
Statistical Evaluation of the Performance of Gridded Daily Precipitation Products from Reanalysis Data, Satellite Estimates, and Merged Analyses over Global Land

Abstract
:1. Introduction
2. Data and Methods
2.1. Reanalysis Data
2.2. Merged Data
2.3. Validation Data
2.4. Evaluation Methods
- Probability of Detection (POD = H/(H + M)): This index quantifies the fraction of correctly detected rain events out of all observed instances, with values ranging from 0 to 1, and a perfect score denoting 1. It gauges the accuracy of rain event detection.
- Probability of Detection (POD = H/(H + M)): This index quantifies the fraction of correctly detected rain events out of all observed instances, with values ranging from 0 to 1, and a perfect score denoting 1. It gauges the accuracy of rain event detection.
- Equitable Threat Score (ETS = (H − G)/(H + M + F − G)), where G = (H + M) (H + F)/N): The ETS provides a balanced assessment by considering the random chance. It considers both hits and false alarms in relation to what could occur by random chance alone.
3. Results
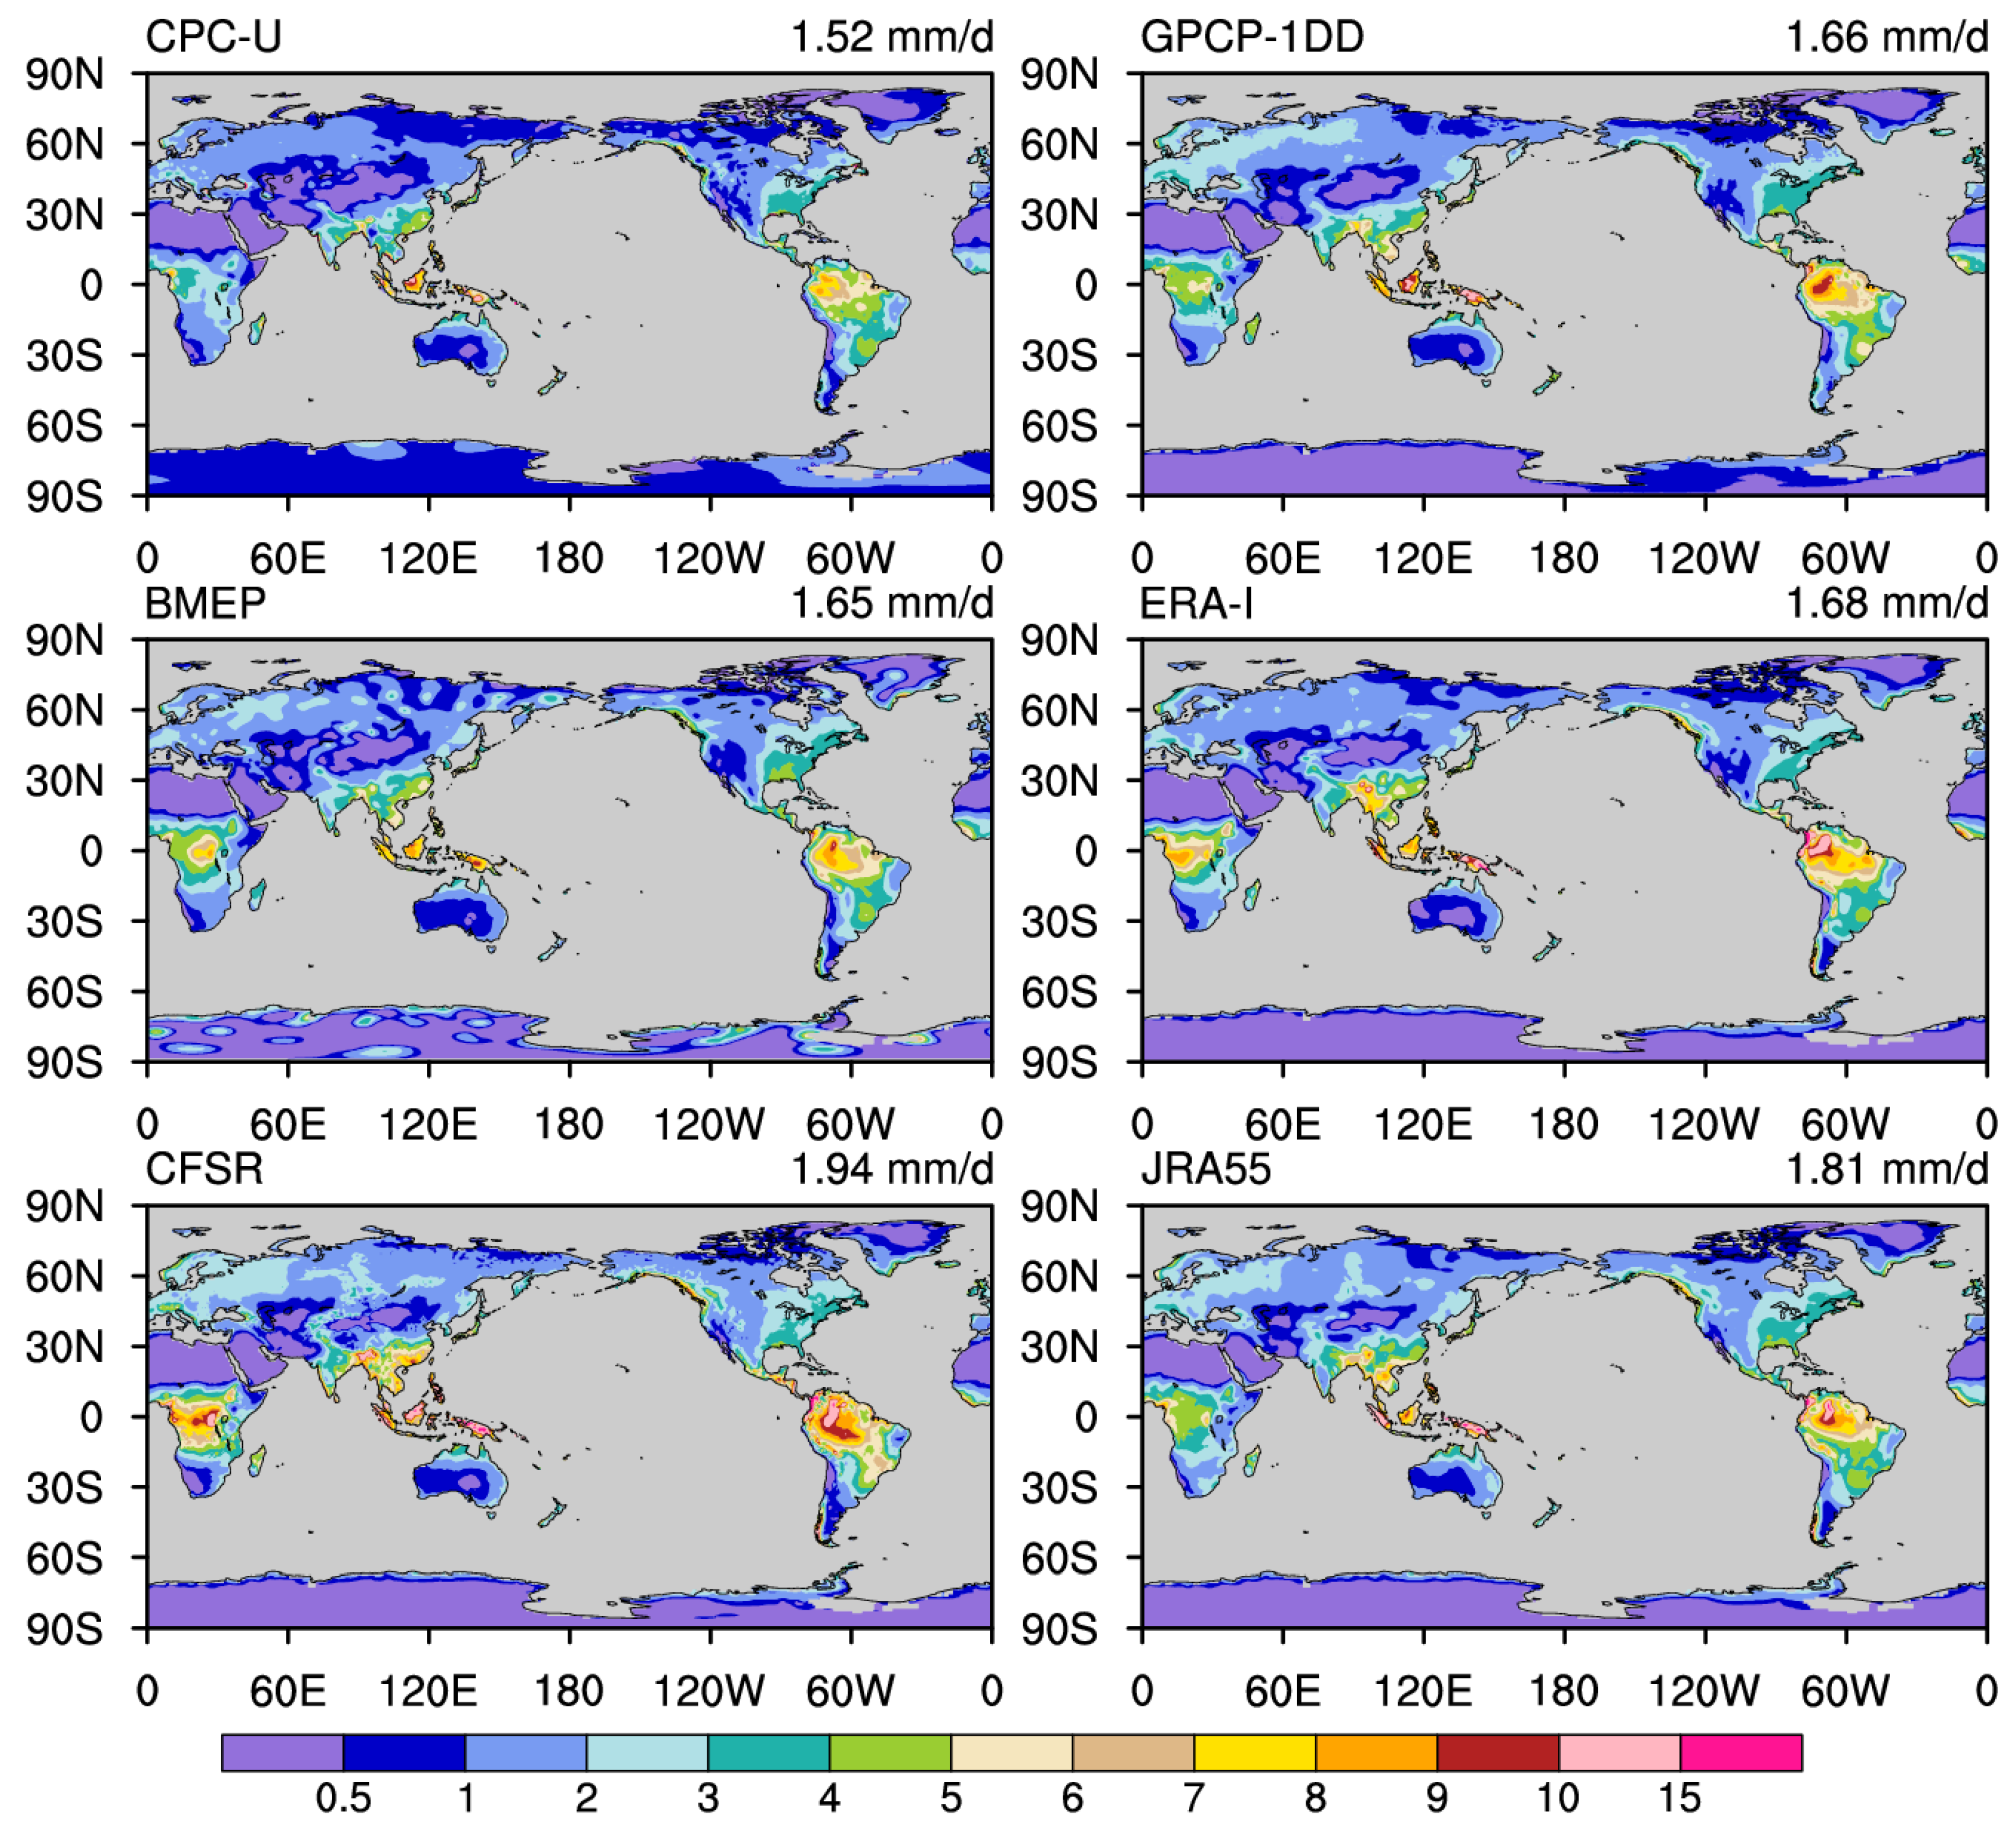
3.1. Spatial Distribution of Annual Means
3.2. Statistical Indices
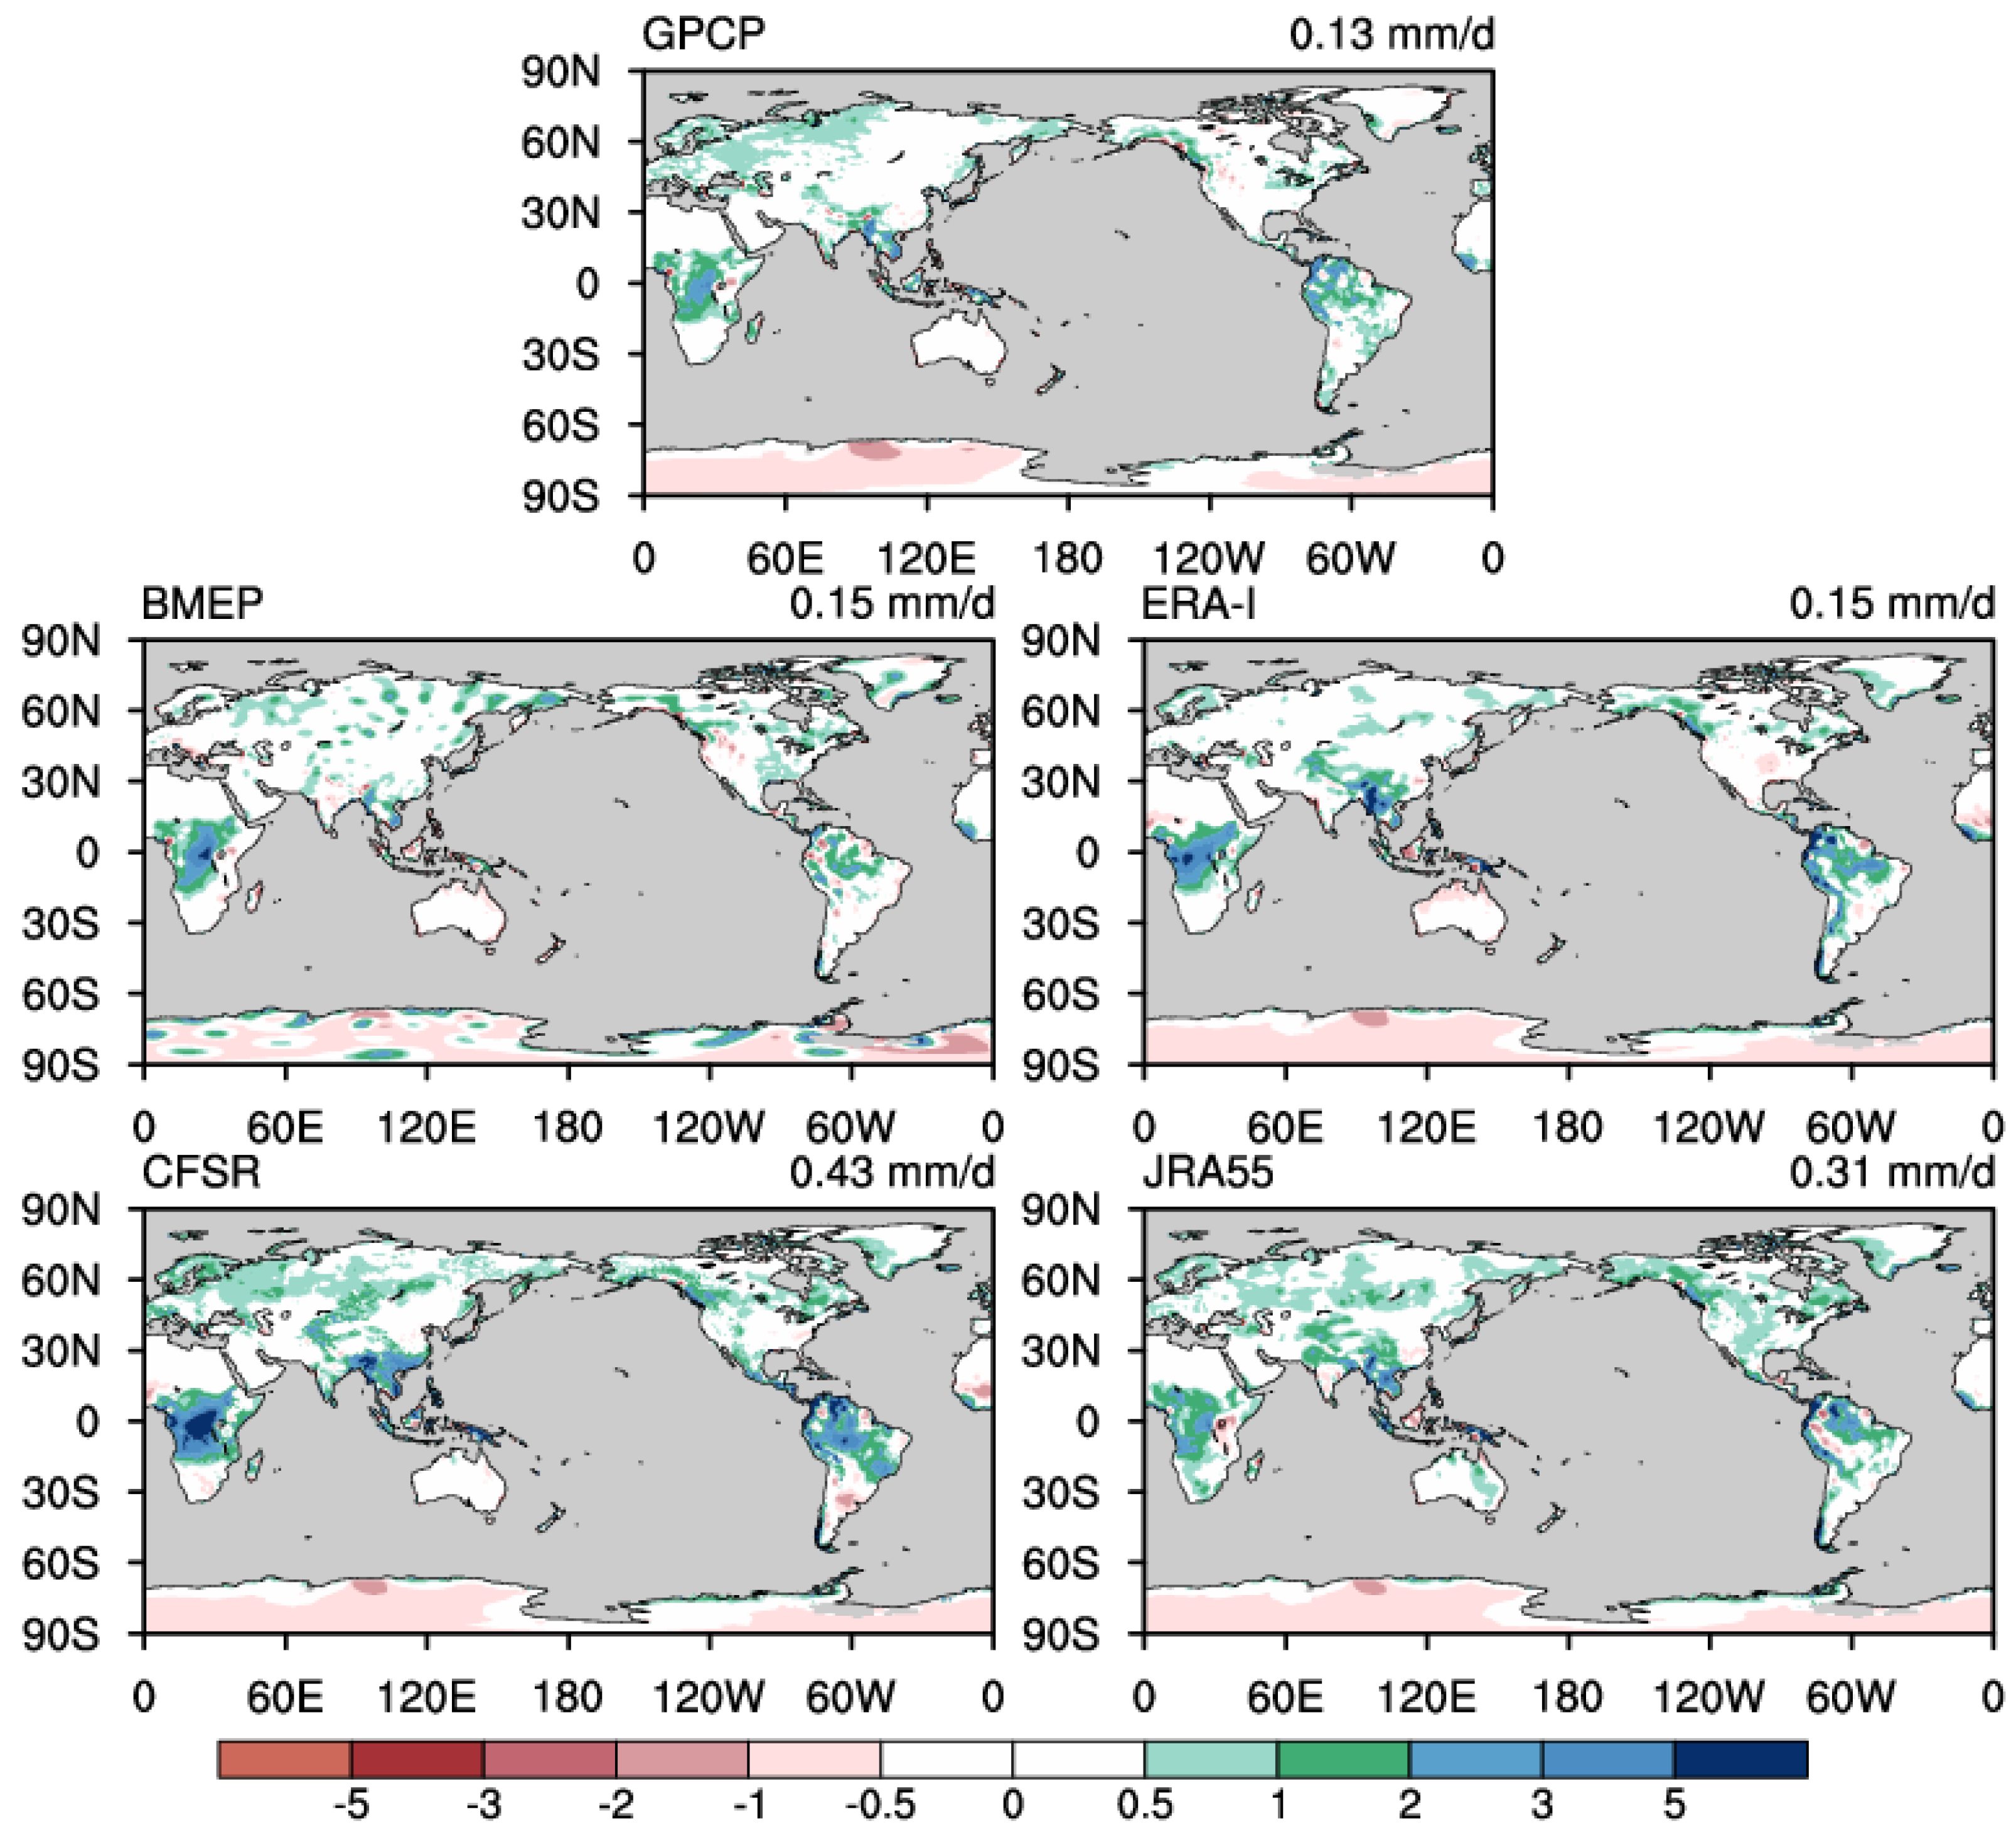
3.2.1. Bias
3.2.2. Time Correlation Coefficient (TCC)
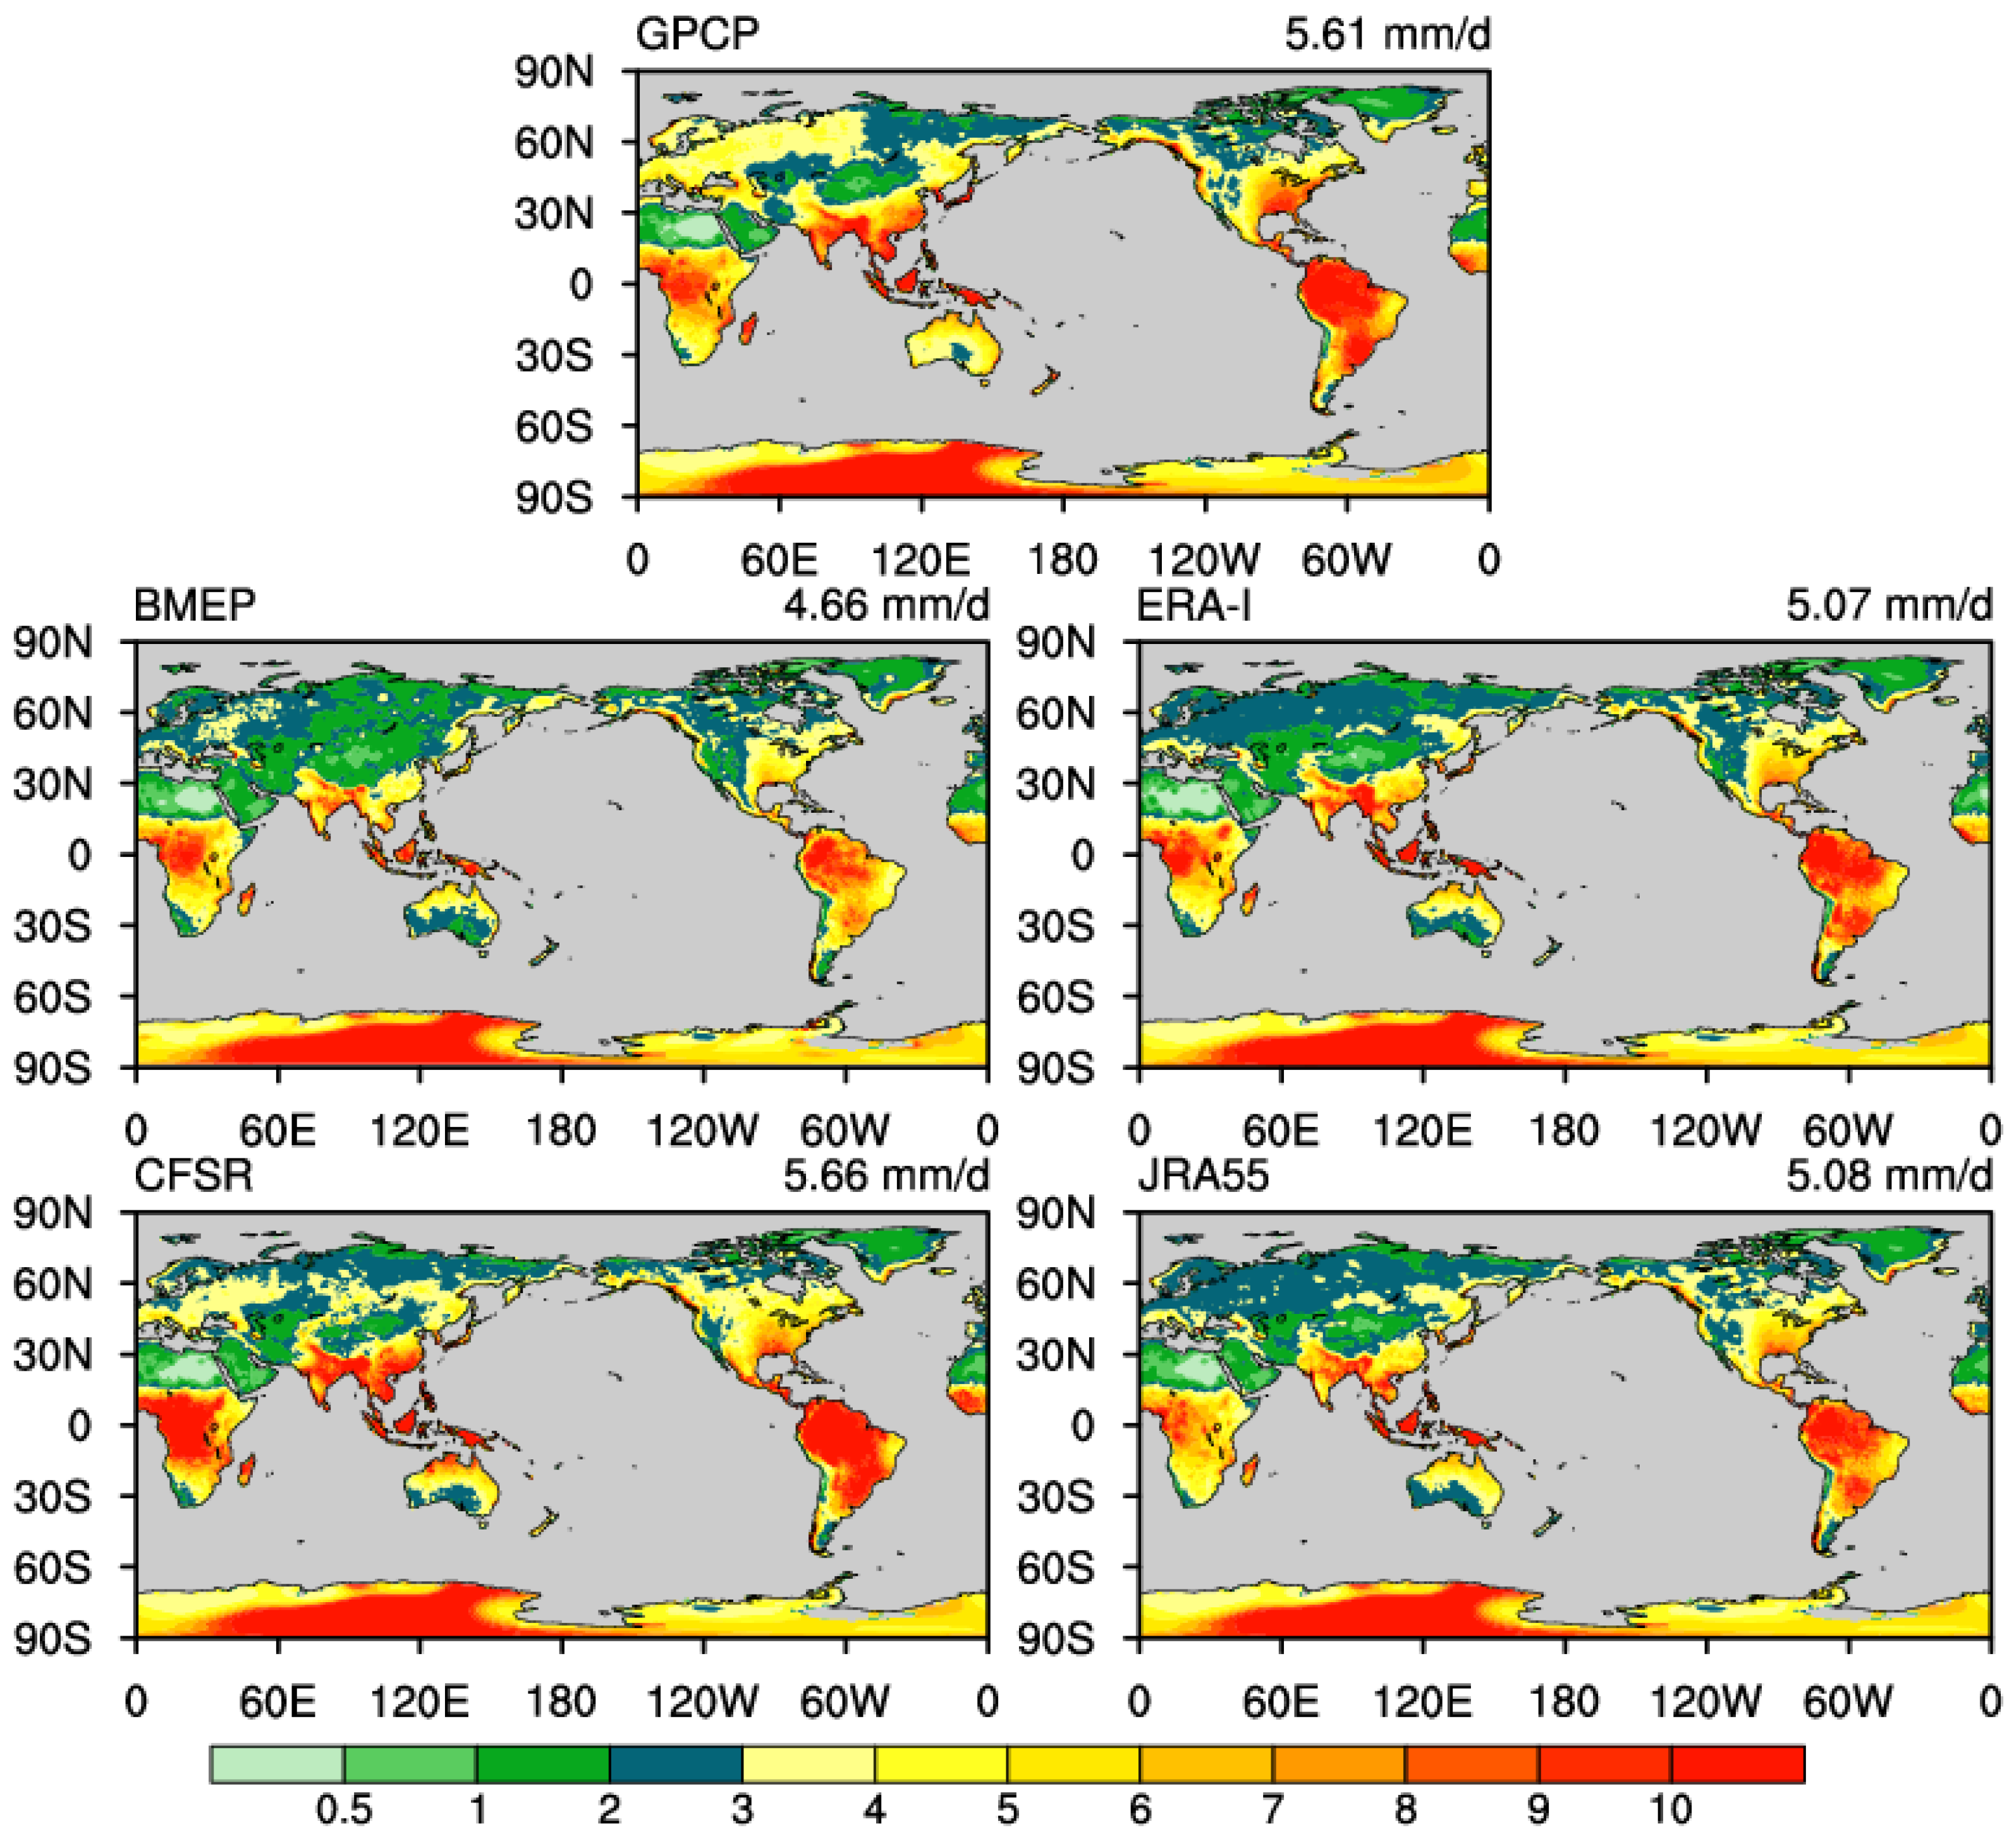
3.2.3. RMSE
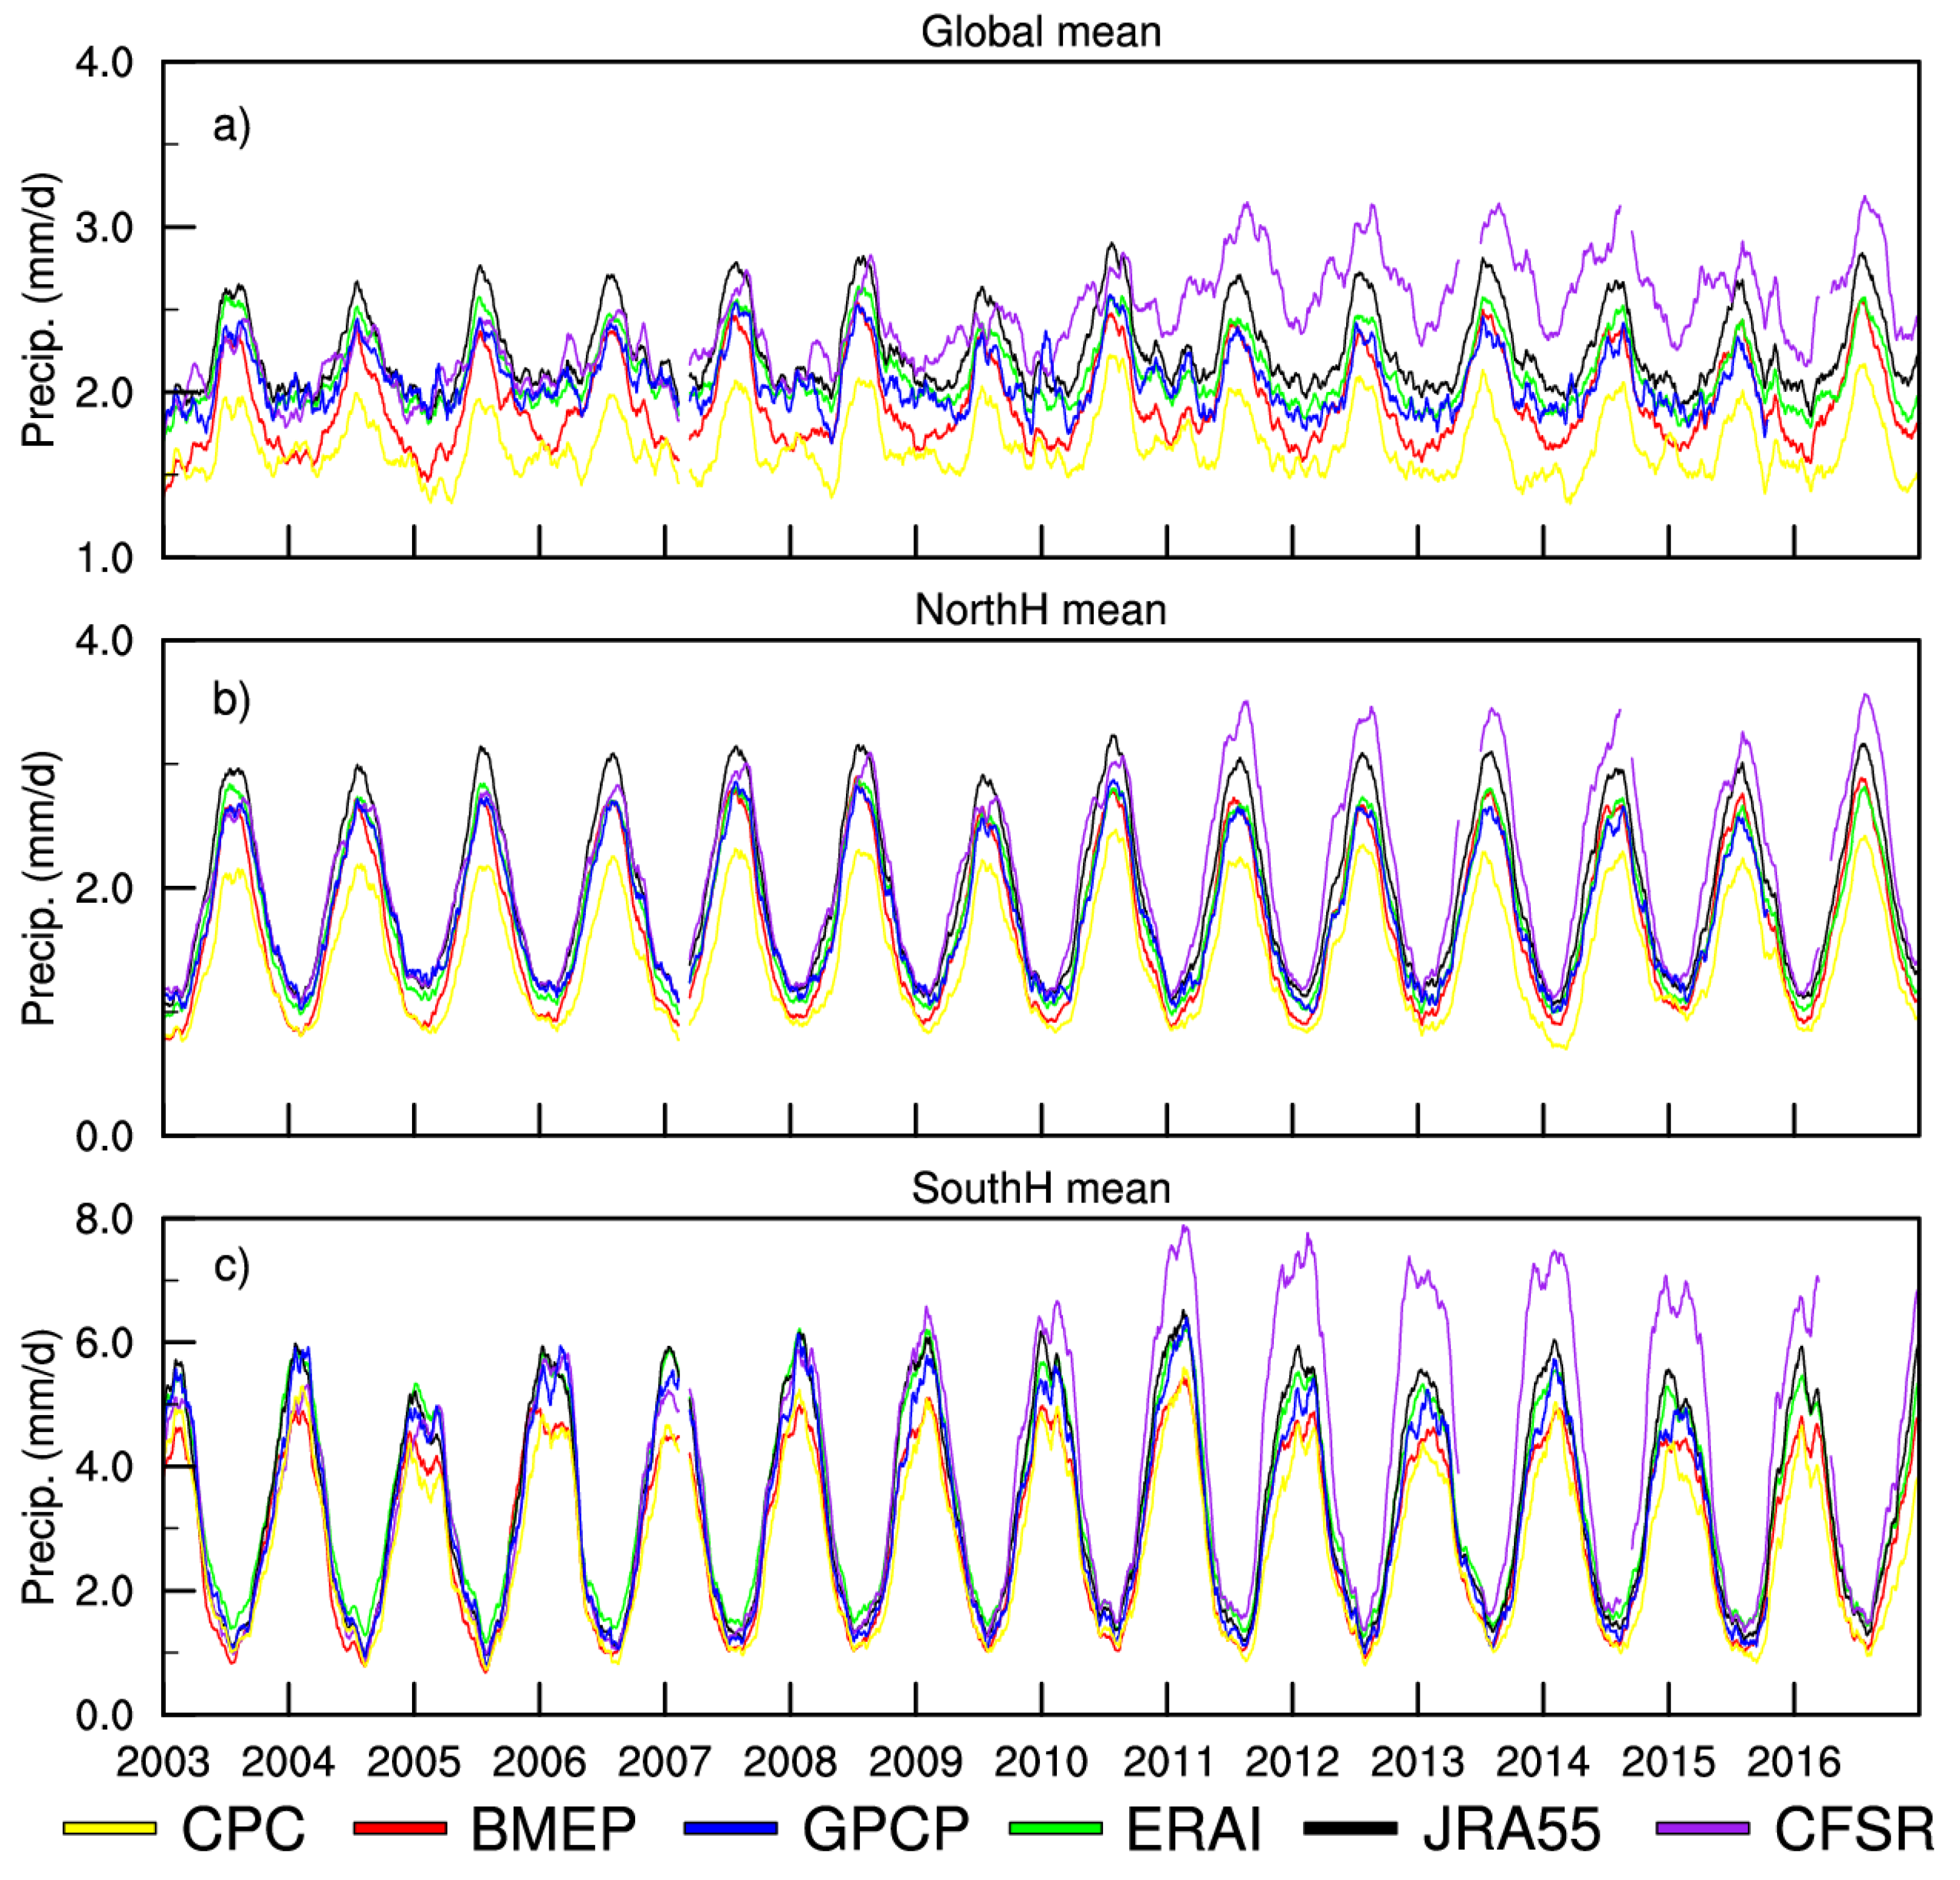
3.3. Time Series of Regional Means
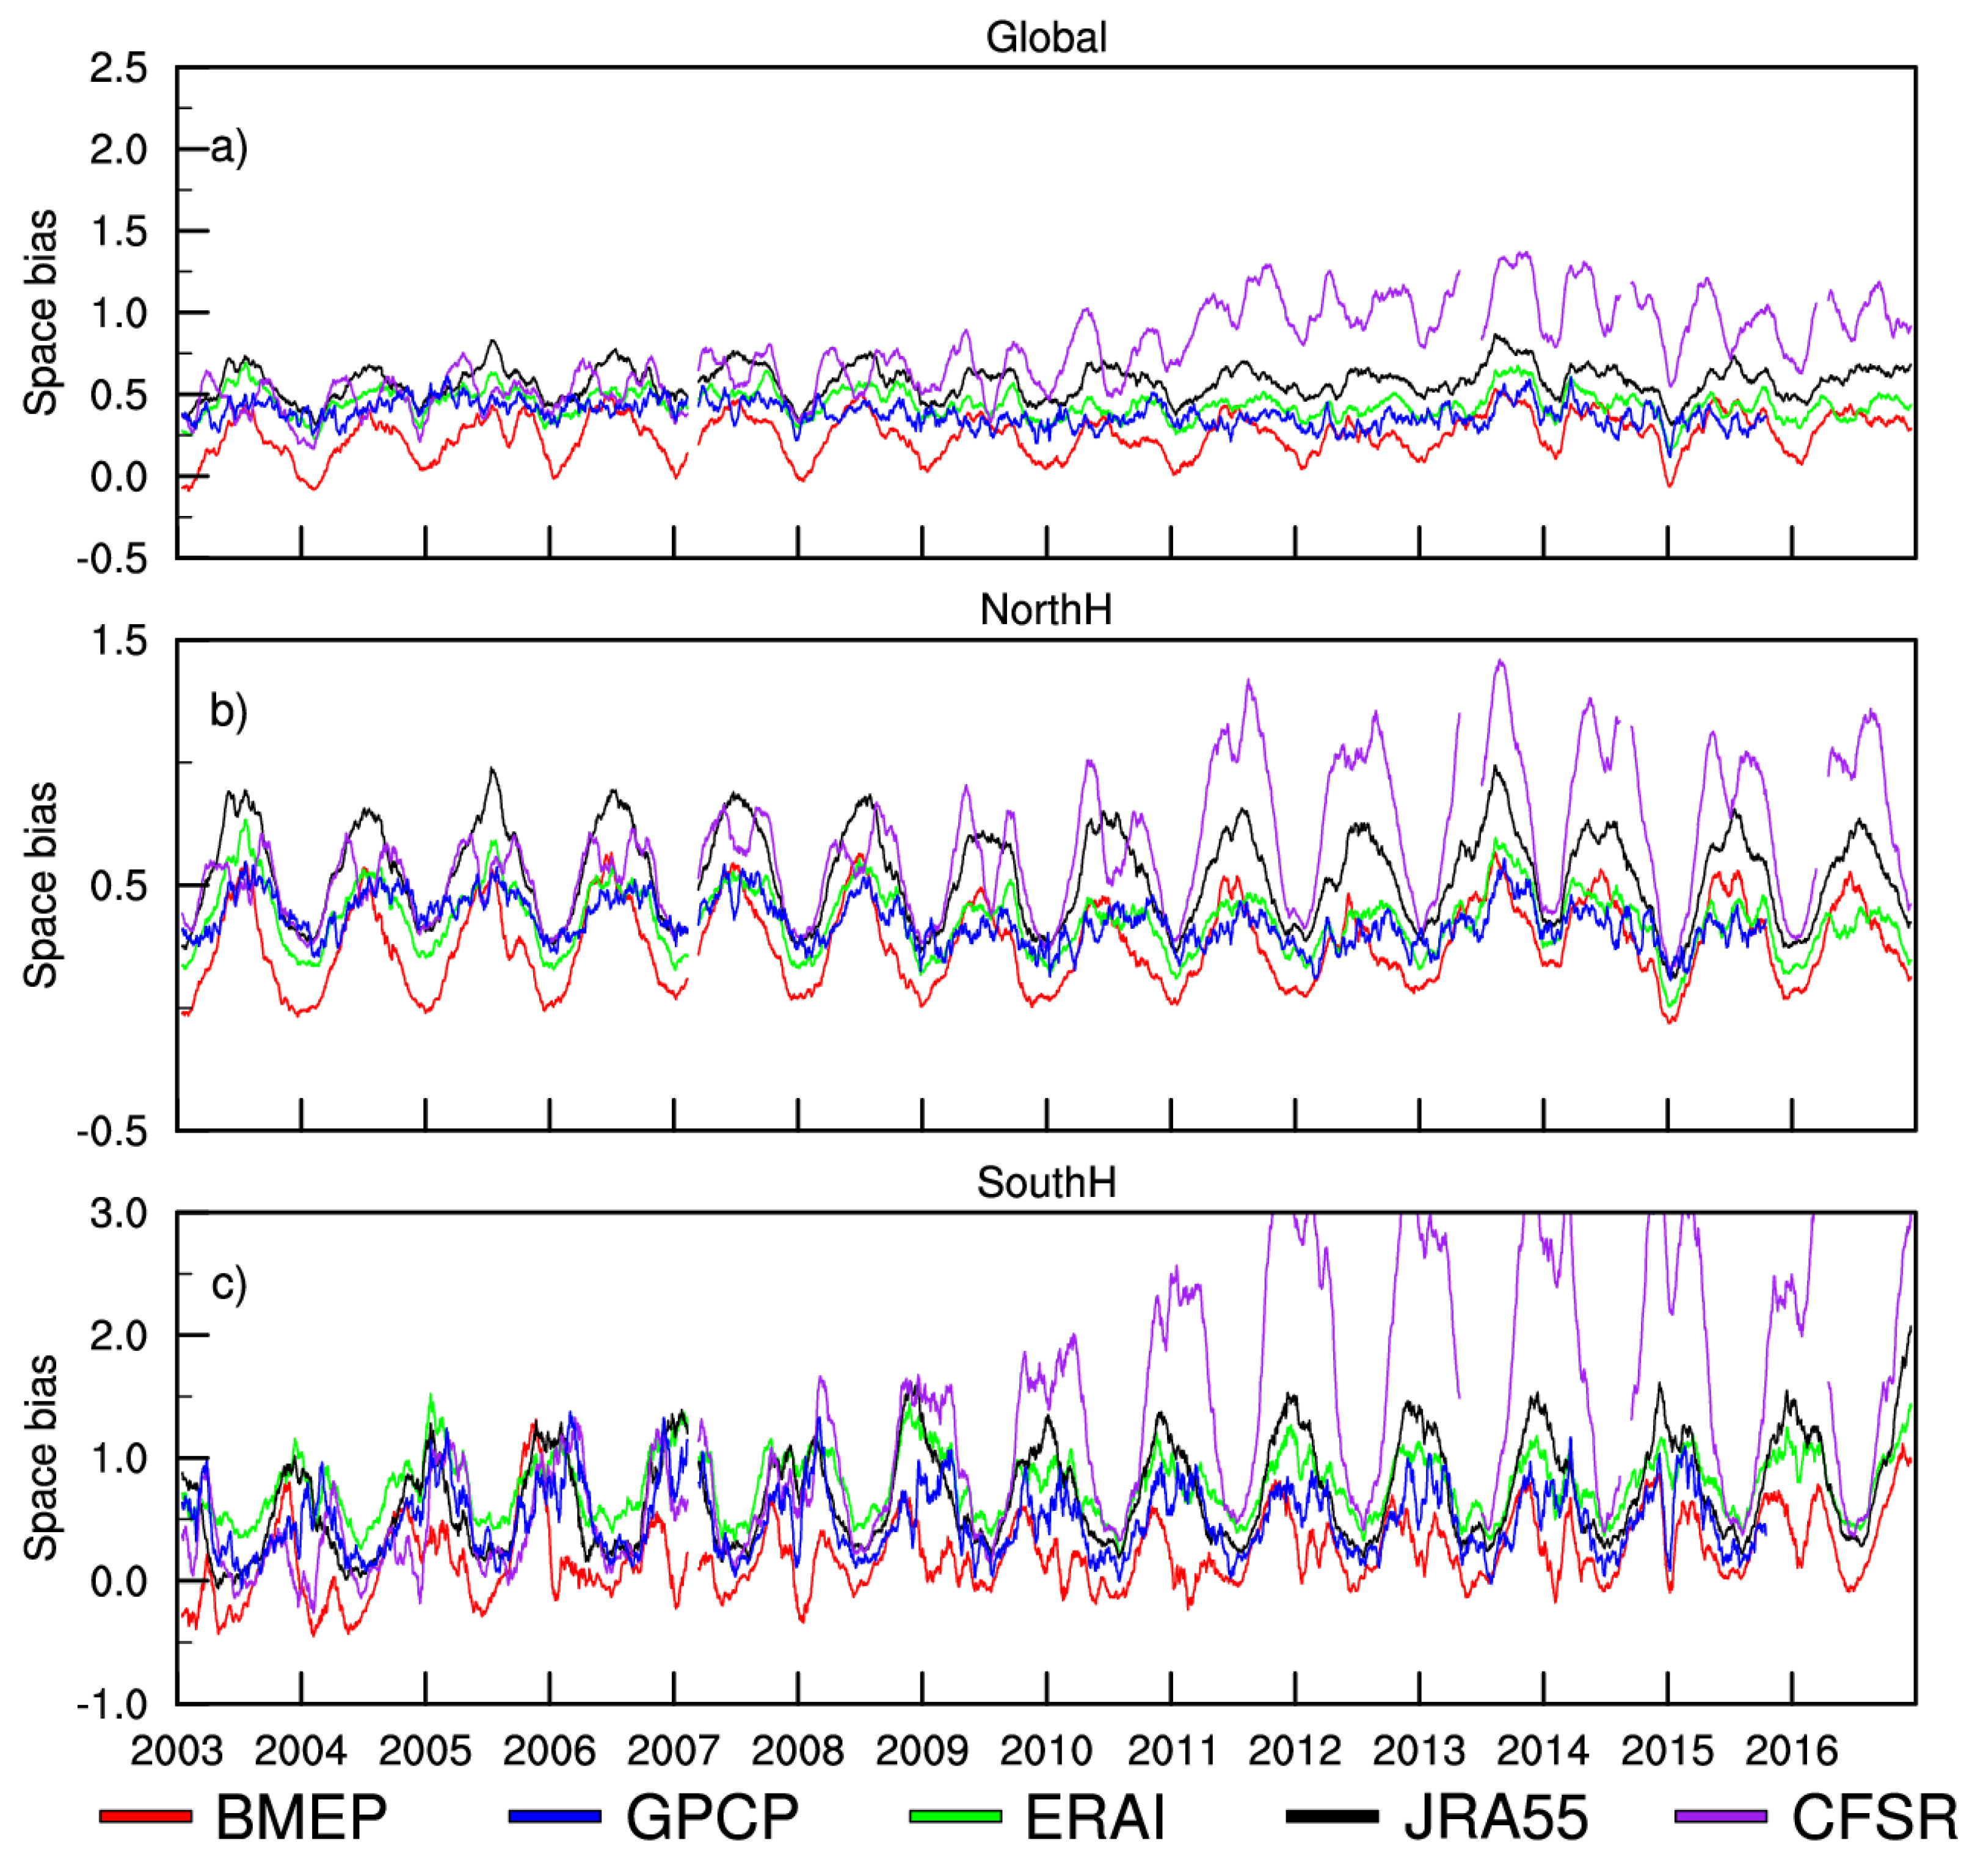
3.4. Spatial Biases
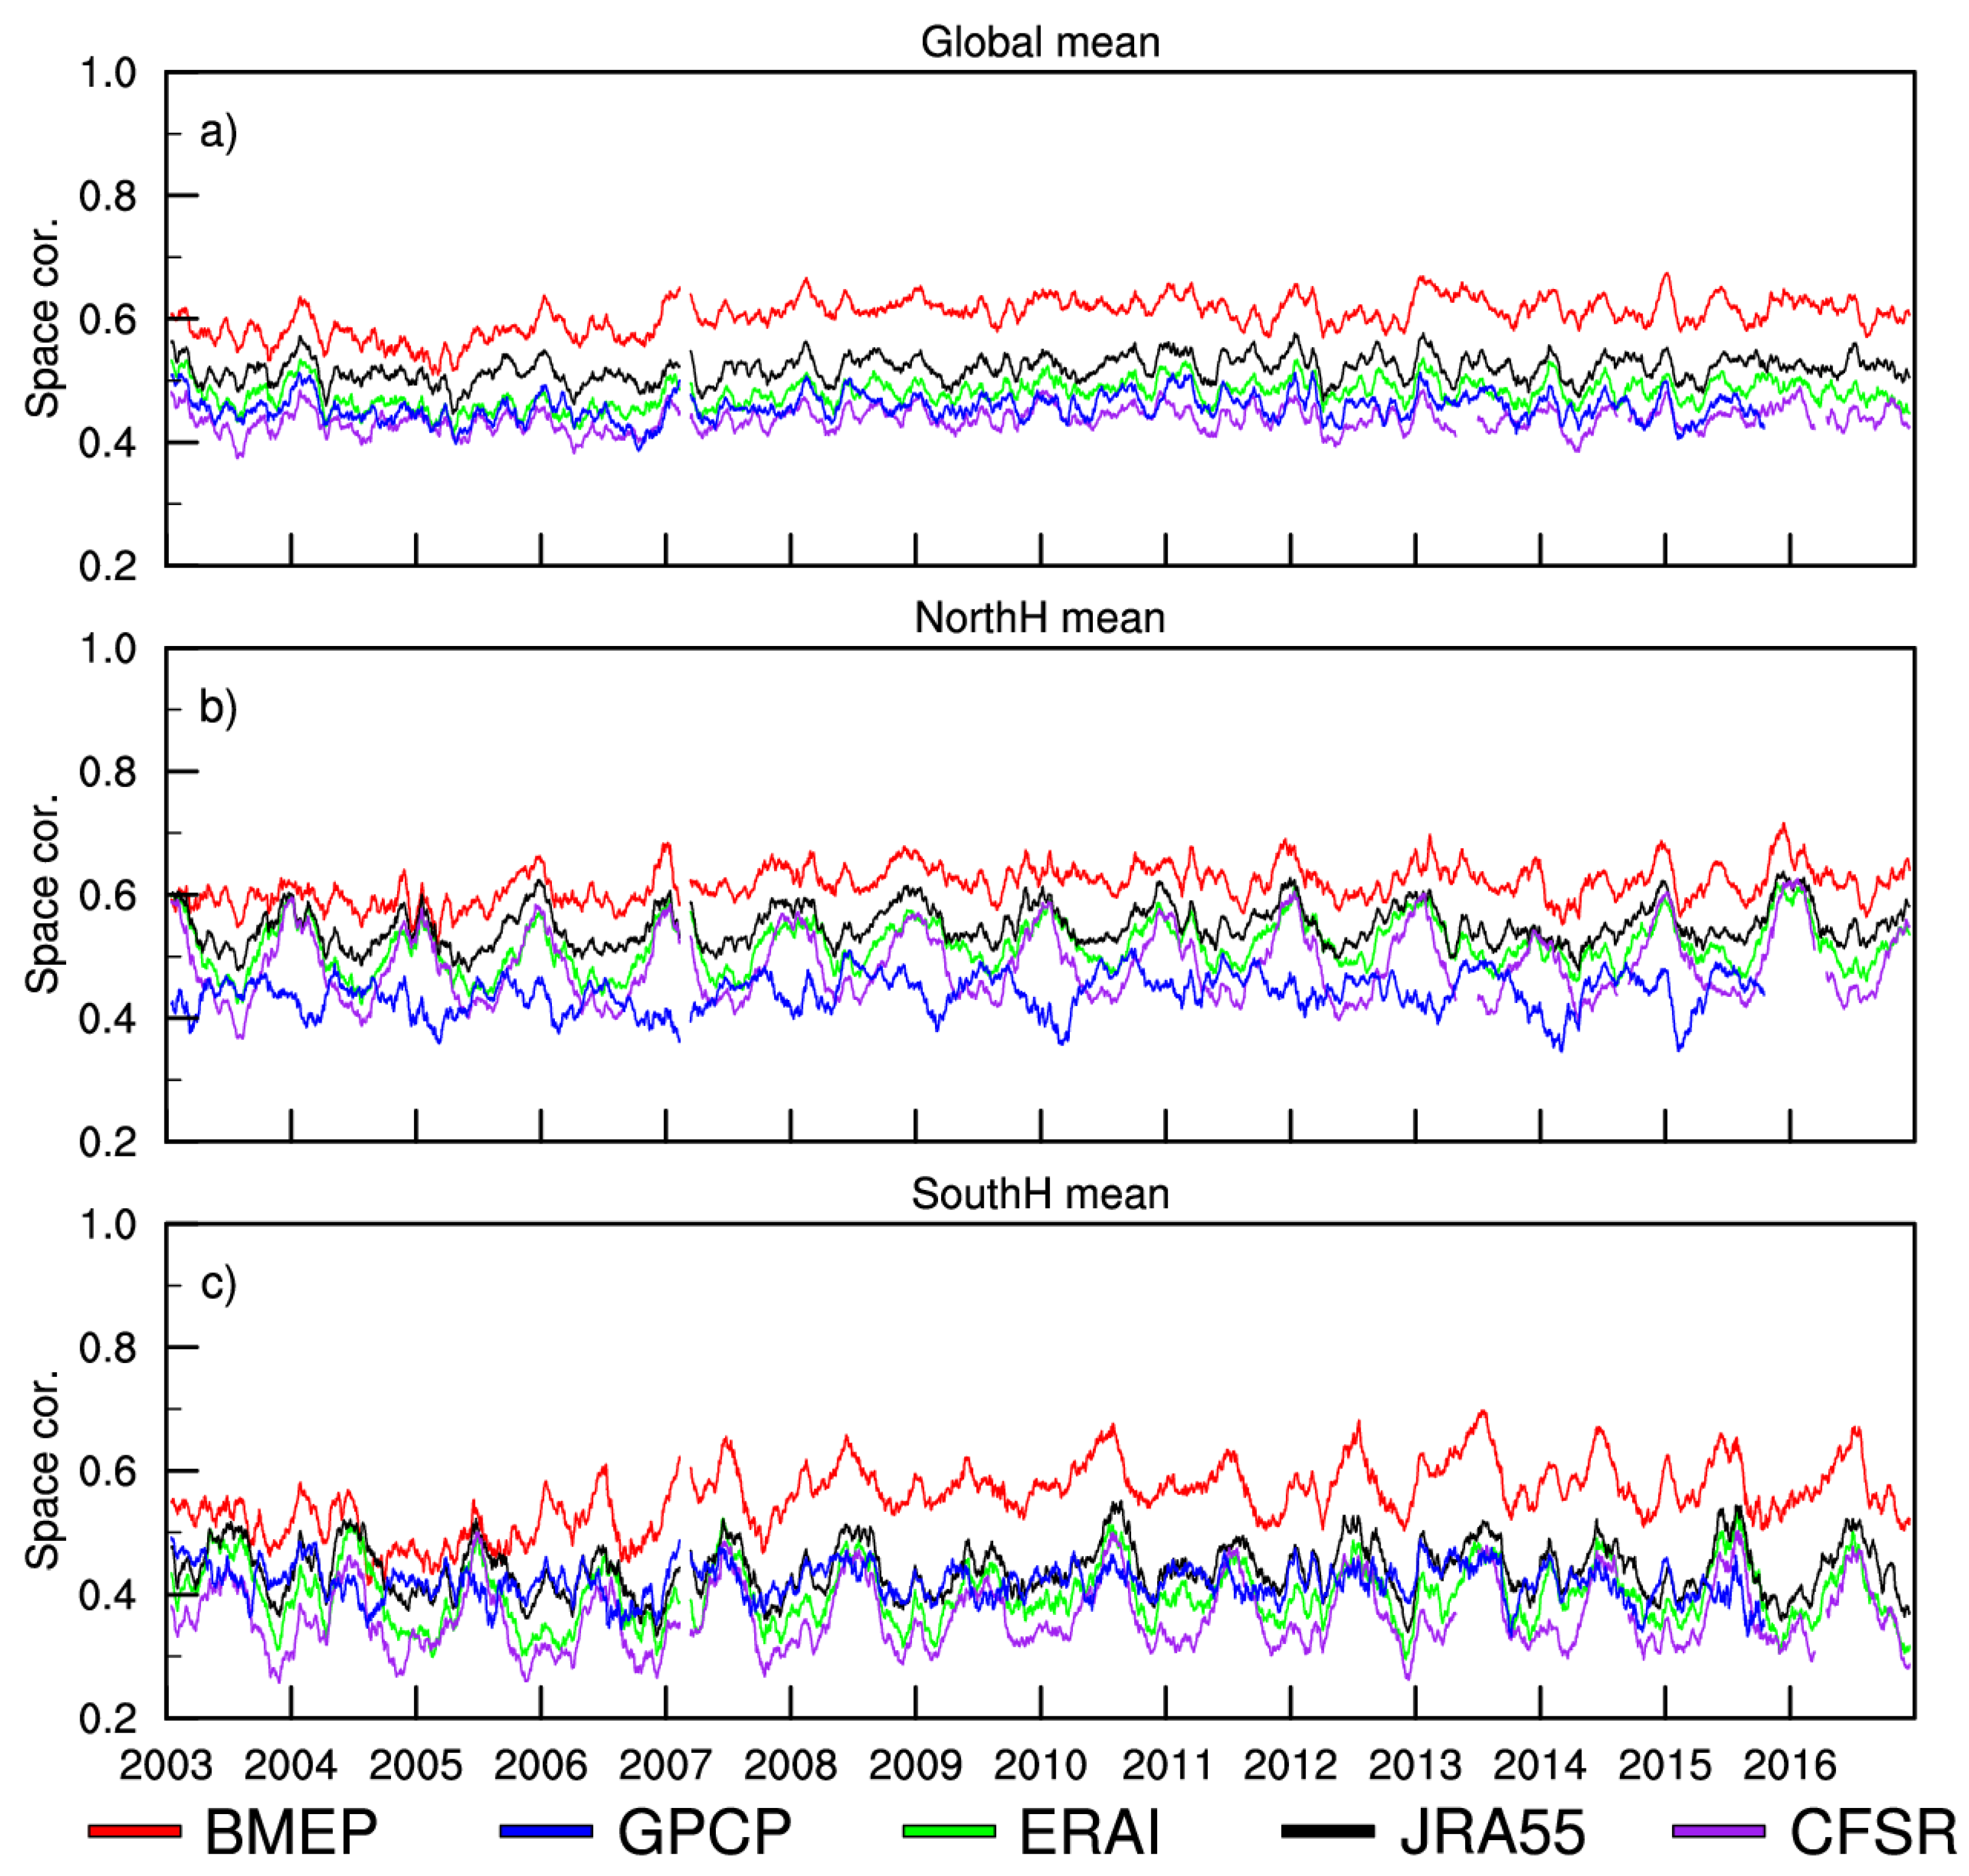
3.5. Spatial Correlation Coefficients
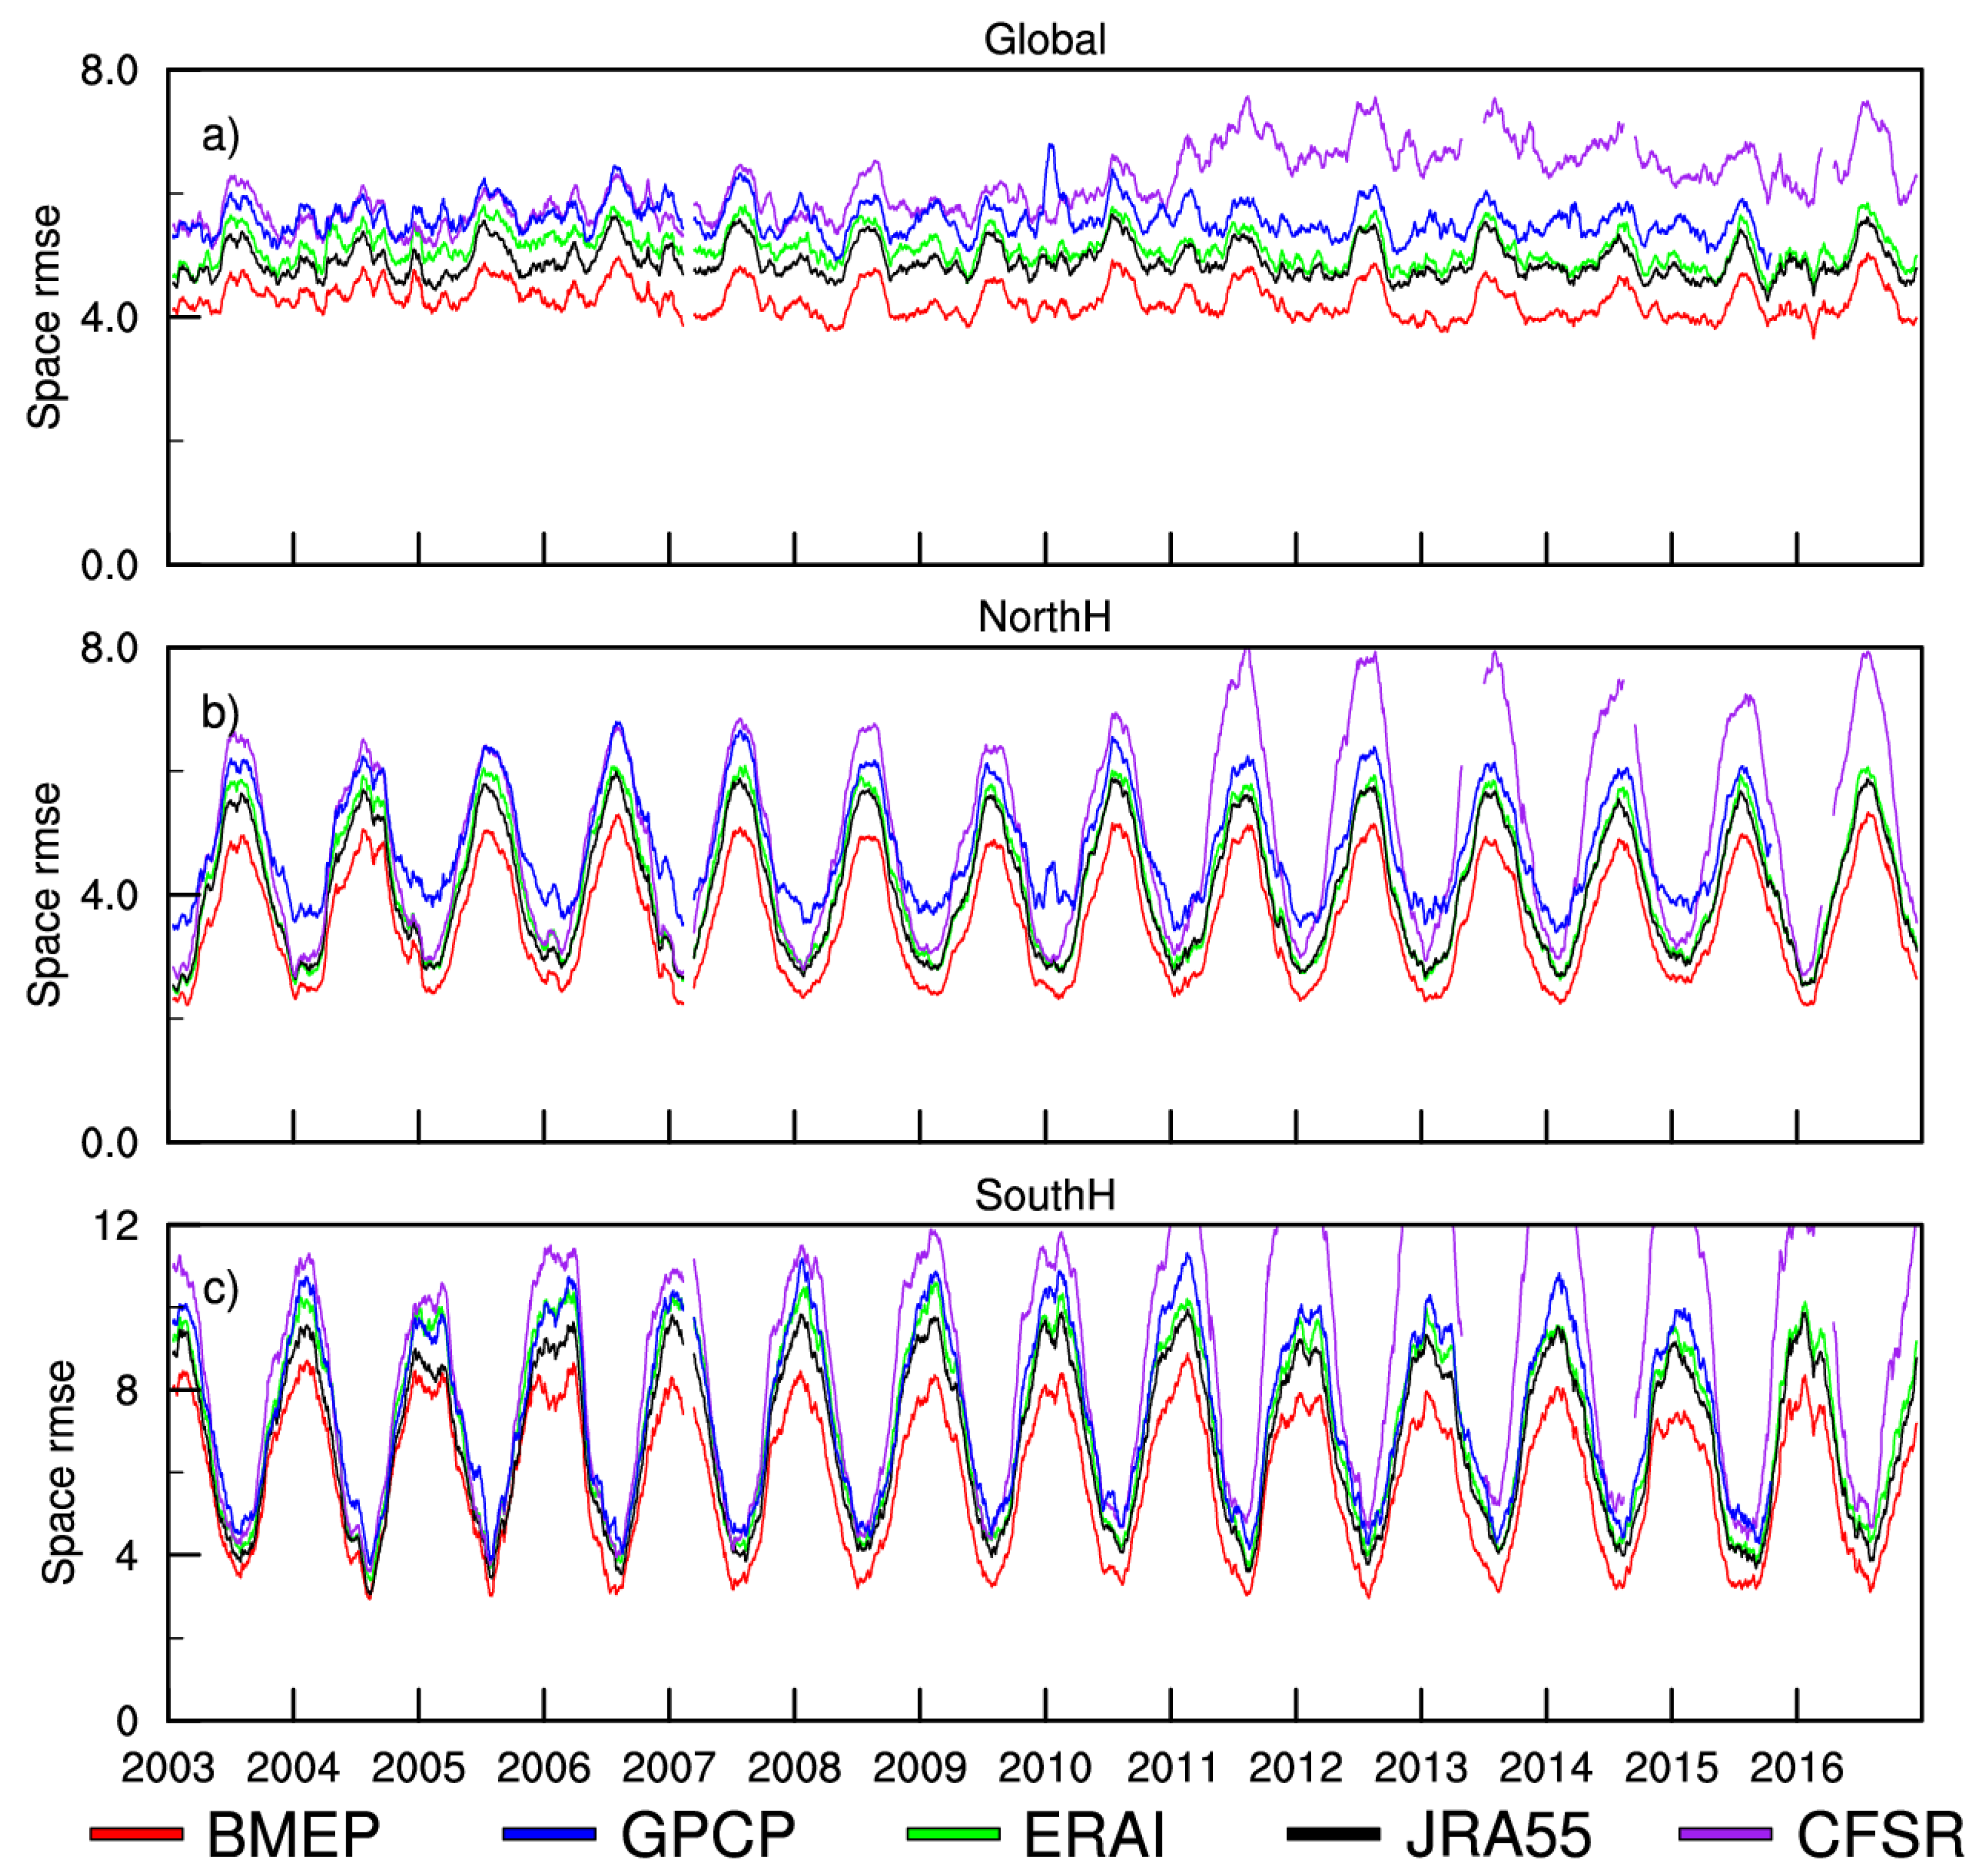
3.6. Spatial RMSEs
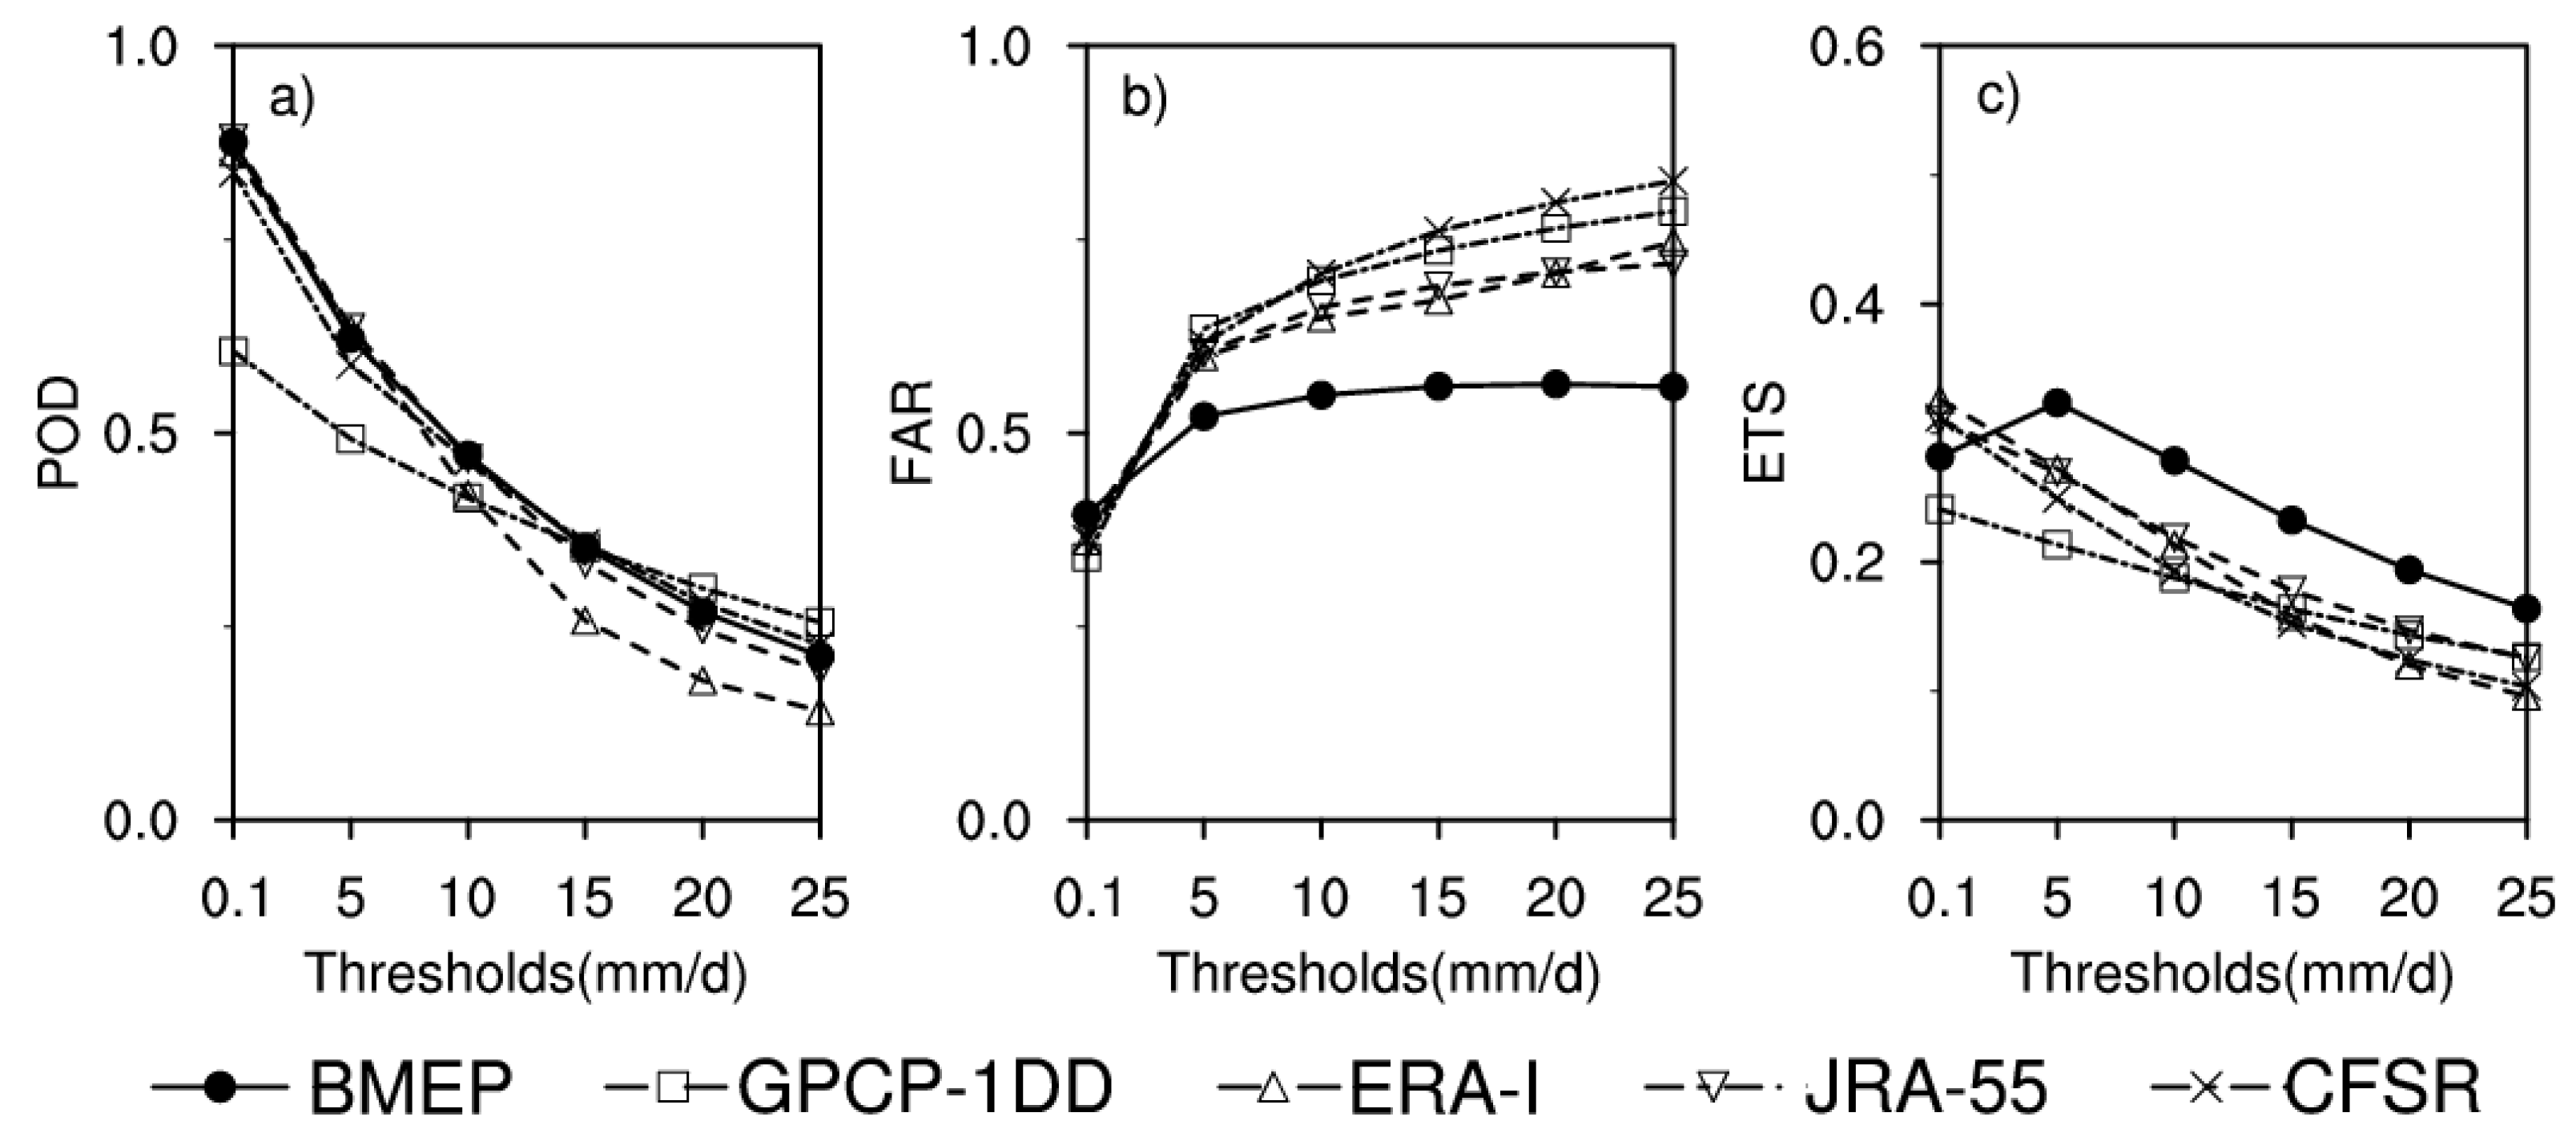
3.7. Categorical Statistics
4. Conclusions
- Gauge-based CPC-U data show that the Indonesian Islands have the highest annual mean precipitation over global land. The Amazon, Equatorial Africa, eastern coastal regions of Asia, and North America also experience significant rainfall. Reanalysis and merged datasets capture the overall precipitation patterns, but some datasets exhibit overestimation or underestimation in specific regions.
- Gridded datasets tend to overestimate precipitation in Equatorial Africa, the Amazon, and the Indo-China Peninsula. Among the reanalysis products, ERA-I and JRA-55 perform well in terms of correlation coefficients and RMSE. GPCP-1DD and BMEP exhibit the smallest overall bias. BMEP exhibits an overall advantage over other gridded datasets in other statistical measures, with the smallest RMSE and the largest TCC. Conversely, GPCP-1DD underperforms compared to BMEP, ERA-I, and JRA-55. Overall, BMEP shows substantial advantages, while CFSR exhibits notable biases and RMSE errors.
- The interannual variability of daily precipitation is consistent across all datasets, with the annual cycle captured by the five gridded datasets over global land areas. Peak precipitation occurs in July and August in the Northern Hemisphere, while the Southern Hemisphere exhibits an inverse pattern with peak precipitation in January. The datasets demonstrate better agreement within each hemisphere compared to the global average. BMEP and CPC-U data exhibit remarkable consistency, with BMEP demonstrating superior performance compared to other gridded products on a global scale and in both hemispheres. However, GPCP-1DD, ERA-I, and JRA-55 display noticeable positive biases in precipitation intensity compared to CPC-U. The CFSR data show a notable positive trend after 2011, attributed to the transition from CFSR data to CFSv2 after the year 2010. CFSv2’s new gravity wave parameterization for cumulus convection-induced drag may cause excess convective precipitation, and its real-time operational nature affects observational data quality, potentially impacting precipitation accuracy after 2010. This finding aligns with previous research suggesting that updates of modeling systems and data assimilation systems can introduce spurious trends in precipitation forecasts, impacting the accuracy of reanalysis-based assessments.
- The spatial bias in daily precipitation exhibits distinct annual cyclic patterns, reflecting the true precipitation dynamics. Among the analyzed datasets, BMEP demonstrates the smallest global and hemispheric spatial bias, surpassing others by a notable margin. Moreover, BMEP showcases exceptional spatial consistency with CPC-U precipitation data, boasting superior global and hemispheric spatial correlation coefficients. This remarkable performance is attributed to the incorporation of daily station-based precipitation observations, enhancing the temporal variability of grid-based precipitation estimates. Additionally, BMEP consistently outperforms its counterparts in terms of spatial RMSE, maintaining a stable value of around 4 mm/d for the global land average. Notably, satellite-based GPCP-1DD precipitation does not exhibit distinct advantages over reanalysis precipitation for global daily estimation, and caution should be exercised during the use of these datasets. JRA-55 stands out as a reliable alternative that exhibits competitive performance, outshining widely used reanalysis datasets and the satellite-derived GPCP-1DD.
- The performance of gridded precipitation products varies with precipitation thresholds. As the thresholds increase, the probability of detecting rainfall decreases (lower POD), while the false alarm ratio increases (higher FAR). BMEP, JRA-55, and CFSR outperform GPCP-1DD in detecting rain occurrence for thresholds ranging from 0.1 to 10 mm/d. Among them, BMEP consistently exhibits the lowest FAR, especially for thresholds above 5 mm/d, indicating its superiority in detecting moderate to heavy precipitation over global land areas. The ETS analysis demonstrates that BMEP achieves higher scores for light rainfall events and maintains superior performance across different thresholds. This is primarily due to its significantly lower false alarm rate, highlighting BMEP’s effectiveness in accurately detecting daily precipitation, particularly for moderate and heavy rain events.
Author Contributions
Funding
Data Availability Statement
Conflicts of Interest
References
- Gruber, A.V.; Levizzani, V. Assessment of Global Precipitation, a Project of the Global Energy and Water Cycle Experiment (GEWEX) Radiation Panel, World Climate Research Program; GEWEX/WCRP Report; WMO: Geneva, Switzerland, 2006; pp. 4–7. [Google Scholar]
- Kucera, P.; Ebert, E.; Turk, F.; Levizzani, V.; Kirschbaum, D.; Tapiador, F.; Loew, A.; Borsche, M. Precipitation from Space: Advancing Earth System Science. Bull. Am. Meteorol. Soc. 2013, 94, 365–375. [Google Scholar] [CrossRef]
- Michaelides, S.; Levizzani, V.; Anagnostou, E.; Bauer, P.; Kasparis, T.; Lane, J.E. Precipitation: Measurement, remote sensing, climatology and modeling. Atmos. Res. 2009, 94, 512–533. [Google Scholar] [CrossRef]
- National Center for Atmospheric Research Staff. The Climate Data Guide: Precipitation Data Sets: Overview & Comparison Table. Available online: https://climatedataguide.ucar.edu/climate-data/precipitation-data-sets-overview-comparison-table (accessed on 5 July 2023).
- Chen, M.; Shi, W.; Xie, P.; Silva, V.B.S.; Kousky, V.E.; Wayne Higgins, R.; Janowiak, J.E. Assessing objective techniques for gauge-based analyses of global daily precipitation. J. Geophys. Res. 2008, 113, D04110. [Google Scholar] [CrossRef]
- Huffman, G.J.; Bolvin, D.T.; Nelkin, E.J.; Wolff, D.; Adler, R.; Gu, G.; Hong, Y.; Bowman, K.; Stocker, E. The TRMM Multisatellite Precipitation Analysis (TMPA): Quasiglobal, multiyear, combined-sensor precipitation estimates at fine scales. J. Hydrometeorol. 2007, 8, 38–55. [Google Scholar] [CrossRef]
- Joyce, R.J.; Janowiak, J.E.; Arkin, P.A.; Xie, P. CMORPH: A method that produces global precipitation estimates from passive microwave and infrared data at high spatial and temporal resolution. J. Hydrometeorol. 2004, 5, 487–503. [Google Scholar] [CrossRef]
- Dee, D.P.; Uppala, S.M.; Simmons, A.J.; Berrisford, P.; Poli, P.; Kobayashi, S.; Andrae, U.; Balmaseda, M.A.; Balsamo, G.; Bauer, D.P.; et al. The ERA-Interim reanalysis: Configuration and performance of the data assimilation system. Q. J. R. Meteorol. Soc. 2011, 137, 553–597. [Google Scholar] [CrossRef]
- Kobayashi, S.; Ota, Y.; Harada, Y.; Ebita, A.; Moriya, M.; Onoda, H.; Onogi, K.; Kamahori, H.; Kobayashi, C.; Endo, H.; et al. The JRA-55 reanalysis: General specifications and basic characteristics. J. Meteor. Soc. Jap. 2015, 93, 5–48. [Google Scholar] [CrossRef]
- Saha, S.; Moorthi, S.; Pan, H.-L.; Wu, X.; Wang, J.; Nadiga, S.; Tripp, P.; Kistler, R.; Woollen, J.; Behringer, D.; et al. The NCEP Climate Forecast System Reanalysis. Bull. Amer. Meteor. Soc. 2010, 91, 1015–1057. [Google Scholar] [CrossRef]
- Silva, V.B.S.; Kousky, V.E.; Higgins, R.W. Daily precipitation statistics for South America: An intercomparison between NCEP reanalyses and observations. J. Hydrometeor. 2011, 12, 101–117. [Google Scholar] [CrossRef]
- Huffman, G.J.; Adler, R.F.; Morrissey, M.M.; Bolvin, D.T.; Curtis, S.; Joyce, R.; McGavock, B.; Susskind, J. Global Precipitation at One-Degree Daily Resolution from Multisatellite Observations. J. Hydrometeor. 2001, 2, 36–50. [Google Scholar] [CrossRef]
- Ploshay, J.J.; Lau, N.C. Simulation of the diurnal cycle in tropical rainfall and circulation during boreal summer with a high-resolution GCM. Mon. Weather. Rev. 2010, 138, 3434–3453. [Google Scholar] [CrossRef]
- Medvigy, D.; Beaulieu, C. Trends in daily solar radiation and precipitation coefficients of variation since 1984. J. Clim. 2012, 25, 1330–1339. [Google Scholar] [CrossRef]
- Deng, X.; Nie, S.; Deng, W.; Cao, W. Statistical evaluation of the performance of gridded monthly precipitation products from reanalysis data, satellite estimates, and merged analyses over China. Theor. Appl. Climatol. 2018, 132, 621–637. [Google Scholar] [CrossRef]
- Akinsanola, A.A.; Ongoma, V.; Kooperman, G.J. Evaluation of CMIP6 models in simulating the statistics of extreme precipitation over Eastern Africa. Atmos. Res. 2021, 254, 105509. [Google Scholar] [CrossRef]
- Sun, J.; Huang, Y.; Han, J.; Zhang, X. Comparison on Relationship between Western Pacific Subtropical High and Summer Precipitation over Dongting Lake Basin Based on Different Datasets. Asia-Pacific J. Atmos. Sci. 2021, 57, 663–678. [Google Scholar] [CrossRef]
- Nie, S.P.; Wu, T.W.; Luo, Y.; Deng, X.; Shi, X.; Wang, Z.; Liu, X.; Huang, J. A strategy for merging objective estimates of global daily precipitation from gauge observations, satellite estimates, and numerical predictions. Adv. Atmos. Sci. 2016, 33, 889–904. [Google Scholar] [CrossRef]
- Blacutt, L.A.; Herdies, D.L.; de Gonçalves, L.G.G.; Vila, D.A.; Andrade, M. Precipitation comparison for the CFSR, MERRA, TRMM3B42 and combined scheme datasets in Bolivia. Atmos. Res. 2015, 163, 117–131. [Google Scholar] [CrossRef]
- Gehne, M.; Hamill, T.M.; Kiladis, G.N.; Trenberth, K.E. Comparison of global precipitation estimates across a range of temporal and spatial scales. J. Clim. 2016, 29, 7773–7795. [Google Scholar] [CrossRef]
- Fu, G.; Charles, S.P.; Timbal, B.; Jovanovic, B.; Ouyang, F. Comparison of NCEP-NCAR and ERA-Interim over Australia. Int. J. Climatol. 2016, 36, 2345–2367. [Google Scholar] [CrossRef]
- Huang, A.; Zhao, Y.; Zhou, Y.; Yang, B.; Zhang, L.; Dong, X.; Fang, D.; Wu, Y. Evaluation of multisatellite precipitation products by use of ground-based data over china. J. Geophys. Res. Atmos. 2016, 121, 10654–10675. [Google Scholar] [CrossRef]
- Beck, H.E.; Vergopolan, N.; Pan, M.; Levizzani, V.; van Dijk, A.I.J.M.; Weedon, G.P.; Brocca, L.; Pappenberger, F.; Huffman, G.J.; Wood, E.F. Global-scale evaluation of 22 precipitation datasets using gauge observations and hydrological modeling. Hydrol. Earth Syst. Sci. 2017, 21, 6201–6217. [Google Scholar] [CrossRef]
- Saha, S.; Nadiga, S.; Thiaw, C.; Wang, J.; Wang, W.; Zhang, Q.; Van den Dool, H.M.; Pan, H.-L.; Moorthi, S.; Behringer, D.; et al. The NCEP Climate Forecast System. J. Clim. 2006, 19, 3483–3517. [Google Scholar] [CrossRef]
- Adler, R.F.; Huffman, G.J.; Chang, A.; Ferraro, R.; Xie, P.P.; Janowiak, J.; Rudolf, B.; Schneider, U.; Curtis, S.; Bolvin, D.; et al. The version-2 Global Precipitation Climatology Project (GPCP) monthly precipitation analysis (1979-present). J. Hydrometeor. 2003, 4, 1147–1167. [Google Scholar] [CrossRef]
- Becker, A.; Finger, P.; Meyer-Christoffer, A.; Rudolf, B.; Schamm, K.; Schneider, U.; Ziese, M. A description of the global land-surface precipitation data products of the Global Precipitation Climatology Centre with sample applications including centennial (trend) analysis from 1901–present. Earth Syst. Sci. Data 2013, 5, 71–99. [Google Scholar] [CrossRef]
- Bolvin, D. Global Precipitation at One-Degree Daily Resolution from Multisatellite Observations, Version 1.2. NASA GSFC, 2001. Available online: ftp://ftp.ncdc.noaa.gov/pub/data/gpcp/daily-v1.2/ (accessed on 1 September 2023).
- Nie, S.P.; Luo, Y.; Li, W.P.; Wu, T.W.; Shi, X.L.; Wang, Z.Z. Quality control and analysis of global gauge-based daily precipitation dataset from 1980 to 2009. Adv. Clim. Chang. Res. 2012, 3, 45–53. [Google Scholar]
- Nie, S.P.; Luo, Y.; Li, W.P.; Wu, T.W.; Shi, X.L.; Wang, Z.Z. A merging scheme for constructing daily precipitation analyses based on objective bias-correction and error estimation techniques. J. Geophys. Res. Atmos. 2015, 120, 8671–8692. [Google Scholar] [CrossRef]
- Maggioni, V.; Meyers, P.C.; Robinson, M.D. A review of merged high resolution satellite precipitation product accuracy during the Tropical Rainfall Measuring Mission (TRMM)-era. J. Hydrometeorol. 2016, 17, 1101–1117. [Google Scholar] [CrossRef]
- Xie, P.; Chen, M.; Shi, W. CPC global unified gauge-based analysis of daily precipitation. In Proceedings of the 24th Conference on Hydrology, Atlanta, GA, USA, 18–21 January 2010. [Google Scholar]
- Cressman, G.P. An operational objective analysis scheme. Mon. Weather. Rev. 1959, 87, 367–374. [Google Scholar] [CrossRef]
- Xie, P.P.; Chen, M.Y.; Yang, S.; Yatagai, A.; Hayasaka, T.; Fukushima, Y.; Liu, C. Agauge-based analysis of daily precipitation over East Asia. J. Hydrometeor. 2007, 8, 607–627. [Google Scholar] [CrossRef]
- Wilks, D. Statistical Methods in the Atmospheric Sciences, 2nd ed.; Academic Press: Cambridge, MA, USA, 2006; p. 260. [Google Scholar]
- Ebert, E.E.; Janowiak, J.E.; Kidd, C. Comparison of near-real-time precipitation estimates from satellite observations and numerical models. Bull. Amer. Meteor. Soc. 2007, 88, 47–64. [Google Scholar] [CrossRef]
- AghaKouchak, A.; Mehran, A.; Norouzi, H.; Behrangi, A. Systematic and random error components in satellite precipitation data sets. Geophys. Res. Lett. 2012, 39, 9406. [Google Scholar] [CrossRef]
- Nogueira, M. Inter-comparison of ERA-5, ERA-interim and GPCP rainfall over the last 40 years: Process-based analysis of systematic and random differences. J. Hydrol. 2020, 583, 124632. [Google Scholar] [CrossRef]
- Saha, S.; Moorthi, S.; Wu, X.; Wang, J.; Nadiga, S.; Tripp, P.; Behringer, D.; Hou, Y.-T.; Chuang, H.-Y.; Iredell, M.; et al. The NCEP climate forecast system version 2. J. Clim. 2014, 27, 2185–2208. [Google Scholar] [CrossRef]
- Trenberth, K.E.; Fasullo, J.T.; Mackaro, J. Atmospheric moisture transports from ocean to land and global energy flows in reanalyses. J. Clim. 2011, 24, 4907–4924. [Google Scholar] [CrossRef]
- AghaKouchak, A.; Behrangi, A.; Sorooshian, S.; Hsu, K.; Amitai, E. Evaluation of satellite-retrieved extreme precipitation rates across the central United States. J. Geophys. Res. Atmos. 2011, 116, D2. [Google Scholar] [CrossRef]


| Indexes | CPC-U | GPCP-1DD | BMEP | ERA-I | CFSR | JRA55 |
|---|---|---|---|---|---|---|
| AM | 1.52 | 1.66 | 1.65 | 1.68 | 1.94 | 1.81 |
| Bias | - | 0.13 | 0.15 | 0.15 | 0.43 | 0.31 |
| TCC | - | 0.26 | 0.39 | 0.35 | 0.31 | 0.35 |
| RMSE | - | 5.61 | 4.66 | 5.07 | 5.66 | 5.08 |
| Indexes | GPCP-1DD | BMEP | ERA-I | CFSR | JRA55 |
|---|---|---|---|---|---|
| Spatial bias (global) | 0.38 | 0.25 | 0.44 | 0.75 | 0.57 |
| Spatial corr. (global) | 0.42 | 0.61 | 0.48 | 0.44 | 0.52 |
| Spatial RMSE (global) | 5.59 | 4.27 | 5.11 | 6.14 | 4.90 |
| Spatial bias (N.H.) | 0.35 | 0.26 | 0.36 | 0.65 | 0.54 |
| Spatial corr. (N.H.) | 0.40 | 0.62 | 0.52 | 0.48 | 0.55 |
| Spatial RMSE (N.H.) | 4.81 | 3.57 | 4.20 | 4.97 | 4.09 |
| Spatial bias (S.H.) | 0.49 | 0.21 | 0.78 | 1.18 | 0.70 |
| Spatial corr. (S.H.) | 0.39 | 0.56 | 0.40 | 0.36 | 0.44 |
| Spatial RMSE (S.H.) | 7.47 | 5.83 | 7.17 | 8.63 | 6.74 |
Disclaimer/Publisher’s Note: The statements, opinions and data contained in all publications are solely those of the individual author(s) and contributor(s) and not of MDPI and/or the editor(s). MDPI and/or the editor(s) disclaim responsibility for any injury to people or property resulting from any ideas, methods, instructions or products referred to in the content. |
© 2023 by the authors. Licensee MDPI, Basel, Switzerland. This article is an open access article distributed under the terms and conditions of the Creative Commons Attribution (CC BY) license (https://creativecommons.org/licenses/by/4.0/).
Share and Cite
Cao, W.; Nie, S.; Ma, L.; Zhao, L. Statistical Evaluation of the Performance of Gridded Daily Precipitation Products from Reanalysis Data, Satellite Estimates, and Merged Analyses over Global Land. Remote Sens. 2023, 15, 4602. https://doi.org/10.3390/rs15184602
Cao W, Nie S, Ma L, Zhao L. Statistical Evaluation of the Performance of Gridded Daily Precipitation Products from Reanalysis Data, Satellite Estimates, and Merged Analyses over Global Land. Remote Sensing. 2023; 15(18):4602. https://doi.org/10.3390/rs15184602
Chicago/Turabian StyleCao, Weihua, Suping Nie, Lijuan Ma, and Liang Zhao. 2023. "Statistical Evaluation of the Performance of Gridded Daily Precipitation Products from Reanalysis Data, Satellite Estimates, and Merged Analyses over Global Land" Remote Sensing 15, no. 18: 4602. https://doi.org/10.3390/rs15184602
APA StyleCao, W., Nie, S., Ma, L., & Zhao, L. (2023). Statistical Evaluation of the Performance of Gridded Daily Precipitation Products from Reanalysis Data, Satellite Estimates, and Merged Analyses over Global Land. Remote Sensing, 15(18), 4602. https://doi.org/10.3390/rs15184602