Article

Unexpected Expansion of Rare-Earth Element Mining Activities in the Myanmar–China Border Region

by
Emmanuel Chinkaka
1,2,*,
Julie Michelle Klinger
1,
Kyle Frankel Davis
1,3 and
Federica Bianco
4,5,6
1
Department of Geography and Spatial Sciences, University of Delaware, Newark, DE 19716, USA
2
Department of Earth Sciences, Malawi University of Science and Technology, Limbe P.O. Box 5196, Malawi
3
Department of Plant and Soil Sciences, University of Delaware, Newark, DE 19716, USA
4
Department of Physics and Astronomy, University of Delaware, Newark, DE 19716, USA
5
Joseph R. Biden, Jr. School of Public Policy and Administration, University of Delaware, Newark, DE 19716, USA
6
Data Science Institute, University of Delaware, Newark, DE 19716, USA
*
Author to whom correspondence should be addressed.
Remote Sens. 2023, 15(18), 4597; https://doi.org/10.3390/rs15184597
Submission received: 3 July 2023 / Revised: 9 September 2023 / Accepted: 12 September 2023 / Published: 19 September 2023

Abstract

:
Mining for rare earth elements is rapidly increasing, driven by current and projected demands for information and energy technologies. Following China’s Central Government’s 2012 strategy to shift away from mining in favor of value-added processing, primary extraction has increased outside of China. Accordingly, changes in mineral exploitation in China and Myanmar have garnered considerable attention in the past decade. The prevailing assumption is that mining in China has decreased while mining in Myanmar has increased, but the dynamic in border regions is more complex. Our empirical study used Google Earth Engine (GEE) to characterize changes in mining surface footprints between 2005 and 2020 in two rare earth mines located on either side of the Myanmar–China border, within Kachin State in northern Myanmar and Nujiang Prefecture in Yunnan Province in China. Our results show that the extent of the mining activities increased by 130% on China’s side and 327% on Myanmar’s side during the study period. We extracted surface reflectance images from 2005 and 2010 from Landsat 5 TM and 2015 and 2020 images from Landsat 8 OLI. The Normalized Vegetation Index (NDVI) was applied to dense time-series imagery to enhance landcover categories. Random Forest was used to categorize landcover into mine and non-mine classes with an overall accuracy of 98% and a Kappa Coefficient of 0.98, revealing an increase in mining extent of 2.56 km2, covering the spatial mining footprint from 1.22 km2 to 3.78 km2 in 2005 and 2020, respectively, within the study area. We found a continuous decrease in non-mine cover, including vegetation. Both mines are located in areas important to ethnic minority groups, agrarian livelihoods, biodiversity conservation, and regional watersheds. The finding that mining surface areas increased on both sides of the border is significant because it shows that national-level generalizations do not align with local realities, particularly in socially and environmentally sensitive border regions. The quantification of such changes over time can help researchers and policymakers to better understand the shifting geographies and geopolitics of rare earth mining, the environmental dynamics in mining areas, and the particularities of mineral extraction in border regions.

1. Introduction

Rare earth elements (REEs) refer to the fifteen elements that comprise the lanthanide series, ranging in atomic number from 57 (lanthanum) to 71 (lutetium), as well as scandium (Sc) and yttrium (Y) [1]. REEs have garnered heightened attention since 2010 because of China’s historic dominance in the sector, the international impacts of China’s industrial policy changes, and, more recently, the increased global demand for REEs in the renewable energy transition [2]. Although rare earth elements are essential inputs to many types of technologies, their usage in renewable energy technologies such as batteries, catalysts, electric vehicles (EVs), and wind turbines [3] has stimulated increased REE exploration programs by various countries [4]. Since the 1990s, China has dominated global REE mining and production, followed by a few other countries, including the United States and Myanmar [5]. Sanctions against Myanmar’s military regime [6] and grassroots accounts of mining-driven violence and expropriation in northern Myanmar [7] have intensified concerns around REE supply chain ethics, security, and traceability. In particular, Western firms are under pressure to ensure the REEs used in their technologies are not sourced from Myanmar [7]. This has proven challenging because of the general assumption that REE mining in China has decreased or stopped while production in Myanmar has increased, driven by demand from China. Proving or disproving this is challenging because of the global importance of value-added processing that takes place within China [8]. Mineral processing facilities combine material from many parts of the world, meaning that while it is possible to trace REEs from the mine to the processor and to trace refined materials from the processor to downstream users, the processors, refiners, and smelters are often a kind of ‘black box’ in mineral commodity flows because they combine raw materials from diverse sources into a single refined product. Therefore, examining the changing footprint of mining activities over time can provide important insights into the actual origins of raw materials, particularly in cross-border regions.
The observations that the decrease in REE mine production in China is related to the expansion of REE mining in Myanmar are broadly accurate, with notable landscape recovery in former rare earth mining areas in Jiangxi Province, China, for example [9]. But this generalization cannot be extrapolated into a causal relationship based on remote sensing analysis alone. Such analyses must be enriched with qualitative research in situ to avoid obscuring important local realities, particularly in sensitive border regions. This study offers empirically substantiated evidence that mining activities are increasing in the region, but increases or decreases in activity are not neatly determined by the location of a deposit relative to national borders. This finding is significant for three major reasons.
First, we have chosen REE mines on either side of the Myanmar–China border, in Kachin State in northern Myanmar and Nujiang Prefecture in Yunnan Province in China, in order to investigate whether policy changes have translated into changing mining footprints on the ground. If the broader narratives are correct and China’s strategies to shift from being a net importer of rare earth elements to being a net exporter have had their intended impacts, then we should expect to see increased rare earth mining in Myanmar and a decrease in rare earth mining activity in China in the context of this border region. Our findings show a more complex situation. This raises important questions about the relationship between policy change, geopolitical shifts, and landcover change in extractive border regions and should enrich ongoing debates about the shifting geographies of rare-earth element supply chains.
Second, the emphasis on the importance of rare earth elements for renewable energy infrastructure has intensified concerns around the social and environmental conditions at mining sites. Reports of land theft, threats of violence, and little to no pollution controls in Myanmar illustrate the practical sustainability concerns surrounding the material needs for the renewable energy transition. However, it is important to note that rare earth elements are used in every major form of energy generation, so these concerns should not be treated as unique to renewable energy technology or solely driven by projected demand increases for electric vehicles. Over the past decade, the demand for consumer electronics and military equipment, both major sectors of REE applications, has also increased [10].
Third, mining operations can produce severe environmental degradation, including air pollution, water contamination, and deforestation, as the mine extent expands over time [11,12,13]. This impairs ecosystem function and landcover dynamics [14,15]. Therefore, it is critical to monitor the development of mining activities on the landscape as a measure of effective environmental protection and mine management. By using open-source data and demonstrating a novel application of established methods to this particular issue, our study shows one reproducible and adaptable method to investigate this dynamic in other contexts where extractive activities are taking place on both sides of a national border dividing two very different regulatory contexts, such as south Texas, US, and Tamaulipas, Mexico [16], or between Copper Belt, Zambia, and Katanga Province, Democratic Republic of the Congo [17], to name just two examples.
The development of remote sensing technology and sensors has advanced the manner in which mining land surfaces in most areas of the earth’s surface can be monitored in a multi-temporal, multi-resolution, and multi-scale manner [12]. Accordingly, many studies have been conducted using satellite remote sensing data to monitor the surface landscape of mining areas in general [18,19,20] and rare earth mines and impacts in particular [9,21]. Mining and restoration assessment indicators (MRAIs) and land surface temperature (LST) of multi-temporal Landsat TM, ETM+, and OLI images were used by Xie et al. [9] to monitor the impacts of REE mining and restoration on the environment. Vorovencii [22] used a Support Vector Machine (SVM) classifier to detect changes and land restoration in the mining areas using multi-temporal Landsat data in Jiu Valley, Romania. The Normalized Difference Vegetation Index (NDVI), Soil Adjusted Vegetation Index (SAVI), and Modified Soil Adjusted Vegetation Index-2 (MSAVI-2) were used to identify and quantify active mines and reclaimed areas within the study area [22]. The Sentinel-2 satellite imagery dataset was used by Juanda et al. [23] to pinpoint surface areas of land degradation on mining sites using a comparative analysis of vegetation indices. Laari et al. [24] applied a maximum likelihood classifier to determine landcover changes in the mining areas of Wa East District, Ghana, using Landsat ETM imagery. Change detection was utilized by Li et al. [25] to monitor the ground-surface environment in the Lingbei rare earth mining area. The landcover change dynamics in mining areas are an essential indicator for determining the impacts of mining operations [26,27]. Landcover mapping algorithms include Artificial Neural Network (ANN) [28], Support Vector Machine (SVM) [29], Random Forest (RF) [30], and Deep Learning (DL) [31,32]. However, among these classifiers, RF has gained great popularity in landcover mapping due to its higher accuracy and relatively low computational cost [30,33,34]. Currently, the Google Earth Engine (GEE) platform provides access to remotely sensed datasets such as Landsat mission data, Sentinel-2, and MODIS for earth observation analysis [35,36]. It allows fast and powerful tools for landuse and landcover mapping in the cloud, which is efficient in processing big geo-data, including dense time-series images, as applied in this study [37,38]. Therefore, based on the GEE platform, this study analyzes the development of REEs’ mining extents from the 2005–2020 period using Landsat missions’ satellite data through landcover change detection. Remote sensing imagery for 2005 and 2010 from Landsat 5 TM and 2015 and 2020 images from Landsat 8 Operational Land Imager (OLI) were processed to determine changes in mining and non-mining areas, and a change detection analysis was performed to quantify the landcover change dynamics of mine and non-mine areas. This is part of a larger global study that aims to map, measure, and characterize the shifting geographies of licit and illicit supply networks of several energy-critical materials, including rare earth elements.

2. Materials and Methods
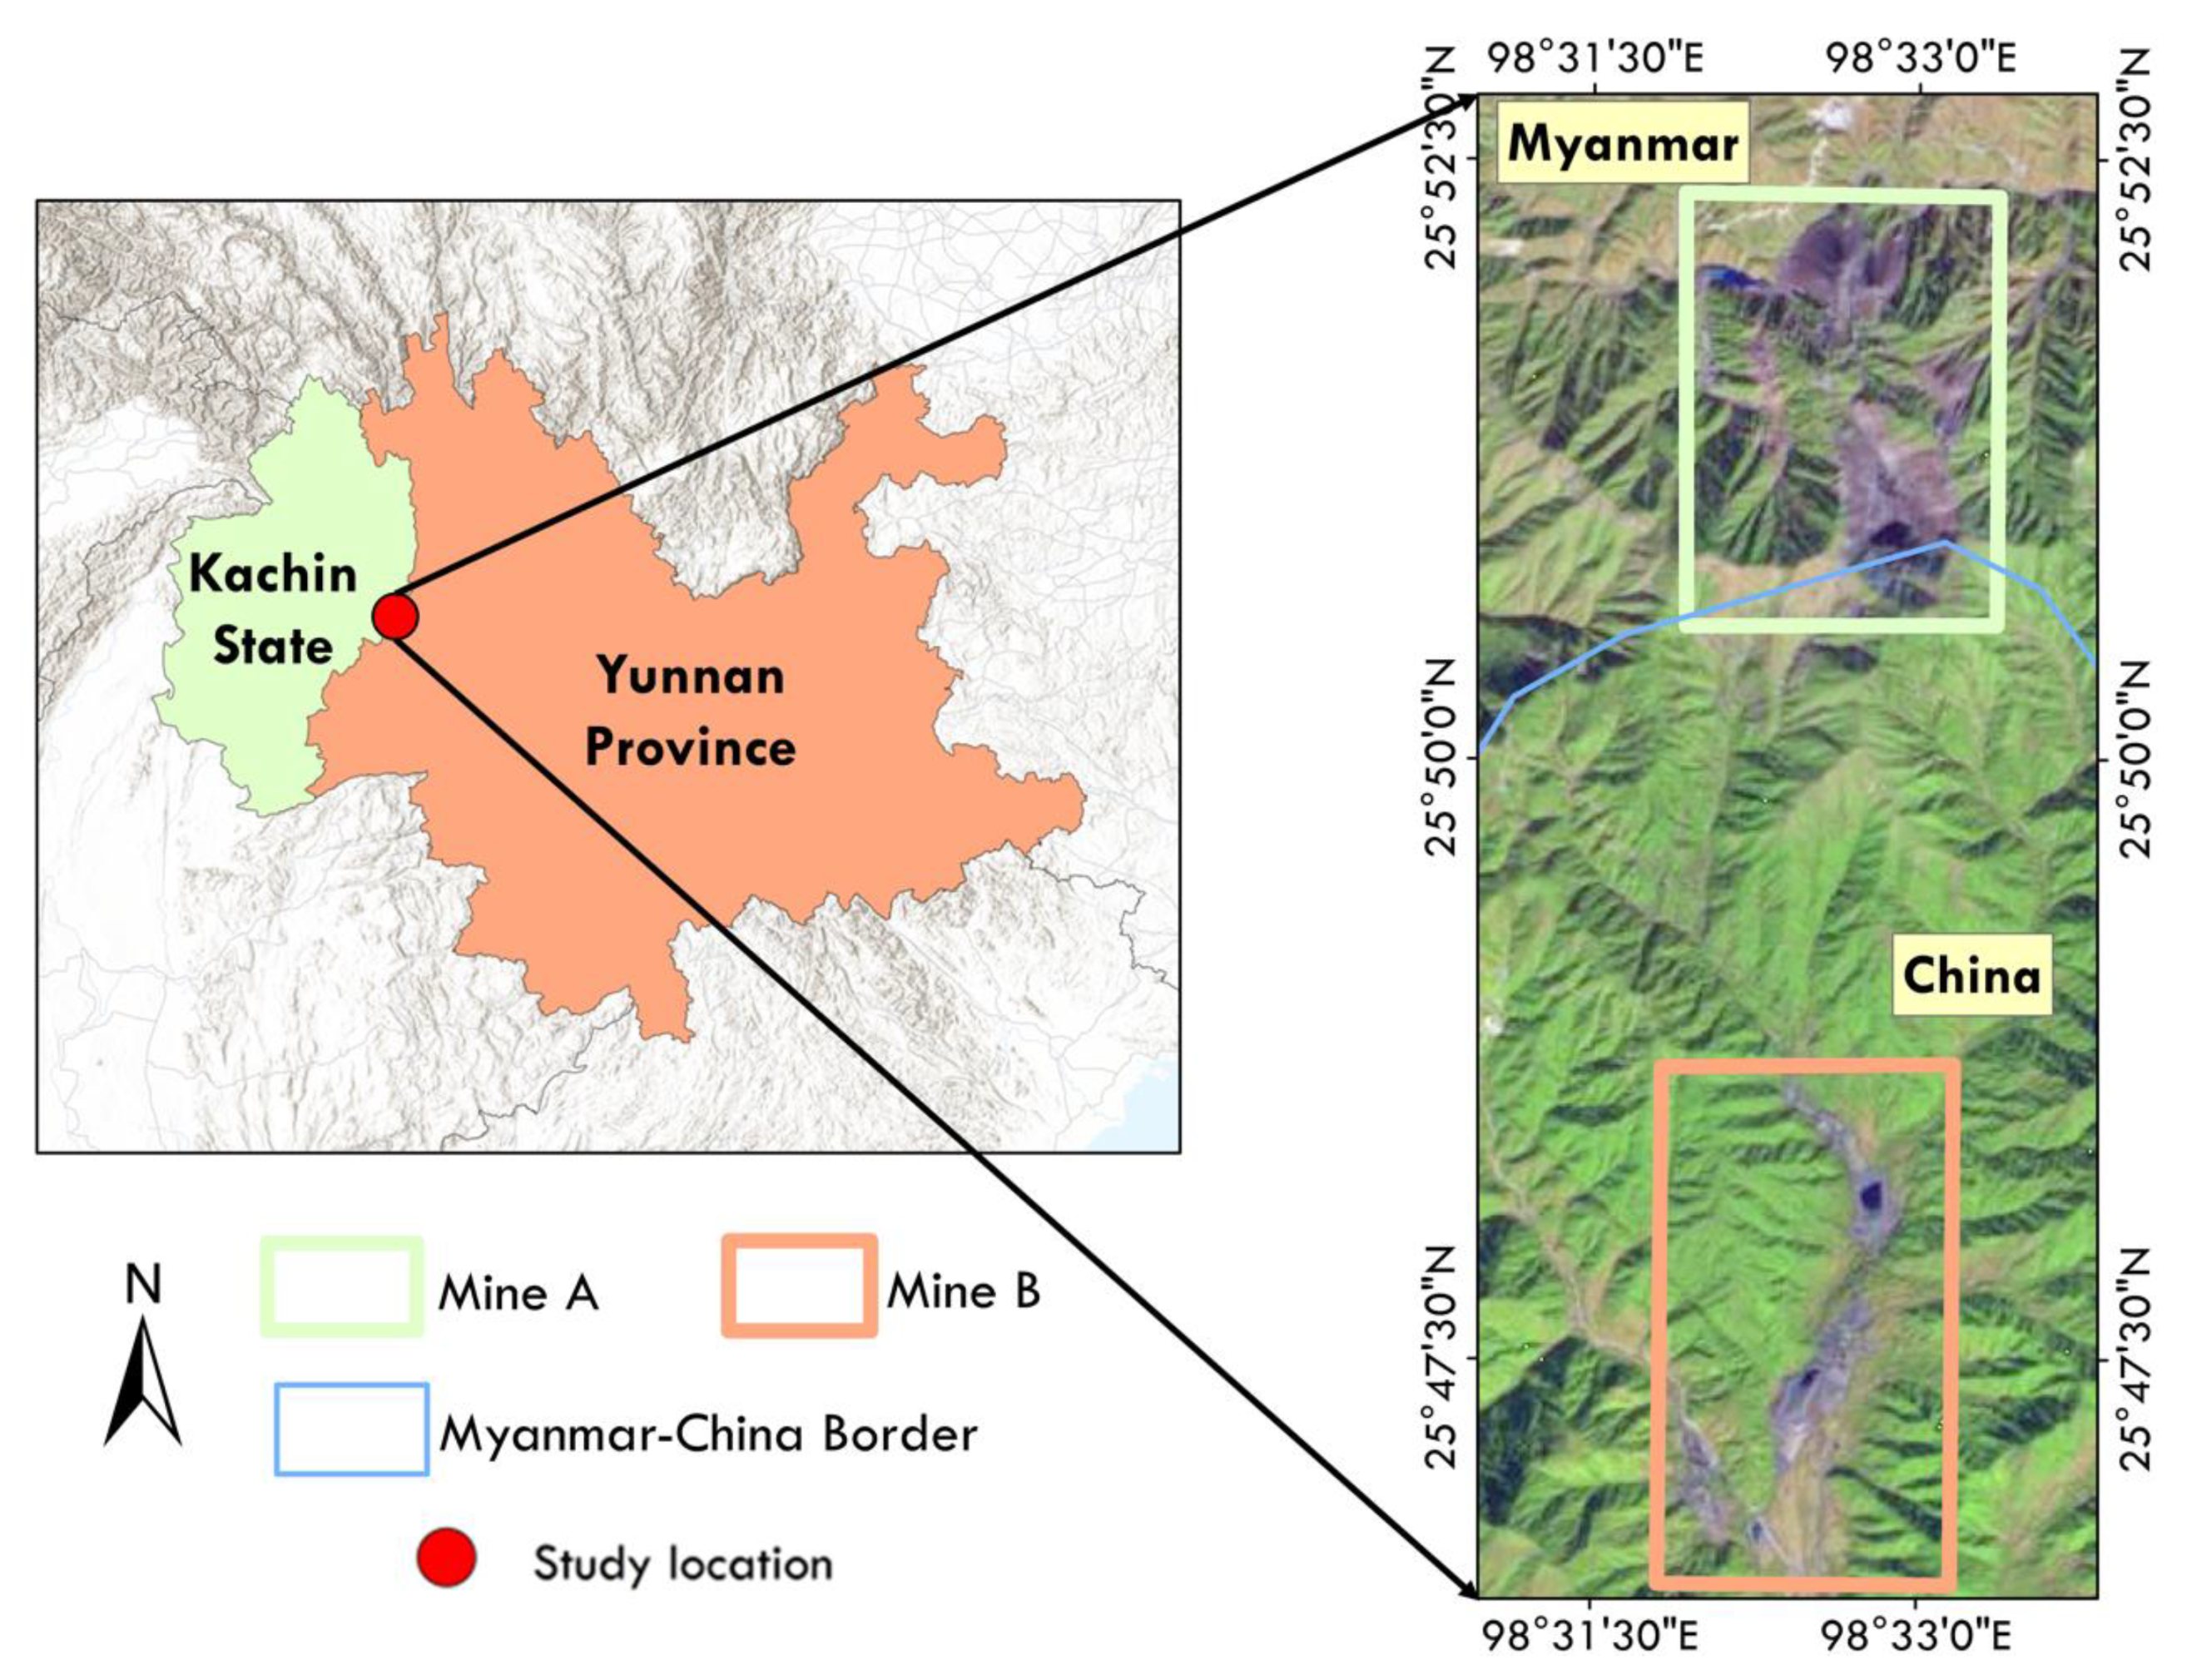
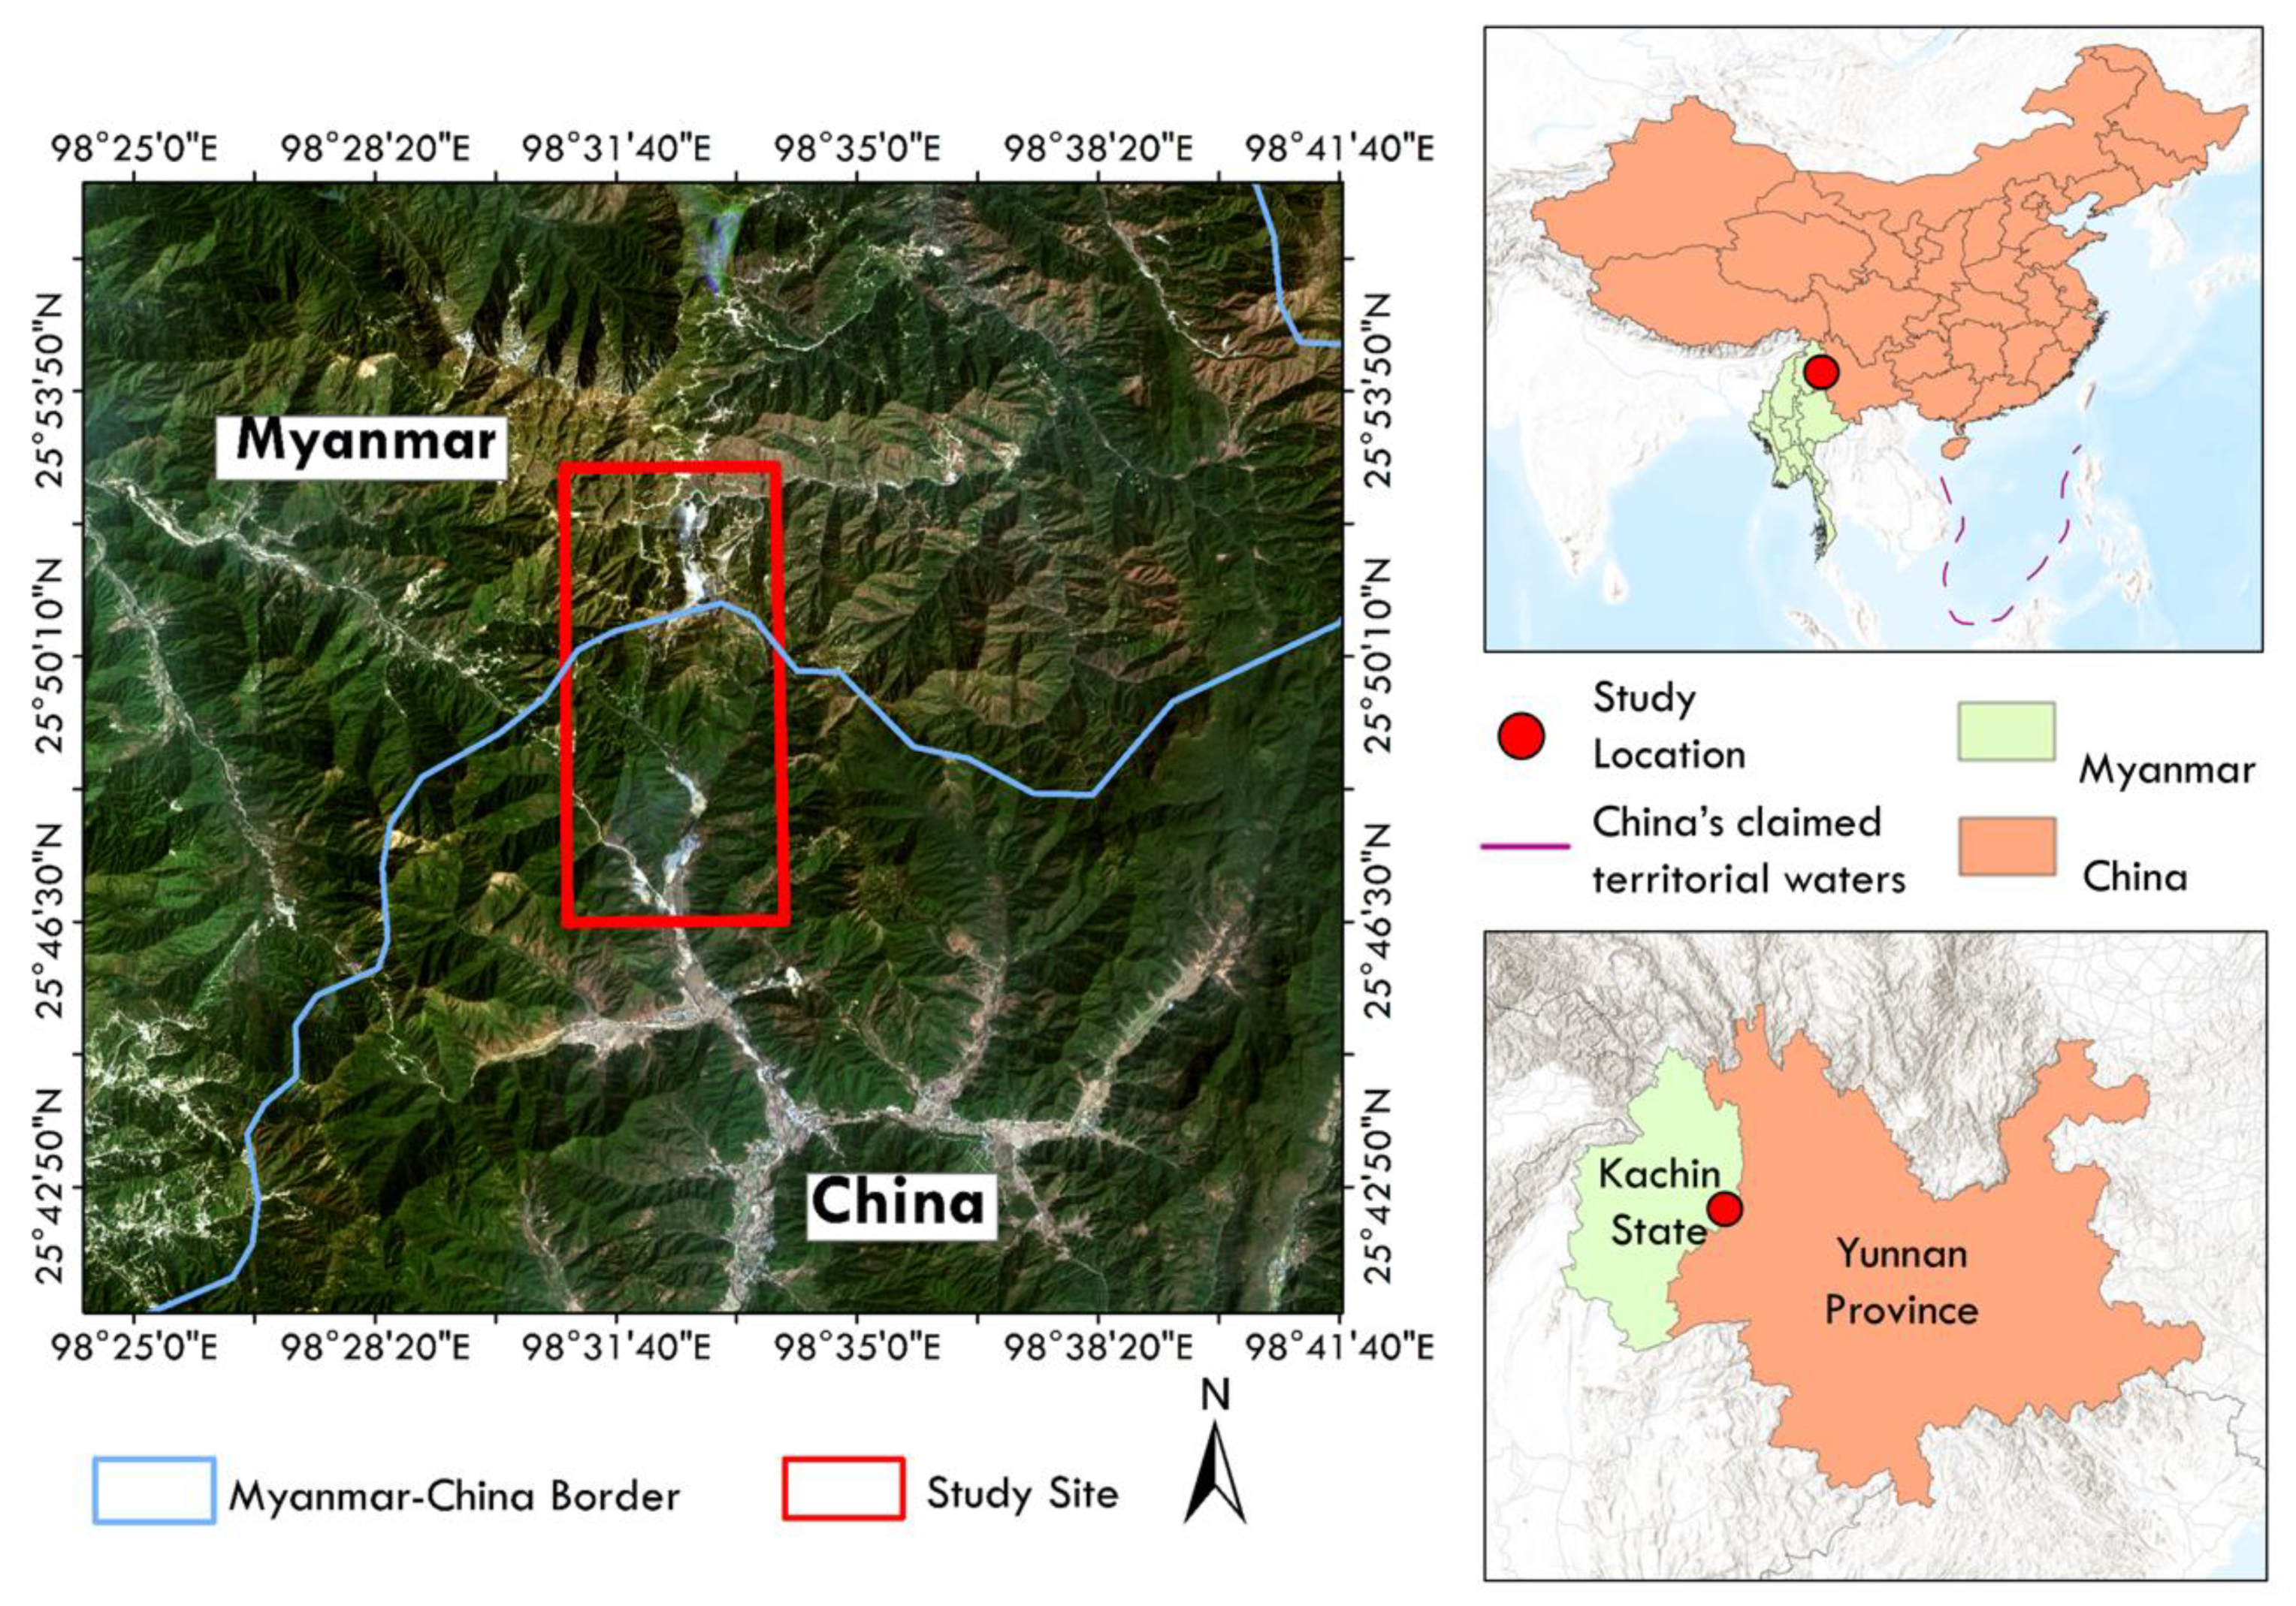
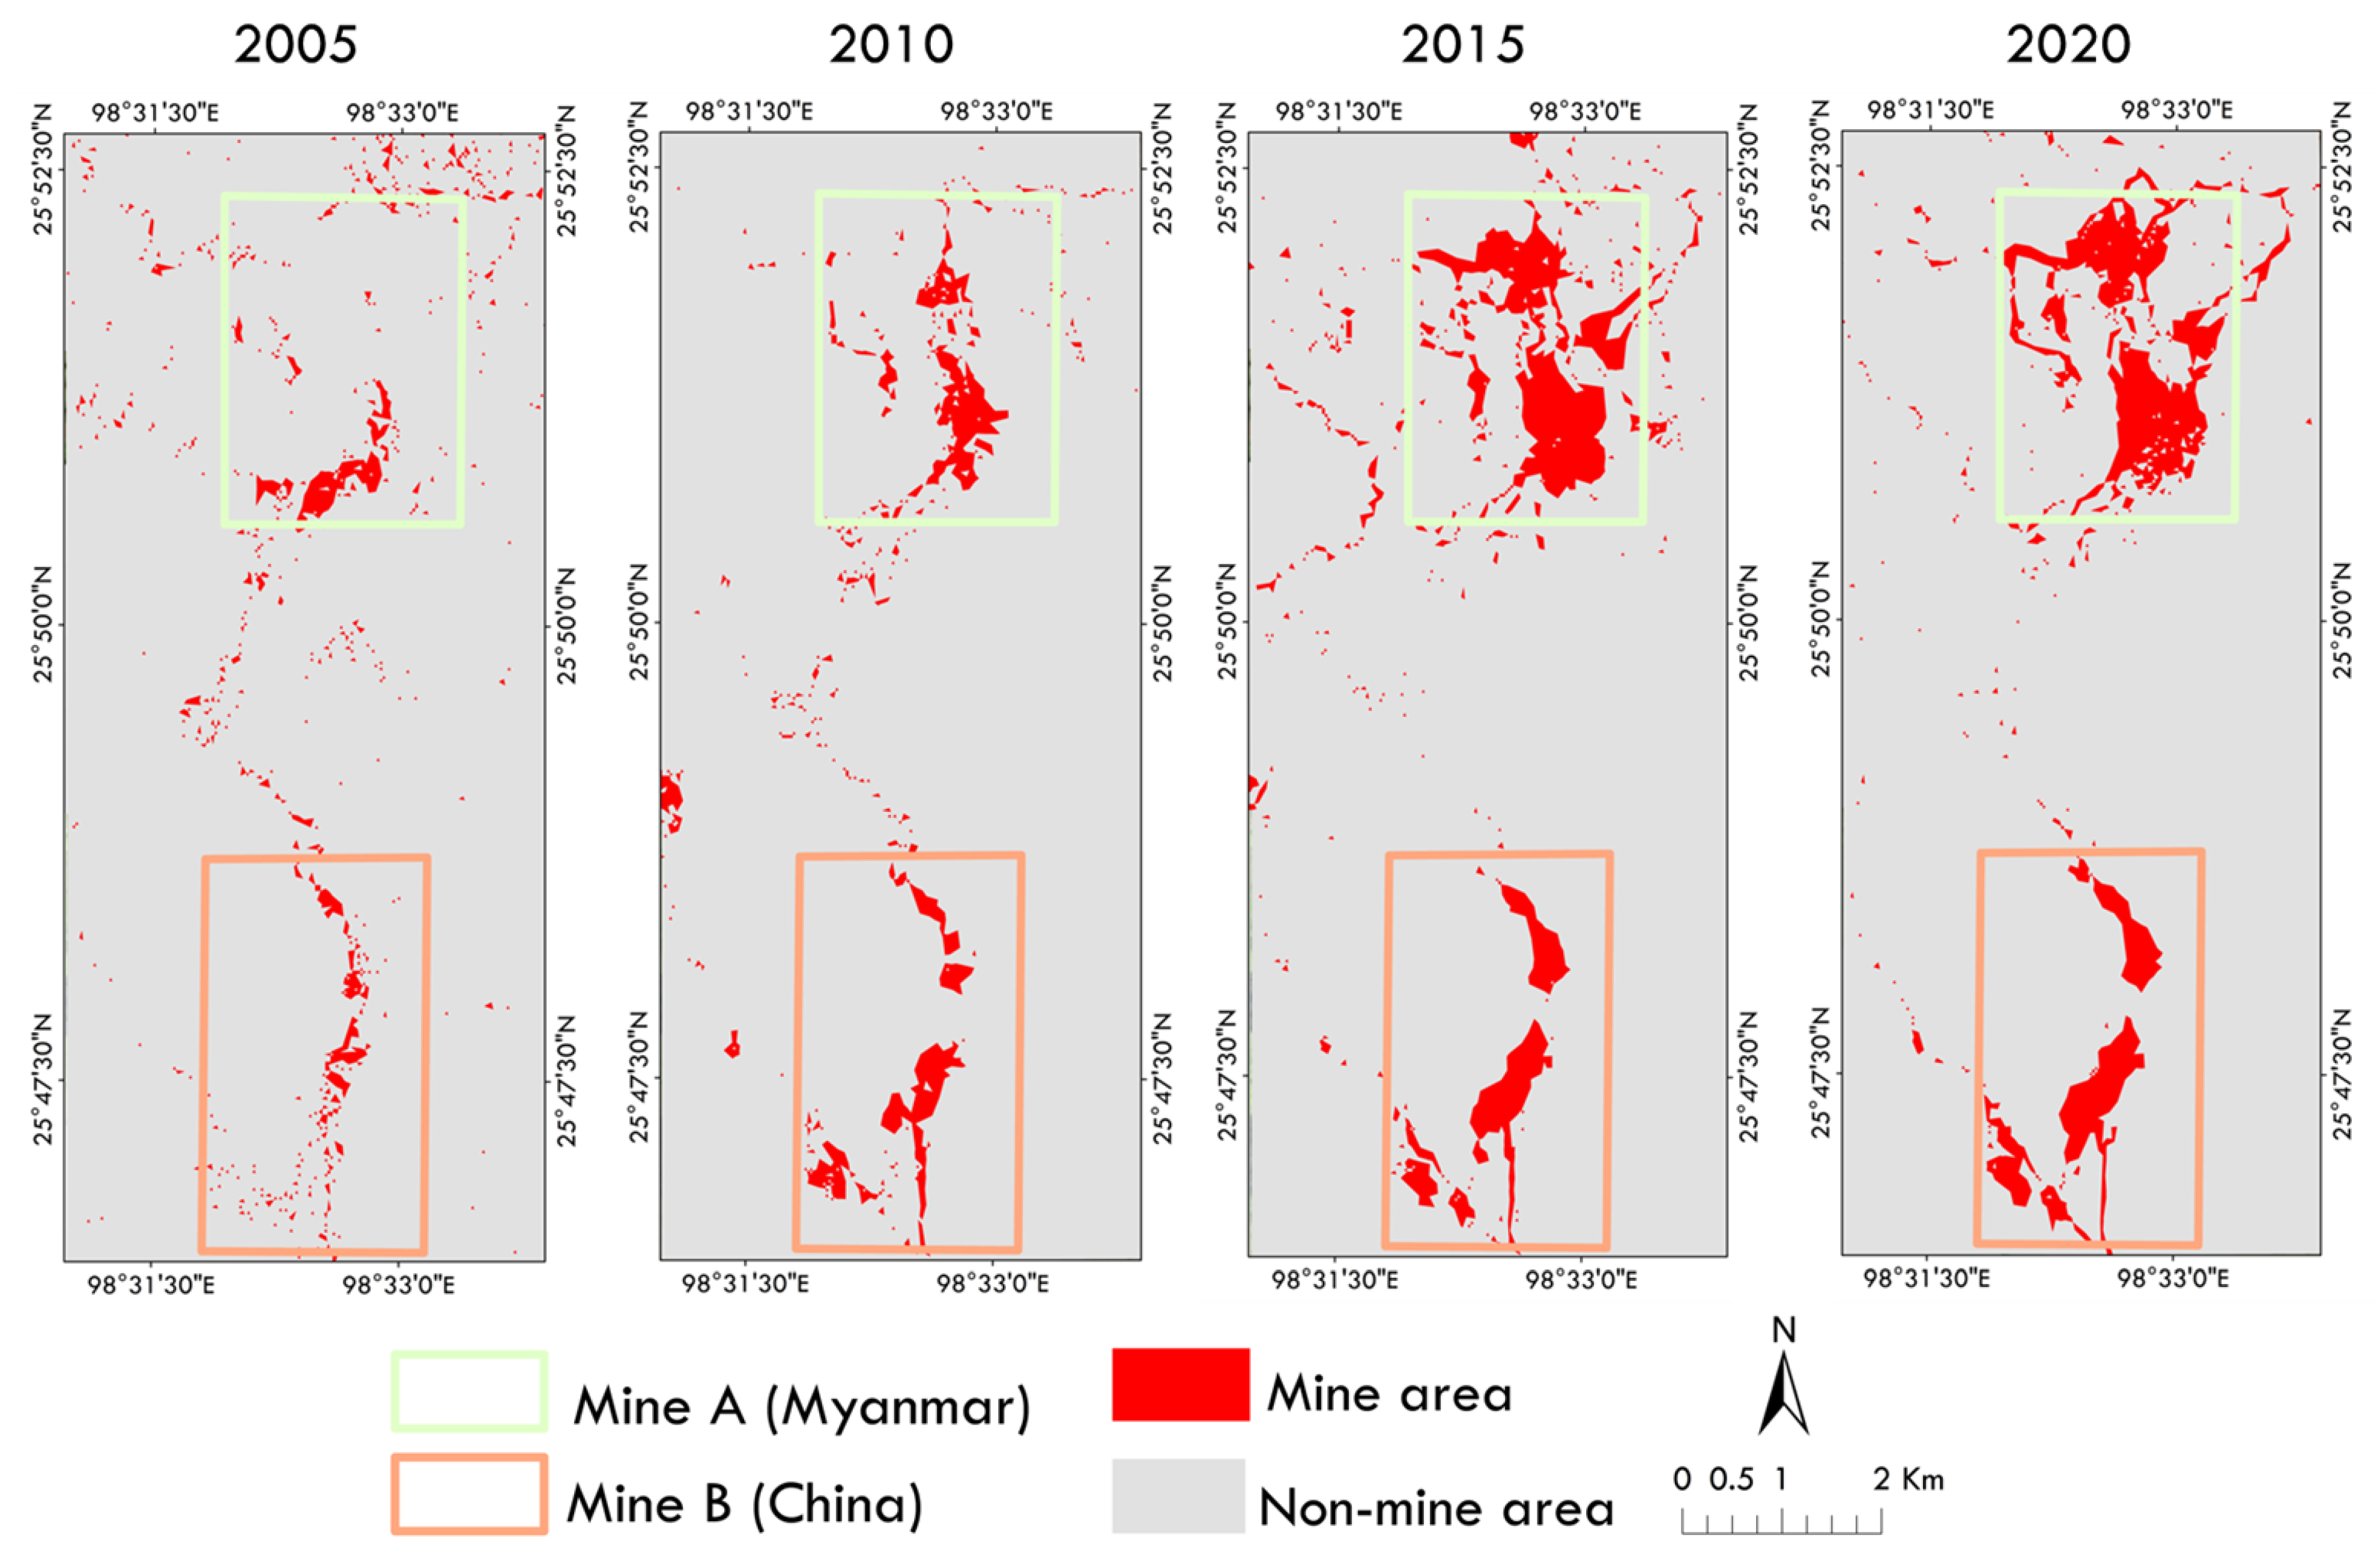
2.1. Study Area

The study area is located in the mining region in the Myanmar–China border in the Myitkyina area in the eastern Kachin State in northern Myanmar and the Nujiang Prefecture area in the western Yunnan Province in southwest China (Figure 1). The study area consists of multiple open-pit mining operations within a long rectangular area located near 98.53°E and 25.89°N, with a total area coverage of about 57.76 km2. The area is characterized by rough mountainous terrain, extensive plateaus, and very heavy and dense vegetation, with no major urban settlements. It is home to several diverse ethnolinguistic groups and has historically hosted largely autonomous agrarian and agropastoral livelihoods [39,40]. The climate of the study area is subtropical, humid, and highland oceanic [41,42]. Rainfall occurs mainly in the monsoon season (between June and October) and is between 1900 and 2540 mm on average [43]. This climate context is important to bear in mind when considering the potential impacts of mining activities, particularly on water quality, soil erosion, and landslides that may result from excavation activities in mountainous regions with heavy rainfall.

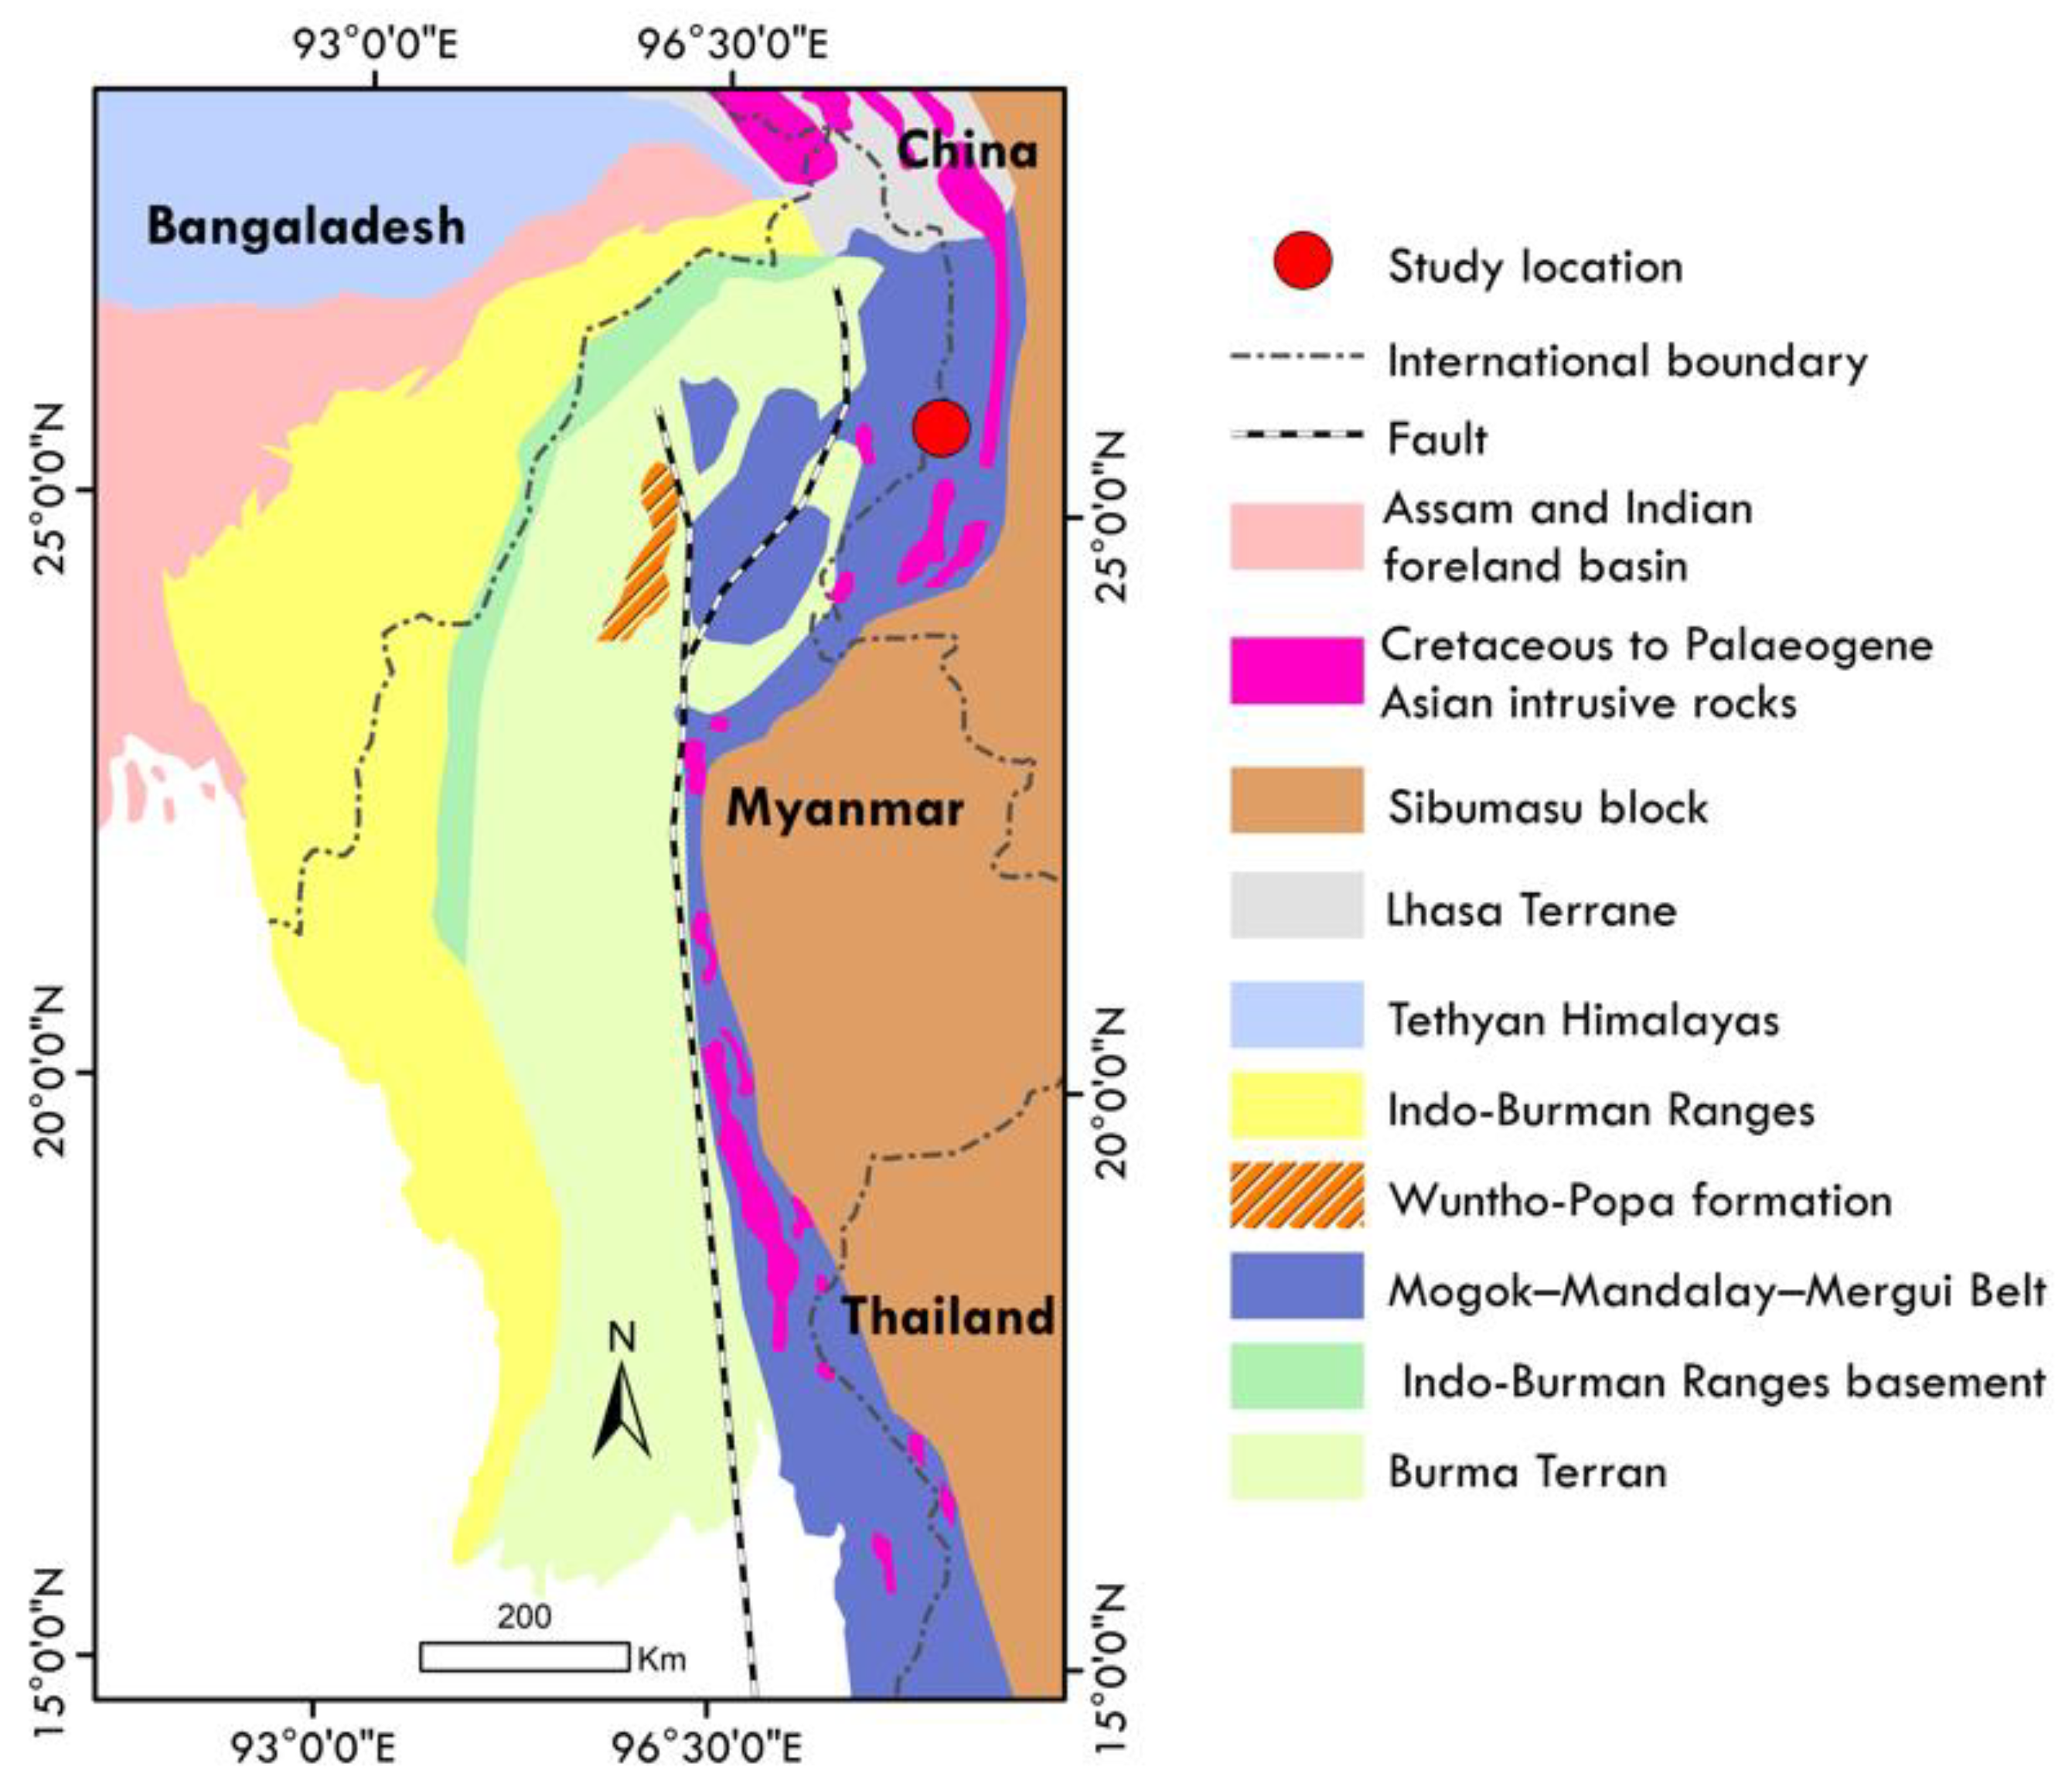
2.2. Geological and Tectonic Setting

Tectonically, the study area forms part of the Alpine–Himalayan Orogenic Belt and the Indonesian Island Arc System [44]. In the northern part of the area, in Myanmar, the orogenic belt is bent around the Eastern Himalayan Syntaxis into a north–south direction and passes southwards through the resource-rich Indo-Myanmar Ranges, while in the south and eastern parts, in China, the area forms a great part of the Shan Plateau known as the Sibumasu block of rocks [45,46]. The local geology comprises a complex succession of metamorphic rocks (the Mogok–Mandalay–Mergui Belt, Figure 2) that forms the boundary of the Burma Terrane [47]. The area is endowed with mineral resources such as rare earth elements and precious metals, including jadeite and “Burmese Amber” (burmite) [48]. These precious stones were formed due to the metasomatic alteration of peridotites in a subduction zone [49,50].
Detailed geological and mineralogical survey data are not freely available in China and Myanmar; therefore, it is necessary to verify the type of mining activity in the study area to confirm that the mining is indeed for rare earth elements. We utilized satellite remote sensing and the United States Geological Survey (USGS) Spectroscopy Laboratory Library for the hyperspectral signature of rare earth elements and host minerals of monazite to verify the presence of rare earth elements in these mines as described by Karimzadeh and Tangestani [51]. Monazite (Nd, Ce, La, Y, Th) PO4 is a phosphate of the group of rare earth metals usually found as a comparatively rare accessory mineral in granitic rocks and pegmatites. It is a reddish-brown phosphate mineral that contains rare earth elements, primarily neodymium (Nd) [52]. Neodymium expresses spectral diagnostic absorption features around 0.53 µm, 0.74 µm, 0.80 µm, and 0.87 µm [51]. As such, any spectral absorption features around these frequencies are related to rare earth elements’ occurrences. Obtaining a monazite spectrum from a sample or image confirms the presence of rare earth metals. Among the available elements in monazite, neodymium has a unique absorption feature around 0.74 µm. This feature is indicative of monazite presence with multiple rare earth combinations (Nd, Ce, La, Y, Th) [53]. The USGS monazite reflectance sample was obtained from Miguel County, New Mexico, USA, as a pure monazite sample and was analyzed spectroscopically in the USGS Spectroscopy Laboratory to obtain its unique spectral reflectance [54]. We used Sentinel-2 MSI spectral reflectance collected from Sentinel-2 MSI images on an open-pit mine in the study site (Figure 3c, red box) to detect a neodymium diagnostic absorption feature at 0.74 µm. We compared the monazite HS255.3B spectrum (Figure 3a) exhibiting a neodymium absorption feature at 0.74 µm wavelength with various rare earth-bearing minerals, including fluorapatite WS416, goethite WS222, and hematite GDS27 [54]. Following Karimzadeh and Tangestani [51], we compared the USGS spectrum of Monazite HS55.3B [54] resampled to Sentinel-2 MSI bandpasses (Figure 3b) with the Sentinel-2 MSI image spectrum at an open pit with ENVI 5.3 coordinates (X:5455 Y:4081). The retained absorption feature of neodymium at 0.74 µm in Band 6 of Sentinel-2 MSI from the image (Figure 3d) provided a high level of certainty that indeed the mines in the study area are for rare earth elements.

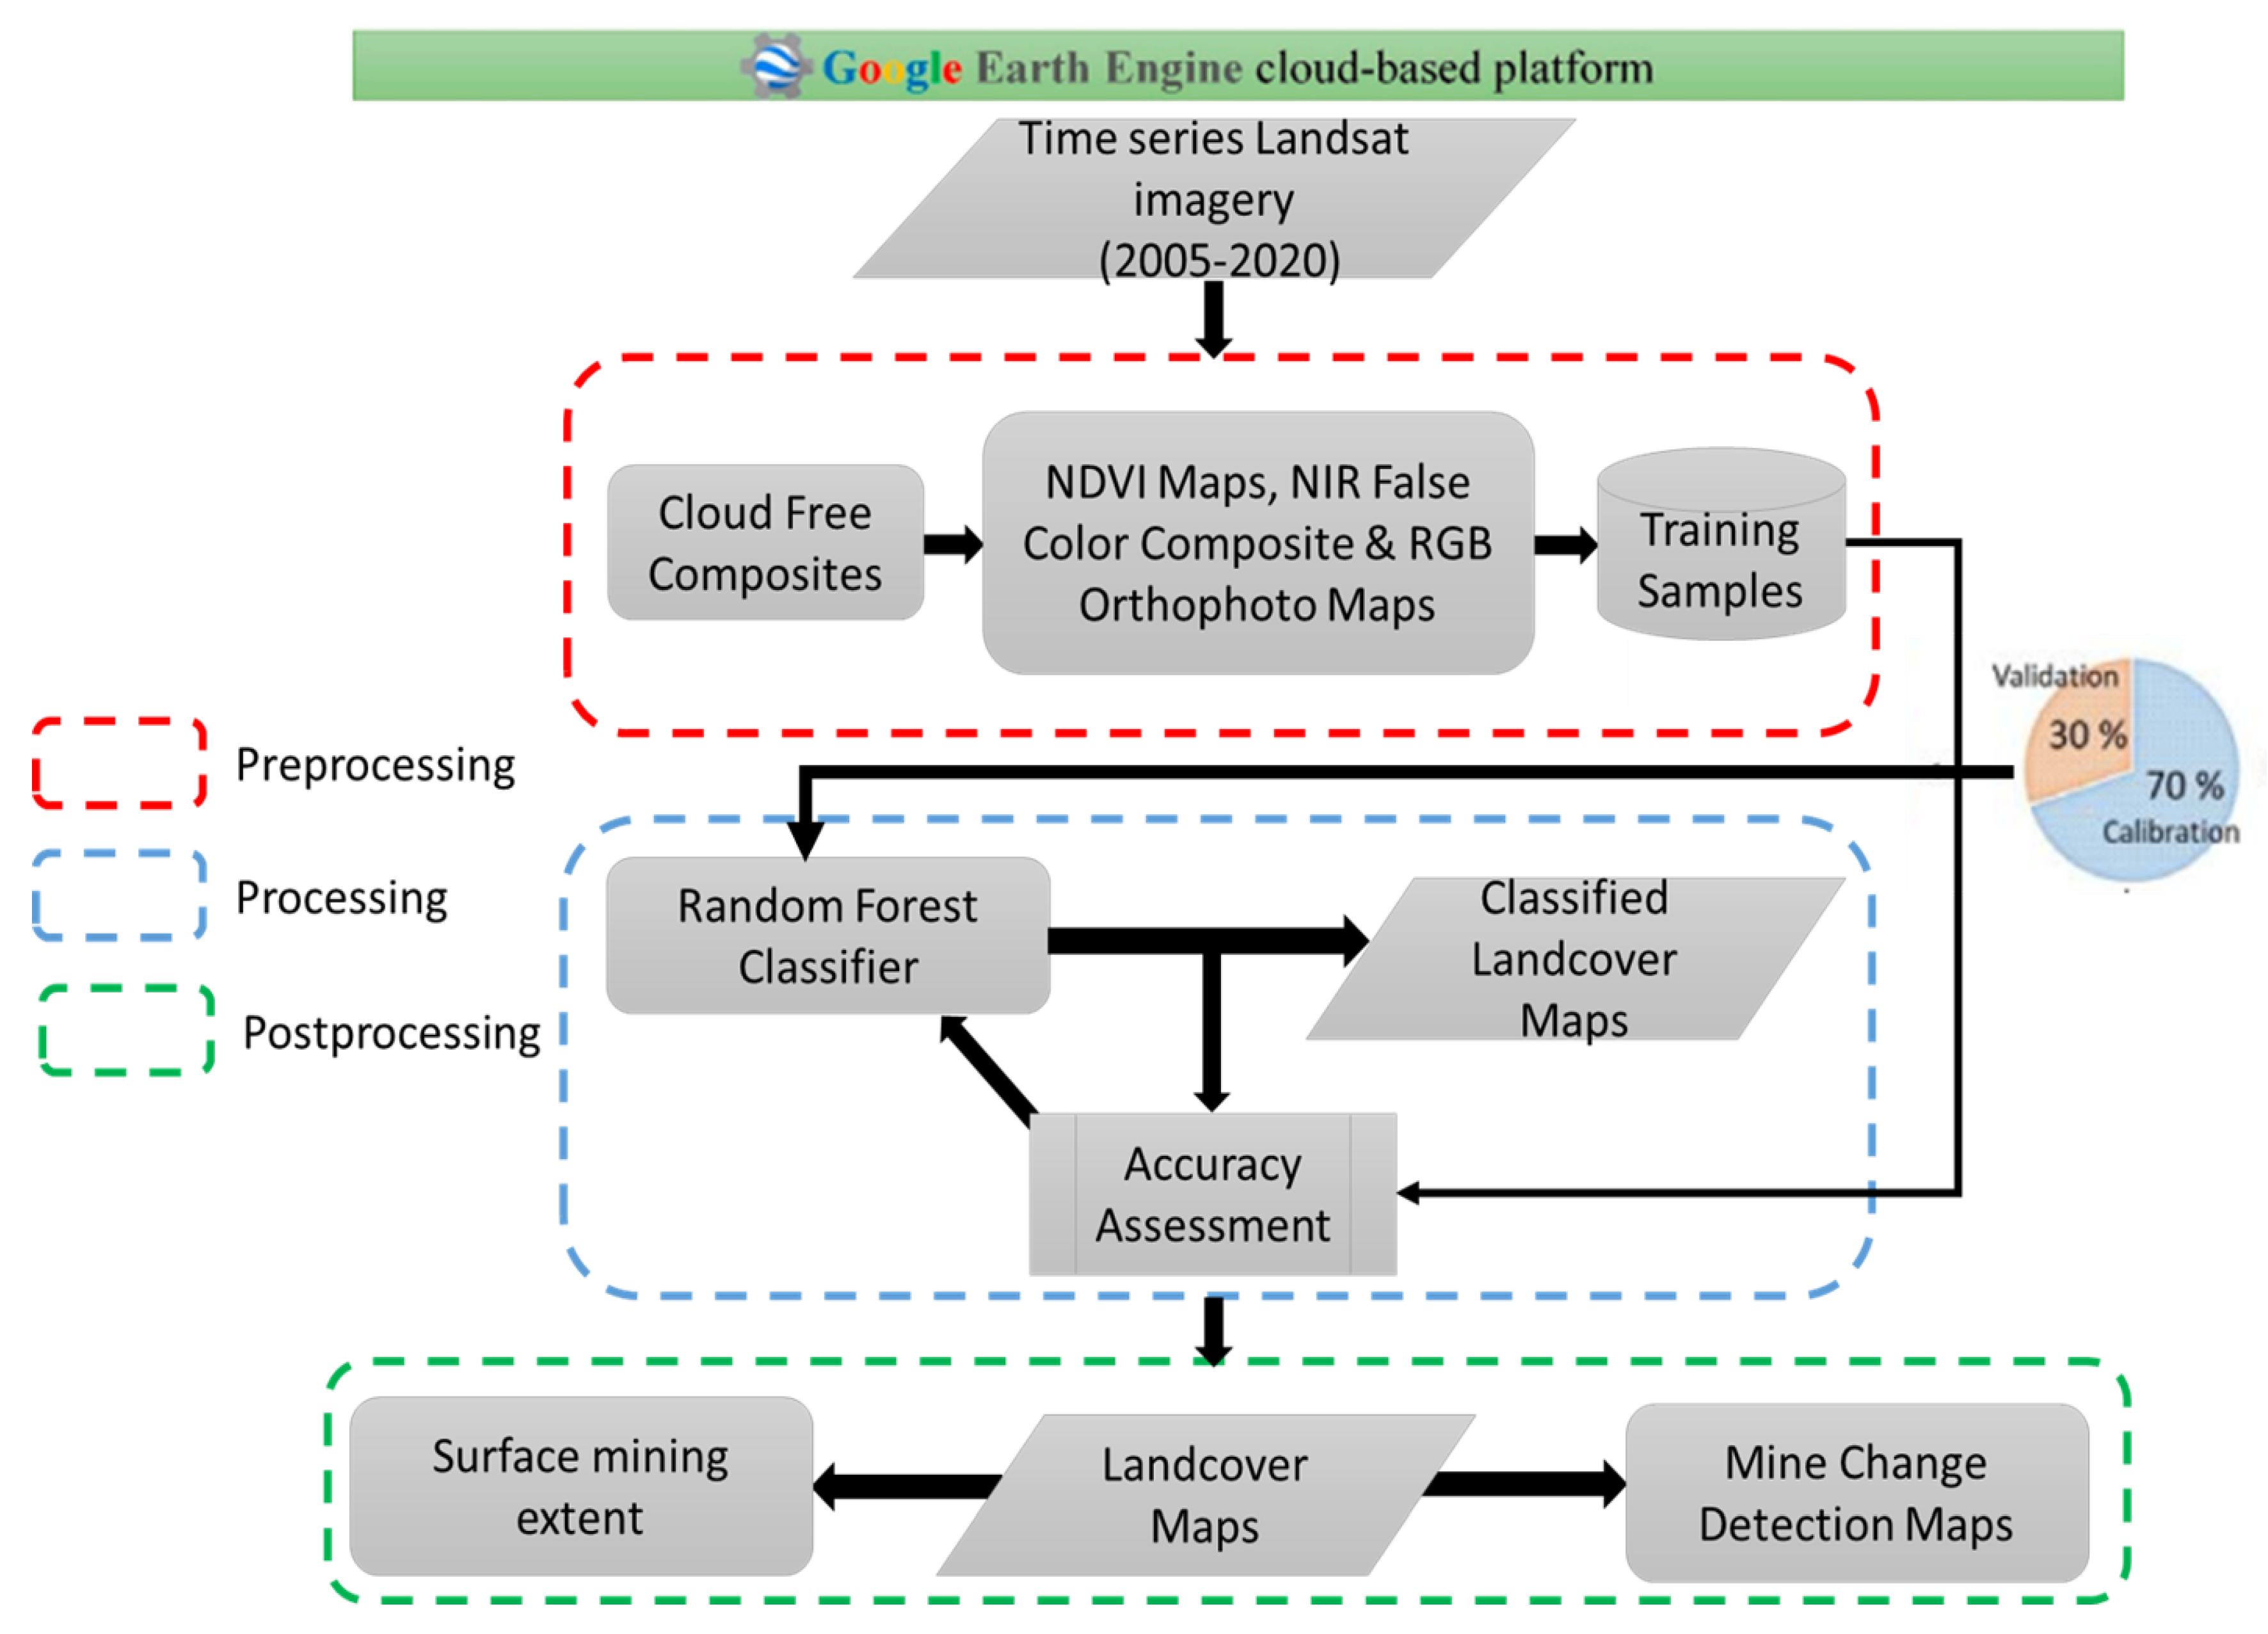
2.3. Satellite Data and Image Preprocessing

Landsat 5 Thematic Mapper™ and Landsat 8 OLI time-series imagery from the USGS database (which provides level 1 and level 2 Landsat data (https://espa.cr.usgs.gov/, accessed on 15 October 2022) were extracted in GEE, obtaining geometrically and atmospherically corrected cloud-free time-series reflectance images for the years 2005 to 2020 (Table 1). Landsat missions’ datasets are freely available on the GEE platform. This study uses open-source platforms for data access and analysis to increase accessibility, adaptability, and reproducibility. Figure 4 shows the location of the study area.
Multi-spectral vegetation indices such as the NDVI measure the ratio of reflectance at different wavelengths as measured in remotely sensed data as a proxy for vegetation health. In particular, the NDVI measures relative reflected energy in the near-infrared wavelengths, which are reflected by healthy chlorophyll, and at red wavelengths [55,56,57]. We measured the NDVI as an indicator of changes in vegetation in mining areas that may be associated with mining operations [22]. The NDVI, proposed by Rouse et al. [58], is defined as follows (Equation (1)):
NDVI = NIR     Red NIR   +   Red
The possible values of the NDVI range between 1 and −1, where 1 indicates a likely high density of green vegetation and 0 or negative values indicate no vegetation [59,60]. Table 2 reports the data specifications of four spectral images that were utilized for landcover mapping and change detection analysis. A detailed methodological flow is illustrated in Figure 5.

Classification Scheme and Sampling for Ground Truthing

Fieldwork in the study area on this topic is not possible for non-local researchers due to the political sensitivity of claims to mineral resources, including armed violence in northern Myanmar [61]. Therefore, reference data for model training and validation were collected remotely. Territorial conflicts surrounding mining activities in international border regions are not unique to the China–Myanmar context, so in theory, the method presented here can be applied to other contexts where field-based ground truthing is not possible. We applied a remote sensing-based integrated approach to identify pixel areas of interest in the images. This includes simultaneous visual inspection and interpretation of maps generated from Landsat 5TM/8OLI images: NDVI maps, Near Infrared False Color Composite (with band combinations of 4, 3, 2 for Landsat 5 TM and 5, 4, 3 for Landsat 8 OLI), RGB Orthophoto Composite Maps (Natural Color Composite with band combinations of 3, 2, 1 for Landsat 5 TM and 4, 3, 2 for Landsat 8 OLI), and high-resolution Google Earth imagery (Figure 5). This approach allows flexibility in the inclusion of different satellite data types depending on data availability and the research question of interest. While we acknowledge the importance of fieldwork-based ground truthing, we are confident that we were able to obtain a reliable set of reference labels that were used as ground-truth datasets for model training and accuracy assessment. We applied a random design when collecting these reference pixels. Training and validation data were randomly selected across each of the images over the areas of interest (AOIs). Random sampling is extensively used for landuse/landcover mapping, as reported in the literature [12,62,63,64,65,66,67]. We obtained 282 labels for randomized pixels in the AOIs. Out of these samples, 100 labels were for mine class and 182 labels were for non-mine class (Table 3 and Table 4).

2.4. Random Forest Classification

Random Forest (RF) classification was performed in the GEE platform, categorizing the study site landscape into mine and non-mine areas by labeling pixels within the images [68,69,70,71]. RF is a non-parametric machine learning classifier that deploys an ensemble of decision trees, each of which divides input pixels into mutually exclusive groups [30]. An RF classifier is essentially a set of flow charts, or “tree models”, where observations (here pixels) are associated into groups based on consecutive binary cuts on subsets of the input features and observations. The cuts are made in the so-called “nodes”. The final groups of observations are referred to as “leaves”. Each node can be subdivided until it is representative of one of the final classes, but the number of allowed splits can also be limited [72]. RF was chosen in this research due to its higher accuracy and relatively low computational cost [30,65,73]. Tamiminia et al. [74] reviewed 349 GEE peer-reviewed papers in a span of 10 years and showed that RF is the most frequently used classification model for landcover in the remote sensing community. RF models, in particular, are less susceptible to overfitting than single decision trees [30]. The large number of trees, each using a randomized subset of the input features, reduces the correlation between trees. This and the strength of the individual trees control the generalization error of forests. The GEE implementation of the RF classifier algorithm allows control of six model hyperparameters: (1) the number of decision trees to create, (2) the number of variables that are used by each node, (3) the bagged fraction of the input variables for each decision tree, (4) the minimum leaf population, (5) the maximum number of node splits, and (6) a random seed to enable reproducibility [65,75]. Panuju et al. [76] suggest that controlling the number of decision trees to create and the number of variables that are used by each node is a sufficient precaution to limit the risk of overfitting (and we see that our performance on the validation test is extremely high, with minimal to no degradation compared to the training set performance). Our model takes the input of the reflectance at each of the eight wavelengths of bands 1 to 8 for each pixel in each image from each year. In this study, we leave the number of variables that are used by each node set to the default GEE value of the square root of the number of variables ( v a r i a b l e s P e r S p l i t = i n t 8 ). This is consistent with the recommendation of keeping variablesPerSplit << N_variables to prevent overfitting [30,77], while we optimize the number of decision trees, ultimately setting it to 50 based on validation accuracy and visual inspection of the classification results. We separated the reference data into a training and a testing set using a 70:30 ratio, where 70% of the points were used for model training and the rest for testing. To assert the validity of the classification results [78], we used the Overall Accuracy (OA) and Cohen’s Kappa Coefficient (k) in a confusion matrix analysis [79,80], as follows:
k = N i = 1 2 m i , i i = 1 2 C i G i N 2 i = 1 2 C i G i
where i stands for the class number, N denotes the total number of classified pixels, m i , i represents the number of pixels of class i that have been assigned to class i, Ci is the total number of classified pixels in class i, and Gi denotes the total number of field data pixels in class i.

2.5. Change Detection

A change matrix depicting changes in mine areas and non-mine areas from the initial analysis year (2005) to the final year of analysis (2020) was computed from the classified maps. To quantify spatiotemporal changes [64,81,82], we generated maps of gains and losses of mine and non-mine cover. Further, change detection statistics were used to compile a detailed tabulation of changes between images acquired during the study period. The open-pit mine area extents and their corresponding quantities from the two identified mines (Mine A in Myanmar and Mine B in China) were extracted from the classified maps. Classified and change analysis area estimate calculations were based on pixel-level calculations of the landcover class, that is, the number of pixels in a particular class. The area changes of the classes, which are mine and non-mine areas in our study case, are a result of the post-classification, which corresponds to the area unit covered by the class pixels [83]. We show the post-classification area change analysis that generates pixel classes of the “from–to” information of binary change maps through change vector analysis [84].

3. Results

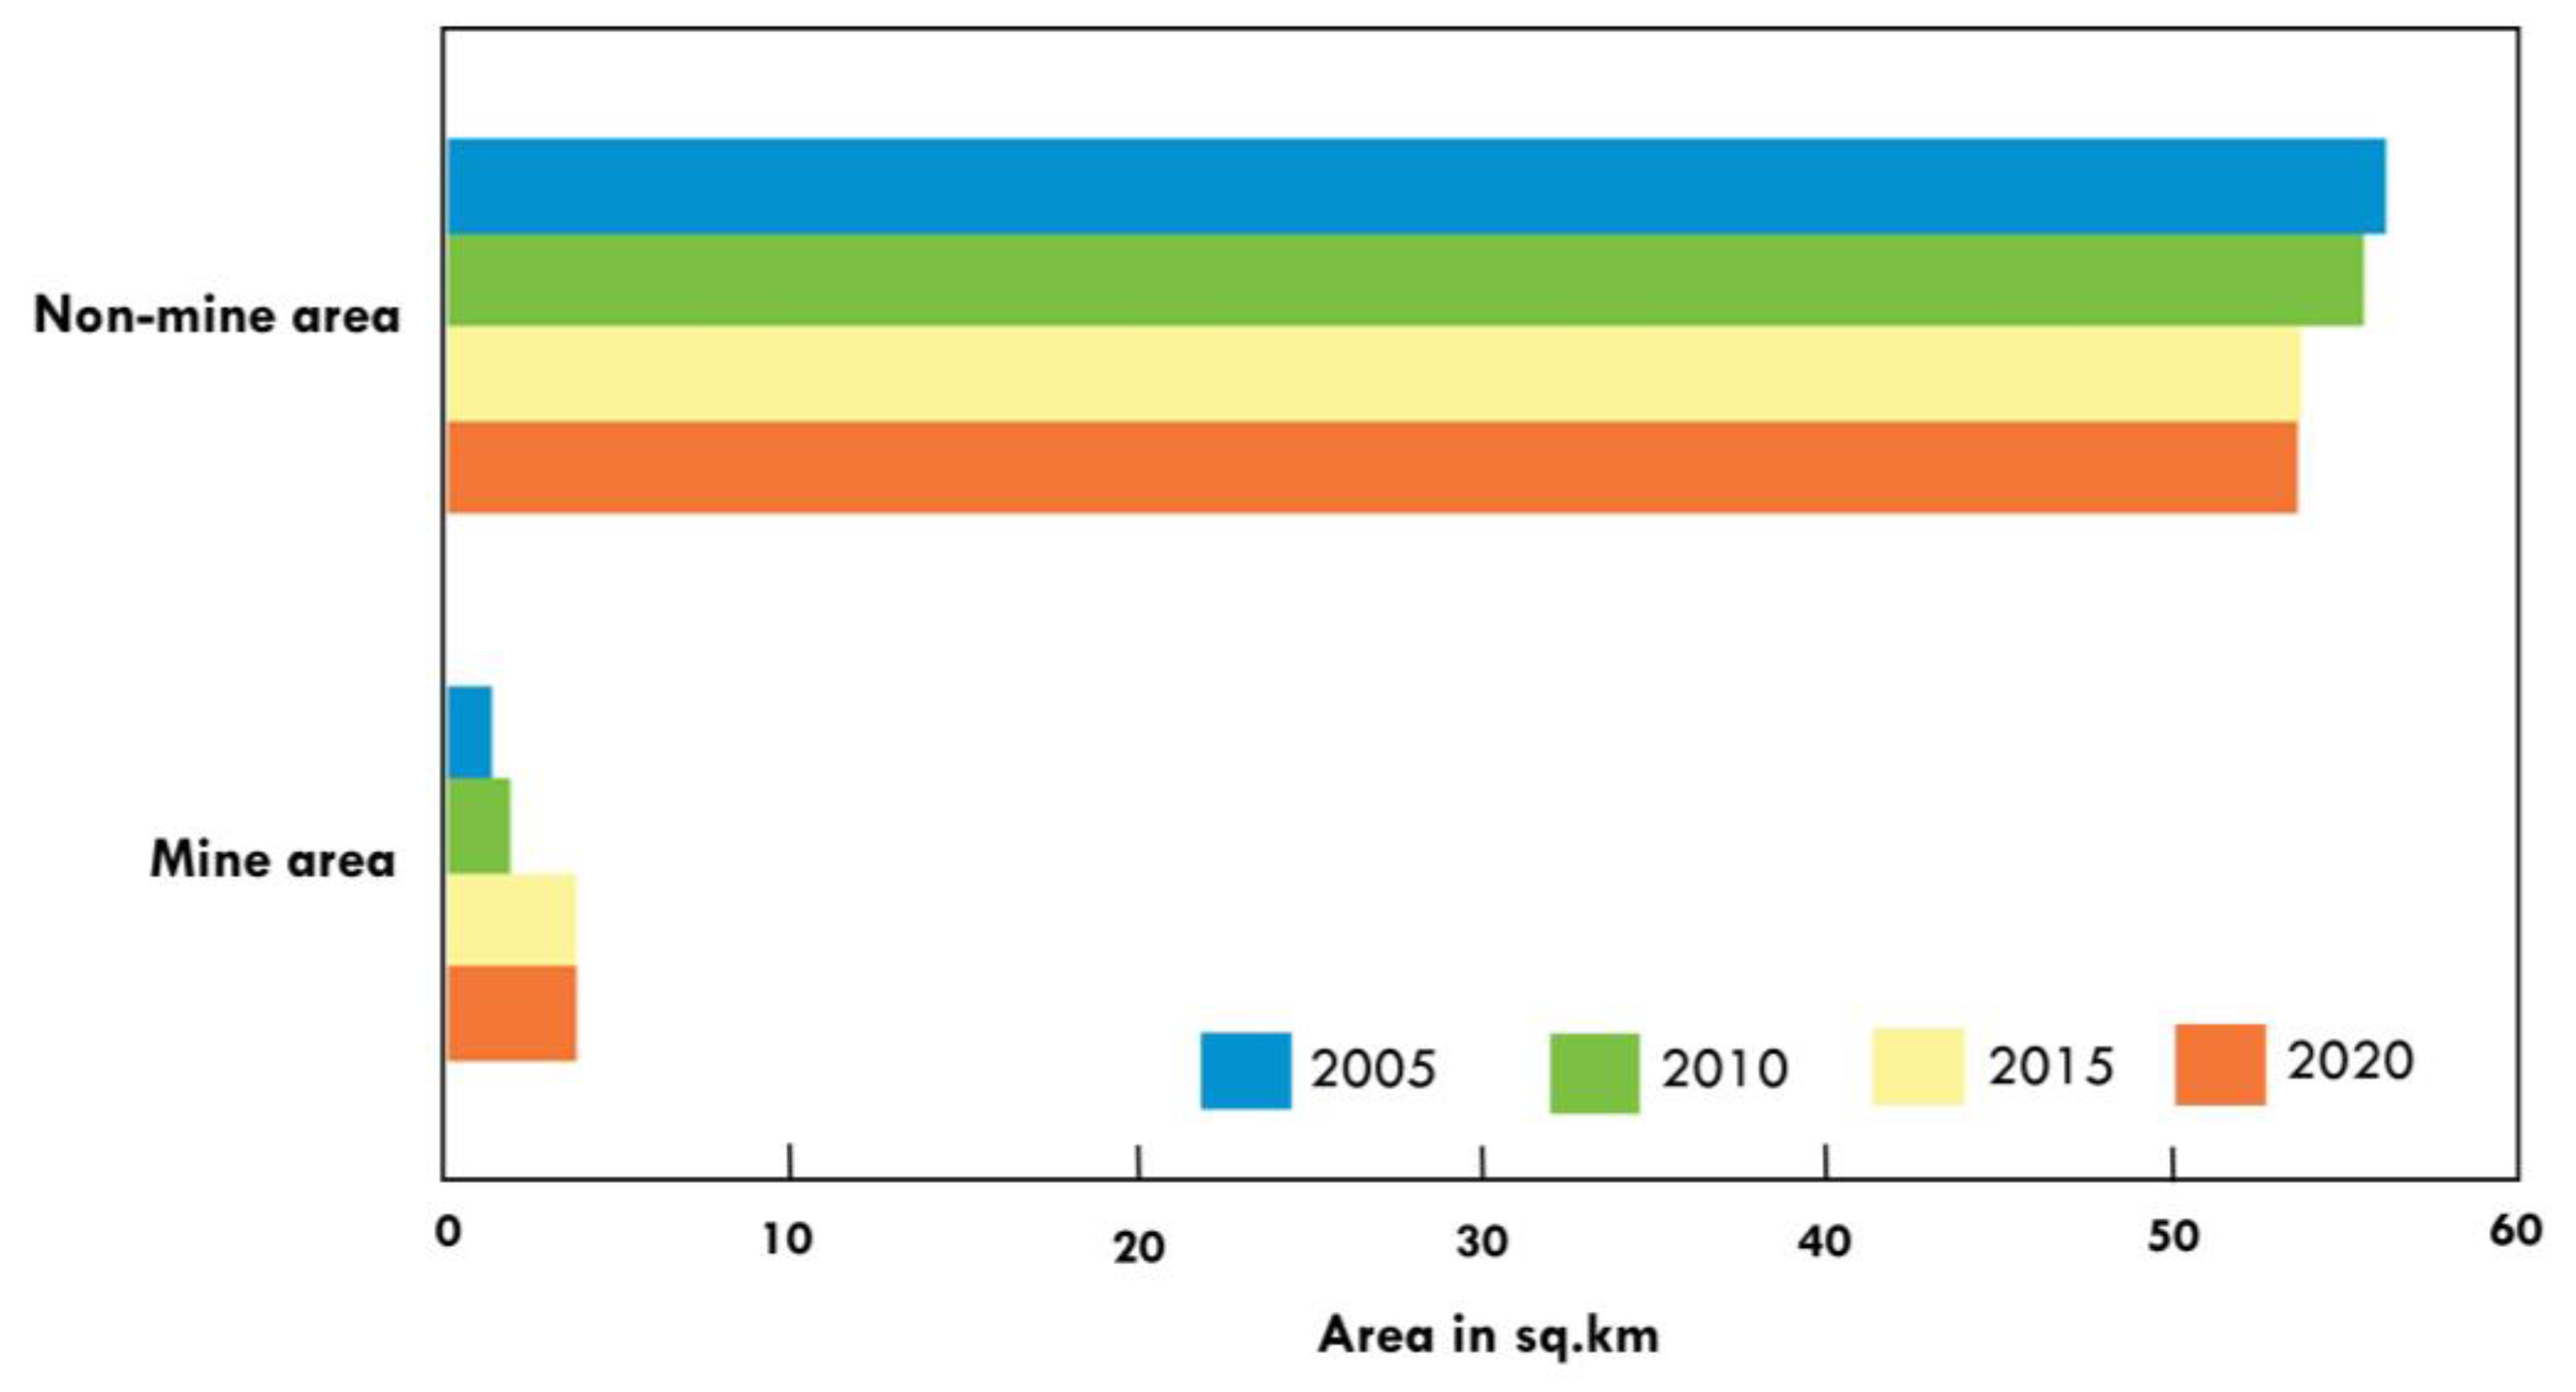
3.1. Analysis of Landcover Distribution and Dynamics

The analysis of landcover distribution and expansion over the study area was based on the classified images of the 2005, 2010, 2015, and 2020 RF model classification outputs.
We revealed continued increases in mine areas over the years from 2005 to 2020. The mine area increased from 1.22 km2 in 2005 to 3.78 km2 in 2020. The RF model classifier in GEE detected the development of REEs excavations in the open pits and excavated areas shown in red in Figure 6. For instance, the mine area depicted in red patches on the peripherals of the two mine boundaries, mine A and mine B, could be related to possible small-scale mining excavations. The mine areas in the study area show no trace of environmental reclamation or remediation activities. Figure 7 shows that the non-mine area, which is predominantly composed of bare land and dense, thick vegetation, decreased from 56.54 km2 to 53.98 km2 over the study period.
Accuracy assessments for the 2005, 2010, 2015, and 2020 images indicated an average overall accuracy of 98% and a Kappa Coefficient of 0.98. This is a good accuracy result based on [85], since the overall accuracies for all classifications were above 85%. The pixel-based landcover classification is appropriate in mining landscapes where the morphology of many mine-related structures is complex and varied, which is a challenge for object detection models. In mining sites, the texture and emissivity of the surfaces are sufficiently distinct, and with a simple classification scheme, as in our case (binary or few-class), there are more risks to the accuracy of object-based analysis than pixel-level analysis.

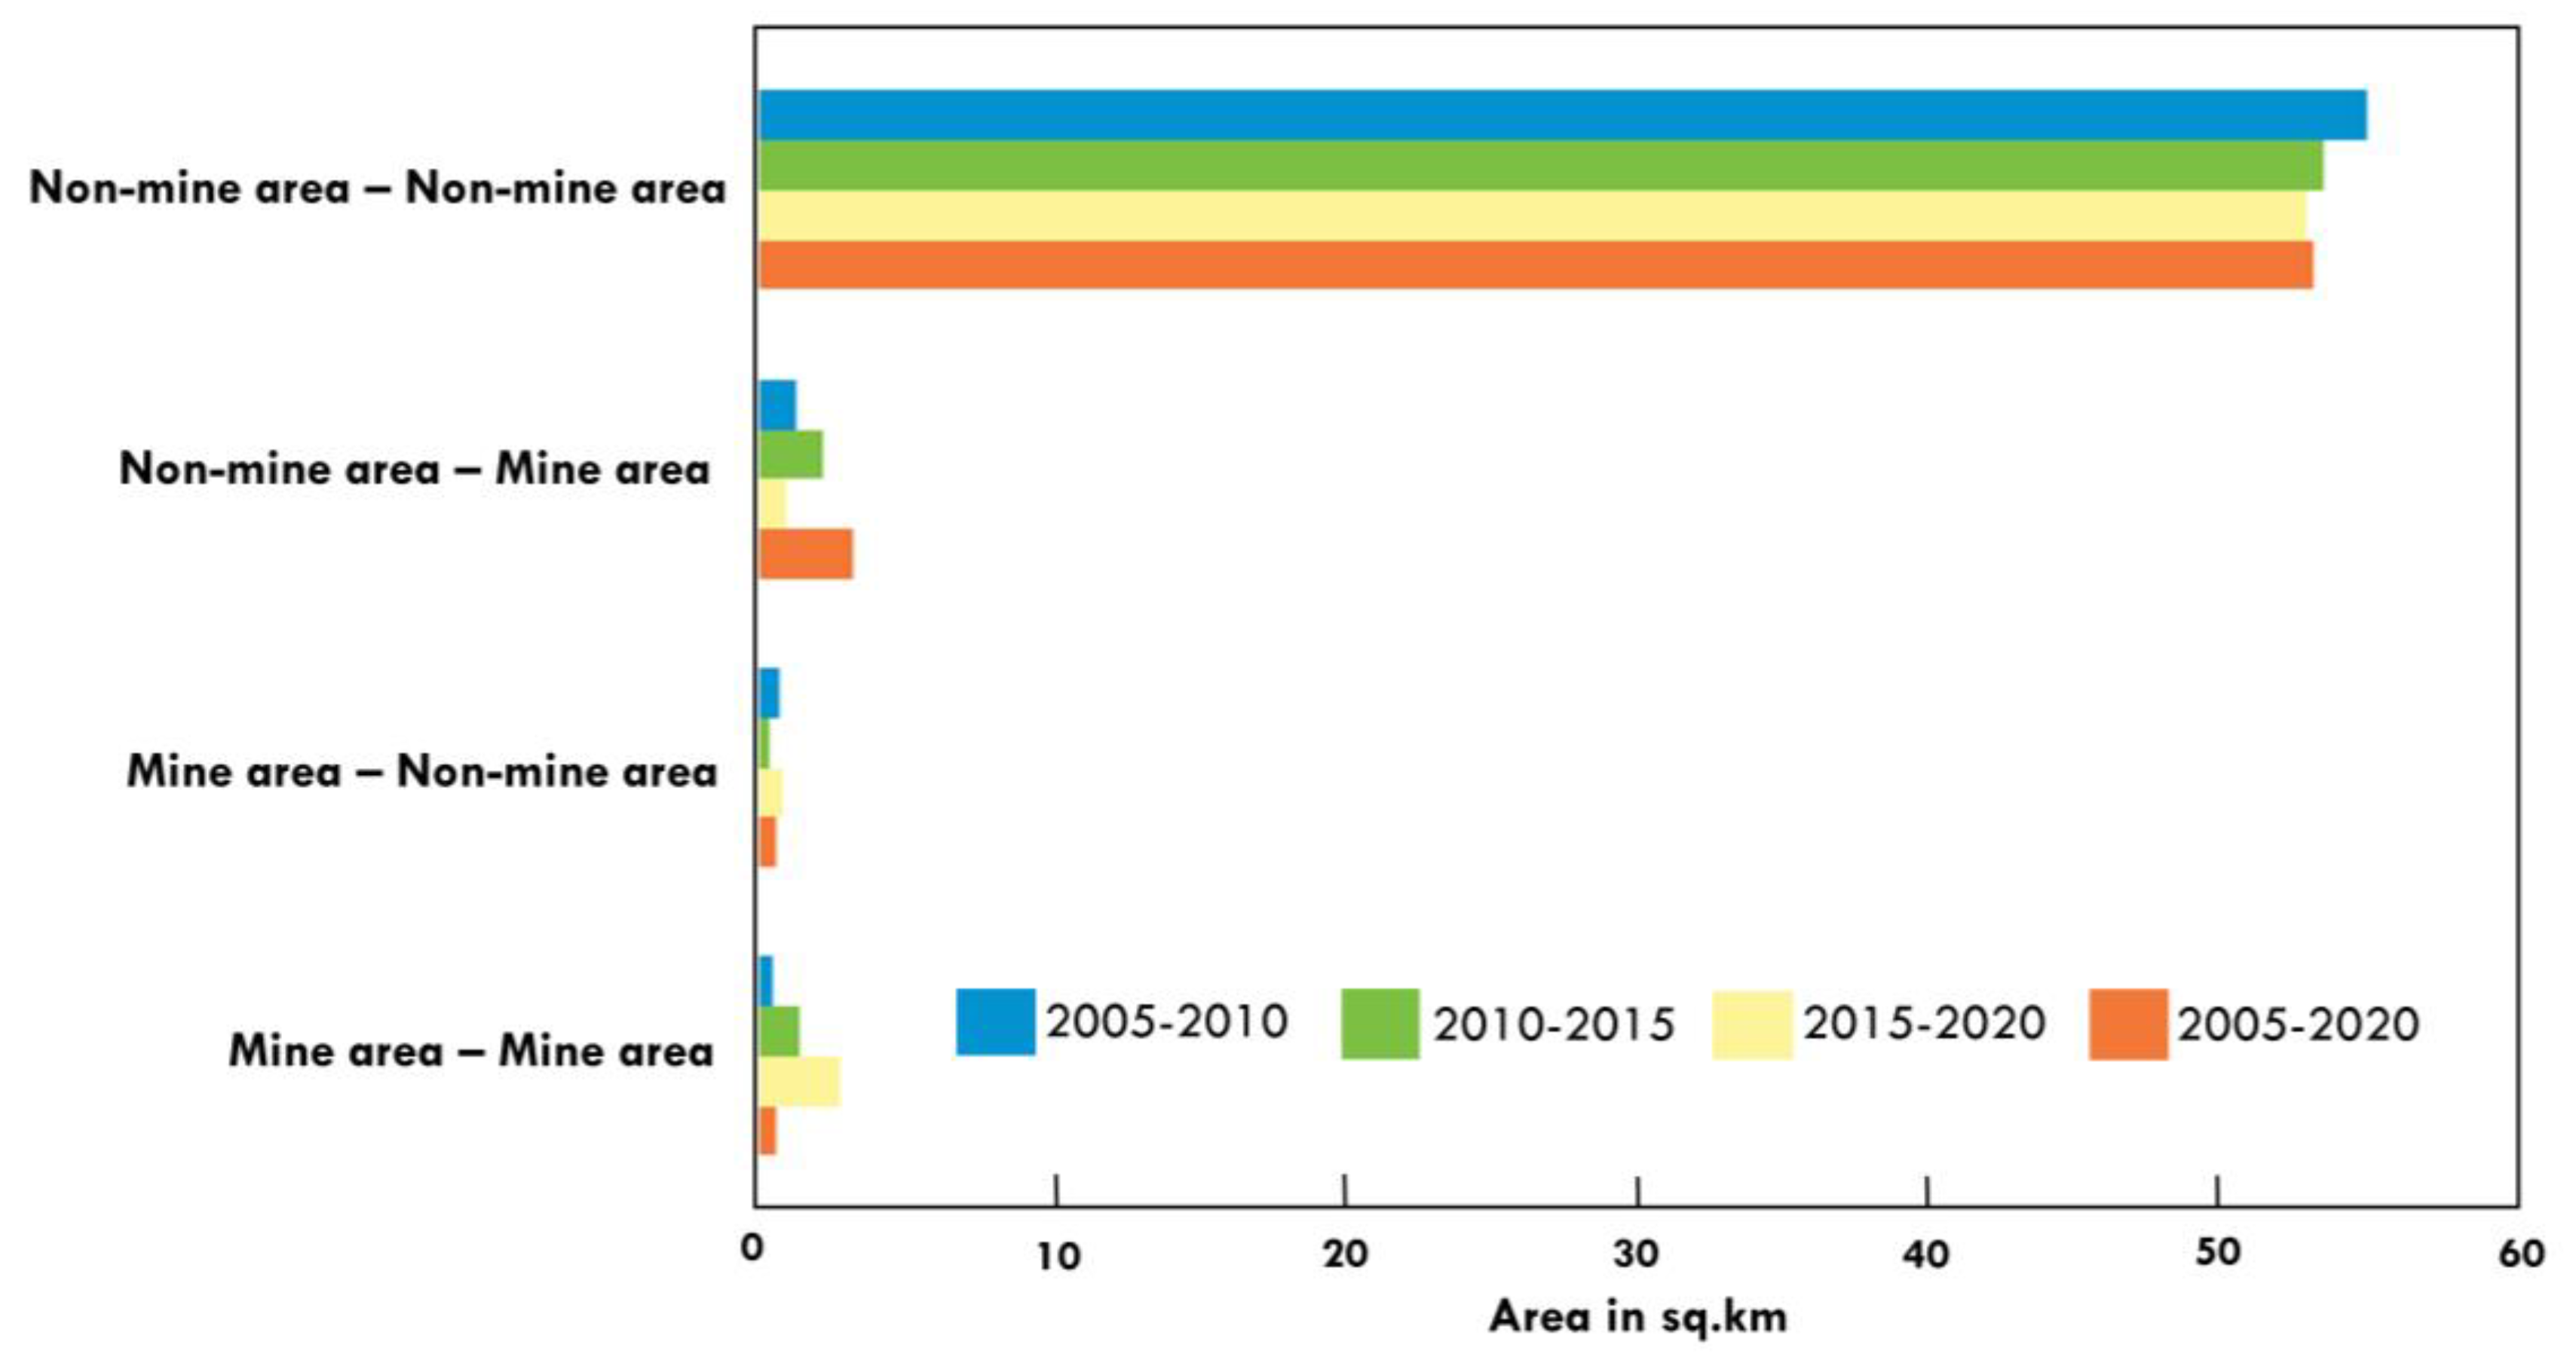
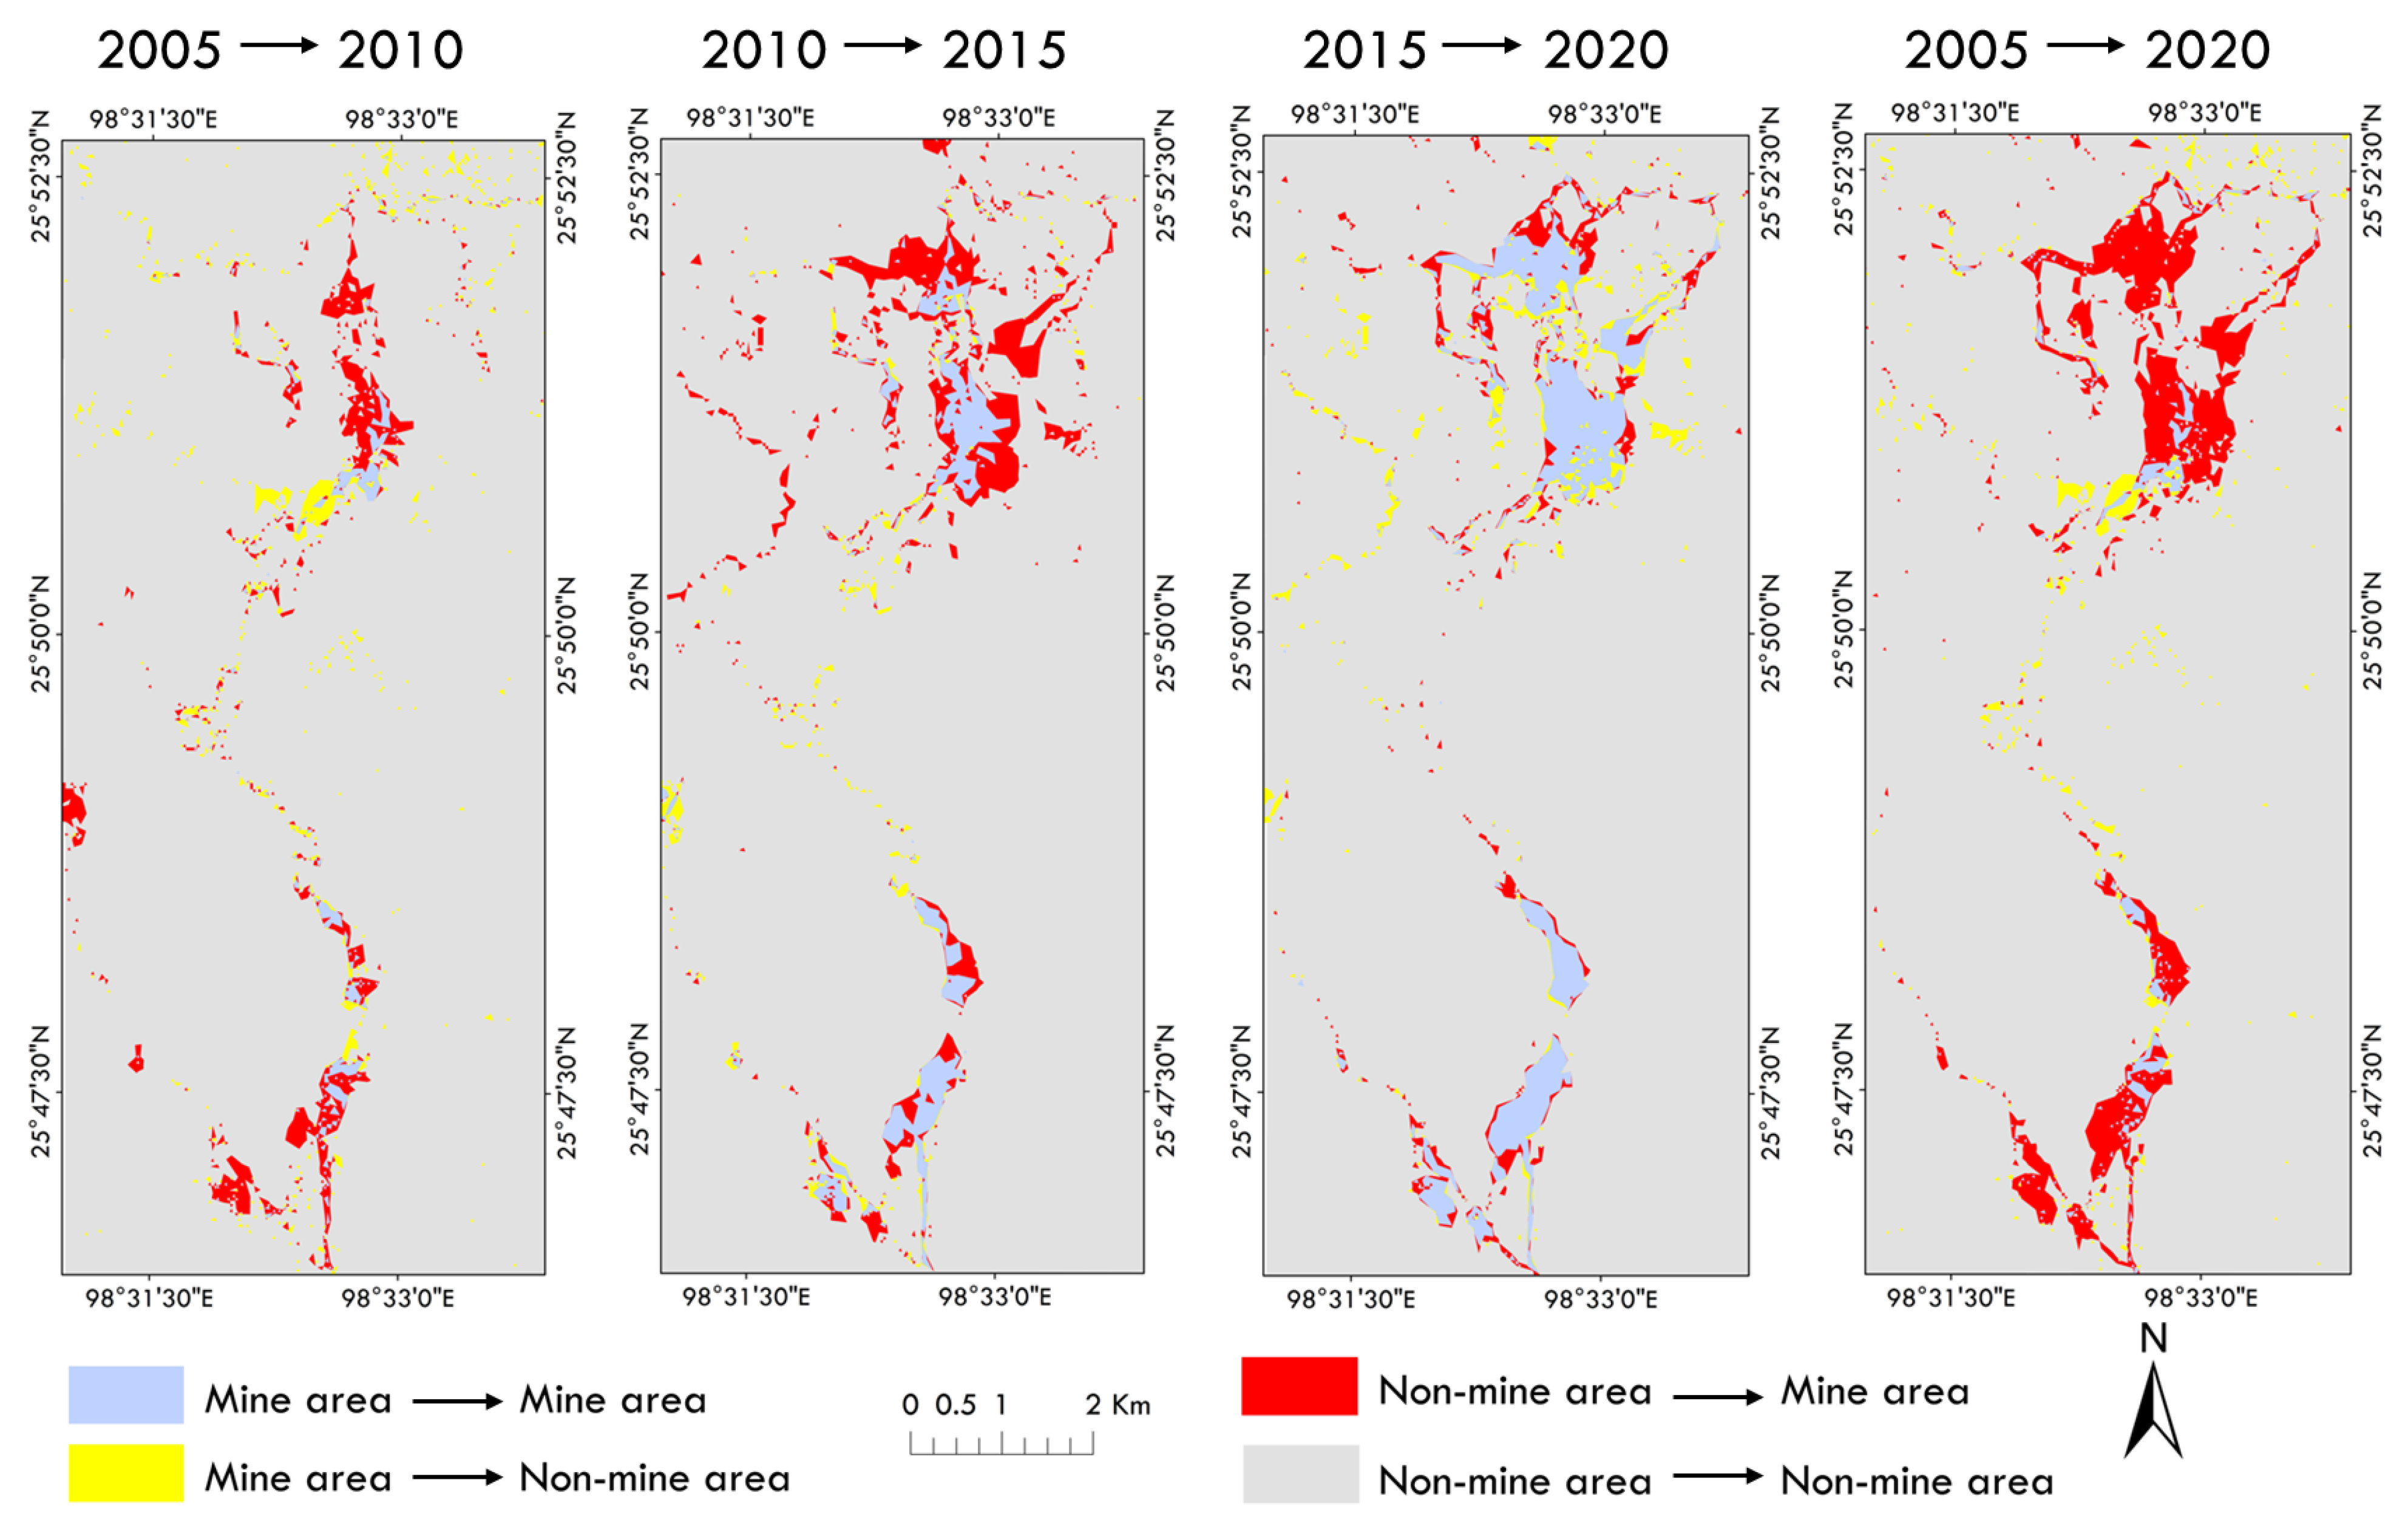
3.2. Change Detection Trajectories

The post-classification and categorization comparison change detection analysis results show that both the mine areas and non-mine areas have rapidly changed over the study area. The change analysis between 2005 and 2010 shows that the non-mine area has changed to mine area by 1.4 km2, and, from 2010 to 2015, a non-mine area cover of about 2.2 km2 was converted to mine area. Further, a total of 1.0 km2 of non-mine area cover was converted to mine area between 2015 and 2020. This is indicative of active mining operations taking place in the area (Figure 8). However, the changes from mine area to non-mine area are minimal in comparison to the changes from non-mine area to mine area as depicted in Figure 9. Throughout the period between 2005 and 2020 (Table 5), only 0.64 km2 of mine area was converted to non-mine area. This could be attributed to abandoned small-scale excavations and is not related to mine area reclamation. Meanwhile, a non-mine area amounting to 3.2 km2 was converted to mine area within the same period.

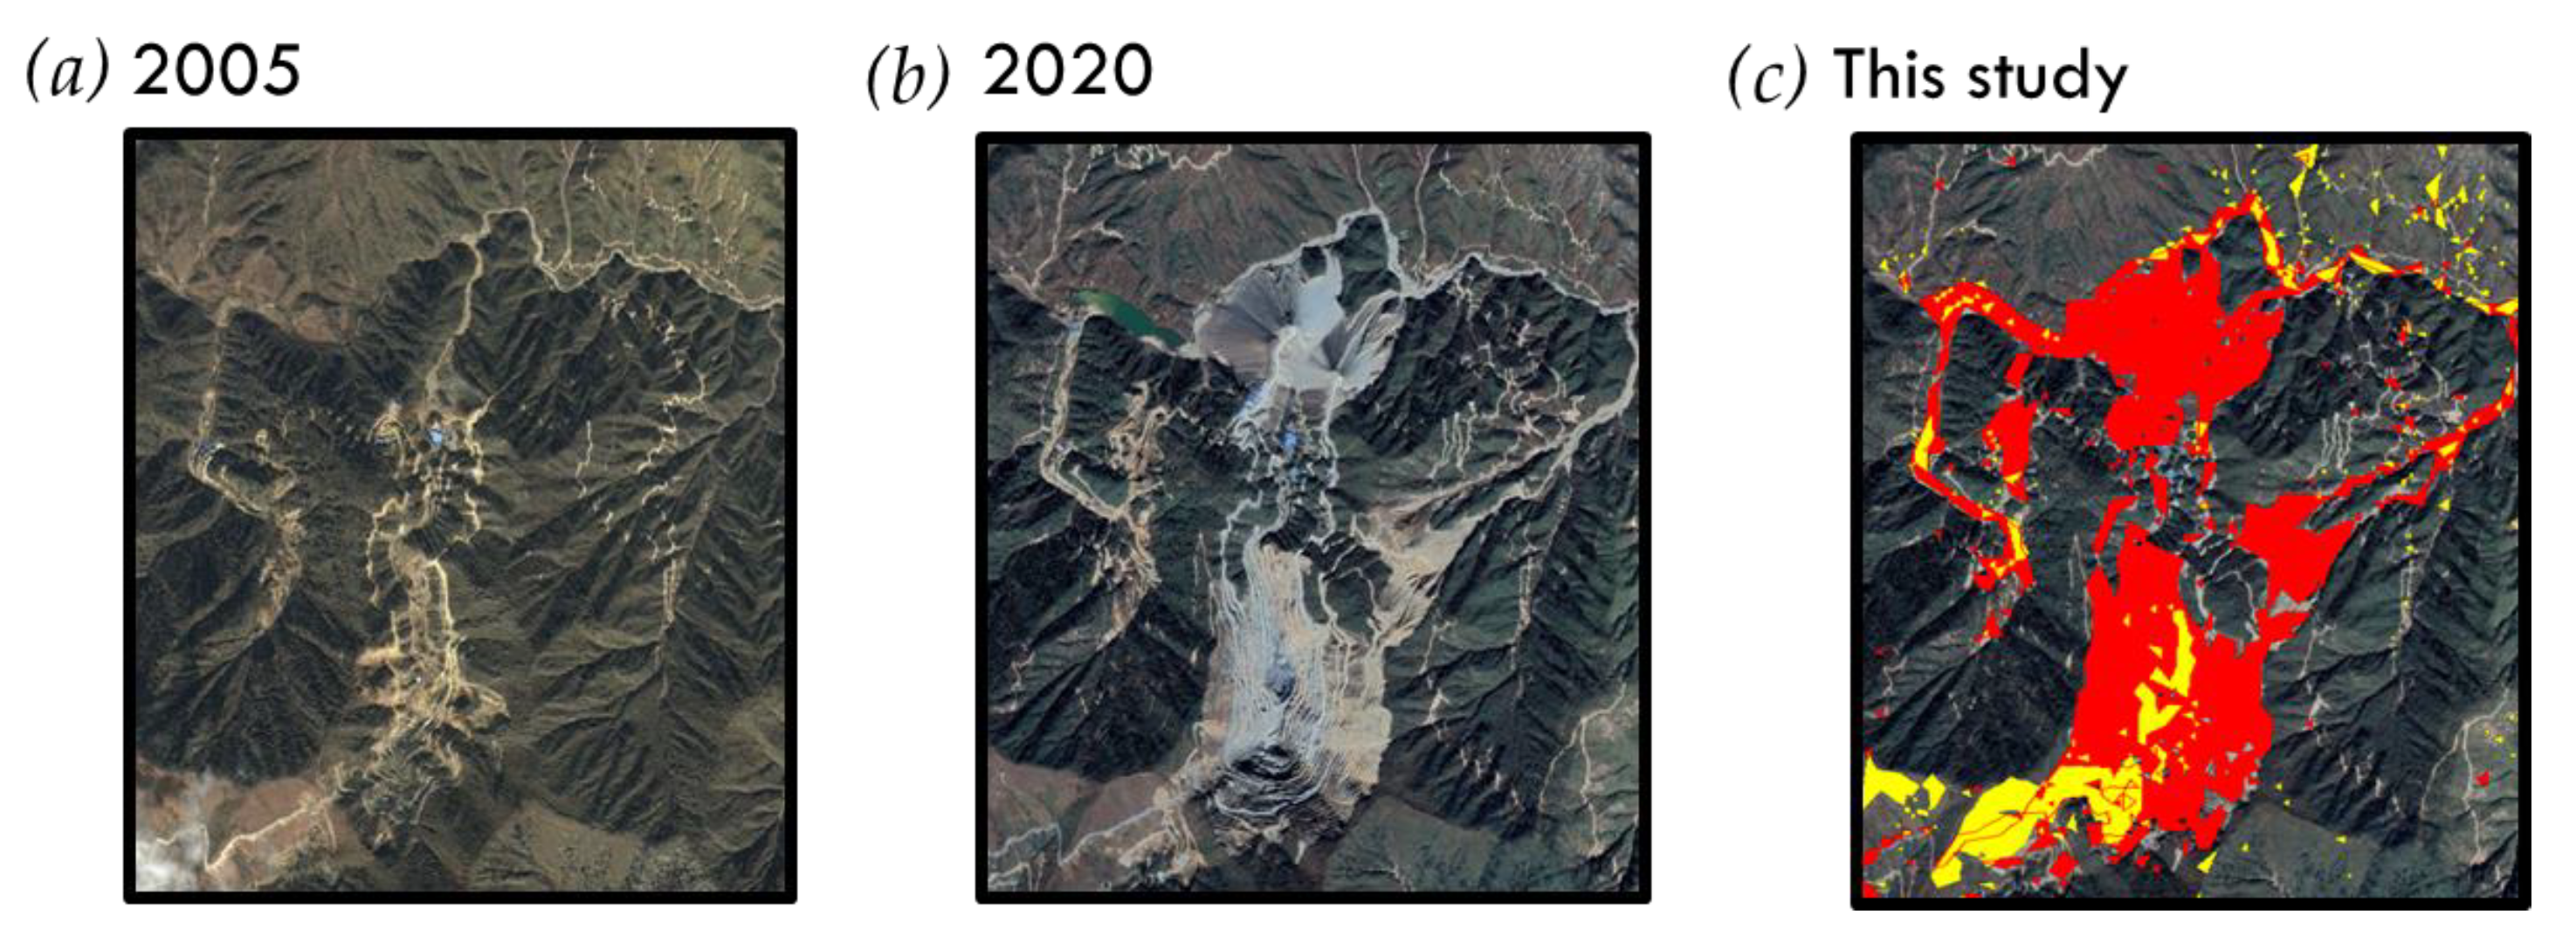
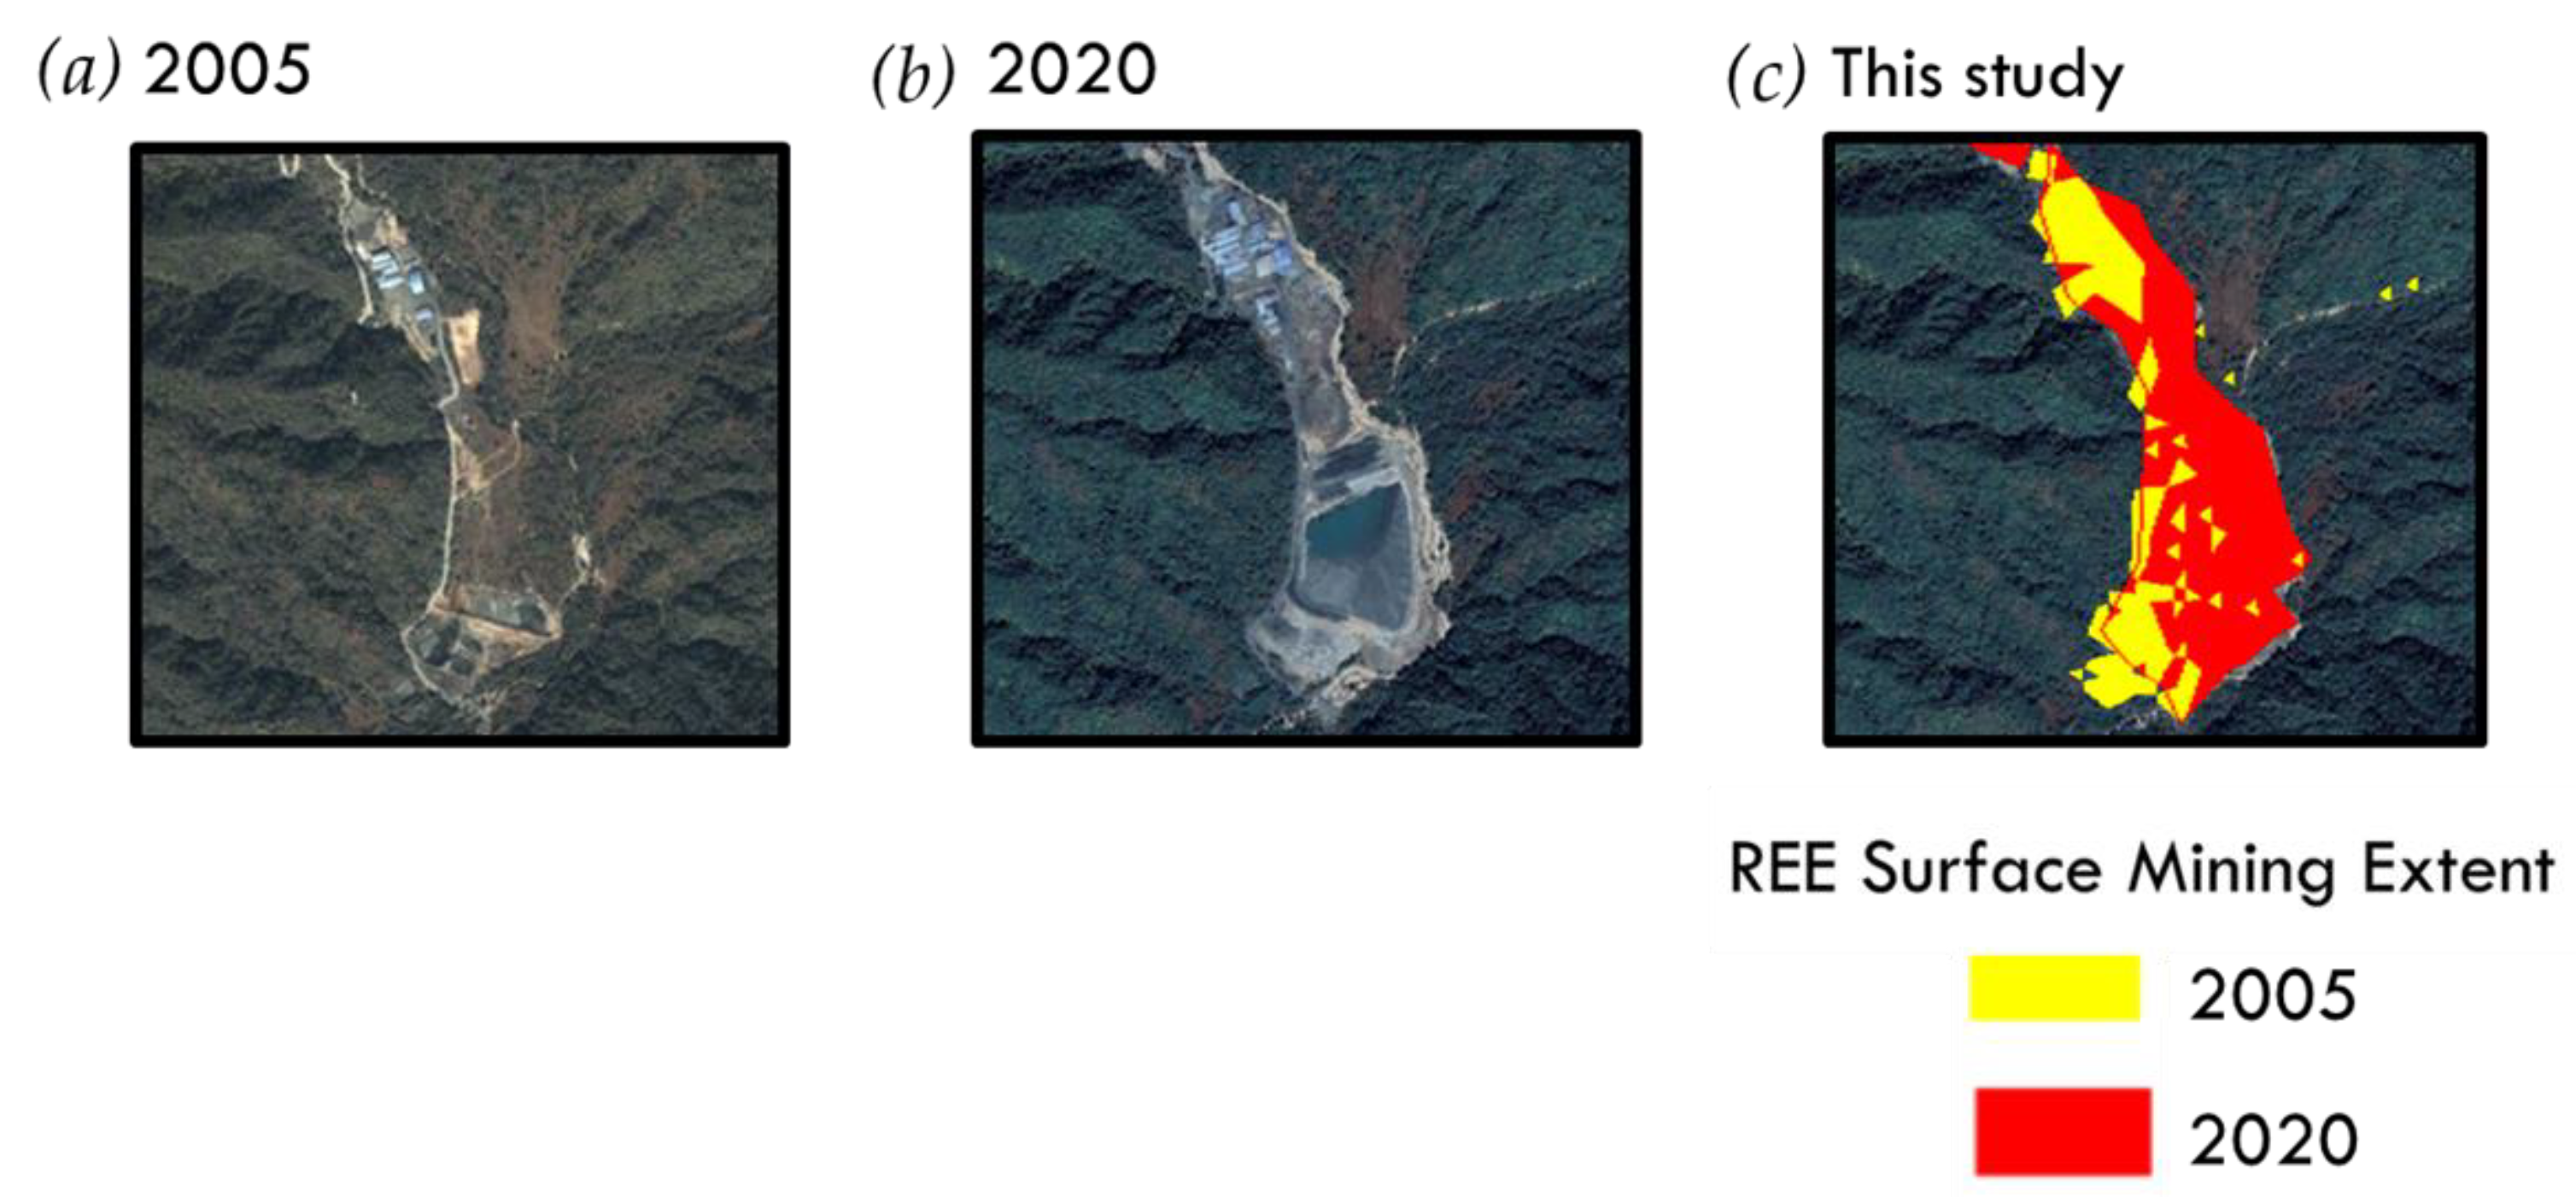
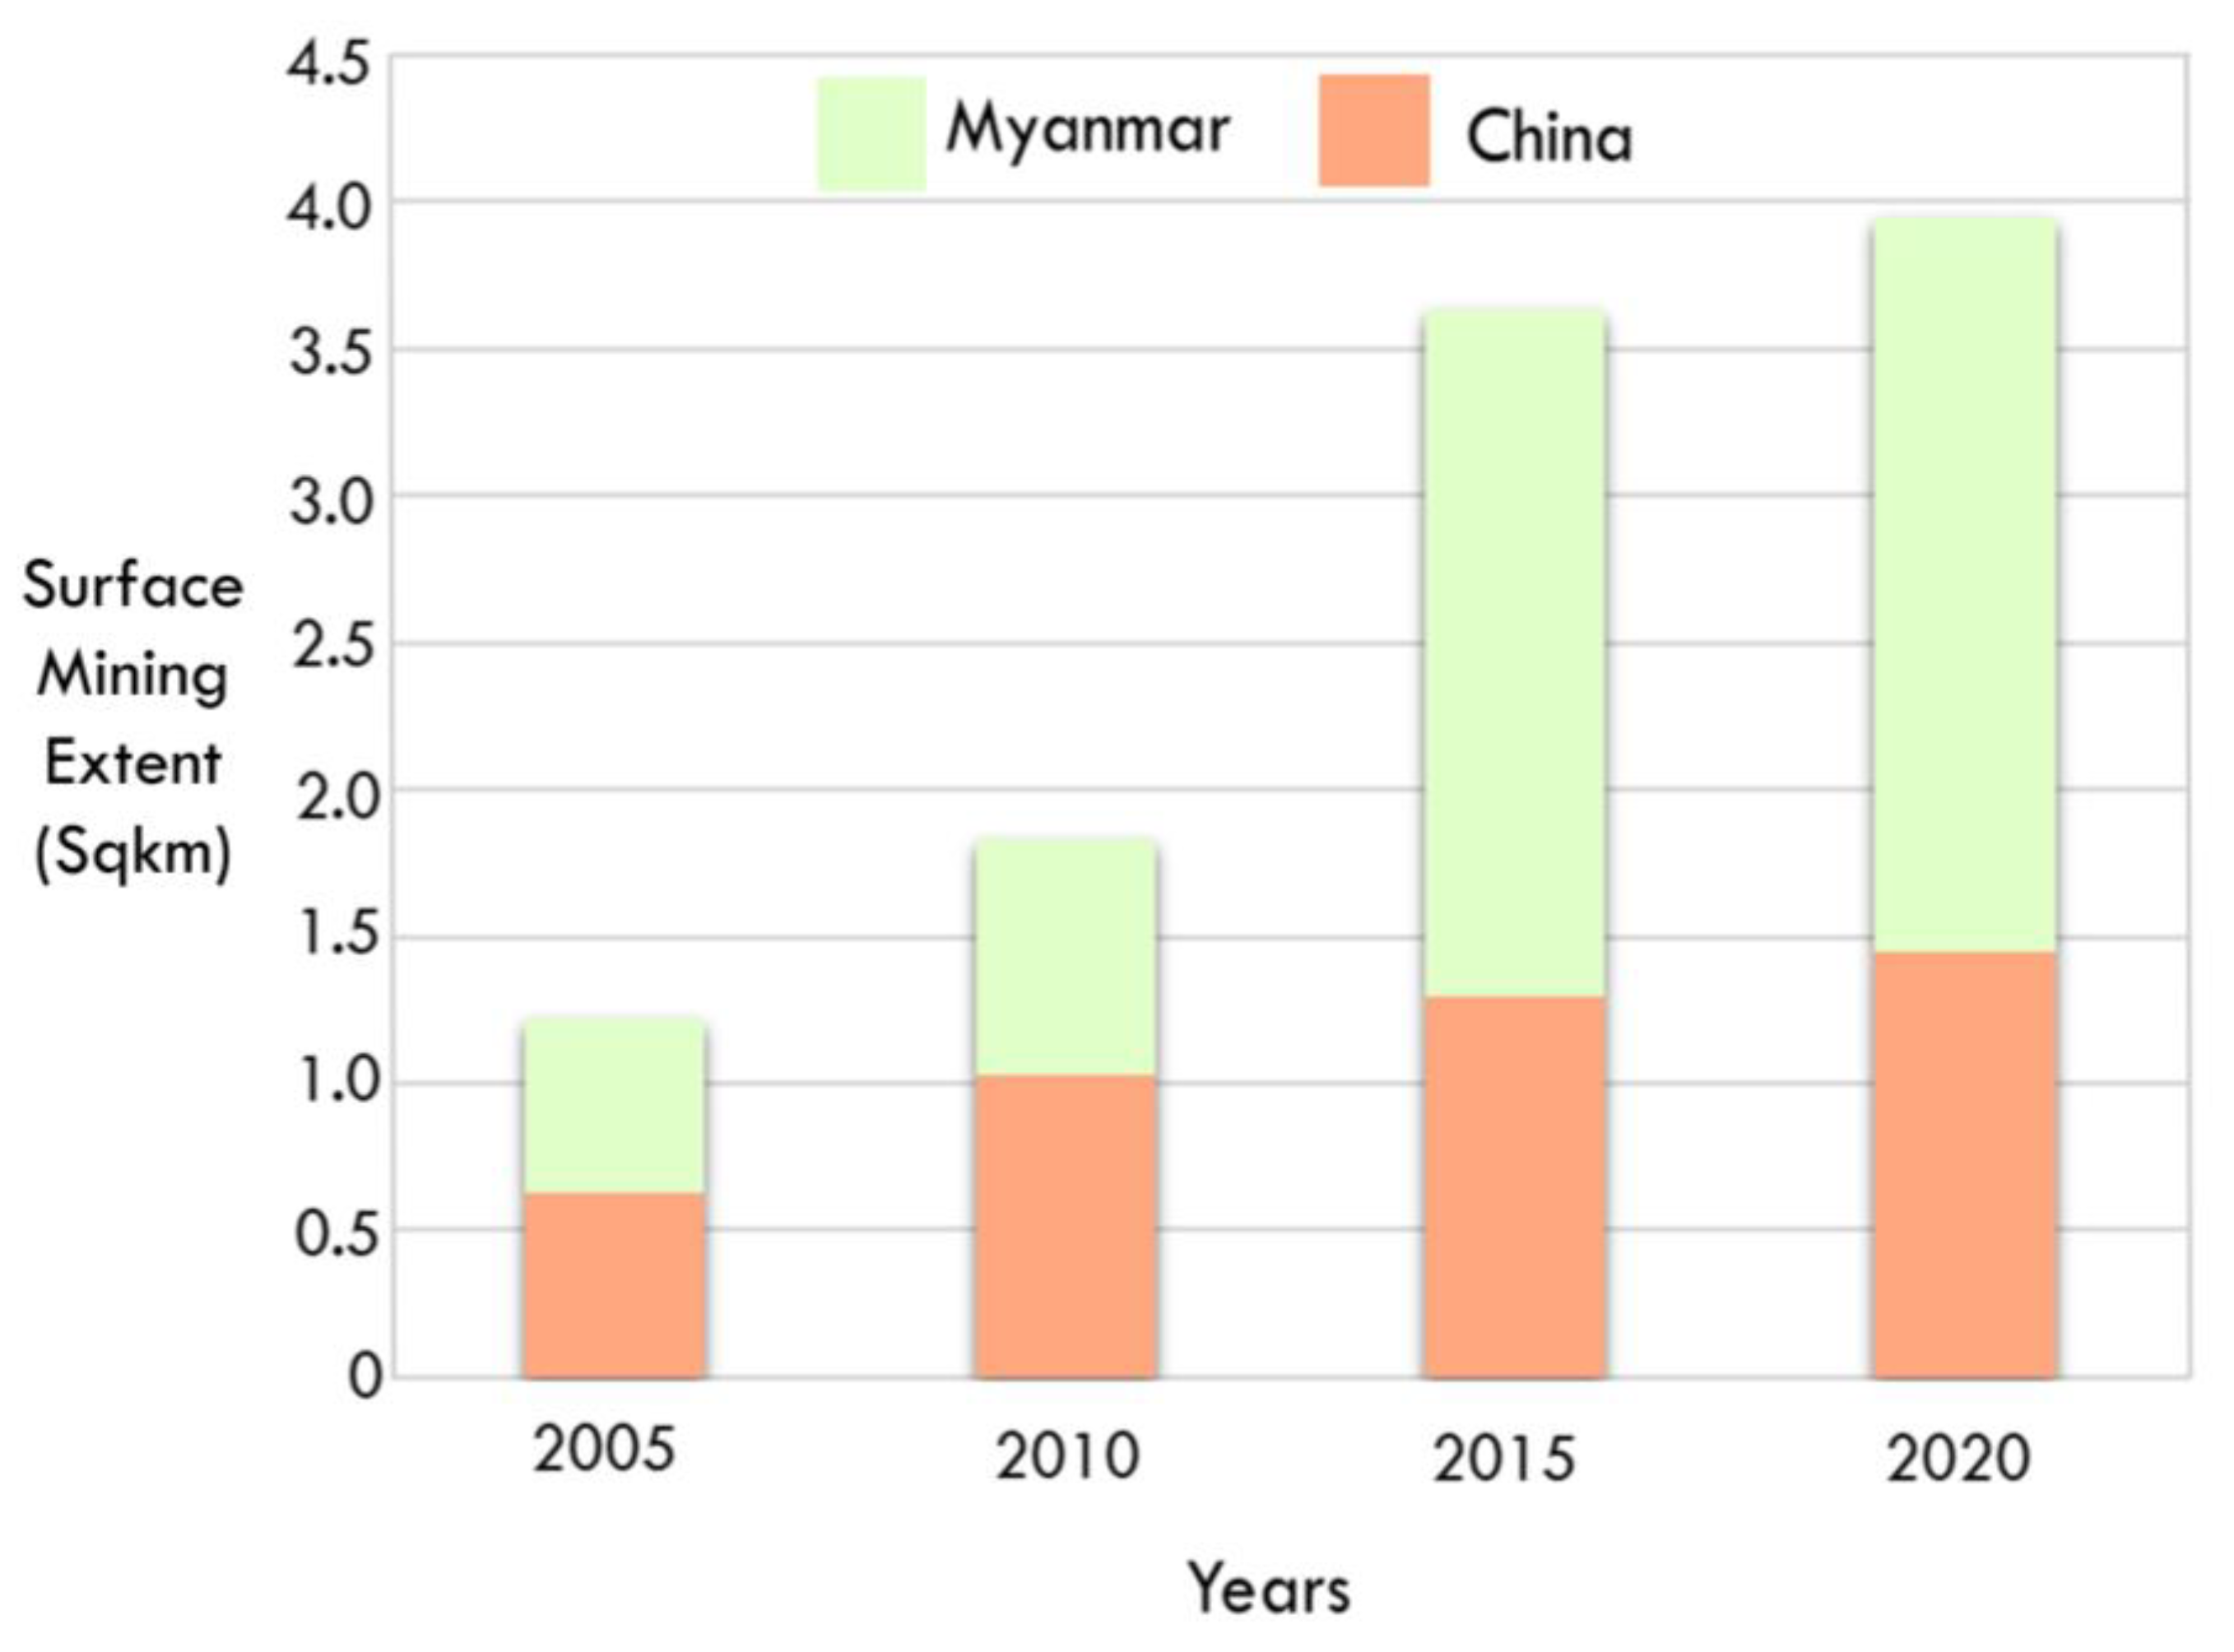
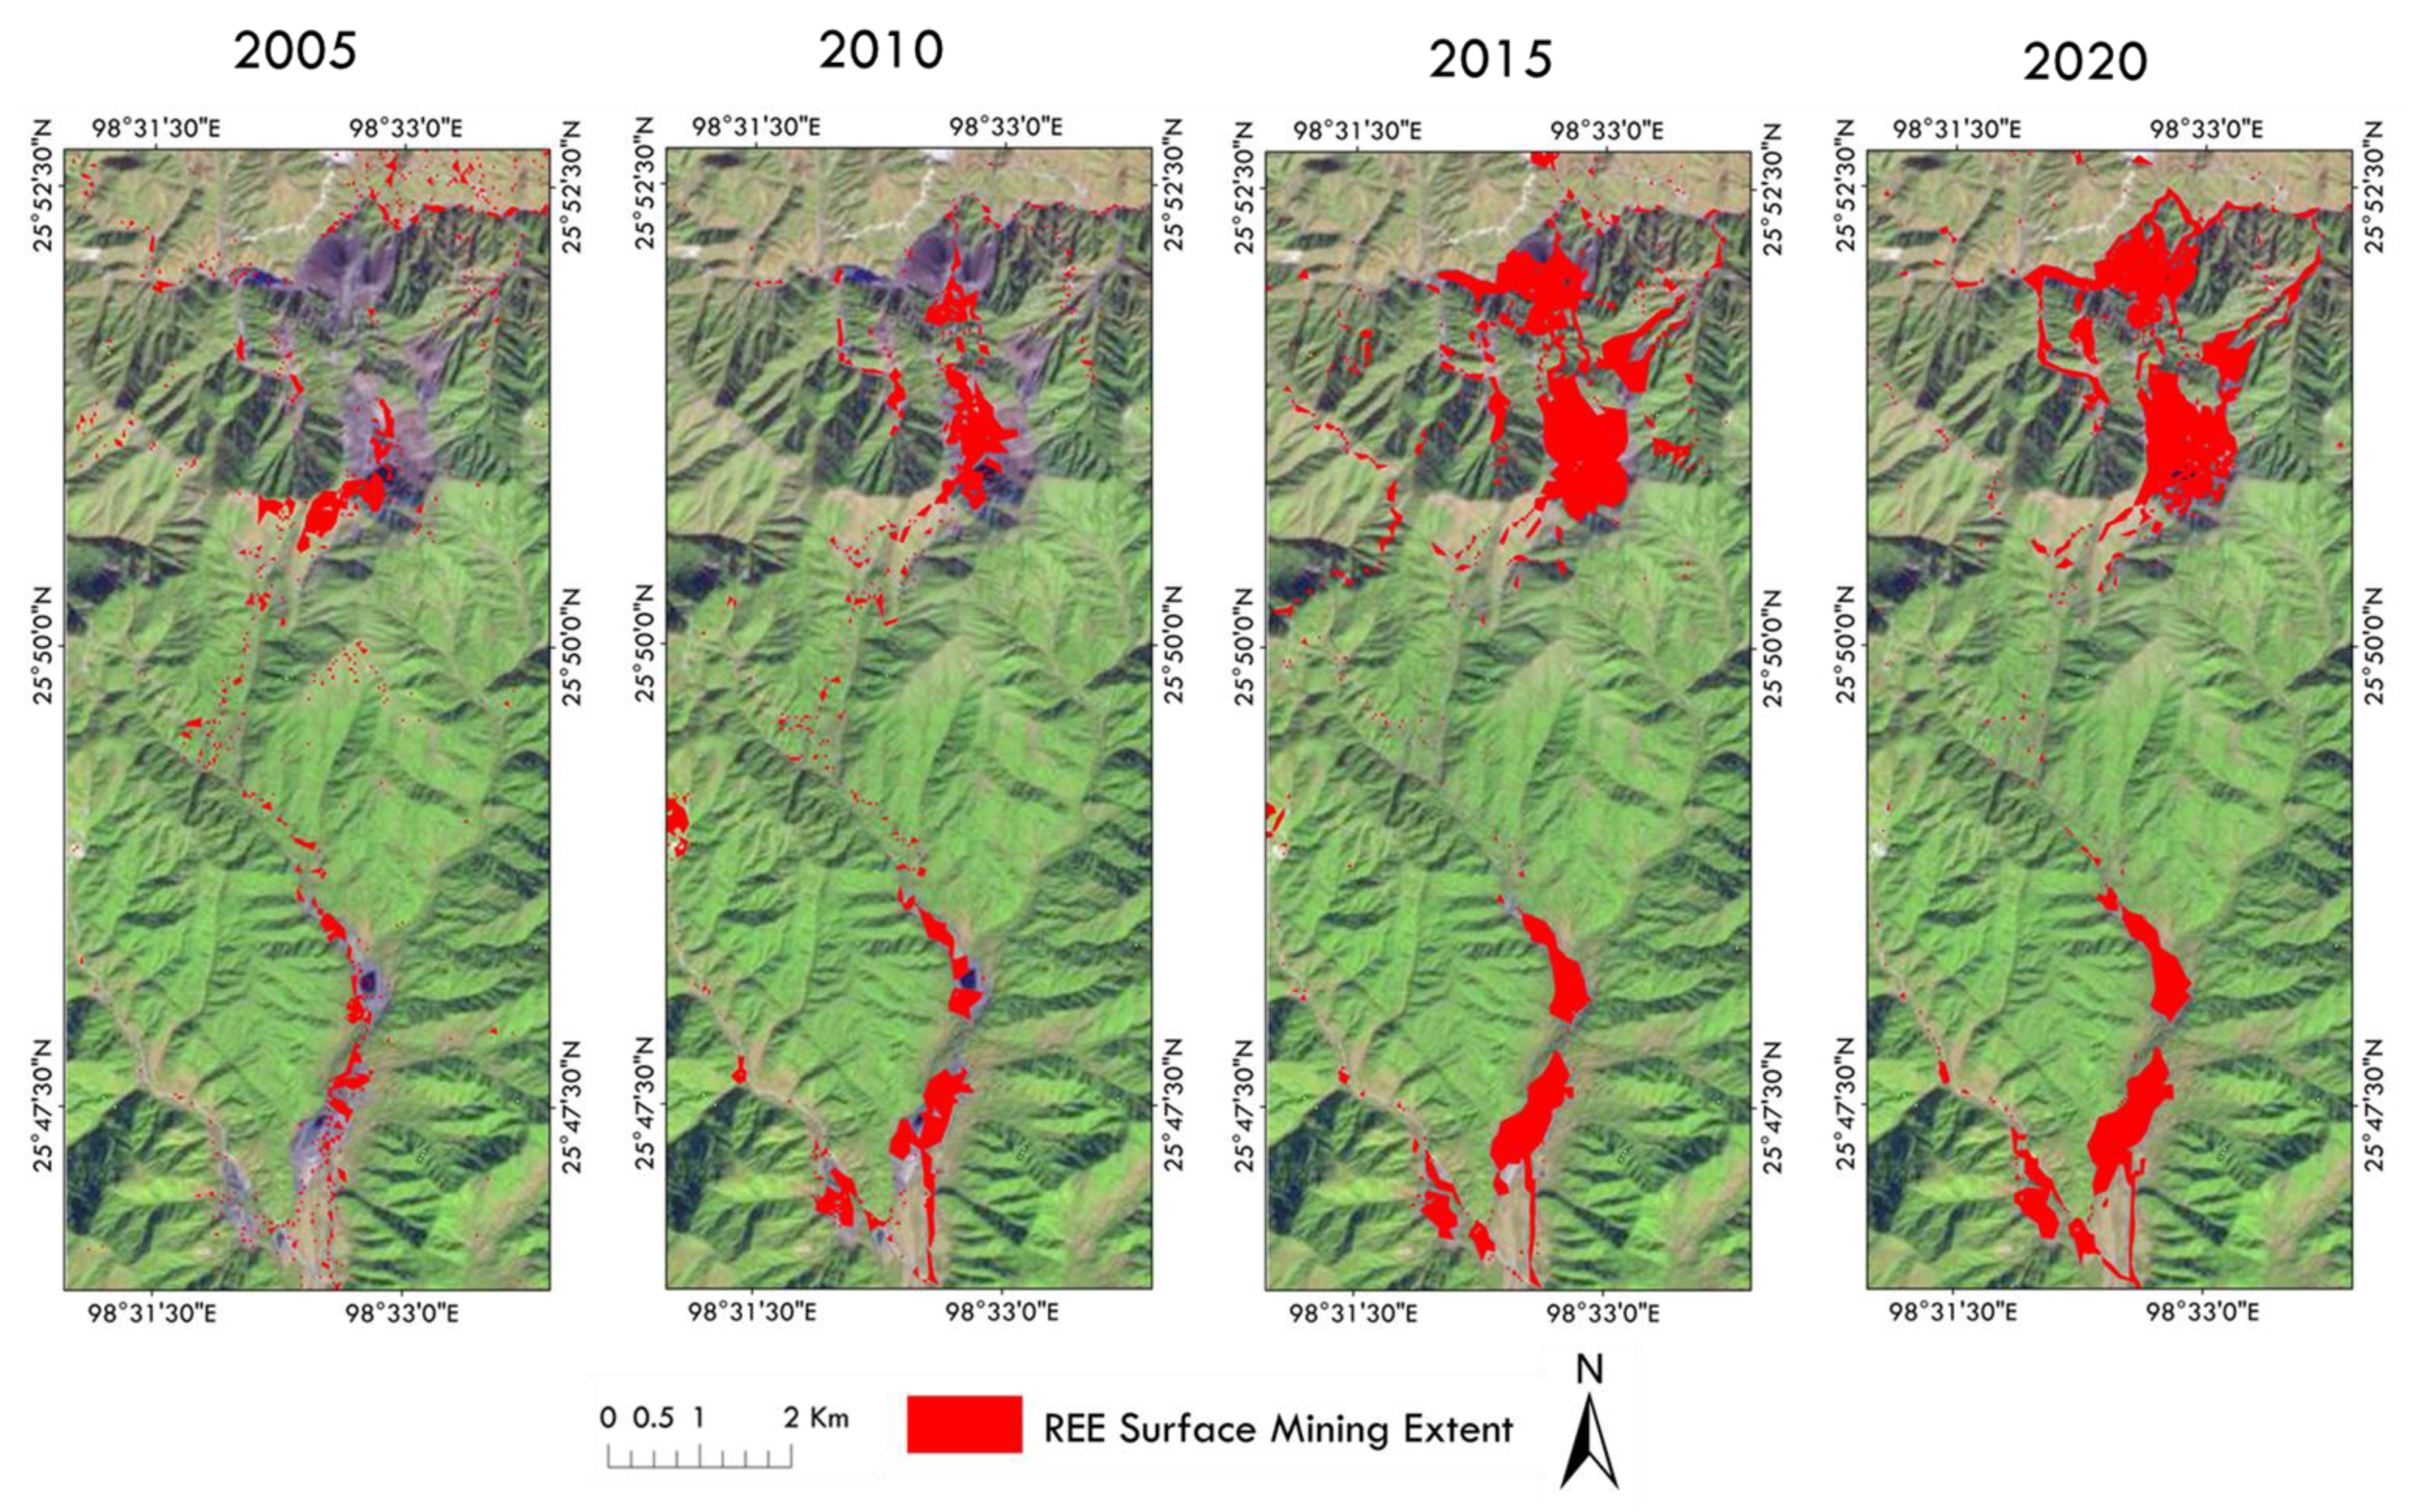
3.3. Surface Mining Extent Changes

Rapid growth in the use of energy-critical minerals, including rare earth elements, is raising concerns about supply chain security, the quality of life of the impacted communities, and the need to prevent irreversible damage to the environment [86,87]. Increased mining extents, which usually infer an increase in mining operations, are an indication of the presence of potential environmental and social impacts at the mining sites. Surface mining extent is considered to cover all areas of the mining site operations, including the stock piles, mining dam tailings, mining paths, open-pit rocks, and mining operation buildings [88]. In this study, the concept of mine area has been defined in this holistic manner. Figure 10 shows the expansion of the REEs mining footprint from 2005 to 2020.

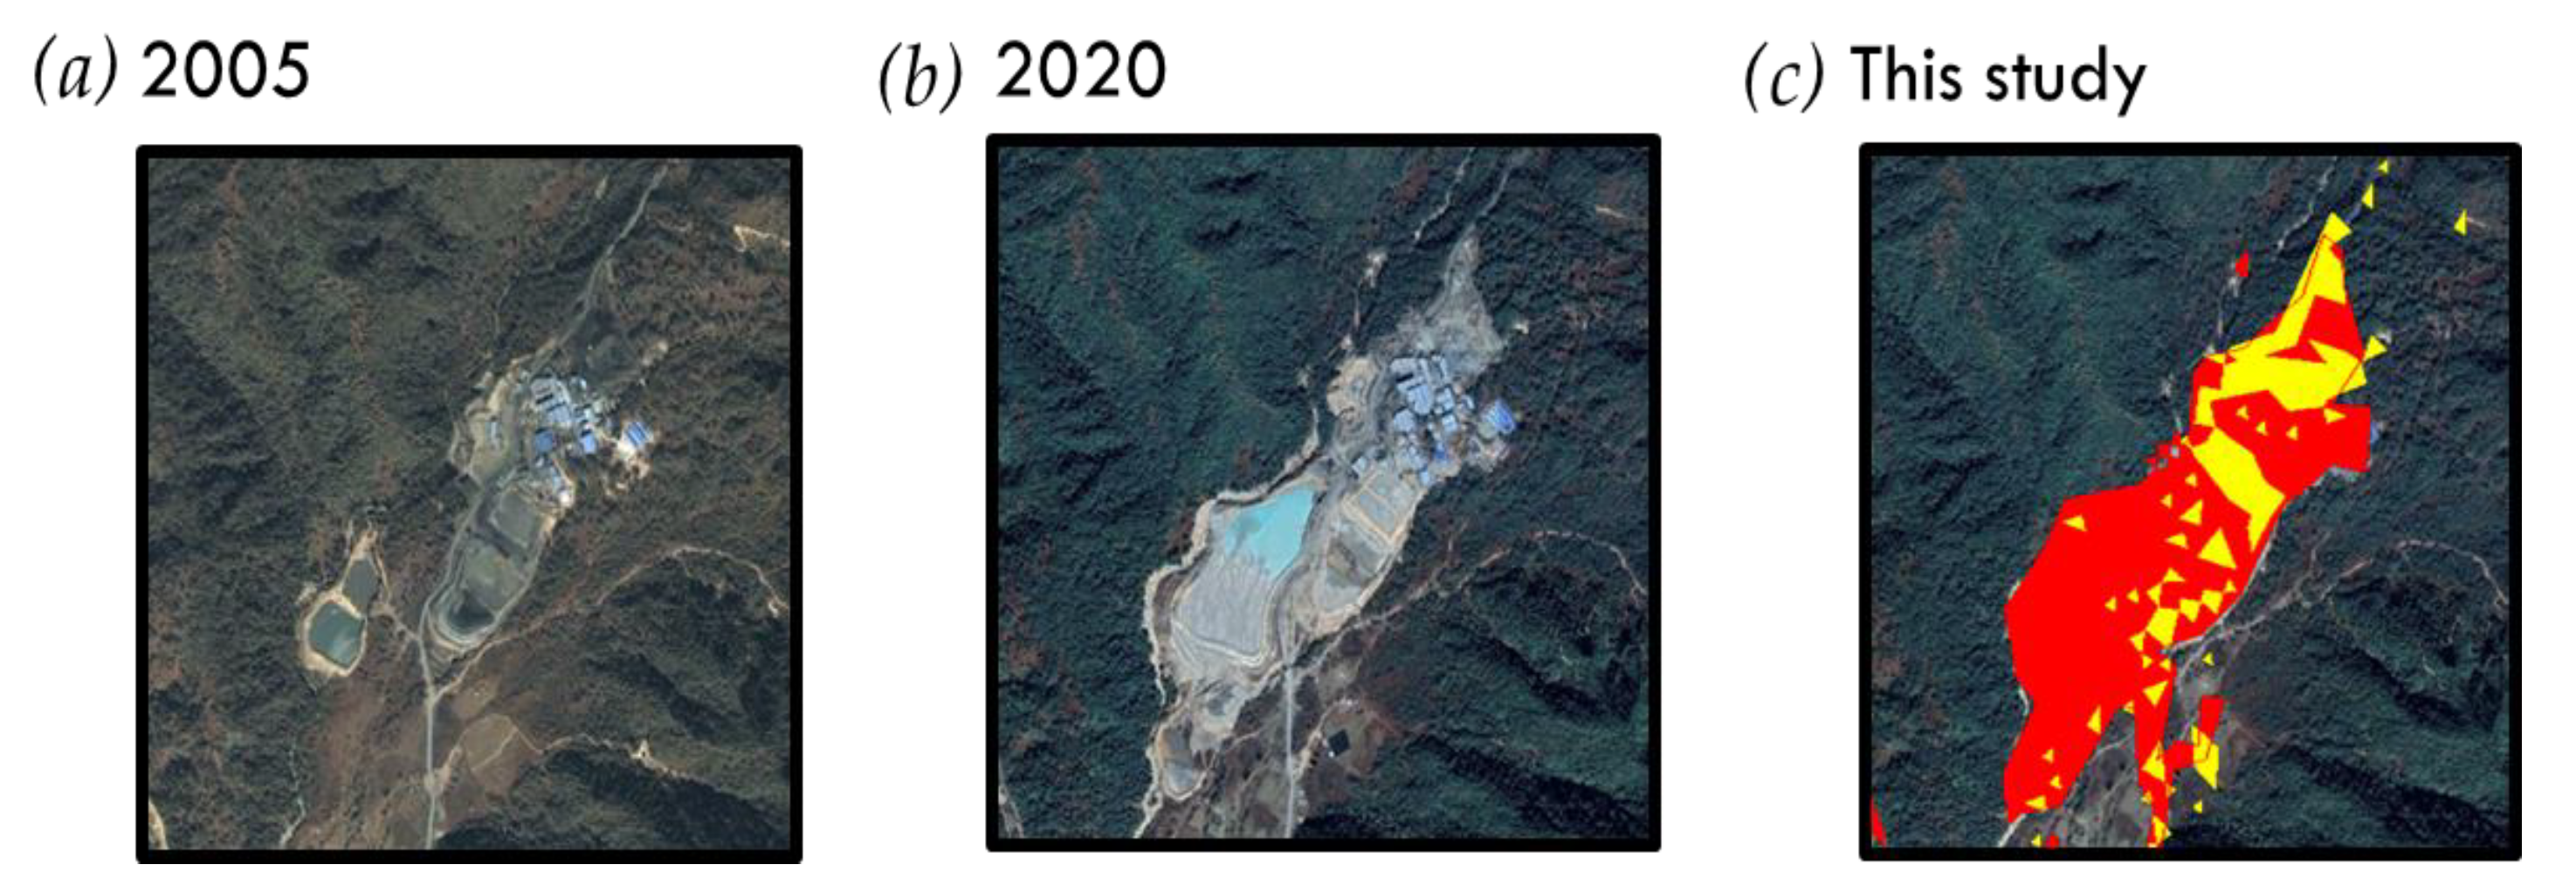
Comparison of the Results from Mining Sites with High-Resolution Google Earth Images

In order to validate the automated mapping extent of this study in mining areas, we compared the mining extent changes using high-resolution Google Earth images for the specific years (2005 and 2020) with the results from this study. Mine site A was compared in terms of the development of its mining extent from 2005 (Figure 11a, Google Earth image), which is consistent with the yellow patches in Figure 11c (which indicate the mining extent mapped from this study). The same was performed for 2020 on Google Earth images (Figure 11b), and it also matched with the results mapped from this study (red patches on Figure 11c). This analysis shows a multi-temporal increase in mining extents.
Mine site B expansion extents have been illustrated in Figure 12 and Figure 13. These images show the expansion of the mining site from Google Earth images for 2005 (Figure 12a and Figure 13a) and 2020 (Figure 12b and Figure 13b). The results from this study showing the spatial expansion of the mining extent are depicted in Figure 12c and Figure 13c.

4. Discussion

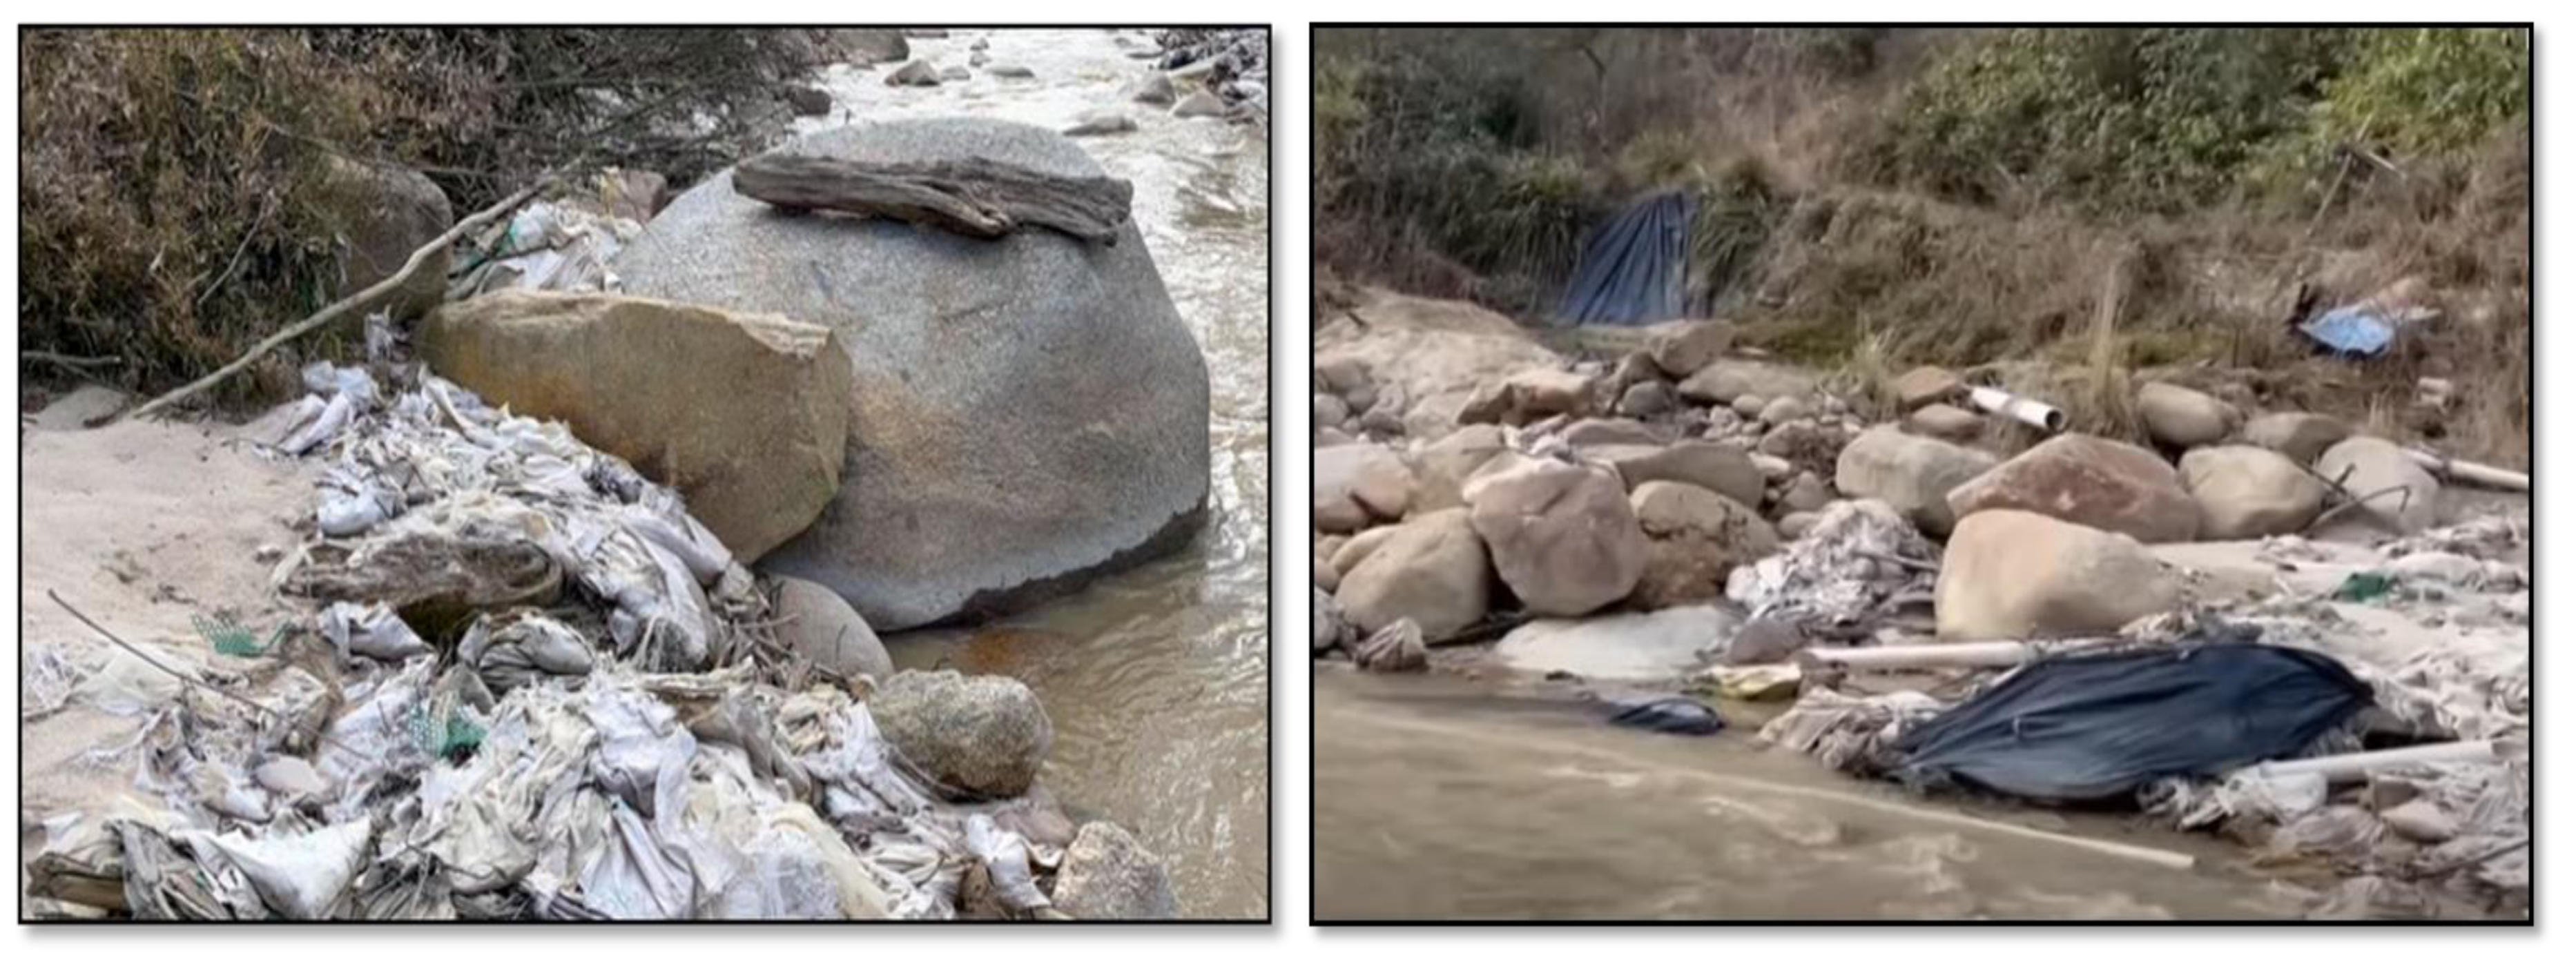
Characterization of Rare Earth Mining Extents and Related Social and Environmental Impacts

Mining covers less than 1% of the Earth’s surface [89]. Though this may seem small, open-pit mine operations can cause significant environmental and human health impacts through physical disturbance of the landscape, sedimentation of water bodies, and contamination [90]. The World Bank [91] has listed several sources related to environmental impacts and pollution pathways due to mining activities, including for rare earth elements (Table 6).
Decades of REE mining in China have caused considerable environmental degradation [92]. More recent social and environmental harms associated with the expansion of rare earth mining have been reported for Kachin State in northern Myanmar [93,94]. Monitoring the development of surface mining expansion over time and in relation to broader political and economic changes can help better understand and potentially manage these effects. This study shows that surface mine extents throughout the REE mining areas in both China and Myanmar (the area of this study) have increased by 211% from 2005 to 2020. This increase is revealed at a time when there is high global demand for REEs for energy and other technologies, including electric vehicle production [88,89]. A reduction in dense forest inferred from the non-mine cover and the high-resolution Google Earth images of the study site indicate increased land degradation, with no evidence of land or forest reclamation in the area. Our analysis also suggests small-scale mining in the area; through time-series analysis and visual inspection of Google Earth satellite images, we identify several patches that we hypothesize to be small-scale REE excavation areas. Their inconsistency on multiple time-series images indicates that these excavated areas were abandoned at a later stage, allowing the regeneration of trees and suggesting the presence of small-scale excavations around the study area. This can compound social and environmental impacts but requires verification. Figure 14 shows potential negative impacts on surface water from the creek where it is no longer usable for drinking or crop irrigation due to rare earth mining activities in Myanmar’s Kachin State [61].
Our findings are contrary to the prevailing narrative that rare earth mining has decreased in China and increased in Myanmar. While overall domestic mining has decreased in China, our study shows that mining has continued to increase in border regions. On the Chinese side of the study area, the REE surface mining extent has increased from 0.63 km2 to 1.45 km2, representing a 130% increase in extractive mining area, and on Myanmar’s side of the border, the surface mining area extraction has increased by 327% within the same study period, during which the mine area increased from 0.58 km2 in 2005 to 2.49 km2 in 2020 (Figure 15). This increase in REE surface mining extents in Myanmar is influenced by its proximity to China, as reported in the literature by Nakano [95], Sophia [96], and Klinger [97].
With projected demand increases, including those driven by the necessary transition to renewable energy to reach net zero by 2050 [98], there is increasing pressure on areas with rare earth elements and other critical raw material reserves. Mining in sensitive border regions (especially when it is occurring against stated government goals) requires improved transparency, as there are many opportunities for those extracted minerals to enter supply chains undetected. Understanding these dynamics more broadly can offer insights into the ways in which REEs are sourced and how their extraction may be better tracked and monitored.

5. Conclusions

In this present study, Landsat 5 TM and Landsat OLI time-series data from 2005 to 2020, in combination with landcover reference data from high-resolution Google Earth images, were used in a machine learning-powered, multi-temporal change detection analysis to map and monitor the development of mining extent activities in the rare earth mining fields of the Myanmar–China geopolitical border within Kachin State in northern Myanmar and the Nujiang Prefecture area in China using the GEE cloud computing platform. We performed a machine learning-supervised Random Forest classification [30] to determine the landcover dynamics in the study area with two main classes: mine area and non-mine area. From the analysis, we noted that the non-mine landcover decreased from 56.54 km2 to 53.98 km2, representing a decrease of 4.7%, and the mining area extent increased from 1.22 km2 to 3.78 km2. The mine area and non-mine area maps generated in this study showed changes in the landscape over the study period. Such information is crucial to understanding the transformation processes and human–environment interactions within mine sites as mining footprints expand over time. Leveraging the properties of the terrain in the area of interest, with heavy forest cover, this study focused on two main landcover classes: mine and non-mine. The typical size of mine-related landmarks is supported by the low spatial resolution of the Landsat data, which provided temporal coverage over our entire study period of 2005–2020. Access to new innovative commercial satellite data providers with low-cost and high-spatial-resolution datasets could be used to track seasonal or annual changes in mining patterns, including landuse/landcover changes, and the wider landscape related to future REE mining operations on a case-by-case scenario. For instance, the 30 m resolution of Landsat data supports our study because of the typical size of mining areas; using a resolution higher than 30 m is unlikely to make any significant difference in a binary classification, as was the case in this study. It is also critical to consider that spatial resolutions higher than 30 m would increase computational burdens without making significant improvements to the actual results. Our approach has successfully been used in mapping and monitoring the development of surface mine footprint expansion while mapping landcover changes using open-source tools. For similar operations and future research work, we recommend the integrated use of multiple methods as applied in this study for landcover categorization, visual inspection, and interpretation as a standard operating protocol to remotely collect ground-truthing data where fieldwork is not possible. This includes a selection of satellite imagery based on image resolution, the purpose of the landcover analysis, and the temporal scale of the study. Further, simultaneous use of visual inspection and interpretation of maps generated from satellite imagery (NDVI maps, Near Infrared False Color Composite (with band combinations of 4, 3, 2 for Landsat 5 TM and 5, 4, 3 for Landsat 8 OLI), RGB Orthophoto Composite Maps (Natural Color Composite with band combinations of 3, 2, 1 for Landsat 5 TM and 4, 3, 2 for Landsat 8 OLI), and high-resolution Google Earth images) are vital. Our approach allows flexibility in the inclusion of different satellite data types, depending on data availability and the research question of interest. This will contribute to the progress of remote sensing technologies in monitoring surface mining footprints, enhance the development of sustainable resource management initiatives, and potentially contribute to more sustainable mining development between the two neighboring countries.

Author Contributions

Conceptualization, E.C. and J.M.K.; methodology, E.C. and F.B.; formal analysis, E.C.; data curation, E.C. and J.M.K.; writing—original draft preparation, E.C. and J.M.K.; writing—review and editing, F.B., K.F.D., E.C. and J.M.K.; visualization, E.C., F.B. and K.F.D.; supervision, J.M.K.; project administration, J.M.K.; funding acquisition, J.M.K. All authors have read and agreed to the published version of the manuscript.

Funding

This material is based upon work supported by the National Science Foundation under Award No. 2039857. Any opinions, findings and conclusions or recommendations expressed in this material are those of the author(s) and do not necessarily reflect the views of the National Science Foundation.

Data Availability Statement

Administrative boundaries of China and Myanmar were accessed through the DIVA-GIS website (https://www.diva-gis.org/gdata, accessed on 1 November 2020); Planet satellite data was accessed on Planet website (https://www.planet.com/products/planet-imagery/, accessed on 1 February 2023); Landsat 5 TM and Landsat 8 OLI were accessed from the USGS through the Google Earth Engine platform (https://code.earthengine.google.com/, accessed on 15 October 2022); Google Earth images and training (referenced) data were accessed through Google Earth Pro (https://www.google.com/earth/versions/#earth-pro, accessed on 25 October 2022); Sentinel-2 data was downloaded from https://scihub.copernicus.eu/dhus/#/home, accessed on 20 October 2022 and pre-proposed in QGIS (https://www.qgis.org/en/site/forusers/download.html, accessed on 21 October 2022); and the USGS Spectroscopy Laboratory Library for rare earth elements was accessed from https://crustal.usgs.gov/speclab/QueryAll07a.php, accessed on 24 November 2022. The GEE codes were modified from https://www.eefabook.org/, accessed on 18 October 2022 and can be accessed on the Github repository through https://github.com/EmmanuelChinkaka/Monitoring-Mining-Extents, accessed on 3 July 2023. Any further information on the data presented in this work can be obtained from the authors.

Acknowledgments

Special thanks to members of the Klinger Lab, Department of Geography and Spatial Sciences, University of Delaware, and Romain Richaud for working on, and helping with the graphical abstract.

Conflicts of Interest

The authors declare no conflict of interest.

References

  1. Wu, B.; Fang, C.; Yu, L.; Huang, X.; Zhang, Q. A Fully Automatic Method to Extract Rare Earth Mining Areas from Landsat Images. Photogramm. Eng. Remote Sens. 2016, 82, 729–737. [Google Scholar] [CrossRef]
  2. Muavhi, N.; Mavhungu, M.E.; Ndivhudzannyi, R. Mapping of potential rare earth deposits in the Schiel alkaline complex using sentinel-2B multispectral sensor. Egypt. J. Remote Sens. Space Sci. 2021, 24, 609–617. [Google Scholar] [CrossRef]
  3. Haque, N.; Hughes, A.; Lim, S.; Vernon, C. Rare Earth Elements: Overview of Mining, Mineralogy, Uses, Sustainability and Environmental Impact. Resources 2014, 3, 614–635. [Google Scholar] [CrossRef]
  4. Nguyen, R.T.; Imholte, D.D. China’s Rare Earth Supply Chain: Illegal Production, and Response to new Cerium Demand. JOM 2016, 68, 1948–1956. [Google Scholar] [CrossRef]
  5. Schlinkert, D.; Boogaart, K.G.v.D. The development of the market for rare earth elements: Insights from economic theory. Resour. Policy 2015, 46, 272–280. [Google Scholar] [CrossRef]
  6. The White House, United States of America. 31 CFR Part 525—Burma Sanctions Regulations. Available online: https://www.ecfr.gov/current/title-31/subtitle-B/chapter-V/part-525 (accessed on 28 March 2023).
  7. Chen, S. ‘The Sacrifice Zone’: Myanmar Bears Cost of Green Energy|AP News. Available online: https://apnews.com/article/technology-forests-myanmar-75df22e8d7431a6757ea4a426fbde94c (accessed on 28 March 2023).
  8. Institute for Energy Research. China and the Rare Earth Supply Chain. IER. 23 February 2021. Available online: https://www.instituteforenergyresearch.org/renewable/china-and-the-rare-earth-supply-chain-policy-brief/ (accessed on 28 March 2023).
  9. Xie, L.; Wu, W.; Huang, X.; Ou, P.; Lin, Z.; Zhiling, W.; Song, Y.; Lang, T.; Huangfu, W.; Zhang, Y.; et al. Mining and Restoration Monitoring of Rare Earth Element (REE) Exploitation by New Remote Sensing Indicators in Southern Jiangxi, China. Remote Sens. 2020, 12, 3558. [Google Scholar] [CrossRef]
  10. Haq, I.U.; Ferreira, P.; Maneengam, A.; Wisetsri, W. Rare Earth Market, Electric Vehicles and Future Mobility Index: A Time-Frequency Analysis with Portfolio Implications. Risks 2022, 10, 137. [Google Scholar] [CrossRef]
  11. Silva, M.P.d.S.; Câmara, G.; Escada, M.I.S.; de Souza, R.C.M. Remote-sensing image mining: Detecting agents of land-use change in tropical forest areas. Int. J. Remote Sens. 2008, 29, 4803–4822. [Google Scholar] [CrossRef]
  12. Zhang, M.; He, T.; Li, G.; Xiao, W.; Song, H.; Lu, D.; Wu, C. Continuous Detection of Surface-Mining Footprint in Copper Mine Using Google Earth Engine. Remote Sens. 2021, 13, 4273. [Google Scholar] [CrossRef]
  13. Soni, A.K. Estimation of Mine Water Quantity: Development of Guidelines for Indian Mines. Mine Water Environ. 2020, 39, 397–406. [Google Scholar] [CrossRef]
  14. Nascimento, F.S.; Gastauer, M.; Souza-Filho, P.W.M.; Nascimento, W.R.; Santos, D.C.; Costa, M.F. Land Cover Changes in Open-Cast Mining Complexes Based on High-Resolution Remote Sensing Data. Remote Sens. 2020, 12, 611. [Google Scholar] [CrossRef]
  15. Luo, P.; Han, X.; Chen, N. Study on Complexity Planning Model of Pumped Storage in Abandoned Open-Pit Mine: A Case Study of Fushun Open-Pit Mine. Front. Earth Sci. 2022, 10, 808371. [Google Scholar] [CrossRef]
  16. Page, W.R.; VanSistine, D.P.; Turner, K.J. Preliminary Geologic Map of Southernmost Texas, United States, and Parts of Tamaulipas and Nuevo Leon, Mexico: Environmental Health Investigations in the United States-Mexico Border Region; U.S. Geological Survey: Denver, CO, USA, 2005. Available online: https://pubs.usgs.gov/of/2005/1409/ (accessed on 21 August 2023).
  17. Rubbers, B. Inside Mining Capitalism: The Micropolitics of Work on the Congolese and Zambian Copperbelts; Boydell & Brewer: Suffolk, UK, 2021. [Google Scholar] [CrossRef]
  18. Chaussard, E.; Kerosky, S. Characterization of Black Sand Mining Activities and Their Environmental Impacts in the Philippines Using Remote Sensing. Remote Sens. 2016, 8, 100. [Google Scholar] [CrossRef]
  19. Mimouni, M.E.; Aarab, A.; Lakhloufi, A.; Hamzaoui, A.; Benammi, E.M.; Benyas, K. New Targets of Potential Mining Interest Using Gravimetric and Satellite Data: Case Study of Hercynian Rehamna Massif, Morocco. Iraqi Geol. J. 2022, 55, 14–26. [Google Scholar] [CrossRef]
  20. Brown, C.; Boyd, D.S.; Kara, S. Landscape Analysis of Cobalt Mining Activities from 2009 to 2021 Using Very High Resolution Satellite Data (Democratic Republic of the Congo). Sustainability 2022, 14, 9545. [Google Scholar] [CrossRef]
  21. Zhiqiang, L.; Peihong, L.; Yimin, Y. Research on Multi-scale Segmentation of Remote Sensing Images of Typical Feature in Rare Earth Mining Area. IOP Conf. Ser. Earth Environ. Sci. 2021, 671, 012025. [Google Scholar] [CrossRef]
  22. Vorovencii, I. Changes detected in the extent of surface mining and reclamation using multitemporal Landsat imagery: A case study of Jiu Valley, Romania. Environ. Monit. Assess. 2021, 193, 30. [Google Scholar] [CrossRef]
  23. Juanda, E.T.; Martono, D.N.; Saria, L. Analysis vegetation change on coal mine reclamation using Normalized Difference Vegetation Index (NDVI). IOP Conf. Ser. Earth Environ. Sci. 2021, 716, 012035. [Google Scholar] [CrossRef]
  24. Basommi, P.L.; Guan, Q.; Cheng, D. Exploring Land use and Land cover change in themining areas of Wa East District, Ghana usingSatellite Imagery. Open Geosci. 2015, 7, 20150058. [Google Scholar] [CrossRef]
  25. Li, H.; Wu, L.; Liu, X. Change detection of ground-surface environment in rare earth mining area based on multi-temporal remote sensing: A case in Lingbei rare earth mining area. Zhongguo Kuangye Daxue Xuebao J. China Univ. Min. Technol. 2014, 43, 1087–1094. [Google Scholar]
  26. Rawat, J.; Kumar, M. Monitoring land use/cover change using remote sensing and GIS techniques: A case study of Hawalbagh block, district Almora, Uttarakhand, India. Egypt. J. Remote Sens. Space Sci. 2015, 18, 77–84. [Google Scholar] [CrossRef]
  27. Arıkan, C.; Tümer, İ.N.; Aksoy, S.; Sertel, E. Determination of burned areas using Sentinel-2A imagery and machine learning classification algorithms. Intercont. Geoinf. Days 2022, 4, 43–46. [Google Scholar]
  28. Korytkowski, M.; Rutkowski, L.; Scherer, R. Fast image classification by boosting fuzzy classifiers. Inf. Sci. 2016, 327, 175–182. [Google Scholar] [CrossRef]
  29. Sanghvi, K.; Aralkar, A.; Sanghvi, S.; Saha, I. A Survey on Image Classification Techniques. SSRN Electron. J. 2021. [Google Scholar] [CrossRef]
  30. Breiman, L. Random forests. Mach. Learn. 2001, 45, 5–32. [Google Scholar] [CrossRef]
  31. Naushad, R.; Kaur, T.; Ghaderpour, E. Deep Transfer Learning for Land Use and Land Cover Classification: A Comparative Study. Sensors 2021, 21, 8083. [Google Scholar] [CrossRef]
  32. Alzubaidi, L.; Zhang, J.; Humaidi, A.J.; Al-Dujaili, A.; Duan, Y.; Al-Shamma, O.; Santamaría, J.; Fadhel, M.A.; Al-Amidie, M.; Farhan, L. Review of deep learning: Concepts, CNN architectures, challenges, applications, future directions. J. Big Data 2021, 8, 53. [Google Scholar] [CrossRef]
  33. Thanh Noi, P.; Kappas, M. Comparison of Random Forest, k-Nearest Neighbor, and Support Vector Machine Classifiers for Land Cover Classification Using Sentinel-2 Imagery. Sensors 2018, 18, 18. [Google Scholar] [CrossRef]
  34. Khelifi, L.; Mignotte, M. Deep Learning for Change Detection in Remote Sensing Images: Comprehensive Review and Meta-Analysis. IEEE Access 2020, 8, 126385–126400. [Google Scholar] [CrossRef]
  35. Gorelick, N.; Hancher, M.; Dixon, M.; Ilyushchenko, S.; Thau, D.; Moore, R. Google Earth Engine: Planetary-scale geospatial analysis for everyone. Remote Sens. Environ. 2017, 202, 18–27. [Google Scholar] [CrossRef]
  36. Bahşi, K.; Ustaoglu, B.; Aksoy, S.; Sertel, E. Estimation of emissions from crop residue burning in Türkiye using remotely sensed data and the Google Earth Engine platform. Geocarto Int. 2022, 38, 2157052. [Google Scholar] [CrossRef]
  37. Huang, H.; Chen, Y.; Clinton, N.; Wang, J.; Wang, X.; Liu, C.; Gong, P.; Yang, J.; Bai, Y.; Zheng, Y.; et al. Mapping major land cover dynamics in Beijing using all Landsat images in Google Earth Engine. Remote Sens. Environ. 2017, 202, 166–176. [Google Scholar] [CrossRef]
  38. Bayrakdar, H.Y.; Kavlak, M.; Yilmazel, B.; Çabuk, A. Assessing the performance of machine learning algorithms in Google Earth Engine for land use and land cover analysis: A case study of Muğla province, Türkiye. J. Des. Resil. Arch. Plan. 2022, 3, 224–236. [Google Scholar] [CrossRef]
  39. Woods, K. Expansion of Agribusiness in Myanmar: Driver of deforestation, conversion timber and land conflicts in Myanmar. 2015. Available online: https://www.forest-trends.org/publications/commercial-agriculture-expansion-in-myanmar-links-to-deforestation-conversion-timber-and-land-conflicts/ (accessed on 29 March 2023).
  40. Ting, Z. A Study of the Impacts of Shifting Cultivation on the Environment and Local People in Kachin State, Myanmar. 2014. Available online: https://www.academia.edu/49165530/A_Study_of_the_Impacts_of_Shifting_Cultivation_on_the_Environment_and_Local_People_in_Kachin_State_Myanmar (accessed on 29 March 2023).
  41. Sun, H.; Wang, J.; Xiong, J.; Bian, J.; Jin, H.; Cheng, W.; Li, A. Vegetation Change and Its Response to Climate Change in Yunnan Province, China. Adv. Meteorol. 2021, 2021, 8857589. [Google Scholar] [CrossRef]
  42. Ranjitkar, S.; Sujakhu, N.M.; Lu, Y.; Wang, Q.; Wang, M.; He, J.; Mortimer, P.E.; Xu, J.; Kindt, R.; Zomer, R.J. Climate modelling for agroforestry species selection in Yunnan Province, China. Environ. Model. Softw. 2016, 75, 263–272. [Google Scholar] [CrossRef]
  43. Zomer, R.J.; Xu, J.; Wang, M.; Trabucco, A.; Li, Z. Projected impact of climate change on the effectiveness of the existing protected area network for biodiversity conservation within Yunnan Province, China. Biol. Conserv. 2015, 184, 335–345. [Google Scholar] [CrossRef]
  44. Licht, A.; Dupont-Nivet, G.; Win, Z.; Swe, H.H.; Kaythi, M.; Roperch, P.; Ugrai, T.; Littell, V.; Park, D.; Westerweel, J.; et al. Paleogene evolution of the Burmese forearc basin and implications for the history of India-Asia convergence. GSA Bull. 2018, 131, 730–748. [Google Scholar] [CrossRef]
  45. The Geology of Burma (Myanmar): An Annotated Bibliography of Burma’s Geology, Geography and Earth Science. Available online: https://www.researchgate.net/publication/235104805_The_Geology_of_Burma_Myanmar_An_Annotated_Bibliography_of_Burma’s_Geology_Geography_and_Earth_Science (accessed on 12 January 2023).
  46. Barber, T. Book Review. Am. Miner. 2020, 105, 287–288. [Google Scholar] [CrossRef]
  47. Westerweel, J.; Roperch, P.; Licht, A.; Dupont-Nivet, G.; Win, Z.; Poblete, F.; Ruffet, G.; Swe, H.H.; Thi, M.K.; Aung, D.W. Burma Terrane part of the Trans-Tethyan arc during collision with India according to palaeomagnetic data. Nat. Geosci. 2019, 12, 863–868. [Google Scholar] [CrossRef]
  48. Searle, M.P.; Morley, C.K.; Waters, D.J.; Gardiner, N.J.; Htun, U.K.; Nu, T.T.; Robb, L.J. Chapter 12 Tectonic and metamorphic evolution of the Mogok Metamorphic and Jade Mines belts and ophiolitic terranes of Burma (Myanmar). Geol. Soc. Lond. Mem. 2017, 48, 261–293. [Google Scholar] [CrossRef]
  49. Parlak, O.; Delaloye, M.; Bíngöl, E. Mineral chemistry of ultramafic and mafic cumulates as an indicator of the arc-related origin of the Mersin ophiolite (southern Turkey). Int. J. Earth Sci. 1996, 85, 647–661. [Google Scholar] [CrossRef]
  50. Liu, T.; Liu, C.; Chen, Y.; Guo, S.; Sein, K.; Dong, X. Petrology and geochemistry of ultramafic rocks in the Mogok belt, Myanmar: Cumulates from high-pressure crystallization of hydrous arc melts. Geol. J. 2021, 57, 886–905. [Google Scholar] [CrossRef]
  51. Karimzadeh, S.; Tangestani, M.H. Potential of Sentinel-2 MSI data in targeting rare earth element (Nd3+) bearing minerals in Esfordi phosphate deposit, Iran. Egypt. J. Remote Sens. Space Sci. 2022, 25, 697–710. [Google Scholar] [CrossRef]
  52. Lavenir, N.M.J.; Cyrille, S.; Paul, N.J.; Suh, C.E. Mineral chemistry (EMPA) of monazites in metamorphic rocks from Edea region: Implications of the monazite chemistry on the metamorphic evolution of the Nyong Complex. Arab. J. Geosci. 2022, 15, 1665. [Google Scholar] [CrossRef]
  53. Purwadi, I.; van der Werff, H.; Lievens, C. Targeting rare earth element bearing mine tailings on Bangka Island, Indonesia, with Sentinel-2 MSI. Int. J. Appl. Earth Obs. Geoinf. 2020, 88, 102055. [Google Scholar] [CrossRef]
  54. Kokaly, R.F.; Clark, R.N.; Swayze, G.A.; Livo, K.E.; Hoefen, T.M.; Pearson, N.C.; Wise, R.A.; Benzel, W.M.; Lowers, H.A.; Driscoll, R.L.; et al. USGS Spectral Library Version 7; U.S. Geological Survey: Reston, VA, USA, 2017; 61p. [Google Scholar] [CrossRef]
  55. Ditian; Devy, M.; Eko, W.; Sanjaya, H.; Hartono, R. Mangrove Extent and Change Mapping of Muaragembong from 1990 to 2020 using Google Earth Engine (GEE). In Proceedings of the IEEE Ocean Engineering Technology and Innovation Conference: Ocean Observation, Technology and Innovation in Support of Ocean Decade of Science (OETIC), Jakarta, Indonesia, 8–9 November 2021; Sanjaya, H., Ed.; pp. 35–38. [Google Scholar] [CrossRef]
  56. Liu, Y.; Xie, M.; Liu, J.; Wang, H.; Chen, B. Vegetation Disturbance and Recovery Dynamics of Different Surface Mining Sites via the LandTrendr Algorithm: Case Study in Inner Mongolia, China. Land 2022, 11, 856. [Google Scholar] [CrossRef]
  57. Ma, C.; Guo, Z.-Z.; Zhang, X.-K.; Han, R.-M. Annual integral changes of time serial NDVI in mining subsidence area. Trans. Nonferrous Met. Soc. China 2011, 21, s583–s588. [Google Scholar] [CrossRef]
  58. Rouse, J.W.; Haas, R.H.; Schell, J.A.; Deering, D.W. Monitoring vegetation systems in the Great Plains with ERTS. In Third Earth Resources Technology Satellite-1 Symposium; NASA Sp-351 I: Greenbelt, MA, USA, 1973; Volume 351, pp. 309–317. [Google Scholar]
  59. Fan, X.; Guan, Y.; Bai, Z.; Zhou, W.; Zhu, C. Optimization of Reclamation Measures in a Mining Area by Analysis of Variations in Soil Nutrient Grades under Different Types of Land Usage—A Case Study of Pingshuo Coal Mine, China. Land 2022, 11, 321. [Google Scholar] [CrossRef]
  60. Liu, X.; Cao, Y.; Bai, Z.; Wang, J.; Zhou, W. Evaluating relationships between soil chemical properties and vegetation cover at different slope aspects in a reclaimed dump. Environ. Earth Sci. 2017, 76, 805. [Google Scholar] [CrossRef]
  61. China-led Rare Earth Mining in Myanmar Fuels Rights Abuses, Pollution: Report. Radio Free Asia. Available online: https://www.rfa.org/english/news/myanmar/rareearths-08092022183340.html (accessed on 4 April 2023).
  62. Hansen, M.C.; Roy, D.P.; Lindquist, E.; Adusei, B.; Justice, C.O.; Altstatt, A. A method for integrating MODIS and Landsat data for systematic monitoring of forest cover and change in the Congo Basin. Remote Sens. Environ. 2008, 112, 2495–2513. [Google Scholar] [CrossRef]
  63. Rabiei-Dastjerdi, H.; Amini, S.; McArdle, G.; Homayouni, S. City-region or city? That is the question: Modelling sprawl in Isfahan using geospatial data and technology. GeoJournal 2022. [Google Scholar] [CrossRef]
  64. Zhu, Z.; Zhang, Z.; Zuo, L.; Pan, T.; Zhao, X.; Wang, X.; Sun, F.; Xu, J.; Liu, Z. Study on the Classification and Change Detection Methods of Drylands in Arid and Semi-Arid Regions. Remote Sens. 2022, 14, 1256. [Google Scholar] [CrossRef]
  65. Amini, S.; Saber, M.; Rabiei-Dastjerdi, H.; Homayouni, S. Urban Land Use and Land Cover Change Analysis Using Random Forest Classification of Landsat Time Series. Remote Sens. 2022, 14, 2654. [Google Scholar] [CrossRef]
  66. Zhai, H.; Lv, C.; Liu, W.; Yang, C.; Fan, D.; Wang, Z.; Guan, Q. Understanding Spatio-Temporal Patterns of Land Use/Land Cover Change under Urbanization in Wuhan, China, 2000–2019. Remote Sens. 2021, 13, 3331. [Google Scholar] [CrossRef]
  67. Tu, Y.; Chen, B.; Zhang, T.; Xu, B. Regional Mapping of Essential Urban Land Use Categories in China: A Segmentation-Based Approach. Remote Sens. 2020, 12, 1058. [Google Scholar] [CrossRef]
  68. Pal, M. Random forest classifier for remote sensing classification. Int. J. Remote Sens. 2005, 26, 217–222. [Google Scholar] [CrossRef]
  69. Somayajula, V.K.; Ghai, D.; Kumar, S. Land Use/Land Cover Change Analysis Using NDVI, PCA. In Proceedings of the 5th International Conference on Computing Methodologies and Communication (ICCMC), Erode, India, 8–10 April 2021; pp. 849–855. [Google Scholar] [CrossRef]
  70. Madanian, M.; Soffianian, A.R.; Koupai, S.S.; Pourmanafi, S.; Momeni, M. Analyzing the effects of urban expansion on land surface temperature patterns by landscape metrics: A case study of Isfahan city, Iran. Environ. Monit. Assess. 2018, 190, 189. [Google Scholar] [CrossRef]
  71. Mantero, P.; Moser, G.; Serpico, S. Partially Supervised classification of remote sensing images through SVM-based probability density estimation. IEEE Trans. Geosci. Remote Sens. 2005, 43, 559–570. [Google Scholar] [CrossRef]
  72. Wulder, M.A.; Li, Z.; Campbell, E.M.; White, J.C.; Hobart, G.; Hermosilla, T.; Coops, N.C. A National Assessment of Wetland Status and Trends for Canada’s Forested Ecosystems Using 33 Years of Earth Observation Satellite Data. Remote Sens. 2018, 10, 1623. [Google Scholar] [CrossRef]
  73. Lechner, M.; Dostálová, A.; Hollaus, M.; Atzberger, C.; Immitzer, M. Combination of Sentinel-1 and Sentinel-2 Data for Tree Species Classification in a Central European Biosphere Reserve. Remote Sens. 2022, 14, 2687. [Google Scholar] [CrossRef]
  74. Tamiminia, H.; Salehi, B.; Mahdianpari, M.; Quackenbush, L.; Adeli, S.; Brisco, B. Google Earth Engine for geo-big data applications: A meta-analysis and systematic review. ISPRS J. Photogramm. Remote Sens. 2020, 164, 152–170. [Google Scholar] [CrossRef]
  75. Rudiastuti, A.W.; Lumban-Gaol, Y.; Silalahi, F.E.S.; Prihanto, Y.; Pranowo, W.S. Implementing Random Forest Algorithm in GEE: Separation and Transferability on Built-Up Area in Central Java, Indonesia. JOIV Int. J. Inform. Vis. 2022, 6, 74–82. [Google Scholar] [CrossRef]
  76. Maxwell, A.E.; Warner, T.A.; Fang, F. Implementation of machine-learning classification in remote sensing: An applied review. Int. J. Remote Sens. 2018, 39, 2784–2817. [Google Scholar] [CrossRef]
  77. Phan, T.N.; Kuch, V.; Lehnert, L.W. Land Cover Classification using Google Earth Engine and Random Forest Classifier—The Role of Image Composition. Remote Sens. 2020, 12, 2411. [Google Scholar] [CrossRef]
  78. He, H.; Garcia, E.A. Learning from Imbalanced Data. IEEE Trans. Knowl. Data Eng. 2009, 21, 1263–1284. [Google Scholar] [CrossRef]
  79. Więckowska, B.; Kubiak, K.B.; Jóźwiak, P.; Moryson, W.; Stawińska-Witoszyńska, B. Cohen’s Kappa Coefficient as a Measure to Assess Classification Improvement following the Addition of a New Marker to a Regression Model. Int. J. Environ. Res. Public Health 2022, 19, 10213. [Google Scholar] [CrossRef]
  80. de Raadt, A.; Warrens, M.J.; Bosker, R.J.; Kiers, H.A.L. A Comparison of Reliability Coefficients for Ordinal Rating Scales. J. Classif. 2021, 38, 519–543. [Google Scholar] [CrossRef]
  81. Meier, J.; Mauser, W. Irrigation Mapping at Different Spatial Scales: Areal Change with Resolution Explained by Landscape Metrics. Remote Sens. 2023, 15, 315. [Google Scholar] [CrossRef]
  82. Zhang, C.; Dong, J.; Zuo, L.; Ge, Q. Tracking spatiotemporal dynamics of irrigated croplands in China from 2000 to 2019 through the synergy of remote sensing, statistics, and historical irrigation datasets. Agric. Water Manag. 2022, 263, 107458. [Google Scholar] [CrossRef]
  83. Panuju, D.R.; Paull, D.J.; Griffin, A.L. Change Detection Techniques Based on Multispectral Images for Investigating Land Cover Dynamics. Remote Sens. 2020, 12, 1781. [Google Scholar] [CrossRef]
  84. Reis, M.S.; Dutra, L.V.; Sant’anna, S.J.S.; Escada, M.I.S. Examining Multi-Legend Change Detection in Amazon with Pixel and Region Based Methods. Remote Sens. 2017, 9, 77. [Google Scholar] [CrossRef]
  85. Baig, M.F.; Mustafa, M.R.U.; Baig, I.; Takaijudin, H.B.; Zeshan, M.T. Assessment of Land Use Land Cover Changes and Future Predictions Using CA-ANN Simulation for Selangor, Malaysia. Water 2022, 14, 402. [Google Scholar] [CrossRef]
  86. Rakhmangulov, A.; Burmistrov, K.; Osintsev, N. Selection of Open-Pit Mining and Technical System’s Sustainable Development Strategies Based on MCDM. Sustainability 2022, 14, 8003. [Google Scholar] [CrossRef]
  87. Zhou, Y.; Zhou, W.; Lu, X.; Jiskani, I.M.; Cai, Q.; Liu, P.; Li, L. Evaluation Index System of Green Surface Mining in China. Mining, Metall. Explor. 2020, 37, 1093–1103. [Google Scholar] [CrossRef]
  88. Dutta, T.; Kim, K.-H.; Uchimiya, M.; Kwon, E.E.; Jeon, B.-H.; Deep, A.; Yun, S.-T. Global demand for rare earth resources and strategies for green mining. Environ. Res. 2016, 150, 182–190. [Google Scholar] [CrossRef]
  89. LaJeunesse Connette, K.J.; Connette, G.; Bernd, A.; Phyo, P.; Aung, K.H.; Tun, Y.L.; Thein, Z.M.; Horning, N.; Leimgruber, P.; Songer, M. Assessment of Mining Extent and Expansion in Myanmar Based on Freely-Available Satellite Imagery. Remote Sens. 2016, 8, 912. [Google Scholar] [CrossRef]
  90. Dlamini, L.Z.D.; Xulu, S. Monitoring Mining Disturbance and Restoration over RBM Site in South Africa Using LandTrendr Algorithm and Landsat Data. Sustainability 2019, 11, 6916. [Google Scholar] [CrossRef]
  91. D’Souza, K. Artisanal Mining in the DRC: Key Issues, Challenges and Opportunities; Communities and Small-Scale Mining; World Bank: Washington, DC, USA, 2007; Available online: https://delvedatabase.org/uploads/resources/2007_CASM_DSouza_DRC-Artisianal-Mining-Key-Issues-Challenges-Opportunities.pdf (accessed on 4 April 2023).
  92. Klinger, J.M. Social and Environmental Impacts of Rare Earth Mining, Processing, and Proliferation: Scoping and Preliminary Assessment. In Critical Minerals, the Climate Crisis and the Tech Imperium; Kalantzakos, S., Ed.; Springer Nature Switzerland: Cham, Switzerland, 2023; pp. 149–165. [Google Scholar] [CrossRef]
  93. Rare Earths in Myanmar: Unobtanium? Available online: https://thediplomat.com/2021/06/rare-earths-in-myanmar-unobtanium/ (accessed on 4 April 2023).
  94. Zapp, P.; Schreiber, A.; Marx, J.; Kuckshinrichs, W. Environmental impacts of rare earth production. MRS Bull. 2022, 47, 267–275. [Google Scholar] [CrossRef]
  95. Nakano, J. The Geopolitics of Critical Minerals Supply Chains. 2021. Available online: https://www.csis.org/analysis/geopolitics-critical-minerals-supply-chains (accessed on 1 May 2023).
  96. Sophia, K. The Geopolitics of Critical Minerals. Professional Paper. 2017. Available online: https://www.academia.edu/41546280/The_Geopolitics_of_Critical_Minerals (accessed on 8 May 2023).
  97. Klinger, J.M. Rare Earth Frontiers: From Terrestrial Subsoils to Lunar Landscapes; Illustrated Edition; Cornell University Press: Ithaca, NY, USA, 2018. [Google Scholar]
  98. Balaram, V. Potential Future Alternative Resources for Rare Earth Elements: Opportunities and Challenges. Minerals 2023, 13, 425. [Google Scholar] [CrossRef]
Figure 1. Study area (Myanmar–China border)—Myitkyina (Kachin State) and Nujiang Prefecture (Yunnan Province) and Planet satellite data imagery (RGB = 642, Natural Color Composite).
Remotesensing 15 04597 g001
Figure 2. Generalized geologic map of the study area: China–Myanmar border and neighboring countries. Modified from [44].
Remotesensing 15 04597 g002
Figure 3. (a) Reflectance spectra of fluorapatite, monazite, goethite, and hematite selected from the USGS spectral library [54]; (b) Monazite HS255.3B from the USGS Library resampled to Sentinel-2 MSI bandpass for comparison (a vertical line indicates the REE neodymium absorption feature); (c) Sentinel-2 MSI imagery with a Natural Color Composite (RGB = 4/3/2) showing study area site in yellow box and the open pit for REE minerals mining in a red box where the image spectrum was extracted at the middle of the open pit (X:5455 Y:4081); (d) Sentinel-2 image spectrum from the study site’s open-pit mine (X:5455 Y:4081), showing a vertical line indicating the REE neodymium absorption feature, confirming the presence of REEs. In this study, Sentinel-2 MSI has only been used for rare earth mineral confirmation because it has a band configuration that enables the detection of neodymium absorption features, but Sentinel-2’s launch dates do not align well with the study period to allow multi-temporal analysis.
Remotesensing 15 04597 g003
Figure 4. Landsat 8 OLI image for the study area in Natural Color Composite (Red = 4, Green = 3, Blue = 2).
Remotesensing 15 04597 g004
Figure 5. Research Methodology Workflow.
Remotesensing 15 04597 g005
Figure 6. Landcover maps of Landsat-5 and Lansat-8 images using RF classifiers for the years 2005, 2010, 2015, and 2020.
Remotesensing 15 04597 g006
Figure 7. Landcover changes using RF classifier of Landsat-5 and Landsat-8 for the years 2005, 2010, 2015, and 2020.
Remotesensing 15 04597 g007
Figure 8. Area change detection quantifications in square kilometers over time: 2005–2020.
Remotesensing 15 04597 g008
Figure 9. Change detection maps with “from–to” information: Mine area–Mine area, Mine area–Non-mine area, Non-mine area–Mine area, and Non-mine area–Non-mine area.
Remotesensing 15 04597 g009
Figure 10. Surface mining extents for 2005, 2010, 2015, and 2020 draped on 2020 Landsat 8 OLI natural color imagery.
Remotesensing 15 04597 g010
Figure 11. (a) Google Earth image for Mine site A in 2005; (b) Google Earth image for Mine site A in 2020 illustrating mine area expansion; (c) surface mine area expansion analysis result for Mine site A from this study, depicting surface mining extent in 2005 (visualized in yellow) and surface mining extent in 2020 (visualized in red).
Remotesensing 15 04597 g011
Figure 12. (a) Google Earth image for northern part of Mine site B in 2005; (b) Google Earth image for northern part of Mine site B in 2020 illustrating mine area expansion; (c) surface mine area expansion analysis result for northern part of Mine site B from this study, depicting surface mining extent in 2005 (visualized in yellow) and surface mining extent in 2020 (visualized in red).
Remotesensing 15 04597 g012
Figure 13. (a) Google Earth image for southern part of Mine site B in 2005; (b) Google Earth image for part southern of Mine site B in 2020 illustrating mine area expansion; (c) surface mine area expansion analysis result for southern part of Mine site B from this study, depicting surface mining extent in 2005 (visualized in yellow) and surface mining extent in 2020 (visualized in red).
Remotesensing 15 04597 g013
Figure 14. Environmental impacts from rare earth mines in Myanmar’s Kachin State. Local villagers have indicated that water from the creek is no longer usable for drinking or growing crops and that their skin itches after being exposed to water near rare earth mining sites [61].
Remotesensing 15 04597 g014
Figure 15. Change in Rare Earth Mining Surface Extents in Myanmar and China (over the study area) between 2005 and 2020.
Remotesensing 15 04597 g015
Table 1. Data description summary.
SensorBand NumberDescriptionBandwidth (µm)Resolution (m)
Landsat 5 TM1Visible Blue0.45–0.5230
2Visible Green0.52–0.6030
3Visible Red0.63–0.6930
4Near-Infrared 10.76–0.9030
5Near-Infrared 21.55–1.7530
6Thermal-Infrared 10.40–12.50120
7Mid-Infrared2.08–2.3530
Landsat 8 OLI1Coastal/Aerosol0.43–0.4530
2Visible Blue0.45–0.5130
3Visible Green0.53–0.5930
4Visible Red0.64–0.6730
5Near-Infrared0.85–0.8830
6Shortwave-Infrared 11.57–1.6530
7Shortwave-Infrared 20.43–0.4530
8Panchromatic0.50–0.6815
9Cirrus1.36–1.3830
10Longwave-Infrared 110.6–11.19100
11Longwave-Infrared 211.5–12.51100
Table 2. Specifications of satellite data that were used in the Random Forest image classification.
SensorAcquisition DatePath/RowResolution
L5 TM13 January 2005167/7130
L5 TM13 December 2010161/7130
L8 OLI9 November 2015161/7130
L8 OLI6 December 2020161/7130
Table 3. Landcover classification categories and their corresponding descriptions.
CategoryDescription
Mine areaAreas with surface mine operations, mine excavated areas, open-pit mine areas, mine wet and dry tailings, mine stockpiles, and mine operation buildings, including mine processing facilities.
Non-mine areaAreas with dense vegetation cover, sparse vegetation cover, mixed vegetation cover, and bare land.
Table 4. Confusion matrix for the accuracy assessment of classified maps (2005, 2010, 2015, and 2020).
Landcover ClassMine AreaNon-Mine AreaTotalUser’s Accuracy (%)
2005
Mine area9819998.99
Non-mine area218118398.90
Total100182282
Producer’s Accuracy (%)9899.45
Overall Accuracy (%)98.94
Kappa Coefficient0.9877
2010
Mine area98098100
Non-mine area218218498.91
Total100182282
Producer’s Accuracy (%)98100
Overall Accuracy (%)99.29
Kappa Coefficient0.9918
2015
Mine area100110199
Non-mine area0181181100
Total100182282
Producer’s Accuracy (%)10099.45
Overall Accuracy (%)99.64
Kappa Coefficient0.9962
2020
Mine area99099100
Non-mine area118218399.45
Total100182282
Producer’s Accuracy (%)99100
Overall Accuracy (%)99.64
Kappa Coefficient0.9958
Table 5. Overall change detection statistics (2005–2020).
Landcover ChangeArea Change (km2)
Mine area–Mine area0.57
Mine area–Non-mine area0.64
Non-mine area–Mine area3.20
Non-mine area–Non-mine area53.33
Table 6. World Bank list of mining activity related to environmental impacts and pollution pathways [91].
Sources, Environmental Impacts, and Pollution Pathways
  • Drainage from mining sites, including processing water discharge and the breaching of mining tailings impoundments;
  • Direct dumping of mine/domestic waste;
  • Sediment runoff from mining activities;
  • Anthropogenic heavy metal pollution of terrestrial and aquatic ecosystems;
  • Leaching of pollutants from tailings residues, disposal areas, and contaminated soils;
  • Air emissions from mineral-processing diesel equipment;
  • Dust emissions.
Disclaimer/Publisher’s Note: The statements, opinions and data contained in all publications are solely those of the individual author(s) and contributor(s) and not of MDPI and/or the editor(s). MDPI and/or the editor(s) disclaim responsibility for any injury to people or property resulting from any ideas, methods, instructions or products referred to in the content.

