Article

An Improved S2A-Net Algorithm for Ship Object Detection in Optical Remote Sensing Images

1
School of Information Science and Engineering, Harbin Institute of Technology at Weihai, Weihai 264209, China
2
Key Laboratory of Cross-Domain Synergy and Comprehensive Support for Unmanned Marine Systems, Ministry of Industry and Information Technology, Weihai 264209, China
3
Shandong Provincial Key Laboratory of Marine Electronic Information and Intelligent Unmanned Systems, Weihai 264209, China
4
School of Instrumentation Science and Engineering, Harbin Institute of Technology, Harbin 150001, China
*
Author to whom correspondence should be addressed.
Remote Sens. 2023, 15(18), 4559; https://doi.org/10.3390/rs15184559
Submission received: 24 August 2023 / Revised: 14 September 2023 / Accepted: 14 September 2023 / Published: 16 September 2023

Abstract

:
Ship detection based on remote sensing images holds significant importance in both military and economic domains. Ships within such images exhibit diverse scales, dense distributions, arbitrary orientations, and narrow shapes, which pose challenges for accurate recognition. This paper introduces an improved S2A-Net (Single-shot Alignment Network) based oriented object detection algorithm for ship detection. In network structure, pyramid squeeze attention is embedded in order to focus on key features and a context information module is designed to enhance the context understanding capability of the network. In the training strategy, considering the distortion problems such as blurring and low contrast in remote sensing images, a fog density and depth decomposition-based unpaired image dehazing network D4 is adopted to improve the image quality, besides, an image weight sampling strategy is proposed to enhance the training opportunities of small and difficult samples, thereby mitigating the issue of imbalanced ship category distribution. Experimental results demonstrate that the improved S2A-Net algorithm achieves the mean average precision of 77.27% for ship detection in the FAIR1M dataset, which is 5.6% better than the original S2A-Net algorithm, and outperforms the current common object detection algorithms.

Graphical Abstract

1. Introduction

Implementing the accurate extraction of ships in optical remote sensing images finds widespread utility in domains of fishing, maritime search and rescue, maritime traffic management, and combating marine smuggling, and it stands as a prominent research avenue within computer vision. Compared with infrared remote sensing images and synthetic aperture radar (SAR) remote sensing images, optical remote sensing images have richer texture and color information, which aligns more closely with human visual perception and underscores their considerable research potential [1].
Traditional methodologies for ship detection can be categorized into segmentation methods based on gray-scale statistics [2], methods based on frequency domain analysis [3] and methods of local feature extraction [4]. However, such methods usually have poor generalization and tend to be affected by disturbing factors such as complex backgrounds and variable targets. Besides, the computational efficiency of these algorithms is intricately tied to the complexity of their design, which renders it challenging to cater to the recognition requisites of the diverse array of ship targets present within remote sensing images.
In recent years, the continual enhancement of GPU (Graphics Processing Unit) computing power has ushered in significant advancements in data-driven deep learning methodologies, which wield a pronounced advantage in extracting complex features and feature discrimination, bringing new development opportunities for the research of ship detection within remote sensing images. Deep learning-based generic object detection algorithms fall broadly into two-stage and one-stage methods, two-stage methods are represented by the Region-based Convolutional Neural Network (RCNN) series of algorithms [5,6,7,8], which first generate a region of interest (ROI) and then a detection head is used to regress bounding boxes and complete classification; one-stage methods do not require the generation of ROI for classification and regression, so these methods can achieve faster detection speed compared to two-stage methods, with representative algorithms such as YOLO (You Only Look Once) series [9,10,11,12], SSD (Single Shot MultiBox Detector) [13], RetinaNet [14]. Numerous researchers adopted generic object detection algorithms to accomplish the automatic recognition of ships, such as the remote sensing image detection framework proposed in [15] is split into three steps, first, selective search is leveraged to generate region proposals, then using AlexNet or GoogleNet to extract features for classification, and finally, the NMS (Non-Maximum Suppression) method and proposed USB-BBR method are used to obtain the precise location of bounding boxes; Li et al. [16] introduced a hierarchical selective filtering layer (HSF layer) and introduced it into Faster RCNN [7] to extract multi-scale features of ships, realizing the detection of ships in various scenarios and scales.
Compared with natural scenes, ships in remote sensing images exhibit distinct characteristics such as narrow shapes, variable sizes, and dense arrangements. Horizontal detection boxes often fall short in accurately discerning different ship targets. As a result, numerous researchers have endeavored to employ oriented object detection algorithms for conducting detection tasks in remote sensing image scenes, which predicts one more rotation parameter on the basis of the generic object detection algorithm to enable the detection of objects with arbitrary orientations. Figure 1 provides a visual comparison between the detection outcomes achieved by horizontal and oriented boxes.
RRPN [17] generated oriented region proposals by introducing six different rotation angles based on the horizontal anchor boxes of Faster RCNN and introduced Rotation RoI (RRoI) pooling layer to transform region proposals with varying orientations, aspect ratios, and scales into a uniform size. R2CNN [18] is also improved based on Faster RCNN, where the RPN network still generates horizontal region proposals but uses two corner point coordinates and one side length (x1, y1, x2, y2, h) to represent an oriented bounding box. RoI Transformer [19] proposed RRoI learner module for autonomous learning to transform horizontal proposals into oriented proposals, avoiding the memory overhead associated with processing numerous rotated anchor boxes, and then using RRoI Warping to extract rotation invariant features. The two-stage algorithms, while effective, often grapple with time-intensive tasks like region proposal transformation and ROI pooling for feature alignment, which hinders their capacity for efficient and real-time detection. Yang et al. [20] proposed a one-stage algorithm called R3Det, which adopts a coarse-to-fine strategy to obtain the preliminary predicted boxes using horizontal anchor boxes first, and then re-encode the position information of the preliminary boxes to the corresponding feature points through the feature refinement module to achieve feature reconstruction and alignment. Inspired by the coarse-to-fine idea of R3Det, S2A-Net [21] achieves feature alignment by applying alignment convolution to the preliminary predicted boxes, and then obtains rotation-sensitive features and rotation-invariant features by ARF (Active Rotating Filters) [22] and pooling module to perform coordinate regression and classification, respectively. Wang et al. [23] attempted to introduce the large-scale visual model, Vision Transformer, into the field of remote sensing image detection, a new rotated varied-size window attention mechanism was proposed to replace the attention operations in the transformer, which contributes to the creation of more influential remote sensing benchmark models. LSKNet [24] can dynamically adjust its large spatial receptive field, allowing it to better simulate the ranging context information of various objects in remote sensing scenes, thereby achieving accurate recognition of objects of various sizes. Pu et al. [25] proposed an adaptive rotated convolution module, which can adaptively rotate based on the different orientations of objects in the image, enabling the model to have greater flexibility in capturing directional information from multiple oriented objects.
This paper presented an improved S2A-Net algorithm to achieve accurate detection of various ships within optical remote sensing images. Contributions can be summarized below:
(1)
On the basis of origin S2A-Net, pyramid squeeze attention is embedded in order to accentuate salient features within the images, which empowers the network to more effectively discern critical information within input data, thereby substantially bolstering its overall performance.
(2)
The context information module was meticulously devised to augment the network’s proficiency in comprehending contextual intricacies, thereby bolstering the neural network’s task comprehension and enabling it to better handle remote sensing image detection tasks.
(3)
An image weight sampling strategy is proposed, which can improve the training opportunities for small and difficult samples, so as to alleviate the problem of unbalanced distribution of ship categories to a certain extent.
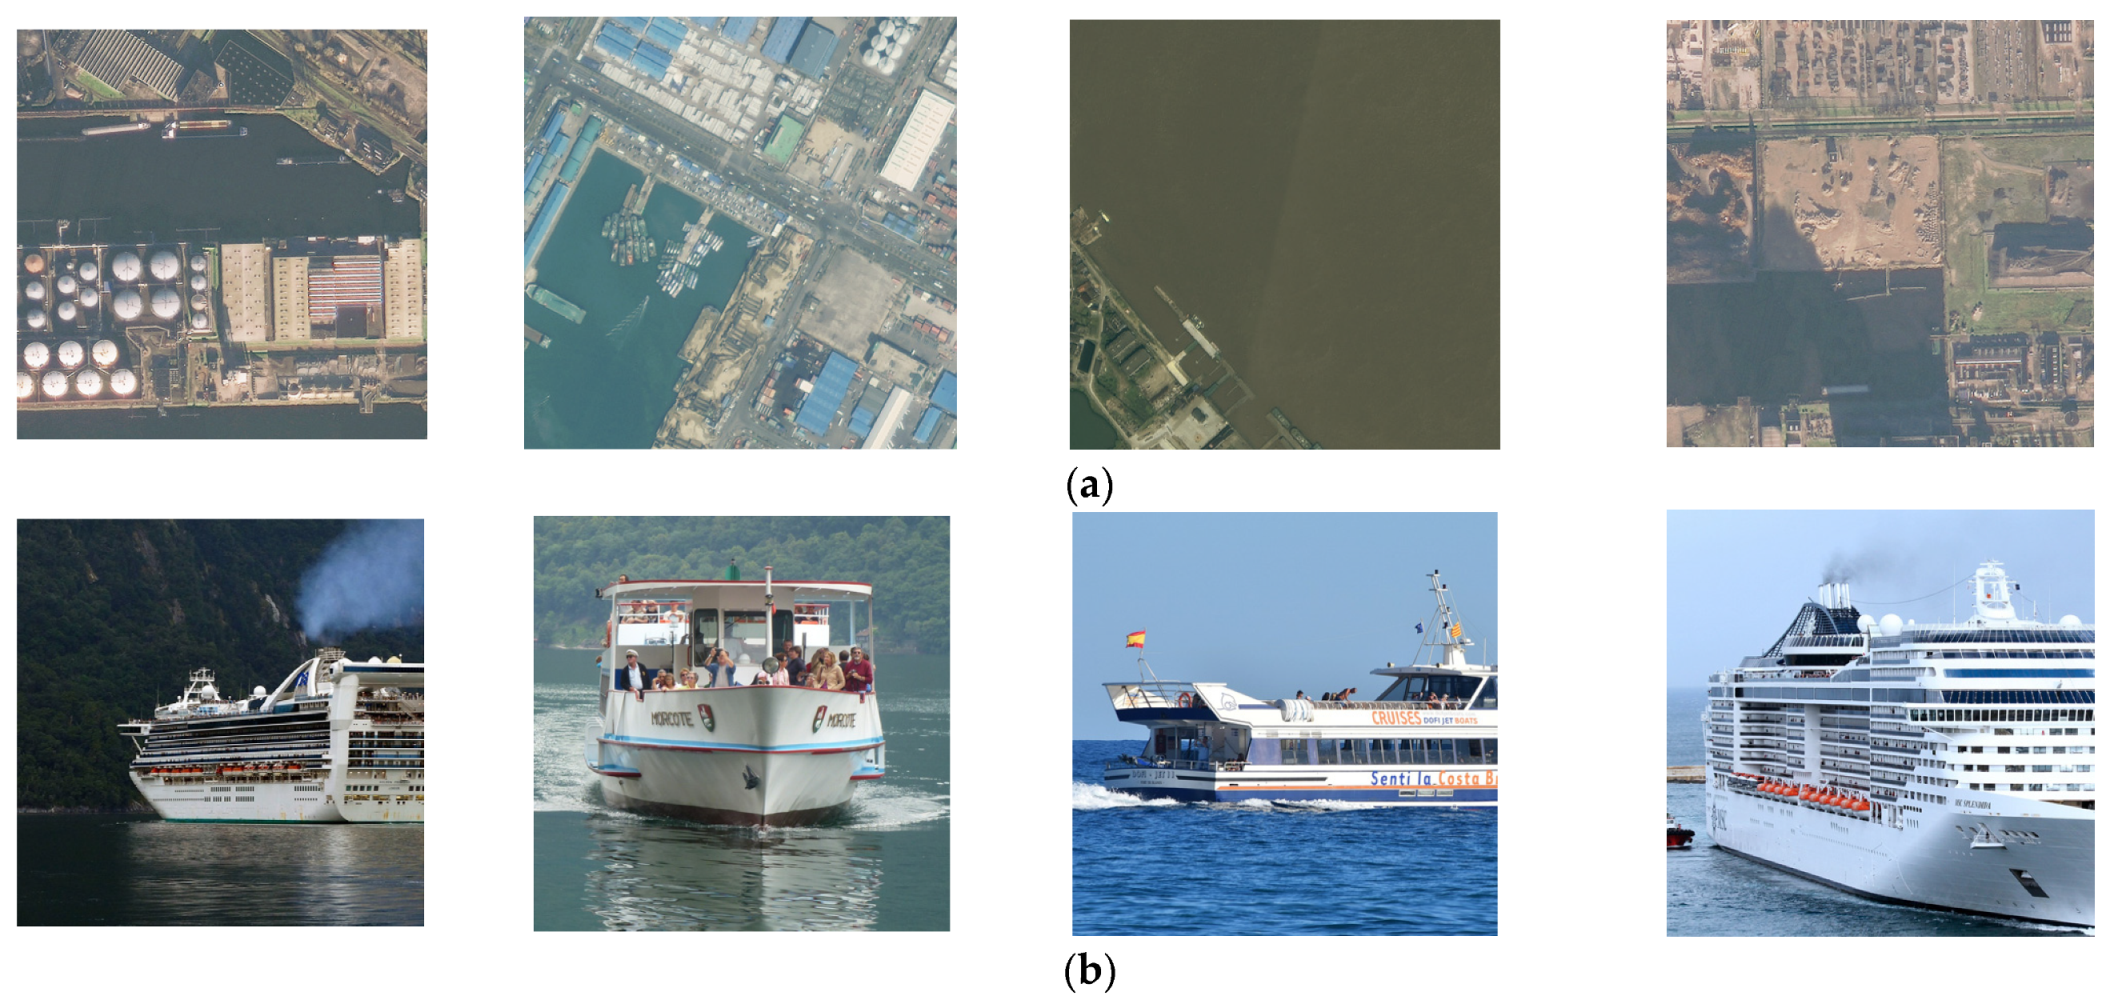
2. Datasets

The FAIR1M dataset [26] serves as an expansive and high-resolution benchmark dataset for optical remote sensing images, it was released by the Chinese Aerospace Information Research Institute, with more than 1 million instances and over 15,000 images, containing various remote sensing images in different scenes, different geographical locations and different time periods. In this paper, the remote sensing ship dataset is derived from the FAIR1M dataset, the targets are labeled in the format of four corner point coordinates, and images of various ships are shown in Figure 2.
Since the resolution of remote sensing images in the FAIR1M dataset can reach several thousand pixels, it is not conducive to fast model training. In this paper, remote sensing images were cut into 800 × 800 to facilitate the training process. Then 6622 images of the training set and 1126 images of the testing set were obtained.
Table 1 provides an enumeration of ship targets across nine distinct categories in the training set. A glance at Table 1 underscores the stark disparities in the distribution of object instances among these nine ship categories, with the largest number of Dry Cargo Ship (Dc) accounting for more than 30%, while the two categories with the smallest number of Passenger Ship (Ps) and Warship (Ws) account for only about 2%.

3. Methodology

3.1. S2A-Net Algorithm

S2A-Net (Single-shot Alignment Network) is an algorithm specifically designed for solving the problem of oriented object detection in remote sensing images. It effectively addresses the misalignment between axis-aligned convolutional features and arbitrarily oriented objects. It achieves high accuracy while maintaining a good detection speed. Moreover, each module of the network exhibits excellent scalability, making it well-suited for the ship detection task in this study. The overall structure of S2A-Net can be seen in Figure 3. Its structure is improved on the basis of RetinaNet, ResNet50 [27] is harnessed as the backbone network, responsible for the extraction of features, then shallow texture features and profound semantic features are fused through a feature pyramid network [28] to obtain a multiscale feature map pyramid, finally the class and bounding box coordinate information of ship target is obtained through detection head.
S2A-Net network realizes lightweight detection by sharing weights between different detection heads. The feature alignment module contains two components: anchor refinement network (ARN) and alignment convolution layer (ACL). ARN sets the parameters for ACL by using two convolution layers to output bounding boxes in the format (x, y, w, h, θ) based on the pre-defined horizontal anchor boxes. Illustration of the bounding box in (x, y, w, h, θ) format is exemplified in Figure 4, where (x, y) denote the coordinates of the center point, w and h indicate the long and short sides of bounding box, θ conveys the orientation between w and horizontal axis, in the range [−(π/4), (3π/4)].
For each position p on the input feature map X, the calculation of ACL can be expressed as:
Y ( p ) = r R ; o O W ( r ) · X ( p + r + o )
where W(r) is the learnable weight, and R is the traversal interval of the convolution kernel with R = {(−1, −1), (−1, 0), …, (0, 1), (1, 1)}. O indicates the offset filed, which can be represented as:
O = { L p r p r } r R
For each rR, the sampling position L p r is calculated as:
L p r = 1 S ( ( x , y ) + 1 k ( w , h ) · r ) R T ( θ )
where (x, y, w, h, θ) indicates the oriented bounding box output from ARN, k denotes the kernel size, S is the stride of ACL, R(θ) = (cosθ, − sinθ; sinθ, cosθ)T is the rotation matrix.
In an oriented detection module (ODM), a technique known as active rotating filters (ARF) is used to encode feature information in different orientations to obtain rotation-sensitive features for coordinate regression of bounding boxes, and rotation-invariant features can be obtained after passing a pooling layer, which proves advantageous in empowering the network to effectively execute classification tasks.

3.2. Improved Network Structure

The holistic architecture of the improved S2A-Net is depicted in Figure 5. Building upon the original S2A-Net method, pyramid squeeze attention (PSA) [29] is embedded between the backbone and FPN, with the aim of extracting more complex shallow and deep features through the attention mechanism before building the pyramid of feature map, and then going through FPN for feature fusion to bolster the efficacy of multi-scale feature extraction. Since in the larger receptive field it is easier to capture small targets, the context information module (CIM) is used in the shallowest path of FPN, which is aimed at amplifying the network’s proficiency in recognizing small targets by directing the network’s attention toward the context information enveloping ships.

3.2.1. Pyramid Squeeze Attention (PSA)

In this paper, pyramid squeeze attention (PSA) is embedded in the origin model, its structure can be seen in Figure 6. The initial step involves subjecting the input feature map to the Squeeze and Concat (SPC) module to yield multi-scale feature maps in the channel direction, then the attention weight vectors corresponding to diverse scale feature maps are obtained by SEWeight module and calibrated by Softmax; finally, the multi-scale feature maps are recalibrated by using these attention weight vectors. The outcome of this process is a concatenated feature map, boasting a wealth of richer multi-scale information, tailored to facilitate the ship detection task.
The SPC module of PSA is used to extract multi-scale information in the input feature map X. The structure is shown in Figure 7. The module uses four parallel convolutions of different kernel sizes to extract feature information under various sizes of receptive fields, K0K3 is the kernel size. Group convolution is used in order to reduce the increased model parameters due to large kernels, G0G3 indicates the number of groups. Finally, the extracted muti-scale feature maps are aggregated in the channel direction and then output.

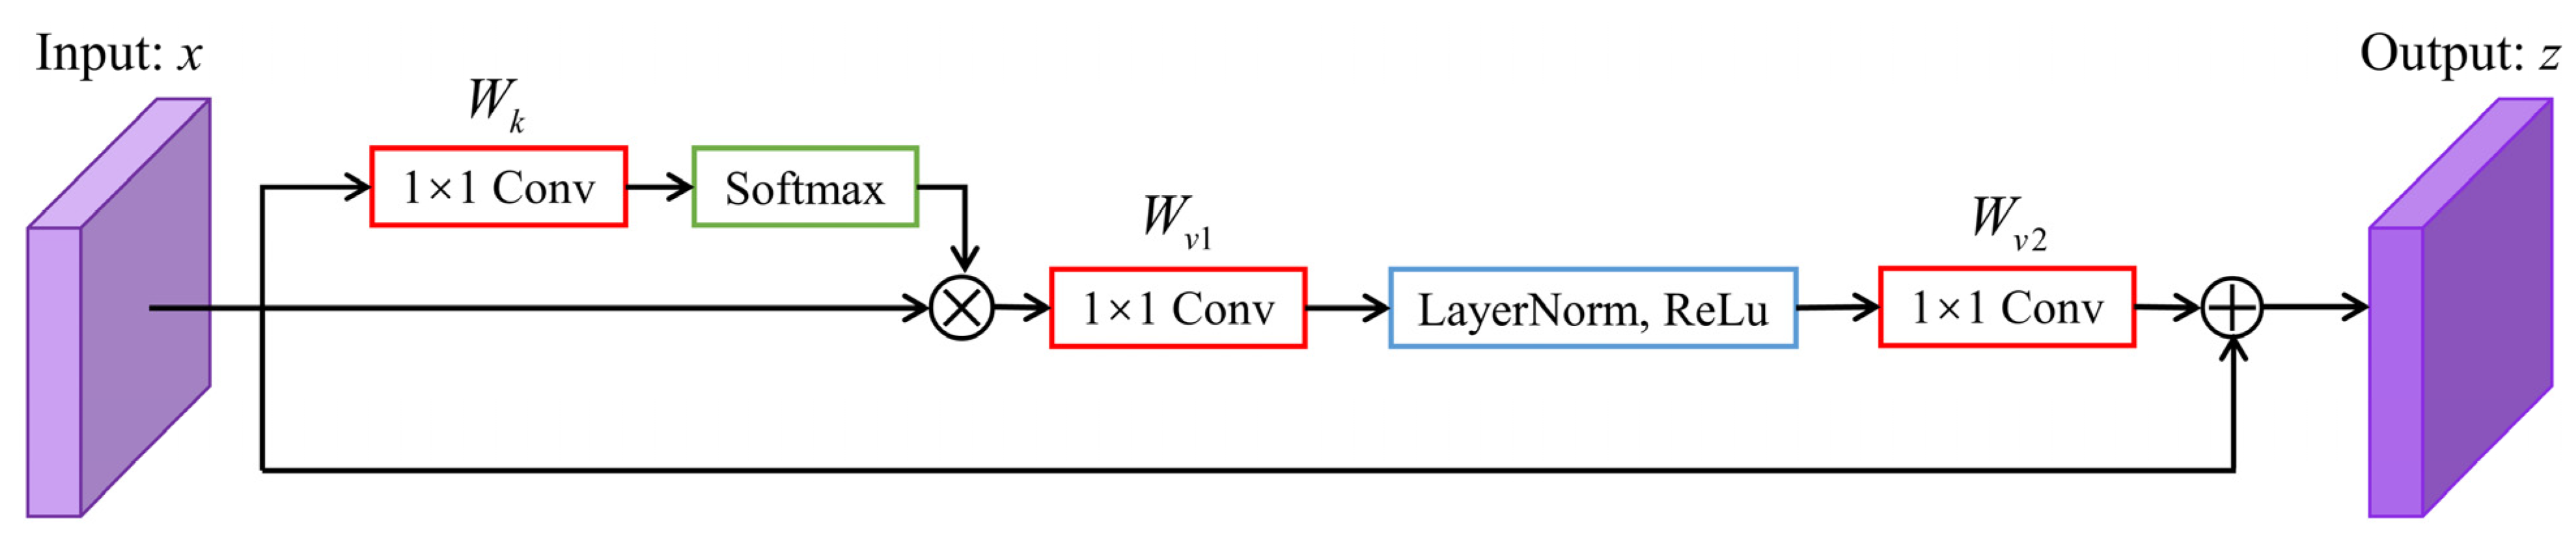
3.2.2. Context Information Module (CIM)

In the object detection task, the target does not exist alone, the surrounding context and other related information can often provide great help for object inference. In order to improve the context understanding of the S2A-Net network, a context information module (CIM) is devised in this study with the structure depicted in Figure 8.
CIM has four parallel branches containing a GC block (Global Context Block) [30] and three dilated convolutions with different rates. The GC block serves the purpose of extracting global context information and capturing long-range dependent features, while the dilated convolution is strategically employed to extract local context information under different sizes of receptive fields. The global context and local context information are summed, yielding an output feature map boasting enhanced context comprehension, which is more helpful for detection in small targets and complex background scenes than normal convolutions.
Dilated convolution involves the insertion of zero elements amidst adjacent positions of the convolution kernel, rate r refers to the count of inserted zero elements. In this paper, dilated convolution is used with r = (1, 3, 5), which can effectively expand the receptive fields, extract the local context information around the feature points, and assist the current feature points for the differentiation of the target class and regression of the bounding box.
Notwithstanding the receptive field expansion facilitated by dilated convolution, the number of sampled points remains unchanged in comparison to normal convolution, so the extracted information is still local context information, which lacks the perception of long-range dependencies. GC block can encapsulate long-range dependencies and model the global context, its structure is visually outlined in Figure 9.
The improvement of GC block over Non-local [31] is that the use of a 1 × 1 convolution (Wk in Figure 9) simplifies the context modeling and all query locations in the input feature map x share a global attention map, significantly reducing the parameter computation. The calculation process can be expressed as:
z i = x i + W v 2 ReLU ( LN ( W v 1 j = 1 N P e W k x j m = 1 N P e W k x m x j ) )
where xi indicates the i-th feature point of the input feature map, zi is the i-th feature point of the output feature map, Np = H × W denotes the total resolution of the input feature map. The calculation first iterates through all feature points xj in the feature map models the global context, captures the dependency among any two points in the feature map, and then adds up the residual structure with the input xi after the feature transformation by 1 × 1 convolution, LayerNorm, etc. The final output feature map captures the dependency between two feature points in the feature map and extracts the global context features, which is helpful for the visual understanding of the object detector.

3.3. Improved Training Strategy

3.3.1. Remote Sensing Image Dehazing

When remote sensing satellite imaging, the dust, particles and water vapor floating in the atmosphere have certain absorption, reflection and even blocking effects on the atmospheric light, so the reflected light from the surface of the ship target will be attenuated when it reaches the imaging equipment, the image quality will be degraded, specifically in terms of contrast reduction, blurring of the target and loss of scene details. The resultant distorted remote sensing image poses challenges for effective feature extraction by convolutional neural networks, ultimately culminating in a loss of detection accuracy. In this research, the remote sensing images are dehazed by the D4 network [32] to restore the image quality, which lays a solid foundation for further ship detection.
The formation of atmospheric scattering can be represented as:
I ( z ) = J ( z ) t ( z ) + A ( 1 t ( z ) )
where I(z) denotes the hazy image, J(z) indicates the clean image, A is the global atmospheric light, t(z) = eβd(z) refers to the transmission map, where β is the scattering coefficient, which can be used to reflect the fog density; d(z) is the scene depth.
D4 is a convolutional neural network based on fog density and depth decomposition, which can be trained without paired images, and is divided into a dehazing-rehazing branch and a hazing-dehazing branch, where the dehazing-rehazing branch is used to complete the transformation of Hazy domain → Clean domain → Hazy domain; the hazing-dehazing branch is used to complete the transformation of Clean domain → Hazy domain → Clean domain. The network structure is vividly depicted in Figure 10.
In the dehazing-rehazing branch, the hazy image H is input into dehazer gD to obtain the predicted transmission map t ^ H and scattering coefficient β ^ H , the calculation of a clear image c ^ can be derived from Equation (5), as shown in Equation (6):
c ^ ( z ) = H ( z ) A ^ t ^ ( z ) + A ^
Depth d ^ H is obtained by depth estimator gE, and then sent to calculate the coarse hazy image H ^ c o a r s e by Equation (7) with β ^ H . Finally, H ^ c o a r s e is processed by refining network gR to obtain the final hazy image H ^ .
H ^ c o a r s e ( z ) = c ^ ( z ) e β ^ H d ^ H ( z ) + A ( 1 e β ^ H d ^ H ( z ) )
In the hazing-dehazing branch, the clean image C is input to depth estimator gE to obtain the depth map d ^ C , and the scattering coefficients βC are randomly sampled from the uniform distribution U(0.6,1.8), coarse hazy image h ^ c o a r s e is obtained according to:
h ^ c o a r s e ( z ) = C ( z ) e β C d ^ C ( z ) + A ( 1 e β C d ^ C ( z ) )
h ^ c o a r s e is refined by the refined network gR to obtain the hazy image h ^ , the transmission map t ^ C and the scattering coefficient β ^ C are obtained by dehazer gD, and finally the clean image C ^ is calculated by Equation (6).

3.3.2. Image Weights Sampling Strategy

In remote sensing image datasets, the distribution of various types of ship targets often presents an inherent imbalance. Categories with a limited count of targets tend to have a diminished probability of being included in the training process. This inherent imbalance consequently exerts a detrimental influence on the overall detection accuracy achieved by neural networks. In this paper, an image weights sampling strategy is adopted to effectively assign a weight to each category based on the number of targets and the category’s AP value. The smaller the number of targets and the lower the AP value, the larger the calculated weights will be. The neural network will improve the training chance of difficult categories by considering the size of each category’s weight during training, thus alleviating the problem of unbalanced category distribution to a certain extent and finally improving the overall recognition accuracy of the model.
The implementation of the image weights sampling strategy unfolds through a two-tiered process: first compute the weights of each ship category, and then calculate the weight of each image based on the frequency of each category appearing in an image. The higher the value of an image’s weight during training, the greater the probability that the image will be sampled.
The category weights are calculated considering the number of targets and the AP value. The weight of the i-th category ci is calculated as:
c i = λ 1 1 N i i 9 1 N i + λ 2 ( 1 AP i ) 2
where Ni refers to the number of targets in the i-th category, APi refers to the Average Precision (AP) value for the i-th class in the current training epoch. The number of targets in each category is taken as the inverse and then normalized to realize that the fewer the number of targets, the higher the weight value, which is in line with the requirement that neural networks should focus on training small samples; the consideration of AP value is reflected in the second term, the closer a category’s AP value is to 1, the closer its weight is to 0, which is in line with the idea that neural networks should focus on hard example mining. λ1 and λ2 are used to balance the size of the two terms.
Based on the frequency of each category appearing in the image, the weight of i-th image imgi can be calculated as shown in Equation (10). where nj denotes the number of occurrences of category j in that image.
i m g i = j = 0 9 c i n j
After completing the calculation of image weights, the probability that the i-th image is sampled at training time Pi is shown in Equation (11), the higher the image weight, the greater the probability that the image is sampled. L is the length of the dataset.
P i = i m g i i L i m g i

4. Results and Discussion

4.1. Evaluation Metric

In the context of object detection tasks, IoU serves as a pivotal metric, assessing the extent of spatial overlap between two bounding boxes. Three distinct metrics can be delineated contingent on whether the IoU between a detection box and its corresponding ground truth box surpasses the threshold value (in this paper it is set to 0.5): TP, FP and FN. TP is the number of IoUs greater than the set threshold value, indicating that the target is correctly identified; FP is the number of IoUs less than the set threshold value, indicating that the detection box fails to predict and FN indicates the number of no detection boxes corresponding to ground truth box. Based on these three metrics, the Precision (p) and Recall (r) can be obtained as:
Precision = T P T P + F P ,   Recall = T P T P + F N
Average Precision (AP) encapsulates the region enclosed between the p-r curve and the coordinate axis, the calculation formula is:
AP = 0 1 p ( r ) d r
The mean Average Precision (mAP) is obtained by averaging the AP of all ship categories, as shown in Equation (14):
mAP = i N AP i N

4.2. Remote Sensing Image Dehazing Experiment

The D4 convolutional neural network can be trained on unpaired image datasets, where the hazy ship dataset is from the FAIR1M dataset and contains real ship targets in various scenes, most of which are more or less hazy. The clean image dataset is from the Boat types recognition dataset of Kaggle [33]. Images of hazy and clean datasets can be seen in Figure 11. The training set contains 5403 hazy images and 1291 clean images, and the testing set contains 1219 hazy images.
The environment used for the experiments is Ubuntu, Intel(R) Xeon(R) Gold 6330 CPU, NVIDIA A40 graphics card with 48 GB memory, CUDA 11.6, cuDNN 8.5, Pytorch 1.12, Python 3.8. The hyperparameters used for the experiments are: learning rate = 0.0001, batch size = 2, input image size = 256 × 256 × 3, Adam optimizer, momentum β1 = 0.9, β2 = 0.999, maximum iterations = 20,000.
The dehazing effect was evaluated using no-reference image quality assessment metrics NIQE (Natural Image Quality Evaluator) [34] and FADE (Fog Aware Density Evaluator) [35], the smaller the metric, the smaller the disparity between the statistical attributes of the evaluated image and a reference natural image, that is, the closer the test image is to clean image, which represents the higher image quality. Table 2 shows the average metric size before and after dehazing in the training set and testing set; an observant analysis of the table reveals that both images in the training set and the testing set show a decrease in NIQE and FADE after dehazing using the D4 network, which indicates that the dehazed images are closer to the natural images.
The effect of remote sensing image dehazing is shown in Figure 12.

4.3. Ablation Study of Ship Detection

The experiment environment for object detection model training is consistent with that described in Section 4.2 of this paper. The hyperparameter settings for training are: the optimizer selects SGD, the initial learning rate is 0.0025, and in the training process a multi-step decay strategy is used to decay the learning rate to 1/10 of the original in 24 and 33 epochs, the batch size is 2, the maximum epochs is set to 50. The results of the ablation experiments are comprehensively presented in Table 3.
As can be seen from Table 3, all four methods used in this paper can lead to the increase in mAP, specifically, the improvement was 1.17%, 1.63%, 0.26%, and 2.54%, respectively. The mAP of the original S2A-Net network is 71.67% and the mAP of the final improved model is 77.27%, the improvement of mAP is 5.6%. Table 4 shows the AP value of nine types of ships before and after improvements, the improved S2A-Net has the most significant improvement in AP for categories of Motorboat (Mb), Fishing boat (Fb), and Other Ship (Os), which are 14.9%, 16.3%, and 16.2%, respectively.
Since the mAP improvement of D4 image dehazing in Table 3 is not obvious, this paper attempted repeating training several times based on the S2A-Net + PSA + CIM network, the results are presented in Table 5. It is proved that after image dehazing using the D4 network, the difference in mAP obtained from multiple repetitions of training experiments is not significant, which can prove the improvement of remote sensing image dehazing for ship object detection.

4.4. Discussions of Model Parameter Setting

To verify the effects of the parameters in PSA, CIM and image weights sampling strategy on the detection accuracy, the following experiments were conducted.

4.4.1. The Setting of the Convolution Kernel Size of PSA

In PSA, the SPC module obtains a multiscale feature map by convolutions of four different sizes. In this section, based on the S2A-Net network, which reaches mAP of 71.67% in the remote sensing ship dataset, the sizes of the convolution kernels of the SPC module are changed to (1, 3, 5, 7), (3, 5, 7, 9) and (5, 7, 9, 11), its effects on mAP can be seen in Table 6, from which we can see that the model lost mAP by 1.51% when choosing (1, 3, 5, 7) as the kernel sizes of SPC module, this decrease may be attributed to the fact that small convolution kernels have a limited receptive field, capturing information only from a local pixel region, and they cannot gather information from pixels far away from the center pixel. Additionally, small convolution kernels are highly sensitive to minor changes in local pixels, which can cause the model to produce excessive responses to noise or small variations, thereby reducing the robustness of contextual information. However, if choosing large kernel sizes: (5, 7, 9, 11), the model showed a recognition decline in Motorboat (Mb), whose ship targets are relatively small. When setting kernel sizes to (3, 5, 7, 9), S2A-Net + PSA achieved the highest mAP, so (3, 5, 7, 9) were selected as the kernel sizes in improved S2A-Net.

4.4.2. CIM Ablation Study

In CIM, the global context information is extracted by GC block and the local context information is extracted using dilated convolution. On the basis of S2A-Net + PSA, Table 7 displays the ablation study of CIM structure. We can see that adding a GC block brings a 0.08% improvement in mAP, and adding dilated convolution of four different kernel sizes improves mAP by 0.4%. When both adding GC block and dilated convolution, the mAP of the improved model reaches 74.47%, which is 1.63% higher than the origin S2A-Net. Experiment results verified the effectiveness of the GC block and dilated convolution for mAP improvement.

4.4.3. The Calculation Form of ci in Image Weights Sampling Strategy

In Equation (9), the category weights ci are calculated considering two factors: the number of targets and AP value, then the two factors are weighted and summed. In this section, three different ci calculation forms are tried with the network structure: S2A-Net+PSA+CIM+D4 network dehazing and the comparison experimental results are presented in Table 8, from which we can see whether the two sub-terms take the form of multiplication or summation, both can bring improvement in mAP, which are 1.58% and 2.35%, respectively, and the summed form has a greater mAP improvement. Further, λ1 and λ2 were used to balance the two sub-terms after carefully adjusting the parameters; it was determined that the model is optimally primed to realize its zenith detection accuracy when λ1 = 0.4, λ2 = 0.6.

4.5. Detection Results and Comparisons

Figure 13 shows the comparison between the detection effect of the improved S2A-Net and the original S2A-Net network. We can see that the original S2A-Net algorithm has missed recognition in detecting both the first and second images, while the improved S2A-Net algorithm successfully completed the detection; the original S2A-Net algorithm has the problem of inaccurate localization in identifying the third image, and the improved S2A-Net algorithm can better complete the object localization.
Figure 14 shows the detection effect of the improved S2A-Net network. Results show that it can perform well in various complex air and sea scenarios.
Several common deep learning models were selected to compare their performance on remote sensing image ship datasets with improved S2A-Net, including generic object detection methods: YOLOv5, Cascade R-CNN, FCOS [36], and ATSS [37] and current oriented object detection methods: GWD [38], KLD [39] and Gliding Vertex [40], the comparison results are shown in Table 9. We can see that among generic object detection methods, YOLOv5 achieved the highest mAP as it performed well in all ship categories. In oriented object detection methods, GWD and KLD because of their poor performance on Passenger Ship (Ps), Motorboat (Mb) and Other Ship (Os), thus resulting in a low overall recognition rate compared with Gliding Vertex. The improved S2A-Net network has significantly surpassed the AP values on the difficult categories like Motorboat (Mb), Fishing boat (Fb) and Other Ship (Os) compared to other networks, achieving a quite excellent mAP value of 77.27%.

5. Conclusions

In this paper, the current research background and related works on remote sensing ship detection are analyzed in detail, a deep learning based oriented object detection method S2A-Net is selected as baseline and then improved, in network structure, pyramid squeeze attention is embedded to engender an elevation in feature extraction proficiency and the neural network’s capacity for generalization, then adding context information module to bestow the network with an enhanced capacity for contextual comprehension; in training strategy, a convolutional neural network D4 based on fog density and depth decomposition is used for remote sensing image dehazing, which improves the image quality, besides, in training process, image weights sampling strategy is adopted to improve the training opportunities of small samples and difficult categories, which serves to alleviate the conundrum of imbalanced category distribution to a notable extent. Experimental results show that the mAP of the improved S2A-Net network is improved by 5.6% compared to baseline and outperforms other common deep learning object detection algorithms. Accurate ship detection is beneficial to various application scenarios such as the localization of dense ships in port, timely warning of suspicious ships, and maritime traffic management, which are important for navigation safety at sea, ocean monitoring, marine resource exploration.

Author Contributions

Conceptualization, J.L. and M.C.; methodology, J.L.; software, M.C. and S.H.; validation, J.L., M.C. and Y.W.; formal analysis, M.C. and S.H.; investigation, J.L. and Y.W.; resources, J.L. and Q.L.; data curation, M.C. and S.H.; writing—original draft preparation, J.L. and M.C.; writing—review and editing, Y.W. and Q.L.; visualization, M.C. and S.H.; supervision, J.L.; project administration, Y.W. and C.W.; funding acquisition, Q.L. and C.W. All authors have read and agreed to the published version of the manuscript.

Funding

This work is partly supported by the National Natural Science Foundation of China (52275524, 62271164 and 51909039), the Major Scientific and Technological Innovation Project of Shandong Province of China (2022ZLGX04, 2021ZLGX05), Shandong Provincial Natural Science Foundation (ZR2020MF017), Chinese Postdoctoral Science Foundation (2020M672123).

Data Availability Statement

All data included in this study are available upon request by contact with the corresponding author.

Acknowledgments

The authors give their appreciations to the support of Key Laboratory of Cross-Domain Synergy and Comprehensive Support for Unmanned Marine Systems, Ministry of Industry and Information Technology, and Shandong Provincial Key Laboratory of Marine Electronic Information and Intelligent Unmanned Systems. The authors would also like to thank anonymous reviewers for their valuable comments on the manuscript.

Conflicts of Interest

The authors declare no conflict of interest.

References

  1. Xu, F.; Liu, J.; Sun, H.; Wang, T.; Wang, X. Research Progress on Vessel Detection Using Optical Remote Sensing Image. Opt. Precis. Eng. 2021, 29, 916–931. [Google Scholar] [CrossRef]
  2. Pegler, K.; Coleman, D.; Zhang, Y.; Pelot, R. The Potential for Using Very High Spatial Resolution Imagery for Marine Search and Rescue Surveillance. Geocarto Int. 2003, 18, 35–39. [Google Scholar] [CrossRef]
  3. Bouma, H.; Dekker, R.; Schoemaker, R.; Mohamoud, A. Segmentation and Wake Removal of Seafaring Vessels in Optical Satellite Images. In Proceedings of the Electro-Optical Remote Sensing, Photonic Technologies, and Applications VII, and Military Applications in Hyperspectral Imaging and High Spatial Resolution Sensing, Dresden, Germany, 15 October 2013. [Google Scholar] [CrossRef]
  4. Arguedas, V. Texture-based Vessel Classifier for Electro-optical Satellite Imagery. In Proceedings of the IEEE International Conference on Image Processing, Quebec, QC, Canada, 27–30 September 2015. [Google Scholar] [CrossRef]
  5. Girshick, R.; Donahue, J.; Darrell, T.; Malik, J. Rich Feature Hierarchies for Accurate Object Detection and Semantic Segmentation. In Proceedings of the IEEE Conference on Computer Vision and Pattern Recognition, Columbus, OH, USA, 23–28 June 2014. [Google Scholar] [CrossRef]
  6. Girshick, R. Fast R-CNN. In Proceedings of the IEEE International Conference on Computer Vision, Santiago, Chile, 7–13 December 2015. [Google Scholar] [CrossRef]
  7. Ren, S.; He, K.; Girshick, R.; Sun, J. Faster R-CNN: Towards Real-time Object Detection with Region Proposal Networks. IEEE Trans. Pattern Anal. Mach. Intell. 2017, 39, 1137–1149. [Google Scholar] [CrossRef] [PubMed]
  8. Cai, Z.; Vasconcelos, N. Cascade R-CNN: Delving into High Quality Object Detection. In Proceedings of the IEEE Conference on Computer Vision and Pattern Recognition, Salt Lake City, UT, USA, 18–23 June 2018. [Google Scholar] [CrossRef]
  9. Redmon, J.; Divvala, S.; Girshick, R.; Farhadi, A. You Only Look Once: Unified, Real-Time Object Detection. In Proceedings of the IEEE Conference on Computer Vision and Pattern Recognition, Las Vegas, NV, USA, 27–30 June 2016. [Google Scholar] [CrossRef]
  10. Redmon, J.; Farhadi, A. YOLO9000: Better, Faster, Stronger. In Proceedings of the IEEE Conference on Computer Vision and Pattern Recognition, Honolulu, HI, USA, 21–26 July 2017. [Google Scholar] [CrossRef]
  11. Redmon, J.; Farhadi, A. Yolov3: An Incremental Improvement. arXiv 2018. [Google Scholar] [CrossRef]
  12. Ge, Z.; Liu, S.; Wang, F.; Li, Z.; Sun, J. Yolox: Exceeding Yolo Series in 2021. arXiv 2021. [Google Scholar] [CrossRef]
  13. Liu, W.; Anguelov, D.; Erhan, D.; Szegedy, C.; Reed, S.; Fu, C.; Berg, A. SSD: Single Shot MultiBox Detector. arXiv 2015. [Google Scholar] [CrossRef]
  14. Lin, T.; Goyal, P.; Girshick, R.; He, K.; Dollar, P. Focal Loss for Dense Object Detection. In Proceedings of the IEEE International Conference on Computer Vision, Venice, Italy, 22–29 October 2017. [Google Scholar] [CrossRef]
  15. Long, Y.; Gong, Y.; Xiao, Z.; Liu, Q. Accurate Object Localization in Remote Sensing Images Based on Convolutional Neural Networks. IEEE Trans. Geosci. Remote Sens. 2017, 55, 2486–2498. [Google Scholar] [CrossRef]
  16. Li, Q.; Mou, L.; Liu, Q.; Wang, Y.; Zhu, X. HSF-Net: Multiscale Deep Feature Embedding for Ship Detection in Optical Remote Sensing Imagery. IEEE Trans. Geosci. Remote Sens. 2018, 56, 7147–7161. [Google Scholar] [CrossRef]
  17. Ma, J.; Shao, W.; Ye, H.; Wang, L.; Wang, H.; Zheng, Y.; Xue, X. Arbitrary-oriented Scene Text Detection via Rotation Proposals. IEEE Trans. Multimed. 2018, 20, 3111–3122. [Google Scholar] [CrossRef]
  18. Jiang, Y.; Zhu, X.; Wang, X.; Yang, S.; Li, W.; Wang, H.; Fu, P.; Luo, Z. R2CNN: Rotational Region CNN for Orientation Robust Scene Text Detection. arXiv 2017. [Google Scholar] [CrossRef]
  19. Ding, J.; Xue, N.; Long, Y.; Xia, G.; Lu, Q. Learning Roi Transformer for Oriented Object Detection in Aerial Images. In Proceedings of the IEEE Conference on Computer Vision and Pattern Recognition, Long Beach, CA, USA, 15–20 June 2019. [Google Scholar] [CrossRef]
  20. Yang, X.; Yan, J.; Feng, Z.; He, T. R3det: Refined Single-stage Detector with Feature Refinement for Rotating Object. In Proceedings of the AAAI Conference on Artificial Intelligence, Online, 2–9 February 2021. [Google Scholar] [CrossRef]
  21. Han, J.; Ding, J.; Li, J.; Xia, G. Align Deep Features for Oriented Object Detection. IEEE Trans. Geosci. Remote Sens. 2022, 60, 5602511. [Google Scholar] [CrossRef]
  22. Zhou, Y.; Ye, Q.; Qiu, Q.; Jiao, J. Oriented Response Networks. In Proceedings of the IEEE Conference on Computer Vision and Pattern Recognition, Honolulu, HI, USA, 21–26 July 2017. [Google Scholar] [CrossRef]
  23. Wang, D.; Zhang, Q.; Xu, Y.; Zhang, J.; Du, B.; Tao, D.; Zhang, L. Advancing Plain Vision Transformer Toward Remote Sensing Foundation Model. IEEE Trans. Geosci. Remote Sens. 2022, 61, 5607315. [Google Scholar] [CrossRef]
  24. Li, Y.; Hou, Q.; Zheng, Z.; Cheng, M.; Yang, J.; Li, X. Large Selective Kernel Network for Remote Sensing Object Detection. arXiv 2023. [Google Scholar] [CrossRef]
  25. Pu, Y.; Wang, Y.; Xia, Z.; Han, Y.; Wang, Y.; Gan, W.; Wang, Z.; Song, S.; Huang, G. Adaptive Rotated Convolution for Rotated Object Detection. arXiv 2023. [Google Scholar] [CrossRef]
  26. Sun, X.; Wang, P.; Yan, Z.; Xu, F.; Wang, R.; Diao, W.; Chen, J.; Li, J.; Feng, Y.; Xu, T.; et al. FAIR1M: A Benchmark Dataset for Fine-grained Object Recognition in High-resolution Remote Sensing Imagery. ISPRS-J. Photogramm. Remote Sens. 2022, 184, 116–130. [Google Scholar] [CrossRef]
  27. He, K.; Zhang, X.; Ren, S.; Sun, J. Deep Residual Learning for Image Recognition. In Proceedings of the IEEE Conference on Computer Vision and Pattern Recognition, Las Vegas, NV, USA, 27–30 June 2016. [Google Scholar] [CrossRef]
  28. Lin, T.; Dollár, P.; Girshick, R.; He, K.; Hariharan, B.; Belongie, S. Feature Pyramid Networks for Object Detection. In Proceedings of the IEEE Conference on Computer Vision and Pattern Recognition, Honolulu, HI, USA, 21–26 July 2017. [Google Scholar] [CrossRef]
  29. Zhang, H.; Zu, K.; Lu, J.; Zou, Y.; Meng, D. EPSANet: An Efficient Pyramid Squeeze Attention Block on Convolutional Neural Network. In Proceedings of the Asian Conference on Computer Vision, Macao, China, 4–8 December 2022. [Google Scholar] [CrossRef]
  30. Cao, Y.; Xu, J.; Lin, S.; Wei, F.; Hu, H. Gcnet: Non-local Networks Meet Squeeze-excitation Networks and Beyond. In Proceedings of the IEEE International Conference on Computer Vision Workshops, Seoul, Republic of Korea, 27–28 October 2019. [Google Scholar] [CrossRef]
  31. Wang, X.; Girshick, R.; Gupta, A.; He, K. Non-local Neural Networks. In Proceedings of the IEEE Conference on Computer Vision and Pattern Recognition, Salt Lake City, UT, USA, 18–23 June 2018. [Google Scholar] [CrossRef]
  32. Yang, Y.; Wang, C.; Liu, R.; Zhang, L.; Guo, X.; Tao, D. Self-augmented Unpaired Image Dehazing via Density and Depth Decomposition. In Proceedings of the IEEE Conference on Computer Vision and Pattern Recognition, New Orleans, LA, USA, 18–24 June 2022. [Google Scholar] [CrossRef]
  33. Boat Types Recognition|Kaggle. Available online: https://www.kaggle.com/datasets/clorichel/boat-types-recognition?resource=download (accessed on 30 April 2023).
  34. Mittal, A.; Soundararajan, R.; Bovik, A. Making a “Completely Blind” Image Quality Analyzer. IEEE Signal Process. Lett. 2013, 20, 209–212. [Google Scholar] [CrossRef]
  35. Choi, L.; You, J.; Bovik, A. Referenceless Prediction of Perceptual Fog Density and Perceptual Image Defogging. IEEE Trans. Image Process 2015, 24, 3888–3901. [Google Scholar] [CrossRef] [PubMed]
  36. Tian, Z.; Shen, C.; Chen, H.; He, T. Fcos: Fully Convolutional One-stage Object Detection. In Proceedings of the IEEE International Conference on Computer Vision, Seoul, Republic of Korea, 27 October–2 November 2019. [Google Scholar] [CrossRef]
  37. Zhang, S.; Chi, C.; Yao, Y.; Lei, Z.; Li, S. Bridging the Gap Between Anchor-based and Anchor-free Detection via Adaptive Training Sample Selection. In Proceedings of the IEEE Conference on Computer Vision and Pattern Recognition, Seattle, WA, USA, 13–19 June 2020. [Google Scholar] [CrossRef]
  38. Yang, X.; Yan, J.; Ming, Q.; Wang, W.; Zhang, X.; Tian, Q. Rethinking Rotated Object Detection with Gaussian Wasserstein Distance Loss. arXiv 2021. [Google Scholar] [CrossRef]
  39. Yang, X.; Yang, X.; Yang, J.; Ming, Q.; Wang, W.; Tian, Q.; Yan, J. Learning High-precision Bounding Box for Rotated Object Detection via Kullback-leibler Divergence. arXiv 2021. [Google Scholar] [CrossRef]
  40. Xu, Y.; Fu, M.; Wang, Q.; Wang, Y.; Chen, K.; Xia, G.; Bai, X. Gliding Vertex on the Horizontal Bounding Box for Multi-oriented Object Detection. IEEE Trans. Pattern Anal. Mach. Intell. 2020, 43, 1452–1459. [Google Scholar] [CrossRef] [PubMed]
Figure 1. Detection results of two kinds of bounding boxes. (a) the detection results of horizontal boxes; (b) the detection results of oriented boxes.
Remotesensing 15 04559 g001
Figure 2. Nine types of ship targets in dataset. (a) Passenger Ship (Ps); (b) Motorboat (Mb); (c) Fishing Boat (Fb); (d) Tugboat (Tb); (e) Engineering Ship (Es); (f) Liquid Cargo Ship (Lc); (g) Dry Cargo Ship (Dc); (h) Warship (Ws); (i) Other Ship (Os).
Remotesensing 15 04559 g002
Figure 3. S2A-Net structure. (a) backbone; (b) feature pyramid network (FPN); (c) feature alignment module (FAM); (d) oriented detection module (ODM).
Remotesensing 15 04559 g003
Figure 4. The regression format of S2A-Net.
Remotesensing 15 04559 g004
Figure 5. The holistic architecture of improved S2A-Net network. PSA is embedded to extract more complex convolution features, CIM is used in the shallowest path of FPN to amplify the network’s proficiency in recognizing small targets.
Remotesensing 15 04559 g005
Figure 6. The structure of pyramid squeeze attention. The numbers (0, 1, 2, 3) in the figure represent the indices of feature maps from four different receptive fields.
Remotesensing 15 04559 g006
Figure 7. The structure of SPC module.
Remotesensing 15 04559 g007
Figure 8. The structure of CIM.
Remotesensing 15 04559 g008
Figure 9. The structure of GC block.
Remotesensing 15 04559 g009
Figure 10. D4 network structure.
Remotesensing 15 04559 g010
Figure 11. Unpaired ship image dataset. (a) hazy ship images; (b) clean ship images.
Remotesensing 15 04559 g011
Figure 12. Remote sensing image dehazing effect. (a) origin hazy images; (b) the dehazed images.
Remotesensing 15 04559 g012
Figure 13. Comparison of the detection effect before and after the improvement of S2A-Net. (a) the detection effect of S2A-Net network; (b) the accurate detection of improved S2A-Net; (c) the distribution of ground truth boxes.
Remotesensing 15 04559 g013
Figure 14. Detection effect of improved S2A-Net network.
Remotesensing 15 04559 g014
Table 1. Number of targets in each category in dataset. Abbreviations are used for the category names in this paper, specifically: Passenger Ship (Ps), Motorboat (Mb), Fishing Boat (Fb), Tugboat (Tb), Engineering Ship (Es), Liquid Cargo Ship (Lc), Dry Cargo Ship (Dc), Warship (Ws), Other Ship (Os).
CategoryPsMbFbTbEsLcDcWsOs
Training setNumber7927434479114721485342810,6277612314
Proportion2.2%22.5%14.5%4.5%4.5%10.4%32.1%2.3%7.0%
Testing setNumber121139310612503006021962101601
Proportion1.9%21.8%16.6%3.9%4.7%9.4%30.7%1.6%9.4%
Table 2. Metrics before and after dehazing of training and testing sets.
Training Set
(before Dehazing)
Training Set
(after Dehazing)
Testing Set
(before Dehazing)
Testing Set
(after Dehazing)
NIQE11.1510.3710.069.15
FADE0.840.450.630.33
Table 3. Ablation study result. “√” refers to the method used in the improved model.
S2A-NetPSACIMD4 Image DehazingImage Weights SamplingmAP/%
71.67
72.84
74.47
74.73
77.27
Table 4. Accuracy of nine types of ships before and after improvements.
PsMbFbTbEsLcDcWsOsmAP/%
S2A-Net63.872.058.376.178.486.887.084.638.071.67
Improved S2A-Net68.386.974.676.680.489.188.676.954.277.27
Table 5. Results of multiple repetition experiments of image dehazing.
PsMbFbTbEsLcDcWsOsmAP/%
First66.873.760.678.982.488.688.185.149.974.89
Second67.773.260.077.784.388.887.983.748.074.60
Third67.873.261.679.185.089.087.882.346.874.73
Table 6. Comparison experiment of kernel size setting in SPC module.
PsMbFbTbEsLcDcWsOsmAP/%
(1, 3, 5, 7)65.767.853.974.374.586.186.983.738.570.16
(5, 7, 9, 11)67.965.857.074.176.986.687.284.442.871.41
(3, 5, 7, 9)63.073.060.776.177.587.587.984.845.172.84
Table 7. Ablation study of CIM structure. “√” refers to the method used in the improved model.
S2A-Net + PSAGC BlockDilated ConvolutionmAP/%
72.84
72.92
73.24
74.47
Table 8. Comparison of experimental results for changing ci computational form.
PsMbFbTbEsLcDcWsOsmAP/%
c i = 1 N i i 9 1 N i ( 1 A P i ) 2 68.985.372.272.179.688.987.976.055.776.31
c i = 1 N i i 9 1 N i + ( 1 A P i ) 2 67.986.573.576.978.188.988.378.155.477.08
c i = 0.4 1 N i i 9 1 N i + 0.6 ( 1 A P i ) 2 68.386.974.676.680.489.188.676.954.277.27
Table 9. Comparison with common deep learning models.
PsMbFbTbEsLcDcWsOsmAP/%
YOLOv562.160.666.570.374.688.687.780.932.669.30
Cascade R-CNN59.750.052.662.767.578.078.667.028.960.50
FCOS40.948.441.658.065.376.675.863.013.953.72
ATSS48.249.944.661.566.479.082.467.415.457.19
GWD35.058.044.465.872.373.376.051.323.155.50
KLD40.862.746.465.471.975.074.956.024.157.44
Gliding Vertex69.774.253.574.178.575.675.551.044.066.25
Improved S2A-Net68.386.974.676.680.489.188.676.954.277.27
Disclaimer/Publisher’s Note: The statements, opinions and data contained in all publications are solely those of the individual author(s) and contributor(s) and not of MDPI and/or the editor(s). MDPI and/or the editor(s) disclaim responsibility for any injury to people or property resulting from any ideas, methods, instructions or products referred to in the content.

