Abstract
Geodetic methods are integral to mapping surface and subsurface objects and phenomena. Modern geodetic technologies such as laser scanning and digital photogrammetry have also become a standard part of the mapping and documentation of cave spaces. In some cases, these technologies cannot accurately capture the measured surface and thus provide reliable data. One such example is the ice with specific surface characteristics in caves with ice deposits. One of the world’s most studied ice caves is the Dobšiná Ice Cave (Slovakia), which has undergone significant changes in the ice-filling area and volume in recent years. To monitor and analyze all these changes properly, we need to know the surface and volume of this ice mass and monitor it regularly. Where modern geodetic methods such as terrestrial laser scanning (TLS) or digital photogrammetry may fail due to the ice’s physical properties, we propose using cross-polarized Structure-from-Motion (SfM) photogrammetry. As a case study, this method was used in a 28 m long ice tunnel in this cave. Two polarizing filters (on the flash as a light source and on the camera lens) were used in 90° rotation to each other to achieve the cross-polarization effect and remove surface reflections. This removed the surface reflections, giving us a compact and accurate point cloud of the entire tunnel. The dense cloud from cross-polarized (CP) photogrammetry is denser and more compact and does not contain as many outliers and noise points when compared to non-cross-polarized (non-CP) photogrammetry. The TLS point cloud covers the entire surface of the tunnel without significant holes; however, the penetration of the beam through the ice makes such a cloud unusable. Only the cloud from CP photogrammetry covers the entire surface of the tunnel densely enough without additional noise. This methodology can then be used in other parts of the cave or other geomorphological applications to suppress reflections so high-quality results for further processing and analysis can be obtained.
1. Introduction
Digital photogrammetry is currently widely used in various geomorphological applications, especially the Structure-from-Motion method, due to its fast processing speed, easy applicability, relatively low cost, and high-quality results if the correct procedures are followed. SfM is used in geomorphological research as in the field of UAV photogrammetry for analyses of larger locations or hard-to-reach places, in locations difficult to move around [1,2,3,4]; and also in the field of close-range digital photogrammetry for geological exploration, stock volume documentation, change monitoring, landslide mapping, and more [5,6,7]. Nowadays, digital photogrammetry is also very well applied in difficult-to-access areas or sites that are difficult to move, where the use of other traditional mapping techniques (TLS, airborne laser scanning, total stations, etc.) is not possible, or their use is not practical in a given case [8,9,10,11].
Digital photogrammetry, in conjunction with UAVs, is also currently being used to monitor the cryosphere, while a general overview of the newest advances is given in [12]. UAV can be suitably utilized for high-resolution glacier monitoring to determine the flow velocity [13] and capture moss beds topography [14], in the field of fluvial ice monitoring to determine surface roughness and estimate ice thickness [15,16], to determine volume changes of ice cliffs from aerial and terrestrial images [17], and in combination with GNSS measurements to determine time kinematics of glaciers [18].
SfM photogrammetry can also be found in various geomorphological applications such as snow monitoring in high mountains from a single camera SfM system [19], long-term monitoring of glaciers [20], documentation of cave environments [21], in combination with TLS [22,23,24], or to stage monitoring of cave floor ice [25]. Utilizing SfM, authors in [26] were even able to document past changes in the glacier from historical images. Other geomorphological applications include terrestrial photogrammetry in the alpine environment for topographic mapping [27], a combination of photogrammetry and other remote sensing techniques for landslide risk determination [28], or monitoring of spatial terrain displacements by a combination of various surveying technologies [29]. For cave surveying, a general overview of these methods is given by [30].
With the frequent use of these technologies, we can gradually encounter locations and objects that require a specific measurement procedure. Such areas include underground spaces, caves, and hard-to-reach steep slopes, but also, for example, objects belonging to the cryosphere. Similarly, we may also encounter types of surfaces and objects that require specific photogrammetric measurement equipment and procedures. This includes, for example, objects with highly reflective surfaces where traditional photogrammetric techniques (SfM) are inappropriate due to the large number of reflections where the image-matching algorithms may fail. Transparent/semi-transparent objects can also be included here, where the use of traditional technologies such as TLS or total stations based on the reflection of the laser signal from the surface (where the laser beam can penetrate and reflect below the real surface, scatters into the environment, or no reflection occurs at all, etc.) may again be impossible.
In photogrammetry, scientific papers dealing with such problematic surfaces were focused on enhancement techniques using cross polarization to document reflective surfaces either in general [31] or for archaeological findings [32,33], to document painting restoration with the detection of changes based on cross polarization [34], or for the 3D reconstruction of highly reflective historical artefacts [35]. However, cross polarization is not widely used in photogrammetry, although it has been known for decades and is well-established in some fields. In the field of 3D reconstruction of geomorphological surfaces and objects from digital photogrammetry, it has so far been little used, while it also has its justification in this field and allows obtaining homogeneously illuminated images and better matching results.
1.1. Area of Interest
Our object of interest was an artificial tunnel approximately 28 m long passing through the ice filling in Dobšiná Ice Cave (Slovakia) (Figure 1 and Figure 2). Dobšiná Ice Cave is known worldwide for its perennial ice fill, which is considered one of the largest ice caves in the world regarding ice volume [36]. It is also unique for its location at a low altitude of 966 m asl (with ice fill in the range of 920–950 m asl), whereas other world-renowned ice caves are located at higher altitudes [36]. In early investigations (the 1880s), the ice volume in the cave was estimated at 125,000 m3. After one of the first measurements of the cave (1964), this estimate was refined to 145,000 m3. The most recent geodetic and geophysical measurements from 1995 indicate a total ice volume of 110,000 m3 and a surface of 9772 m2, a maximum ice thickness of 26.5 m with an average ice thickness of 13 m [36]. However, due to climatic changes in recent years, the cave is experiencing changes in the ice fill, a gradual loss of ice, and thus a loss of precious ice decorations. Additionally, the ice block has its own movement dynamics [36]. For these reasons, long-term climatic measurements and analyses have been conducted in the cave [37], as well as stage measurements of the ice-filling dynamics in recent years [38].
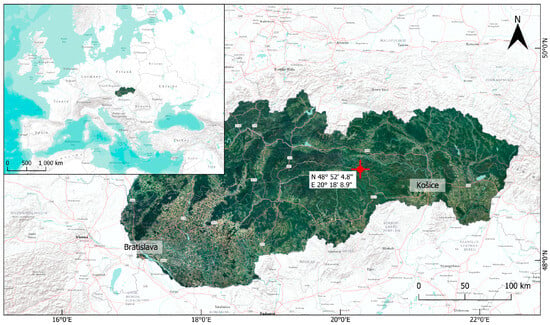
Figure 1.
Location of Dobšiná Ice Cave (Slovakia).
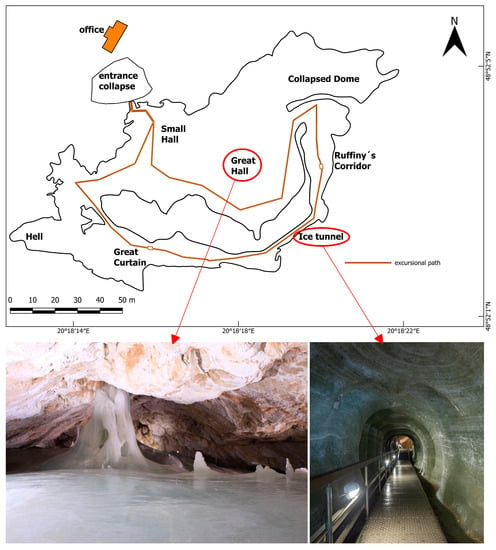
Figure 2.
Dobšiná Ice Cave—ground plan of the glaciated part (top), and ice decoration in Great Hall (left) and artificial ice tunnel (right) (source: authors).
1.2. Aim of the Research
In order to determine the actual total volume and dynamics of ice-filling changes, we need to be able to continuously capture the ice-filling surface with appropriate technologies and methods. The ice mass in the Dobšiná Ice Cave is inhomogeneous and highly variable in terms of surface structure and texture, which is most evident between different parts of the cave, either in terms of horizontal or vertical position. In some parts, the ice layers just below/on the surface also contain other particles (dust, dusty wood, gravel), and the surface itself is thus dull with a variable texture (allowing for easier SfM photogrammetric processing), or there is no penetration of the laser beam below the surface (allowing for easier use of TLS). In some places, the ice itself has these properties, with ice crystals forming on the ice depending on the season and the conditions in the cave. In other places, however, the ice is clear, transparent, or with a smooth surface with no structure. Various examples of ice surfaces are shown in Figure 3:

Figure 3.
Different ice surfaces in the cave (source: authors). (a) smooth, compact ice with deposits in layers; (b) smooth, clear ice with a densely cracked surface; (c) frost formed from crystals of a few mm to cm in size; (d) smooth and transparent ice formed from freshly accreted water.
- Smooth, compact ice with deposits in layers—variable texture with a sufficiently matt surface without reflections;
- Smooth, clear ice with a densely cracked surface—less variable texture with significant reflections;
- Frost formed from crystals of a few mm to cm in size—less variable texture with reflections;
- Smooth and transparent ice formed from freshly accreted water—no texture with strong reflections.
Therefore, the spatial survey of such an ice surface by geodetic methods is challenging and depends on many factors. Some parts of the surface are relatively easy to survey using TLS, a polar method by total station, or digital photogrammetry. In some parts, however, these methods fail. This paper aims to use a measurement methodology in such places that would provide spatial data on the ice fill regardless of the ice structure/texture and allow spatial and temporal monitoring of the dynamics of the ice fill in all parts of the cave in the future.
2. Materials and Methods
Compared to traditional methods of cave surveying [39], current geodetic technologies provide a much wider range of methods and instruments, from classical speleological methods [40,41], through surveying technologies such as digital tacheometry, terrestrial laser scanning, digital photogrammetry, and Simultaneous Localization And Mapping (SLAM) [22,25,42,43,44], to geophysical methods such as microgravimetry, seismometry, or ground penetrating radar [45,46]. All of these technologies have different applicability and suitability and provide different results.
For the 3D modelling of specific structures in ice caves, as an artificial ice tunnel, we used the following non-contact surveying technologies:
- Terrestrial laser scanning.
- Structure-from-Motion photogrammetry:
- With cross polarization;
- Without cross polarization.
2.1. Structure-from-Motion Photogrammetry
Structure-from-Motion photogrammetry is a well-known and established photogrammetric procedure of automated image processing, initially based on visual perception and computer vision. It can be understood as a reconstruction of a spatial structure from a sequence of 2D digital images from a moving recording medium/camera around the given structure [47,48,49]; and others). However, in order to obtain and guarantee accurate results, one needs to understand and employ the fundamental steps of photogrammetric processing—camera calibration, camera pose estimation, image matching, dense point cloud creation, use of ground control points and checkpoints, etc. [50,51,52,53].
2.2. Cross Polarization
The light from a normal source is actually a mixture of lights of different polarizations and does not oscillate in any significant direction. Such light, natural light, is unpolarized. Light, in which the vector of electric field strength oscillates perpendicular to the direction of advance in a single plane, is linearly polarized. Since the human eye is not sensitive to polarization, suitable equipment is necessary to observe the polarization phenomena. A polarizer is a special material that transmits only light of a certain polarization. This means that if one looks at a light source through a polarizer, less light reaches the eye than if not using a polarizer. A polarizer, therefore, filters light, which is why it is also referred to as a polarizing filter. However, as soon as a polarizer is put in the light’s path, the light behind it is already polarized. It would seem that the polarizer merely picks out the light that oscillates in the right direction and absorbs all the rest. However, if we put another (same) polarizer in the way (just rotated differently), some light would still come through. The amount of light that passes through depends on the rotation of the second polarizer or on the angle of rotation of the second polarizer relative to the first [54,55].
The effect of cross polarization in our study when using two polarizing filters is shown in Figure 4. Two polarizing filters are placed with a 90° rotation so that none of the light incidents on the first filter pass through the second.
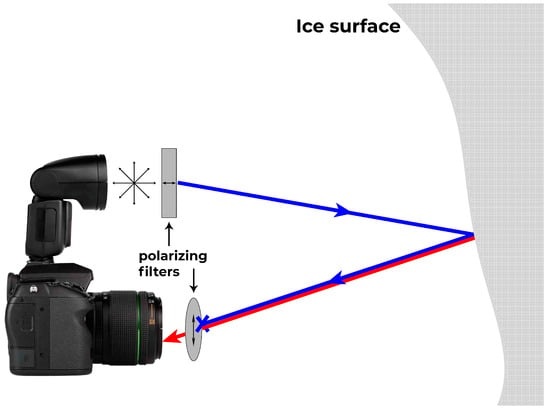
Figure 4.
DSLR camera with flash and polarizing filter setup for imaging. Blue represents polarized incident light; red reflecting light with altered polarization (after [31]).
2.3. Cross-Polarized and Non-Cross-Polarized Photogrammetric Imaging
Polarization filters add optical components to the sensor system, so verifying the standard photogrammetry camera model is necessary. The authors of [56] have shown that a polarizing filter does not significantly affect the overall accuracy; for the same setup with and without a filter is quite similar. For this reason, polarization filters are applicable to the standard photogrammetric camera model and bundle adjustment. They state that the polarizing filter mainly affects the principal distance and the principal point. However, a conventional photogrammetric camera model can still describe these variations. Therefore, it is also applicable to our object of interest.
The selected object of interest, approximately 28 m long ice tunnel (Figure 2), is located in a narrow space with limited access (requiring movement only on an unstable tourist path walkway) and with limited illumination using only several artificial spotlights. The given object was selected due to its problematic illumination, variable surface texture, and excessive surface reflections given by the ice properties. Due to these conditions, other methods such as TLS or basic SfM photogrammetry fail. Therefore, we used the cross-polarized (CP) SfM photogrammetry. The basic concept of the used CP SfM photogrammetry is shown in Figure 4. We used a polarizing filter firmly placed in front of the camera flash and another filter mounted on the camera lens. The fundamental requirement to obtain the CP effect is that the circular polarizer must be rotated at 90° with respect to the sheet on the flash.
The imaging itself was carried out from a tripod using a 12 s self-timer. Since the tripod had to be placed on metal plates of the tourist path walkway, which were unstable, imaging was time consuming. All images were captured by a digital APS-C DSLR camera Pentax K-5 with the lens Pentax SMC DA 15 mm f/4 ED AL Limited (see Table 1) using the aperture priority mode, ISO 200, aperture f/10, and RAW format with subsequent conversion to 12-bit TIFF. A total of 110 images were captured. Detailed parameters of imaging are given in Section 3.1.

Table 1.
Parameters of DSLR camera and polarizing filter.
All images were captured with these settings in two modes: one with the cross-polarization setup and the second without. In this way, we obtained two sets of images from the same camera stations but with different illumination and without/with reflections.
2.4. Georeferencing
For the later comparison and analysis of results, the project was georeferenced bundle adjustment with ground control points (GCP) and checkpoints (ChP) in the form of 12-bit coded targets of A4 size paper. There was no possibility of using any standard geodetic monumentation of these targets. Therefore, we decided to place them directly on the ice surface by light melting of the surface by hand movement and then firmly placing the paper onto the ice (Figure 5). After a short while, the melted ice freezes again, fastening the paper on the surface.
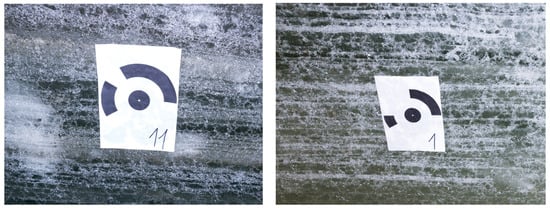
Figure 5.
An example of a target monumentation on the ice surface.
In total, 15 targets were used, with the goal of as even a distribution as possible. Nine of the fifteen targets were used as GCPs and six as ChPs. The configuration and the location of the targets are shown in Section 3.1. The position of the targets was surveyed by the spatial polar method using total station Leica TS15. The internal accuracy was calculated as a priori mean error of measurement for the furthest measured points from the survey station, expressed by the mean positional error mp ≤ 10 mm and mean vertical error mh ≤ 10 mm. The survey was referenced to the geodetic control monumented in the cave, connected to the national coordinate system [57].
2.5. Image Processing
For image processing, the Agisoft MetaShape® Professional Edition, Version 1.6.0 software (Agisoft LLC, St. Petersburg, Russia, 2019) for the photogrammetric processing of digital images and creation of 3D spatial data was used. Within the processing, we used the following MetaShape settings (Table 2). The initial image alignment was carried out with high accuracy and a tie point limit of 0, with subsequent gradual filtering of the sparse point cloud (for details, see Table 2). After each step of image filtering, the optimization of camera alignment (a full bundle adjustment procedure on the aligned photogrammetric block) was performed. A dense point cloud was generated with the option to calculate point confidence for further filtering.

Table 2.
Settings used for image processing in Agisoft MetaShape software.
2.6. Other Surveying Methods—Terrestrial Laser Scanning
The whole glaciated part of the cave, also available to tourists, was surveyed by terrestrial laser scanning (TLS). TLS was realized by a pulse laser scanner Leica ScanStation C10, with Leica HDS targets for scan registration. With the spatial resolution of 30 × 30 mm in the final point cloud, more than 85 million points were recorded. The scanning was conducted from 30 survey stations, with the accuracy of a single measurement in the position of 6 mm and in a distance of 4 mm. The ice tunnel was covered by scanning from 3 scanning stations. Registration of individual scans was conducted directly in the scanner during the scanning using the Leica HDS targets. A correct georeferencing of the scanning was ensured by total station surveying of HDS targets connecting it to the geodetic control monumented in the cave. The final workflow of the overall surveying works is given in Figure 6.
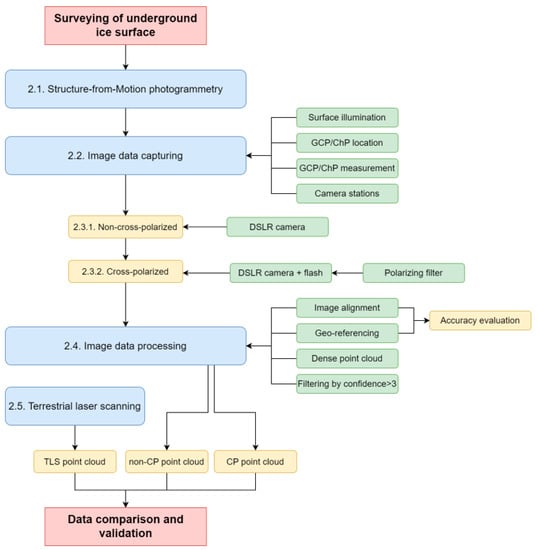
Figure 6.
General processing workflow.
3. Results
The results can be divided into photogrammetric and TLS results. Within photogrammetry, results can be considered as non-CP and CP SfM photogrammetry.
3.1. Non-CP and CP SfM Photogrammetry
Of the total of 110 images, all were successfully aligned during the image processing. The average imaging distance of 2 m was achieved for both sets of images, with the ground sampling distance (GSD) of 0.9 mm/pix. For both sets of images, nine GCPs and six ChPs were used, with the accuracy in the reference system being 10 times better for CP photogrammetry. After filtering dense cloud by the number of points with confidence >3, only 4.5% of points remained for non-CP photogrammetry and 51% remained for CP photogrammetry. Detailed parameters of image processing with and without polarization are given in Table 3.

Table 3.
Parameters of imaging and image processing for data sets with non-CP and CP images.
The final results from both sets of images were two dense point clouds (Figure 7), with GCPs error estimates from CP photogrammetry in Figure 8. As can be seen, the non-CP photogrammetry dense cloud has a significantly lower quality with a large number of empty areas, which then also leads to a lower quality of the subsequently created 3D mesh model or other point cloud analysis.
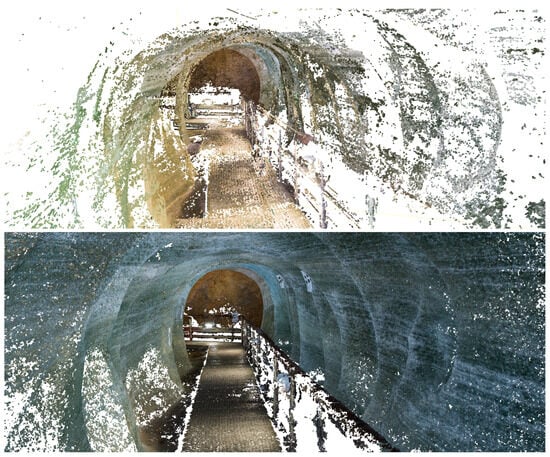
Figure 7.
Dense point cloud after filtering by confidence >3; top–non-CP photogrammetry; bottom–CP photogrammetry.
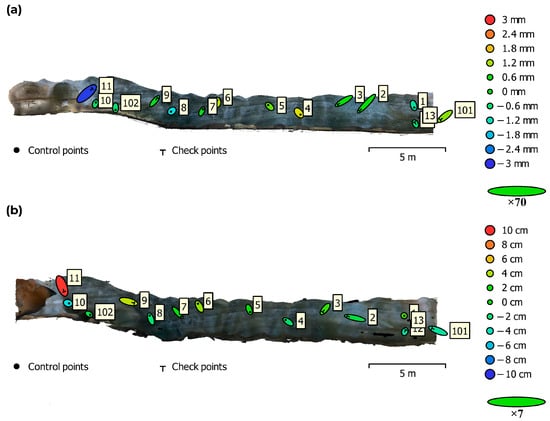
Figure 8.
Error estimates of GCPs from CP (a) and non-CP (b) photogrammetry in Agisoft MetaShape software—a side view of the tunnel. Z error is represented by ellipse colour, and X,Y errors by ellipse shape.
3.2. Terrestrial Laser Scanning
The object of interest, the ice tunnel, was cut from the resulting TLS point cloud, containing approximately 6 million points. Within TLS, the scanner camera was not used for the photo-texturing of individual points (due to the bad illumination in the cave); therefore, the point cloud contained only the laser beam reflectivity information (in addition to the spatial coordinates). TLS was also referenced to the geodetic control monumented in the cave, connected to the national coordinate system. The final TLS point cloud of the tunnel is displayed in Figure 9.
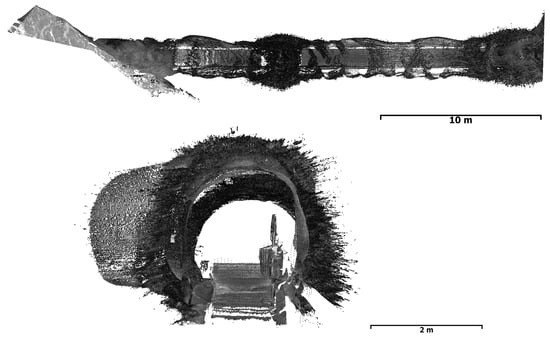
Figure 9.
TLS point cloud of the tunnel from the top and through the tunnel.
However, when applying terrestrial laser scanning, it is also necessary to consider the type of scanner/scanning system and the scanning data it can provide. For Leica ScanStation C10 used in this research, it follows that we can only obtain coordinates of one reflection of the laser beam. Depending on the scanning system, it is possible to obtain coordinates of multiple reflections and filter only the first reflection of the laser beam. This can lead to better results and less noisy point clouds.
4. Discussion
The spatial survey is an integral part of the mapping and documentation of cave systems. Traditional geodetic methods are nowadays well established and commonly used [39,40,41], but they do not always allow a sufficiently accurate capture of cave spaces or are time consuming. Therefore, in recent years, technologies such as TLS and digital photogrammetry have also come to the fore in the field of cave mapping, allowing the surveying of even larger cave systems with high detail and accuracy in a short time [22,23,25,58,59].
Ice caves worldwide have also long been the subject of spatial surveying by geodetic methods, in particular TLS [44,60,61,62], but also by SfM photogrammetry [22,43]. However, in parallel with spatial surveys in these caves, spatio-temporal monitoring of the ice fill is often carried out [63,64,65,66].
In some cases, however, these technologies also fail. For example, in ice caves, the structure and texture of the ice can cause problems in capturing the progression of the ice surface, resulting in data with significant noise or areas with no data.
Dobšiná Ice Cave is a typical example where TLS was used to obtain an overall model of the cave, and digital photogrammetry was used for a more detailed modelling of selected sites for the purpose of the long-term monitoring of ice-filling dynamics [38,67]. However, in some parts of the cave, these technologies also failed, and their results were not applicable (Figure 7), especially in the tunnel cut in the ice filling. As can be seen in Figure 9, Figure 10 and Figure 11, individual results imply the following. The laser scanning beam penetrates well below the ice surface, in some places up to 70 cm (Figure 11). On the other hand, using conventional SfM photogrammetry, although the resulting point cloud is free of such outliers (Figure 11), the significant reflections of artificial illumination from the ice made the point cloud very sparse with many empty spots and near-surface noise (Figure 9).
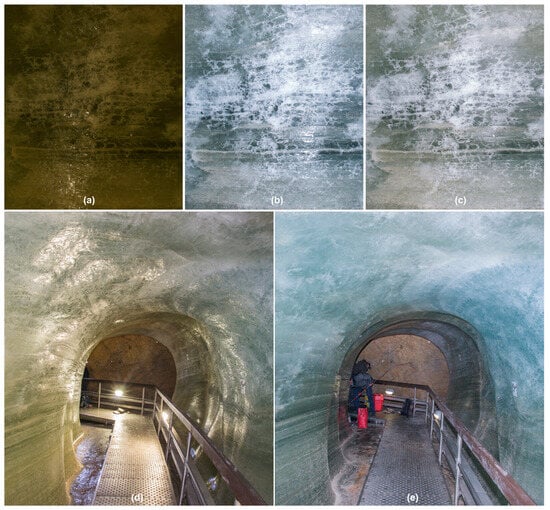
Figure 10.
Effect of cross polarization on ice surface reflections: (a) artificial electric illumination, (b) flash with no polarization, (c) flash with cross polarization, (d) a typical image without CP effect, (e) the effect of cross polarization on reflections.
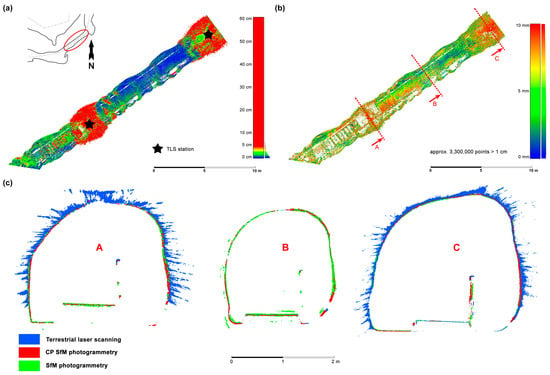
Figure 11.
Comparison of the resulting point clouds by difference models (a,b) and vertical cross sections A, B, C (c).
For these reasons, we proposed using cross-polarized photogrammetry, by which we could filter out unwanted reflections and thus obtain a compact, dense point cloud covering the shape of the tunnel without significant noise. The following Figure 11 shows detailed images with various ice surface textures and reflections, depending on the method of illumination. It can be clearly seen that when using only artificial illumination in the cave (a), images are very sensitive to proper exposure, the texture of the ice is fading away, and the ice creates reflections. On the other hand, when using the mounted camera flash with no polarization (b), the texture and exposure are better; however, reflections are still present. Finally, by using flash with cross polarization (c), we can obtain a clear, sharp texture of the ice with no reflections from other light sources.
At the bottom, changes in illumination and reflections from the ice are visible in the overall image of the tunnel without polarization (d) and with polarization (e).
The point cloud obtained from CP SfM photogrammetry is denser and more compact than that from non-CP photogrammetry and does not contain as many outliers and noise points. The difference in the quality of the photogrammetric processing is also visible in the statistical parameters. Although the number of points in the dense cloud is comparable, after filtering out points with confidence <3, only 4.5% and 51% of the points remained for non-CP SfM and CP SfM, respectively. Accuracy in the reference system is also significantly better in favour of the CP SfM with 3 mm compared to 36 mm.
A difference model between the TLS and CP SfM point cloud was created in CloudCompare 2.16 software using the Compute Cloud/Cloud Distance function to obtain a robust evaluation and comparison of results. Figure 11a shows a difference model with a maximum distance of points in the TLS cloud from points in the CP SfM cloud of 60 cm. However, the highest differences occurred around the survey stations from which the TLS was performed—the laser beam was incident on the surface at a greater angle, so the penetration under the surface was higher, and reflection and scattering from the surface were lower.
When the difference model was filtered by the maximum distance of 1 cm to obtain a better visual representation (Figure 11b), approximately 3,300,000 points were filtered out (55% of the TLS cloud, mainly around the TLS stations). All remaining differences of points are almost evenly distributed; the overall noise of the TLS cloud, when compared to the CP SfM cloud, is up to 10 mm.
When comparing the resulting point clouds from TLS, CP SfM and non-CP SfM using three vertical cross sections (Figure 11c; A—through a scanning station, B—between scanning stations, C—through a scanning station), the differences using these technologies are clearly visible. Although the TLS point cloud covers the entire surface of the tunnel without significant holes, the penetration of the beam through the ice makes such a cloud unusable. Although the cloud from non-CP photogrammetry is not as noisy, most of the surface is without any points, making such a cloud unusable as well. Only the cloud from CP photogrammetry covers the entire surface of the tunnel densely enough without additional noise.
Regarding the subsequent processing of point clouds to obtain 3D mesh models from photogrammetry point clouds, both data sets were used to generate a 3D model. However, Figure 12 clearly shows that the 3D mesh model from the non-CP point cloud (left) is too noisy, with holes, and thus unusable. Then, the 3D mesh model from the CP point cloud (right) forms a homogenous and closed surface, which is appropriate for potential further processing/analysis.
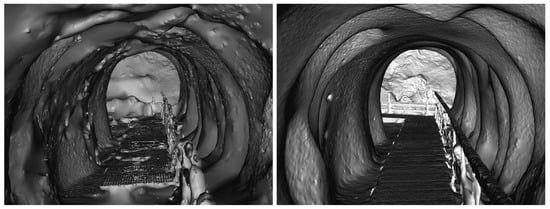
Figure 12.
A perspective view through the mesh model of the ice tunnel; (left)—non-CP photogrammetry, (right)—CP photogrammetry.
It follows from the above that the use of cross polarization in SfM photogrammetry can successfully suppress reflections, and we can thus obtain reliable and accurate results. Moreover, it is achievable without increased time or financial demands, even for such reflective surfaces in such challenging environments. Based on this procedure, it is possible to carry out a regular stage survey of these parts of the cave and perform multi-temporal analyses of ice-filling dynamics. These multi-temporal results can then be used, including climate data from the cave, to model the future behaviour of the ice in the cave.
5. Future Work
Future work in spatial surveying of this cave, particularly of such challenging ice surfaces, will focus on using other alternative approaches in TLS and SfM photogrammetry technologies. As previously mentioned, the Leica ScanStation C10 laser scanner provides a point cloud from each individual laser beam reflection. Better results could be obtained by using a newer scanner (such as Leica RTC360) that allows noise filtering (ambiguous points, mixed pixels, etc.) in the data processing. Another option is to use scanners with other wavelengths of the laser signal or scanners from other manufacturers (Riegl, Faro Focus) that allow working with the raw scan data, analyzing and filtering it according to different criteria.
Another point for a photogrammetric survey is the illumination. Since there is only artificial illumination in the cave, we can use different types of light sources (which is not so easy to implement due to the fixed location of the actual lighting and limited sources of electricity). However, different types of illumination can be considered. For instance, polarizing filters on all light sources, camera flash with a polarizing filter as the only light source, or light sources with more diffused illumination.
6. Conclusions
In photogrammetric applications using digital images (Structure-from-Motion, dense stereo matching, etc.), reflections and flares of light from surfaces can lead to incorrect measurements, errors in image matching, and thus gross errors in the resulting point cloud. Cross polarization in the form of polarizing filters mounted on the light source and the camera lens can be used to overcome this problem and eliminate distracting reflections. This leads to homogeneous illumination in the images, resulting in better quality image matching and generating dense point clouds without gross errors, noise, or areas without points.
Polarizing filters are widely used in common and professional photography, as they allow us to obtain photos with more vivid colours, higher saturation, and without reflections from reflective surfaces. In photogrammetry, they are mainly used in the digital reconstruction of historical artefacts and works of art. So far, however, cross polarization has found only very little application in photogrammetric measurement and imaging of specific surfaces in geomorphology.
This paper aimed to demonstrate the use of cross polarization in photogrammetry and in geomorphological applications, where specific surfaces producing significant reflections may also occur, making the use of classical photogrammetric imaging impossible. One such example is the surface of ice filling in underground spaces, which can be challenging to survey spatially. Due to the physical properties of the ice and its surface, traditional technologies such as tacheometry, TLS, or digital photogrammetry fail here, as demonstrated by the artificial tunnel in the ice filling in Dobšiná Ice Cave. However, results from cross-polarized photogrammetry show that such an approach is able to produce images suitable for photogrammetric processing and thus obtain a sufficiently accurate and high-quality 3D model. By combining these technologies, it is then possible to obtain an overall model of the glaciated parts of the cave, which can be used for the regular monitoring of the dynamics of ice-filling changes, providing data for further analysis to better understand the impact of climate change on underground glaciers and their protection.
Author Contributions
Conceptualization, J.G. and P.B.; methodology, K.B. and K.P.; software, Ľ.K.; validation, J.G. and P.B.; formal analysis, K.B.; investigation, K.B., K.P., Ľ.K. and J.G.; resources, K.P. and P.B.; data curation, K.P.; writing—original draft preparation, K.B.; writing—review and editing, K.B. and K.P.; visualization, K.B.; supervision, P.B.; project administration, K.P.; funding acquisition, K.P. All authors have read and agreed to the published version of the manuscript.
Funding
The study is the result of the Grant Project of the Ministry of Education of the Slovak Republic KEGA No. 003TUKE-4/2023 and VEGA No.1/0340/22.
Data Availability Statement
The raw data supporting the conclusions of this article will be made available by the authors, without undue reservation.
Acknowledgments
We would like to thank Ľubomír Očkaik, the Dobšiná Ice Cave. Many thanks to the reviewers and the editor for their useful comments and suggestions.
Conflicts of Interest
The authors declare no conflict of interest. The funders had no role in the design of the study; in the collection, analyses, or interpretation of data; in the writing of the manuscript; or in the decision to publish the results.
References
- Salach, A.; Bakuła, K.; Pilarska, M.; Ostrowski, W.; Górski, K.; Kurczyński, Z. Accuracy assessment of point clouds from Lidar and dense image matching acquired using the UAV platform for DTM creation. ISPRS Int. J. Geo Inf. 2018, 7, 342. [Google Scholar] [CrossRef]
- Šedina, J.; Hůlková, M.; Pavelka, K.; Pavelka, J.K. RPAS for documentation of Nazca aqueducts. Eur. J. Remote Sens. 2018, 52, 174–181. [Google Scholar] [CrossRef]
- Urban, R.; Štroner, M.; Blistan, P.; Kovanič, Ľ.; Patera, M.; Jacko, S.; Ďuriška, I.; Kelemen, M.; Szabo, S. The suitability of UAS for mass movement monitoring caused by torrential rainfall—A study on the talus cones in the alpine terrain in high tatras, Slovakia. ISPRS Int. J. Geo Inf. 2019, 8, 317. [Google Scholar] [CrossRef]
- Pavelka, K.; Šedina, J.; Pavelka, K. Knud Rasmussen Glacier Status Analysis based on historical data and moving detection using RPAS. Appl. Sci. 2021, 11, 754. [Google Scholar] [CrossRef]
- Moudrý, V.; Urban, R.; Štroner, M.; Komárek, J.; Brouček, J.; Prošek, J. Comparison of a commercial and home-assembled fixed-wing UAV for terrain mapping of a post-mining site under leaf-off conditions. Int. J. Remote Sens. 2018, 40, 555–572. [Google Scholar] [CrossRef]
- Giordan, D.; Hayakawa, Y.; Nex, F.; Remondino, F.; Tarolli, P. Review article: The use of remotely piloted aircraft systems (RPASs) for natural hazards monitoring and management. Nat. Hazards Earth Syst. Sci. 2018, 18, 1079–1096. [Google Scholar] [CrossRef]
- Fraštia, M.; Liščák, P.; Žilka, A.; Pauditš, P.; Bobáľ, P.; Hronček, S.; Sipina, S.; Ihring, P.; Marčiš, M. Mapping of debris flows by the morphometric analysis of DTM: A case study of the Vrátna dolina Valley, Slovakia. Geogr. J. 2019, 71, 101–120. [Google Scholar] [CrossRef]
- Fraštia, M.; Plakinger, M.; Beck, J. Photogrammetric observation of deformation of the vertical mining shaft. Acta Montan. Slovaca 2011, 16, 276–286. [Google Scholar]
- Bakuła, K.; Ostrowski, W.; Szender, M.; Plutecki, W.; Salach, A.; Górski, K. Possibilities for using LIDAR and photogrammetric data obtained with an unmanned aerial vehicle for Levee Monitoring. ISPRS Int. Arch. Photogramm. Remote Sens. Spat. Inf. Sci. 2016, 41, 773–780. [Google Scholar] [CrossRef]
- Kurczynski, Z.; Bakuła, K.; Karabin, M.; Kowalczyk, M.; Markiewicz, J.S.; Ostrowski, W.; Podlasiak, P.; Zawieska, D. The possibility of using images obtained from the UAS in cadastral works. ISPRS Int. Arch. Photogramm. Remote Sens. Spat. Inf. Sci. 2016, 41, 909–915. [Google Scholar] [CrossRef]
- Hemmelder, S.; Marra, W.; Markies, H.; De Jong, S.M. Monitoring river morphology & bank erosion using UAV imagery—A case study of the river Buëch, Hautes-Alpes, France. Int. J. Appl. Earth Obs. Geoinf. 2018, 73, 428–437. [Google Scholar] [CrossRef]
- Gaffey, C.; Bhardwaj, A. Applications of unmanned aerial vehicles in cryosphere: Latest advances and prospects. Remote Sens. 2020, 12, 948. [Google Scholar] [CrossRef]
- Karimi, N.; Sheshangosht, S.; Roozbahani, R. High-resolution monitoring of debris-covered glacier mass budget and flow velocity using repeated UAV photogrammetry in Iran. Geomorphology 2021, 389, 107855. [Google Scholar] [CrossRef]
- Lucieer, A.; Turner, D.; King, D.H.; Robinson, S.A. Using an Unmanned Aerial Vehicle (UAV) to capture micro-topography of Antarctic moss beds. Int. J. Appl. Earth Obs. Geoinf. 2014, 27, 53–62. [Google Scholar] [CrossRef]
- Irvine-Fynn, T.D.; Sanz-Ablanedo, E.; Rutter, N.; Smith, M.W.; Chandler, J.H. Measuring glacier surface roughness using plot-scale, close-range digital photogrammetry. J. Glaciol. 2014, 60, 957–969. [Google Scholar] [CrossRef]
- Ehrman, J.; Clark, S.; Wall, A. Ice roughness estimation via remotely piloted aircraft and photogrammetry. Cryosphere 2021, 15, 4031–4046. [Google Scholar] [CrossRef]
- Brun, F.; Buri, P.; Miles, E.S.; Wagnon, P.; Steiner, J.; Berthier, E.; Ragettli, S.; Kraaijenbrink, P.; Immerzeel, W.W.; Pellicciotti, F. Quantifying volume loss from ice cliffs on debris-covered glaciers using high-resolution terrestrial and aerial photogrammetry. J. Glaciol. 2016, 62, 684–695. [Google Scholar] [CrossRef]
- Bearzot, F.; Garzonio, R.; Di Mauro, B.; Colombo, R.; Cremonese, E.; Crosta, G.B.; Delaloye, R.; Hauck, C.; Di Cella, U.M.; Pogliotti, P.; et al. Kinematics of an Alpine rock glacier from multi-temporal UAV surveys and GNSS data. Geomorphology 2022, 402, 108116. [Google Scholar] [CrossRef]
- Liu, J.; Chen, R.; Ding, Y.; Han, C.; Ma, S. Snow process monitoring using time-lapse structure-from-motion photogrammetry with a single camera. Cold Reg. Sci. Technol. 2021, 190, 103355. [Google Scholar] [CrossRef]
- Kaufmann, V.; Seier, G. Long-term monitoring of Glacier Change at Gössnitzkees (Austria) using terrestrial photogrammetry. ISPRS Int. Arch. Photogramm. Remote Sens. Spat. Inf. Sci. 2016, 41, 495–502. [Google Scholar] [CrossRef]
- Alessandri, L.; Baiocchi, V.; Del Pizzo, S.; Rolfo, M.F.; Troisi, S. Photogrammetric survey with fisheye lens for the characterization of the La Sassa Cave. ISPRS Int. Arch. Photogramm. Remote Sens. Spat. Inf. Sci. 2019, 42, 25–32. [Google Scholar] [CrossRef]
- Pukanská, K.; Bartoš, K.; Bella, P.; Gašinec, J.; Blistan, P.; Kovanič, Ľ. Surveying and high-resolution topography of the ochtiná aragonite cave based on TLS and digital photogrammetry. Appl. Sci. 2020, 10, 4633. [Google Scholar] [CrossRef]
- Bella, P.; Bosák, P.; Pruner, P.; Hercman, H.; Pukanská, K.; Bartoš, K.; Gaál, Ľ.; Haviarová, D.; Tomčík, P.; Kdýr, Š. Speleogenesis in a lens of metamorphosed limestone and ankerite: Ochtiná Aragonite Cave, Slovakia. Int. J. Speleol. 2021, 51, 13–28. [Google Scholar] [CrossRef]
- Giordan, D.; Godone, D.; Baldo, M.; Piras, M.; Grasso, N.; Zerbetto, R. Survey solutions for 3D acquisition and representation of artificial and natural caves. Appl. Sci. 2021, 11, 6482. [Google Scholar] [CrossRef]
- Šupinský, J.; Kaňuk, J.; Hochmuth, Z.; Gallay, M. Detecting dynamics of cave floor ice with selective cloud-to-cloud approach. Cryosphere 2019, 13, 2835–2851. [Google Scholar] [CrossRef]
- Vargo, L.J.; Anderson, B.M.; Horgan, H.J.; Mackintosh, A.N.; Lorrey, A.M.; Thornton, M. Using structure from motion photogrammetry to measure past glacier changes from historic aerial photographs. J. Glaciol. 2017, 63, 1105–1118. [Google Scholar] [CrossRef][Green Version]
- Niederheiser, R.; Rutzinger, M.; Bremer, M.; Wichmann, V. Dense image matching of terrestrial imagery for deriving high-resolution topographic properties of vegetation locations in alpine terrain. Int. J. Appl. Earth Obs. Geoinf. 2018, 66, 146–158. [Google Scholar] [CrossRef]
- Francioni, M.; Coggan, J.; Eyre, M.; Stead, D. A combined field/remote sensing approach for characterizing landslide risk in coastal areas. Int. J. Appl. Earth Obs. Geoinf. 2018, 67, 79–95. [Google Scholar] [CrossRef]
- Hastaoğlu, K.Ö.; Gül, Y.; Poyraz, F.; Kara, B.C. Monitoring 3D areal displacements by a new methodology and software using UAV photogrammetry. Int. J. Appl. Earth Obs. Geoinf. 2019, 83, 101916. [Google Scholar] [CrossRef]
- Oludare, I.M.; University Putra Malaysia; Pradhan, B. A decade of modern cave surveying with terrestrial laser scanning: A review of sensors, method and application development. Int. J. Speleol. 2016, 45, 71–88. [Google Scholar] [CrossRef]
- Wells, J.; Jones, T.; Danehy, P. Polarization and color filtering applied to enhance photogrammetric measurements of reflective surfaces. In Proceedings of the 46th AI-AA/ASME/ASCE/AHS/ASC Structures, Structural Dynamics and Materials Conference, Austin, TX, USA, 18–21 April 2005. [Google Scholar] [CrossRef][Green Version]
- Nicolae, C.; Nocerino, E.; Menna, F.; Remondino, F. Photogrammetry applied to problematic artefacts. ISPRS Int. Arch. Photogramm. Remote Sens. Spat. Inf. Sci. 2014, 40, 451–456. [Google Scholar] [CrossRef]
- Noya, N.C.; García, Á.L.; Ramírez, F.C. Combining photogrammetry and photographic enhancement techniques for the recording of megalithic art in north-west Iberia. Digit. Appl. Archaeol. Cult. Herit. 2015, 2, 89–101. [Google Scholar] [CrossRef]
- Abate, D. Documentation of paintings restoration through photogrammetry and change detection algorithms. Herit. Sci. 2019, 7, 13. [Google Scholar] [CrossRef]
- Hallot, P.; Gil, M. Methodology for 3D acquisition of highly reflective goldsmithing artefacts. ISPRS Int. Arch. Photogramm. Remote Sens. Spat. Inf. Sci. 2019, 42, 129–134. [Google Scholar] [CrossRef]
- Bella, P.; Zelinka, J. Ice Caves in Slovakia. In Ice Caves; Elsevier: Amsterdam, The Netherlands, 2018; pp. 657–689. [Google Scholar] [CrossRef]
- Korzystka, M.; Piasecki, J.; Sawinski, T.; Zelinka, J. Climatic system of the Dobsinska Ice Cave. In Proceedings of the ISCA 6th Congress, Demänovská Valley, Slovakia, 18–23 October 2010; SNC SR and Slovak Caves Administration: Liptovský Mikuláš, Slovakia, 2011. [Google Scholar]
- Gašinec, J.; Pukanská, K.; Bartoš, K. Geodetical Measurements of Ice Surface Changes in the Dobšiná Ice Cave. Aragonit 2020, 25, 40–41, (Abstracts of the 9th International Workshop on Ice Caves, Liptovský Mikuláš, Slovakia, 9–13 May 2022). [Google Scholar]
- Hochmut, Z. Mapovanie Jaskýň; Slovenská speleologická spoločnosť: Liptovský Mikuláš, Slovakia, 1995; 78p, ISBN 80-966963-1-9. [Google Scholar]
- Budaj, M.; Mudrák, S. Therion–Digital Cave Maps Therion–cartographie souterraine digitale. Spelunca Mem. 2008, 33, 138–141, (Proceedings of the 4th European Speleological Congress, Lans-en-Vercors, France, 23–30 August 2008). [Google Scholar]
- Szunyogh, G. High-accuracy graphic representation of underground karst features and formations during cave mapping. Acta Carsologica 2006, 33, 319–328. [Google Scholar] [CrossRef]
- Pukanská, K.; Bartoš, K.; Bella, P.; Rákay, Š.; Sabová, J. Comparison of non-contact surveying technologies for modelling underground morphological structures. Acta Montan. Slovaca 2018, 22, 246–256. [Google Scholar]
- Securo, A.; Forte, E.; Martinucci, D.; Pillon, S.; Colucci, R.R. Long-term mass-balance monitoring and evolution of ice in caves through structure from motion–multi-view stereo and ground-penetrating radar techniques. Prog. Phys. Geogr. Earth Environ. 2022, 46, 422–440. [Google Scholar] [CrossRef]
- Pfeiffer, J.; Rutzinger, M.; Spötl, C. Terrestrial laser scanning for 3D mapping of an alpine ice cave. Photogramm. Rec. 2022, 38, 6–21. [Google Scholar] [CrossRef]
- Bello, C.; Santillan, N.; Cochachin, A.; Arias, S.; Suarez, W. Ice thickness using ground penetrating radar at Znosko glacier on King George island. In Proceedings of the 2020 IEEE Latin American GRSS & ISPRS Remote Sensing Conference, Santiago, Chile, 22–27 March 2020; pp. 437–439. [Google Scholar]
- Guo, J.; Li, L.; Liu, J.; Fu, L.; Tang, X.; Wang, Y.; Yang, W.; Dou, Y.; Liu, S.; Lu, Q.; et al. Ground-penetrating radar survey of subsurface features at the margin of ice sheet, East Antarctica. J. Appl. Geophys. 2022, 206, 104816. [Google Scholar] [CrossRef]
- Seitz, S.M.; Curless, B.; Diebel, J.; Scharstein, D.; Szeliski, R. A comparison and evaluation of multi-view stereo reconstruction algorithms. In Proceedings of the 2006 IEEE Computer Society Conference on Computer Vision and Pattern Recognition (CVPR’06), New York, NY, USA, 17–22 June 2006; Volume 1. [Google Scholar]
- Westoby, M.; Brasington, J.; Glasser, N.F.; Hambrey, M.J.; Reynolds, J.M. ‘Structure-from-motion’ photogrammetry: A low-cost, effective tool for geoscience applications. Geomorphology 2012, 179, 300–314. [Google Scholar] [CrossRef]
- Remondino, F.; Spera, M.G.; Nocerino, E.; Menna, F.; Nex, F. State of the art in high density image matching. Photogramm. Rec. 2014, 29, 144–166. [Google Scholar] [CrossRef]
- Fuhrmann, S.; Langguth, F.; Moehrle, N.; Waechter, M.; Goesele, M. MVE—An image-based reconstruction environment. Comput. Graph. 2015, 53, 44–53. [Google Scholar] [CrossRef]
- Toschi, I.; Capra, A.; De Luca, L.; Beraldin, J.-A.; Cournoyer, L. On the evaluation of photogrammetric methods for dense 3D surface reconstruction in a metrological context. ISPRS Ann. Photogramm. Remote Sens. Spat. Inf. Sci. 2014, 2, 371–378. [Google Scholar] [CrossRef]
- Fraser, C. SLAM, SfM and photogrammetry: What’s in a name? In Proceedings of the ISPRS Technical Comission II: Symposium 2018 “Towards Photogrammetry 2020”, Riva del Garda, Italy, 3–7 June 2018. [Google Scholar]
- Rinaudo, F. Photogrammetry in Cultural Heritage—Is it only SfM software? In Proceedings of the ISPRS Technical Comission II: Symposium 2018 “Towards Photogrammetry 2020”, Riva del Garda, Italy, 3–7 June 2018. [Google Scholar]
- Ohanian, H.C.; Markert, J.T. Physics for Engineers and Scientists, 3rd ed.; Norton, W. W. & Company, Inc.: New York, NY, USA, 2007. [Google Scholar]
- Edwards, N. Cross-Polarisation, Making it Practical. J. Vis. Commun. Med. 2011, 34, 165–172. [Google Scholar] [CrossRef] [PubMed]
- Conen, N.; Hastedt, H.; Kahmen, O.; Luhmann, T. Improving image matching by reducing surface reflections using polarising filter techniques. ISPRS Int. Arch. Photogramm. Remote Sens. Spat. Inf. Sci. 2018, 42, 267–274. [Google Scholar] [CrossRef]
- Gašinec, J.; Gašincová, S.; Zelizňaková, V.; Palková, J.; Kuzevičová, Ž. Analysis Of Geodetic Network Established Inside The Dobšinská Ice Cave Space/Analýza Geodetickej Siete Zriadenej V Priestoroch Dobšinskej Ľadovej Jaskyne. Geosci. Eng. 2014, 60, 45–54. [Google Scholar] [CrossRef][Green Version]
- Berenguer-Sempere, F.; Gómez-Lende, M.; Serrano, E.; de Sanjosé-Blasco, J.J. Orthothermographies and 3D modeling as potential tools in ice caves studies: The Peña Castil Ice Cave (Picos de Europa, Northern Spain). Int. J. Speleol. 2014, 43, 35–43. [Google Scholar] [CrossRef]
- Gómez-Lende, M.; Sánchez-Fernández, M. Cryomorphological topographies in the study of Ice Caves. Geosciences 2018, 8, 274. [Google Scholar] [CrossRef]
- Petters, C.; Milius, J.; Buchroithner, M. Eisriesenwelt: Terrestrial laser scanning and 3D visualisation of the largest ice cave on earth. In Proceedings of the European LiDAR Mapping Forum, Salzburg, Austria, 29–30 November 2011. [Google Scholar]
- Milius, J.; Petters, C. Eisriesenwelt—From Laser Scanning to Photo-Realistic 3D Model of the Biggest Ice Cave on Earth; GI-Forum: Washington, DC, USA, 2012; pp. 513–523. [Google Scholar]
- Gómez-Lende, M.; Berenguer, F.; Serrano, E. Morphology, ice types and thermal regime in a high mountain ice cave. First studies applying terrestrial laser scanner in the Peña Castil ice cave (Picos de Europa, northern Spain). Geogr. Fis. Din. Quat. 2014, 37, 141–150. [Google Scholar]
- Strug, K.; Zelinka, J. The Demämovska Ice cave—The volume balance of the ice monolith in 2003–2007 (Slovakia). Slov. Kras 2008, 46, 369–386. [Google Scholar]
- Morard, S.; Bochud, M.; Delaloye, R. Rapid changes of the ice mass configuration in the dynamic diablotins ice cave—Fribourg prealps, Switzerland. Cryosphere 2010, 4, 489–500. [Google Scholar] [CrossRef]
- Perşoiu, A.; Pazdur, A. Ice genesis and its long-term mass balance and dynamics in Scărişoara Ice Cave, Romania. Cryosphere 2011, 5, 45–53. [Google Scholar] [CrossRef]
- Smith, K.J. Ice cave monitoring at Lava Beds National Monument. In Proceedings of the Sixth International Workshop on Ice Caves, Idaho Falls, ID, USA, 17–22 August 2014; NCKRI Symposium 4. Land, L., Kern, Z., Maggi, V., Turri, S., Eds.; National Cave and Karst Research Institute: Carisbad, NM, USA; pp. 88–93. [Google Scholar]
- Pukanská, K.; Bartoš, K.; Gašinec, J.; Pašteka, R.; Zahorec, P.; Papčo, J.; Kseňak, Ľ.; Bella, P.; Andrássy, E.; Dušeková, L.; et al. Measurement of spatio-temporal changes of cave ice using geodetic and geophysical methods: Dobšiná Ice Cave, Slovakia. Cryosphere Discuss. 2023; in review. [Google Scholar] [CrossRef]
Disclaimer/Publisher’s Note: The statements, opinions and data contained in all publications are solely those of the individual author(s) and contributor(s) and not of MDPI and/or the editor(s). MDPI and/or the editor(s) disclaim responsibility for any injury to people or property resulting from any ideas, methods, instructions or products referred to in the content. |
© 2023 by the authors. Licensee MDPI, Basel, Switzerland. This article is an open access article distributed under the terms and conditions of the Creative Commons Attribution (CC BY) license (https://creativecommons.org/licenses/by/4.0/).