Article

Deciphering Small-Scale Seasonal Surface Dynamics of Rock Glaciers in the Central European Alps Using DInSAR Time Series

1
Department of Physical Geography, Institute of Geography and Geology, University of Wurzburg, D-97074 Wurzburg, Germany
2
Department of Remote Sensing, Institute of Geography and Geology, University of Wurzburg, D-97074 Wurzburg, Germany
3
Institute of Environmental Social Sciences and Geography, University of Freiburg, D-79085 Freiburg im Breisgau, Germany
4
German Remote Sensing Data Center (DFD), German Aerospace Center (DLR), Muenchener Strasse 20, D-82234 Wessling, Germany
5
Geoinformatics Department, Munich University of Applied Sciences, Karlstraße 6, D-80333 Munich, Germany
*
Author to whom correspondence should be addressed.
Remote Sens. 2023, 15(12), 2982; https://doi.org/10.3390/rs15122982
Submission received: 5 May 2023 / Revised: 1 June 2023 / Accepted: 5 June 2023 / Published: 7 June 2023
(This article belongs to the Special Issue Advances in Remote Sensing in Glacial and Periglacial Geomorphology)

Abstract

:
The Essential Climate Variable (ECV) Permafrost is currently undergoing strong changes due to rising ground and air temperatures. Surface movement, forming characteristic landforms such as rock glaciers, is one key indicator for mountain permafrost. Monitoring this movement can indicate ongoing changes in permafrost; therefore, rock glacier velocity (RGV) has recently been added as an ECV product. Despite the increased understanding of rock glacier dynamics in recent years, most observations are either limited in terms of the spatial coverage or temporal resolution. According to recent studies, Sentinel-1 (C-band) Differential SAR Interferometry (DInSAR) has potential for monitoring RGVs at high spatial and temporal resolutions. However, the suitability of DInSAR for the detection of heterogeneous small-scale spatial patterns of rock glacier velocities was never at the center of these studies. We address this shortcoming by generating and analyzing Sentinel-1 DInSAR time series over five years to detect small-scale displacement patterns of five high alpine permafrost environments located in the Central European Alps on a weekly basis at a range of a few millimeters. Our approach is based on a semi-automated procedure using open-source programs (SNAP, pyrate) and provides East-West displacement and elevation change with a ground sampling distance of 5 m. Comparison with annual movement derived from orthophotos and unpiloted aerial vehicle (UAV) data shows that DInSAR covers about one third of the total movement, which represents the proportion of the year suited for DInSAR, and shows good spatial agreement (Pearson R: 0.42–0.74, RMSE: 4.7–11.6 cm/a) except for areas with phase unwrapping errors. Moreover, the DInSAR time series unveils spatio-temporal variations and distinct seasonal movement dynamics related to different drivers and processes as well as internal structures. Combining our approach with in situ observations could help to achieve a more holistic understanding of rock glacier dynamics and to assess the future evolution of permafrost under changing climatic conditions.

Graphical Abstract

1. Introduction

Permafrost is an essential component of the cryosphere [1], which is defined as ground material (sediment, soil or rock) that remains at or below 0 °C for at least two consecutive years [1,2]. Permafrost has been identified as an Essential Climate Variable (ECV) by the Global Climate Observing System of the World Meteorological Organisation [3] and is currently undergoing strong changes due to rising air and ground temperatures [2,4]. Mountain permafrost warming and degradation leads to changes in runoff and increased geohazards such as slope instabilities, landslides and rock falls [4,5,6,7]. However, as permafrost is a subsurface feature, its observation and monitoring of ongoing changes remains scarce and challenging [4,8]. Permafrost creep due to gravitative processes is one key indicator for the existence of mountain permafrost [6,9], which is used to detect and outline the occurrence of permafrost [7,10]. The movement results in the formation of characteristic landforms such as rock glaciers, which have a distinct front, lateral margins and often a surface with ridges and furrows [6,9,10,11]. Therefore, Rock Glacier Velocity (RGV) was added as a new ECV product of permafrost in 2022 [3]. RGVs usually range from a few centimeters to up to a few meters per year, although in rare cases of destabilization they can exceed 10 m per year [10,12,13,14]; they are categorized into three classes by the International Permafrost Association (IPA): active (>10 cm/a), transitional (1–10 cm/a), and inactive (<1 cm/a) [10,15]. Multiple studies in the Alps have shown that rising temperatures in most cases [13,16,17,18] as well as the availability of liquid water [19,20,21,22] lead to an increase in RGVs.
Additionally, dynamics on different temporal scales could be identified: longterm (decadal), multiannual and seasonal dynamics. These dynamics are linked to changes in the two drivers: temperature and liquid water. Based on Kenner et al., 2020 [23] and other recent studies [6,9,13,16,17,18,19,20,21,22,24,25,26,27,28], we summarize RGV dynamics as follows: longterm trends are related to climatic changes resulting in increased ground temperatures, which increase the viscosity of permafrost bodies. This temperature trend is overlain by multiannual effects, such as summer heat waves and increased cooling due to low snow cover during autumn and winter. Seasonal and short-term dynamics are driven by the availability of liquid water from snowmelt and summer precipitation. Under specific topographic conditions (increasing slope of the bedrock and downslope of the rock glacier front), an increase in RGV might reach a tipping point in external force, resulting in the destabilization of a rock glacier. Over longer (multidecadal) timescales, however, increasing temperatures will result in decreasing velocities due to ongoing permafrost degradation and decreasing ice concentrations which results in a conversion of active rock glaciers to a transitional and then inactive state.
Despite the increased understanding of rock glacier dynamics in recent years, modeling approaches have so far had limited success in describing rock glacier dynamics [14,27,28,29]. Further, observations are usually limited in their spatial coverage (in situ borehole deformation, inclinometers and GNSS measurements) [19,20,23,30] or in short-term temporal resolution (Feature Tracking) [13,18,25,31,32]. Therefore, spaceborne Differential SAR Interferometry (DInSAR) has become an increasingly popular method to derive rock glacier velocities [10,33,34,35] as it provides displacement information at high spatial and temporal resolutions. DInSAR uses the phase difference between two Synthetic Aperture Radar (SAR) acquisitions to detect distance changes of the surface towards the sensor and is capable of detecting relative displacements of a few millimeters along the so-called Line of Sight (LOS). The Sentinel-1 C-band SAR mission, with its nearly global coverage as well as a free and open data policy, is a game changer in this regard. Hence, several studies have successfully used Sentinel-1 DInSAR time series to outline and categorize permafrost creep and active rock glaciers [10,33,34,35,36,37,38,39,40,41,42,43,44,45] as well as to detect other periglacial processes, such as heave-subsidence freeze–thaw cycles [37,41] or creep due to solifluction [41,42].
However, the seasonal dynamics of RGVs are not the focus of these studies, despite the fact that DInSAR is capable of detecting such dynamics (shown by Strozzi et al. [34]). Moreover, other studies monitoring earthquakes [46], landslides [47], and subsidence [48,49] show that Sentinel-1 LOS displacement can be decomposed into horizontal (East-West) and vertical (Up-Down) displacement components using ascending and descending orbits. However, most of the previous Sentinel-1 DInSAR studies of rock glaciers used only one orbit and projected displacement along the steepest slope [34,38,40], even though several studies showed that displacement has a significant vertical component due to mass balance changes and melting processes [6,9,14,16,25,27,50]. Further, small-scale spatial variations of these parameters (seasonality, movement components) within individual rock glaciers have not been assessed in detail using DInSAR, even though spatial patterns are reported in many studies [6,9,16,19,23,25,27,31,50].
Hence, we designed our study to address the following three objectives:
(i) We combine data from ascending and descending orbits to derive the spatial patterns of the horizontal as well as the vertical component of displacement over selected rock glaciers; (ii) We carry out a detailed accuracy assessment of the decomposed displacement rates by comparing the results with independently generated movement rates based on Feature Tracking (FT) and digital elevation model (DEM) differencing using high-resolution orthophotos as well as unpiloted aerial vehicle (UAV) imagery; (iii) We analyze the spatial patterns in the seasonal dynamics of the monitored landforms to get a better understanding of the current process dynamics occurring in rock glaciers and degrading alpine permafrost bodies.
For this purpose, we developed a semiautomated approach using open-source tools (SNAP by ESA; pyrate by GeoScience Australia [51,52,53]) to generate accurate DInSAR displacement time series with only minimal expert input required, so that the workflow can easily be transferred to other study sites. Further, we altered DInSAR preprocessing to achieve a higher spatial sampling range than previous studies (5 m) in order to capture small-scale spatial heterogeneity in displacement rates of rock glaciers. The workflow was tested for five different study sites located in the Central European Alps, where dense coverage with Sentinel-1 data from ascending and descending orbits is available.

2. Study Areas

2.1. Kaiserbergtal

The Kaiserbergtal valley (46.91°N, 10.68°E) is located in the crystalline Öztaler Alps, Austria (Figure 1a), and is characterized by a typical dry inner alpine climate. The upper Kaiserbergtal valley with an area of about 3 km 2 hosts several active rock glaciers at an elevation of 2500 m above sea level (a.s.l.). The most prominent landform of the valley is the Kaiserberg rock glacier, which has been the subject of earlier studies focusing on its internal structure [54], hydrology [55], and kinematics [14]. Consisting of two units, the northern part is 400 m long and 200 m wide (Figure 1c; mark 1), the southern part is 250 m long and 150 m wide (Figure 1c; mark 2), the rock glacier descends from a north-northeast facing valley side and creeps in the northeast direction (Figure 1c,d).

2.2. Grison Study Sites

The other four study sites are located in the Swiss canton of Grison, most of them being adjacent to the Engadine valley (Figure 1b). The climate is characterized as rather dry and continental due to its inner-alpine location. The first site, Nair (Figure 1e,f), is located at the north and northeastern slopes of Piz Nair (46.51°N, 9.79°E). Lithology here consists of shales and breccias of the Mesozoic age from the Err-Nappe [56]. The site consists of several adjacent north and northeast facing rock glacier lobes. All lobes are located between 2600 and 2900 m a.s.l. and the individual lobe size ranges from 20 to 100 m in width and 50 to 200 m in length. Parts of the rock glacier have been studied previously, and the occurrence of permafrost has been observed using geophysical measurements such as seismic refraction sounding and electrical resistivity tomography (ERT) [57,58]. The second site (Gianda Grischa, 46.49°N, 9.75°E) is located on the western slopes of Piz Julier (3380 m a.s.l.) at an elevation ranging from 2500 to 3000 m a.s.l. with lithology consisting of granites, diorites, and para-gneiss as part of the Err-Bernina nappe [59,60]. The double-tongued rock glacier (Figure 1g,h; mark 1) is between 150 m and 400 m wide and has a length of slightly less than a kilometer facing from east to west (Figure 1f,g). Repeated kinematic and geophysical measurements have been carried out on this rock glacier [59,60,61]. Another inactive rock glacier [60] is located directly north of the first one (Figure 1g,h; mark 2) and has a width of 250 to 350 m and a length of 850 m facing mostly towards west and southwest. The third site, Muragl, is located in the Val Muragl (46.51°N, 9.93°E) and consists of several periglacial features: The lower part of the valley is dominated by a rock glacier located at the northern slopes of Las Sours and facing first towards north-east before turning towards west to northwest (Figure 1i,k, mark 1). The source area is located at 2800 m and the front is at about 2500 m a.s.l. with a width of 100 to 300 m and a length of about 900 m. The main rock glacier has been analyzed in several studies focusing on kinematics [29,30,62] and internal structure using geophysical measurements (ERT, seismic, georadar) [63,64] as well as borehole deformation and temperature measurements [29,65]. In the upper part of the valley, the glacier forefield hosts several smaller features (Figure 1i,k; marks 2–4), which have also been assessed in studies focusing on internal structure using geophysical measurements [66,67,68,69] as well as kinematics [67,70]. These elements are located at an elevation range from 2600 to 2800 m a.s.l and have a width of 40 to 100 m and a length of 50 to 350 m. The lithology consists mostly of granites, diorites, gneiss, and mica schists [66]. The fourth site Tellers Davains (46.54°N, 9.68°E) is located outside the upper Engadine in a side valley of the Val Surses. The main rock glacier (Figure 1l,m, mark 1) is located on the western slopes of Piz Calderas (3396 m a.s.l.) at an elevation from 2500 to 2900 m a.s.l. and has a width of 250 to 400 m and a length of 950 m. Adjacent to it in the southern direction, several smaller lobes are located at a similar elevation on the north-western slopes of Piz Cucarnegl (3050 m a.s.l.) with a width of 100 to 400 m and a length of up to 600 m (Figure 1l,m, mark 2). The lithology consists of granites and diorites of the Err-Julier nappe [71]. No studies have been carried out at this site so far, to the best of our knowledge.

3. Data and Methods

The following methodological section consists of five parts, shown in the workflow chart in Figure 2. In the first part (i), the DInSAR displacement time series is generated from Sentinel-1 data using snappy and pyrate. In the second part (ii), LOS displacement from ascending and descending orbits is decomposed into horizontal East-West (E-W) and vertical Up-Down (U-D) displacement. Consecutively, the elevation change and direction of movement are derived. In the third step (iii), reference data from orthophotos and UAV imagery are generated to assess the accuracy of the decomposed DInSAR displacement rates. In the fourth step (iv), the seasonality of the displacement is calculated. In the final step (v), a detailed correlation analysis of the spatiotemporal dynamics is carried out to identify drivers for movement rates and direction as well as intensity and timing of seasonal acceleration. An overview of all used software can be found in Appendix B (Table A1).

3.1. Differential SAR Interferometry Displacement Time Series Generation

DInSAR has become an increasingly popular methodology to monitor geomorphological activity in periglacial landscapes in the recent years [10,33,34,35,36,37,38,39,40,41,42,43,44,45], especially since the availability of Copernicus mission Sentinel-1. For this study, we used cost-free and open-access C-band (wavelength = 5.6 cm) SAR data obtained by the Sentinel-1 satellite constellation providing a repetition rate of 6 days over Europe. In order to ensure a consistent time series, we limited our analysis to the time period, during which both satellites were available, starting from January 2017 until December 2021 covering 5 years of data. We collected all Single Look Complex (SLC) acquisitions in the IW mode with VV polarization (resolution rg × az: 2.3 m × 13.9 m) available at the Alaska Satellite Facility [72] from 4 orbits covering our study sites (descending orbits: 66–293 acq, 168–293 acq; ascending orbits: 15–286 acq, 117–291 acq). Each orbit was processed individually based on the following processing steps carried out using a semi-automated approach based on snappy (python wrapper for SNAP functionalities—version 8) by ESA and Pyrate (version 0.5) by GeoScience Australia. These preprocessing steps require a high-quality DEM. We used the SwissALTI3D DEM by Swisstopo (resolution: 2 m) [73] for the study sites in Grison and the digital terrain model Tyrol by Land Tirol (resolution: 1 m) [74] for the Kaiserbergtal site. The processing started with the execution of the following steps in snappy: First, (i) the most recent orbit file was applied and (ii) the bursts of interest were split using separate areas of interest for the Kaiserbergtal and the Grison sites. Each scene was then (iii) coregistered to the nearest observation in time in the same orbit using Back Geocoding. (iv) The Enhanced Spectral Diversity correction was additionally used in cases in which several bursts needed to be processed. Afterwards, (v) the differential interferogram was calculated for the coregistered dataset, including the subtraction of the topographic phase using the previously mentioned high-resolution DEMs and then (vi) debursted. In order to maintain the highest possible resolution, we avoided the commonly used uniform Multilooking Operator (e.g., [34,41,42]) and applied instead (vii) a weak Goldstein Phase Filter [75] (alpha = 0.5, fft size = 64, window size = 7) to dampen the effects of outliers and decorrelated pixels, while keeping the original resolution of 2.3 m × 13.9 m. The result was (viii) cropped to the individual study sites to reduce the processing time for the (ix) phase unwrapping carried out in snaphu [76] using the Minimum Cost Flow algorithm (MCF). The resulting unwrapped phase information was then (x) projected to Cartesian coordinates at a spatial sampling of 5 m using the high-resolution DEM.
The unwrapped interferograms were then screened and scenes with average coherence values below a certain threshold were excluded from further analysis. Visual inspection showed that a coherence threshold of 0.5 is suited best to exclude scenes with widespread decorrelation of the phase signal. These scenes were mostly acquisitions with changing snow cover conditions during autumn, winter and spring. Occasional snowfall during the snow-free period (usually June until October) also caused low coherence values for few acquisitions. These occasions were also excluded and instead bridged with interferograms of longer temporal baselines (12 or 18 days). The filtered acquisitions were then grouped into continuous time series stacks. Each stack consisting of more than one scene was then processed by pyrate. The processing in pyrate consists of: (i) masking out all pixels below a coherence threshold of 0.3 (=default threshold of pyrate); (ii) automatic search for a stable area to identify and then subtract the reference phase; (iii) applying a residual orbit error correction (linear filter); (iv) atmospheric phase screen (APS) correction using a spatial low-pass Gaussian filter (size: 1 km); (v) APS correction using a temporal low-pass Gaussian filter (size: 6 days); (vi) conversion of the corrected phase to 6-day Line-of-Sight displacement for each individual time step. The APS correction steps (iv) and (v) were excluded for stacks with less than 5 scenes as using the respective filters in pyrate for such few scenes is not recommended due to increased inaccuracies. The 6-day LOS displacement rate time series was then used as input for the displacement decomposition as well as for the calculation of the seasonal movement. Areas affected by radar shadow or layover were masked out.

3.2. Displacement Decomposition

The LOS displacement time series was first aggregated by calculating the sum. Using this averaging technique (stacking), we further reduced the effects of atmospheric artefacts on the summarized stack due to their randomized phase contribution [41,42,77,78]. As the stacked time series covers 5 years of data the result was divided by 5 to obtain the annual DInSAR displacement rate. In the next step, we applied displacement decomposition (Figure 3) to convert the annual LOS displacement from an ascending and descending orbit into the E-W and the U-D displacement components using Equation (1). This equation (based on [46,48,49,79]) uses a simplified geometry neglecting the North-South (N-S) component of the displacement as preliminary tests decomposing LOS displacement of three orbits to 3D displacement showed limited sensitivity in the N-S direction (e.g., [79]). With the simplified geometry, only one ascending and one descending LOS displacement value is necessary to decompose. In case of several ascending or descending orbits available, we used the orbit less affected by radar shadow and layover. The heading angle of the platform ( α = ± 15 ° from north) was neglected in this decomposition approach.
d L O S _ A S C d L O S _ D E S C = sin θ A S C cos θ A S C sin θ D E S C cos θ D E S C d E _ W d U _ D ,
The resulting uplift or subsidence of a respective area is not equal to the U-D displacement component because it additionally depends on the local topography [47]. Therefore, we derived actual elevation change ( d z ) at a specific area using the following Equation (2), which corrects for slope-induced vertical displacement contributions (see also Figure 3):
d z = d U _ D d E _ W · tan ( s l o p e E _ W ) ,
Neglecting the N-S displacement component leads to increased effects in the elevation change dataset, as the vertical displacement effects induced by N-S movement along the slope are not corrected. Therefore, results have to be interpreted with care in areas where we assume there to be higher movement rates in the N-S direction.
To assess the proportion of elevation change on the overall movement, we calculate the direction of the movement ( τ d i r ) using Equation (3). Values range from +90° (0% horizontal movement, 100% uplift) over 0° (100% horizontal movement, 0% elevation change) to 90 ° (0% horizontal movement, 100% subsidence):
τ d i r = a t a n ( d z / a b s ( d E _ W ) ) , [ 90 ° ; ; 90 ° ] ,

3.3. Reference Data Generation Using Feature Tracking and DEM Differencing

Apart from DInSAR approaches used to monitor surface deformation, the manual or automated tracking of surface features in optical imagery has been widely applied in recent years to investigate rock glacier kinematics with remotely sensed imagery [14,80,81]. Here, we use the Environmental Motion Tracking software (EMT Version 0.9.3, http://www.tu-dresden.de/geo/emt; accessed on 15 January 2022; [82]) that matches image patches in consecutive images based on a combination of cross correlation and least squares matching algorithms [82,83]. While cross correlation is used for first-order matching, the iterative least squares matching approach can achieve subpixel accuracies.
For the study areas located in Switzerland, we use orthoimages from 27 August 2015 and 14 September 2019 provided by Swisstopo [84] at a ground resolution of 0.25 × 0.25 m. Given the strong differences in shadowing and snow coverage between the 2015 and 2019 orthoimages, we excluded these areas from our analysis based on simple thresholds for masking shadow and snow. For computational efficiency, all images were resampled to 0.5 × 0.5 m ground resolution, providing sufficient detail for optical FT. For the Kaiserberg rock glacier, aerial images captured by an unpiloted aerial vehicle were used to derive digital topographic data and orthoimages. Using the structure from motion multi view stereo algorithms, as implemented in Agisoft Metashape Professional (Version 1.7.2), we constructed dense point clouds from 876 and 622 images for 21 July 2019 and 28 August 2021, respectively. Using a differential global navigation satellite system (Trimble R8s/R2), we measured 50 ground control points, resulting in positional accuracies (root mean squared error—RMSE) of our UAV derived point clouds of 5.2 and 5.8 cm for 2019 and 2021, respectively. Point clouds were exported as raster-based digital elevation models with a ground resolution of 0.5 × 0.5 m, providing sufficient detail for comparison with DInSAR results. Because UAV-derived orthoimages might show inconsistencies in appearance due to different lighting conditions and snow cover, we favor FT in hillshades derived from digital elevation models [80]. In both the Swiss and Austrian study areas, we applied a 50 m buffer around mapped rock glacier features to create a regular grid of object points (i.e., patch centers) for FT in EMT, spaced at 2 m in x and y direction (i.e., every fourth pixel). Tracking in EMT was performed using patch sizes of 30 × 30 pixels (i.e., 15 × 15 m) and a search area of the same dimension, allowing for a maximum displacement of 15 m in all directions between image pairs. To quantify the residual mismatch between orthoimage pairs, we randomly distributed 2500 object points on stable surfaces (i.e., outside potentially moving periglacial landforms) and tracked displacement using the same settings as described above. Here, we use the 90th percentile of tracked stable areas as a cutoff value to distinguish significant surface movement from non-significant movement that cannot be resolved by our FT in optical imagery. This limit of detection (LoD) is 0.12 m/a for Davains, 0.05 m/a for Muragl, 0.07 m/a for Nair, 0.09 m/a for Gianda Grischa, and 0.05 m/a for the Kaiserberg rock glacier. For the comparison with the DInSAR derived results, all products were then resampled to the 5 m spatial sampling of the DInSAR product.

3.4. Calculation of Seasonal Movement

Based on a preliminary analysis, we assumed strong variations in seasonal activity. To quantify this effect and assess its spatio-temporal distribution, we selected the orbit which shows the highest LOS displacement rates. This is usually the orbit, where the LOS has nearly the same direction as the movement of the observed feature along the slope, i.e., an ascending orbit for east and north-east facing landforms and descending orbit for west and north-west facing landforms. We selected ascending orbit 117 for Kaiserbergtal and ascending orbit 15 for Nair, descending orbit 66 for Gianda Grischa and Davains and descending orbit 168 for the Muragl site. For these selected orbits, we calculated the pixelwise median LOS 6d-displacement rate for each month based on the LOS displacement time series. The median of June and July was selected as the displacement rate before the seasonal increase and the median of September as the displacement rate at the maximum seasonal activity (Equations (4) and (5)). The difference between these two is defined as the absolute seasonal increase in the displacement rate (Equation (6)):
m e d j u n _ j u l = m e d { d i s p j u n _ 1 , , d i s p j u n _ n , d i s p j u l _ 1 , d i s p j u l _ n } ,
m e d s e p t e m b e r = m e d { d i s p s e p 1 , , d i s p s e p n } ,
s e a s o n a l i t y a b s = m e d s e p t e m b e r m e d j u n _ j u l , [ m m / 6 d ] ,
To quantify the proportion of the seasonal acceleration on the maximum velocity in summer, we additionally calculated the relative seasonality with Equation (7):
s e a s o n a l i t y r e l = s e a s o n a l i t y a b s m e d s e p t e m b e r , [ 0 % ; ; 100 % ] ,

3.5. Correlation Analysis of Spatiotemporal Dynamics

For the analysis of the spatiotemporal dynamics, we first performed a segmentation of the dataset using the Orfeo Toolbox (OTB, Version 8) to reduce variabilities inherent to the pixel level at such a high resolution. The following steps were carried out for the segmentation: (i) Stacking of the following bands: yearly E-W DInSAR displacement, yearly U-D DInSAR displacement as well as absolute seasonality of all available orbits; (ii) conversion of stacked bands to a common dynamic range cutting of the 0.5% extreme values; and (iii) execution of the segmentation (spatial radius: 5, range radius: 10, convergence threshold: 0.1, max iterations 100, min region size: 50). For each segment, median yearly (i) E-W displacement ( d E _ W ), (ii) elevation change ( d z ), (iii) direction of movement ( τ d i r ), (iv) absolute seasonality ( s e a s o n a l i t y a b s ) and (v) relative seasonality ( s e a s o n a l i t y r e l ) are calculated. All five parameters were tested against the local elevation and slope of the respective segment to identify potential drivers for differences. To avoid local furrows and ridges affecting the slope analysis and to ensure that the slope of the bedrock was captured, we first ran a mean window on the local elevation of 50 by 50 m before calculating the slope parameter. We further assessed possible correlations of the movement parameters and compared absolute and relative seasonality of movement against horizontal movement, elevation change and direction of movement.
Moreover, the start of seasonal increase was identified for each year separately using Equation (8):
s e a s o n _ s t a r t ( s e g ) = f i r s t   D O Y , w h e r e ( d i s p ( s e g , D O Y ) d i s p ( s t a b l e , D O Y ) ) > ( m e d j u n _ j u l ( s e g ) + 1 ) ( t w o   t i m e s ) n a , o t h e r w i s e ,
In this Equation, the 6d-displacement of each segment is corrected by the mean of a chosen stable area to ensure that the reference is not affected by errors. Second, for each acquisition starting from 1st July onwards, we test whether the corrected 6d displacement of the segment exceeds its preseason median by more than one millimeter. If this is the case for two consecutive acquisitions, the first of these two dates is defined as the start of the seasonal increase for the respective segment. As the snow cover and availability of water from snowmelt is said to be a crucial factor for rock glacier dynamics, we additionally calculated the date when snow cover ended (end of snow cover—EOS) for all years using the SAR intensity time series of ascending orbit 15. This methodology is based on the approach of Buchelt et al., 2022 [85].
The assessment of the seasonal movement was limited to segments, which are located within a buffer zone of 50 m around the investigated landforms and show at least 5 cm annual movement in either horizontal or vertical direction. Further, areas affected by phase unwrapping errors were also excluded. The areas used in the correlation analysis are shown in Appendix A Figure A1.

4. Results

4.1. Comparison of DInSAR Displacement with Feature Tracking and DEM Differencing

First, we assessed the accuracy of our product by comparing the annual DInSAR displacement rate with results derived from optical imagery. At Kaiserbergtal, we used the available UAV data for FT to compare horizontal displacement in the E-W direction and DEM Differencing to assess the elevation change. For the site in Grison, we used publicly available orthophotos for FT comparing only the E-W displacement.

4.1.1. Kaiserbergtal

The Kaiserbergtal site is well-suited for DInSAR as it is barely affected by shadow and layover and the predominant direction of movement is north-east to east and, therefore, very detectable in ascending orbit. When comparing absolute values, the limited availability of observations for DInSAR due to decorrelation during snow cover is clearly visible. The DInSAR annual displacement roughly makes up one third of the annual movement observable by FT (Figure 4e). This agrees well with the proportion of scenes that could be used for DInSAR (ascending: 93/286; descending: 101/293). Hence, we scaled the DInSAR results by a factor of three for the following accuracy assessment. The E-W component from FT compared with the corrected DInSAR displacement shows good relative agreement with a Pearson R of 0.7, an RMSE of 11 cm and a standard deviation (sd) of 29 cm. The DEM differencing shows less relative agreement with a Pearson R of 0.42, an RMSE of 7 cm and an SD of 26 cm. Besides the systematic underestimation of displacement by DInSAR, an increasing deviation exists for dx starting at about 0.3 m of displacement in FT. These are predominantly areas in the southeastern part of the rock glacier (Figure 4a,b).

4.1.2. Grison Sites

The Grison sites show various settings, which have a strong variability in their suitability for DInSAR analysis, whereas the Nair site is less suited due to its north-facing direction (Figure 5a,b), which reduces the detectability of displacement in both acquisition orbits. The Gianda Grischa site is strongly affected by layover and shadow effects, especially in the upper parts of the rock glacier beneath the rock faces (Figure 5d,e). On the other hand, Muragl has better suitability except for the upper parts of the rock glacier, which is also north-facing (Figure 5g,h). The Davains site is well-suited except for the top parts in the east located directly beneath the rock face (Figure 5k,l). When comparing the East-West component derived from FT with the results from DInSAR, we see effects similar to those in the Kaiserbergtal valley site. The yearly DInSAR displacement makes up again roughly about one third of the movement detected by FT (Figure 5c,f,i,m). This represents the fraction of the year with snow-free or stable snow cover conditions. Hence, we applied a scaling of 3 on the DInSAR displacement values for the statistical assessment. The Pearson correlation coefficient ranges from 0.45 for the Nair site to 0.70 for the Davains site. RMSE is lowest for the Gianda Grischa site at 5 cm, and highest for the Davains site at 26.5 cm. The SD ranges from 20 cm at Gianda Grischa to 50 cm at Davains. Further, we can again identify an increasing underestimation for larger displacement rates. At Gianda Grischa and Nair, this effect starts to occur already at about 0.4 m FT displacement (Figure 5c,f). At Muragl, the effect is visible for absolute values of higher than 0.3 m and becomes more dominant from 0.6 m onwards, showing a constantly increasing underestimation with higher displacement rates (Figure 5i). At Davains, only a slight underestimation occurs at absolute values below 0.9 m and then an abrupt offset of about 0.15 m in DInSAR displacement is visible for values of higher than 1.0 m (Figure 5m). This offset then remains stable for higher displacement values.

4.2. Seasonal Movement

For the analysis of the seasonal component (Figure 6) we present the results of the orbit, where the LOS displacement is strongest. Results for all orbits can be found in Appendix A Figure A2. Seasonality is visualized in an additive RGB coloring with the red band representing the pre-season median 6d displacement m e d j u n _ j u l , the blue band representing the median 6d displacement in September ( m e d s e p t e m b e r ) and the green band representing the absolute difference between the former two values ( s e a s o n a l i t y a b s ). Based on this, non-moving areas are transparent, whereas areas with a low seasonal variability and a stable displacement rate appear in magenta. On the other hand, areas with a high seasonality (low movement in July; high movement in September) appear in cyan tones. Areas with middle seasonality (medium movement in July; high movement in September) appear in shades of blue. Additionally, areas prone to phase unwrapping errors show a distinct different visualization usually in bright yellow, orange, green or white.
At Kaiserbergtal, most parts of the main rock glacier assessed with the UAV imagery show a high seasonality in displacement (Figure 6a). Only the lower southwestern part towards the front has a displacement rate with low seasonality. Moreover, some active areas in the east and south above the main rock glacier are visible, showing varied seasonality ranging from low to high. There are also signs of seasonal activity in a lower-lying rock glacier in the northeastern part of the image. As this feature has no morphological link to the rest of the rock glacier, we excluded it from further analysis. At Nair (Figure 6b), most slopes directly beneath the rock faces show displacement dominated by medium to high seasonality. Moreover, only a few of the rock glacier lobes show activity at further distances (>50 m) from the rock faces. In such cases, this movement is mostly defined by low seasonal variability. At Gianda Grischa (Figure 6c), the southern rock glacier shows low to middle seasonality in the lower western parts towards the front and in the highest eastern parts towards the rock face. Further, an area affected by phase unwrapping errors is located in the middle. The area above this erroneous part has a high seasonal component, unlike the rest of the rock glacier. The adjacent inactive northern rock glacier is dominated in the lower part by no movement, which is followed by areas with high seasonality in the upper part. Close to the rock face, a small part of the rock glacier shows low seasonal variability. In the Muragl valley (Figure 6d), the rock glacier in the western part is defined by low seasonality in the lowest part, followed by an area of phase unwrapping errors. Above this area, the seasonal contribution increases from medium to high seasonality towards the upwards and southwards parts of the rock glacier. Adjacent to the rock glacier, a smaller feature shows low seasonal variability, while the remaining active areas located further eastwards in the valley show predominantly high seasonal variability. The Davains site (Figure 6e) is dominated by areas with low seasonality in the southern rock glacier as well as the western and southern part of the northern rock glacier. However, especially the lower western part of the latter one is mostly dominated by phase unwrapping errors. In contrast, the northern part of this rock glacier as well as the upper eastern part of the rock glacier adjacent to the head walls are mostly dominated by high seasonality. For all sites, the spatial agreement on these patterns is very high between the separately processed orbits (Appendix A Figure A2).

4.3. Correlation Analysis

The correlation analysis carried out for each study site is summarized in Figure 7. Correlations with elevation are not distinct and sometimes contradictory between the different sites. At Nair, a highly significant increase in horizontal movement towards higher elevations is observed but a highly significant decrease at Gianda Grischa and Muragl is observed. Additionally, elevation change tends to increase at Gianda Grischa and Davains with high significance but decrease with lower significance at Kaiserbergtal. Along with that, the direction of movement is decreasing [increasing] for Gianda Grischa, Muragl and Davains [Nair] with high significance, indicating a tendency towards a higher proportion of subsidence [horizontal movement] at higher altitudes. At Kaiserbergtal, absolute seasonality decreases at higher elevation with high significance whereas in the Grison sites they tend to increase with elevation (high significance). Additionally, relative seasonality also increases with high significance towards higher elevations at Gianda Grischa, Muragl and Davains. The correlations with slope are generally rather low. At Nair, slope correlates negatively with horizontal movement (high significance) and positively (at lower significance) with elevation change. Moreover, slope shows negative correlation with elevation change at Davains, Kaiserbergtal (both lower significance) and Gianda Grischa (highly significant). Direction of movement tends to decrease at steeper slopes at Nair and increase at Gianda Grischa with high significance. For all sites except Nair, absolute seasonality tends to decrease at steeper slopes (high significance: Kaiserbergtal, Davains; lower significance: Gianda Grischa, Muragl). Relative seasonality shows a negative correlation with slope at Kaiserbergtal, Gianda Grischa (highly significant) and Davains (lower significance), but a positive correlation with high significance at Nair. With increasing absolute seasonality, we see a lower significant increase in horizontal movement at Nair, and a highly significant and strong increase in elevation change at all other sites. The direction of movement is decreasing with high significance at Gianda Grischa, Muragl and Davains, indicating a higher proportion of subsidence for areas with higher absolute seasonality. With increasing relative seasonality (proportion of seasonal component on the average summer movement) less horizontal movement is observed in all sites (high significance: Gianda Grischa, Muragl, Davains; lower significance: Kaiserbergtal, Nair), whereas a positive increase in elevation change could only be observed at Kaiserbergtal. As a result, the angle of movement tends to decrease for all sites, indicating a higher proportion of subsidence. This effect is highly significant for all sites except Nair (lower significance).
When assessing the timing of the seasonal component (Figure 8), we see a positive correlation with EOS at Muragl, Kaiserbergtal and Davains (all high significance, latter two rather weak). EOS tends to be later at higher elevations for all sites except Gianda Grischa (high significance), though there is no sign that the seasonal movement component starts later at higher elevations. Contrarily, the seasonal component tends to start earlier at higher elevations at Gianda Grischa (high significance; Figure 8). Generally, there is a systematic offset between EOS and start of seasonality ranging from 15 to 80 days (Figure 9).

5. Discussion

5.1. Accuracy of the Yearly DInSAR Displacement Rate and Its Decomposition

In general, the two independent datasets (DInSAR and FT) show good agreement despite the fact that different time spans were covered (DInSAR: 2017–2021; FT: 2015–2019/2019–2021). The comparison of the spatial distribution shows several effects:
(i)
The FT product is unable to detect displacement in case of sun shadow (Grischa, Muragl; Figure 5d,g) or snow cover (Davains; Figure 5k). These areas have to be masked out in the FT approach due to a failure in detecting features because of the strong difference between the images used, whereas DInSAR is independent from lighting conditions. Further, at Gianda Grischa we could visually identify a systematic error in the displacement detection of the northern rock glacier, which is caused by different sun illumination angles between the two acquisitions resulting in shifted shadows of the blocks on the surface (Figure 5d). Hence, inaccuracies of the DInSAR product are rather overestimated, as we do not correct for these artefacts induced by the FT product.
(ii)
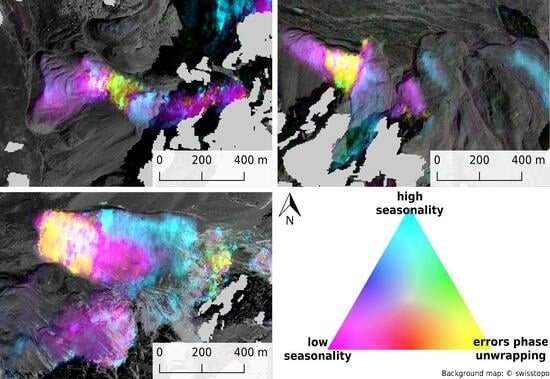
DInSAR shows systematic underestimation of the movement in areas with strong and abrupt changes in displacement values such as at fast moving rock glacier parts near the front (Kaiserbergtal, Davains; Figure 4b and Figure 5l) or adjacent to the lateral boundaries (Muragl; Figure 5h). In these cases, we still observe reduced velocities; it is only at Gianda Grischa that the movement of the middle part of the southern rock glacier is not detected at all (Figure 5e). Such effects are caused by errors in the phase unwrapping process. We observe that the upper detectable boundary of DInSAR displacement is lower than the previously described [34,43] single full phase cycle 2 π , which represents about a 1.7 m/a displacement. At our study sites, phase unwrapping errors start to occur at already half a phase cycle (0.9 m/a), but can occur at down to even less than 0.4 m/a (Figure 5) in unfavorable conditions (e.g., Gianda Grischa). More unwrapping errors in interferograms with longer temporal baselines, which were used to bridge gaps with low coherence due to snowfall events during summer, could partially explain the reduced sensitivity. This highlights the importance of dense C-Band time series for rock glacier monitoring. Phase unwrapping tends to fail preferably at the margins of rock glaciers, where abrupt phase changes occur along with a decorrelation of the signal due to the instability of the surface. Unwrapping errors occur mostly along East-West boundaries due to the reduced number of adjacent pixels in this direction, which is caused by the uneven pixel size (2.3 m in range, 13.9 m in azimuth). Thereby, distinct boundaries in the north-south direction develop for unwrapping affected areas (e.g., Kaiserbergtal, Gianda Grischa, Muragl; Figure 6). Projection to squared pixels in Cartesian coordinates before unwrapping might reduce this tendency and could improve results, but the interpolation and oversampling in an azimuth direction of the wrapped interferograms might cause new artefacts. Therefore, we did not carry out an adapted workflow. Besides such changes in preprocessing, advanced methods for phase unwrapping such as deep-learning-based approaches (e.g., [86,87]) could improve the successful unwrapping of the interferograms.
(iii)
The spatial patterns of the two independent datasets match very well. Even smaller areas and those with weaker displacement rates (e.g., eastern part of Muragl; Figure 5g,h) are congruently detected by both methods. Our results show similar accuracies as other studies with the SD ranging from 0.23 m up to 0.33 m after scaling compared to, e.g., the results of Strozzi et al., 2020 [34] with an SD ranging from 0.20 m to 0.34 m. It is only at Davains that higher inaccuracies are observed because a larger proportion of the investigated area is affected by phase unwrapping issues (Figure 5k–m). However, the scatterplot shows similar good agreement for lower displacement rates (Figure 5m). Hence, the higher spatial sampling does not lead to higher inaccuracies in the aggregated yearly displacement rate and our approach is able to accurately detect movement. Based on an RMSE of around 10 cm (except Davains with more unwrapping issues) and visual inspection of value ranges in stable areas, we state that the lower detectable boundary with 6d interferogram stacks is at around 10 cm/a displacement, which is the limit for active rock glaciers [15]. Our results indicate slightly higher sensitivity than other recent studies [34,43], which might be due to the longer time series used in the stacking procedure [41,42,77,78] which results in a stronger dampening of arbitrary phase contributions from atmosphere or noise. Discriminating areas with displacement rates of less than 10 cm/a need longer temporal baselines [34,43] and more sensitive methods such as small baseline subset (SBAS) InSAR should be used [41,42,45,88].
(iv)
Visual assessment of the displacement maps shows that DInSAR lacks the ability to detect very high-resolution variabilities (e.g., Kaiserbergtal for the elevation change—Figure 4c,d, Nair for outlines of the smaller active lobes—Figure 5a,b). The coverage of such high-resolution spatial variations is more limited in the north-south direction due to the lower azimuth resolution (13.9 m) compared to the range (2.3 m) of Sentinel-1. However, the extent and variations on the scale of a few decameters are captured well. Moreover, the systematic difference in the distribution of horizontal and vertical displacement at Kaiserbergtal (subsidence in western part; increasing horizontal movement towards southeast) agrees well in both methods (Figure 4). Spatial agreement in E-W displacement is also good in areas where less suitable conditions exist for DInSAR, such as areas adjacent to widespread layover and shadow at Gianda Grischa or strong northern orientation at Nair (Figure 5a,b,d,e). Even active areas with a direct northern orientation are highly detectable due to their vertical displacement contribution (see Appendix A Figure A1), which is evident for nearly all rock glaciers. However, neglecting the N-S displacement component leads to incorrect estimates, especially in the vertical displacement. This is twofold: (1) neglecting N-S displacement leads to a systematic increase in the vertical displacement component due to their similar behavior in LOS. (2) The contribution of slope in N-S direction to the vertical displacement component is neglected and, therefore, leads to an overestimation of elevation change in areas with strong N-S displacement.
In conclusion, phase unwrapping remains a critical source of inaccuracy, which should be addressed by more advanced unwrapping techniques. The quantification of total annual velocity is difficult due to DInSAR being limited to stable surface conditions. However, the 6d DInSAR time series is capable of accurately detecting active rock glacier parts and spatial variations in movement rates and its direction on the scale of a few decameters, which provides valuable insights in movement dynamics and direction. Therefore, we can confirm the results of previous studies by successfully applying Sentinel-1 to map active rock glaciers [10,34,41,42,43]. Further, our results highlight that FT, DEM Differencing and DInSAR should be jointly used to derive total displacement from the former two and short-term dynamics from the latter one.

5.2. Insights from Spatial Patterns of Movement Direction and Seasonality

As mentioned in the previous section, Nair is strongly affected by N-S displacement. This might explain the differing behavior in the correlation analysis related to horizontal displacement, elevation change and direction of movement. Hence, Nair is excluded from further analysis in this section.
The tendency towards higher subsidence rates at higher elevations for the lobe shaped rock glaciers at the Grison sites (Figure 7) is in line with previous observations, which showed higher subsidence rates or vertical movement in the root zone of rock glaciers due to plastic deformation [9,16,18,24,32,62,89]. The lack of such a correlation at Kaiserbergtal is probably due to the low elevation range of the main rock glacier body. The decreasing level of elevation change at steeper slopes (Figure 7) indicates that most movement in these areas occurs along the local slope. Surprisingly, no positive correlation between horizontal movement and slopes is observable despite other studies identifying such a link [14,28,62,80]. Most likely, the exclusion of the fastest moving areas due to phase unwrapping errors leads to this effect as these areas show higher slope values during visual inspection than the other rock glacier parts. Moreover, other drivers important for RGV such as ice content, rock glacier thickness as well as the contributing headwall area and the size of the catchment feeding into the landform [14,80] might superimpose the effect of slope on velocity.
Before starting the assessment of the seasonal movement, it has to be highlighted that the observed absolute seasonality does not cover the entire range of the seasonal variability in velocity. Recent studies [19,20,23] showed that the seasonal increase in velocity starts with the penetration of melt water into the shear horizons of rock glaciers. This effect of a seasonal increase during snowmelt is not covered by our approach, as the DInSAR time series is not capable of providing information during the melting phase as wet snow leads to a decorrelation of the SAR signal. The here calculated preseason mean movement ( m e d j u n _ j u l ) describes the velocity after the increase due to available melt water. As we observe areas with high relative seasonality, which show little to no movement in early snow-free period (June/July) but a systematic increase throughout the summer, we assume that melt water or water availability in general plays a limited role for movement in such areas (Figure 6, Appendix A Figure A2 and Figure A3). Further, the start of movement shows a temporal delay of up to several tens of days after EOS. Hence, not availability of snow melt water but rising ground temperatures might trigger processes in these areas and the temporal delay could indicate when rising surface temperatures start to thaw the frozen subsurface after the insulating snow cover disappeared. Besides, areas with high relative seasonality show little to no horizontal movement and, hence, mostly subsidence (Figure 7). Therefore, we assume that areas with a high relative seasonality might show signs of ongoing permafrost degradation (e.g., Muragl glacier forefield, Gianda Grischa northern rock glacier; Figure 6c,d). The observed process of subsidence might be related to degradation of permafrost due to increasing active layer thickness. We cannot conclude whether the movement observed is reversed during winter due to refreeze and heave, as this process would occur during the snow-covered period with very limited DInSAR observations usable. Besides, the movement rate is most likely below the sensitivity of the 6d interferograms stacking methodology.
The spatial distribution of seasonal movement patterns (Figure 6) indicates an increased seasonality towards the upper part of a rock glacier (e.g., Nair, Muragl rock glacier, Davains; Figure 6b,d,e), the root zone, which shows subsidence due to plastic deformation [20,35]. The effect is clearer for rock glaciers with greater lengths (Muragl, Davains). The correlation analysis confirms this trend for all Grison sites (correlation between elevation and absolute seasonality; Figure 7). We also observe a strong correlation between absolute seasonality and increasing subsidence mostly due to higher absolute elevation changes (Figure 7). Additionally, no difference in the temporal delay between start of seasonal increase and end of snow cover could be observed compared to the previously mentioned features of ongoing permafrost degradation. Hence, the observed effect of increasing velocity during the snow-free period might also be related to active layer thawing or increasing permafrost temperatures, leading to higher movement rates. However, previous studies [19,20,23] that observed seasonal increases in velocity during snow-free periods mostly attributed them to strong rainfall events. Hence, the rainfall events might cause acceleration not solely due to increased water availability but also due to the energy transfer of rainwater from the surface (warmed by air and sun illumination) into the active layer. The transported heat would be then available for increasing melt and permafrost temperatures. Energy transport by rain water would also explain why acceleration occurs faster within a few weeks after the end of snow cover, whereas modeled approaches, which use heat conduction only [29] wrongly predict acceleration much later (rather months than weeks after end of snow cover). The rather weak correlation of start of seasonality to EOS (Figure 8) might be due to other effects being more relevant (e.g., mean daily surface temperature after melt, total precipitation after melt). However, further in situ observations such as borehole temperature and inclinometer measurements (e.g., [21,29]) distributed over one rock glacier along with geophysical, surface temperature and precipitation measurements would be necessary to confirm these hypotheses and identify whether the observed acceleration during the snow-free period is caused by subsidence at the near surface driven by temperature and rain water energy transport or by accelerated movement in the shear horizons due to increased water availability and pore pressure.
Besides this systematic increase in seasonality towards the root zone, strong variations in seasonality can also be observed at short distances within rock glaciers (two rock glacier parts at Kaiserbergtal, northern rock glacier at Davains; Figure 6a,e) or at active features adjacent to each other (Muragl; Figure 6d). These systematic differences indicate that the seasonal component is not only driven by external drivers such as elevation and slope but might also be affected by internal factors such as origin, permafrost temperature, ice content or state. As we lack sufficient data on these parameters, we cannot analyze those factors and how they might affect the seasonal component. Hence, movement direction and seasonality are useful to differentiate rock glacier parts with different dynamics and drivers and possibly variations in internal structures. Further in situ measurements and geophysical investigations are required to link the observed movement variations with other parameters to achieve a more holistic understanding of rock glacier dynamics.

6. Conclusions

In this study, we processed and analyzed Sentinel-1 DInSAR time series data over five years for five study sites (size: 0.15–0.65 km 2 , elevation: 2500–3000 m a.s.l.) in the Central Swiss and Austrian Alps using a semi-automated procedure and open source programs to detect small-scale patterns in displacement direction and seasonality. Unlike previous studies, we decomposed LOS displacement from ascending and descending orbit into horizontal E-W displacement and elevation change. Comparison with movement derived from FT and elevation change from DEM differencing showed that DInSAR captures about one third of the total movement, which represents approximately the proportion of the year covered by the DInSAR time series. Accuracies (Pearson R: 0.42–0.74; RMSE: 4.7–11.6 cm; sd: 20–34 cm) are similar to other recent studies (e.g., Strozzi et al. [34]), indicating that the higher spatial sampling of 5 m did not have a negative effect on the accuracy of the product. Systematic underestimation increases in areas with larger displacement rates (>0.4 m/a) due to phase unwrapping errors preferable at the front or lateral margins of rock glaciers but could be addressed in future by more advanced unwrapping methods such as deep learning based approaches (e.g., [86,87]). However, our approach can accurately identify variations in velocity, movement direction and seasonal behavior within rock glaciers on the scale of few decameters also in more challenging settings such as areas adjacent to widespread layover and shadow as well as north oriented rock glacier lobes. Based on our results, the lower detectable boundary with 6 day interferogram stacks is at around 10 cm/a displacement, which is exactly the limit for active rock glaciers [15].
Spatial assessment of movement direction and seasonality showed (Pearson R in brackets): (i) Subsidence over rock glaciers increases with elevation. This effect is clearer at larger rock glaciers with a larger root zone where subsidence occurs due to plastic deformation (0.52–0.79). (ii) Increasing horizontal movement at steeper slopes is most likely obscured by the masking of phase unwrapping errors. (iii) Areas with high relative seasonality show little movement in the first 15 to 80 days after meltout of the snowpack and then preferably increasing subsidence (0.30–0.65) during summer. Hence, rising ground temperatures instead of snow melt water availability might trigger processes in these areas. (iv) Within rock glaciers, absolute seasonality increases towards the root zone (0.34–0.59) along with subsidence (0.49–0.8); additionally, acceleration might be not solely caused by the increased melt water availability here but rather by temperature increases or energy transfer of rainwater from the surface into the subsurface. (v) Strong variations in seasonality occur between adjacent and within rock glaciers, indicating that internal factors such as origin, permafrost temperature, ice content or state might additionally affect seasonality.
In conclusion, our approach for Sentinel-1 6-day DInSAR time series can be used for outlining active rock glaciers as well as monitoring their dynamics, mostly during snow-free conditions. It could be implemented as a near-realtime warning system for rock glacier destabilization but also for longterm assessment of ongoing permafrost degradation. Direction and seasonality of movement are useful to differentiate rock glacier parts with different dynamics and drivers as well as to potentially identify variations in internal structure. However, more in situ measurements and geophysical investigations are required to link the observed movement variations with other parameters to achieve a more holistic understanding of rock glacier dynamics.

Author Contributions

Conceptualization, S.B., T.U. and C.K. (Christof Kneisel); methodology, S.B. and J.H.B.; validation data, J.H.B.; formal analysis, S.B.; investigation, S.B.; visualization, S.B.; writing—original draft preparation, S.B.; writing—review and editing, S.B., J.H.B., C.K. (Claudia Kuenzer), A.S., T.U., M.P. and C.K. (Christof Kneisel); supervision, C.K. (Claudia Kuenzer), A.S., T.U. and C.K. (Christof Kneisel). All authors have read and agreed to the published version of the manuscript.

Funding

This publication was supported by the Open Access Publication Fund of the University of Wurzburg.

Data Availability Statement

All data that support the findings of this study are available from the corresponding author upon reasonable request.

Acknowledgments

We gratefully thank the two anonymous reviewers for their valuable comments.

Conflicts of Interest

The authors declare no conflict of interest.

Abbreviations

The following abbreviations are used in this manuscript:
APSAtmospheric Phase Screen
a.s.l.above sea level
DEMDigital Elevation Model
DInSARDifferential SAR Interferometry
ECVEssential Climate Variable
EMTEnvironmental Motion Tracking
EOSend of snow cover
E-WEast-West
FTFeature Tracking
IPAInternational Permafrost Association
LOSLine of Sight
MCFMinimum Cost Flow
N-SNorth-South
OTBOrfeo Toolbox
RGVRock glacier velocity
RMSERoot Mean Squared Error
SARSynthetic Aperture Radar
SBASSmall Baseline Subset
sdStandard Deviation
SLCSingle Look Complex
UAVunpiloted aerial vehicle
U-DUp-Down

Appendix A

Appendix A.1

Figure A1. Overview on all parameters derived with Feature Tracking as well as Differential SAR Interferometry (DInSAR). The last column shows, which areas have been included into the correlation analysis (Figure 7 and Figure 8). Background: ©Google Satellite, ©swisstopo.
Remotesensing 15 02982 g0a1

Appendix A.2

Figure A2. Maps showing the seasonality of all study sites for all available orbits. Seasonality is visualized in an additive RGB coloring (see also Figure 6) with the red band representing the preseason median 6d displacement m e d j u n _ j u l , the blue band representing the median 6d displacement in September ( m e d s e p t e m b e r ) and the green band representing the absolute difference between the former two values ( s e a s o n a l i t y a b s ). Background: ©Google Satellite, ©swisstopo.
Remotesensing 15 02982 g0a2

Appendix A.3

Figure A3. Maps showing the relative seasonality of all study sites for all available orbits. Background: ©Google Satellite, ©swisstopo.
Remotesensing 15 02982 g0a3

Appendix B

Table A1. Overview of used software.
SoftwareVersionProcessing Steps
SNAP
(accessed via snappy)
v8.0.3Preprocessing: Apply Orbit File, TOPSAR Split & Deburst
Coregistration: Backgeocoding, Enhanced Spectral Diversity
Interferogram: Calculation of Phase, Topographic Phase removal, Goldstein Phase Filter
Projection to map coordinates
snaphuv2.0.4Phase unwrapping (MCF algorithm)
pyratev0.5.0Reference Phase: Detection of stable area; Calculation of Reference Phase
Corrections: Mask low coherence areas; orbit error correction
Atmospheric Phase Screen: spatial and temporal low-pass gaussian filter
Conversion of phase to displacement
Agisoft Metashape Professional1.7.2Structure from motion point cloud generation from UAV imagery
Generation of digital elevation model
Environmental Motion Tracker0.9.3UAV hillshade/orthophoto image coregistration
Feature Tracking in coregistered UAV hillshade/orthophoto
Orfeo Toolbox8.1.0Preparation of dataset for segmentation: stacking, normalization
Segmentation of rock glacier areas into segments of similar dynamics

References

  1. French, H.M. The Periglacial Environment; John Wiley & Sons: Hoboken, NJ, USA, 2017. [Google Scholar]
  2. Etzelmüller, B.; Guglielmin, M.; Hauck, C.; Hilbich, C.; Hoelzle, M.; Isaksen, K.; Noetzli, J.; Oliva, M.; Ramos, M. Twenty years of European mountain permafrost dynamics—The PACE legacy. Environ. Res. Lett. 2020, 15, 104070. [Google Scholar] [CrossRef]
  3. World Meteorological Organization (WMO). The 2022 GCOS ECVs Requirements (GCOS 245). Available online: https://library.wmo.int/doc_num.php?explnum_id=11318 (accessed on 27 January 2023).
  4. Hock, R.; Rasul, G.; Adler, C.; Cáceres, B.; Gruber, S.; Hirabayashi, Y.; Jackson, M.; Kääb, A.; Kang, S.; Kutuzov, S.; et al. High Mountain Areas; The Intergovernmental Panel on Climate Change (IPCC); Cambridge University Press: Cambridge, UK, 2019. [Google Scholar]
  5. Wagner, T.; Kainz, S.; Helfricht, K.; Fischer, A.; Avian, M.; Krainer, K.; Winkler, G. Assessment of liquid and solid water storage in rock glaciers versus glacier ice in the Austrian Alps. Sci. Total. Environ. 2021, 800, 149593. [Google Scholar] [CrossRef]
  6. Delaloye, R.; Lambiel, C.; Gärtner-Roer, I. Overview of rock glacier kinematics research in the Swiss Alps. Geogr. Helv. 2010, 65, 135–145. [Google Scholar] [CrossRef]
  7. Beniston, M.; Farinotti, D.; Stoffel, M.; Andreassen, L.M.; Coppola, E.; Eckert, N.; Fantini, A.; Giacona, F.; Hauck, C.; Huss, M.; et al. The European mountain cryosphere: A review of its current state, trends, and future challenges. Cryosphere 2018, 12, 759–794. [Google Scholar] [CrossRef] [Green Version]
  8. Philipp, M.; Dietz, A.; Buchelt, S.; Kuenzer, C. Trends in Satellite Earth Observation for Permafrost Related Analyses—A Review. Remote. Sens. 2021, 13, 1217. [Google Scholar] [CrossRef]
  9. Haeberli, W.; Hallet, B.; Arenson, L.; Elconin, R.; Humlum, O.; Kääb, A.; Kaufmann, V.; Ladanyi, B.; Matsuoka, N.; Springman, S.; et al. Permafrost creep and rock glacier dynamics. Permafr. Periglac. Process. 2006, 17, 189–214. [Google Scholar] [CrossRef]
  10. Bertone, A.; Barboux, C.; Bodin, X.; Bolch, T.; Brardinoni, F.; Caduff, R.; Christiansen, H.H.; Darrow, M.M.; Delaloye, R.; Etzelmüller, B.; et al. Incorporating InSAR kinematics into rock glacier inventories: Insights from 11 regions worldwide. Cryosphere 2022, 16, 2769–2792. [Google Scholar] [CrossRef]
  11. Barsch, D. Rockglaciers: Indicators for the Present and Former Geoecology in High Mountain Environments; Springer Science & Business Media: Berlin/Heidelberg, Germany, 2012. [Google Scholar]
  12. Vivero, S.; Lambiel, C. Monitoring the crisis of a rock glacier with repeated UAV surveys. Geogr. Helv. 2019, 74, 59–69. [Google Scholar] [CrossRef]
  13. Marcer, M.; Cicoira, A.; Cusicanqui, D.; Bodin, X.; Echelard, T.; Obregon, R.; Schoeneich, P. Rock glaciers throughout the French Alps accelerated and destabilised since 1990 as air temperatures increased. Commun. Earth Environ. 2021, 2, 1–11. [Google Scholar] [CrossRef]
  14. Groh, T.; Blöthe, J.H. Rock Glacier Kinematics in the Kaunertal, Ötztal Alps, Austria. Geosciences 2019, 9, 373. [Google Scholar] [CrossRef] [Green Version]
  15. RGIK—Kinematic. Optional Kinematic Attribute in Standardized Rock Glacier Inventories, IPA Action Group Rock Glacier Inventories and Kinematics. Available online: https://bigweb.unifr.ch/Science/Geosciences/Geomorphology/Pub/Website/IPA/CurrentVersion/Current_KinematicalAttribute.pdf (accessed on 16 February 2023).
  16. Kaufmann, V.; Kellerer-Pirklbauer, A.; Seier, G. Conventional and UAV-Based Aerial Surveys for Long-Term Monitoring (1954–2020) of a Highly Active Rock Glacier in Austria. Front. Remote Sens. 2021, 2, 33. [Google Scholar] [CrossRef]
  17. Haberkorn, A.; Kenner, R.; Noetzli, J.; Phillips, M. Changes in Ground Temperature and Dynamics in Mountain Permafrost in the Swiss Alps. Front. Earth Sci. 2021, 9, 626686. [Google Scholar] [CrossRef]
  18. Fleischer, F.; Haas, F.; Piermattei, L.; Pfeiffer, M.; Heckmann, T.; Altmann, M.; Rom, J.; Stark, M.; Wimmer, M.H.; Pfeifer, N.; et al. Multi-decadal (1953–2017) rock glacier kinematics analysed by high-resolution topographic data in the upper Kaunertal, Austria. Cryosphere 2021, 15, 5345–5369. [Google Scholar] [CrossRef]
  19. Wirz, V.; Gruber, S.; Purves, R.S.; Beutel, J.; Gärtner-Roer, I.; Gubler, S.; Vieli, A. Short-term velocity variations at three rock glaciers and their relationship with meteorological conditions. Earth Surf. Dyn. 2016, 4, 103–123. [Google Scholar] [CrossRef] [Green Version]
  20. Kenner, R.; Phillips, M.; Beutel, J.; Hiller, M.; Limpach, P.; Pointner, E.; Volken, M. Factors Controlling Velocity Variations at Short-Term, Seasonal and Multiyear Time Scales, Ritigraben Rock Glacier, Western Swiss Alps. Permafr. Periglac. Process. 2017, 28, 675–684. [Google Scholar] [CrossRef]
  21. Buchli, T.; Kos, A.; Limpach, P.; Merz, K.; Zhou, X.; Springman, S.M. Kinematic investigations on the Furggwanghorn Rock Glacier, Switzerland. Permafr. Periglac. Process. 2018, 29, 3–20. [Google Scholar] [CrossRef]
  22. Cicoira, A.; Beutel, J.; Faillettaz, J.; Vieli, A. Water controls the seasonal rhythm of rock glacier flow. Earth Planet. Sci. Lett. 2019, 528, 115844. [Google Scholar] [CrossRef]
  23. Kenner, R.; Pruessner, L.; Beutel, J.; Limpach, P.; Phillips, M. How rock glacier hydrology, deformation velocities and ground temperatures interact: Examples from the Swiss Alps. Permafr. Periglac. Process. 2020, 31, 3–14. [Google Scholar] [CrossRef]
  24. Fleischer, F.; Haas, F.; Altmann, M.; Rom, J.; Knoflach, B.; Becht, M. Combination of historical and modern data to decipher the geomorphic evolution of the Innere Ölgruben rock glacier, Kaunertal, Austria, over almost a century (1922–2021). Permafr. Periglac. Process. 2023, 34, 3–21. [Google Scholar] [CrossRef]
  25. Hartl, L.; Zieher, T.; Bremer, M.; Stocker-Waldhuber, M.; Zahs, V.; Höfle, B.; Klug, C.; Cicoira, A. Multi-sensor monitoring and data integration reveal cyclical destabilization of the Äußeres Hochebenkar rock glacier. Earth Surf. Dyn. Discuss. 2023, 11, 117–147. [Google Scholar] [CrossRef]
  26. Ikeda, A.; Matsuoka, N.; Kääb, A. Fast deformation of perennially frozen debris in a warm rock glacier in the Swiss Alps: An effect of liquid water. J. Geophys. Res. Earth Surf. 2008, 113, 1–12. [Google Scholar] [CrossRef] [Green Version]
  27. Kääb, A.; Frauenfelder, R.; Roer, I. On the response of rockglacier creep to surface temperature increase. Glob. Planet. Chang. 2007, 56, 172–187. [Google Scholar] [CrossRef]
  28. Cicoira, A.; Marcer, M.; Gärtner-Roer, I.; Bodin, X.; Arenson, L.U.; Vieli, A. A general theory of rock glacier creep based on in-situ and remote sensing observations. Permafr. Periglac. Process. 2021, 32, 139–153. [Google Scholar] [CrossRef]
  29. Cicoira, A.; Beutel, J.; Faillettaz, J.; Gärtner-Roer, I.; Vieli, A. Resolving the influence of temperature forcing through heat conduction on rock glacier dynamics: A numerical modelling approach. Cryosphere 2019, 13, 927–942. [Google Scholar] [CrossRef] [Green Version]
  30. Cicoira, A.; Weber, S.; Biri, A.; Buchli, B.; Delaloye, R.; Da Forno, R.; Gärtner-Roer, I.; Gruber, S.; Gsell, T.; Hasler, A.; et al. In situ observations of the Swiss periglacial environment using GNSS instruments. Earth Syst. Sci. Data 2022, 14, 5061–5091. [Google Scholar] [CrossRef]
  31. Gärtner-Roer, I.; Brunner, N.; Delaloye, R.; Haeberli, W.; Kääb, A.; Thee, P. Glacier–permafrost relations in a high-mountain environment: 5 decades of kinematic monitoring at the Gruben site, Swiss Alps. Cryosphere 2022, 16, 2083–2101. [Google Scholar] [CrossRef]
  32. Fey, C.; Krainer, K. Analyses of UAV and GNSS based flow velocity variations of the rock glacier Lazaun (Ötztal Alps, South Tyrol, Italy). Geomorphology 2020, 365, 107261. [Google Scholar] [CrossRef]
  33. Kääb, A.; Strozzi, T.; Bolch, T.; Caduff, R.; Trefall, H.; Stoffel, M.; Kokarev, A. Inventory and changes of rock glacier creep speeds in Ile Alatau and Kungöy Ala-Too, northern Tien Shan, since the 1950s. Cryosphere 2021, 15, 927–949. [Google Scholar] [CrossRef]
  34. Strozzi, T.; Caduff, R.; Jones, N.; Barboux, C.; Delaloye, R.; Bodin, X.; Kääb, A.; Mätzler, E.; Schrott, L. Monitoring Rock Glacier Kinematics with Satellite Synthetic Aperture Radar. Remote Sens. 2020, 12, 559. [Google Scholar] [CrossRef] [Green Version]
  35. Brencher, G.; Handwerger, A.L.; Munroe, J.S. InSAR-based characterization of rock glacier movement in the Uinta Mountains, Utah, USA. Cryosphere 2021, 15, 4823–4844. [Google Scholar] [CrossRef]
  36. Kunz, J.; Ullmann, T.; Kneisel, C. Internal structure and recent dynamics of a moraine complex in an alpine glacier forefield revealed by geophysical surveying and Sentinel-1 InSAR time series. Geomorphology 2022, 398, 108052. [Google Scholar] [CrossRef]
  37. Reinosch, E.; Buckel, J.; Dong, J.; Gerke, M.; Baade, J.; Riedel, B. InSAR time series analysis of seasonal surface displacement dynamics on the Tibetan Plateau. Cryosphere 2020, 14, 1633–1650. [Google Scholar] [CrossRef]
  38. Reinosch, E.; Gerke, M.; Riedel, B.; Schwalb, A.; Ye, Q.; Buckel, J. Rock glacier inventory of the western Nyainqêntanglha Range, Tibetan Plateau, supported by InSAR time series and automated classification. Permafr. Periglac. Process. 2021, 32, 657–672. [Google Scholar] [CrossRef]
  39. Buckel, J.; Reinosch, E.; Hördt, A.; Zhang, F.; Riedel, B.; Gerke, M.; Schwalb, A.; Mäusbacher, R. Insights into a remote cryosphere: A multi-method approach to assess permafrost occurrence at the Qugaqie basin, western Nyainqêntanglha Range, Tibetan Plateau. Cryosphere 2021, 15, 149–168. [Google Scholar] [CrossRef]
  40. Buckel, J.; Reinosch, E.; Voigtländer, A.; Dietze, M.; Bücker, M.; Krebs, N.; Schroeckh, R.; Mäusbacher, R.; Hördt, A. Rock Glacier Characteristics Under Semiarid Climate Conditions in the Western Nyainqêntanglha Range, Tibetan Plateau. J. Geophys. Res. Earth Surf. 2022, 127, e2021JF006256. [Google Scholar] [CrossRef]
  41. Rouyet, L.; Lauknes, T.R.; Christiansen, H.H.; Strand, S.M.; Larsen, Y. Seasonal dynamics of a permafrost landscape, Adventdalen, Svalbard, investigated by InSAR. Remote Sens. Environ. 2019, 231, 111236. [Google Scholar] [CrossRef]
  42. Rouyet, L.; Lilleøren, K.S.; Böhme, M.; Vick, L.M.; Delaloye, R.; Etzelmüller, B.; Lauknes, T.R.; Larsen, Y.; Blikra, L.H. Regional Morpho-Kinematic Inventory of Slope Movements in Northern Norway. Front. Earth Sci. 2021, 9, 681088. [Google Scholar] [CrossRef]
  43. Villarroel, C.D.; Tamburini Beliveau, G.; Forte, A.P.; Monserrat, O.; Morvillo, M. DInSAR for a Regional Inventory of Active Rock Glaciers in the Dry Andes Mountains of Argentina and Chile with Sentinel-1 Data. Remote Sens. 2018, 10, 1588. [Google Scholar] [CrossRef] [Green Version]
  44. Villarroel, C.D.; Ortiz, D.A.; Forte, A.P.; Tamburini Beliveau, G.; Ponce, D.; Imhof, A.; López, A. Internal structure of a large, complex rock glacier and its significance in hydrological and dynamic behavior: A case study in the semi-arid Andes of Argentina. Permafr. Periglac. Process. 2022, 33, 78–95. [Google Scholar] [CrossRef]
  45. Lilleøren, K.S.; Etzelmüller, B.; Rouyet, L.; Eiken, T.; Slinde, G.; Hilbich, C. Transitional rock glaciers at sea level in northern Norway. Earth Surf. Dyn. 2022, 10, 975–996. [Google Scholar] [CrossRef]
  46. De Luca, C.; Zinno, I.; Manunta, M.; Lanari, R.; Casu, F. Large areas surface deformation analysis through a cloud computing P-SBAS approach for massive processing of DInSAR time series. Remote Sens. Environ. 2017, 202, 3–17. [Google Scholar] [CrossRef]
  47. Crippa, C.; Agliardi, F. Practical Estimation of Landslide Kinematics Using PSI Data. Geosciences 2021, 11, 214. [Google Scholar] [CrossRef]
  48. Delgado Blasco, J.M.; Foumelis, M.; Stewart, C.; Hooper, A. Measuring Urban Subsidence in the Rome Metropolitan Area (Italy) with Sentinel-1 SNAP-StaMPS Persistent Scatterer Interferometry. Remote Sens. 2019, 11, 129. [Google Scholar] [CrossRef] [Green Version]
  49. Fernandez, J.; Prieto, J.; Escayo, J.; Camacho, A.; Luzon, F.; Tiampo, K.; Palano, M.; Abajo, T.; Pérez-Martín, E.; Velasco-Gómez, J.; et al. Modeling the two- and three-dimensional displacement field in Lorca, Spain, subsidence and the global implications. Sci. Rep. 2018, 8, 1–14. [Google Scholar] [CrossRef] [Green Version]
  50. Halla, C.; Blöthe, J.H.; Tapia Baldis, C.; Trombotto Liaudat, D.; Hilbich, C.; Hauck, C.; Schrott, L. Ice content and interannual water storage changes of an active rock glacier in the dry Andes of Argentina. Cryosphere 2021, 15, 1187–1213. [Google Scholar] [CrossRef]
  51. GeoScience Australia. PyRate Documentation. Available online: https://geoscienceaustralia.github.io/PyRate/ (accessed on 21 February 2023).
  52. Mccubbine, J.; Du, Z.; Ojha, C.; Garthwaite, M.; Brown, N. InSAR processing over the Great Artesian Basin and analysis over the western Eromanga Basin and northern Surat Basin; Geoscience Australia: Canberra, Australia, 2022. [Google Scholar] [CrossRef]
  53. Wang, L.W.; Garthwaite, M.; Du, Z.; Deane, A.; McCubbine, J.; Wheeler, M.; O’Hehir, A.; Davies, B. InSAR Analysis Ready Data. In Proceedings of the IGARSS 2022—2022 IEEE International Geoscience and Remote Sensing Symposium, Kuala Lumpur, Malaysia, 17–22 July 2022; pp. 2920–2923. [Google Scholar] [CrossRef]
  54. Hausmann, H.; Krainer, K.; Brückl, E.; Ullrich, C. Internal structure, ice content and dynamics of Ölgrube and Kaiserberg rock glaciers (Ötztal Alps, Austria) determined from geophysical surveys. Austrian J. Earth Sci. 2012, 105, 12–31. [Google Scholar]
  55. Krainer, K.; Mostler, W. Hydrology of Active Rock Glaciers: Examples from the Austrian Alps. Arctic Antarct. Alp. Res. 2002, 34, 142–149. [Google Scholar] [CrossRef]
  56. Emmert, A.A. The Internal Structure of Periglacial Landforms-Assessments of Subsurface Variations in Permafrost-Related and Frost-Related Phenomena by Multi-Dimensional Geophysical Investigations. Ph.D. Thesis, Würzburg University Press, Würzburg, Germany, 2020. [Google Scholar] [CrossRef]
  57. Ikeda, A.; Matsuoka, N. Pebbly versus bouldery rock glaciers: Morphology, structure and processes. Geomorphology 2006, 73, 279–296. [Google Scholar] [CrossRef]
  58. Emmert, A.; Kneisel, C. Internal structure of two alpine rock glaciers investigated by quasi-3-D electrical resistivity imaging. Cryosphere 2017, 11, 841–855. [Google Scholar] [CrossRef] [Green Version]
  59. Buckel, J.; Mudler, J.; Gardeweg, R.; Hauck, C.; Hilbich, C.; Frauenfelder, R.; Kneisel, C.; Buchelt, S.; Blöthe, J.H.; Hördt, A.; et al. Identifying mountain permafrost degradation by repeating historical ERT-measurements. Cryosphere Discuss. 2022, 2022, 1–36. [Google Scholar] [CrossRef]
  60. Frauenfelder, R.; Laustela, M.; Kääb, A. Relative age dating of Alpine rockglacier surfaces. Z. Geomorphol. 2005, 49, 145–166. [Google Scholar]
  61. Frauenfelder, R.; Hauck, C.; Hilbich, C.; Kneisel, C.; Hoelzle, M. An integrative observation of kinematics and geophysical parameters of Gianda Grischa rock glacier, Upper Engadine, Swiss Alps. In Proceedings of the 9th International Conference on Permafrost, Fairbanks, AK, USA, 29 June–3 July 2008; pp. 463–468. [Google Scholar]
  62. Kääb, A.; Kaufmann, V.; Ladstädter, R.; Eiken, T. Rock glacier dynamics: Implications from high-resolution measurements of surface velocity fields. Permafrost 2003, 1, 501–506. [Google Scholar]
  63. Maurer, H.; Hauck, C. Geophysical imaging of alpine rock glaciers. J. Glaciol. 2007, 53, 110–120. [Google Scholar] [CrossRef] [Green Version]
  64. Hauck, C.; Böttcher, M.; Maurer, H. A new model for estimating subsurface ice content based on combined electrical and seismic data sets. Cryosphere 2011, 5, 453–468. [Google Scholar] [CrossRef] [Green Version]
  65. Arenson, L.; Hoelzle, M.; Springman, S. Borehole deformation measurements and internal structure of some rock glaciers in Switzerland. Permafr. Periglac. Process. 2002, 13, 117–135. [Google Scholar] [CrossRef]
  66. Kneisel, C.; Emmert, A.; Kästl, J. Application of 3D electrical resistivity imaging for mapping frozen ground conditions exemplified by three case studies. Geomorphology 2014, 210, 71–82. [Google Scholar] [CrossRef]
  67. Kneisel, C.; Kääb, A. Mountain permafrost dynamics within a recently exposed glacier forefield inferred by a combined geomorphological, geophysical and photogrammetrical approach. Earth Surf. Process. Landforms 2007, 32, 1797–1810. [Google Scholar] [CrossRef]
  68. Kneisel, C. New insights into mountain permafrost occurrence and characteristics in glacier forefields at high altitude through the application of 2D resistivity imaging. Permafr. Periglac. Process. 2004, 15, 221–227. [Google Scholar] [CrossRef]
  69. Kunz, J.; Kneisel, C. Glacier–Permafrost Interaction at a Thrust Moraine Complex in the Glacier Forefield Muragl, Swiss Alps. Geosciences 2020, 10, 205. [Google Scholar] [CrossRef]
  70. Kääb, A.; Kneisel, C. Permafrost creep within a recently deglaciated glacier forefield: Muragl, Swiss Alps. Permafr. Periglac. Process. 2006, 17, 79–85. [Google Scholar] [CrossRef]
  71. Peters, T.; Dietrich, V.J. Erläuterungen zu Blatt 1256 Bivio. In Geologischer Atlas der Schweiz 1: 25 000; Bundesamt für Landestopographie: Wabern, Switzerland, 2008. [Google Scholar]
  72. Alaska Satellite Facility. Copernicus Sentinel Data 2017–21, Retrieved from ASF DAAC, Processed by ESA. Available online: https://search.asf.alaska.edu/ (accessed on 15 September 2022).
  73. Federal Office of Topography Swisstopo. swissALTI3D. The High Precision Digital Elevation Model of Switzerland. Available online: https://www.swisstopo.admin.ch/de/geodata/height/alti3d.html (accessed on 27 April 2023).
  74. Land Tirol. Terrain Data Tyrol: Digital Terrain Model (DTM/DGM). Available online: https://www.data.gv.at/katalog/en/dataset/land-tirol_tirolgelnde (accessed on 27 April 2023).
  75. Goldstein, R.M.; Werner, C.L. Radar interferogram filtering for geophysical applications. Geophys. Res. Lett. 1998, 25, 4035–4038. [Google Scholar] [CrossRef] [Green Version]
  76. Chen, C.; Zebker, H. Phase unwrapping for large SAR interferograms: Statistical segmentation and generalized network models. IEEE Trans. Geosci. Remote Sens. 2002, 40, 1709–1719. [Google Scholar] [CrossRef] [Green Version]
  77. Lyons, S.; Sandwell, D. Fault creep along the southern San Andreas from interferometric synthetic aperture radar, permanent scatterers, and stacking. J. Geophys. Res. Solid Earth 2003, 108, 1831. [Google Scholar] [CrossRef]
  78. Sandwell, D.T.; Price, E.J. Phase gradient approach to stacking interferograms. J. Geophys. Res. Solid Earth 1998, 103, 30183–30204. [Google Scholar] [CrossRef] [Green Version]
  79. Fuhrmann, T.; Garthwaite, M. Resolving Three-Dimensional Surface Motion with InSAR: Constraints from Multi-Geometry Data Fusion. Remote Sens. 2019, 11, 241. [Google Scholar] [CrossRef] [Green Version]
  80. Blöthe, J.H.; Halla, C.; Schwalbe, E.; Bottegal, E.; Trombotto Liaudat, D.; Schrott, L. Surface velocity fields of active rock glaciers and ice-debris complexes in the Central Andes of Argentina. Earth Surf. Process. Landforms 2021, 46, 504–522. [Google Scholar] [CrossRef]
  81. Vivero, S.; Bodin, X.; Farías-Barahona, D.; MacDonell, S.; Schaffer, N.; Robson, B.A.; Lambiel, C. Combination of Aerial, Satellite, and UAV Photogrammetry for Quantifying Rock Glacier Kinematics in the Dry Andes of Chile (30°S) Since the 1950s. Front. Remote Sens. 2021, 2, 784015. [Google Scholar] [CrossRef]
  82. Schwalbe, E.; Maas, H.G. The determination of high-resolution spatio-temporal glacier motion fields from time-lapse sequences. Earth Surf. Dyn. 2017, 5, 861–879. [Google Scholar] [CrossRef] [Green Version]
  83. Förstner, W. A feature based correspondence algorithm for image matching. ISPRS ComIII Rovan. 1986, 26-3, 150–166. [Google Scholar]
  84. Federal Office of Topography Swisstopo. SWISSIMAGE. The Digital Color Orthophotomosaic of Switzerland. Available online: https://www.swisstopo.admin.ch/en/geodata/images/ortho/swissimage10.html (accessed on 29 April 2023).
  85. Buchelt, S.; Skov, K.; Rasmussen, K.K.; Ullmann, T. Sentinel-1 time series for mapping snow cover depletion and timing of snowmelt in Arctic periglacial environments: Case study from Zackenberg and Kobbefjord, Greenland. Cryosphere 2022, 16, 625–646. [Google Scholar] [CrossRef]
  86. Sica, F.; Calvanese, F.; Scarpa, G.; Rizzoli, P. A CNN-Based Coherence-Driven Approach for InSAR Phase Unwrapping. IEEE Geosci. Remote Sens. Lett. 2022, 19, 1–5. [Google Scholar] [CrossRef]
  87. Li, L.; Zhang, H.; Tang, Y.; Wang, C.; Gu, F. InSAR Phase Unwrapping by Deep Learning Based on Gradient Information Fusion. IEEE Geosci. Remote Sens. Lett. 2022, 19, 1–5. [Google Scholar] [CrossRef]
  88. Berardino, P.; Fornaro, G.; Lanari, R.; Sansosti, E. A new algorithm for surface deformation monitoring based on small baseline differential SAR interferograms. IEEE Trans. Geosci. Remote Sens. 2002, 40, 2375–2383. [Google Scholar] [CrossRef] [Green Version]
  89. Seppi, R.; Carturan, L.; Carton, A.; Zanoner, T.; Zumiani, M.; Cazorzi, F.; Bertone, A.; Baroni, C.; Salvatore, M.C. Decoupled kinematics of two neighbouring permafrost creeping landforms in the Eastern Italian Alps. Earth Surf. Process. Landforms 2019, 44, 2703–2719. [Google Scholar] [CrossRef]
Figure 1. Overview map of the study sites. (a,b) Location of the study sites in the Central Alps. (c,e,g,i,k) Maps of the respective sites with white polygon showing the outline of the rock glacier units. (d,f,j,l) Photographs of the respective study sites taken by J. Blöthe (d) and S. Buchelt (f,j,l). (h) Google Earth Image of Gianda Grischa. For better orientation, selected landforms are highlighted with orange numbers in the maps and photographs. Background maps: ©Google Satellite (b,c), ©swisstopo (b,e,g,i,l).
Remotesensing 15 02982 g001
Figure 2. Flowchart of the study presenting five major parts of the methodology: (i) Generation of the Differential SAR Interferometry (DInSAR) displacement time series from Sentinel-1 single look complex (SLC) data. (ii) Decomposition of line-of-sight (LOS) displacement from ascending and descending orbit into horizontal East-West and vertical Up-Down displacement. Consecutively, elevation change and direction of movement are derived. (iii) Generation of reference data from orthophotos and UAV imagery to assess the accuracy of decomposed DInSAR displacement rates. (iv) Calculation of seasonal movement. (v) Correlation analysis of the spatiotemporal dynamics.
Remotesensing 15 02982 g002
Figure 3. Schematic description of East-West ( d E _ W ) and Up-Down ( d U _ D ) displacement decomposition from ascending and descending line-of-sight (LOS) displacement ( d L O S _ A S C ; d L O S _ D E S C ). Besides, elevation change ( d z ) and direction of movement ( τ d i r ) are also depicted. Modified from [47].
Remotesensing 15 02982 g003
Figure 4. Comparison of annual horizontal East-West displacement and elevation change of the Kaiserbergtal study site. The left column shows (a) E-W displacement from Feature Tracking and (c) elevation change from DEM differencing based on the UAV imagery. The middle column shows the respective (b) E-W displacement and (d) the elevation change derived from DInSAR. The white outline shows the area covered by the UAV reference dataset. (e) The scatterplot describes the distribution of the measurements; contour lines show kernel density estimates (levels: 0.3; 0.5; 0.7; 0.9). Background maps: ©Google Satellite.
Remotesensing 15 02982 g004
Figure 5. Comparison of annual horizontal E-W displacement of the study sites in Grison: (ac) Nair, (df) Gianda Grischa, (gi) Muragl, (jl) Davains. The left column shows result from Feature Tracking based on the orthophotos. The middle column shows the respective E-W displacement derived from DInSAR. The right column shows scatterplots of these two independent datasets with contour lines highlighting kernel density estimates (levels: 0.3; 0.5; 0.7; 0.9). The white outline in the maps (50 m buffer around rock glacier units) was used to exclude areas outside from analysis. Background maps: ©swisstopo.
Remotesensing 15 02982 g005
Figure 6. Maps showing the seasonality of all study sites: (a) Kaiserbergtal; (b) Nair; (c) Gianda Grischa; (d) Muragl; (e) Tellers Davains. Seasonality is visualized in an additive RGB coloring with the red band representing the preseason median 6d displacement m e d j u n _ j u l , the blue band representing the median 6d displacement in September ( m e d s e p t e m b e r ) and the green band representing the absolute difference between the former two values ( s e a s o n a l i t y a b s ). The white bounding box in the maps (50 m buffer around rock glacier units) was used to exclude areas outside from analysis. Background maps: ©Google Satellite, ©swisstopo.
Remotesensing 15 02982 g006
Figure 7. Pearson matrix assessing correlation between displacement intensity, direction and seasonality as well as elevation and slope. Significant values are highlighted with their respective p-values as follows: * p < 0.01; ** p < 0.001. The number of segments used for the respective analysis is shown in the lower part of the figure.
Remotesensing 15 02982 g007
Figure 8. Pearson matrix assessing correlation between timing of melt (approach by Buchelt et al., 2022 [85]), timing of seasonality ( s e a s o n _ s t a r t ) and elevation. Significant values are highlighted with their respective p-values as follows: ** p < 0.001. The number of observations used for the respective analysis is shown in the lower part of the figure.
Remotesensing 15 02982 g008
Figure 9. Kernel density estimate plots of end-of-snowcover date (approach by Buchelt et al., 2022 [85]) against start of seasonality date ( s e a s o n _ s t a r t ).
Remotesensing 15 02982 g009
Disclaimer/Publisher’s Note: The statements, opinions and data contained in all publications are solely those of the individual author(s) and contributor(s) and not of MDPI and/or the editor(s). MDPI and/or the editor(s) disclaim responsibility for any injury to people or property resulting from any ideas, methods, instructions or products referred to in the content.

