Article

Spatiotemporal Variation and Quantitative Attribution of Carbon Storage Based on Multiple Satellite Data and a Coupled Model for Jinan City, China

1
Institute of Strategic Planning, Chinese Academy of Environmental Planning, Beijing 100041, China
2
Lhasa Plateau Ecosystem Research Station, Key Laboratory of Ecosystem Network Observation and Modeling, Institute of Geographic Sciences and Natural Resources Research, Chinese Academy of Sciences, Beijing 100101, China
*
Author to whom correspondence should be addressed.
These authors contributed equally to this work.
Remote Sens. 2023, 15(18), 4472; https://doi.org/10.3390/rs15184472
Submission received: 13 July 2023 / Revised: 29 August 2023 / Accepted: 30 August 2023 / Published: 12 September 2023
(This article belongs to the Special Issue Remote Sensing in Natural Resource and Water Environment II)

Abstract

:
Rapidly predicting and revealing the spatiotemporal characteristics and driving factors of land-use changes in carbon storage within megacities under different scenarios is crucial to achieving sustainable development. In this study, Jinan City (JNC) is taken as the study area, and the Markov-FLUS-InVEST model is utilized to predict and analyze the spatiotemporal variation in carbon storage in 2030 under three scenarios, namely, the natural development scenario (S1), the ecological conservation scenario (S2), and the economic development scenario (S3). The drivers of carbon storage changes were identified using an optimal parameter-based geographic detection (OPGD) model. The findings indicate that (1) land use from 2010 to 2018 shows a trend of continuous expansion of construction land and reduction in arable land. (2) The main types of carbon pools were cropland, forest, and grassland, accounting for more than 96% of the total amount. Carbon storage showed a decreasing trend from 2010 to 2018, and the main type of carbon pool that decreased was cropland. The center of gravity of carbon storage increases and decreases was located in the southern Lixia District, and the center of gravity of increase and decrease moved to the southwest by 3057.48 m and 1478.57 m, respectively. (3) From 2018 to 2030, the reductions in carbon stocks were 3.20 × 10⁶ t (S1), 2.60 × 10⁶ t (S2), and 4.26 × 10⁶ t (S3), and the carbon release was about 9 times (S1), 4 times (S2), and 10 times (S3) that of the carbon sink. (4) The contribution of slope (A2) ∩ nighttime light index (B6) and elevation (A1) ∩ nighttime light index (B6) to the regional heterogeneity of carbon stocks was the largest among the interaction drivers. To sum up, this study deepens the simulation of spatial and temporal dynamics of carbon storage under land-use changes in megacities and the related driving mechanism, which can provide the basis for scientific decision-making for cities to conduct territorial spatial planning and ecological protection and restoration.

1. Introduction

Increased urbanization will lead to a corresponding increase in land cover [1,2]. As a vital ecosystem service, carbon storage plays an essential role in fixing CO2, maintaining the global carbon cycle, and mitigating climate warming [3,4]. Due to the difference in the carbon intensity of each land use type, carbon storage is directly or indirectly influenced by land-use/land-cover changes [5,6], such as structural changes, material flow, and information transfer in urban ecosystems [3,7]. With the target of the SDGs and the carbon peak and carbon neutrality target proposed [8], it has become a hot research topic to assess changes in carbon storage caused by land-use changes in megacities [9,10]. Therefore, studying the spatiotemporal variation and attribution of carbon storage in megacities has practical implications for synergistic ecological conservation.
Although traditional estimation methods, such as soil type, life zone, and biomass methods, are more accurate for carbon storage estimation, they cannot conduct long-period, large-scale spatial, and temporal changes in carbon storage and impact mechanisms. On the contrary, model-based methods can better solve this problem [11]. The InVEST model (integrated valuation of ecosystem services and tradeoffs), jointly developed by Stanford University, WWF, and The Nature Conservancy, has the advantages of an open-source nature and low-input data volume. This model is used in watersheds [12,13], urban clusters [14], regions [15,16], high-vegetation-density areas [17], and sea islands [18]. It has been widely used. The FLUS (future land use simulation) model is suitable for the simulation research of future land-use change scenarios and is an effective model for geospatial simulation, space optimization, and auxiliary decision-making. This model uses an Artificial Neural Network (ANN) to obtain the suitability probability of various land uses and then improves the applicability of the model by coupling the Markov model and the Cellular Automaton (CA) model [19,20,21]. In the CA model, an adaptive inertial competition mechanism is introduced to address the complexity and uncertainty of the conversion of various land-use types under the joint influence of nature and human activities [19,22,23]. Babbar et al. used the Markov chain and InVEST models to assess the carbon storage changes from 2010 to 2035 in the Sariska Tiger Reserve, India, and performed field validation [24]. Zhao et al. used InVEST and CA-Markov models to assess the impact of environmental engineering on carbon storage in the upper reaches of the Black River Basin in the semi-arid northwest [25]. Aitali et al. found that urban expansion in coastal wetlands in North Africa led to changes in carbon storage [26]. Li et al. used the InVEST model to assess the increase in carbon storage in Huining County, Northwest China, from 2000 to 2016 and found that the increase in carbon storage was mainly due to the increase in the vegetation pool. In order to quantitatively reveal the spatial heterogeneity of carbon stocks, this paper adopts the optimal parameter-based geographical detectors (OPGD) model, which can achieve more accurate spatial analysis and improve the overall ability of spatial heterogeneity analysis. It has been widely used in spatial pattern investigation and ecosystem services [27].
In summary, scholars’ studies on carbon storage have focused on areas such as typical watersheds, nature reserves, and some land types of urban agglomerations, but studies on megacities, which are essential drivers of economic development, are relatively inadequate; particularly, the level of their ecosystem stability needs attention [28]. Jinan, as a typical megacity, with farmland and forest accounting for about 70%, is an important carbon storage area for the regional ecosystem. With the overlapping national strategies of ecological protection and high-quality development in the Yellow River basin, human activities have greatly influenced the way of land use. At present, studies on Jinan City have focused on the value of ecosystem services [29] and ecological risk assessment [30] using land-use simulation [31]. Few scholars have conducted research on the impact of land-use change on carbon storage under multiple scenarios and diverse drivers at the citywide scale. In addition, there are relatively few studies on the spatiotemporal changes in carbon storage based on carbon density correction in Jinan City. While the carbon density of biomass and soil carbon has a significant relationship with the precipitation factor [32], many studies have been conducted based on factors such as the precipitation density, which is corrected to improve accuracy [32,33]. Thirdly, although the current research methods on carbon storage drivers and the selection of driver indicators can provide scientific guidance for subsequent related studies, the research objects tend to focus on regions such as urban clusters, provinces, and ecologically fragile areas [34,35,36]. However, less attention has been paid to the dynamics of carbon storage in megacity ecosystems and its driving mechanisms, and the relevant research base is weak.
In view of this, this study analyzes the land cover and spatiotemporal distribution and transfer characteristics of Jinan City in the past ten years, from 2010 to 2018. Using precipitation data corrected for carbon density data, an integrated model of Markov-FLUS-InVEST is used to estimate and predict the regional carbon storage under three scenarios in 2030, revealing its spatial and temporal dispersion characteristics and evolutionary patterns. Finally, the driving mechanism of the spatial heterogeneity of carbon storage is thoroughly investigated by using the OPGD model. This study’s results can provide a scientific basis and decision support for accurately grasping the impact of human activities on carbon storages in megacities, scientifically and rationally formulating territorial spatial planning, and ecological restoration planning.

2. Materials and Methods
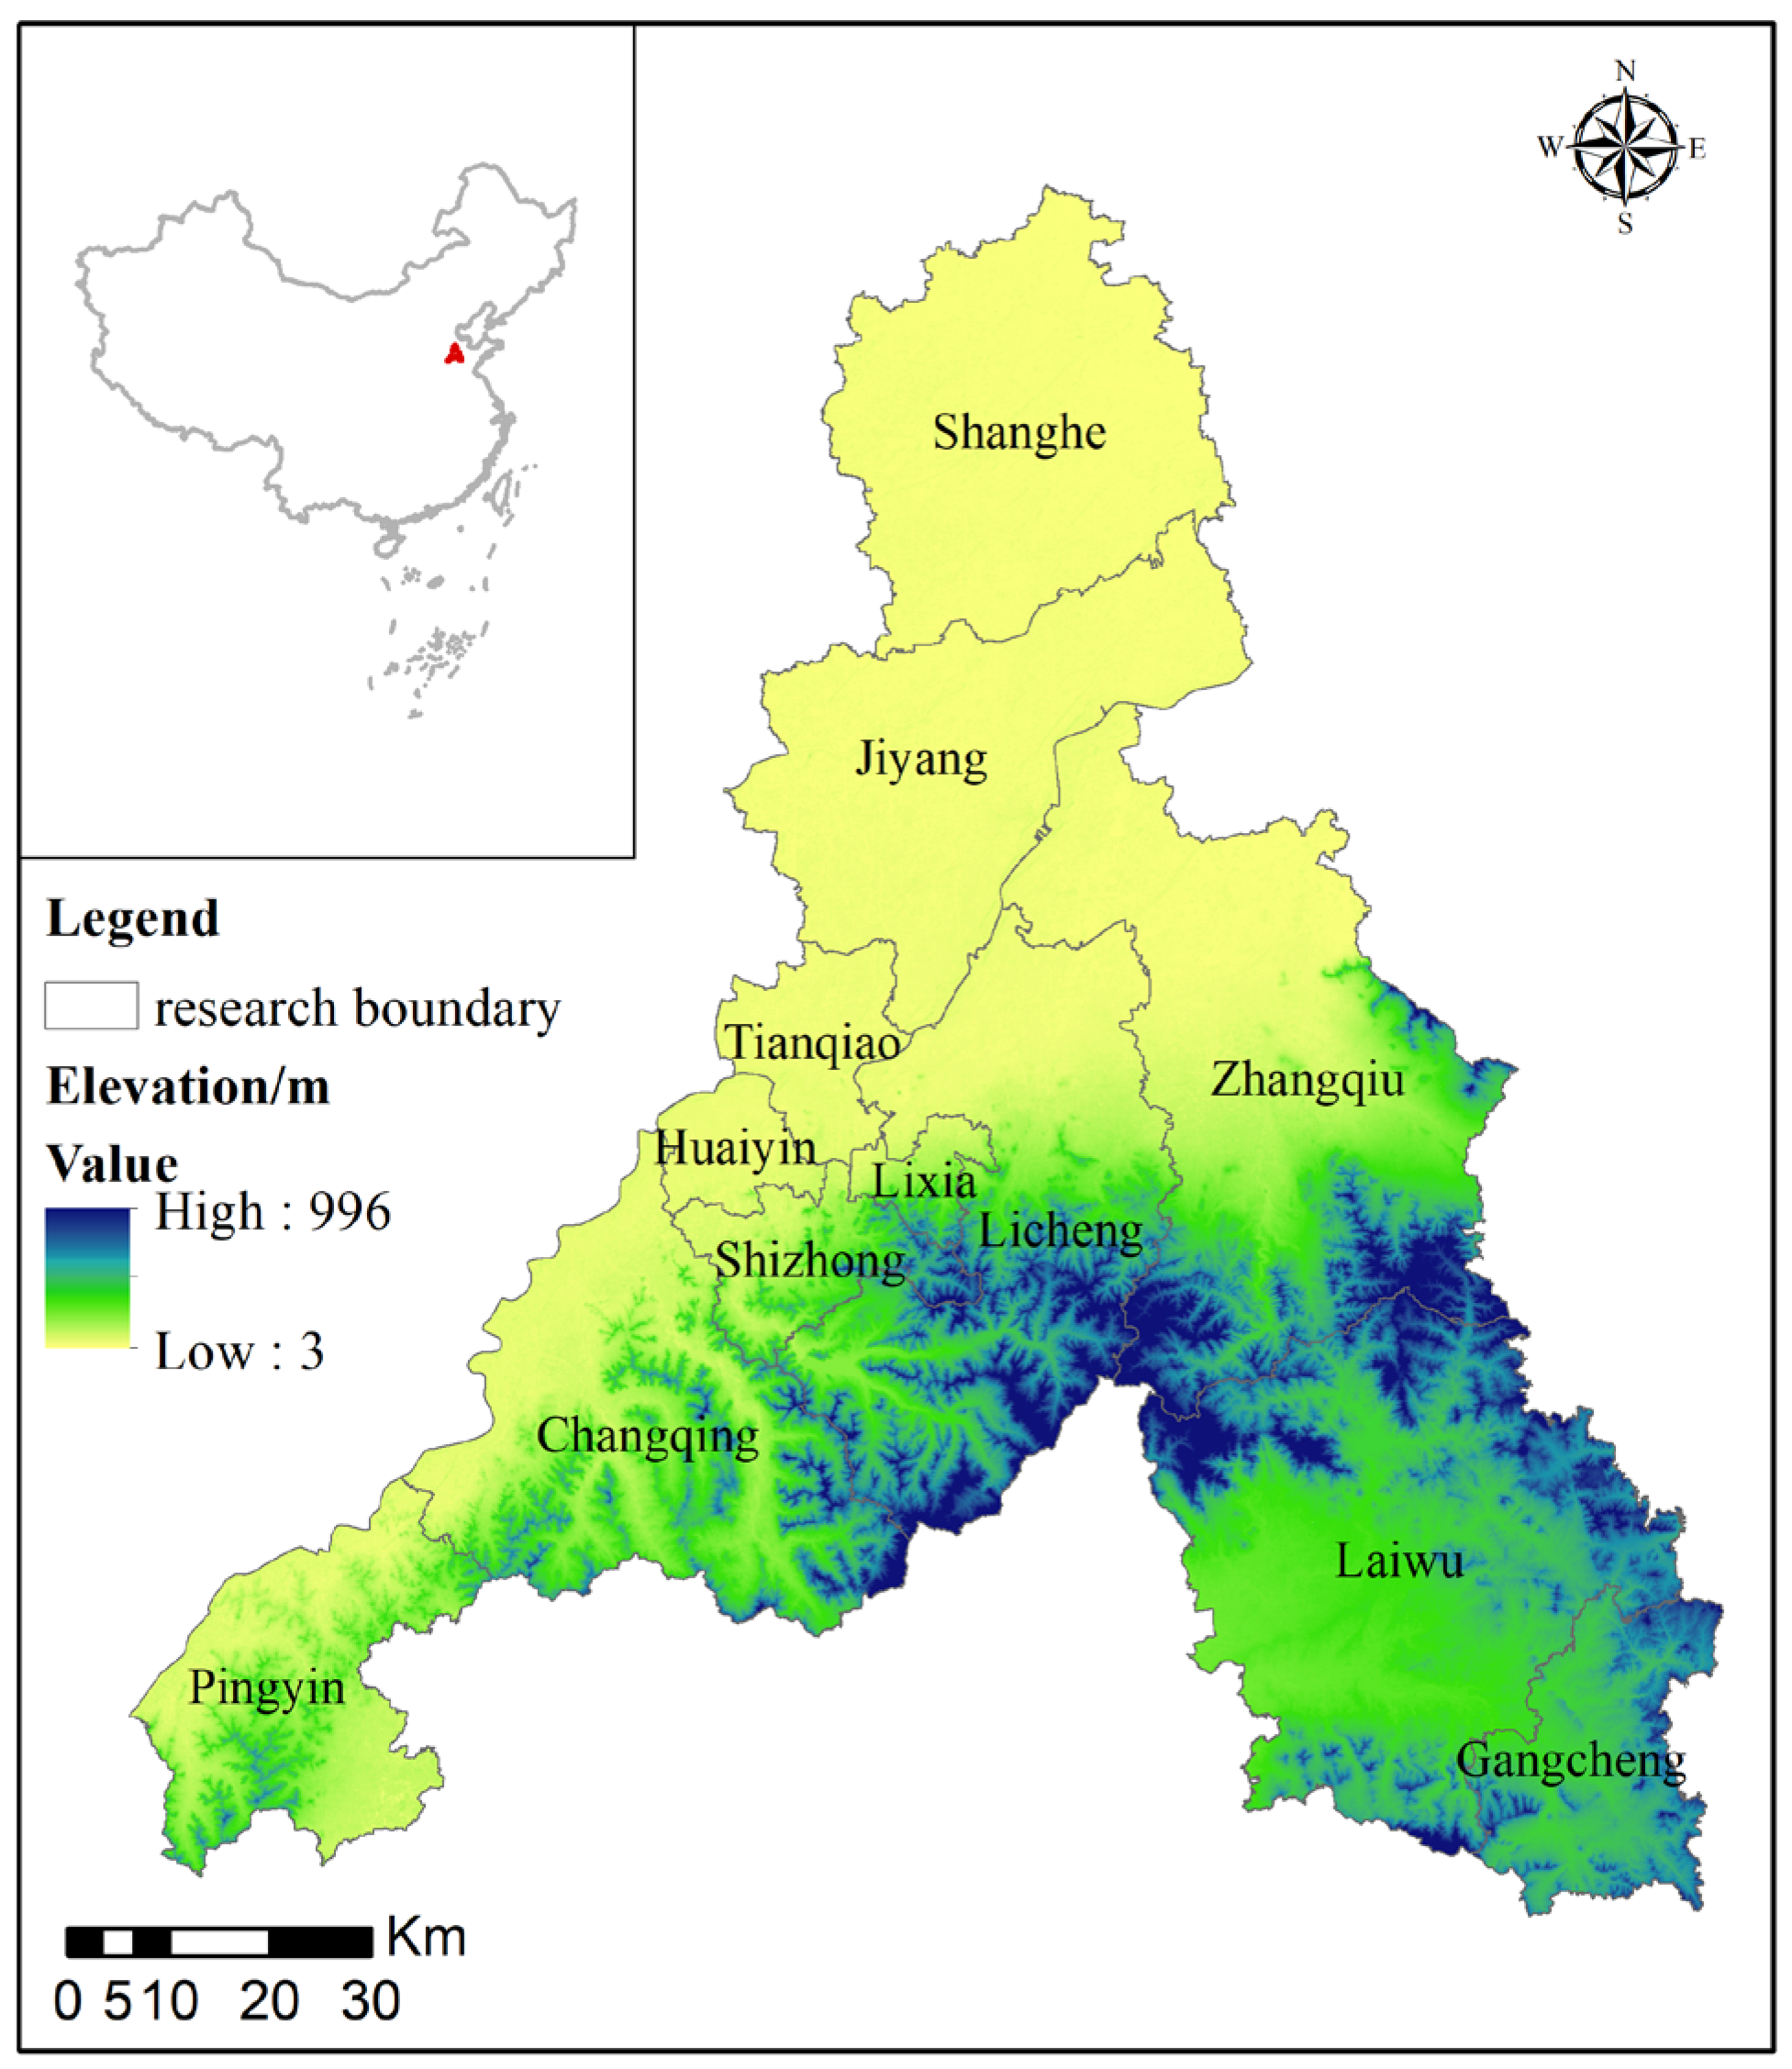
2.1. Study Area

Jinan City is located in the northern part of the mountainous region of central Lu (Figure 1), spanning 35.95°~37.54°N and 116.22~117.97°E, with a total area of 10,244 km2. It lies on Mount Tai in the south and straddles the Yellow River in the north. The topographic elevation ranges from 8 to 973 m. The terrain is generally high in the south and low in the north and can be divided into three zones: the Yellow River zone; the central plain zone; and the southern mountainous zone. The average annual temperature is 13.8 °C, and the average annual precipitation is 685 mm.

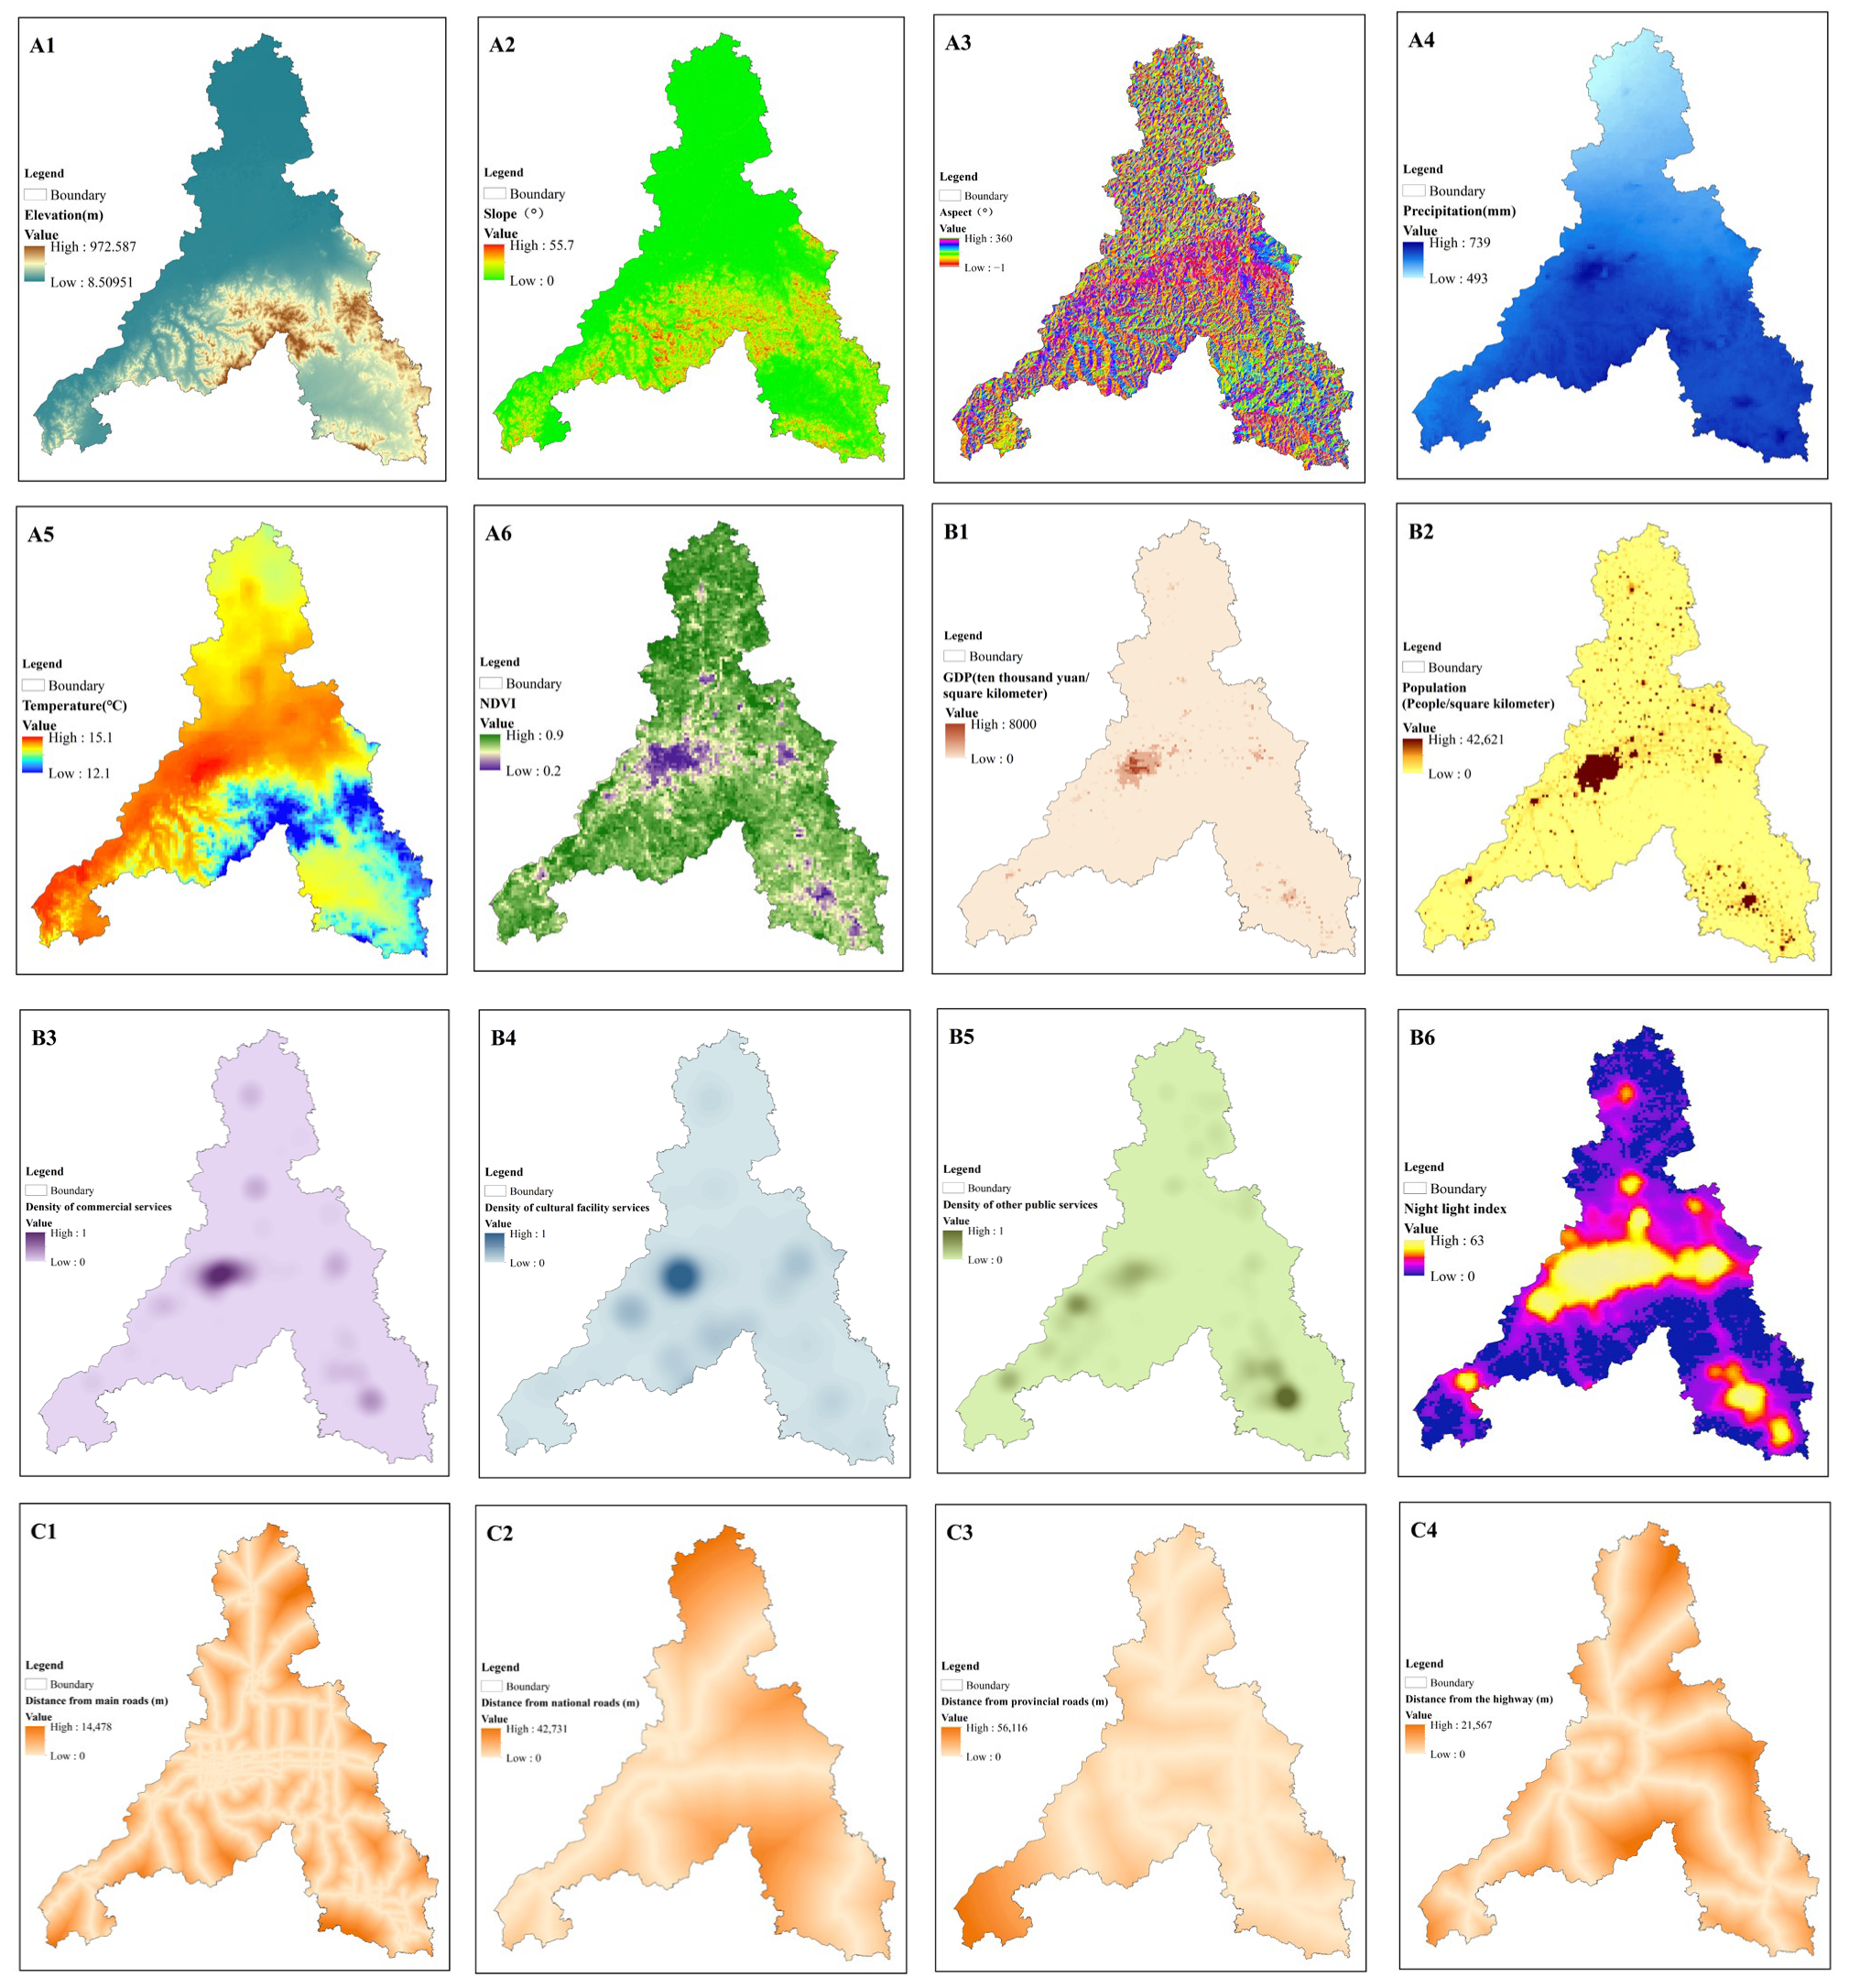
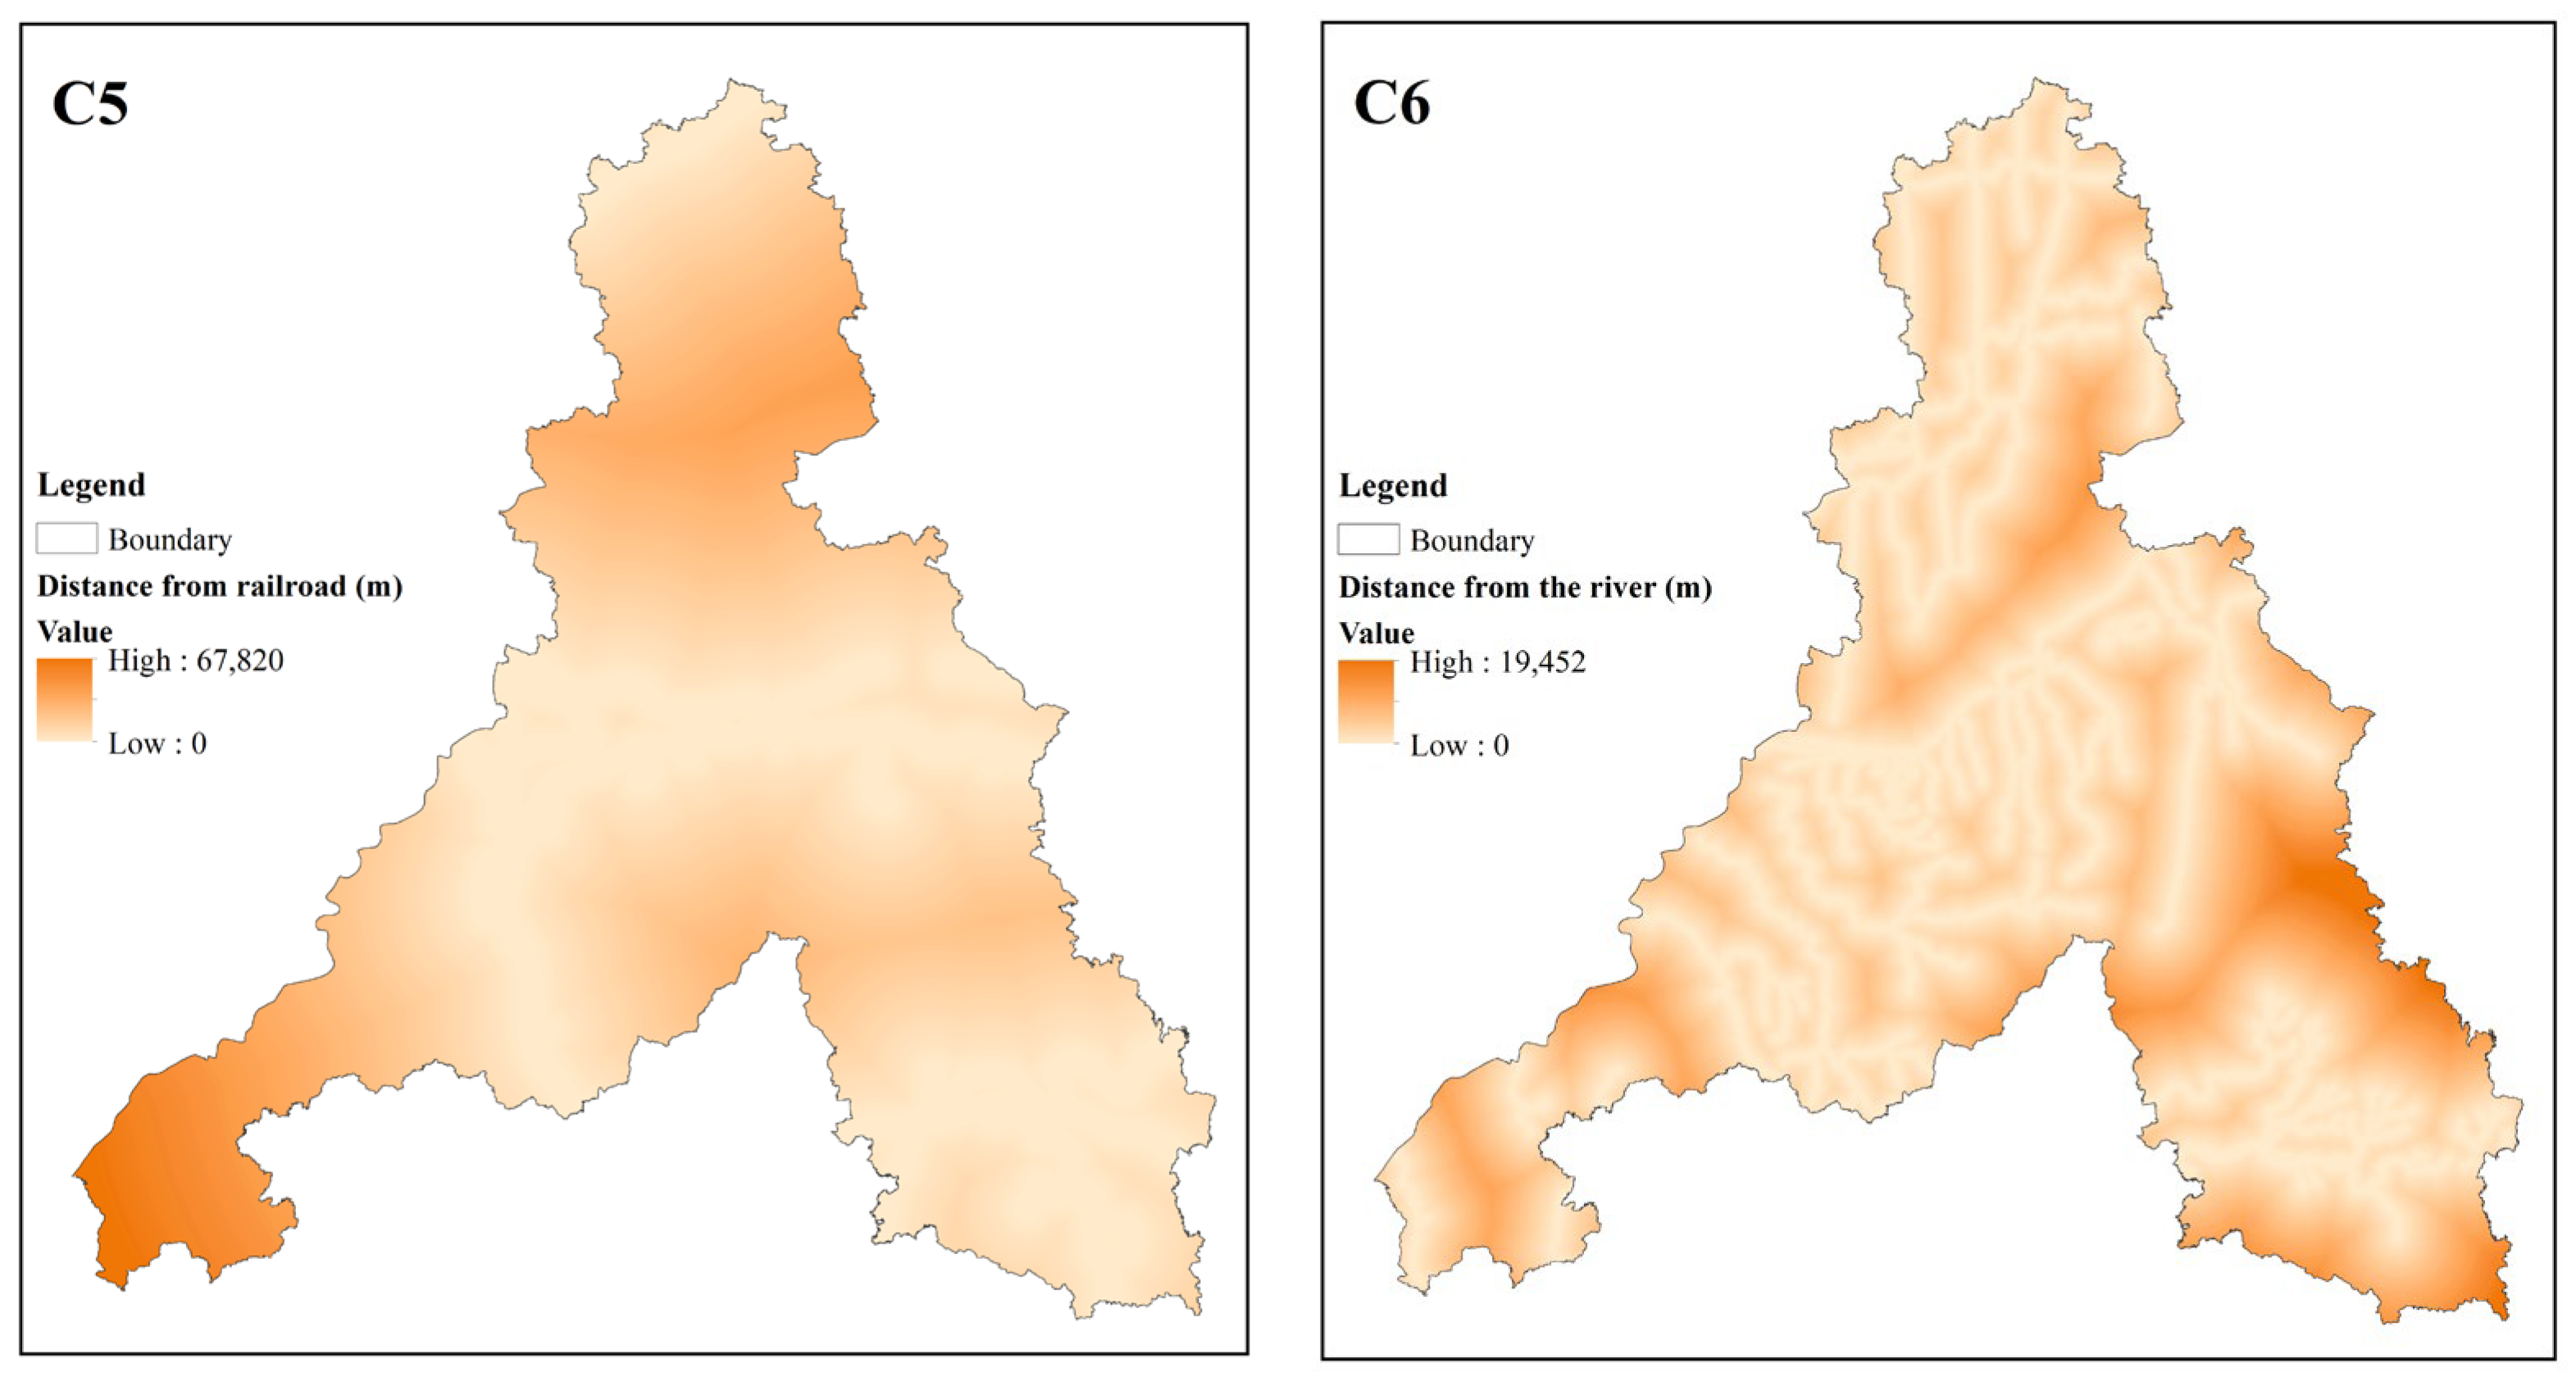
2.2. Multi-Source Remote Sensing Data

The data of this study are shown below (Table S1). The land-use data in the period of 2010–2018 were generated by the Resources and Environment Science and Data Center (https://www.resdc.cn, accessed on 1 January 2023). The data were generated by manual visual interpretation of Landsat TM/ETM remote sensing images for each period, with a resolution of 30 m. At present, the database is the most accurate land-use remote sensing monitoring data product in China. The Digital Elevation Model (DEM) was derived from the geospatial data cloud platform (http://www.gscloud.cn, accessed on 5 February 2023). The Normalized Difference Vegetation Index (NDVI) data were sourced from the Resources and Environment Science and Data Center (http://www.resdc.cn, accessed on 1 January 2023) with a resolution of 1 km. The monthly precipi0tation data were acquired from the National Earth System Science Data Center (http://www.geodata.cn, accessed on 10 January 2023) with a resolution of 1 km. The slope data were derived from the DEM data processed by GIS software. Data sources for commercial services, cultural facilities services, other public services, highways, and railroads were obtained from the China rivermap (http://www.rivermap.cn, accessed on 18 February 2023). The landScan2019 Global Vital Statistics Analysis Database was developed by the U.S. Department of Energy Oak Ridge National Laboratory (ORNL) and provided by East View Cartographic (https://landscan.ornl.gov, accessed on 20 February 2023). All data were projected to the CGCS2000 coordinate system, masked to obtain JNC’s data, and uniformly converted to 100 m × 100 m raster data (Figure 2).

2.3. Methodology

The research framework of this paper is divided into three parts (Figure 3), applying the Markov-FLUS model to calculate LUCC and using the InVEST model to explore carbon storage and the OPGD-based detection of drivers. Specifically, 18 driving factors of physical geography, socio-economics, and accessibility were set. The Markov-FLUS model was used to predict the spatial and temporal patterns of land use in 2030 under three scenarios based on the land-use data of Jinan City from 2010 to 2018; the InVEST model was used to determine the carbon storage in 2030 and reveal its spatial and temporal distribution and evolutionary patterns. Finally, OPGD was applied to explore the drivers of the spatial heterogeneity of regional carbon storage.

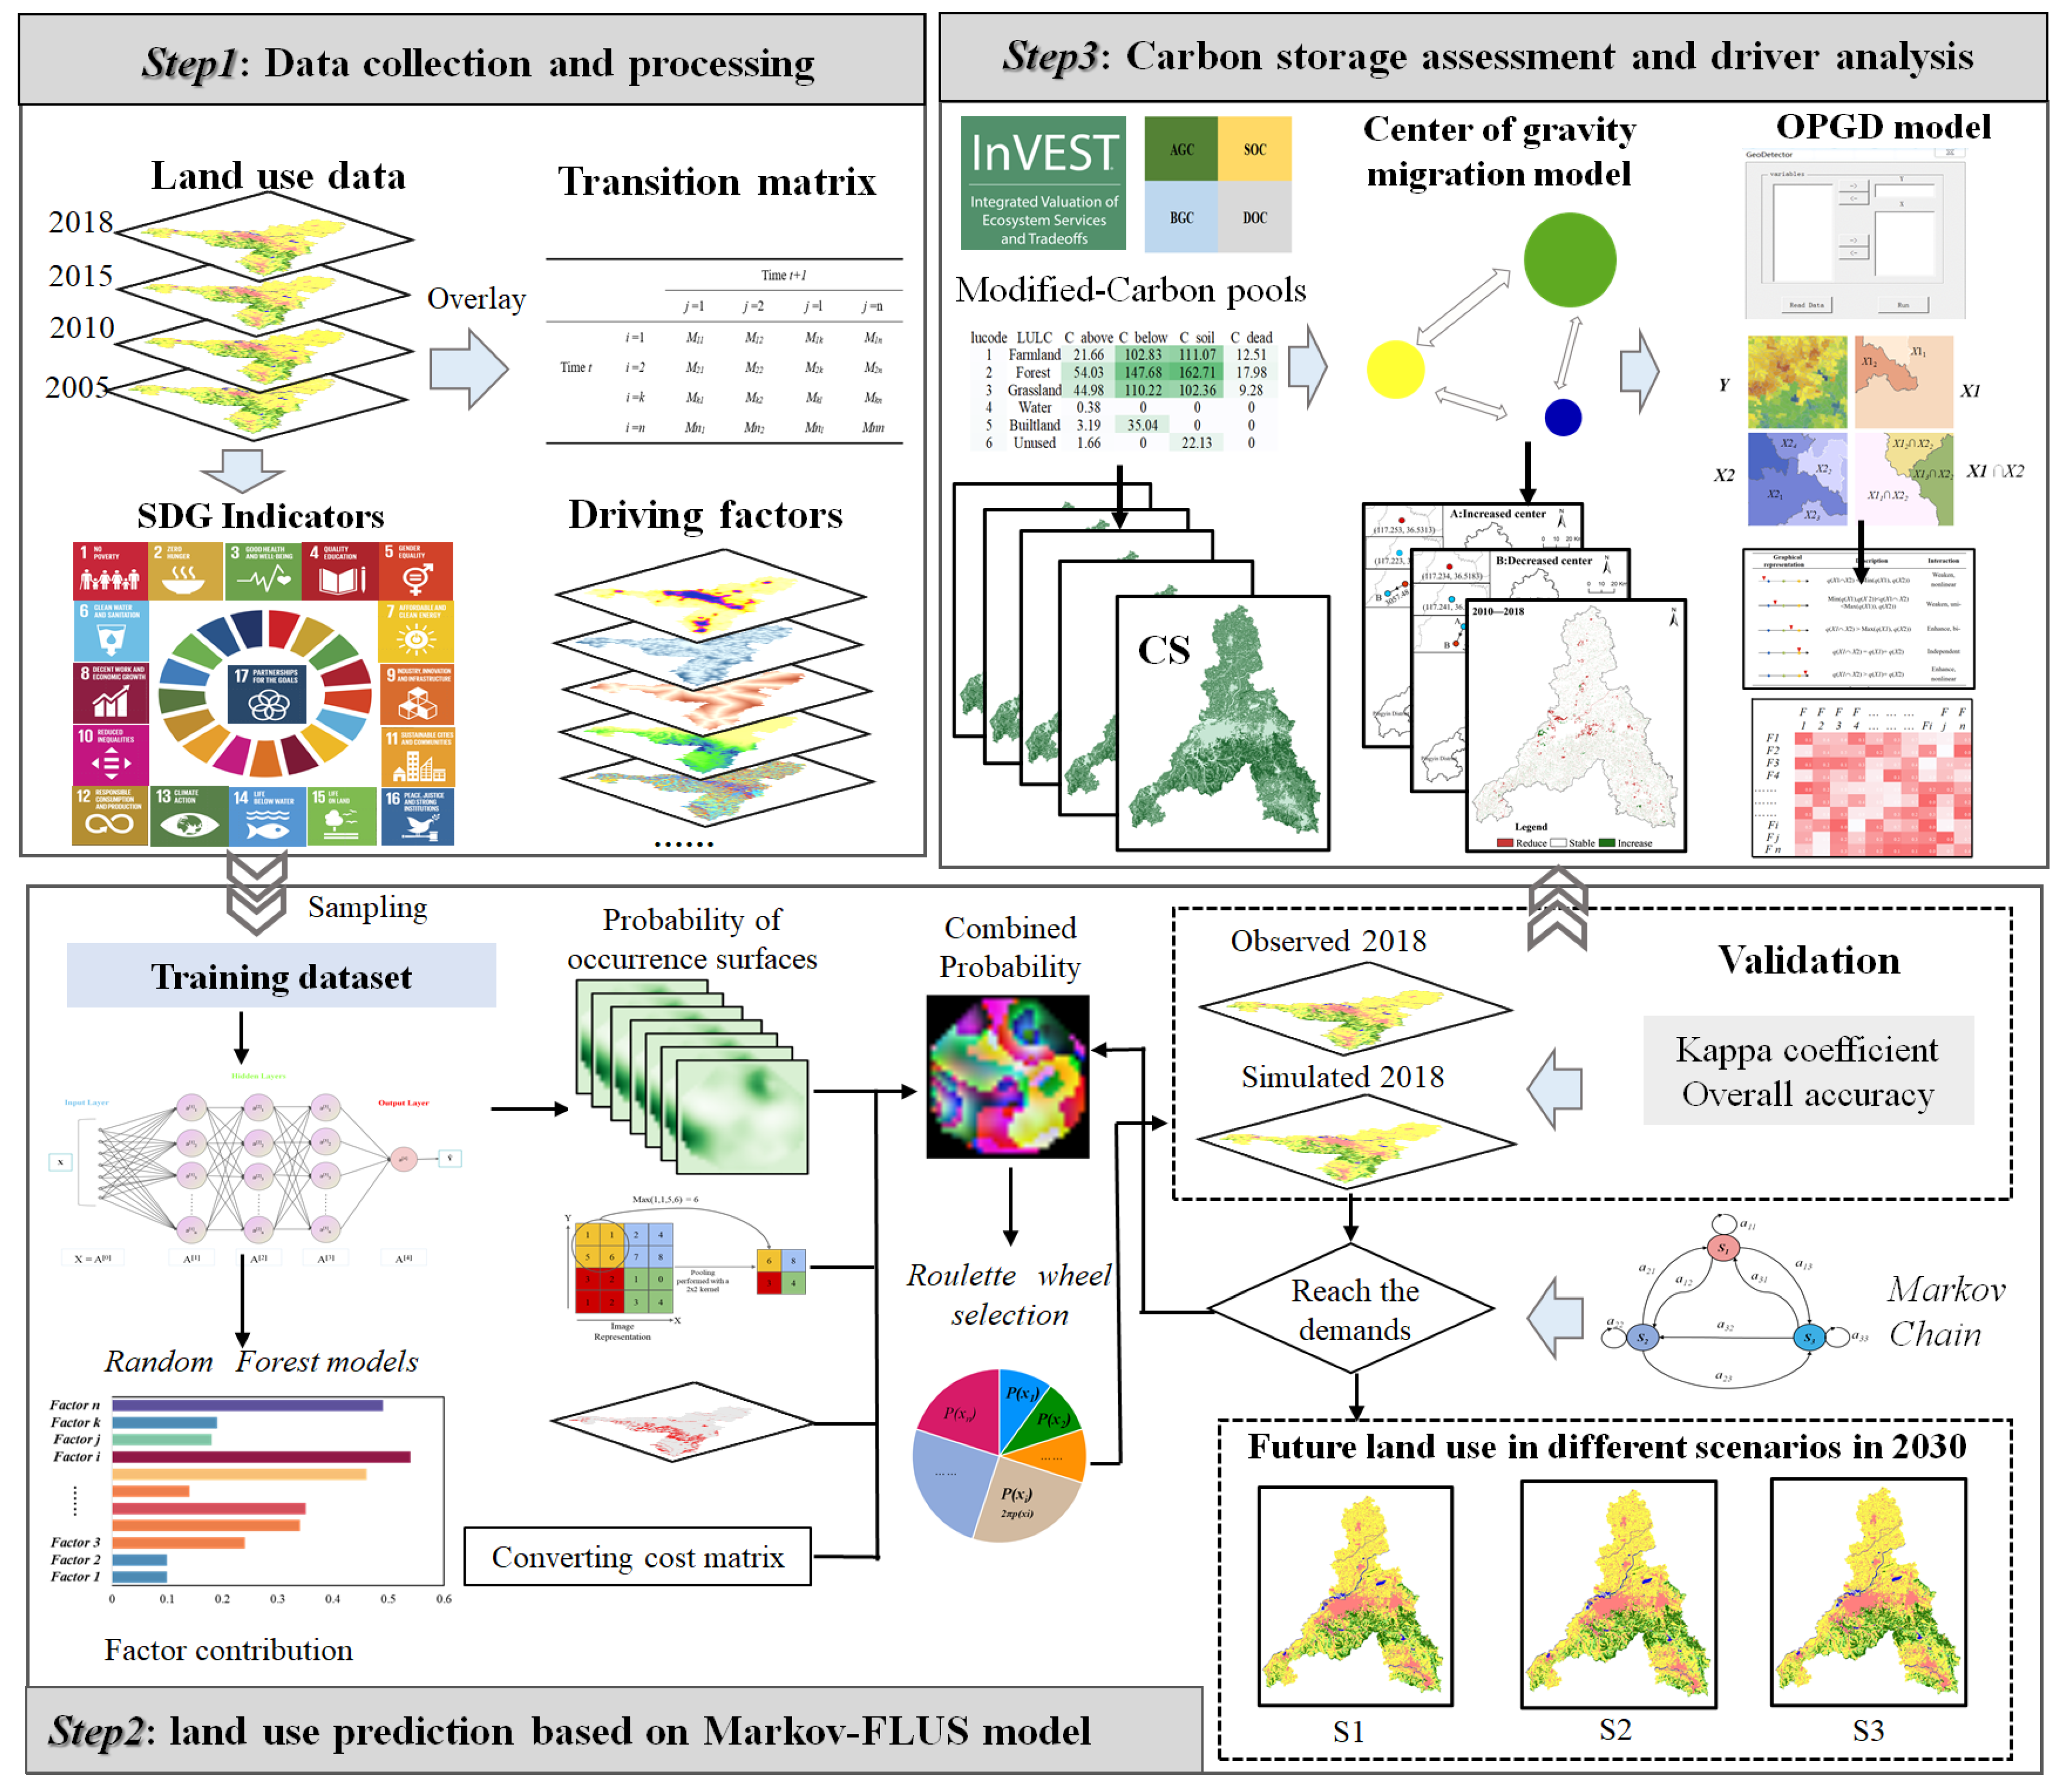
2.3.1. The Coupled Markov-FLUS Model

The Markov model is a raster-based spatial probability model with subsequent nullity. It is often used for the prediction of geographical events, specifically involving Markov processes, state transfer matrices, and state transfer probability matrices [37,38] that are widely used in studies of land-use simulation, urban sprawl, and ecosystem services [39,40,41].
The CA model is a local network dynamics model with discrete space–time and state, spatial interactions, and temporal causality, with powerful complex computational functions, parallel computational capabilities, highly dynamic features, and spatial concepts. It is composed of four parts, i.e., meta-cell, meta-cell state, neighborhood, and transition rules, and its basic principle is that the state of a meta-cell in the next moment is a function of the state of its neighborhood in the previous moment [21,42]. The model is expressed as follows:
S ( t + 1 ) = f S ( t ) , N
where S is a finite, discrete set of meta-cell states; N is the meta-cell neighborhood; t + 1 is a different moment, and f is the transition rule of the local space meta-cell states.
The FLUS model uses the existing land-use type transfer matrix [43], which can simulate land-use changes under the influence of human activities and nature, as well as a model of future land-use scenarios. This model uses a neural network algorithm (ANN) to obtain the suitability probabilities of various types of land use from the Phase 1 land-use data with 18 driving factors (Figure S1).

2.3.2. Development Scenario Setting Based on SDGs

Three scenarios were set up based on the SDGs: The natural development scenario (S1) refers to urban expansion without SDG intervention, and the ecological conservation scenario (S2) is concerned with the impact on the overall urban development when ecological conservation measures are implemented. On the other hand, the economic development scenario (S3) emphasizes the SDGs’ economic development goals and places no restrictions on urban expansion. However, spatial and temporal urban development must not break through the bottom line of the ecological protection red line. When discussing the future urban land-use pattern using multiple scenarios, the transfer probability and restriction area between each land type are set according to the characteristics of each scenario and the demands of SDGs (Table S2), and the demand for each type of land in different scenarios in 2030 is predicted using a Markov chain (Table 1).
(1) Natural development scenario (S1): Without considering the binding effect of SDGs on land-use changes and changing the transfer probability between different land-use types, the demanded area of each type of land in this study’s area in 2030 was projected based on the land use in 2015 and 2018, using a Markov chain without changing the transfer probability between land-use types;
(2) Ecological conservation scenario (S2): SDG-15 points out the conservation, restoration, and promotion of sustainable use of terrestrial ecosystems, sustainable forest management, combating desertification, halting and reversing land degradation, and curbing biodiversity loss. Therefore, based on the natural development scenario in 2030, the proportion of farmland converted to forest, grassland, and water was increased by 20%; the proportion of forest, grassland, and watershed converted to construction land was reduced by 80%, and the proportion of unused land converted to farmland, forest, grassland, and watershed was increased by 40%. The red line of ecological protection in Jinan was set as a no-construction zone (Figure S1);
(3) Economic development scenario (S3): SDG-11 promotes building-inclusive, safe, risk-resilient, and sustainable cities and human settlements, and Jinan City as the essential intersection of the Bohai Economic Zone and the Beijing–Shanghai Economic Axis needs to expand further in the future. This study referred to the Jinan City Territorial Spatial Master Plan (2021–2035), which increases the proportion of bare land converted to construction land by 50%, the area of farmland, forest, and grassland converted to construction land by 25%, and the proportion of watershed converted to construction land by 10% in 2030, according to the relevant policy requirements for economic development and ecological protection. The red line of ecological protection was set as a prohibited area for development. All kinds of land can be freely converted among them.

2.3.3. InVEST Carbon Storage and Sequestration Model

(1) Carbon storage and sequestration assessment
The carbon module in the InVEST model is based on the different carbon pool densities corresponding to land-use types to obtain the total regional carbon pool, which mainly contains aboveground biogenic carbon, belowground biogenic carbon, soil organic carbon, and dead organic carbon [44]. The model is as follows:
C i = C i - a b o v e + C i - b e l o w + C i - s o i l + C i - d e a d
C t o t a l = i = 1 n C i × S i
where i is the land-use type, including the six categories of farmland, forest, grassland, water, built land, and unused land; Ci-above is the aboveground carbon density (t/hm2); Ci-below is the underground carbon density (t/hm2); Ci-soil is the soil carbon density (t/hm2); Ci-dead is the dead organic carbon density (t/hm2); Si is the area of land-use type i (hm2), and n is the number of land-use types, which was 6 in this study.
(2) Correction of Carbon density
Considering that carbon density can be affected by a variety of factors, it can produce spatial and temporal distribution variability [45]. In this paper, we used the precipitation factor for carbon density correction to obtain the final carbon density of Jinan (Table 2). The 2000–2019 precipitation data were obtained from the data provided through the ecological and environmental status bulletins of China and Jinan, and the average multi-year precipitation of the country and Jinan were 644.03 mm and 688.91 mm, respectively. The carbon density correction model was corrected using the precipitation factor [33] as follows:
C s p = 3.3968 × P + 3996.1
C b p = 6.798 l e 0.00541 P
where Csp is the soil carbon density corrected using the precipitation (kg/m2), and Cbp is the biomass carbon density calculated from the annual precipitation (kg/m2). P is the average annual precipitation (mm), using the ratio of national and Jinan precipitation as the correction factor and the national carbon density multiplied by the correction factor as the Jinan carbon density.
K b = C b p C b p
K s = C s p C s p
Here, Kbp is the correction factor of precipitation factor for biological carbon density (kg/m2); C b P and C b P are the biomass carbon density based on the annual precipitation at the Jinan and national scales, respectively; C S P and C S P are the soil carbon density based on the annual precipitation at the Jinan and national scales, respectively, and Ks and Kb are the correction factors of soil carbon density and biomass carbon density, respectively.

2.3.4. Optimal Parameter-Based Geographical Detectors

The detection of spatial dispersion is one of the critical features of geo-detectors for identifying regional variability and explaining its driving factors [46,47]. It has been widely used in recent years in areas such as ecosystem services [32]. However, the critical aspect of using a geo-detector is determining the appropriate hierarchical spatial heterogeneity level through spatial data discretization. Because traditional geo-detector methods are subject to human subjectivity when discretizing continuous data, they suffer from several problems, such as poor discretization, which significantly impact the final results. Therefore, in this study, with the help of the GD package in R software, the number of classes was set to 3–8 using five classification methods: equal interval; natural breakpoint; quantile; geometric interval; and standard deviation [27]. The combination of parameters with the maximum q value was selected for analysis to quantify the interaction between each factor and carbon storage in Jinan City, thus revealing the main driving factors affecting the spatial distribution.
(1) Factor detection: The geo-detector factor detection model was applied to measure the spatial heterogeneity of different factors on carbon storage, as well as to detect the magnitude of their influence, which is measured by the q-value, as follows:
q = 1 h = 1 L N h σ h 2 N σ 2
where h = 1, …; L is the classification or partition of the independent or dependent variable; Nh and N are numbers of cells in layer h and the whole area, respectively, and σ h 2 and σ2 are the variances q in the dependent variable in layer h and the whole area, respectively, with values in the interval [0, 1]. The larger the latter value, the greater the influence of the partitioning factors on the spatial distribution of carbon storage in this study’s area, and the smaller it is for the opposite scenario [48];
(2) Interaction detection: It is possible to identify the interactions of different influencing factors on the dependent variable, to assess whether the action of the factors enhances or weakens the explanatory power of the dependent variable, and the results of different interactions and the range of q values are shown in Table 3.

3. Results

3.1. Model Validation and Importance of Driving Factors

To predict the future land-use type of Jinan City more accurately, this study simulated the land-use situation of 2018 based on the 2015 land-use data and driving factors, and the Markov-FLUS model was used for simulation and validation. Compared with the actual 2018 situation, the Kappa coefficient was 0.876, and the overall accuracy was 0.923, which showed that the Markov-FLUS model had high confidence in predicting future land use in Jinan City. In addition, the Markov chain was used to calculate the amount of land use for three different development scenarios in 2030. The number of different kinds of land was input into the FLUS model to simulate the spatial distribution of land-use ecosystems in Jinan City in 2030 under three different development scenarios based on the actual land-use map in 2018 and setting different transformation rules.
The contribution of the natural geography category factors to forest, grassland, and unused land is 51%, 44%, and 44%, respectively. The socio-economic category factors drive the 50% and 36% contribution of watershed and built-up land, respectively. The accessibility factor contributes 30% to all five land types except forest (Figure 4). In terms of secondary drivers, GDP is a significant driver of change in watershed land, public facilities, commercial facilities, and cultural facilities, and the nighttime light index is the main driver of change in built-up land. DEM is the primary driver of change in woodland, and the slope is the primary driver of change in grassland that contributes to the conversion of woodland and built-up land. Temperature is the main factor for unused land conversion. Distance from a river is the main driver of watershed change, and distance from national roads is the main factor of unused land expansion. It is clear that human activities mainly influence socio-economic factors and result from land degradation and restoration, and they have some influence on environmental factors. In summary, we found a complex scenario in relation to the drivers of land-use change in megacities, especially regarding the changes in the built-up land, forest, and farmland.

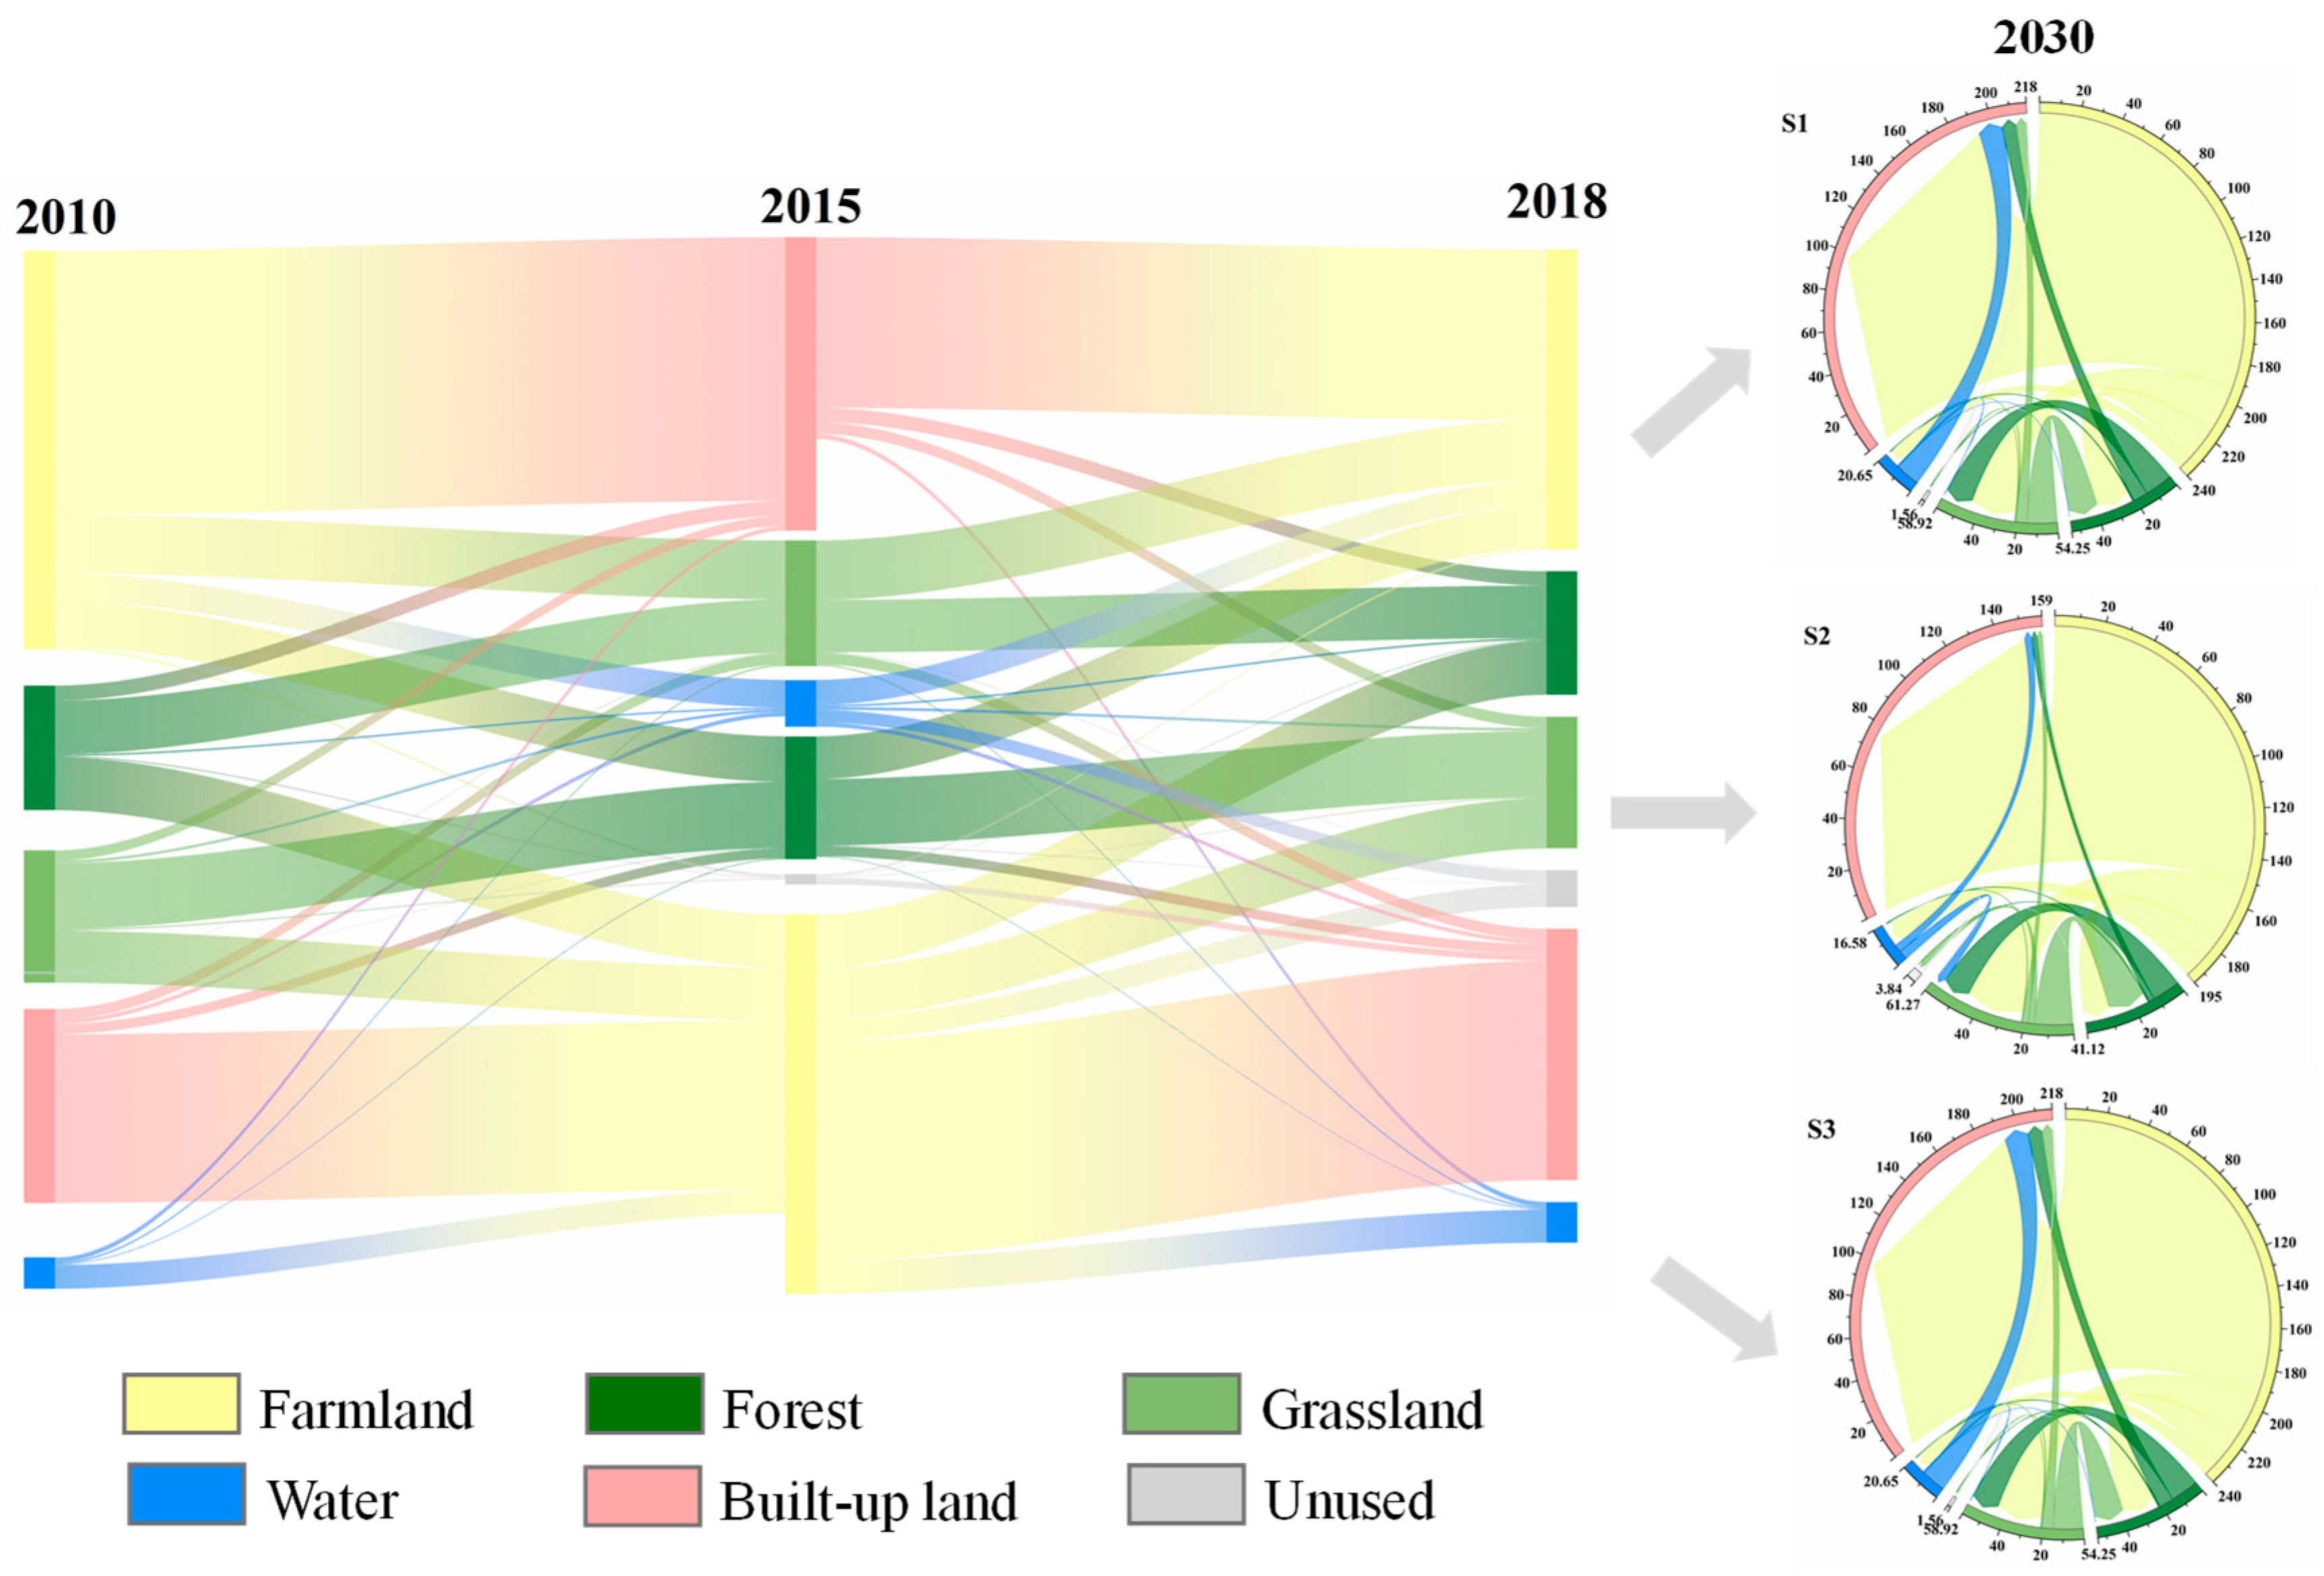
3.2. The Spatial–Temporal LUCC in JNC during 2010–2030

3.2.1. LUCC Dynamics from 2010 to 2018

From 2010 to 2018, JNC’s primary land-use type was farmland, accounting for about 55% of the area, mainly concentrated in the northern part (Table 4). Built-up land was the second largest land-use type in JNC, accounting for about 20% of the whole area, and is mainly distributed in the central, southeastern, and southwestern areas of JNC. Forest accounts for 12.7% of the whole area, mainly distributed in the southern mountainous area, an essential distribution for the purposes of carbon sink. Grasslands account for 8% of the area. Finally, water and unused land account for the least amount of the area, with less than 3% of the total. It should be noted that although the area of the watershed is relatively small, it is downstream of the Yellow River Basin, which takes on a crucial water-conserving function (Figure 5).
In the past ten years, the area of land-use types in JNC has changed to different degrees. The most apparent change is the shift between farmland and built-up land, and the changes in land-use types are mainly distributed in Licheng District, Laiwu District, and Pingyin County. Built-up and unused land types showed an increasing trend, among which built-up land increased by 127.25 km2 (1.24%), but farmland continued to decrease by 153.07 km2 (1.49%), and the other land remained unchanged. From a spatial perspective, the LUCC changes in JNC are characterized by noticeable spatial differences due to different topographic and climatic conditions. The increase in built-up land is mainly concentrated in Licheng District, Pingyin County, and Laiwu District, and we found that these are primarily places with a high density of various governmental locations and critical commercial service facilities. The increase in forest land and grassland is located in the southern mountainous region, the main area of ecological restoration in JNC in recent years.

3.2.2. LUCC Dynamics from 2018 to 2030

Under the three different scenarios for 2030, the regional land-use characteristics are generally consistent with the base year, among which the conversion of farmland to built-up land is particularly prominent (Figure 6), mainly due to the intensification of human activities and the substantial expansion capacity with the possibility of built-up land. In 2030, under the natural development scenario (S1), the built-up land will reach 2297.36 km2, compared with 2018. In 2030, the built-up land will expand by 7.43%; farmland will shrink by 3.43%, and forest land and grassland will increase by 0.97% and 2.28%, respectively. Under the ecological conservation scenario (S2), the built-up land will reach 2271.50 km2 compared with 2018; the built-up land will expand by 6.22%; the farmland will shrink by 3.75%, and forest land and grassland will increase by 2.30% and 4.41%, respectively. Under the economic development scenario (S3), the built-up land will reach 2356.65 km2, which will expand by 10.20% and shrink by 4.22% for farmland compared with 2018. Comparing the spatial distribution map of land use under the various scenarios, the distribution of Jinan City is generally stable. Built-up land is mainly distributed in the districts of Lixia, Huaiyin, Zhangqiu, and Laiwu, with the districts mentioned above being the central area of radiation spread. Farmland is mainly distributed in the north district of the Yellow River and is located in the north of Jinan City as a whole. The forest is mainly distributed in the southern mountainous area.

3.3. Spatiotemporal Variability of Carbon Storage in JNC from 2010 to 2030

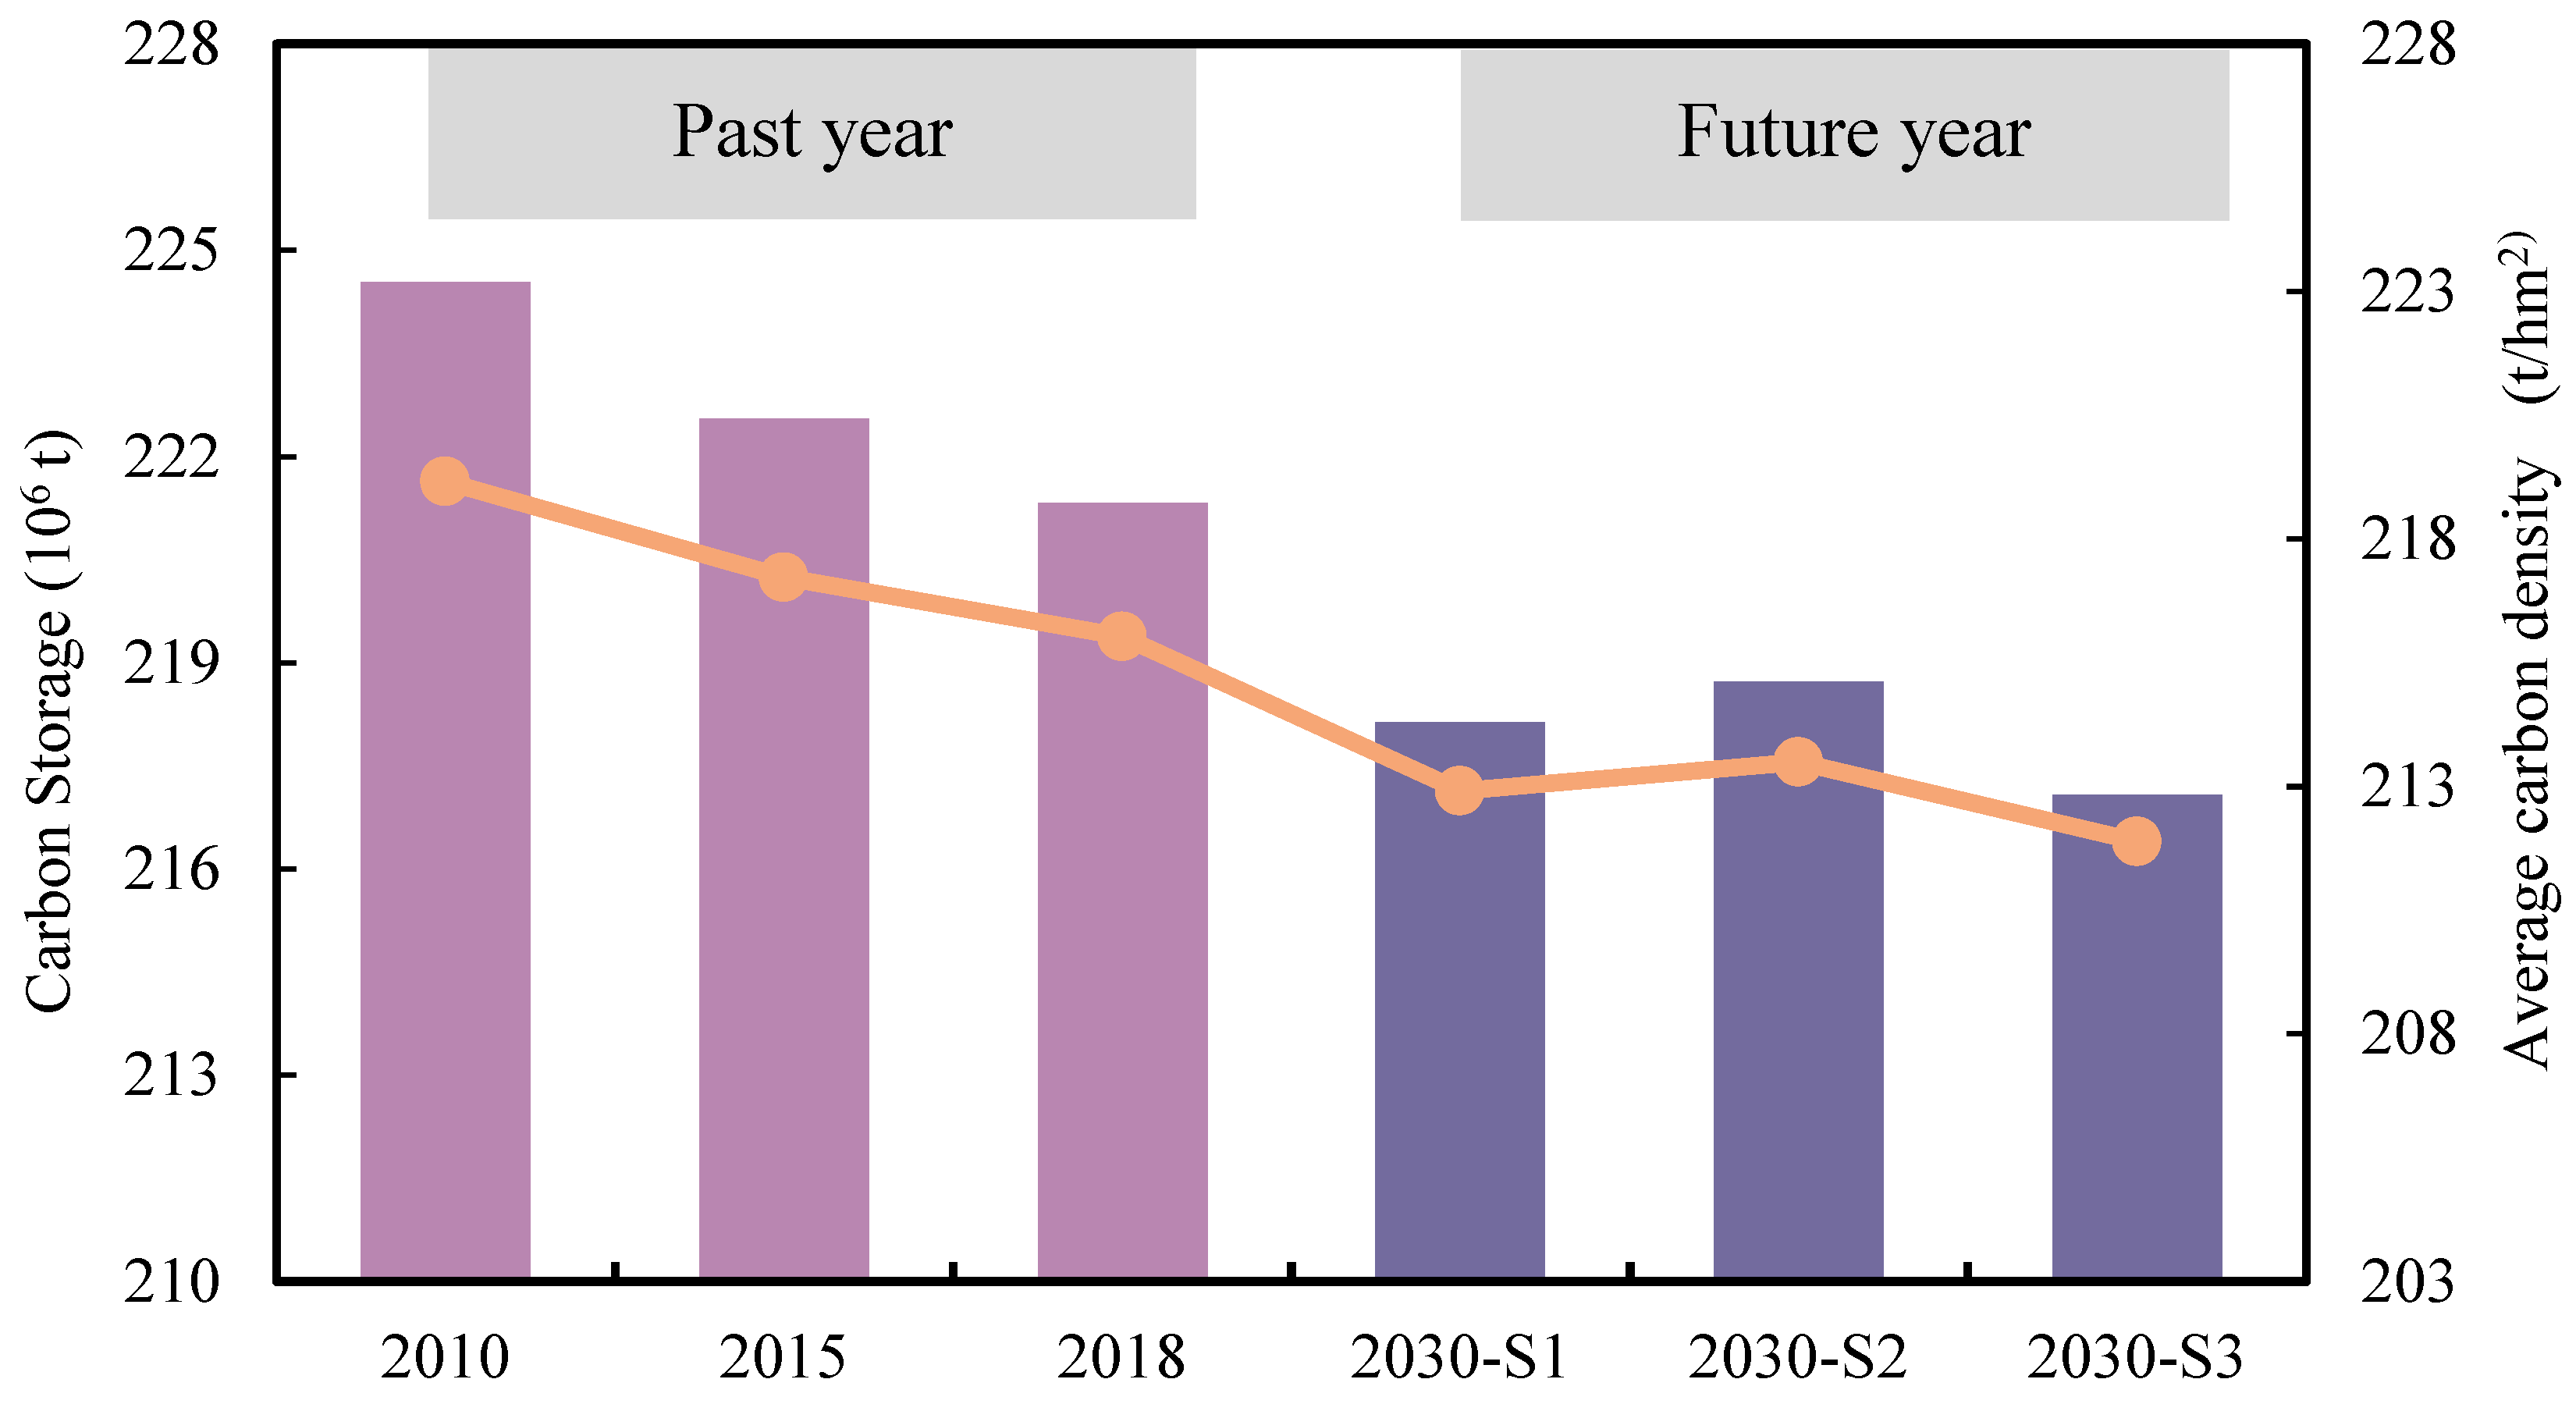
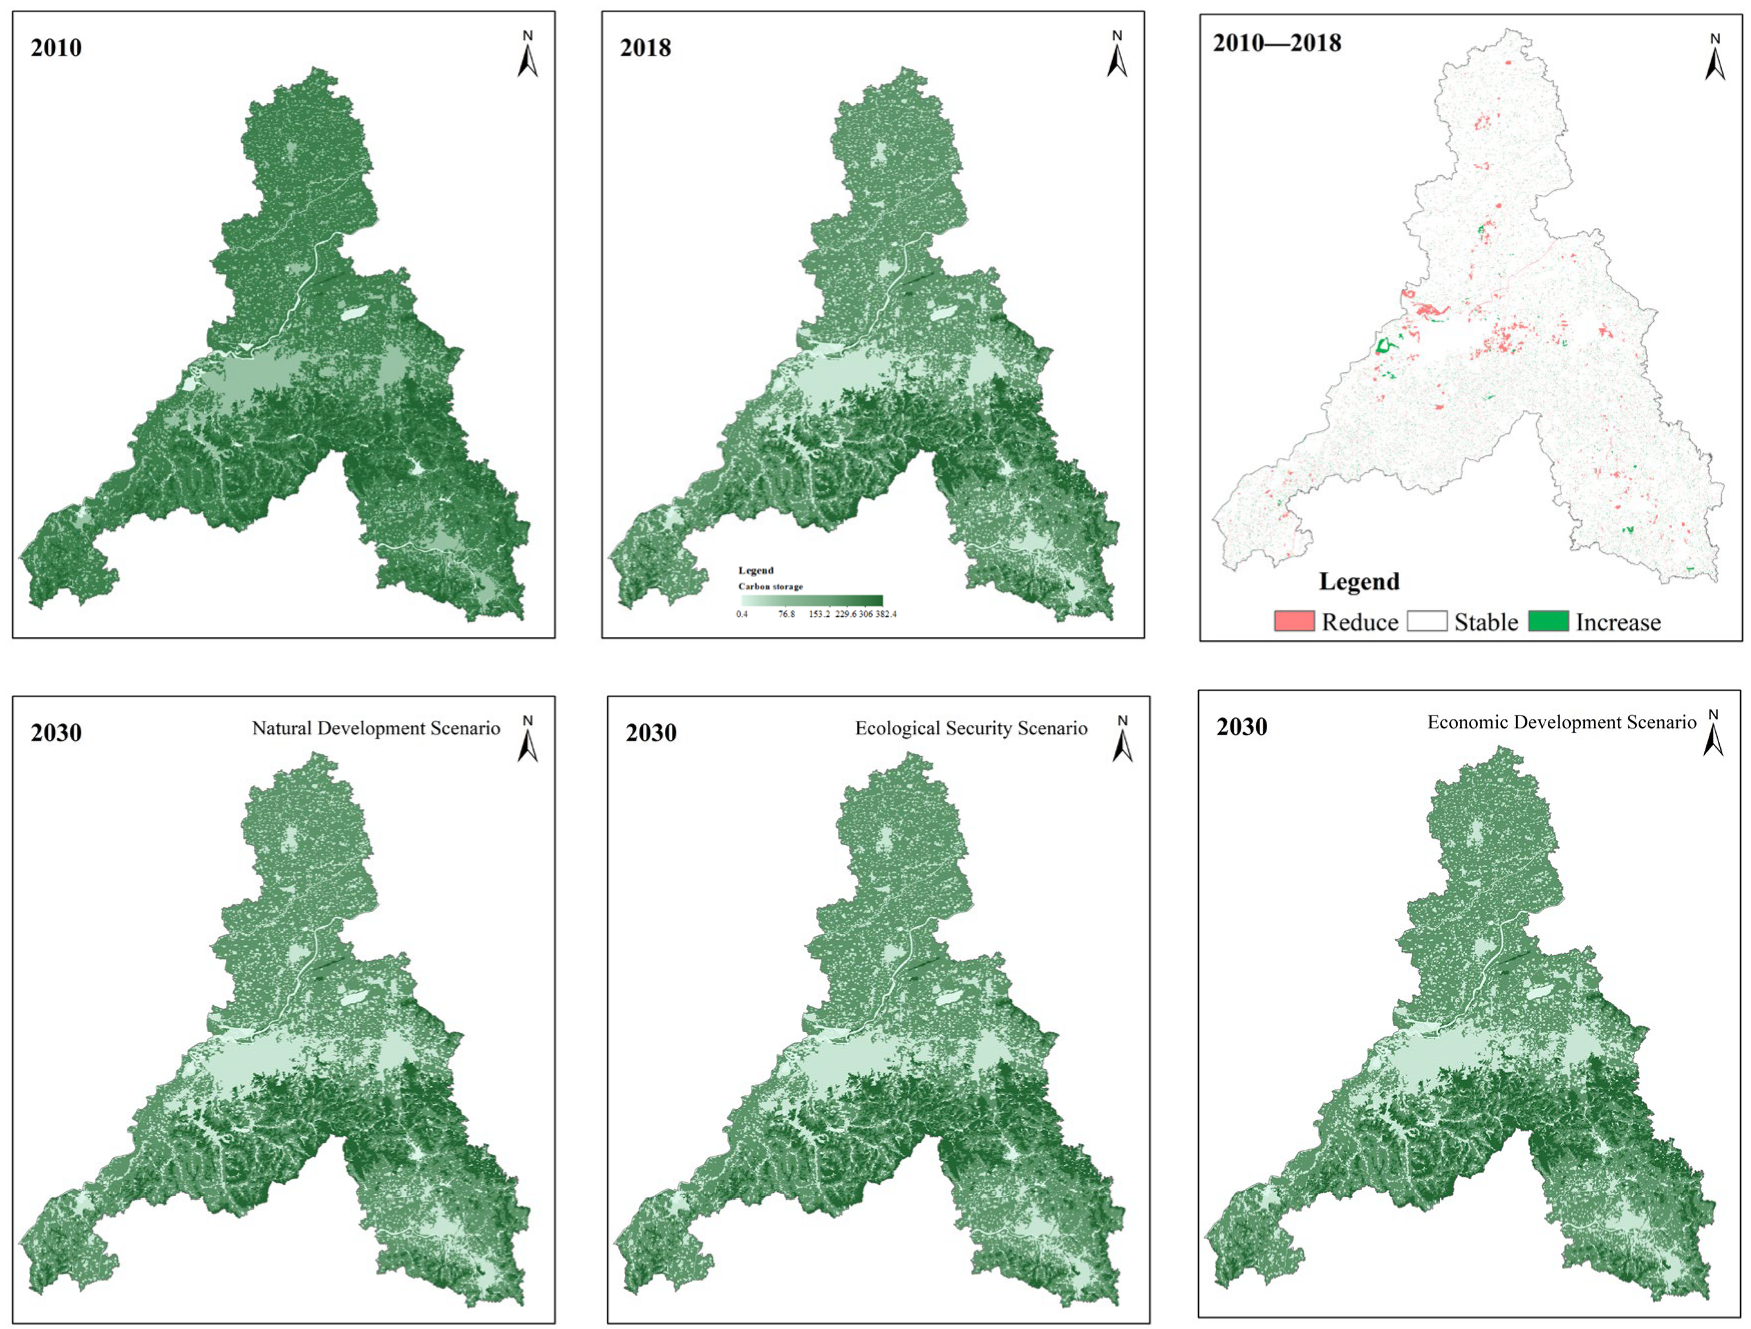
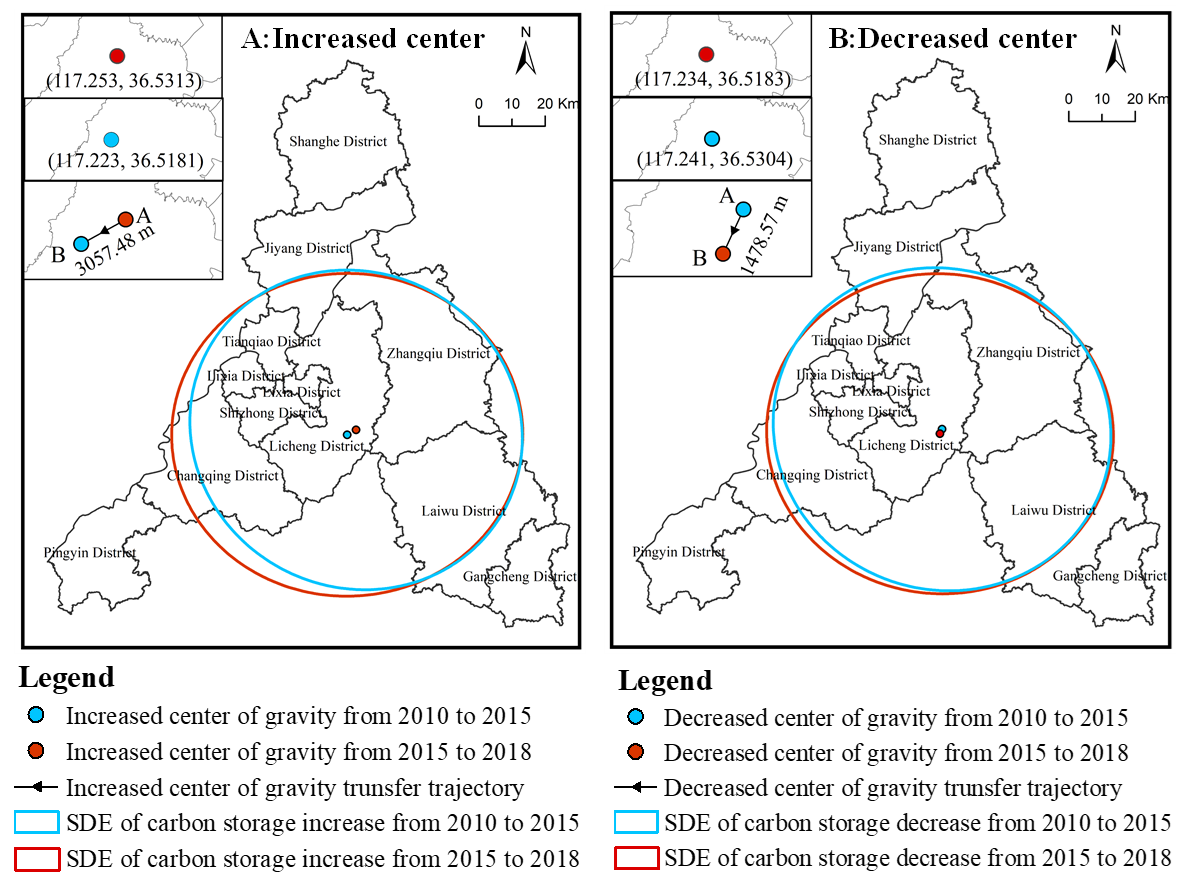
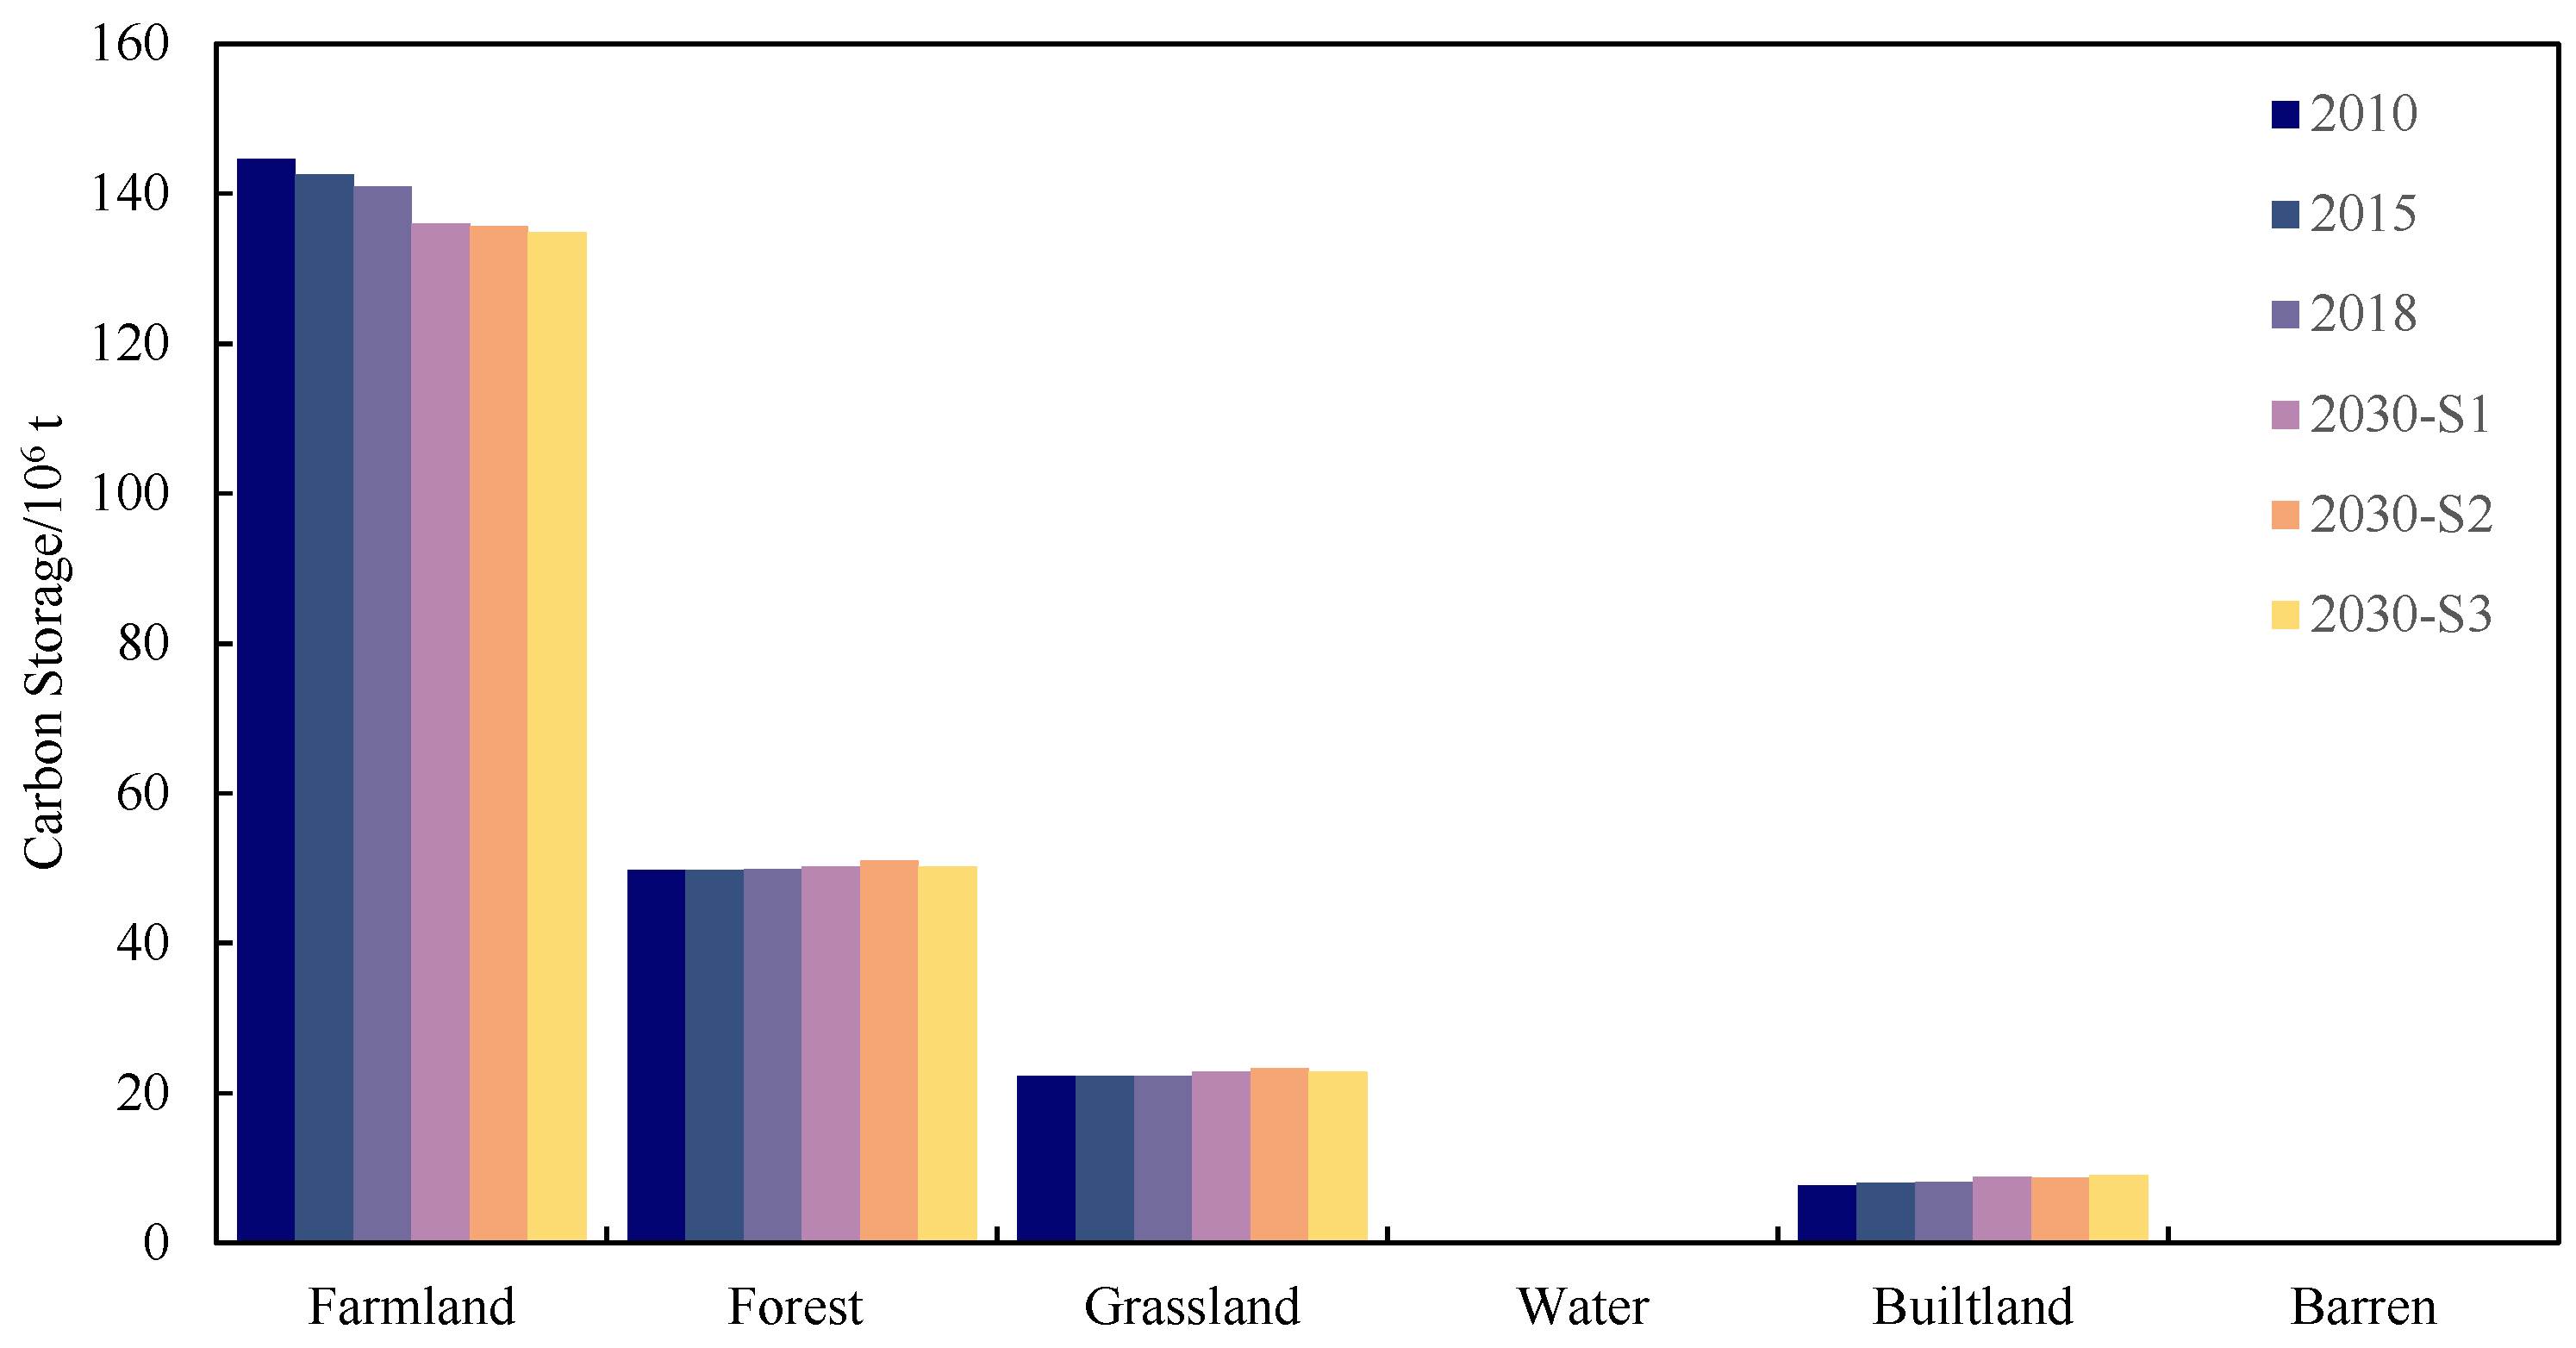
3.3.1. Carbon Storage Dynamics from 2010 to 2018

The multi-year carbon storage accounting results show that the main carbon pool types in Jinan are farmland, forest, and grassland, accounting for more than 96% of the city’s total carbon storage. Among them, the carbon pool of farmland is maintained at over 64% on average for many years. In 2010, 2015, and 2018, carbon storages were 224.54 × 10⁶ t, 222.55 × 10⁶ t, and 221.33 × 10⁶ t, with an average carbon density of 219.17 t/hm2, 217.23 t/hm2, and 216.04 t/hm2, respectively (Figure 7). The carbon storage in JNC showed a continuous decreasing trend in the past nine years, and the carbon storage decreased by 3.21 × 10⁶ t or 1.43% due to land-use type conversion. The carbon storage of farmland showed a decreasing trend, decreasing by 3.80 × 10⁶ t, with a decrease rate of 0.47 × 10⁶ t/a. Forest land and grassland showed a weak, increasing trend, with the carbon storage of forest increasing by 0.04 × 10⁶ t, with an increased rate of 0.0054 × 10⁶ t/a, and the increase in grassland was 0.0013 × 10⁶ t. The overall spatial distribution pattern of carbon storage in JNC over the past nine years has not changed significantly, with high-value areas of carbon storage gathered in the southern mountainous areas and low-value areas mainly concentrated in the built-up areas of the city where human activities are concentrated (Figure 8). For 2010–2015 and 2015–2018, the centers of gravity of carbon storage increases and decreases are located in the southern Licheng District. Overall, the centers of gravity of increases and decreases shifted to the southwest by 3057.48 m and 1478.57 m, respectively (Figure 9).

3.3.2. Carbon Storage Dynamics from 2018 to 2030

All three scenarios of carbon storage in 2030 show different degrees of decrease trends compared to 2018 (Figure 10). The projected carbon storage in 2030 under the natural development scenario (S1) is 218.14 × 10⁶ t, with a decrease of 3.20 × 10⁶ t and a decline rate of 0.27 × 10⁶ t/a; under the ecological conservation scenario (S2), the projected carbon storage in 2030 is 218.73 × 10⁶ t, with a decrease of 2.60 × 10⁶ t compared to 2018, and a decline rate of 0.22× 10⁶ t/a; under the economic development scenario (S3), the projected carbon storage in 2030 is 217.08 × 10⁶ t compared to 2018, with a decrease of 4.26 × 10⁶ t and a decline rate of 0.35 × 10⁶ t/a. By 2030, the average carbon intensity of Jinan City under the three development scenarios will be 212.92 t/hm2 (S1), 213.50 t/hm2 (S2), and 211.88 t/hm2 (S3). It can be found that the decrease rate of carbon storage is the lowest under the implementation of environmental protection measures, which indicates that strengthening ecological protection efforts can effectively improve the carbon sequestration capacity. If there is no restriction on the probability of converting forest land and grassland to construction land, it can be found that both scenarios S1 and S3 will have a further decrease in the carbon sequestration capacity.

3.4. Analysis of the Factors Influencing the Changes in Carbon Storage in JNC

3.4.1. Factor Detection

Using the OPGD factor detection method, this study determined the optimal classification method and the number of classifications, based on which we studied the determination of the explanatory power of the factors for the regional heterogeneity of carbon storage at different stages in JNC in the period of 2010–2018 (Table S3). The results show that all factors passed the significance test, and the p-values were less than 0.01, except for the driving factors A3 (slope direction) and C3 (distance from provincial roads). From the static perspective of the mean value of carbon storage in different years, there was variability in the explanatory power of each factor for the spatial heterogeneity of carbon storage, but the differences were less significant. For the spatial heterogeneity of carbon storage in the period of 2010–2018, the main drivers are B6 (nighttime lighting index), A1 (elevation), A2 (slope), A6 (NDVI), A5 (temperature), B2 (population density), and B3 (density of commercial services), all with an explanatory power exceeding 10%; there are minor differences observed in the explanatory power of B5 (density of other public services), C1 (distance from major roads), and B1 (GDP), and A3 (slope orientation), C3 (distance from provincial roads), and C4 (distance from highways) are the three least explanatory factors for the regional variation in basin carbon storages, with the sum of the three being only about 4%.

3.4.2. Interaction Detection Analysis

The results of the OPGD model show that the changes in carbon storage in Jinan City were the result of multiple factors (Figure 11). In different periods, the most significant explanatory power for the spatial variation in carbon storage is the influence of slope ∩ nighttime light index and elevation ∩ nighttime light index. The explanatory power is between 0.388 and 0.431 because the change in nighttime light intensity will affect the composition and nature of urban substrata and, thus, make the carbon storage vary more. At the same time, the carbon storage in the areas with high values of elevation and slope is also maintained at high levels, which, to some extent, leads to the spatial heterogeneity of carbon storage. In addition, the interaction effect of slope and NDVI is also obvious, indicating natural factors, such as slope, elevation, NDVI, and temperature. In conclusion, the synergistic effect among the driving factors has a greater influence on the spatial differentiation of carbon storage in JNC, which is not a simple superposition relationship, and the influence of the driving factors on the spatial differentiation of carbon storage needs to be considered comprehensively in practice. Moreover, the interaction relationship among the drivers is non-linearly enhanced, indicating that any one factor combined with other factors can enhance the influence on the spatial variance in carbon storage.

4. Discussions

4.1. LULC Dynamics Affected by Human Activities

Megacities have the fastest urbanization and socio-economic development and the most pronounced pressure on ecosystem services from human activities [49,50,51]. The overall land-use change in JNC is similar: the proportions of farmland and construction land in Jinan (55.4% and 22.4%) are much higher than the national average (14.3% and 4%), but the unused proportion (0.38%) is only about 1% of the national average [52]. The results of the random forest model show that socio-economic and accessibility factors contributed 76%, 69%, and 53% to water land, arable land, and construction land, respectively (Figure 4).
Regarding spatiotemporal structural transformation characteristics, especially between farmland and built-up land in big cities, this characteristic is similar to the land evolution path of most megacities in China [53,54]. To some extent, the structural shifts represent the evolutionary direction of human activities. Compared to the natural development scenario (S1), the ecological conservation scenario (S2) shows a significant increase in forest land and grassland area and a slowdown in the expansion of built-up land, which indicates that mega-city expansion is guaranteed at the expense of ecological land [55]. We developed JNC’s land evolution in two phases, Phase 1 for accelerated expansion (2010–2015) and Phase 2 for stable evolution (2015–2018). Phases 1 and 2 had an expansion rate of 17.00 km2/year and 14.1 km2/year for built-up land, respectively, while the rate of farmland shrinkage was −17.05 km2/year and −13.56 km2/year, respectively. We found that although the area of built-up land under the economic development scenario (S3) in 2030 is 59.3 km2 and 85.1 km2 more than that under the S1 and S2 scenarios, we consider that the ecological protection red line is still the bottom line for maintaining the sustainable development of megacities in the future [56]. The forest land and grassland in the southern mountainous areas increased, which is the effect of adding the ecological protection red line-limiting factor, which means that priority ecological lands will be protected regardless of economic development or ecological conservation scenarios.

4.2. Impacts of LUCC on Carbon Storage from 2010 to 2030

Overall, land-use changes generally affect regional carbon storage by influencing carbon density [57,58]. The carbon release in the period of 2018–2030 is much larger than the carbon sink, with the carbon release being about nine times (S1), four times (S2), and ten times (S3) higher than the carbon sink (Table 5). The total carbon release under different scenarios can reach 3.51 × 10⁶ t (S1), 3.14 × 10⁶ t (S2), and 4.60 × 10⁶ t (S3). The conversion types with more significant changes in carbon release were mainly farmland–construction land, forest land–grassland, and forest land–construction land, among which the conversion of cropland–construction land was the most prominent, with 3.17 × 10⁶ (S1), 2.69 × 10⁶ t (S2), and 4.04 × 10⁶ t (S3), accounting for 90.4% (S1), 85.8% (S2), and 87.9% (S3) of the total carbon release, respectively, which is similar to a study of the coastal areas of Shandong Province [58]. The total carbon sinks in Jinan under different scenarios could reach 0.39 × 10⁶ t (S1), 0.80 × 10⁶ t (S2), and 0.45 × 10⁶ t (S3), and the transformation types with more significant changes in carbon sinks were dominated by cropland–forest, grassland–forest land, and cropland–grassland. Under the ecological conservation scenario (S2), the conversion of cropland–forest land and grassland–forest land resulted in increased carbon sinks of 0.45 × 10⁶ t (S2) and 0.27 × 10⁶, respectively, which was due to the greater soil carbon density of forest land than that of grassland.
In rapid urbanization, megacities are more likely to shift from agricultural and ecological land, such as farmland or grassland, to land for construction [59]. The reduction in ecosystem areas will directly lead to a significant decrease in the carbon sequestration capacity of the ecosystem, as the substrate biomass of construction land is significantly lower than that of cropland and forest land. As the dominant land type in Jinan, farmland needs to be adjusted to improve its agricultural carbon sink function by adjusting the cropping structure, crop rotation, and applying organic fertilizers [60,61].

4.3. Drivers of the Spatial Variation in Carbon Storage

Unlike most current studies that directly use a single classification, such as natural breakpoints for data discretization studies [13,62], this study used OPGD to implement a combination of methods for optimal data discretization (Figure 12). Based on the highest q-value parameter combination (Table S3), the quantile method was used to optimally classify elevation, temperature, GDP, the density of other public facilities services, distance from major roads, distance from national roads, distance from railroads, and distance from water systems. Slope, NDVI, and population density were classified using the geometric classification method; slope direction, precipitation, and cultural facility service density were classified by the SD method, and commercial service facility density and distance from provincial roads were classified by the natural breakpoint method. The nighttime light index was treated as discrete data in order to more scientifically and accurately analyze the driving mechanisms of geographic changes in carbon storage. The results show that B6 (nighttime light index), B1 (GDP), A1 (elevation), B2 (population density), A6 (NDVI), and A2 (slope) were always the main drivers affecting the spatial distribution of carbon storage, while A5 (temperature), B3 (density of commercial service facilities), and C1 (distance from major roads) were secondary drivers, as confirmed by this study at this point [32]. After the two-factor inter-detection effect, all factors exhibited a non-linear enhancement, which is consistent with what others have found in the Yellow River Basin [63] and the Southwest Karst Basin [32].
The distribution of the nighttime lighting index plays a major role in carbon storage changes, indicating that the expansion of building sites reduces carbon storage [16]. The interaction of slope, elevation, and NDVI with other factors is also more obvious, and woodlands and grasslands possess a better carbon sequestration capacity. In addition, the spatial distribution of soil types differed significantly under different elevation and slope conditions [64]. Furthermore, the spatial distribution of soil types differed significantly under different elevation and slope conditions, which led to different physical and chemical factors, such as water content and pH, on the sequestration capacity of organic carbon in the soil, thus affecting the spatial distribution of carbon storage. Therefore, when promoting future carbon-neutral work in Southern Jinan, it is necessary to reasonably adjust the land-use structure and consider the impact of human activities on carbon sequestration in the region. Implementing ecological engineering restoration and reforestation can enhance the carbon sink capacity [65]. At the same time, the “three control lines” of land space should be strictly observed to prevent the disorderly expansion of cities and towns from encroaching on ecological space and agricultural space.

4.4. Limitations and Future Perspectives

Regarding land-use multi-scenario simulation, the land-use change is a complex system process, and this study found that the trend of conversion of farmland to construction land is relatively obvious in JNC. In the future, the system dynamics (SD) model and multi-objective optimization model can be used to study the characteristics and response of carbon storage changes under the cropland change scenario. In addition, climate change has a clear impact on carbon storage [66]. The need for the fine-grained simulation of land-use changes under shared socio-economic pathways scenarios (SSPs) is urgent [67], which is important for enhancing the urban response to climate change.
The uncertainty of the InVEST model mechanism is the uncertainty of the model about carbon density. Although this study revised the carbon pool density, the reality of land-use change is continuously evolving, especially at this stage. Both soil and ecological restoration projects have different effects on different land-use types, affecting the timeliness of carbon storage [68]. Future research should build a more refined localized carbon density database. Second, since most carbon storage processes follow a non-linear storage path, the construction of a non-linear response model of carbon storage rate versus time can be enhanced in the future to improve the accuracy of carbon storage amounts. Finally, forest ecosystem management under climate change and other ecosystem services, such as water conservation, soil and water conservation, and habitat quality, is also worth studying [69,70,71]. At the same time, we only analyzed carbon sequestration by regulating services, so a future research direction includes exploring the synergistic and trade-off characteristics of integrated ecosystem services.

5. Conclusions

This study focused on the megacity of Jinan City as the study area and predicted and calculated the carbon storage for the past 20 years using the Markov-FLUS-InVEST model based on multi-year land-use data, revealing the relationship between the spatial and temporal variation characteristics of carbon storage and land uses in this megacity. Based on the OPGD model, the main driving factors of the spatial variation in regional carbon storage were quantitatively identified, and the main conclusions are as follows:
(1) The Kappa coefficient of the Markov-FLUS model was 0.876, and the inclusion of natural, social, and accessibility multi-class factors could better simulate the complex land-use change process in megacities;
(2) From a temporal perspective, the land-use types in the period of 2010–2018 are relatively stable, mainly the farmland and built-up land. The carbon pool of farmland in Jinan accounts for more than 64%, and the carbon storage shows a continuous decreasing trend in the past nine years, mainly a decrease in the carbon storage of farmland, which decreased by 3.80 × 10⁶ t. In 2030, all three development scenarios show different degrees of decreasing trends of carbon storage, and compared with the natural development scenario, the ecological conservation scenario can weaken the decreasing trend of carbon storage better than the other two scenarios;
(3) From a spatial perspective, the most apparent land-use change is the shift from farmland to built-up land. The distribution of carbon storage shows a “high–low–high” pattern from south to north in JNC, with the southern mountainous areas having a high value of carbon storage and the low-value areas mainly concentrated in the urban built-up areas where human activities are concentrated. The change in carbon storage is mainly influenced by the expansion of built-up land on agricultural land and ecological land, and the dynamic changes in carbon storage are more evident in the central areas with rapid urbanization;
(4) The main carbon storage drivers are the nighttime light index, NDVI, elevation, and slope. The synergistic enhancement effect resulting from the complex interactions among these factors leads to the spatial heterogeneity of carbon storage. The multi-year multifactor interaction shows that slope ∩ nighttime light index and elevation ∩ nighttime light index have the greatest explanatory power for carbon storage, ranging from 0.388 to 0.431. NDVI, temperature, and population density are the single main drivers of regional carbon storage spatial variation, with average annual q values greater than 10%.

Supplementary Materials

The following supporting information can be downloaded at https://www.mdpi.com/article/10.3390/rs15184472/s1. Figure S1: The restrictive factors for ecological conservation scenario (S2). Table S1. Data sources for this study and optimal parameters for the OPGD model. Table S2. Land-use conversion cost matrix under the three scenarios. Table S3. Results of detecting the driving factors for the spatial differentiation of carbon storage in the JNC from 2010 to 2018.

Author Contributions

L.L.: conceptualization, methodology, writing—original draft, and writing—review and editing; Q.X.: conceptualization, software, writing—original draft, and writing—review and editing; X.Z.: visualization and data curation; C.Q.: resources, supervision, and funding acquisition; L.J.: methodology and writing—review and editing. All authors have read and agreed to the published version of the manuscript.

Funding

This work was supported by the National Key Research and Development Project of China (grant number 2022YFF1301205).

Data Availability Statement

Data can be made available by contacting authors.

Acknowledgments

I am grateful for this study to be supported by the Tsien Hsue-Shen Urbanology Award of Hangzhou International Urbanology Research Center and Zhejiang Urban Governance Studies Center, and we also appreciate the reviewers for providing valuable comments.

Conflicts of Interest

The authors declare that they have no known conflicting financial interests that could have appeared to influence the work reported in this paper.

References

  1. Lawrence, D.M.; Hurtt, G.C.; Arneth, A.; Brovkin, V.; Calvin, K.V.; Jones, A.D.; Jones, C.D.; Lawrence, P.J.; de Noblet-Ducoudré, N.; Pongratz, J. The Land Use Model Intercomparison Project (LUMIP) Contribution to CMIP6: Rationale and Experimental Design. Geosci. Model Dev. 2016, 9, 2973–2998. [Google Scholar] [CrossRef]
  2. Winkler, K.; Fuchs, R.; Rounsevell, M.; Herold, M. Global Land Use Changes Are Four Times Greater than Previously Estimated. Nat. Commun. 2021, 12, 2501. [Google Scholar] [CrossRef] [PubMed]
  3. Houghton, R.A. Revised Estimates of the Annual Net Flux of Carbon to the Atmosphere from Changes in Land Use and Land Management 1850–2000. Tellus B Chem. Phys. Meteorol. 2003, 55, 378–390. [Google Scholar]
  4. Cao, M.; Woodward, F.I. Dynamic Responses of Terrestrial Ecosystem Carbon Cycling to Global Climate Change. Nature 1998, 393, 249–252. [Google Scholar] [CrossRef]
  5. Sun, W.; Liu, X. Review on Carbon Storage Estimation of Forest Ecosystem and Applications in China. For. Ecosyst. 2020, 7, 4. [Google Scholar] [CrossRef]
  6. Wei, X.; Yang, J.; Luo, P.; Lin, L.; Lin, K.; Guan, J. Assessment of the Variation and Influencing Factors of Vegetation NPP and Carbon Sink Capacity under Different Natural Conditions. Ecol. Indic. 2022, 138, 108834. [Google Scholar] [CrossRef]
  7. Houghton, R.; Hackler, J. Emissions of Carbon from Forestry and Land-use Change in Tropical Asia. Glob. Chang. Biol. 1999, 5, 481–492. [Google Scholar] [CrossRef]
  8. Wu, X.; Fu, B.; Wang, S.; Song, S.; Li, Y.; Xu, Z.; Wei, Y.; Liu, J. Decoupling of SDGs Followed by Re-Coupling as Sustainable Development Progresses. Nat. Sustain. 2022, 5, 452–459. [Google Scholar] [CrossRef]
  9. Liang, Y.; Hashimoto, S.; Liu, L. Integrated Assessment of Land-Use/Land-Cover Dynamics on Carbon Storage Services in the Loess Plateau of China from 1995 to 2050. Ecol. Indic. 2021, 120, 106939. [Google Scholar] [CrossRef]
  10. Liu, X.; Wang, S.; Wu, P.; Feng, K.; Hubacek, K.; Li, X.; Sun, L. Impacts of Urban Expansion on Terrestrial Carbon Storage in China. Environ. Sci. Technol. 2019, 53, 6834–6844. [Google Scholar] [CrossRef]
  11. Houghton, R.A.; Skole, D.L.; Nobre, C.A.; Hackler, J.L.; Lawrence, K.T.; Chomentowski, W.H. Annual Fluxes of Carbon from Deforestation and Regrowth in the Brazilian Amazon. Nature 2000, 403, 301–304. [Google Scholar] [CrossRef]
  12. Wang, Y.; Zhang, Z.; Chen, X. Land Use Transitions and the Associated Impacts on Carbon Storage in the Poyang Lake Basin, China. Remote Sens. 2023, 15, 2703. [Google Scholar] [CrossRef]
  13. Xu, C.; Jiang, Y.; Su, Z.; Liu, Y.; Lyu, J. Assessing the Impacts of Grain-for-Green Programme on Ecosystem Services in Jinghe River Basin, China. Ecol. Indic. 2022, 137, 108757. [Google Scholar] [CrossRef]
  14. Wu, W.; Xu, L.; Zheng, H.; Zhang, X. How Much Carbon Storage Will the Ecological Space Leave in a Rapid Urbanization Area? Beijing-Tianjin-Hebei Urban Agglomeration. Resour. Conserv. Recycl. 2023, 189, 106774. [Google Scholar] [CrossRef]
  15. Zhu, G.; Qiu, D.; Zhang, Z.; Sang, L.; Liu, Y.; Wang, L.; Zhao, K.; Ma, H.; Xu, Y.; Wan, Q. Land-Use Changes Lead to a Decrease in Carbon Storage in Arid Region, China. Region, China. Ecol. Indic. 2021, 127, 107770. [Google Scholar] [CrossRef]
  16. Xiang, S.; Wang, Y.; Deng, H.; Yang, C.; Wang, Z.; Gao, M. Response and Multi-Scenario Prediction of Carbon Storage to Land Use/Cover Change in the Main Urban Area of Chongqing, China. Ecol. Indic. 2022, 142, 109205. [Google Scholar] [CrossRef]
  17. He, Y.; Ma, J.; Zhang, C.; Yang, H. Spatio-Temporal Evolution and Prediction of Carbon Storage in Guilin Based on FLUS and InVEST Models. Remote Sens. 2023, 15, 1445. [Google Scholar] [CrossRef]
  18. Gong, W.; Duan, X.; Sun, Y.; Zhang, Y.; Ji, P.; Tong, X.; Qiu, Z.; Liu, T. Multi-Scenario Simulation of Land Use/Cover Change and Carbon Storage Assessment in Hainan Coastal Zone from Perspective of Free Trade Port Construction. J. Clean. Prod. 2023, 385, 135630. [Google Scholar] [CrossRef]
  19. Lin, Z.; Peng, S. Comparison of Multimodel Simulations of Land Use and Land Cover Change Considering Integrated Constraints—A Case Study of the Fuxian Lake basin. Ecol. Indic. 2022, 142, 109254. [Google Scholar] [CrossRef]
  20. Xiong, N.; Yu, R.; Yan, F.; Wang, J.; Feng, Z. Land Use and Land Cover Changes and Prediction Based on Multi-Scenario Simulation: A Case Study of Qishan. Remote Sens. 2022, 14, 4041. [Google Scholar] [CrossRef]
  21. Liu, X.; Liang, X.; Li, X.; Xu, X.; Ou, J.; Chen, Y.; Li, S.; Wang, S.; Pei, F. A Future Land Use Simulation Model (FLUS) for Simulating Multiple Land Use Scenarios by Coupling Human and Natural Effects. Landsc. Urban Plan. 2017, 168, 94–116. [Google Scholar] [CrossRef]
  22. Jiang, X.; Meng, W.; Gang, X.U.; Bingwang, F.; Kun, Q.I.N.; Rui, X. Urban Development Boundary Simulation Based on “Double Evaluation” and FLUS Model. J. Geod. Geoinf. Sci. 2022, 5, 7–18. [Google Scholar]
  23. Zhang, J.; Li, X.; Zhang, C.; Yu, L.; Wang, J.; Wu, X.; Hu, Z.; Zhai, Z.; Li, Q.; Wu, G. Assessing Spatiotemporal Variations and Predicting Changes in Ecosystem Service Values in the Guangdong-Hong Kong-Macao Greater Bay Area. gISci. Remote Sens. 2022, 59, 184–199. [Google Scholar] [CrossRef]
  24. Babbar, D.; Areendran, G.; Sahana, M.; Sarma, K.; Raj, K.; Sivadas, A. Assessment and Prediction of Carbon Sequestration Using Markov Chain and InVEST Model in Sariska Tiger Reserve, India. J. Clean. Prod. 2021, 278, 123333. [Google Scholar] [CrossRef]
  25. Zhao, M.; He, Z.; Du, J.; Chen, L.; Lin, P.; Fang, S. Assessing the Effects of Ecological Engineering on Carbon Storage by Linking the CA-Markov and InVEST Models. Ecol. Indic. 2019, 98, 29–38. [Google Scholar] [CrossRef]
  26. Aitali, R.; Snoussi, M.; Kolker, A.S.; Oujidi, B.; Mhammdi, N. Effects of Land Use/Land Cover Changes on Carbon Storage in North African Coastal Wetlands. J. Mar. Sci. Eng. 2022, 10, 364. [Google Scholar] [CrossRef]
  27. Song, Y.; Wang, J.; Ge, Y.; Xu, C. An Optimal Parameters-Based Geographical Detector Model Enhances Geographic Characteristics of Explanatory Variables for Spatial Heterogeneity Analysis: Cases with Different Types of Spatial Data. gISci. Remote Sens. 2020, 57, 593–610. [Google Scholar] [CrossRef]
  28. Chen, W.; Wang, G.; Zeng, J. Impact of Urbanization on Ecosystem Health in Chinese Urban Agglomerations. Environ. Impact Assess. Rev. 2023, 98, 106964. [Google Scholar] [CrossRef]
  29. Li, K.; Hou, Y.; Andersen, P.S.; Xin, R.; Rong, Y.; Skov-Petersen, H. An Ecological Perspective for Understanding Regional Integration Based on Ecosystem Service Budgets, Bundles, and Flows: A Case Study of the Jinan Metropolitan Area in China. J. Environ. Manag. 2022, 305, 114371. [Google Scholar] [CrossRef]
  30. Wang, X.; Sun, Y.; Liu, Q.; Zhang, L. Construction and Optimization of Ecological Network Based on Landscape Ecological Risk Assessment: A Case Study. Land 2023, 12, 743. [Google Scholar] [CrossRef]
  31. Liu, P.; Hu, Y.; Jia, W. Land Use Optimization Research Based on FLUS Model and Ecosystem Services-Setting Jinan City as an Example. Urban Clim. 2021, 40, 100984. [Google Scholar] [CrossRef]
  32. Li, Y.; Geng, H. Spatiotemporal Trends in Ecosystem Carbon storage Evolution and Quantitative Attribution in a Karst Watershed in Southwest China. Ecol. Indic. 2023, 153, 110429. [Google Scholar] [CrossRef]
  33. Alam, S.A.; Starr, M.; Clark, B.J. Tree Biomass and Soil Organic Carbon Densities across the Sudanese Woodland Savannah: A Regional Carbon Sequestration Study. J. Arid. Environ. 2013, 89, 67–76. [Google Scholar] [CrossRef]
  34. Guo, W.; Teng, Y.; Yan, Y.; Zhao, C.; Zhang, W.; Ji, X. Simulation of Land Use and Carbon Storage Evolution in Multi-Scenario: A Case Study in Beijing. Sustainability 2022, 14, 13436. [Google Scholar] [CrossRef]
  35. Wang, C.; Luo, J.; Qing, F.; Tang, Y.; Wang, Y. Analysis of the Driving Force of Spatial and Temporal Differentiation of Carbon Storage in Taihang Mountains Based on InVEST Model. Appl. Sci. 2022, 12, 10662. [Google Scholar] [CrossRef]
  36. Xiang, M.; Wang, C.; Tan, Y.; Yang, J.; Duan, L.; Fang, Y.; Li, W.; Shu, Y.; Liu, M. Spatio-Temporal Evolution and Driving Factors of Carbon Storage in the Western Sichuan Plateau. Sci. Rep. 2022, 12, 8114. [Google Scholar] [CrossRef] [PubMed]
  37. Eddy, S.R. Profile Hidden Markov Models. Bioinformatics 1998, 14, 755–763. [Google Scholar] [CrossRef]
  38. Eddy, S.R. Hidden Markov Models. Curr. Opin. Struct. Biol. 1996, 6, 361–365. [Google Scholar] [CrossRef]
  39. Firozjaei, M.K.; Sedighi, A.; Argany, M.; Jelokhani-Niaraki, M.; Arsanjani, J.J. A Geographical Direction-Based Approach for Capturing the Local Variation of Urban Expansion in the Application of CA-Markov Model. Cities 2019, 93, 120–135. [Google Scholar] [CrossRef]
  40. Zhang, Y.; Chang, X.; Liu, Y.; Lu, Y.; Wang, Y.; Liu, Y. Urban Expansion Simulation under Constraint of Multiple Ecosystem Services (MESs) Based on Cellular Automata (CA)-Markov Model: Scenario Analysis and Policy Implications. Land Use Policy 2021, 108, 105667. [Google Scholar] [CrossRef]
  41. Zhou, L.; Dang, X.; Sun, Q.; Wang, S. Multi-Scenario Simulation of Urban Land Change in Shanghai by Random Forest and CA-Markov Model. Cities Soc. 2020, 55, 102045. [Google Scholar] [CrossRef]
  42. Wang, S.Q.; Zheng, X.Q.; Zang, X.B. Accuracy Assessments of Land Use Change Simulation Based on Markov-Cellular Automata Model. Procedia Environ. Sci. 2012, 13, 1238–1245. [Google Scholar] [CrossRef]
  43. Liang, X.; Liu, X.; Li, X.; Chen, Y.; Tian, H.; Yao, Y. Delineating Multi-Scenario Urban Growth Boundaries with a CA-Based FLUS Model and Morphological Method. Landsc. Urban Plan. 2018, 177, 47–63. [Google Scholar] [CrossRef]
  44. Sharp, R.; Douglass, J.; Wolny, S.; Arkema, K.; Bernhardt, J.; Bierbower, W.; Chaumont, N.; Denu, D.; Fisher, D.; Glowinski, K.; et al. VEST 3.9.0 User’s Guide; The Natural Capital Project, Stanford University, University of Minnesota, The Nature Conservancy, and World Wildlife Fund, 2020. [Google Scholar]
  45. Fu, Q.; Xu, L.; Zheng, H.; Chen, J. Spatiotemporal Dynamics of Carbon Storage in Response to Urbanization: A Case Study in the Su-Xi-Chang Region, China. Processes 2019, 7, 836. [Google Scholar] [CrossRef]
  46. Liu, J.; Xu, Q.; Yi, J.; Huang, X. Analysis of the Heterogeneity of Urban Expansion Landscape Patterns and Driving Factors Based on a Combined Multi-Order Adjacency Index and Geodetector Model. Ecol. Indic. 2022, 136, 108655. [Google Scholar] [CrossRef]
  47. Wang, J.; Xu, C. Geodetector: Principle and Prospective. Acta Geogr. Sin. 2017, 72, 116–134. [Google Scholar]
  48. Gong, C.; Wang, L.; Wang, S.-X.; Zhang, Z.-X.; Dong, H.; Liu, J.-F.; Wang, D.-W.; Yan, B.-Q.; Chen, Y. Spatial Differentiation and Influencing Factor Analysis of Soil Heavy Metal Content at Town Level Based on Geographic Detector. Huan Jing Ke Xue Huanjing Kexue 2022, 43, 4566–4577. [Google Scholar]
  49. Aguilera, M.A.; Tapia, J.; Gallardo, C.; Núñez, P.; Varas-Belemmi, K. Loss of Coastal Ecosystem Spatial Connectivity and Services by Urbanization. Natural-to-Urban Integration for Bay Management. J. Environ. Manag. 2020, 276, 111297. [Google Scholar] [CrossRef] [PubMed]
  50. Rimal, B.; Sharma, R.; Kunwar, R.; Keshtkar, H.; Stork, N.E.; Rijal, S.; Rahman, S.A.; Baral, H. Effects of Land Use and Land Cover Change on Ecosystem Services in the Koshi River Basin, Eastern Nepal. Ecosyst. Serv. 2019, 38, 100963. [Google Scholar] [CrossRef]
  51. Zeng, J.; Cui, X.; Chen, W.; Yao, X. Impact of Urban Expansion on the Supply-Demand Balance of Ecosystem Services: An Analysis of Prefecture-Level Cities in China. Environ. Impact Assess. Rev. 2023, 99, 107003. [Google Scholar] [CrossRef]
  52. Zou, L.; Liu, Y.; Wang, J.; Yang, Y.; Wang, Y. Land Use Conflict Identification and Sustainable Development Scenario Simulation on China. J. Clean. Prod. 2019, 238, 117899. [Google Scholar] [CrossRef]
  53. Wang, C.; Zhan, J.; Chu, X.; Liu, W.; Zhang, F. Variation in Ecosystem Services with Rapid Urbanization: A Study of Carbon Sequestration in the Beijing. Phys. Chem. Earth Parts A/B/C 2019, 110, 195–202. [Google Scholar] [CrossRef]
  54. Zhu, L.; Song, R.; Sun, S.; Li, Y.; Hu, K. Land Use/Land Cover Change and Its Impact on Ecosystem Carbon Storage in Coastal Areas of China from 1980 to 2050. Ecol. Indic. 2022, 142, 109178. [Google Scholar] [CrossRef]
  55. Xin, X.; Zhang, T.; He, F.; Zhang, W.; Chen, K. Assessing and Simulating Changes in Ecosystem Service Value Based on Land Use/Cover Change in Coastal Cities: A Case Study of Shanghai, China. Ocean Coast. Manag. 2023, 239, 106591. [Google Scholar] [CrossRef]
  56. Ding, K.; Huang, Y.; Wang, C.; Li, Q.; Yang, C.; Fang, X.; Tao, M.; Xie, R.; Dai, M. Time Series Analysis of Land Cover Change Using Remotely Sensed and Multisource Urban Data Based on Machine Learning: A Case Study of Shenzhen, China from 1979 to 2022. Remote Sens. 2022, 14, 5706. [Google Scholar] [CrossRef]
  57. Junqia, K.; Du, Z.; Rong, Y.; Yongzhong, S. Prediction of Land Use Change and Its Influence on Carbon storages in the Middle Reaches of Heihe River. J. Desert Res. 2019, 39, 87. [Google Scholar]
  58. Zheng, H.; Zheng, H. Assessment and Prediction of Carbon Storage Based on Land Use/Land Cover Dynamics in the Coastal Area of Shandong Province. Ecol. Indic. 2023, 153, 110474. [Google Scholar] [CrossRef]
  59. Xiang, S.; Zhang, Q.; Wang, D.; Wang, S. Response and Vulnerability Analysis of Carbon Storage to LUCC in the Main Urban Area of Chongqing during 2000. J. Nat. Resour. 2022, 37, 1198–1213. [Google Scholar]
  60. Liu, M.; Han, G.; Zhang, Q. Effects of Agricultural Abandonment on Soil Aggregation, Soil Organic Carbon Storage and Stabilization: Results from observation in a small karst catchment, Southwest China. Agric. Ecosyst. Environ. 2020, 288, 106719. [Google Scholar] [CrossRef]
  61. Seitz, D.; Fischer, L.M.; Dechow, R.; Wiesmeier, M.; Don, A. The Potential of Cover Crops to Increase Soil Organic Carbon Storage in German Croplands. Plant Soil 2022, 488, 157–173. [Google Scholar] [CrossRef]
  62. Wang, R.; Zhang, H.; Qiang, W.; Li, F.; Peng, J. Spatial Characteristics and Influencing Factors of Carbon Emissions in County-Level Cities of China Based on Urbanization. Prog. Geogr 2021, 40, 1999–2010. [Google Scholar] [CrossRef]
  63. Wang, J.; Li, L.; Li, Q.; Wang, S.; Liu, X.; Li, Y. The Spatiotemporal Evolution and Prediction of Carbon Storage in the Yellow River Basin Based on the Major Function-Oriented Zone Planning. Sustainability 2022, 14, 7963. [Google Scholar] [CrossRef]
  64. Yang, Y.; Liu, L.; Zhang, P.; Wu, F.; Wang, Y.; Xu, C.; Zhang, L.; An, S.; Kuzyakov, Y. Large-Scale Ecosystem Carbon storages and Their Driving Factors across Loess Plateau. Carb Neutrality 2023, 2, 5. [Google Scholar] [CrossRef]
  65. Piao, S.; Fang, J.; Ciais, P.; Peylin, P.; Huang, Y.; Sitch, S.; Wang, T. The Carbon Balance of Terrestrial Ecosystems in China. Nature 2009, 458, 1009–1013. [Google Scholar] [CrossRef]
  66. Gao, M.; Xu, R.; Huang, J.; Su, B.; Jiang, S.; Shi, P.; Yang, H.; Xing, Y.; Wang, D.; Jiang, H.; et al. Increase of Carbon Storage in the Qinghai-Tibet Plateau: Perspective from Land-Use Change under Global Warming. J. Clean. Prod. 2023, 414, 137540. [Google Scholar] [CrossRef]
  67. Kong, R.; Zhang, Z.; Huang, R.; Tian, J.; Feng, R.; Chen, X. Projected Global Warming-Induced Terrestrial Ecosystem Carbon across China under SSP Scenarios. Ecol. Indic. 2022, 139, 108963. [Google Scholar] [CrossRef]
  68. Lal, R. Soil Carbon Sequestration Impacts on Global Climate Change and Food Security. Science 2004, 304, 1623–1627. [Google Scholar] [CrossRef] [PubMed]
  69. Luo, P.; Zhou, M.; Deng, H.; Lyu, J.; Cao, W.; Takara, K.; Nover, D.; Schladow, S.G. Impact of Forest Maintenance on Water Shortages: Hydrologic Modeling and Effects of Climate Change. Sci. Total Environ. 2018, 615, 1355–1363. [Google Scholar] [CrossRef]
  70. He, Y.; Kuang, Y.; Zhao, Y.; Ruan, Z. Spatial Correlation between Ecosystem Services and Human Disturbances: A Case Study of the Guangdong-Hong Kong-Macao Greater Bay Area, China. Remote Sens. 2021, 13, 1174. [Google Scholar] [CrossRef]
  71. Cao, Z.; Zhu, W.; Luo, P.; Wang, S.; Tang, Z.; Zhang, Y.; Guo, B. Spatially Non-Stationary Relationships between Changing Environment and Water Yield Services in Watersheds of China’s Climate Transition Zones. Remote Sens. 2022, 14, 5078. [Google Scholar] [CrossRef]
Figure 1. The digital elevation map of JNC.
Remotesensing 15 04472 g001
Figure 2. Multi-source remote sensing drivers of land use in JNC. (Note: (A1): Elevation; (A2): Slope; (A3): Aspect; (A4): Annual average precipitation; (A5): Annual average temperature; (A6): Normalized difference vegetation index (NDVI); (B1): Gross domestic product (GDP); (B2): Density of population; (B3): Density of commercial services; (B4): Density of cultural facility services; (B5): Density of other public services; (B6): Night light index; (C1): Distance from main roads; (C2): Distance from national roads; (C3): Distance from provincial roads; (C4): Distance from the highway; (C5): Distance from railroad; (C6): Distance from the river).
Remotesensing 15 04472 g002aRemotesensing 15 04472 g002b
Figure 3. Research framework.
Remotesensing 15 04472 g003
Figure 4. Importance of driving factors based on the random forest model for each land-use type. (A) The contribution rate of driving factors under the three types of physical geography, socio-economic factors, and accessibility. (B) The contribution rate of physical geography factors. (C) The contribution rate of socio-economic factors. (D) The contribution rate of accessibility factors.
Remotesensing 15 04472 g004
Figure 5. Spatial distribution of LUCC and transfer mapping in JNC from 2010 to 2030.
Remotesensing 15 04472 g005
Figure 6. Land-use conversion map from 2018 to 2030.
Remotesensing 15 04472 g006
Figure 7. Changes in carbon storage and average carbon density in JNC under different scenarios from 2010 to 2030.
Remotesensing 15 04472 g007
Figure 8. Spatial distribution of carbon storage and transfer mapping from 2010 to 2030.
Remotesensing 15 04472 g008
Figure 9. Map of spatial changes in the carbon storage centroid offset and standard deviation ellipse transfer direction: (A) increase in carbon storage; and (B) decrease in carbon storage.
Remotesensing 15 04472 g009
Figure 10. Carbon storage changes under various land-use types in Jinan City, 2010–2030.
Remotesensing 15 04472 g010
Figure 11. Interaction of different factors on carbon storage (A1: Elevation; A2: Slope; A3: Aspect; A4: Annual average precipitation; A5: Annual average temperature; A6: Normalized difference vegetation index (NDVI); B1: Gross domestic product (GDP); B2: Density of population; B3: Density of commercial services; B4: Density of cultural facility services; B5: Density of other public services; B6: Nighttime light index; C1: Distance from main roads; C2: Distance from national roads; C3: Distance from provincial roads; C4: Distance from the highway; C5: Distance from railroad; and C6: Distance from the river).
Remotesensing 15 04472 g011
Figure 12. Statistical plots of q-values for different classification methods and number of partitions. (Note: (A1): Elevation; (A2): Slope; (A3): Aspect; (A4): Annual average precipitation; (A5): Annual average temperature; (A6): Normalized difference vegetation index (NDVI); (B1): Gross domestic product (GDP); (B2): Density of population; (B3): Density of commercial services; (B4): Density of cultural facility services; (B5): Density of other public services; (C1): Distance from main roads; (C2): Distance from national roads; (C3): Distance from provincial roads; (C4): Distance from the highway; (C5): Distance from railroad; and (C6): Distance from the river).
Remotesensing 15 04472 g012
Table 1. Land-use demand of the three different scenarios for Jinan City in 2035 (km2).
All ScenariosFarmlandForestGrasslandWaterBuilt LandUnused Land
S15483.731315.25857.16233.782297.3657.84
S25465.651332.64875.05242.472271.5057.81
S35438.781313.05854.73233.452356.6548.47
Table 2. Revised carbon density of different land-use types in JNC (unit: t C/hm2).
Lucc TypeCi-aboveCi-belowCi-soilCi-dead
Farmland21.66102.83111.0712.51
Forest54.03147.68162.7117.98
Grassland44.98110.22102.369.28
Water0.38000
Built-up land3.1935.0400
Unused land1.66022.130
Table 3. Types of interaction between two covariates.
Types of InteractionsRange of q Values
Non-linear weakeningq(X1∩X2) < Min[q(X1), q(X2)]
Single-linear weakeningMin[q(X1), q(X2)] < q(X1∩X2) < Max[q(X1), q(X2)]
Two-factor enhancementMax[q(X1), q(X2)] < q(X1∩X2) < q(X1) + q(X2)
Mutually independentq(X1∩X2) = q(X1) + q(X2)
Non-linear enhancementq(X1∩X2) > q(X1) + q(X2)
Table 4. Areas of different land-use types in JNC.
2010201520182030-S12030-S22030-S3
Farmland5831.715746.445678.645483.735465.655438.78
Forest1301.551300.111302.671315.251332.641313.05
Grassland838.04832.56838.09857.16875.05854.73
Water248.08252.65247.51233.78242.47233.45
Built-up land2011.242096.252138.492297.362271.502356.65
Unused14.517.1139.7257.8457.8148.47
Total10,245.1210,245.1210,245.1210,245.1210,245.1210,245.12
Table 5. Changes in terrestrial ecosystem carbon storage caused by land-use transformation in JNC from 2010 to 2030 (103 t).
Type of ConversionS1S2S3
Farmland–Forest land148.17446.11232.79
Farmland–Grassland46.0675.5743.73
Farmland–Built-up land−3170.68−2690.57−4042.99
Forest land–Grassland−133.13−267.06−161.67
Forest land–Built-up land−82.94−92.93−255.03
Forest land–Unused−5.74−16.14−6.81
Grassland–Forest land182.24268.21173.34
Grassland–Built-up land−54.64−51.44−123.45
Grassland–Unused−61.98−17.50−11.91
Unused–Forest land1.794.660.36
Unused–Grassland8.513.401.94
Unused–Built-up land0.030.000.49
Carbon losses−3509.11−3135.63−4601.86
Carbon sinks386.794797.957452.662
Total change−3122.31−2337.67−4149.20
Disclaimer/Publisher’s Note: The statements, opinions and data contained in all publications are solely those of the individual author(s) and contributor(s) and not of MDPI and/or the editor(s). MDPI and/or the editor(s) disclaim responsibility for any injury to people or property resulting from any ideas, methods, instructions or products referred to in the content.

