Article

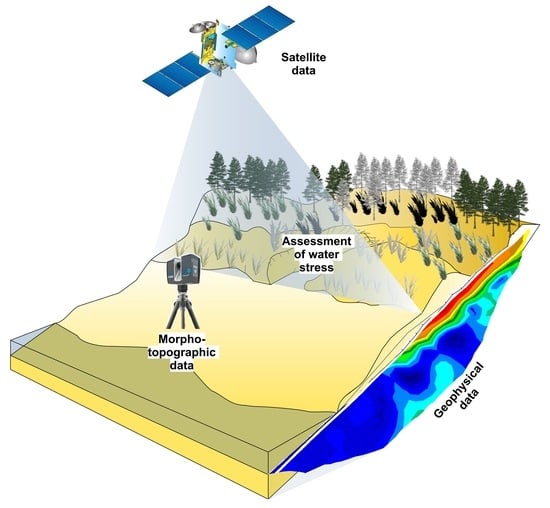
An Integrated Approach between Multispectral Satellite Images and Geophysical and Morpho-Topographic Surveys for the Detection of Water Stress Associated with Coastal Dune Erosion

by
Giovanni Scardino
1,2,*,
Saverio Mancino
1,
Gerardo Romano
1,
Domenico Patella
1 and
Giovanni Scicchitano
1,2
1
Department of Earth and Geo-Environmental Sciences, University of Bari Aldo Moro, 70125 Bari, Italy
2
Interdepartmental Research Center for Coastal Dynamics, University of Bari Aldo Moro, 70125 Bari, Italy
*
Author to whom correspondence should be addressed.
Remote Sens. 2023, 15(18), 4415; https://doi.org/10.3390/rs15184415
Submission received: 15 August 2023 / Revised: 2 September 2023 / Accepted: 6 September 2023 / Published: 7 September 2023
(This article belongs to the Special Issue Advances in Remote Sensing in Coastal Geomorphology Ⅱ)

Abstract

:
Coastal erosion occurs due to different processes involving physical and ecological systems. One of these factors is the degree of water stress experienced by dune vegetation. While healthy dune vegetation can help to stabilize the dune systems, water-stressed vegetation can instead enhance dune erosion. In this study, remote sensing techniques were used to monitor the water stress affecting the dune vegetation in dune systems along the alluvial plain of the Chiatona coast (Apulia, Southern Italy) located on the Ionian Arc. Multispectral satellite data from Landsat 8/9 and Sentinel-2 were used to assess the water stress at different spatial scales over a 4-year monitoring period from 2019 to 2023. The normalized difference vegetation index (NDVI) and the normalized difference moisture index (NDMI) were used to identify dune surfaces that were experiencing water stress. Furthermore, a terrestrial laser scanner and LiDAR data were acquired at different temporal ranges in areas affected by water stress to highlight coastal changes in areas associated with unhealthy dune vegetation. A large drop in NDVI values was observed in May 2020 due to the occurrence of coastal fires in some parts of the Chiatona coast. Geoelectrical surveys were conducted to investigate if coastal fires were capable of saline groundwater contamination, potentially enhancing dune erosion in these areas. The joint analysis of remote sensing, topographical, and geoelectric data showed that water stress reduced the amount of healthy dune vegetation, triggering dune deflation processes that resulted in increased coastal erosion rates, while also leading to the saline contamination of groundwater.

Graphical Abstract

1. Introduction

Coastal environments are important and complex ecosystems that require modern monitoring techniques for the development of reliable intervention strategies. Remote sensing technologies allow for the collection of large amounts of data at high temporal and spatial frequencies, which are useful for the detection and monitoring of the vegetation cover of coastal dunes [1,2]. The spectral signature of healthy, green vegetation exhibits a “peak-and-valley” curve that is exclusively related to the chlorophyll absorption band centered at wavelengths of approximately 450 and 670 nm [3,4]. The reflectance of healthy vegetation increases in the near-infrared portion of the electromagnetic spectrum at a spectral range of approximately 680–750 nm, depending on the species and environmental conditions [5]. In particular, chlorophyll production may decrease or even cease if the vegetation is stressed. Optical satellite data are frequently used for the analysis of vegetational cover and long-term changes in vegetation indices, such as the normalized difference vegetation index (NDVI) [6,7]. The NDVI is the most common method for evaluating the health of vegetation in coastal habitats [8] and provides the necessary phenological profiles used for the identification of the different types of vegetation [1]. NDVI time series data has been frequently used to monitor the productivity of seasonal vegetation, providing information that allows researchers to estimate the seasonal and inter-annual responses recorded by vegetation on coastal dune ecosystems [9]. Most studies reporting on the linear relation between rainfall events and NDVI have been carried out in arid or semi-arid areas [10,11]. Furthermore, an NDVI-based study carried out in Poland [12] confirms the suitability of NDVI in areas with sufficient water supplies. Relationships between NDVI and hydrological values have also been used to evaluate the response of forest ecosystems to changes in groundwater [13] as well as to evaluate groundwater runoff in wetland ecosystems to model environmental degradation [14]. NDVI has also been highlighted as a promising method for identifying groundwater-dependent vegetation [15], and there is an established relationship between NDVI and climate, surface water, and groundwater levels [7].
This study utilized a multidisciplinary approach comprising remote sensing and morpho-topographic and geophysical surveys to characterize water stress along the coastal dunes of the Chiatona coast (Apulia, Southern Italy). The aim of this study is to highlight the physical processes that could enhance coastal erosion. Remote sensing technologies, such as multispectral satellite images, integrated with morpho-topographic and geophysical data could represent a useful tool to automatically map coastal areas subjected to erosion processes and water stress. Evidence was collected directly from the study area, where, in recent years, both the shrubs and herbaceous vegetation of the foredunes and the arboreal vegetation of the secondary dunes have been observed to be suffering from a lack of water. To map the areas affected by water stress, we used multispectral satellite images across a 4-year time window (2019–2023) to analyze the study area in both the visible and infrared spectral ranges using optical satellite images. The analysis of multispectral optical satellite images allowed for the estimation of normalized vegetation indices, including the NDVI and the normalized difference moisture index (NDMI), which are particularly useful for characterizing the status of vegetative health with respect to water stress. Coastal changes were highlighted by conducting morpho-topographic surveys using terrestrial laser scanner (TLS) systems [16,17,18,19,20] as well as the analysis of LiDAR data [21,22,23,24] across different time periods. Geoelectrical surveys were also used to show the influence of groundwater flow on the root systems of the dune vegetation and were eventually used to highlight seawater intrusions in the study area. A drop in the NDVI observed in the study area was due to a coastal fire that occurred in the same period, resulting in a water deficit that affected the health of the dune vegetation. The NDMI was used to map the areas affected by the water deficit. At present, the dune vegetation is experiencing a slow natural recovery; however, dune erosion processes can still be observed in the present day.

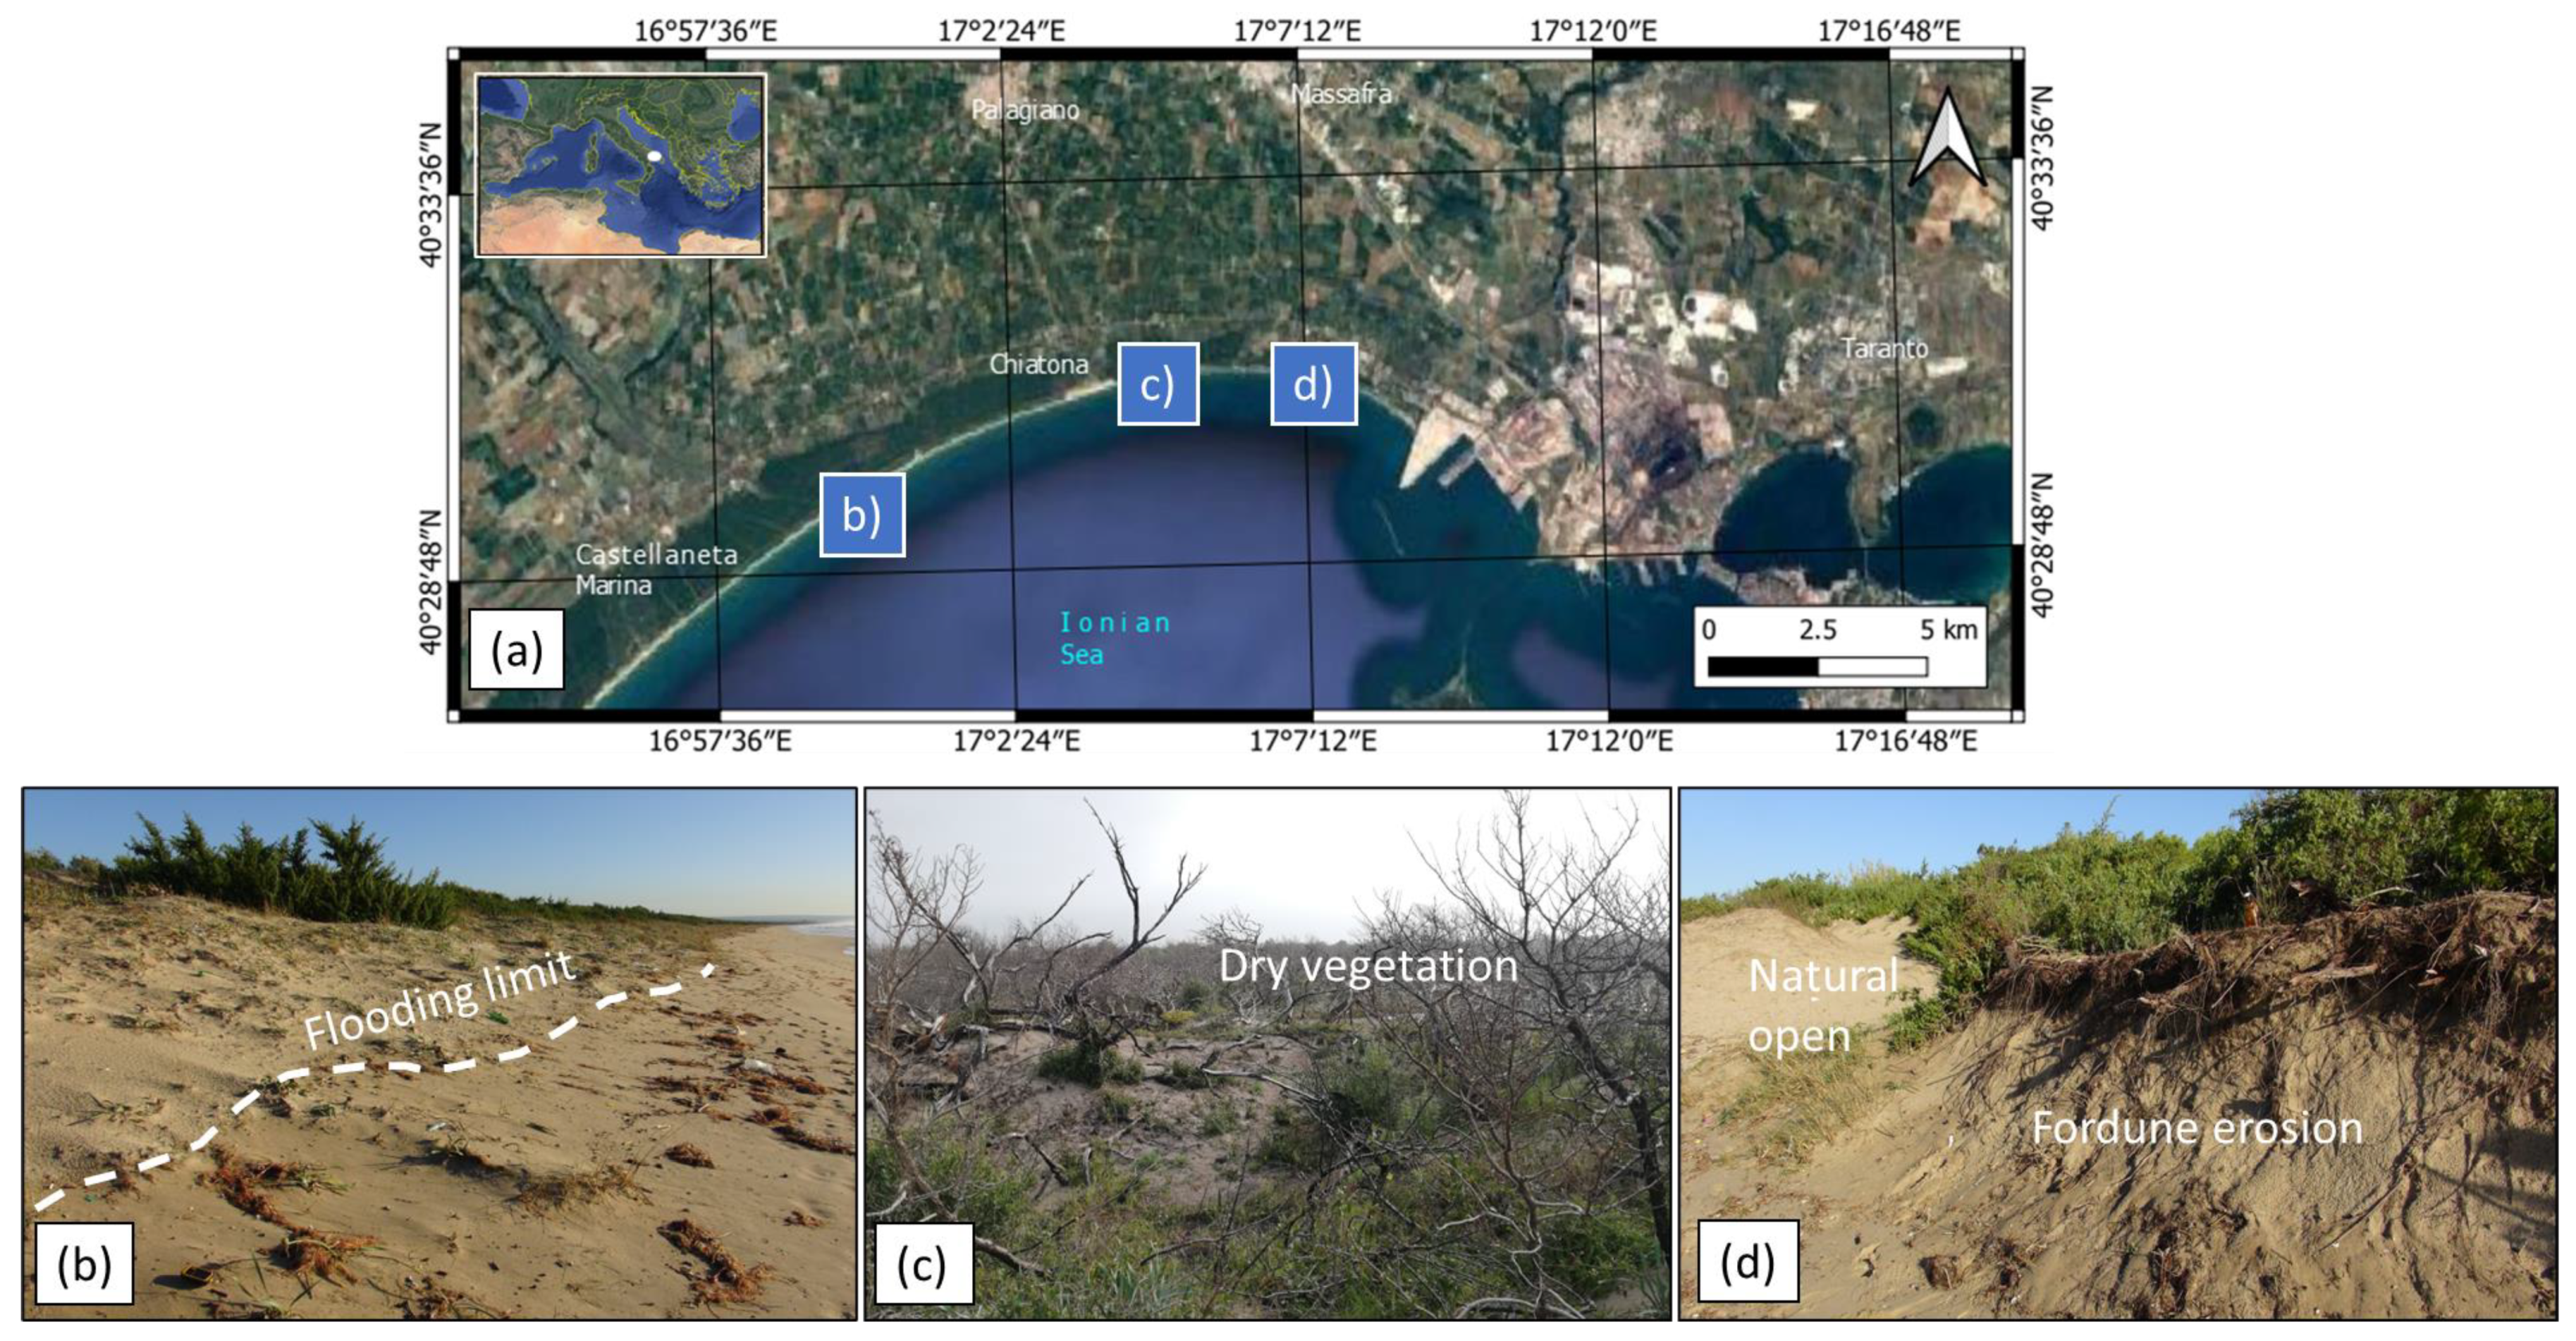
2. Study Area: Chiatona Coastline, Apulia, Southern Italy

This study area is located in the southwestern sector of the Apulia region (southern Italy), about 1.2 km east of the Chiatona settlement, a seaside district of the municipality of Palagiano (TA), located on the coastal plain of the Gulf of Taranto (Figure 1).
The sediment cover on the coastal plain is the result of a long sedimentary accumulation and progradation process that began about 7000 years BP [25,26]. The sediments are primarily derived from siliciclastic deposits carried by the main Lucanian rivers (Bradano, Basento, Agri, Cavone, and Sinni). These siliciclastic sediments are redistributed by littoral drift trending SSW to NNE for the entire coastal stretch of the plain [27,28,29]. The small watercourses (Lato, Lenne, Patemisco, and Tara) that cross the sandy coast close to Palagianello and the surrounding towns do not have sufficient extension and flow rates to supply beaches [26]. There are different orders of dune ridges present along the mobile coastal system, with some extending more than 1 km inland and reaching elevations between 8 m and 17 m above sea level; these dunes are primarily stabilized by the presence of macchia mediterranea vegetation [28,30]. The beaches continued to accrete until the mid-20th century; later, however, they were subjected to erosion driven by a negative sediment balance due to the construction of dams and water collection facilities as well as the construction of tourist resorts, which led to the leveling of the foredunes [29,31]. It is clear that the erosive influence of coastal dynamics was amplified by anthropogenic influences, especially in the area of Chiatona and Castellaneta Marina. The current morphology of the coastal area is thus the consequence of intense anthropogenic modification [32] as well as wave-driven erosional phenomena, resulting in the retreat of the dune body due to the weakening of the foot of the dune, which can lead to blowouts; consequently, more and more secondary and tertiary dunes are affected by erosional processes [33,34,35].
Additional vegetation analysis allowed for the identification of the different types of vegetation present in the area. The significant environmental diversity observed in the study area is mainly a result of the geomorphological and microclimatic characteristics of the gravine formed by the erosional furrows. The current vegetation is of biogeographic interest because the Mediterranean-Eastern (Balkan) floristic component is associated with a moderate Western component [36]. The vegetation of the embryonic dunes is primarily represented by an agro-prairie ecosystem, composed of vegetation dominated by beach crabgrass (Agropyron junceum), a perennial plant that uses its high stoloniferous capacity to spread and avoid burial. A. junceum exhibits root lengths that range between 10.5 cm and 16.5 cm and heights ranging from 100.7 cm to 102.4 cm [37]. The pioneer plants are followed by massive vegetation colonization; here, sand begins to accumulate due to the cohesion provided by the stems of plants, with small deposits of embryonic dunes reaching elevations that are a few centimeters high. The development of the foredune occurs simultaneously with the appearance of European beachgrass (Ammophila littoralis), a perennial psammophilous grass with erect culms up to 1.5 m tall. These plants exhibit dense leaves that form thick and tall tufts; this is unlike A. junceum, which is characterized by isolated culms and well-spaced leaves. A. littoralis grows on dunes far above the water table, with most possessing roots that extend to about 1 m in depth; in some cases, however, the roots of this plant can be found at depths of 2 m and even up to 5 m [38]. The secondary and tertiary dunes are mainly covered by Pinus halepensis. Root length of Pinus halepensis ranges between 8 m and 5 m [39]. In the Chiatona area the saline groundwater contamination can influence the concentration of nitrogen, useful for root and shoot growth [39].

3. Materials and Methods

Analysis on the dune vegetation was followed after considering the areas affected by water stress detected through satellite data and an in-situ survey (Figure 2). The areas greatly affected by water stress have been surveyed through morpho-topographic techniques, using Terrestrial Laser Scanner and LiDAR data. The morpho-topographic and geophysical data allowed us to assess the coastal changes that occurred from 2009 to 2023 and to determine the entity of the sediment loss in the foredune area.

3.1. Satellite Data

The spectral data collected by satellite sensors provide a significant amount of information about the physical features of the landscape. The two main datasets used in this work were acquired from Landsat 8/9 and Sentinel-2.
These satellites are equipped with both optical and thermal sensors. The Operational Land Imager optical sensor (OLI; Ball Aerospace & Technologies Corporation, Broomfield, CO, USA) produces images across a total of nine spectral bands that encompass the visible, near-infrared, and microwave ranges, with a spectral resolution ranging from 443 nm to 2200.5 nm. In contrast, the Thermal Infrared Sensor (TIRS; NASA Goddard Space Flight Center) consists of two thermal bands that record ground surface temperatures, with a spectral resolution ranging from 10,895 nm to 12,005 nm. The Landsat 8/9 Level 1 missions provide panchromatic images at a 15-m spatial resolution and multispectral images at a 30-m spatial resolution along a 185 km swath, while the thermal bands provide 100 m resolution images at an acquisition frequency of 16 days.
The Sentinel-2 mission is a constellation of two polar-orbiting satellites, Sentinel-2A and Sentinel-2B, placed along the same sun-synchronous orbit with a phase offset of 180°. The optical sensors on these satellites were built by Astrium SAS (Paris, France) and have 13 spectral bands: four bands at a 10 m spatial resolution (with a spectral resolution ranging from 490 nm to 842 nm), six bands at a 20 m spatial resolution (with a spectral resolution ranging from 705 nm to 2190 nm), and three bands at a 60 m spatial resolution (with a spectral resolution ranging from 443 nm to 1375 nm). The orbital swath is 290 km with an acquisition frequency of 5 days.
The temporal ranges of the different satellite images are reported in Table S1. Cloud-free scenes were selected to minimize uncertainties due to heterogeneous atmospheric conditions; radiometric calibration and atmospheric correction were also applied [40].
The spectral contents of the datasets were analyzed to highlight the typical spectral signature of chlorophyll absorption. The spectral signatures of dune vegetation were extracted using semi-automatic classification algorithms in QGIS, a geospatial analysis software [41]. The spectral separability of signatures was assessed in the primary, secondary, and tertiary dunes in 500 m2 squares.
Application of the Normalized Difference Vegetation Index (NDVI) in ecological studies has enabled the quantification and mapping of green vegetation and estimating the health vegetation status. NDVI is based on differences in reflectance in the red bands of visible spectra (due to vegetation pigment absorption) and maximum reflectance in the near infrared (NIR) bands (caused by cellular structure) [13,42]. In order to assess the soil moisture connected to the health vegetation status, the Normalized Difference Moisture Index was used. The NDMI is based on NIR and SWIR bands to display moisture. The SWIR band reflects changes in both the vegetation water content and the spongy mesophyll structure in vegetation canopies, while the NIR reflectance is affected by leaf internal structure and leaf dry matter content but not by water content [43,44,45].
The NDVI was calculated from satellite images without cloud cover to assess the health of the dune vegetation (Appendix A). The NDVI analysis allowed us to map the areas of the dune ridges that were influenced by water stress as well as extract time series data on the health of the vegetation. The NDMI was calculated from Sentinel 2 images to assess the water content of the vegetation (Appendix B).

3.2. Morpho-Topographic Data

Ground-based TLS and Airborne Laser Scanner (ALS) systems were used to obtain morpho-topographic data on the areas affected by water stress. ALS data were acquired for the inland areas from the former Italian Environmental Ministry (Ministero dell’Ambiente) between 2008 and 2009; these data had a vertical accuracy of 0.15 m and spatial resolution of 4 points/m2 over inland areas and were georeferenced in the WGS84/UTM zone 33N coordinate reference system. The TLS surveys were performed in 2022 and 2023 using a Faro Focus X130 TLS and covered the littoral area of the emerged beach, ranging from the foreshore to the tertiary dunes. An outside acquisition setting was configured with a resolution of 28.9 × 10⁶ points, an accuracy of 2 mm, an acquisition speed of 976,000 points/s, and a point distance of 3.068 mm/10 m.
The TLS point cloud was georeferenced using the GPS-Real Time Kinematic mode of the ITALPOS GNSS stations [46,47]. TLS data were filtered to remove vegetation and were interpolated using a natural neighbor algorithm to obtain digital terrain models (DTMs) that were representative of the coastal changes over time, with a cell width of 1 m. The main geomorphological features (e.g., shorelines, dune scarps, and dune ridges) were mapped and exported to a GIS environment. Furthermore, a difference of the DTMs was performed through a raster calculator in order to highlight the areas that experienced variations in the landforms and sediment loss.

3.3. Geoelectrical Surveys

The electrical resistivity tomography (ERT) methodology allows for the reconstruction of the distribution of electrical resistivity in the subsoil. Resistivity values depend on several factors, such as the porosity, the degree of saturation of the rocks, the nature of the fluids, and the mineralogy of the media being assessed. Consequently, ERT surveys are capable of acquiring key information in scenarios where significant resistivity contrasts are expected. They have been particularly successful in the detection of karst-related cavities and in the characterization of hydrogeological settings in coastal environments [48,49,50,51].
To investigate the subsoil in the study area, a single land–marine survey was conducted using a Syscal Pro 48 ch. (IRIS instruments, Orléans, France) connected to a 24-channel multielectrode land cable and a 13-channel multielectrode marine cable with an electrode spacing of 5 m. The total length of the surveys was 185 m (land: 115 m; marine: 70 m). The electrical connection between cables and ground was established through the use of integrated stainless steel and graphite electrodes on the land and marine cables, respectively. Where necessary, the contact resistance of the land cables was lowered through the use of salty water. Different electrode configurations were adopted to highlight the resistivity distribution patterns within the subsoil [52].
Specifically, data were acquired using the following configurations:
  • The Wenner–Schlumberger (WS) configuration due to its high signal-to-noise ratio as well as its moderate to high sensitivity to variations in vertical resistivity;
  • The dipole–dipole (DD) configuration (both in direct and reverse mode) due to its high sensitivity to lateral resistivity variations as well as to avoid experimental errors during the inversion procedure;
  • Multi gradient (GR) configuration due to its high spatial coverage in the shallower portions of the subsoil.
Topographical information was also included in the datasets; these were inverted using the RES2DINV program (Geotomo Software ver. 3.71.118; Loke and Barker, [53]). Resistivity models were produced by following the methods described by [53]; they were obtained using an L2-norm inversion while directly inverting the apparent resistivity values that better converged. Water column characteristics were also included in the inversion procedure by adding a stratum of 0.3 Ω ·m of resistivity (mean resistivity of the seawater in general conditions) to the marine section of the ERT survey with a vertical extension calculated from the topographic information.

4. Results

4.1. Spectral Signature and Water Stress

The analysis of the spectral signature of dune vegetation revealed the presence of the characteristic “peak-and-valley” curve before the occurrence of coastal fires in the Chiatona area on 26 and 27 May 2020 (Figure 3a,b). Following the occurrence of these coastal fires, an area of water stress was observed, extending from the foredune to the tertiary dunes; this resulted in a drastic change in the typical spectral signature of dune vegetation, with a significant reflectance loss in the red and NIR bands (Figure 3c). The health of the vegetation appeared to be recovering slowly over the past year, evidenced by the restoration of the spectral signature associated with dune vegetation (Figure 3d).
Coastal fires occurred due to the aridity of the dune vegetation in some areas of the sandy Chiatona coast. An analysis of the NDVI values of these areas revealed seasonal variations from 2019 to May 2020 (Figure 4a,b), with values ranging between 0.4 and 0.8, which are consistent with chlorophyll absorption associated with healthy vegetation. Between May and June 2020, there was a significant drop in NDVI to values lower than 0.2 (Figure 4c). This drop was detected in the Landsat 8/9 images between 22 May 2020 and 7 June 2020 and in the Sentinel-2 images between 24 May 2020 and 13 June 2020. The coastal fires affected a surface area of approximately 300,750 m2; these fires caused the vegetation in the region, primarily composed of Pinus spp., A. junceum, and A. littoralis, to be subjected to significant amounts of water stress (Figure 4). NDMI values lower than −0.25 were recorded during this time; these values usually represent areas with low canopy cover with high water stress or very low canopy cover with low water stress (Appendix B). It should be noted that the NDVI time series data revealed a positive trend that could be associated with an improvement in the health of the dune vegetation.

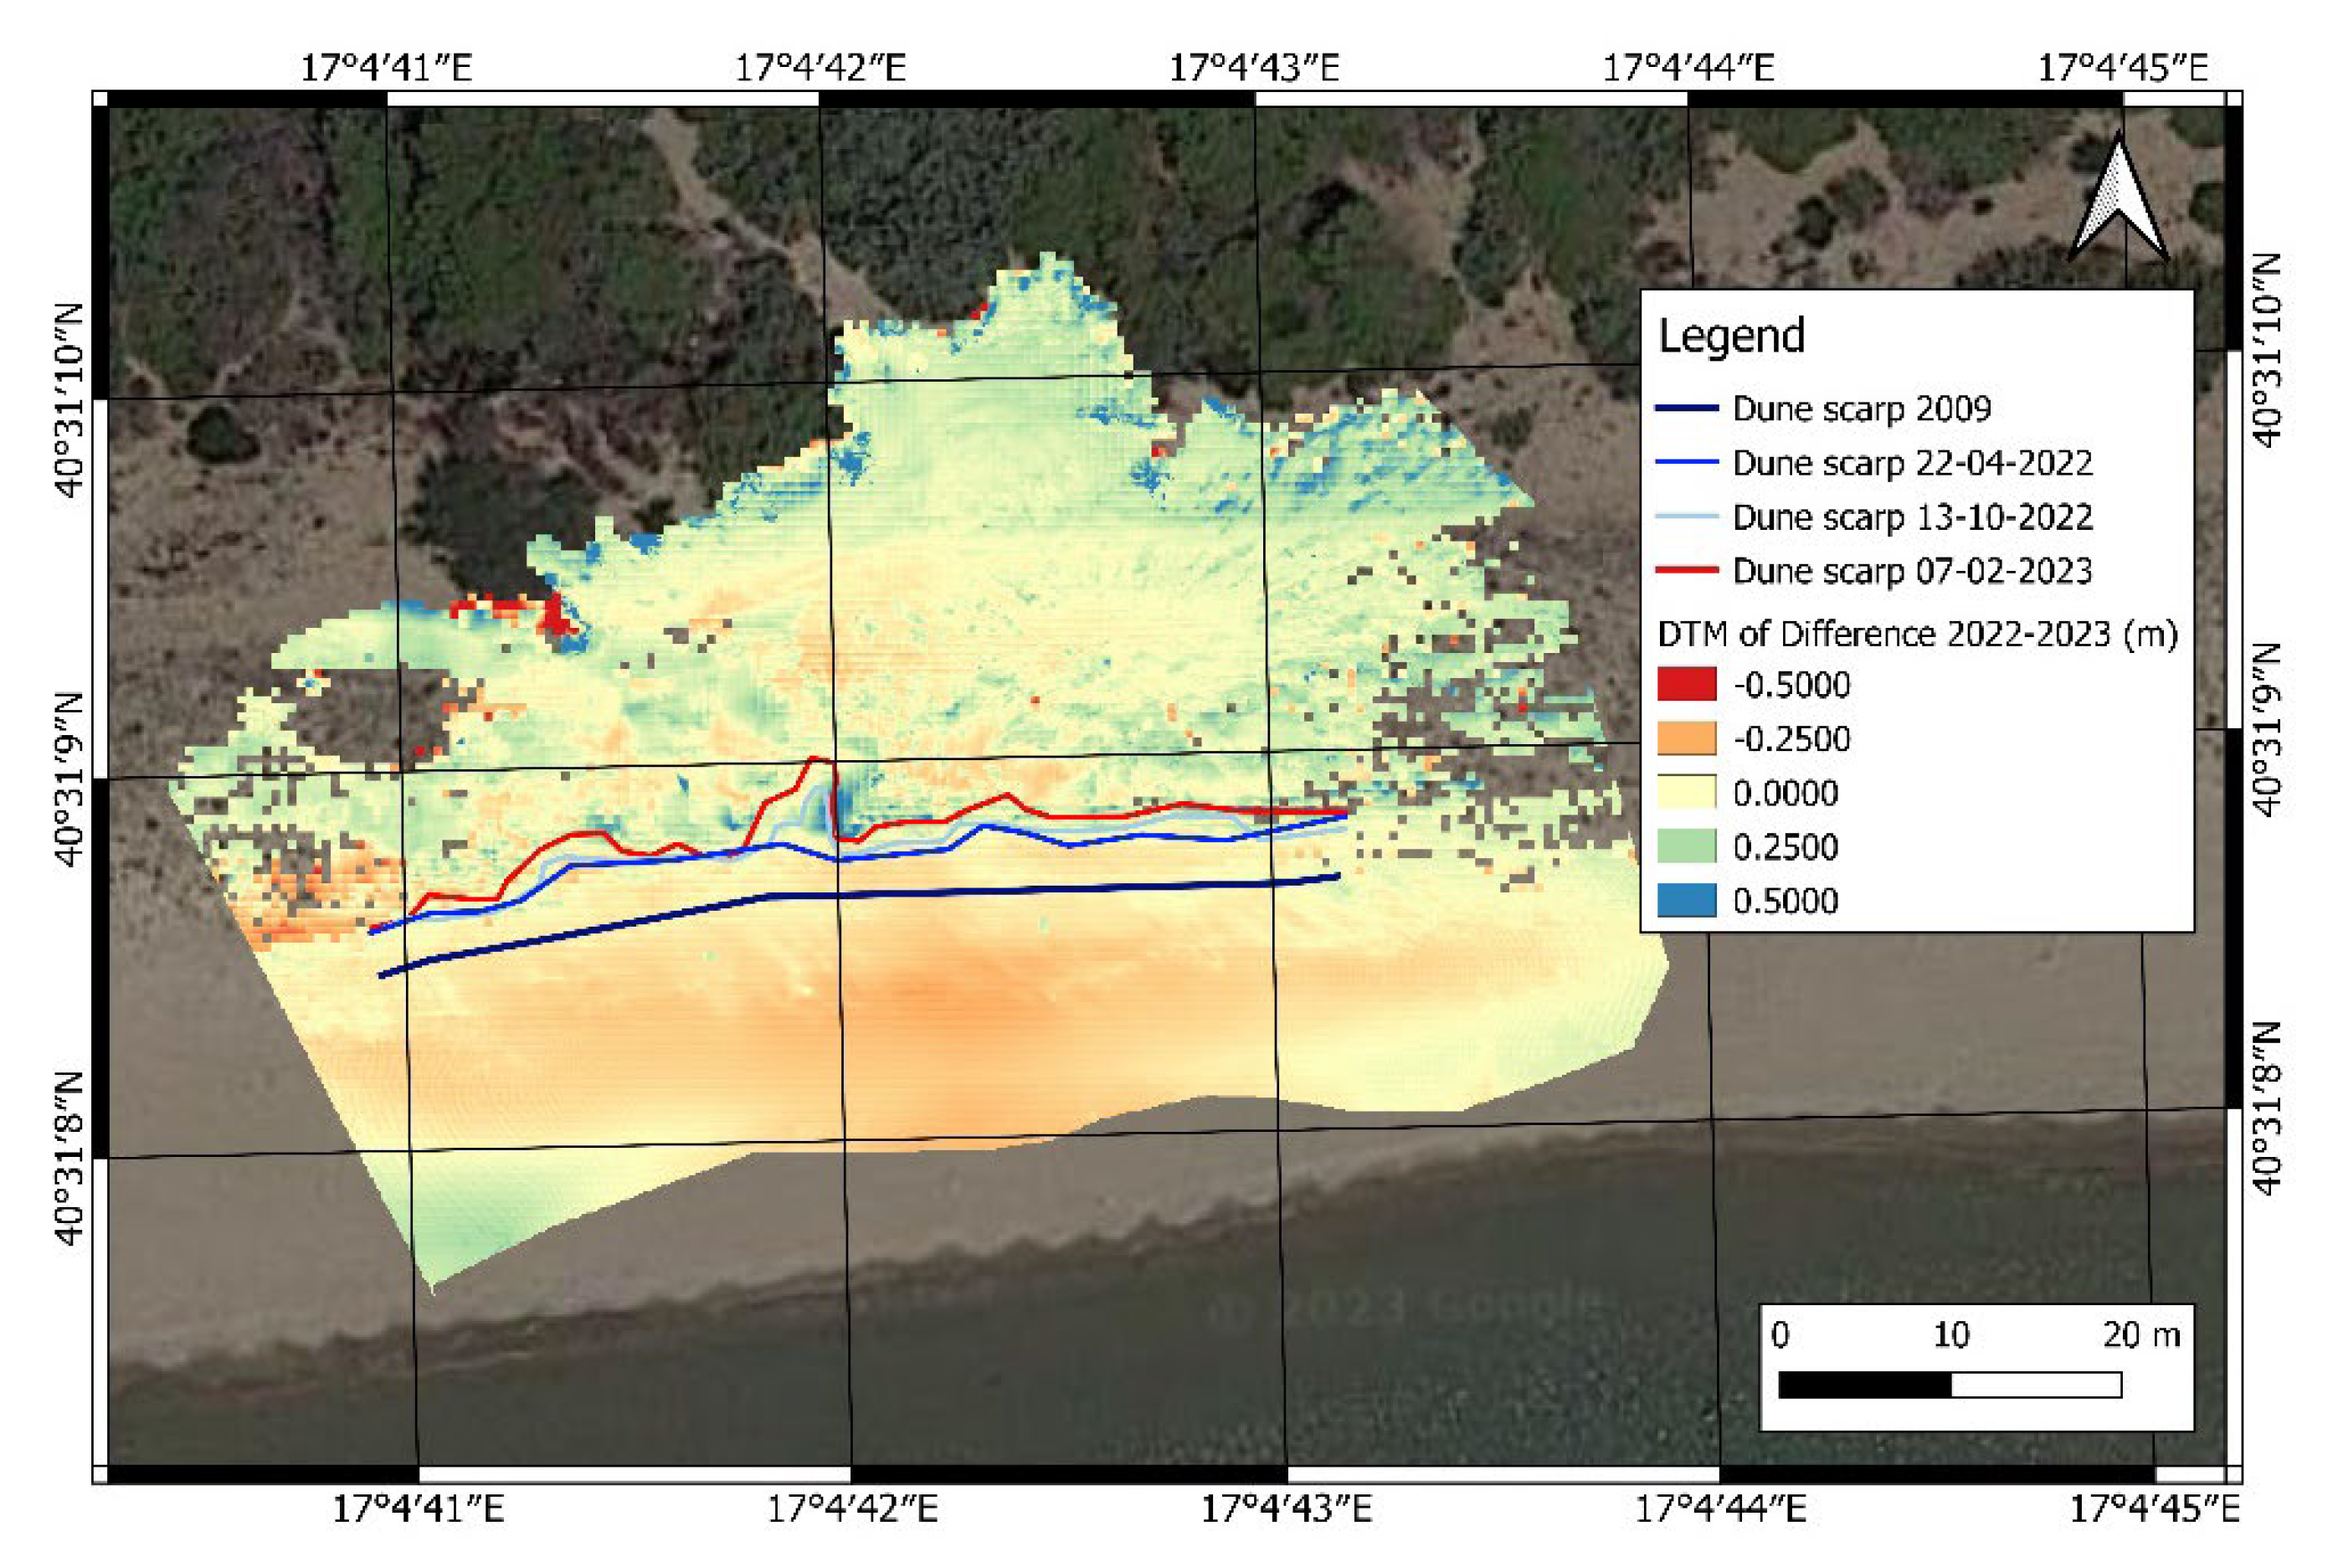
4.2. Coastal Changes and Dune Erosion
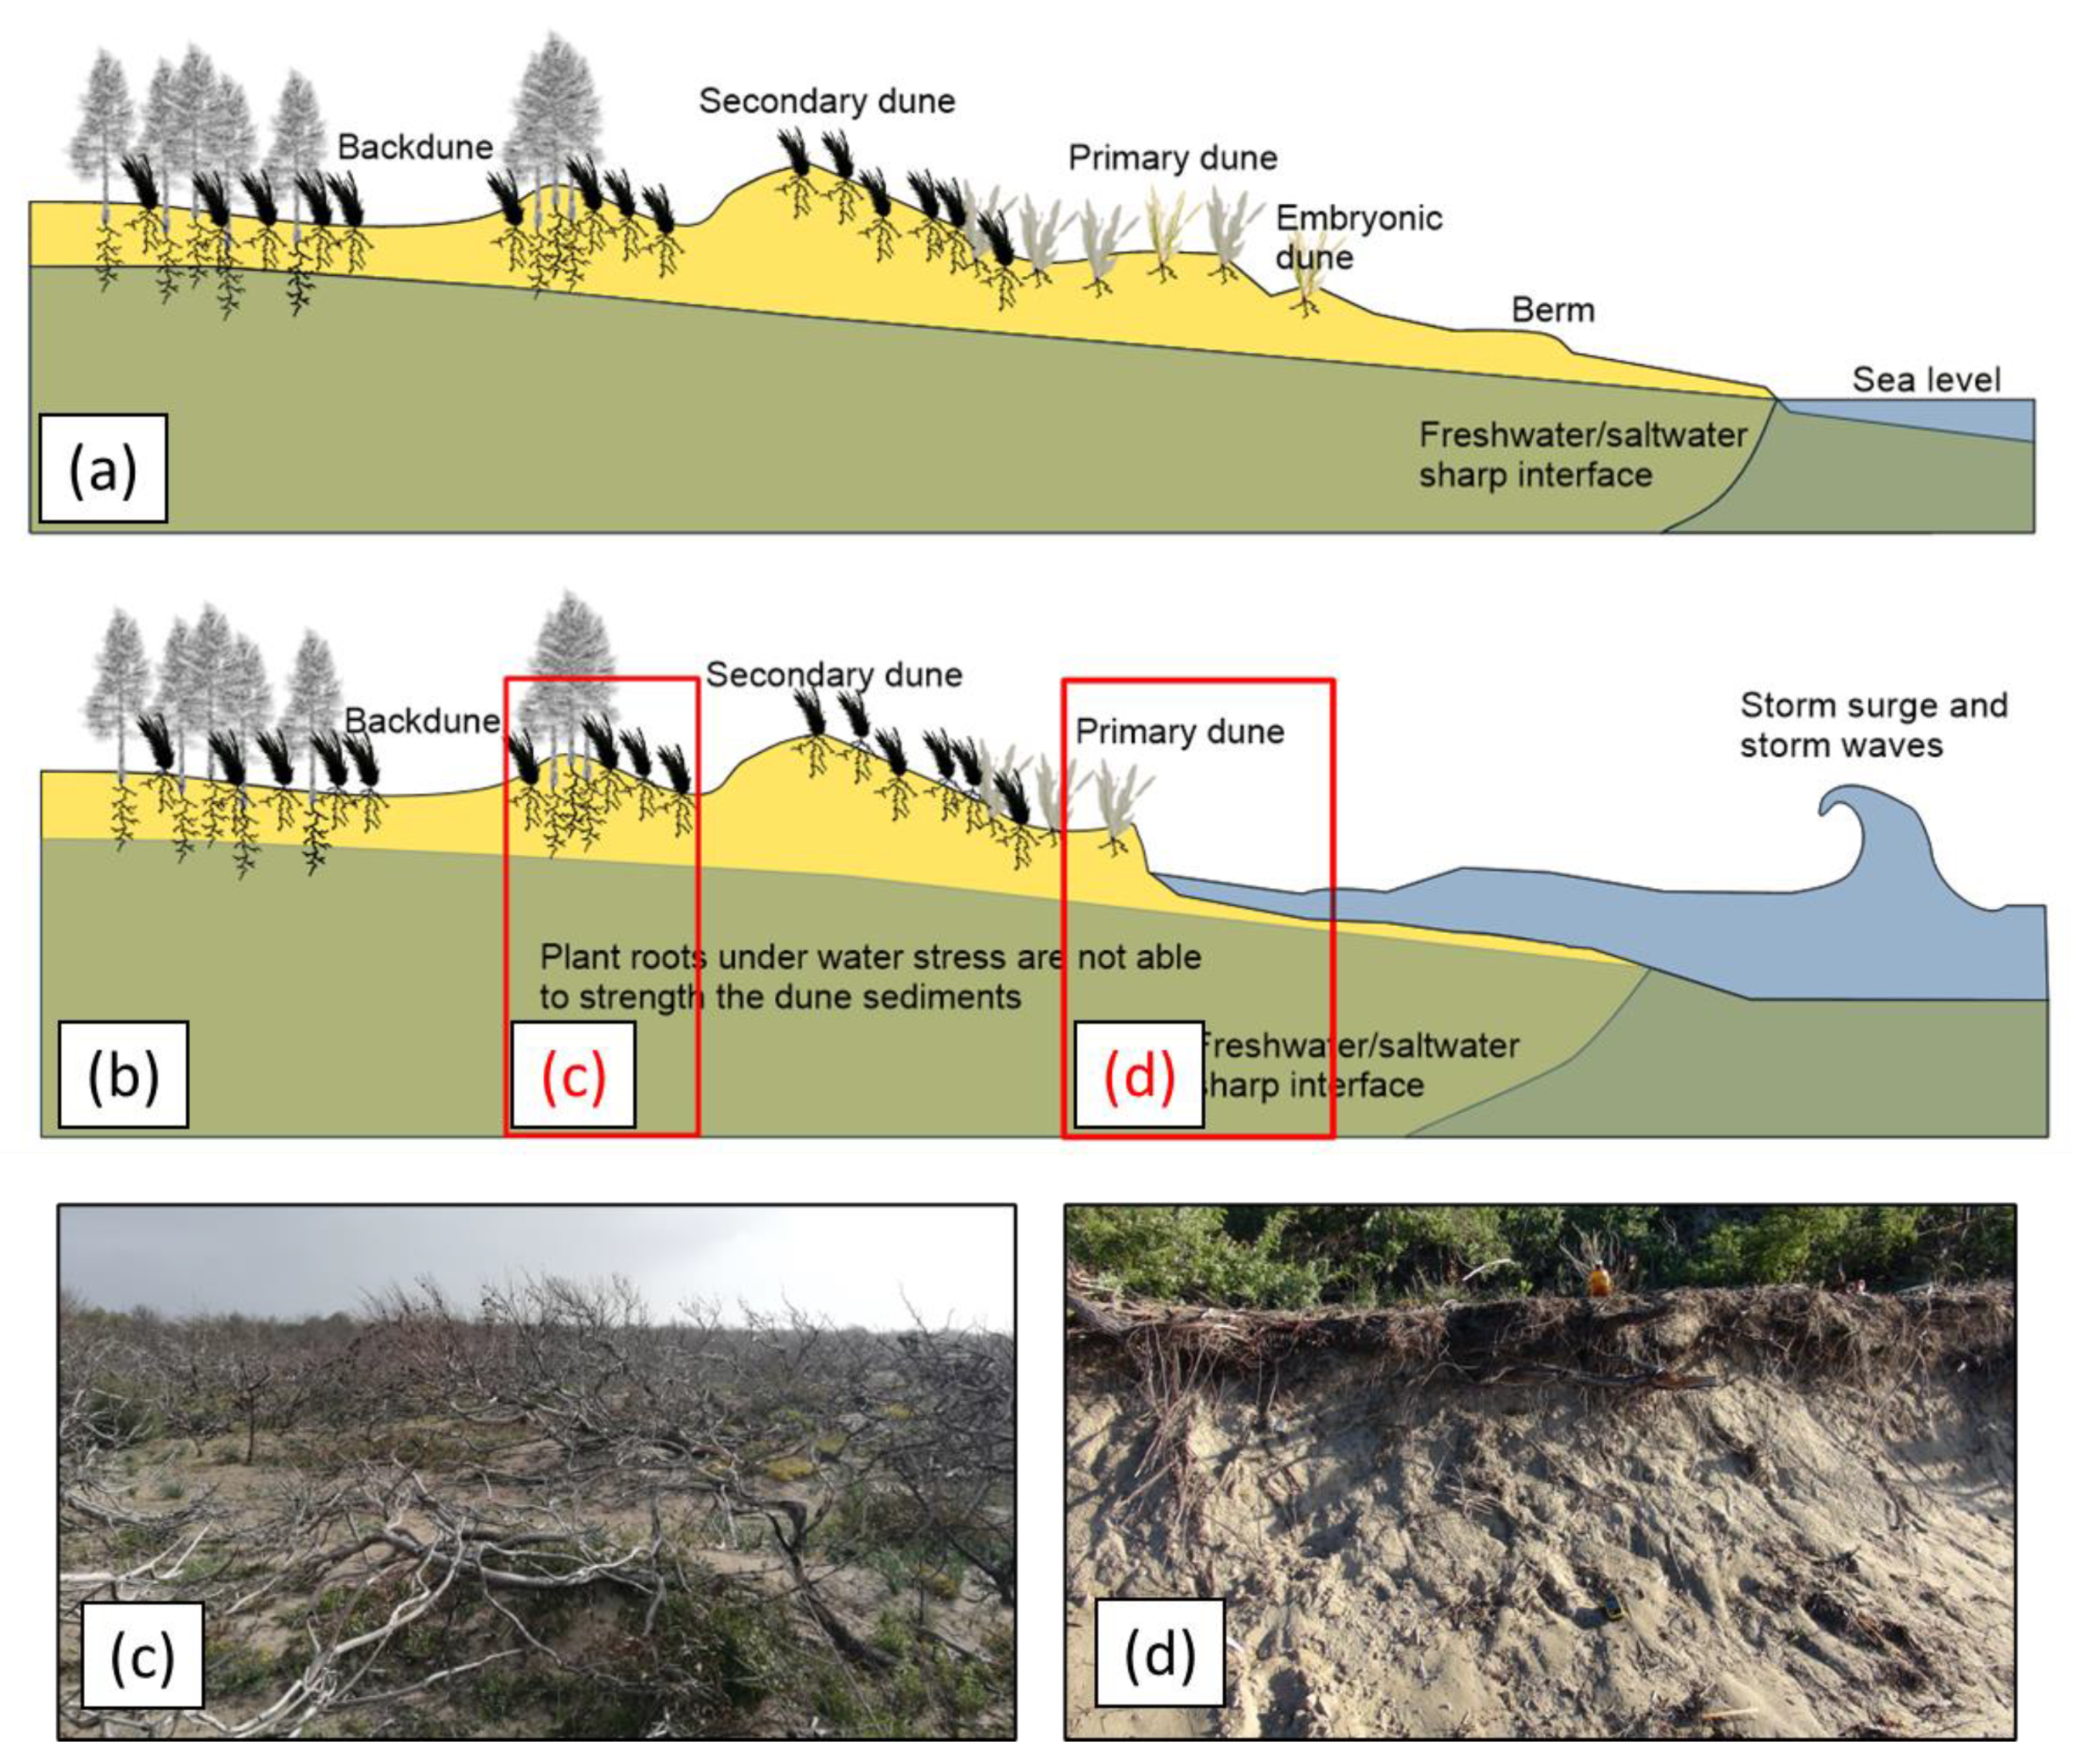
The analysis of the morpho-topographic data revealed that dune erosion generally increased between 2020 and 2023. LiDAR data from 2009 revealed lower foredune elevations (Figure 5) compared to data from 2020, highlighting the general accretion experienced by the coastal system. However, TLS data acquired from 2022 to 2023 highlighted the extent of erosional processes on the foredunes at a present rate of −0.38 ± 0.1 m/year. DTMs were comparatively analyzed to calculate the sediment loss as a function of dune erosion. The loss in sediment resulted in the migration of the foredune scarp at a rate of 9 m3/year (Figure 6).
Data from the ERT surveys revealed resistivity values that were consistent with the lithology of the study area as well as saltwater intrusion in the dune systems. The overall quality of the collected data was good, and no particular filtering procedures were adopted except for the removal of a few data points with negative resistivity values. The inversion of the geoelectrical data, which were acquired through the use of different electrode configurations (WS, DD, and GR), produced similar models. This was consistent with the rather simple geological setting of the study area, where resistivity variations are primarily due to the different degrees of saturation in the sediments. Figure 7a,b present the resistivity model obtained from the WS configuration and one possible interpretation of the model involving saltwater intrusion, respectively. This interpretation assumes that dry sands are characterized by high resistivities due to their high air content, while the resistivity of the saturated sands is strongly dependent on the nature of the pore-filling fluids. Consequently, more conductive areas are associated with seawater-saturated sands, while other parts of the model, which exhibit intermediate resistivity values, could represent areas saturated by fresh or brackish waters.
The upper limit of saline wedge intrusion does not affect the roots of the dune vegetation (Figure 7).

5. Discussion

Dune vegetation water stress is a major factor that drives the destabilization of dune bodies, resulting in enhanced erosional processes [54,55]. Morpho-topographic data and in situ observations of the Chiatona coast revealed that portions of the foredunes were affected by deflation processes and sometimes even exhibited dune levelling (Figure 8) [26]. The deflation and erosional processes appeared to be enhanced in areas where the health of the dune vegetation was poor. Furthermore, the water stress experienced by the dune vegetation decreases the mechanical strength of the non-cohesive sediments [56]. Geotechnical tests have shown that vegetated dune systems are better at counteracting erosional processes driven by wave and surge impacts compared to dunes without vegetation [56].
The relationship between the resilience of dunes and vegetation can be expressed in two main interactions: above-ground and below-ground interactions. Above-ground interactions involve the relationship between wave energy and surge impacts and plant height, flexibility, and the extent of the vegetated area [57,58]. Below-ground interactions involve the contribution of root density, depth, and size as well as mycorrhizal colonization to the mechanical strength of the dunes [56,59,60]. In this study area, Pinus halepensis and A. littoralis are the main species that contribute to the stabilization of the dune due to the below-ground interactions associated with their root system. In contrast, A. littoralis and A. junceum contribute to above-ground interactions by increasing the hydrodynamic drag and decreasing the energy imparted by wave impacts (Figure 9). Consequently, the poor health of dune vegetation decreases the ability of these vegetated dune systems to counteract the impact of storm events.
NDVI and NDMI analyses revealed that dune vegetation showed a slow recovery after the coastal fire occurred on 26 May 2020. However, LiDAR and TLS data revealed the presence of significant amounts of ongoing coastal erosion, with a shoreline erosion rate of −0.36 ± 0.18 m/year [26], consistent with the erosion rates observed on the primary dune scarp. The apparent contradiction between the rapid erosion rate and the slow restoration of dune vegetation is due to the different elastic responses of mobile coastal systems, which describes the resilience response of the dune system [61].
Multispectral satellite images were found to be better at describing the extent of vegetation compared to an orthomosaic RGB image (Figure 10). The red and NIR spectral bands of the Sentinel-2 and Landsat 8/9 data were much better at highlighting the distribution of vegetation characterized by low chlorophyll absorption (Figure 10b).
Multispectral images are widely used in vegetation-monitoring applications, especially in coastal environments [6,62]. Satellite images provide reliable records of the NDVI values of coastal vegetation due to their characteristic spectral signature [7]. Many studies have attempted to identify a correlation between the NDVI values of the dune vegetation and the height of the groundwater table [14,55,63], while other studies have attempted to integrate geophysical methods to correlate the height of the groundwater table with the health of the dune vegetation [64,65,66,67]. Many studies have also used satellite data to identify the different types of vegetation present in coastal dune systems through an analysis of NDVI and multispectral satellite imagery [22,68,69]. The height of the groundwater table is an important aspect that strongly influences vegetative health [9,15,70,71,72]. Many coastal management authorities are currently considering the use of dune vegetation as an eco-sustainable means of protecting coastlines against erosional processes triggered by climate change [55,73,74,75,76,77].

6. Conclusions

Mobile coastal systems are greatly affected by changes in climate. Among the many consequences of climate change, deficits in sediment balances are reflected in the erosion of coastal dunes. Dune vegetation can stabilize these dune systems, offsetting some of the effects of negative sedimentary balances. This study analyzed the extent of water stress in the dune systems of Chiatona (Apulia, Southern Italy). The main results obtained are the following:
-
NDVI and NDMI analyses of multispectral satellite images revealed that the total surface area affected by water stress was approximately 300,750 m2. This water stress was primarily due to a coastal fire event that occurred on 26 May 2020.
-
Morpho-topographic and geoelectrical surveys were used to provide insights into the coastal dynamics of this stretch of coastline, as well as examine the response of the coastline to water stress, showing a rate of foredune erosion equal to −0.38 ± 0.1 m/year.
Furthermore, the following phenomena were observed:
-
Coastal dune accretion occurred along the Chiatona coast from 2009 to 2020.
-
On 26 May 2020—14:18 h UTC, coastal fires occurred on the Chiatona and Palagiano coasts.
-
From June 2020 to February 2023, the Chiatona coast was subjected to significant erosional processes, primarily expressed by the retreat of the foredune scarp.
The multidisciplinary approach described in this work allowed us to assess the specific responses of this mobile coastal system in terms of its coastal resilience. In particular, the NDVI and NDMI analyses revealed that the health of the dune vegetation has been slowly recovering following the coastal fire event. However, this restoration has not been able to sufficiently stabilize the dune system, which is still subject to significant erosion. The remote sensing techniques described in this study can also be applied to coastal dune management to highlight the areas affected by water stress due to coastal fires.

Supplementary Materials

The following supporting information can be downloaded at: https://www.mdpi.com/article/10.3390/rs15184415/s1, Table S1: Dataset of multispectral images used for the assessment of water stress.

Author Contributions

Conceptualization, G.S. (Giovanni Scardino); methodology, G.S. (Giovanni Scardino), S.M. and G.R.; software, G.S. (Giovanni Scardino), G.R. and D.P.; validation, G.S. (Giovanni Scicchitano) and G.S. (Giovanni Scardino); formal analysis, G.S. (Giovanni Scardino), G.R. and D.P.; investigation, G.S. (Giovanni Scardino), S.M., G.R. and D.P.; resources, G.S. (Giovanni Scicchitano); data curation, G.S. (Giovanni Scardino), S.M., G.R. and D.P.; writing—original draft preparation, G.S. (Giovanni Scardino) and S.M.; writing—review and editing, G.R., D.P. and G.S. (Giovanni Scicchitano); visualization, G.S. (Giovanni Scicchitano); supervision, G.S. (Giovanni Scardino); project administration, G.S. (Giovanni Scicchitano); funding acquisition, G.S. (Giovanni Scicchitano). All authors have read and agreed to the published version of the manuscript.

Funding

This work was developed as part of the activities of the Research Agreement stipulated between the University of Bari Aldo Moro and the Agenzia Regionale Strategica per lo Sviluppo Ecosostenibile del Territorio (ASSET, Italy) (Scientific Coordinator G. Scicchitano).

Data Availability Statement

Suggested Data Availability Statements are available on request.

Acknowledgments

This research was partially funded by the Apulia Region (Italy) under the European Regional Development Fund and the European Social Fund (POR Puglia FESR-FSE 2014-2020-Action 10.4 “Research for Innovation” (REFIN): F675E915. An initial version of this work was developed by S. Mancino in the framework of his master thesis at the University of Bari Aldo Moro.

Conflicts of Interest

The authors declare no conflict of interest.

Appendix A

Some studies have used the normalized difference vegetation index (NDVI) as an indicator for vegetative health [78,79,80] (Caturegli et al., 2015; 2016; Volterrani et al., 2017). The NDVI is the ratio between the difference and the sum of reflected near-infrared and visible red radiation and describes the vigor of the vegetation being analyzed. The NDVI index was applied to multispectral satellite images using the following equation:
N D V I = R N I R R R E D R N I R + R R E D
where RNIR represents the reflectance value in the near-infrared (NIR) band and RRED represents the reflectance value in the visible red band. The NDVI was calculated using the NIR and visible red bands from Landsat 8 and Sentinel-2 images in QGIS. Different NDVI values represent different degrees of vegetative vigor (Table A1).
Table A1. The relationship between NDVI values and the vigor of the vegetation.
NDVIType of Vegetation Vigor
<0.1Bare ground or clouds
0.1–0.2Almost no plant cover
0.2–0.3Very low plant cover
0.3–0.4Low canopy cover with low vigor or very low canopy cover with high vigor
0.4–0.5Medium-low canopy cover with low vigor or very low canopy cover with high vigor
0.5–0.6Medium canopy cover with low vigor or medium-low canopy cover with high vigor
0.6–0.7Medium-high canopy cover with low vigor or medium canopy cover with high vigor
0.7–0.8High plant cover with high vigor
0.8–0.9Very high canopy cover with very high vigor
0.9–1.0Total vegetative cover with very high vigor

Appendix B

The Normalized Difference Moisture Index (NDMI) [81] was used to evaluate the water stress experienced by the vegetation. The NDMI is the ratio between the difference and the sum of the reflected radiations in the NIR and in the short-wave infrared (SWIR) spectra:
N D M I = R N I R R S W I R R N I R + R S W I R
where RNIR represents the reflectance value in the NIR band and RSWIR represents the reflectance value in the SWIR band. The NDMI was calculated using the NIR and SWIR bands from Landsat 8 and Sentinel-2 images in QGIS. NDMI values are representative of the degree of water stress and the type of vegetation (Table A2).
Table A2. The relationship between NDMI values and the degree of water stress and the type of vegetation.
NDMIType of Water Stress
−1–−0.8Bare ground
−0.8–−0.6Almost no plant cover
−0.6–−0.4Very low plant cover
−0.4–−0.2Low canopy cover with high water stress or very low canopy cover with low water stress
−0.2–0Medium-low canopy cover with high water stress or low canopy cover with low water stress
0–0.2Medium canopy cover with high water stress or medium-low canopy cover with low water stress
0.2–0.4Medium-high canopy cover with high water stress or medium canopy cover with low water stress
0.4–0.6High plant cover and no water stress
0.6–0.8Very high plant cover and no water stress
0.8–1.0Total plant cover and no water stress or stagnant water or clouds

References

  1. Silvestri, S.; Marani, M.; Marani, A. Hyperspectral Remote Sensing of Salt Marsh Vegetation, Morphology and Soil Topography. Phys. Chem. Earth Parts A/B/C 2003, 28, 15–25. [Google Scholar] [CrossRef]
  2. Yousefi Lalimi, F.; Silvestri, S.; Moore, L.J.; Marani, M. Coupled Topographic and Vegetation Patterns in Coastal Dunes: Remote Sensing Observations and Ecomorphodynamic Implications. J. Geophys. Res. Biogeosci. 2017, 122, 119–130. [Google Scholar] [CrossRef]
  3. Zarco-Tejada, P.J.; Miller, J.R.; Morales, A.; Berjón, A.; Agüera, J. Hyperspectral Indices and Model Simulation for Chlorophyll Estimation in Open-Canopy Tree Crops. Remote Sens. Environ. 2004, 90, 463–476. [Google Scholar] [CrossRef]
  4. Yadav, T. Habitable Exoplanets: A Literature Review of Potential Signatures of Life; ResearchGate: Berlin, Germany, 2018. [Google Scholar]
  5. O’Malley-James, J.T.; Kaltenegger, L. The Vegetation Red Edge Biosignature Through Time on Earth and Exoplanets. Astrobiology 2018, 18, 1123–1136. [Google Scholar] [CrossRef] [PubMed]
  6. Marzialetti, F.; Giulio, S.; Malavasi, M.; Sperandii, M.G.; Acosta, A.T.R.; Carranza, M.L. Capturing Coastal Dune Natural Vegetation Types Using a Phenology-Based Mapping Approach: The Potential of Sentinel-2. Remote Sens. 2019, 11, 1506. [Google Scholar] [CrossRef]
  7. Fu, B.; Burgher, I. Riparian Vegetation NDVI Dynamics and Its Relationship with Climate, Surface Water and Groundwater. J. Arid Environ. 2015, 113, 59–68. [Google Scholar] [CrossRef]
  8. Shalaby, A.; Tateishi, R. Remote Sensing and GIS for Mapping and Monitoring Land Cover and Land-Use Changes in the Northwestern Coastal Zone of Egypt. Appl. Geogr. 2007, 27, 28–41. [Google Scholar] [CrossRef]
  9. Jackson, D.; Costas, S.; González-Villanueva, R.; Cooper, A. A Global ‘Greening’ of Coastal Dunes: An Integrated Consequence of Climate Change? Glob. Planet. Change 2019, 182, 103026. [Google Scholar] [CrossRef]
  10. Peng, J.; Dong, W.; Yuan, W.; Zhang, Y. Responses of Grassland and Forest to Temperature and Precipitation Changes in Northeast China. Adv. Atmos. Sci. 2012, 29, 1063–1077. [Google Scholar] [CrossRef]
  11. Groeneveld, D.P. Remotely-Sensed Groundwater Evapotranspiration from Alkali Scrub Affected by Declining Water Table. J. Hydrol. 2008, 358, 294–303. [Google Scholar] [CrossRef]
  12. Dabrowska-Zielinska, K.; Kogan, F.; Ciolkosz, A.; Gruszczynska, M.; Kowalik, W. Modelling of Crop Growth Conditions and Crop Yield in Poland Using AVHRR-Based Indices. Int. J. Remote Sens. 2002, 23, 1109–1123. [Google Scholar] [CrossRef]
  13. Aguilar, C.; Zinnert, J.C.; Polo, M.J.; Young, D.R. NDVI as an Indicator for Changes in Water Availability to Woody Vegetation. Ecol. Indic. 2012, 23, 290–300. [Google Scholar] [CrossRef]
  14. Šimanauskienė, R.; Linkevičienė, R.; Bartold, M.; Dąbrowska-Zielińska, K.; Slavinskienė, G.; Veteikis, D.; Taminskas, J. Peatland Degradation: The Relationship between Raised Bog Hydrology and Normalized Difference Vegetation Index. Ecohydrology 2019, 12, e2159. [Google Scholar] [CrossRef]
  15. Páscoa, P.; Gouveia, C.M.; Kurz-Besson, C. A Simple Method to Identify Potential Groundwater-Dependent Vegetation Using NDVI MODIS. Forests 2020, 11, 147. [Google Scholar] [CrossRef]
  16. Caldara, M.; Capolongo, D.; Damato, B.; Pennetta, L. Can the Ground Laser Scanning Technology Be Useful for Coastal Defenses Monitoring? Ital. J. Eng. Geol. Environ. 2006, 1, 35–49. [Google Scholar]
  17. Boeder, V.; Kersten, T.; Hesse, C.; Thies, T.; Sauer, A. Initial Experience with the Integration of a Terrestrial Laser Scanner into the Mobile Hydrographic Multi Sensor System on a Ship. In Proceedings of the ISPRS Istanbul Workshop 2010 on Modeling of Optical Airborne and Spaceborne Sensors, Istanbul, Turkey, 11–13 October 2010; Volume 38. [Google Scholar]
  18. Lapietra, I.; Lisco, S.; Mastronuzzi, G.; Milli, S.; Pierri, C.; Sabatier, F.; Scardino, G.; Moretti, M. Morpho-Sedimentary Dynamics of Torre Guaceto Beach (Southern Adriatic Sea, Italy). J. Earth Syst. Sci. 2022, 131, 64. [Google Scholar] [CrossRef]
  19. Lapietra, I.; Lisco, S.; Capozzoli, L.; De Giosa, F.; Mastronuzzi, G.; Mele, D.; Milli, S.; Romano, G.; Sabatier, F.; Scardino, G.; et al. A Potential Beach Monitoring Based on Integrated Methods. J. Mar. Sci. Eng. 2022, 10, 1949. [Google Scholar] [CrossRef]
  20. O’Dea, A.; Brodie, K.L.; Hartzell, P. Continuous Coastal Monitoring with an Automated Terrestrial Lidar Scanner. J. Mar. Sci. Eng. 2019, 7, 37. [Google Scholar] [CrossRef]
  21. Fabris, M. Monitoring the Coastal Changes of the Po River Delta (Northern Italy) since 1911 Using Archival Cartography, Multi-Temporal Aerial Photogrammetry and LiDAR Data: Implications for Coastline Changes in 2100 A.D. Remote Sens. 2021, 13, 529. [Google Scholar] [CrossRef]
  22. Frati, G.; Launeau, P.; Robin, M.; Giraud, M.; Juigner, M.; Debaine, F.; Michon, C. Coastal Sand Dunes Monitoring by Low Vegetation Cover Classification and Digital Elevation Model Improvement Using Synchronized Hyperspectral and Full-Waveform LiDAR Remote Sensing. Remote Sens. 2021, 13, 29. [Google Scholar] [CrossRef]
  23. Arshad, B.; Barthelemy, J.; Perez, P. Autonomous Lidar-Based Monitoring of Coastal Lagoon Entrances. Remote Sens. 2021, 13, 1320. [Google Scholar] [CrossRef]
  24. Schmidt, A.; Rottensteiner, F.; Soergel, U. Monitoring Concepts for Coastal Areas Using Lidar Data. ISPRS Int. Arch. Photogramm. Remote Sens. Spat. Inf. Sci. 2013, XL-1/W1, 311–316. [Google Scholar] [CrossRef]
  25. Tropeano, M.; Cilumbriello, A.; Sabato, L.; Gallicchio, S.; Grippa, A.; Longhitano, S.G.; Bianca, M.; Gallipoli, M.R.; Mucciarelli, M.; Spilotro, G. Surface and Subsurface of the Metaponto Coastal Plain (Gulf of Taranto—Southern Italy): Present-Day- vs LGM-Landscape. Geomorphology 2013, 203, 115–131. [Google Scholar] [CrossRef]
  26. Scardino, G.; Sabatier, F.; Scicchitano, G.; Piscitelli, A.; Milella, M.; Vecchio, A.; Anzidei, M.; Mastronuzzi, G. Sea-Level Rise and Shoreline Changes Along an Open Sandy Coast: Case Study of Gulf of Taranto, Italy. Water 2020, 12, 1414. [Google Scholar] [CrossRef]
  27. Cilumbriello, A.; Sabato, L.; Tropeano, M.; Gallicchio, S.; Grippa, A.; Maiorano, P.; Mateu-Vicens, G.; Rossi, C.A.; Spilotro, G.; Calcagnile, L.; et al. Sedimentology, Stratigraphic Architecture and Preliminary Hydrostratigraphy of the Metaponto Coastal-Plain Subsurface (Southern Italy). Mem. Descr. Carta Geol. d’It 2010, XC, 67–84. [Google Scholar]
  28. Sabato, L.; Longhitano, S.G.; Gioia, D.; Cilumbriello, A.; Spalluto, L. Sedimentological and Morpho-Evolution Maps of the ‘Bosco Pantano Di Policoro’ Coastal System (Gulf of Taranto, Southern Italy). J. Maps 2012, 8, 304–311. [Google Scholar] [CrossRef]
  29. Bonora, N.; Immordino, F.; Schiavi, C.; Simeoni, U.; Valpreda, E. Interaction between Catchment Basin Management and Coastal Evolution (Southern Italy). J. Coast. Res. 2002, 36, 81–88. [Google Scholar] [CrossRef]
  30. Longhitano, S.G. Short-Term Assessment of Retreating vs. Advancing Microtidal Beaches Based on the Backshore/Foreshore Length Ratio: Examples from the Basilicata Coasts (Southern Italy). Open J. Mar. Sci. 2015, 5, 123–145. [Google Scholar] [CrossRef]
  31. Caldara, M.; Centenaro, E.; Mastronuzzi, G.; Sansò, P.; Sergio, A. Features and Present Evolution of Apulian Coast (Southern Italy). J. Coast. Res. 1998, SI, 55–64. [Google Scholar]
  32. Rizzo, A.; De Giosa, F.; Di Leo, A.; Lisco, S.; Moretti, M.; Scardino, G.; Scicchitano, G.; Mastronuzzi, G. Geo-Environmental Characterisation of High Contaminated Coastal Sites: The Analysis of Past Experiences in Taranto (Southern Italy) as a Key for Defining Operational Guidelines. Land 2022, 11, 878. [Google Scholar] [CrossRef]
  33. Hesp, P.A. Ecological Processes and Plant Adaptations on Coastal Dunes. J. Arid Environ. 1991, 21, 165–191. [Google Scholar] [CrossRef]
  34. Hesp, P. Foredunes and Blowouts: Initiation, Geomorphology and Dynamics. Geomorphology 2002, 48, 245–268. [Google Scholar] [CrossRef]
  35. Hesp, P.; Martinez, M.; da Silva, G.M.; Rodríguez-Revelo, N.; Gutierrez, E.; Humanes, A.; Laínez, D.; Montaño, I.; Palacios, V.; Quesada, A.; et al. Transgressive Dunefield Landforms and Vegetation Associations, Doña Juana, Veracruz, Mexico. Earth Surf. Process. Landf. 2011, 36, 285–295. [Google Scholar] [CrossRef]
  36. Biondi, E.; Guerra, V. Vegetazione e Paesaggio Vegetale Delle Gravine Dell’arco Jonico. Fitosociologia 2008, 45, 57–125. [Google Scholar]
  37. Romano, G.; Ricci, G.F.; Leronni, V.; Venerito, P.; Gentile, F. Soil Bioengineering Techniques for Mediterranean Coastal Dune Restoration Using Autochthonous Vegetation Species. J. Coast. Conserv. 2022, 26, 71. [Google Scholar] [CrossRef]
  38. Huiskes, A.H.L. Ammophila arenaria (L.) Link (Psamma arenaria (L.) Roem. et Schult.; Calamgrostis arenaria (L.) Roth). J. Ecol. 1979, 67, 363–382. [Google Scholar] [CrossRef]
  39. Cuesta, B.; Vega, J.; Villar-Salvador, P.; Rey-Benayas, J.M. Root Growth Dynamics of Aleppo Pine (Pinus halepensis Mill.) Seedlings in Relation to Shoot Elongation, Plant Size and Tissue Nitrogen Concentration. Trees 2010, 24, 899–908. [Google Scholar] [CrossRef]
  40. Yuan, J.; Niu, Z. Evaluation of Atmospheric Correction Using FLAASH. In Proceedings of the 2008 International Workshop on Earth Observation and Remote Sensing Applications, Beijing, China, 30 June–2 July 2008; pp. 1–6. [Google Scholar]
  41. Congedo, L. Semi-Automatic Classification Plugin: A Python Tool for the Download and Processing of Remote Sensing Images in QGIS. J. Open Source Softw. 2021, 6, 3172. [Google Scholar] [CrossRef]
  42. Gamon, J.A.; Field, C.B.; Goulden, M.L.; Griffin, K.L.; Hartley, A.E.; Joel, G.; Peñuelas, J.; Valentini, R. Relationships Between NDVI, Canopy Structure, and Photosynthesis in Three Californian Vegetation Types. Ecol. Appl. 1995, 5, 28–41. [Google Scholar] [CrossRef]
  43. Nejad, M.F.; Zoratipour, A. Assessment of LST and NDMI Indices Using MODIS and Landsat Images in Karun Riparian Forest. J. For. Sci. 2019, 65, 27–32. [Google Scholar] [CrossRef]
  44. Mihai, B.; Horoias, R. NDMI use in recognition of water stress issues, related to winter wheat yields in Southern Romania. Sci. Pap. Ser. Manag. Econ. Eng. Agric. Rural. Dev. 2022, 22, 105–112. [Google Scholar]
  45. Strashok, O.; Ziemiańska, M.; Strashok, V. Evaluation and Correlation of Normalized Vegetation Index and Moisture Index in Kyiv (2017–2021). J. Ecol. Eng. 2022, 23, 212–218. [Google Scholar] [CrossRef] [PubMed]
  46. Serpelloni, E.; Casula, G.; Galvani, A.; Anzidei, M.; Baldi, P. Data Analysis of Permanent GPS Networks in Italy and Surrounding Region: Application of a Distributed Processing Approach. Ann. Geophys. 2006, 49, 897–928. [Google Scholar] [CrossRef]
  47. Serpelloni, E.; Faccenna, C.; Spada, G.; Dong, D.; Williams, S.D.P. Vertical GPS Ground Motion Rates in the Euro-Mediterranean Region: New Evidence of Velocity Gradients at Different Spatial Scales along the Nubia-Eurasia Plate Boundary. J. Geophys. Res. Solid Earth 2013, 118, 6003–6024. [Google Scholar] [CrossRef]
  48. Romano, G.; Capozzoli, L.; Abate, N.; De Girolamo, M.; Liso, I.S.; Patella, D.; Parise, M. An Integrated Geophysical and Unmanned Aerial Systems Surveys for Multi-Sensory, Multi-Scale and Multi-Resolution Cave Detection: The Gravaglione Site (Canale Di Pirro Polje, Apulia). Remote Sens. 2023, 15, 3820. [Google Scholar] [CrossRef]
  49. Muzzillo, R.; Zuffianò, L.E.; Rizzo, E.; Canora, F.; Capozzoli, L.; Giampaolo, V.; De Giorgio, G.; Sdao, F.; Polemio, M. Seawater Intrusion Proneness and Geophysical Investigations in the Metaponto Coastal Plain (Basilicata, Italy). Water 2021, 13, 53. [Google Scholar] [CrossRef]
  50. Niculescu, B.M.; Andrei, G. Application of Electrical Resistivity Tomography for Imaging Seawater Intrusion in a Coastal Aquifer. Acta Geophys. 2021, 69, 613–630. [Google Scholar] [CrossRef]
  51. Kazakis, N.; Pavlou, A.; Vargemezis, G.; Voudouris, K.S.; Soulios, G.; Pliakas, F.; Tsokas, G. Seawater Intrusion Mapping Using Electrical Resistivity Tomography and Hydrochemical Data. An Application in the Coastal Area of Eastern Thermaikos Gulf, Greece. Sci. Total Environ. 2016, 543, 373–387. [Google Scholar] [CrossRef]
  52. Dahlin, T.; Zhou, B. A Numerical Comparison of 2D Resistivity Imaging with 10 Electrode Arrays. Geophys. Prospect. 2004, 52, 379–398. [Google Scholar] [CrossRef]
  53. Loke, M.H.; Barker, R.D. Rapid Least-Squares Inversion of Apparent Resistivity Pseudosections by a Quasi-Newton Method. Geophys. Prospect. 1996, 44, 131–152. [Google Scholar] [CrossRef]
  54. Nordstrom, K.F.; Hartman, J.; Freestone, A.L.; Wong, M.; Jackson, N.L. Changes in Topography and Vegetation near Gaps in a Protective Foredune. Ocean Coast. Manag. 2007, 50, 945–959. [Google Scholar] [CrossRef]
  55. Taminskas, J.; Šimanauskienė, R.; Linkevičienė, R.; Volungevičius, J.; Slavinskienė, G.; Povilanskas, R.; Satkūnas, J. Impact of Hydro-Climatic Changes on Coastal Dunes Landscape According to Normalized Difference Vegetation Index (the Case Study of Curonian Spit). Water 2020, 12, 3234. [Google Scholar] [CrossRef]
  56. Sigren, J.; Figlus, J.; Armitage, A. Coastal Sand Dunes and Dune Vegetation: Restoration, Erosion, and Storm Protection. Shore Beach 2014, 82, 5–12. [Google Scholar]
  57. Bouma, T.J.; De Vries, M.B.; Low, E.; Peralta, G.; Tánczos, I.C.; van de Koppel, J.; Herman, P.M.J. Trade-Offs Related to Ecosystem Engineering: A Case Study on Stiffness of Emerging Macrophytes. Ecology 2005, 86, 2187–2199. [Google Scholar] [CrossRef]
  58. Augustin, L.N.; Irish, J.L.; Lynett, P. Laboratory and Numerical Studies of Wave Damping by Emergent and Near-Emergent Wetland Vegetation. Coast. Eng. 2009, 56, 332–340. [Google Scholar] [CrossRef]
  59. Miller, R.M.; Jastrow, J.D. Hierarchy of Root and Mycorrhizal Fungal Interactions with Soil Aggregation. Soil Biol. Biochem. 1990, 22, 579–584. [Google Scholar] [CrossRef]
  60. De Baets, S.; Poesen, J.; Reubens, B.; Wemans, K.; De Baerdemaeker, J.; Muys, B. Root Tensile Strength and Root Distribution of Typical Mediterranean Plant Species and Their Contribution to Soil Shear Strength. Plant Soil 2008, 305, 207–226. [Google Scholar] [CrossRef]
  61. Westman, W.E. Resilience: Concepts and Measures. In Resilience in Mediterranean-Type Ecosystems; Dell, B., Hopkins, A.J.M., Lamont, B.B., Eds.; Tasks for Vegetation Science; Springer: Dordrecht, The Netherlands, 1986; pp. 5–19. ISBN 978-94-009-4822-8. [Google Scholar]
  62. Suo, C.; McGovern, E.; Gilmer, A. Coastal Dune Vegetation Mapping Using a Multispectral Sensor Mounted on an UAS. Remote Sens. 2019, 11, 1814. [Google Scholar] [CrossRef]
  63. Alessio, G.A.; De Lillis, M.; Brugnoli, E.; Lauteri, M. Water Sources and Water-Use Efficiency in Mediterranean Coastal Dune Vegetation. Plant Biol. 2004, 6, 350–357. [Google Scholar] [CrossRef]
  64. Abd El-Dayem, M.; Abd El-Gawad, A.; Bedair, S.; Farag, K.S.I. Groundwater Resource Evaluation Using Geoelectrical Resistivity Survey in the Ghard El-Hunishat Area of New Delta Project Province, North Western Desert, Egypt. Groundw. Sustain. Dev. 2023, 21, 100918. [Google Scholar] [CrossRef]
  65. Alexopoulos, J.; Dilalos, S.; Poulos, S.; Ghionis, G.; Mavroulis, S. Application of Geoelectrical Techniques in the Investigation of a Coastal Sand Dune Field; European Association of Geoscientists & Engineers: Utrecht, The Netherlands, 2014. [Google Scholar]
  66. Frohlich, R.K.; Urish, D.W.; Fuller, J.; O’Reilly, M. Use of Geoelectrical Methods in Groundwater Pollution Surveys in a Coastal Environment. J. Appl. Geophys. 1994, 32, 139–154. [Google Scholar] [CrossRef]
  67. Urish, D.W.; Frohlich, R.K. Surface Electrical Resistivity in Coastal Groundwater Exploration. Geoexploration 1990, 26, 267–289. [Google Scholar] [CrossRef]
  68. Medina Machín, A.; Marcello, J.; Hernández-Cordero, A.I.; Martín Abasolo, J.; Eugenio, F. Vegetation Species Mapping in a Coastal-Dune Ecosystem Using High Resolution Satellite Imagery. GIScience Remote Sens. 2019, 56, 210–232. [Google Scholar] [CrossRef]
  69. Murphy, J.T.; Owensby, C.E.; Ham, J.; Coyne, P. Estimation of Vegetative Characteristics by Remote Sensing. Acad. Res. J. Agric. Sci. Res. 2014, 2, 34–46. [Google Scholar] [CrossRef]
  70. Silva, F.G.; Wijnberg, K.M.; de Groot, A.V.; Hulscher, S.J.M.H. The Influence of Groundwater Depth on Coastal Dune Development at Sand Flats Close to Inlets. Ocean Dyn. 2018, 68, 885–897. [Google Scholar] [CrossRef]
  71. Lammerts, E.J.; Maas, C.; Grootjans, A.P. Groundwater Variables and Vegetation in Dune Slacks. Ecol. Eng. 2001, 17, 33–47. [Google Scholar] [CrossRef]
  72. Van Bodegom, P.M.; Oosthoek, A.; Broekman, R.; Bakker, C.; Aerts, R. Raising Groundwater Differentially Affects Mineralization and Plant Species Abundance in Dune Slacks. Ecol. Appl. 2006, 16, 1785–1795. [Google Scholar] [CrossRef] [PubMed]
  73. Zarnetske, P.L.; Ruggiero, P.; Seabloom, E.W.; Hacker, S.D. Coastal Foredune Evolution: The Relative Influence of Vegetation and Sand Supply in the US Pacific Northwest. J. R. Soc. Interface 2015, 12, 20150017. [Google Scholar] [CrossRef]
  74. Lawlor, P.; Jackson, D.W.T. A Nature-Based Solution for Coastal Foredune Restoration: The Case Study of Maghery, County Donegal, Ireland. In Human-Nature Interactions: Exploring Nature’s Values Across Landscapes; Misiune, I., Depellegrin, D., Egarter Vigl, L., Eds.; Springer International Publishing: Cham, Switzerland, 2022; pp. 417–429. ISBN 978-3-031-01980-7. [Google Scholar]
  75. Scicchitano, G.; Scardino, G.; Monaco, C.; Piscitelli, A.; Milella, M.; De Giosa, F.; Mastronuzzi, G. Comparing Impact Effects of Common Storms and Medicanes along the Coast of South-Eastern Sicily. Mar. Geol. 2021, 439, 106556. [Google Scholar] [CrossRef]
  76. Scardino, G.; Scicchitano, G.; Chirivì, M.; Costa, P.J.M.; Luparelli, A.; Mastronuzzi, G. Convolutional Neural Network and Optical Flow for the Assessment of Wave and Tide Parameters from Video Analysis (LEUCOTEA): An Innovative Tool for Coastal Monitoring. Remote Sens. 2022, 14, 2994. [Google Scholar] [CrossRef]
  77. Scardino, G.; Anzidei, M.; Petio, P.; Serpelloni, E.; De Santis, V.; Rizzo, A.; Liso, S.I.; Zingaro, M.; Capolongo, D.; Vecchio, A.; et al. The Impact of Future Sea-Level Rise on Low-Lying Subsiding Coasts: A Case Study of Tavoliere Delle Puglie (Southern Italy). Remote Sens. 2022, 14, 4936. [Google Scholar] [CrossRef]
  78. Caturegli, L.; Casucci, M.; Lulli, F.; Grossi, N.; Gaetani, M.; Magni, S.; Bonari, E.; Volterrani, M. GeoEye-1 Satellite versus Ground-Based Multispectral Data for Estimating Nitrogen Status of Turfgrasses. Int. J. Remote Sens. 2015, 36, 2238–2251. [Google Scholar] [CrossRef]
  79. Caturegli, L.; Corniglia, M.; Gaetani, M.; Grossi, N.; Magni, S.; Migliazzi, M.; Angelini, L.; Mazzoncini, M.; Silvestri, N.; Fontanelli, M.; et al. Unmanned Aerial Vehicle to Estimate Nitrogen Status of Turfgrasses. PLoS ONE 2016, 11, e0158268. [Google Scholar] [CrossRef]
  80. Volterrani, M.; Minelli, A.; Gaetani, M.; Grossi, N.; Magni, S.; Caturegli, L. Reflectance, Absorbance and Transmittance Spectra of Bermudagrass and Manilagrass Turfgrass Canopies. PLoS ONE 2017, 12, e0188080. [Google Scholar] [CrossRef]
  81. Jin, S.; Sader, S.A. Comparison of Time Series Tasseled Cap Wetness and the Normalized Difference Moisture Index in Detecting Forest Disturbances. Remote Sens. Environ. 2005, 94, 364–372. [Google Scholar] [CrossRef]
Figure 1. The study area is located on the coastal plain of the Gulf of Taranto. (a) Orthophoto of the coastal plain as acquired from Google Satellite images taken in 2023. (b) Evidence of dune erosion on the sandy coast of Pino di Lenne. (c) Dry vegetation in the Chiatona coastal area. (d) Foredune erosion and naturally open areas on Lido Azzurro.
Remotesensing 15 04415 g001
Figure 2. Flowchart of the work process followed to assess the coastal changes and dune erosion in the areas affected by water stress.
Remotesensing 15 04415 g002
Figure 3. The spectral signatures of the dune vegetation in the study area: (a) sampling points used to assess the spectral signature of the dune vegetation; (b) spectral signature of the dune vegetation before the occurrence of coastal fires; (c) spectral signature of the dune vegetation after the occurrence of coastal fires; (d) restoration of vegetative health as highlighted by the changes in the spectral signature of the dune vegetation.
Remotesensing 15 04415 g003
Figure 4. Map of NDVI values as calculated from Sentinel-2 images along the Chiatona coast: (a) NDVI map extracted before the coastal fire; (b) NDVI map after the coastal fires; (c) NDVI values over time. There is a clear drop in NDVI values associated with the coastal fire event.
Remotesensing 15 04415 g004
Figure 5. Dune erosion as identified using TLS and LiDAR data: (a) dune scarps mapped along the Chiatona coast; (b) change in topographic profiles of the foredunes over time.
Remotesensing 15 04415 g005
Figure 6. Coastal and dune erosion as highlighted by the difference in DTMs from 2022 and 2023. The red pixels in the raster image highlight the areas most affected by the loss of sediment.
Remotesensing 15 04415 g006
Figure 7. ERT profile: (a) the trace of the ERT survey; (b) the ERT model obtained from the inversion of the WS dataset (final r.m.s. = 7.8%); (c) a possible simplified interpretation of the ERT model in terms of saltwater intrusion.
Remotesensing 15 04415 g007
Figure 8. A diagram describing the erosional features on the sandy coast of the Ionian Arc. Erosional processes are primarily expressed in the form of deflation basins and erosion on the dunes affected by water stress and dry vegetation.
Remotesensing 15 04415 g008
Figure 9. Coastal erosion and water stress in a vegetated dune system: (a) a steady-state mobile coastal system with low hydrodynamism; (b) dune erosion due to storm events and the limited contribution of dry vegetation to the shear strength of the dunes (red rectangles are referred to the areas affected by water stress on the vegetation); (c) dry vegetation on the tertiary and secondary dunes in Chiatona; (d) erosion of the primary dune scarp in Palagiano. Clear evidence of dry vegetation can also be observed.
Remotesensing 15 04415 g009
Figure 10. A comparison between an RGB orthomosaic and Landsat 8: (a) an orthomosaic image taken on June 2022; (b) Landsat 8 image taken on June 2022 with RGB channels highlighting the difference in spectral bands for the areas affected by coastal fires.
Remotesensing 15 04415 g010
Disclaimer/Publisher’s Note: The statements, opinions and data contained in all publications are solely those of the individual author(s) and contributor(s) and not of MDPI and/or the editor(s). MDPI and/or the editor(s) disclaim responsibility for any injury to people or property resulting from any ideas, methods, instructions or products referred to in the content.

