Communication

Performance of Wide Dynamic Photomultiplier Applied in a Low Blind Zone Lidar

1
School of Remote Sensing and Information Engineering, Wuhan University, Wuhan 430079, China
2
Wuhan Institute of Quantum Technology, Wuhan 430206, China
*
Author to whom correspondence should be addressed.
Remote Sens. 2023, 15(18), 4404; https://doi.org/10.3390/rs15184404
Submission received: 22 July 2023 / Revised: 23 August 2023 / Accepted: 6 September 2023 / Published: 7 September 2023

Abstract

:
Aerosol lidars play a vital role in the investigations of atmospheric pollution formation and meteorological processes. The intensity of lidar return signals in the near range changes much faster compared with the one in the far range, so extremely wide dynamic outputs from the photomultiplier tube (PMT) are needed to avoid saturation in the near range. Usually, to obtain the wide dynamic range, simultaneously, a transient digitizer (Licel) is applied to provide an analog detection chain for strong signals and a photon counting (PC) detection chain for weak signals. However, the near-range signals are still often saturated due to the very high aerosol loading. In this paper, we proposed to use a new PMT module with eight orders of magnitude for a low blind zone lidar, which can achieve both analog and PC separately. A comprehensive evaluation of this potential PMT, which could perform better in near-range detection, compared with the ordinary PMT was tested, but similar features are maintained in the far-range. The photon count rate and signal-to-noise ratio were tested for both the new PMT module and the ordinary PMT module. The results showed that the new PMT module is useful to extend the dynamic range of lidar detection.

1. Introduction

Aerosols can be raised up from the surface to the planetary boundary layer and free troposphere due to convection or turbulent flow within the planetary boundary layer. Such vertical transport mechanisms play a vital role in regional or global climate changes and meteorological processes, and in the meantime the near-surface aerosol can affect human life and health directly. Aerosol lidars are important tools to investigate the detailed transportation mechanisms of aerosols by providing high temporal and vertical spatial resolution profiles, such as aerosol backscatter coefficient, extinction coefficient, and other intensive optical properties [1,2,3]. However, lidar techniques suffered from the large dynamic range of the signals from near-surface to far-range [4], for instance, a six orders of magnitude decrease from 0–1 km and two orders of magnitude decrease from 1–10 km; so that the complete and effective aerosol profiles from near surface to free troposphere is very difficult to observe. The detectable dynamic range of the signals mainly depends on photomultiplier tubes (PMT), which are commonly used in the lidar system as a detector, and the dynamic range of the employed digitizers, but usually the dynamic range of the digitizer is satisfied for the lidar application [5,6]. The PMTs in a lidar system can be worked in two modes: one is the analog mode, and the other one is the photon counting (PC) mode [7]. Usually in the aerosol lidar systems (Mie–Rayleigh, polarization, and even N 2 Raman lidar systems), the analog mode is used for the strong backscattered lidar return signal in the lower atmosphere due to its large up limit for the higher intensity light. But it decreases as the square of the range, thus the PC mode becomes useful for the detection of far-range backscattered lidar return signals due to its higher precision and better signal-to-noise-ratio (SNR) for the weaker intensity light. The analog data and PC data can be merged to extend the dynamic range of the lidar signals so that a large detectable range of lidar measurement is obtained [8,9].
Most lidar systems employ the customized data acquisition system (Licel transient recorder (Licel GmbH, Germany, https://licel.com/, (accessed on 23 June 2023)) to output analog data and PC data simultaneously [6,10,11,12]. The dynamic range of the merged data was calculated to be about six orders of magnitude [13]. However, Mie–Rayleigh backscattering of atmospheric molecular and aerosol together contributes over eight orders of magnitude variation range from near ground to the top of the troposphere in theory according to the calculation based on the U.S. Standard Atmosphere Model [14], therefore the demand of atmospheric observation within the troposphere covering from the surface to the top of the troposphere cannot be satisfied, especially in a high aerosol loading situation [15,16]. In order to meet the large dynamic requirement of atmospheric observation, several methods have already been attempted and discussed [17,18,19], which are to compress the dynamic range of the lidar signal to fit the PMTs. In this way, the saturation of near-range lidar return can be avoided, but the additional optics or electronic components could effect the accuracy of the lidar signals. The other approach is to use a self-developed dual-output photoelectric detection module to output analog and PC lidar signals simultaneously [20], which not only provides a more flexible and more cost-effective solution than the Licel transient recorder but also has the potential to obtain a larger dynamic range than other methods. Although only a simulated lidar signal was applied in this test, it still suffers from signal noise and linearity issues.
In this study, we present an approach of newly customized wide dynamic range PMT module (H13126-02) from Hamamatsu (Hamamatsu Photonics K.K., Janpan, https://www.hamamatsu.com.cn, (accessed on 1 October 2022)) in the application of aerosol lidar measurements, which aims to provide a solution for extending the dynamic range of the lidar signals using the simultaneous output of analog and PC signals from one PMT module directly. First, the linearity of newly PMT’s response was tested. Second, the performance of the lidar signal with newly PMT module was evaluated, including the evaluation of lidar signal-to-noise ratio and the signal dynamic range. Finally, a comparison was made between the application of ordinary PMT and the new PMT module.

2. Experimental Design and Methods

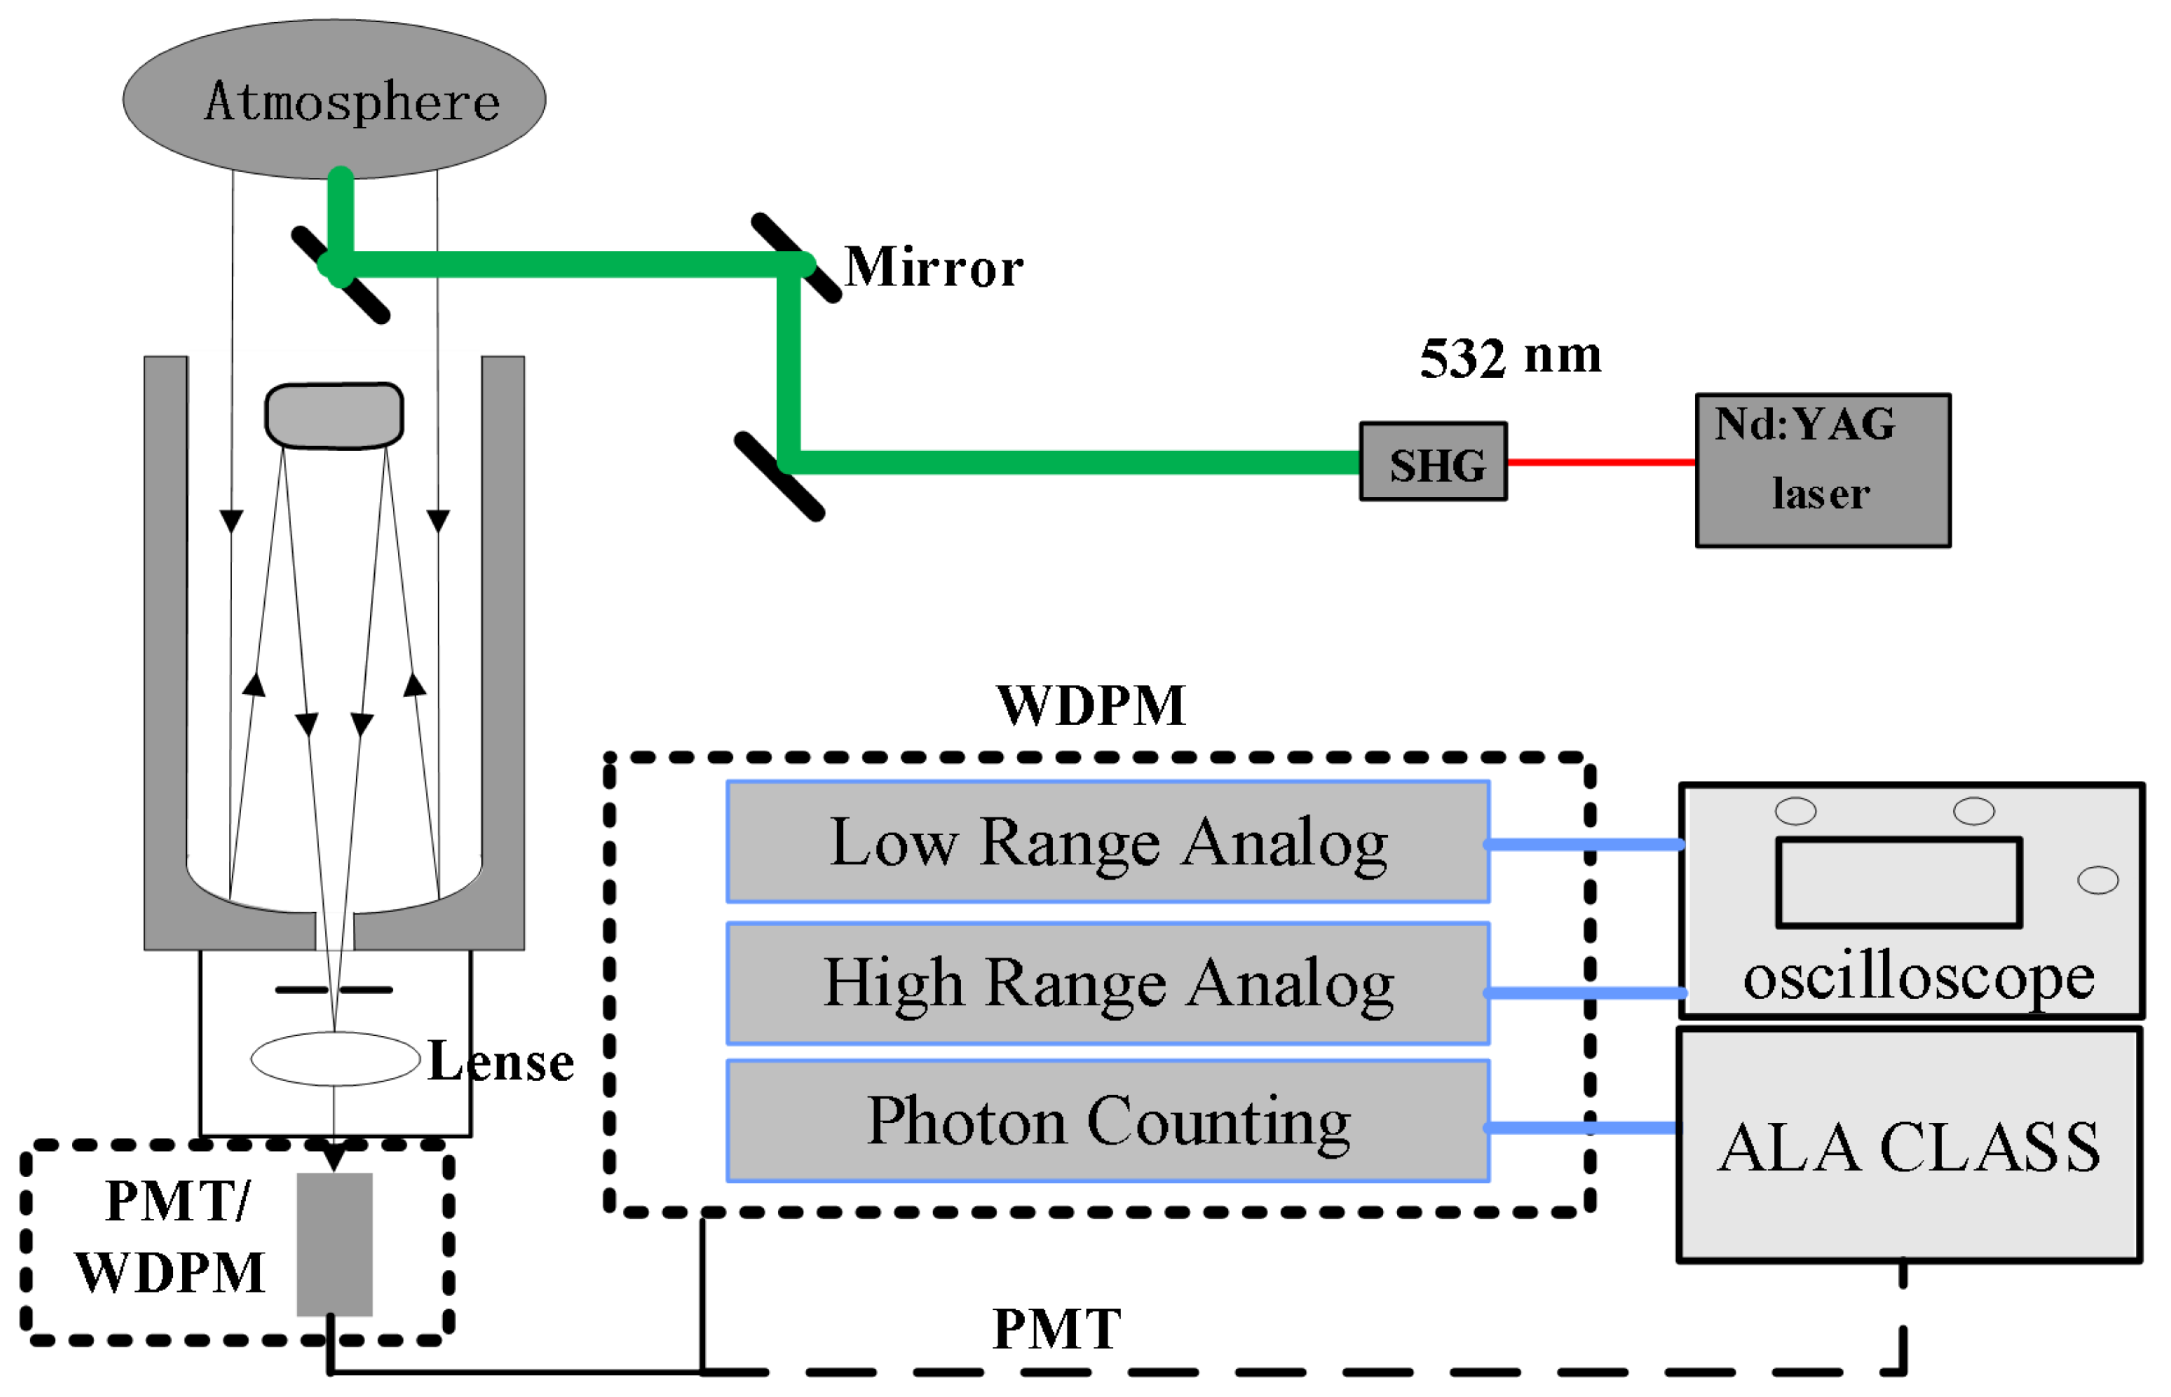
2.1. Experimental Design
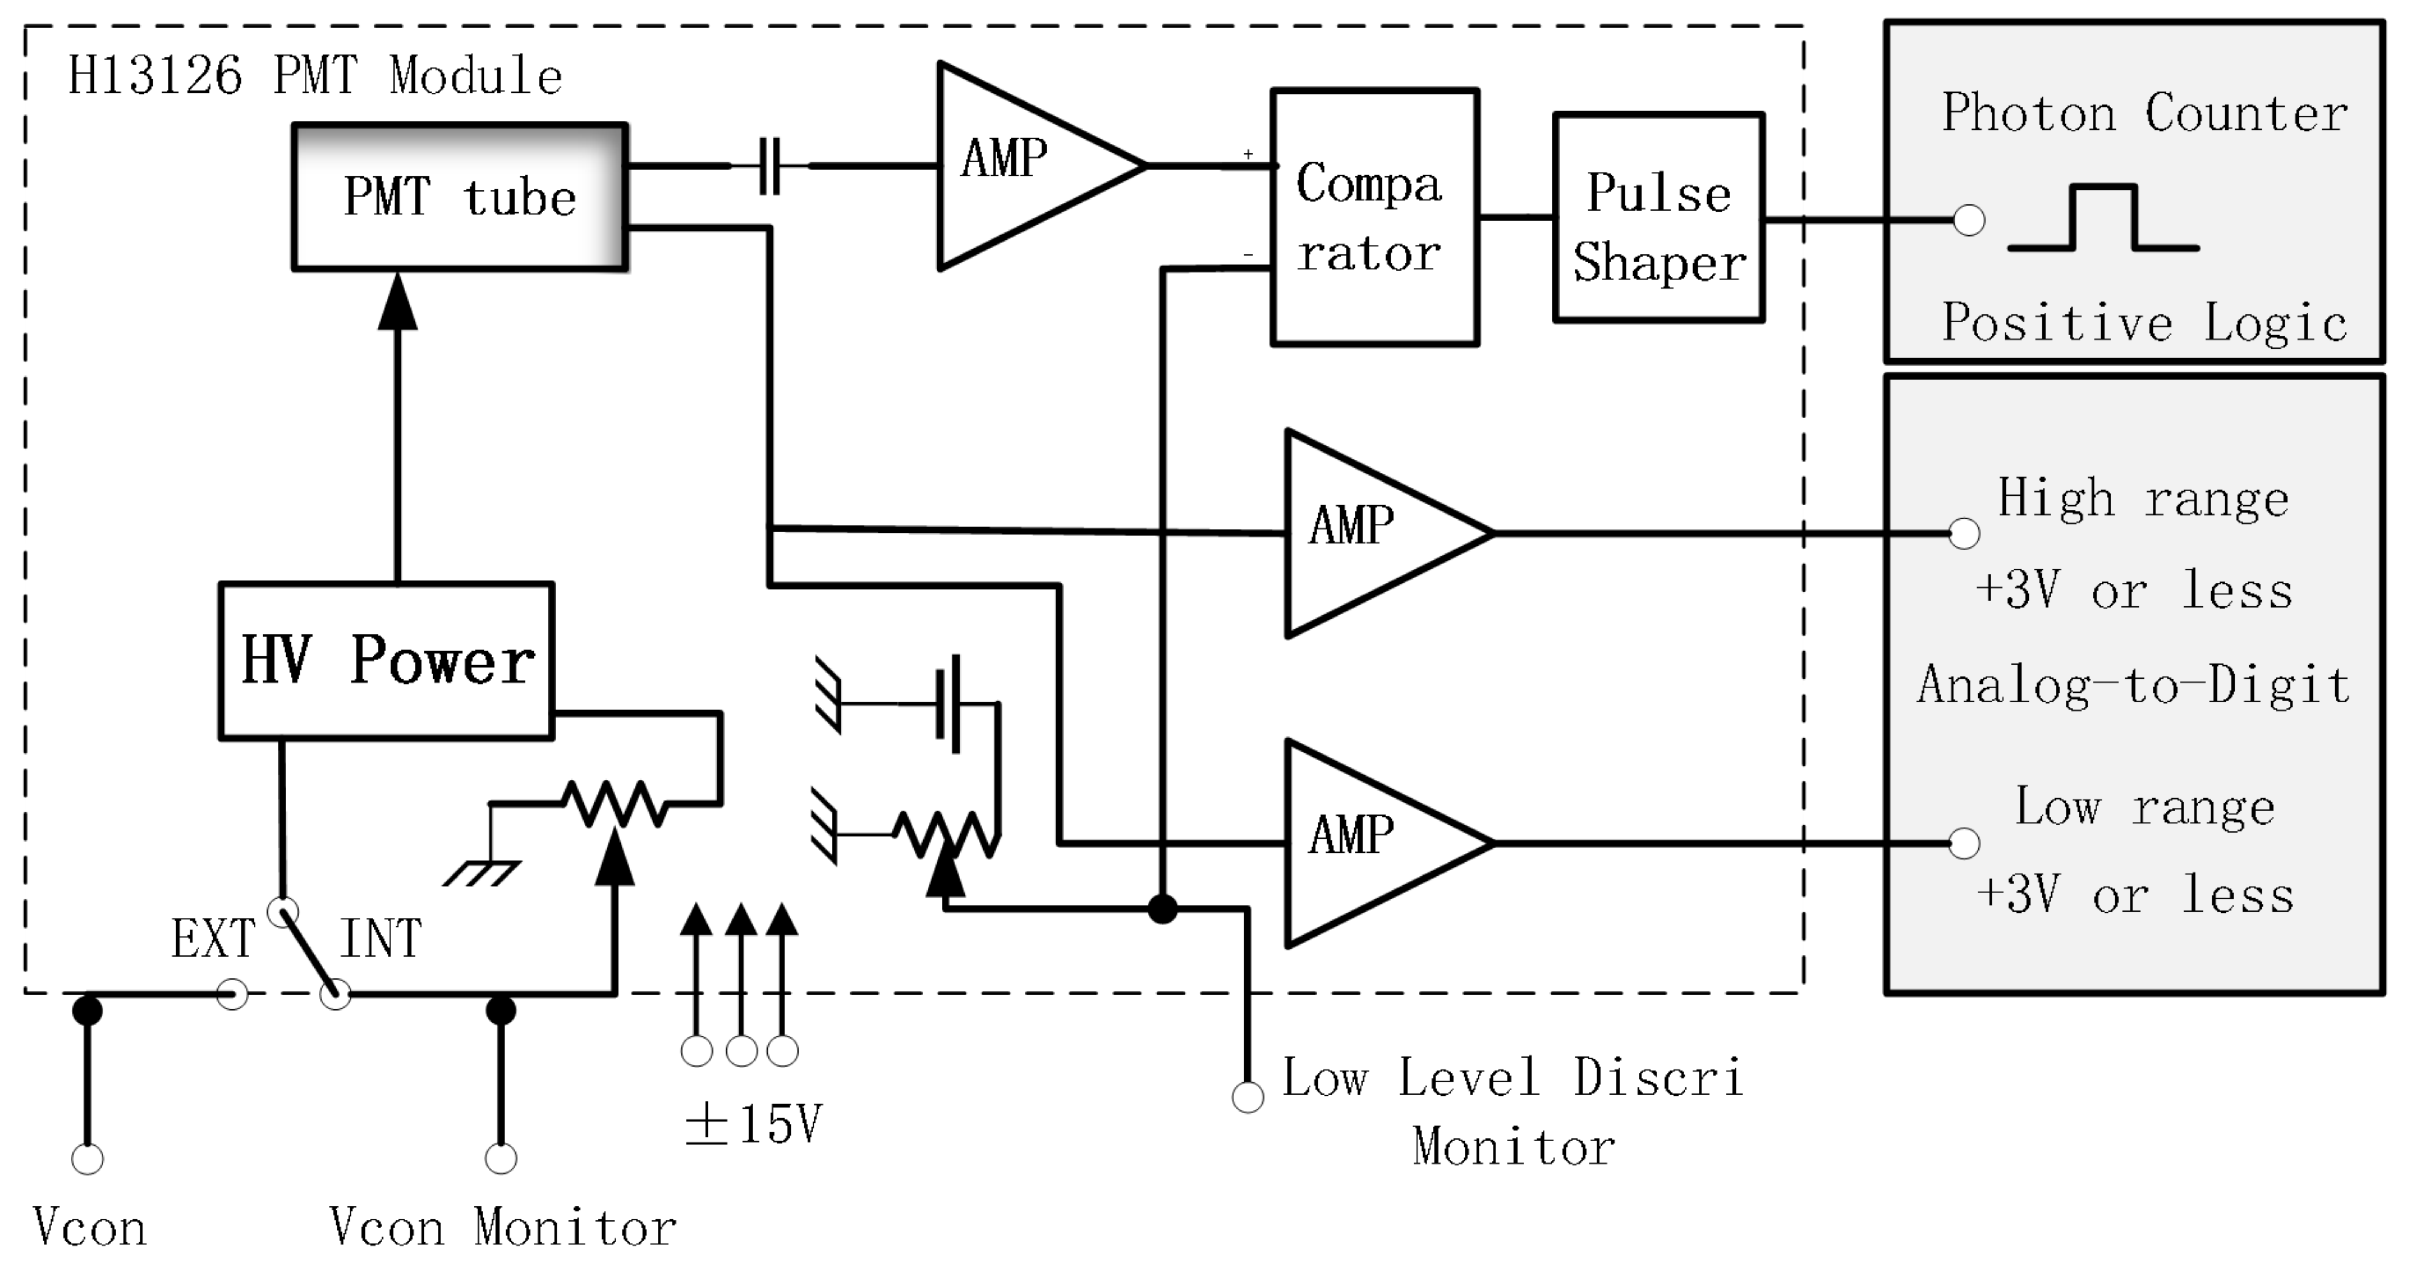
The new wide dynamic PMT module (WDPM) is used in an aerosol lidar system, which is from Hamamatsu photonics. The WDPM is divided into three channels, which are high dynamic range analog, low dynamic range analog and PC channels (Figure 1). In order to measure the performance of the dual-output photoelectric detection modes, a testing lidar system was developed. In the meanwhile, an ordinary PMT (H7421), which was commonly used for aerosol lidar at 532 nm, was used for comparison with the WDPM detector. This system consists of a laser at 532.2 nm, a telescope with a diameter of 150 mm, an alterable detector, and the data acquisition systems (PC and analog). The small F-number telescope with optimal diameter is specially made in order to obtain a very low blind zone [21]. With a coaxial design, the incomplete overlap range of the lidar system is as small as 100 m. The main system components are listed in Table 1. A schematic view of the lidar system, which is set up at Wuhan University, is shown in Figure 2. In this design, the detector is a replaceable unit. When the ordinary PMT is mounted, only a single PC channel of ALA CLASS is employed. When the WDPM is mounted, all analog and PC channels are employed.
This experiment was carried out on the campus of Wuhan University (30.32 N, 114.21 E) on 29 December 2021 during the night time. In order to compare the performance of ordinary PMT and WDPM, these two PMT modules were switched manually after every 2 min of data collection. There were 5 groups of 2 min data samplings obtained in the whole experiment for each of the two PMT modules. There is an about 10 min time interval between the lidar data detected by two different PMT modules. Therefore, the time-series signals cannot be compared between these two PMT modules because of the temporal evolution of the atmosphere simultaneously. However, the weather was calm with a wind speed less than 3 m/s and cloudless, thus the lidar signals are assumed to be comparable within this 10 min gap.

2.2. Dynamic Range

Each raw lidar signal is averaged by 2 min of sampling, and the SNR is also evaluated using the method described by [22]. For a raw lidar signal, the analog data correctly depict the real lidar signal intensity in the near range, while the photon count data exactly reflect the real lidar signal intensity at the far range. In order to combine the two types of datasets, the voltage value from the analog signal needs to be converted into a photon count rate. After subtraction of the background noise of two analog data, two voltage values follow linear correlation, thus the low-range analog data are merged into high-range analog data by multiplying a slope value. And also after the dead-time correction of PC data, the voltage value and photon count rate types of datasets should have the following relation [13]:
s = C V ,
where C is the photon count rate, V the voltage value of the analog signal, and s is the slope coefficient. Once the slope is obtained, a dataset of voltage value can be formed into photon count rate at a lower range by multiplying the corresponding analog data by the slope value. After gluing the lower range photon count rate data with the original photon count rate data at higher range, a completely range-covered lidar signal profile is yielded, and its dynamic range of the resulting data can be expressed as
D = s V m a x C m i n ,
where V m a x is the maximum voltage in the analog data; C m i n = 1 / t m is the lower limits of the linear range of the photon count rate; where t is the bin width of the photon count data, and m is the number of accumulated laser pulses. Thus, it can be written as
D = s V m a x t m ,
The testing lidar system at Wuhan University utilizes the ALA CLASS as its data acquisition system, with parameters t being 100 ns, resolution of being 12 bit, and V m a x being 3 V. The number of accumulated pulses m is 300 k.

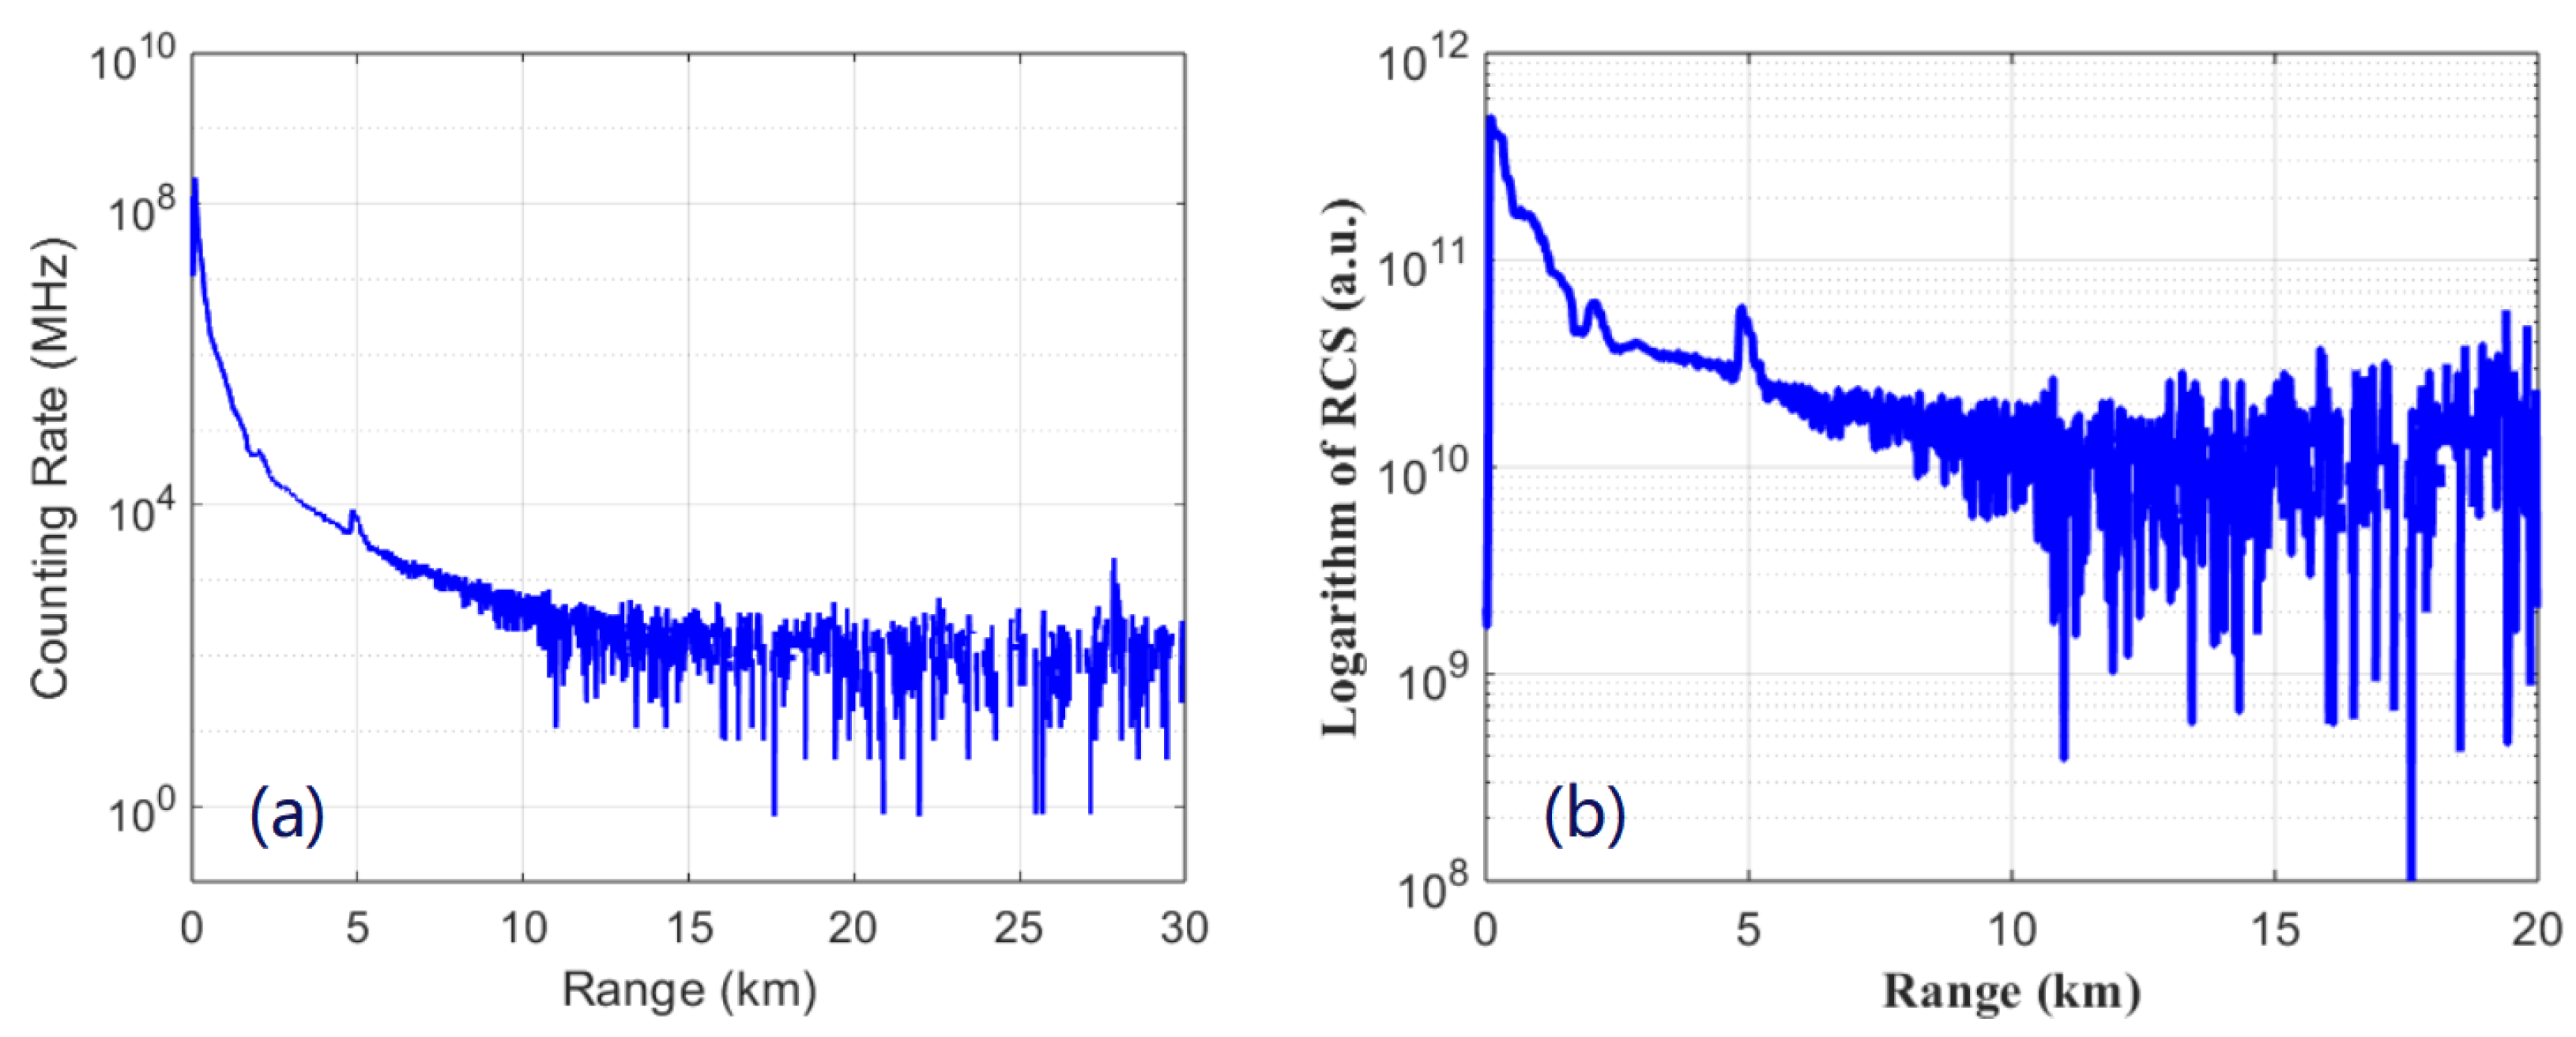
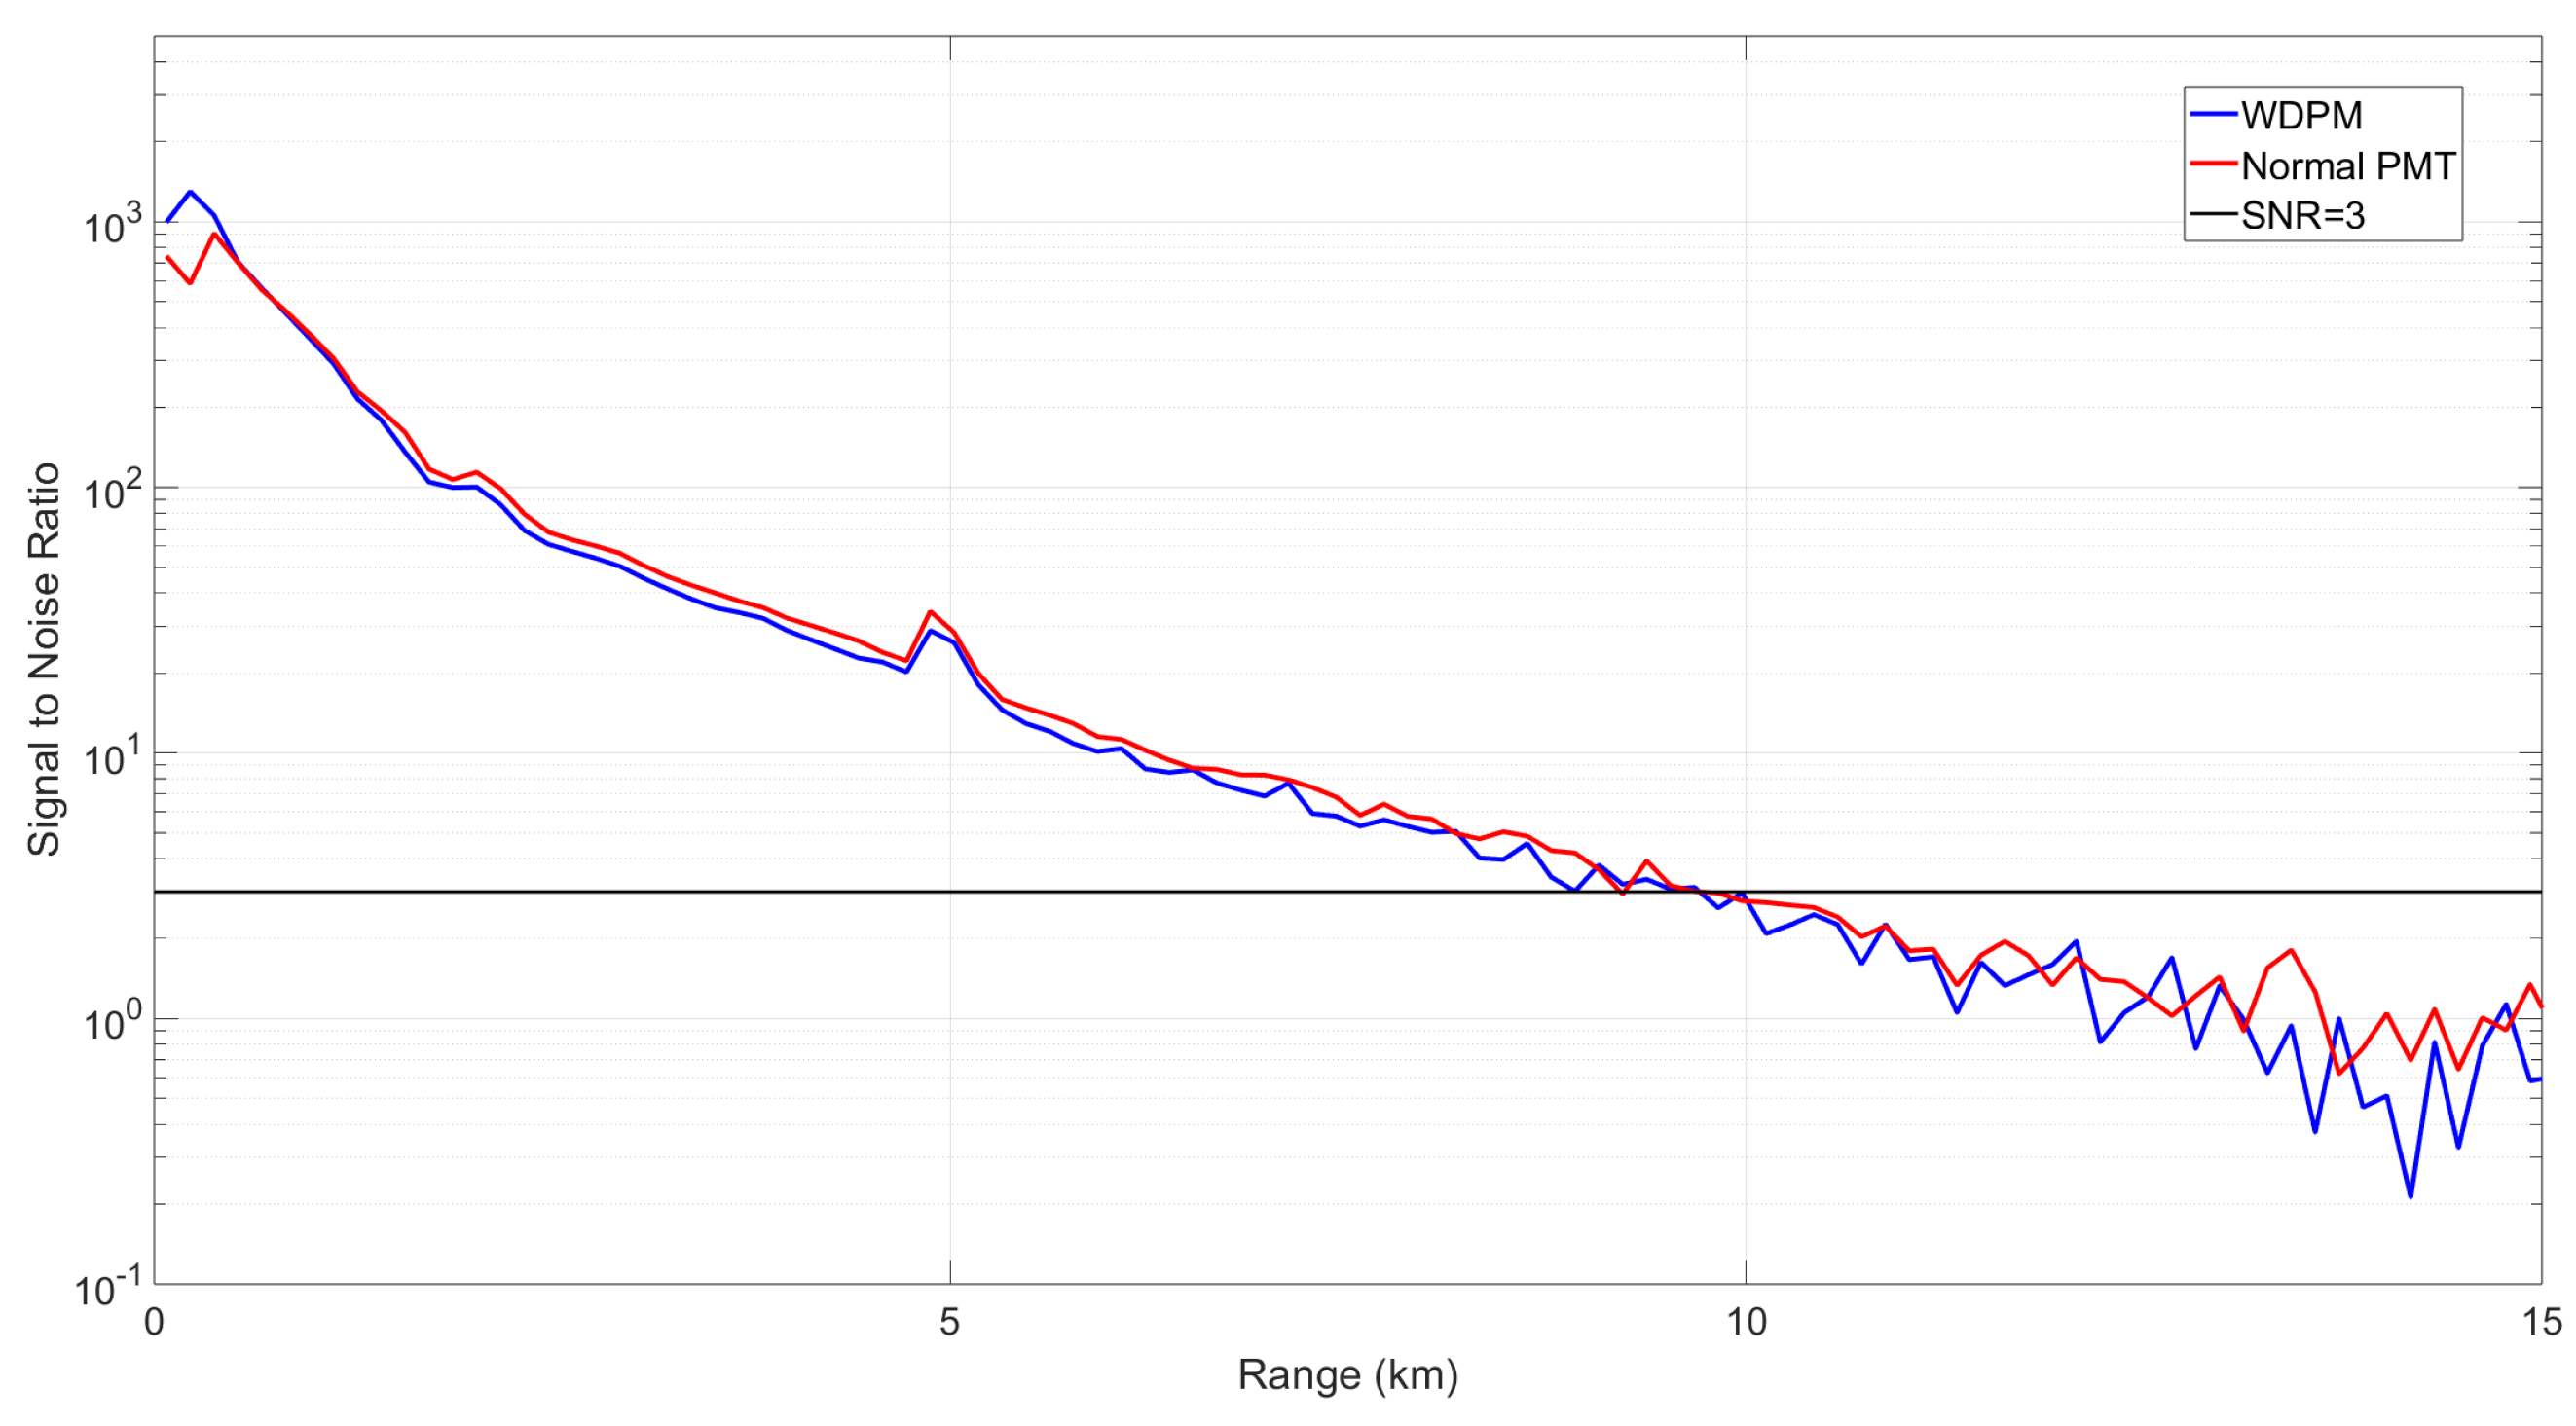
3. Results and Discussion

For two-minute data sampling, the backscattered lidar signals were collected by the WDPM, which are divided into one PC channel and two analog channels (Figure 3). Obviously, the PC signal is saturated below about 500 m in the near range. Although the analog signal in the low dynamic range channel showed better performance in the near range detection (below 200 m), it is still saturated to compare with the analog signal in the high dynamic range channel. On the other hand, the signal-to-noise ratio is enhanced in the order of PC, analog low and high dynamic channel, thus the combination of these signals in three channels is needed in order to enhance the lidar detection ability in both near and far range.
To glue the signals from three channels together, first analog data from the high-range channel are scaled to fit into the analog data from the low-range channel, so that new analog data are obtained by combining both analog chains. The new analog data are again scaled to fit into the dead-time corrected PC data, thus a full-range of covered lidar data is converted with a counting rate. The data dynamic range is calculated to be of five orders of magnitude in the PC chain. Figure 4a shows an example of the lidar data profile after the combination of three channels. After combining the two types of data sets, the data dynamic range is about eight orders of magnitude, which is close to the theoretically calculated result by substituting the parameters into Equation (3). Also, the validated detection range covers 0.1 km up to over 10 km (Figure 4b) To compare with Licel, WDPM integrate the amplifier circuits into a compact module directly, thus the dynamic range depends on the detector itself. Licel is a commercial data acquisition system for lidar applications, which provides one analog detection and one PC detection mode, thus the dynamic range also depends on the employed PMT. WDPM is a detector with two analog and one PC detection modes, thus an additional data acquisition system is still required for such an application. However, the application of WDPM costs less than Licel application, and it provides even larger dynamic range detection (eight orders of magnitude) than Licel (six orders of magnitude, the theoretical calculation taken by [13]) in a short data-sampling period (2 min) for reality application.
To show the performance of WDPM detection, two signals from WDPM and ordinary PMT detections are selected for comparison, which took place at 21:12 and 21:22 CST on 29 December 2021, respectively (Figure 5). The range-corrected lidar signals could represent the vertical distribution of aerosol and molecular concentration in the atmosphere. As the results show in Figure 5a, two range-corrected lidar signals have a good agreement above 0.4 km (e.g., both observed the cloud peak at 5 km), although there is an about 10 min time shift between two of these signals. In order to investigate the performance details in the lower range detection, the near range results below 0.8 km are presented in Figure 5b.
The range-corrected signal from WDPM could present the lowest aerosol loading about at 0.1 km, which is almost the same with the designed incomplete overlap range of the lidar system. Also, the signal is not saturated at the lowest complete overlap zone, which means the WDPM can detect even higher aerosol loading in the near-surface region as long as the system design supports a lower range of complete overlap. For comparison, the range-corrected signal from ordinary PMT with a single PC detection chain is distorted below about 0.4 km due to the dense aerosol loading in the lower atmosphere.
To evaluate the validated detectable range, the SNR of both signals was tested. Commonly, the lidar SNR bigger than three can be considered as an available signal to extract the real atmospheric information, thus the threshold of three is selected as a criterion for the signal availability. As the results show in Figure 6, both signals have almost the same validated detectable range of about 10 km. Therefore, WDPM detection is good at the near-range observation of aerosol loading, but for the far-range observation, it is as good as ordinary PMT detection.
The counting rate signals recorded by two PMT modules between the lidar range of 0.5 km and 10 km are shown in Figure 7. By comparison, both Pearson correlation coefficient (0.998) and coefficient of determination (0.996) indicate the high linear correlation between data taken from WDPM and normal PMT in general. The nonlinear behavior in some parts is probably caused by the atmospheric variation during the about 10 min time shift and the slight difference in electronic characteristics between the two PMT modules. Therefore, it indicates that the two PMT modules had almost the same counting rates in PC chains. It is worth noting that the number of scatter points were decreasing with the increasing counting rate. The reason is the aerosol loading is mainly distributed in the lower atmosphere (below 2 km) and varies largely, which responds to the higher counting rate; however, the molecule concentration (distributed in 0.5–10 km) responds to the lower counting rate.

4. Conclusions

In this approach, a new wide dynamic PMT module was applied into the lidar system to increase the dynamic range of lidar detection. The dynamic of a lidar signal with a WDPM detector can be over eight orders of magnitude. The comparison results with ordinary PMT detection indicate that the lidar system with a WDPM detector has the same performance of SNR and linearity. The detection range of a lidar signal powered with a WDPM is valid 0.12 km to 15 km with a diameter of 150 mm telescope and energy of 0.45 W laser at 532.2 nm. It demonstrated that the newly PMT detectors can improve the detection ability of a lidar system in the near range. In this study, the blind zone of lidar is about 100 m, but the results indicated there is still room to reduce the blind zone of the lidar system using the WDPM detection technique. In the future, a low-blind range lidar powered with WDPM can be developed for observations of full aerosol profiles from the near-surface to the free troposphere.

Author Contributions

All the authors made contributions on this research work and manuscript. In particular, data curation, S.M.; investigation, L.W., Q.Z. and B.Z.; methodology, L.W., Z.Y. and X.W.; project administration, L.W. and X.W.; software, L.W., S.M. and Z.Y.; writing—original draft, L.W.; writing—review and editing, Z.Y., Q.Z., B.Z., S.M., Y.Y. and X.W. All authors have read and agreed to the published version of the manuscript.

Funding

This work was supported by the National Natural Science Foundation of China (grant Nos. 62105248, 62275202 and 42205130).

Data Availability Statement

The datasets generated during and/or analyzed during the current study are available from the corresponding author on reasonable request.

Acknowledgments

We are grateful to Zhengzhi Wang and Lei Zhao for their help with the experimental setup.

Conflicts of Interest

The authors declare no conflict of interest.

References

  1. Müller, D.; Ansmann, A.; Mattis, I.; Tesche, M.; Wandinger, U.; Althausen, D.; Pisani, G. Aerosol-type-dependent lidar ratios observed with Raman lidar. J. Geophys. Res. Atmos. 2007, 112. [Google Scholar] [CrossRef]
  2. Mona, L.; Amodeo, A.; D’Amico, G.; Giunta, A.; Madonna, F.; Pappalardo, G. Multi-wavelength Raman lidar observations of the Eyjafjallajökull volcanic cloud over Potenza, southern Italy. Atmos. Chem. Phys. 2012, 12, 2229–2244. [Google Scholar] [CrossRef]
  3. Wang, L.; Stanič, S.; Eichinger, W.; Song, X.; Zavrtanik, M. Development of an automatic polarization Raman LiDAR for aerosol monitoring over complex terrain. Sensors 2019, 19, 3186. [Google Scholar] [CrossRef]
  4. Qiu, J.; Xia, H.; Shangguan, M.; Dou, X.; Li, M.; Wang, C.; Shang, X.; Lin, S.; Liu, J. Micro-pulse polarization lidar at 1.5 μm using a single superconducting nanowire single-photon detector. Opt. Lett. 2017, 42, 4454–4457. [Google Scholar] [CrossRef]
  5. Riu, J.; Sicard, M.; Royo, S.; Comerón, A. Silicon photomultiplier detector for atmospheric lidar applications. Opt. Lett. 2012, 37, 1229–1231. [Google Scholar] [CrossRef] [PubMed]
  6. Mielke, B. How can Licel help the ATMOHEAD community? In EPJ Web of Conferences; EDP Sciences: Les Ulis, France, 2015; Volume 89, p. 04002. [Google Scholar]
  7. Photonics, H. Handbook Photomultiplier Tubes Basics and Applications. 2020. Available online: https://www.hamamatsu.com/content/dam/hamamatsu-photonics/sites/documents/99_SALES_LIBRARY/etd/PMT_handbook_v4E.pdf (accessed on 5 September 2023).
  8. Newsom, R.K.; Turner, D.D.; Mielke, B.; Clayton, M.; Ferrare, R.; Sivaraman, C. Simultaneous analog and photon counting detection for Raman lidar. Appl. Opt. 2009, 48, 3903–3914. [Google Scholar] [PubMed]
  9. Gao, F.; Veberič, D.; Stanič, S.; Bergant, K.; Hua, D.X. Performance improvement of long-range scanning Mie lidar for the retrieval of atmospheric extinction. J. Quant. Spectrosc. Radiat. Transf. 2013, 122, 72–78. [Google Scholar] [CrossRef]
  10. Feng, C.Z.; Liu, B.Y.; Liu, J.T.; Wu, S.H. Gluing Lidar Signals Detected in Analog-to-Digital and Photon Counting Modes. In EPJ Web of Conferences; EDP Sciences: Les Ulis, France, 2016; Volume 119, p. 25021. [Google Scholar]
  11. Vinogradov, S.L. Evaluation of performance of silicon photomultipliers in lidar applications. In Proceedings of the Photon Counting Applications 2017, Prague, Czech Republic, 24–25 April 2017; SPIE: New York, NY, USA, 2017; Volume 10229, pp. 92–101. [Google Scholar]
  12. Bobrovnikov, S.; Gorlov, E.; Zharkov, V.; Zaitsev, N.; Nadeev, A.; Trifonov, D. Evaluation of efficiency of the combined LIDAR signal photodetection technique. In Proceedings of the 26th International Symposium on Atmospheric and Ocean Optics, Atmospheric Physics, Moscow, Russian, 6–10 July 2020; SPIE: New York, NY, USA, 2020; Volume 11560, pp. 659–664. [Google Scholar]
  13. Zhang, Y.; Yi, F.; Kong, W.; Yi, Y. Slope characterization in combining analog and photon count data from atmospheric lidar measurements. Appl. Opt. 2014, 53, 7312–7320. [Google Scholar] [CrossRef] [PubMed]
  14. McCartney, E.J. Optics of the Atmosphere: Scattering by Molecules and Particles; John Wiley and Sons, Inc.: New York, NY, USA, 1976. [Google Scholar]
  15. Lehmann, S.; Wulfmeyer, V.; Bösenberg, J. Time-dependent attenuator for dynamic range reduction of lidar signals. Appl. Opt. 1997, 36, 3469–3474. [Google Scholar] [CrossRef]
  16. Agishev, R.; Comerón, A.; Bach, J.; Rodriguez, A.; Sicard, M.; Riu, J.; Royo, S. Lidar with SiPM: Some capabilities and limitations in real environment. Opt. Laser Technol. 2013, 49, 86–90. [Google Scholar] [CrossRef]
  17. Gong, W.; Richter, D.A.; Chyba, T.H.; Temple, D.A. Lidar dynamic range compression by using a membrane mirror light shutter. Opt. Laser Technol. 2007, 39, 909–912. [Google Scholar] [CrossRef]
  18. Payment, A.; Feygels, V.; Fuchs, E. Proposed lidar receiver architecture for the CZMIL system. In Proceedings of the Algorithms and Technologies for Multispectral, Hyperspectral, and Ultraspectral Imagery XVI, Orlando, FL, USA, 5–8 April 2010; SPIE: New York, NY, USA, 2010; Volume 7695, pp. 298–306. [Google Scholar]
  19. Jiang, Y.; Zhao, S.; Jalali, B. Invited Article: Optical dynamic range compression. APL Photonics 2018, 3, 110806. [Google Scholar] [CrossRef]
  20. Fu, Y.; Wang, Y.; Liu, W.; Zhang, T.; Chen, Z. A Dual-output Photoelectric Detection Module for Simultaneous Analog and Photon Counting Lidar Measurements. In Optical Instrumentation for Energy and Environmental Applications; Optica Publishing Group: Washington, DC, USA, 2014; p. JW6A-8. [Google Scholar]
  21. Mao, S.; Wang, A.; Yi, Y.; Yin, Z.; Zhao, Y.; Hu, X.; Wang, X. Polarization Raman lidar for atmospheric correction during remote sensing satellite calibration: Instrument and test measurements. Opt. Express 2022, 30, 11986–12007. [Google Scholar] [CrossRef] [PubMed]
  22. Morille, Y.; Haeffelin, M.; Drobinski, P.; Pelon, J. STRAT: An automated algorithm to retrieve the vertical structure of the atmosphere from single-channel lidar data. J. Atmos. Ocean. Technol. 2007, 24, 761–775. [Google Scholar] [CrossRef]
Figure 1. Schematic diagram of the lidar data detection module with the simultaneous two analog and a photon-counting outputs. HV is a high voltage; AMP is an amplifier.
Remotesensing 15 04404 g001
Figure 2. Schematic diagram of the testing lidar system. The WDPM is a wide dynamic PMT module.
Remotesensing 15 04404 g002
Figure 3. Performance of a wide dynamic PMT module in a PC detection chain, and two analog detection chains, respectively. The green curve indicates the range-corrected lidar signal from the PC detection chain; the red curve indicates the range-corrected lidar signal from the high dynamic analog (High A) detection chain; the blue curve indicates the range-corrected lidar signal from the low dynamic analog (Low A) detection chain.
Remotesensing 15 04404 g003
Figure 4. Dead-time corrected PC and converted analog data from two channels. (a) The gluing raw data. (b) Range-corrected signal after gluing. The time averaging of the data is 2 min.
Remotesensing 15 04404 g004
Figure 5. A comparison between WDPM and ordinary PMT lidar detection. The blue curve indicates the range-corrected signal of WDPM detection; the red curve indicates the range-corrected signal of ordinary PMT detection. the WDPM data were taken at 21:12 CST on 29 December 2021, and the ordinary PMT data were taken at 21:22 CST in the same day. Each profile was averaged by 2 min of sampling, and its range resolution is 15 m. (a) The range-corrected signal of 20 km. (b) The range-corrected signal of 0.8 km. The time averaging of the data is 2 min.
Remotesensing 15 04404 g005
Figure 6. The sample datasets with Figure 5. The blue curve indicates the signal-to-noise ratio (SNR) of WDPM detection; the red curve indicates the SNR of ordinary PMT detection. The black horizontal dash line indicates where the SNR is equal to 3.
Remotesensing 15 04404 g006
Figure 7. The sample datasets with Figure 5. The linear correlation between the raw PC signal of WDPM and the raw PC signal of ordinary PMT. Pearson R means Pearson correlation coefficient and R 2 means coefficient of determination.
Remotesensing 15 04404 g007
Table 1. Main components of the testing aerosol lidar.
Transmitter
Wavelength532 nm
Frequency2500 Hz
Energy0.45 W
Divergence0.045 mrad
Receiver
Cassegrain telescopeDiameter 150 mm/Focal length 500 mm
Pin hole0.5 mm
Focus lenseFocal length 50 mm
DetectorsHamamatsu PMT H13126-01 or Hamamatsu PMT H7421
Data acquisition
ALA CLASS1 × PC
Oscilloscope2 × Analog Channels
Disclaimer/Publisher’s Note: The statements, opinions and data contained in all publications are solely those of the individual author(s) and contributor(s) and not of MDPI and/or the editor(s). MDPI and/or the editor(s) disclaim responsibility for any injury to people or property resulting from any ideas, methods, instructions or products referred to in the content.

