Abstract
As an essential technology for intelligent transportation management and traffic risk prevention and control, vehicle detection plays a significant role in the comprehensive evaluation of the intelligent transportation system. However, limited by the small size of vehicles in satellite remote sensing images and lack of sufficient texture features, its detection performance is far from satisfactory. In view of the unclear edge structure of small objects in the super-resolution (SR) reconstruction process, deep convolutional neural networks are no longer effective in extracting small-scale feature information. Therefore, a vehicle detection network based on remote sensing images (VDNET-RSI) is constructed in this article. The VDNET-RSI contains a two-stage convolutional neural network for vehicle detection. In the first stage, a partial convolution-based padding adopts the improved Local Implicit Image Function (LIIF) to reconstruct high-resolution remote sensing images. Then, the network associated with the results from the first stage is used in the second stage for vehicle detection. In the second stage, the super-resolution module, detection heads module and convolutional block attention module adopt the increased object detection framework to improve the performance of small object detection in large-scale remote sensing images. The publicly available DIOR dataset is selected as the experimental dataset to compare the performance of VDNET-RSI with that of the state-of-the-art models in vehicle detection based on satellite remote sensing images. The experimental results demonstrated that the overall precision of VDNET-RSI reached 62.9%, about 6.3%, 38.6%, 39.8% higher than that of YOLOv5, Faster-RCNN and FCOS, respectively. The conclusions of this paper can provide a theoretical basis and key technical support for the development of intelligent transportation.
1. Introduction
With the vigorous development of surveying and mapping technology in China, the ability and quality of remote sensing data acquisition have been improved, and are now widely applied to the fields of smart cities, intelligent transportation, environmental monitoring, emergency command, etc. [1,2]. As one of the key issues in the realization of intelligent transportation based on satellite remote sensing data, vehicle detection is of great application value in promoting the development of road traffic planning [3,4]. Nevertheless, the small size of vehicles, insufficient texture features and unclear edge structure are still challenges in the application of remote sensing images to vehicle detection at present [5]. In the field of remote sensing images, compared to general object detection, it is more difficult to detect small objects and improve the precision of this as the inherent characteristics of small objects make it difficult for the model to obtain satisfactory features of the target area. CNN obtains high-dimensional representations of images by stacking convolutional and pooling layers. However, small objects in remote sensing images often have complex backgrounds. After passing through convolutional layers, the features of the target area are easily disturbed by the background or other instances, which leads to the loss of discriminative information, and increases the difficulty of subsequent object detection tasks. On the other hand, small objects often have blurry edges and their visual structure depends on the quality of the original image, making it difficult to accurately obtain their outline information through CNN. With the widespread application of deep learning in image processing, image classification, object identification, and other fields, the existing literature has achieved some research results [6,7,8].
Nowadays, object detection methods based on a one-stage model, such as YOLO [9,10], SSD [11], and FCOS [12], directly give the final detection results without generating explicit candidate regions. Object detection based on a two-stage model, such as Faster R-CNN [13], UA-CMDet [14], and RepDarkNet [15], first generates candidate regions that may contain objects, then further classifies and calibrates the candidate regions, and finally obtains the detection results. The research shows that the average precision for small objects is approximately 10 times lower than that for large objects [16]. When such methods are directly applied to small object detection in multi-source remote sensing images, their effect is still poor. Meanwhile, these methods are far from satisfying the precision requirements when applied directly to the detection of small objects in remote sensing images. At present, small object detection methods in remote sensing optical images are mainly divided into the following types. The first type is methods based on data augmentation [17], in which an important reason for the difficulty in detecting small objects in remote sensing images is the lack of enough samples for training. To address the problem of great differences in object size and dense distribution of small objects in remote sensing images, a dynamic adjustment of the image block size is adopted to balance the object size. Mosaic and other operations are introduced for object detection in remote sensing images, increasing the sample size of small objects. The second type is methods based on feature fusion [18]. In mainstream object detection methods based on deep learning, object identification is mainly accomplished by the deep feature output of the backbone network. Existing methods integrate feature maps from different stages to obtain efficient feature representations that balance semantic and detailed information, thereby improving the precision of small object detection while ensuring the precision of other size objects. The third type is methods based on SR reconstruction [5,19,20,21]. Compared to medium- to large-sized objects, small target areas are limited and often accompanied by challenges such as blurry structures. The idea of designing a network for SR of small target areas and obtaining detection performance comparable to large and medium-sized objects is to enhance the structural information of small objects and obtain better feature representation. Inspired by the stunning success of SR reconstruction based on CNN, the inherent spatial resolution of the image is improved by image post-processing technology, to increase the detection performance for small objects in remote sensing images.
SR reconstruction refers to the processing of a single or several low-resolution image(s) with complementary information to obtain one or several high-resolution image(s) [22,23]. With the in-depth research into image processing technology, SR reconstruction technology has realized significant progress and development [24,25], from traditional SR reconstruction based on interpolation [26,27] to SR reconstruction methods based on reconstruction [28] and then to SR reconstruction methods based on deep learning [29,30]. Among these methods, reconstruction based on deep learning is more effective, and both the initial convolutional neural network and the later generative adversarial network [31,32,33] show great performance. However, owing to the artifacts introduced in the process of SR reconstruction, it is difficult to ensure the quality of spatial resolution improvement for small objects. It can be seen that SR reconstruction can further increase the utilization efficiency of images by improving the spatial resolution of images through image processing technology, but image processing algorithms still need to be improved and optimized.
Inspired by these studies, the main problem addressed in this paper is to optimize the SR reconstruction’s representation of the structure of small objects, preserve the edge structural features of small objects, and integrate them into the object detection framework to improve the performance of vehicle detection in remote sensing images. To achieve this goal, a vehicle detection network based on remote sensing images (VDNET-RSI) that considers SR reconstruction is proposed in this study, in order to solve the problem of the small size of vehicles in large-scale remote sensing images and the negative effect of deep convolutional neural networks on feature interpretation and identification. Firstly, an SR reconstruction module is established considering the improvement of small object edge structure and spatial resolution; secondly, based on the integration of spatial resolution improvement modules, the attention mechanisms are added, the detection heads are optimized, and a VDNET-RSI network is constructed to improve the performance of small object detection in large-scale remote sensing images. The main contributions of this paper are as follows:
- (1)
- An SR construction module is established with the improved Local Implicit Image Function (LIIF) of a partial convolution-based padding to reconstruct high-resolution remote sensing images. Experimental results show that our module preserved clear edge structure and obtained better detection effects for small vehicle objects in remote sensing images.
- (2)
- An integrated framework of VDNET-RSI is constructed. In addition to SR reconstruction, the attention mechanisms and detection heads are added to expand the receptive field of vehicles, to further improve the robustness of vehicle detection, and to alleviate the problem of semantic information and spatial information.
2. Methods
The main research aim of this paper is SR reconstruction and improving the robustness of vehicle detection. In the first part, SR reconstruction focusing on the problem of the small object edge reconstruction effect was introduced. In the second part, the performance of small object detection was improved by using SR results and an object detection network. A schematic diagram of the proposed method is shown in Figure 1.
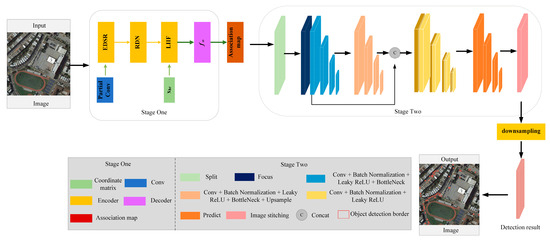
Figure 1.
Overview of the proposed method. Firstly, the SR results were obtained by the LIIF-based partial convolution module. Secondly, according to the SR results, the vehicle detection network based on YOLOv5 was optimized to improve the robustness.
2.1. Multi-Scale SR Reconstruction Module Considering Edge Optimization
In Stage One, the LIIF-based partial convolution module retains the advantages of learning a continuous representation for the arbitrary-scale SR images, and adds a partial convolution to preserve the edge structure of small objects. In continuous representation, each remote sensing image I(i) is represented as a 2D feature map M(i) RH × W × C. To predict the SR value of the arbitrary-scale image, LIIF utilizes a learnable implicit function, which predicts the SR value by taking the coordinate and the nearest feature as the input. The implicit function is parameterized by the multi-layer perceptron fθ (with θ as its parameter). The mathematical expression is as follows.
where z is a vector, and each vector z can be considered to represent the function ; is a 2D coordinate in the continuous image domain, which can be understood as a latent feature code; is the predicted signal, such as the radiation information of the remote sensing images.
According to , the radiation information of any position xq can be reconstructed:
where is the continuous image domain; z* is the nearest latent code from xq; v* is the coordinate of z*. A latent code is the concatenation of the 3 × 3 neighboring latent codes, and its outside border is padded by zero vectors.
Secondly, the 2D feature map is unfolded to fully utilize the feature map information.
The subsequent step is local ensemble. Since each z* can only determine a part of the domain, the selection of z* can suddenly switch from one to another. The area ratio is adopted as the weight to optimize Equation (2), in order to preserve the total weight of any point among the four equal eigenvectors. Finally, cell decoding is required to prevent the prediction value s from depending on the pixel size. Therefore, the function is modified as follows:
where c = [ch, cw] contains two values that specify the height and width of the query pixel; [x, c] refers to the concatenation of x and c.
Given that the convolution kernel can meet all elements in the LIIF module, using zero padding will bias the results and lead to artifact effects. In order to solve the problem of artifact effect, the bias terms are adjusted and decomposed. Consequently, all bias terms have the same form and are independent of each other. When the elements have residuals, the corresponding components of the bias terms also need to be removed, and thus the corresponding bias is eliminated, which is mathematically described as follows:
where is the eigenvalue within the window of the convolution layer centered on (i, j), and the convolution kernel size is the same as the convolution layer window size. is the weight of the convolution kernel corresponding to . W is the full convolution kernel weight, and b is the bias. is the eigenvalue in the next convolutional layer window centered on (i, j).
2.2. Vehicle Detection Network Considering SR Reconstruction
The phase of object detection mainly includes four parts: Input, Backbone, Neck and Prediction. The Backbone network is for feature extraction. Specifically, the feature extraction network consists of three modules: Focus, Cross-Stage Partial (CSP) and Spatial Pyramid Pooling (SPP). In order to further improve the precision of small object detection, the object detection module is further optimized based on the fusion of SR reconstruction results. In the PAN part, the attention mechanism module is utilized. The attention mechanism module includes a channel attention mechanism and spatial attention mechanism. The structure diagram of the convolutional block attention module (CBAM) is shown in Figure 2. In the network, the structure of the channel attention mechanism includes three parts. Firstly, the feature map with the size of H × W × C is imported into the network, and two feature maps with the size of 1 × 1 × C are obtained after global maximum-pooling and global average-pooling operations. Secondly, the feature map with the size of 1 × 1 × C is imported into the shared neural network, which is composed of a multi-layer perceptron and hidden layer; finally, the two output feature elements are added and multiplied, and the channel attention map Mc is obtained through the sigmoid activation function. The spatial attention mechanism consists of two parts. Firstly, the channel information is aggregated by dimensionally compressing each channel of inputting features by average pooling and maximum pooling, and then the two channel attention features with the size of H × W × 1 pass the convolutional layer with the size of 7 × 7 for fusion; secondly, the weight coefficient and the input feature F’ are multiplied by the sigmoid activation function to get the spatial attention map Ms.
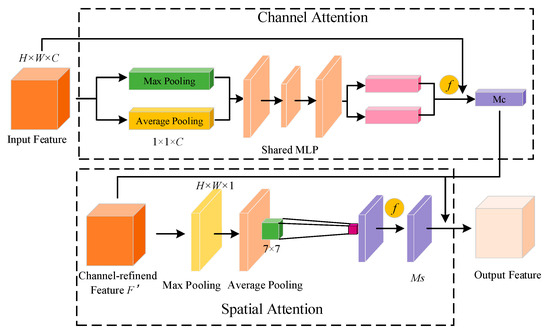
Figure 2.
Structure diagram of CBAM network.
The attention mechanisms identify the importance of the feature information by weight adjustment. In the small object detection process, the fusion of secondary features has little impact on the detection results and requires a certain amount of computation. Therefore, the computation work can be reduced by reducing the weight of secondary features and suppressing the expression of irrelevant feature information. To improve the object detection performance, the CBAM module is embedded into the Neck network of the object detection network based on the improvement of multi-scale feature detection. Before feature fusion, the CBAM module is added to enhance the attention of the network to important features, and to improve the feature fusion effect of the Neck network. In this way, the module can learn more effective features and the feature extraction ability of the network can be enhanced.
Furthermore, small objects have relatively small sizes and contain less information, which will result in severe loss of feature information after multiple downsampling. It is difficult to effectively extract the vehicles by the original three scale feature maps of the network. To fully utilize the shallow feature information of images, this paper expanded the detection scale by adding a feature map with the size of 200 × 200 to predict small objects. The schematic diagram of multi-scale object detection improvement is shown in Figure 3. The improved network model can detect objects on four different scale feature maps, in order to enhance the network’s ability for multi-scale object detection and to improve the network’s detection performance for small objects.
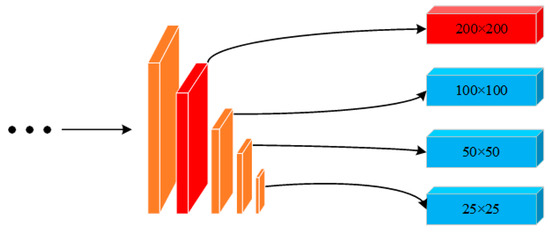
Figure 3.
Schematic diagram of multi-scale object detection improvement.
In the Prediction part, an extra detection layer is added based on the YOLOv5 network for small object prediction. The feature map of the 18th layer is upsampling, and connected with the feature map of the 2nd layer to generate a new feature detection layer for small object detection. This new feature map obtained has richer shallow fine-grained features and high-level semantic feature information, which can provide the module with a better performance in small-object detection. On the basis of the first stage, the results from the SR module are utilized in the second stage of the VDNET-RSI framework. Then, the SR results are split by the Focus module. Suppose the size of the feature map imported is 4 × 4 × 3; after splitting and channel insertion, the feature map size becomes 2 × 2 × 12 and the image information is converted from the spatial dimension to the channel dimension. This reduces the input size, retains the input information, and increases the speed of network training and detection. On this basis, CSP and SPP are introduced to optimize the detection effect, so as to retain more features and adapt to different scales of object detection. In the experiments, to ensure that the images in the input network are of the same size, the SR reconstructed images are segmented and overlapping sliding window segmentation is conducted for the images to alleviate the loss of object edge information caused by image segmentation. The segmented images are imported into the object detection network and finally the images are re-fused to obtain the final detection results. The prediction of object detection contains the border Loss function and non-extreme value suppression.
The Loss function contains the location, confidence, and category information of the prediction box. The overall loss value is obtained by weighting. The specific mathematical description is as follows:
where , , are location Loss function, confidence Loss function and category Loss function, respectively.
The CIoU position Loss function is used in the experiment to improve the slow convergence of the model and make the boundary regression box more stable when the gradient drops. The mathematical model is described as follows:
where b and bgt denote the central points of the predicted box and target box, ρ is the Euclidean distance, and c is the diagonal length of the smallest enclosing box covering the two boxes. α is a positive tradeoff parameter, and ν measures the consistency of the aspect ratio. The expressions are as follows:
where , , , represents the height and width of the predicted box and the height and width of the real box, respectively.
This object detection network considers the improvement of small target edge structure and spatial resolution and adds the attention mechanisms, optimizes the detection heads, then a VDNET-RSI network is constructed to improve the performance of small object detection in large-scale remote sensing images. The detailed parameters are listed in Table 1.

Table 1.
Parameters of VDNET-RSI.
3. Experiments
3.1. Experiment Data
DIOR [34] dataset is utilized in this experiment. The dataset has a total of 23,463 images and 190,288 annotation instances, and the image size is 800 × 800 pixels, with a spatial resolution of 0.5–30 m. Since the original DIOR dataset does not indicate the spatial resolution information of each image, the spatial resolution information of the displayed image is not listed in this paper. Ubuntu16.04 system is adopted as the experimental environment, GeForce1080 Ti(11G) is applied as the GPU, and Intel core i9-9900K is selected as the CPU. The training parameters should be initialized in the experiment. The specific settings are as follows: the training epoch is set to 100 times; the initial learning rate is set to 0.01; the batch size is set to 8; the learning rate is adjusted to 10% of the original learning rate after 80 iterations, and 1% after 90 iterations. Other parameters are consistent with the official parameters of the algorithm.
3.2. Data Preprocessing
In the experiment, after SR reconstruction for the image, the image size changes according to the scale of SR reconstruction. For example, the size of the original image is 800 × 800 pixels, while the image size becomes 1600 × 1600 pixels after reconstruction after 2X SR. In the object detection stage, in order to ensure consistency with the original network input size and avoid detection difficulty for small objects caused by the scaling of images, the images after SR reconstruction are preprocessed in the experiment, as shown in Figure 4, the red square in the right image is the object detection result border.
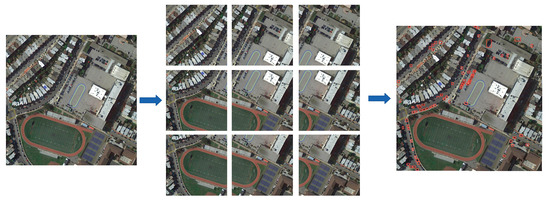
Figure 4.
Schematic diagram of image preprocessing.
Firstly, the image is segmented based on overlapping sliding windows to alleviate the loss of edge object information caused by image segmentation. The input image size is 1600 × 1600 pixels; the segmentation step size is set to 600 pixels, and the size of the overlapping area is 200 pixels. Finally, 9 images are obtained, each with a size of 800 × 800 pixels. The calculation formula for the number of image slices obtained after image segmentation is as follows:
where W and H are the width and height of the original image size, respectively. w and h are the width and height of the image slice, respectively; w1 and h1 are the width and height of the overlapping area, respectively, while n and m are the number of rows and columns in the image slice.
Secondly, in the object detection stage, to avoid repeated detection of vehicles in the overlapping areas, the segmented images are concatenated, as shown in Figure 4. The segmented images are imported into the object detection stage to obtain temporary results, and then the segmented images are re-fused to obtain the detection results of the original image. The fusion method means to calculate the relative coordinates of the upper left corner of the image slice and the corresponding original image coordinates based on Equations (9) and (10), and to restore the detected object position information in the image slice to the absolute coordinates of the original image. For the results at the edge of the image fusion, the NMS non-maximum suppression method is used to eliminate the redundant detection results generated by the overlapping areas, and then the final detection result is obtained.
3.3. Evaluation Index
In the experiment, Precision (P), Recall (R), and Average Precision (AP) are adopted as evaluation indexes for the detection performance of small objects. Precision can reflect the proportion of correctly predicted positive and negative samples in the model, while recall rate can reflect the proportion of correctly predicted positive samples in the model. The equation is as follows:
where TP is the number of true positive samples; FP is the number of false positive samples; FN is the number of false negative samples.
The samples after detection are classified with a neural network classifier to obtain different confidence intervals for classification. The samples are divided according to the confidence threshold set by the network. Samples with a confidence level greater than the threshold are classified as positive samples, while samples with a confidence level less than the threshold are classified as negative samples. The proportion of positive and negative samples in the model varies with the confidence threshold. After the confidence threshold is set, the precision and recall curves are plotted. The average precision is the area enclosed under the precision–recall curve, which is a common index to evaluate the detection effect of single-category objects. The higher the average precision value, the better the prediction performance of the model. The equation is as follows:
where P is the precision; R is the recall rate; AP is the average precision.
3.4. Result Analysis
- (1)
- Comparative Experimental Analysis of Vehicle Detection Using SR Reconstruction on Different Scales
Small objects in large-scale remote sensing images usually have a low resolution and lack sufficient texture features, detail information, and edge structure. Object detection networks are prone to significant information loss or even loss of some feature information during downsampling, resulting in severe missed detection for small objects, which affects the precision of small object detection. To address such problems, a multi-scale SR reconstruction module considering edge structure is introduced in the experiment, to realize SR reconstruction for the input remote sensing images, improve the spatial resolution of small objects, and increase their feature information. The results of different experiments on spatial resolution improvement in the SR reconstruction module are shown in Figure 5, Figure 6, Figure 7 and Figure 8. Therein, the red square in the first column on the left represents a partially enlarged window. The different color squares in other column are the object detection results. From the figures, it can be seen that the SR reconstruction module can effectively improve the image resolution and enhance the detailed feature information of vehicles.
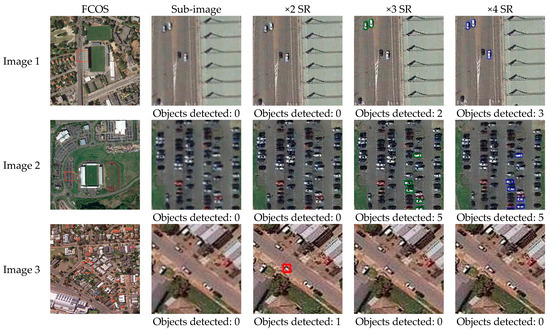
Figure 5.
FCOS object detection based on SR reconstruction results on different scales. From left to right: the original image, local magnification, 2× SR reconstruction results, 3× SR reconstruction results, and 4× SR reconstruction results.
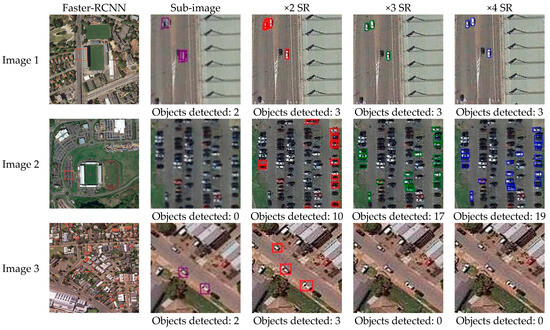
Figure 6.
Faster-RCNN object detection based on SR reconstruction results on different scales. From left to right: the original image, local magnification, 2× SR reconstruction results, 3× SR reconstruction results, and 4× SR reconstruction results.
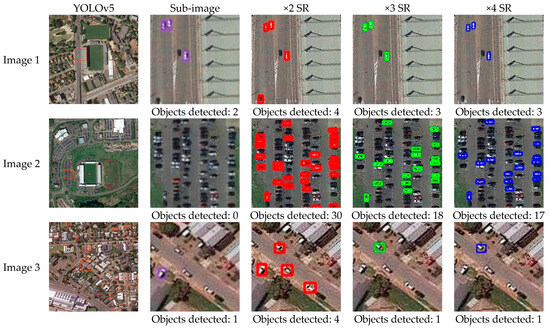
Figure 7.
YOLOv5 object detection based on SR reconstruction results on different scales. From left to right: the original image, local magnification, 2× SR reconstruction results, 3× SR reconstruction results, and 4× SR reconstruction results.
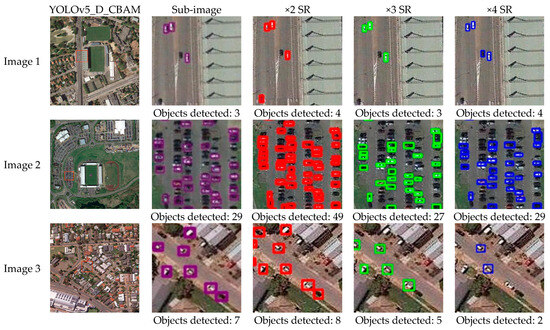
Figure 8.
YOLOv5_D_CBAM object detection based on SR reconstruction results on different scales. From left to right: the original image, local magnification, 2× SR reconstruction results, 3× SR reconstruction results, and 4× SR reconstruction results.
Furthermore, to better explain the impact of the SR reconstruction module on the improvement of detection performance for small-size objects, super resolutions of different scales are selected for further analysis in this experiment. Meanwhile, the experiment evaluates the quality of SR-reconstructed images on different scales, as shown in Table 2. Due to the lack of real high-resolution image data, the experiment evaluates the quality of SR reconstruction on different scales using two quality evaluation methods, Enhancement Measure Evaluation (EME) and average gradient (Avegrad) [35,36]. The principle of EME is to calculate the maximum and minimum ratios of the gray level in the sub-region. The logarithm of the ratios is the evaluation result of the image detail. This evaluation index represents the degree of gray change of the local image. The larger the EME value, the richer the detail information in the image. The average gradient value is the sum of the squares of the differences between each pixel and its adjacent pixels divided by the total number of pixels. This method can sensitively reflect the ability of the image to express small details in contrast, and is used to evaluate the blurriness of the image. The larger the average gradient, the clearer the image and the better the contrast. From a quantitative perspective, it can be concluded that 2x SR reconstruction results in the best image quality, which is also verified by the vehicle detection results. In the 2× SR reconstruction experiment, the vehicle extraction effect is better. In addition, effective SR reconstruction information can improve the detection results of vehicles, and increase the robustness of vehicle detection.
Table 2.
Index evaluation results on different-scale SR reconstruction.
- (2)
- Comparative Experiment and Analysis of Vehicle Detection Effects with Different Object Detection Methods
In the previous part, we discussed and evaluated the impact of different-scale SR reconstruction on object detection. In this part, the proposed model is compared with the state-of-the-art deep learning models, such as the non-anchor frame object detection model FCOS, the two-stage object detection model Faster R-CNN, and the single-stage anchor object detection model YOLOv5, to analyze the performance of the VDNET-RSI framework proposed in this paper. The experimental results are shown in Figure 9, and the different color squares in other column are the object detection results.
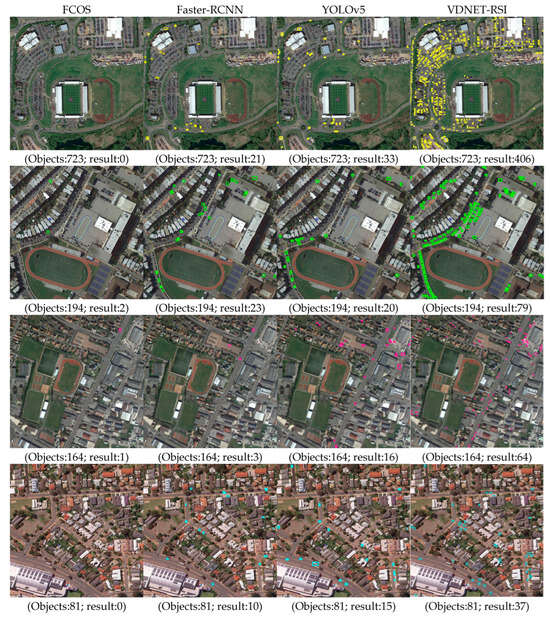
Figure 9.
Vehicle detection results obtained with different object detection methods.
From the experimental results, it can be concluded that VDNET-RSI is better than FCOS, Faster-RCNN and YOLOv5. The main reason is that FCOS cannot effectively detect small objects directly through pixel-by-pixel regression. Although it gets rid of the dependence on anchor parameters, the multi-scale feature pyramid does not fully utilize the low dimensional features, leading to the missing of most of the small objects in detection. Faster-RCNN detects vehicles through the preset anchor. It is not sensitive to the detection of various types of vehicles in remote sensing images, and there are a large number of overlapping detection results. In YOLOv5, an adaptive anchor box calculation module is added. Before training, the optimal anchor box size is calculated according to different data types. However, the final-generation feature maps on three scales (76 × 76, 38 × 38 and 19 × 19) are used to predict the vehicles. The receptive field size on the feature map with the largest resolution is 8 pixels, which may cause loss of features of tiny objects after downsampling.
The experiment utilizes AP, training time, inference time, parameters, and GFLOPs to comprehensively analyze the performance of four object detection methods; the statistical results are shown in Table 3. The VDNET-RSI model is little less efficient in terms of model size (Parameters) and computation complexity (GFLOPs). In terms of object detection precision, the AP is used as the index for the object detection performance [37]. According to the statistical results, the object detection performance is better than that of the two-stage object detection model. The experimental results show that the overall precision of vehicle detection of VDNET-RSI can reach 62.9%, which is 6.3% higher than that of the YOLOv5 model, about 38.6% higher than that of the Faster-RCNN model, and about 39.8% higher than that of the FCOS model. The main reason for this is that FCOS does not require complex operations related to the anchor. Thus, the problem of imbalance between positive and negative samples can be avoided. However, its feature map has a relatively large receptive field, which makes it difficult to detect small-size objects. Compared with FCOS, Faster-RCNN presents a lower detection speed, but higher precision. The size ratio of the anchor is not suitable for small-size objects. YOLOv5 has a relatively stronger feature-extraction ability and better detection performance. However, missed detection still exists in terms of tiny vehicle objects. The training time of VDNET-RSI is relatively long. Most of the training time is spent on the SR module, while the integration of the SR module improves the small object detection precision. VDNET-RSI solves the problem of insufficient spatial resolution of vehicles, and the semantic and spatial information in the deep convolutional neural network is considered. In the following study, it will be one of the key issues to ensure the quality of SR reconstruction, make the SR reconstruction framework lightweight, and improve the overall detection efficiency.
Table 3.
Comparison results of different deep learning object detection models using DIOR images.
- (3)
- Ablation Experiment
In order to evaluate the method proposed in this paper more intuitively, the performance of VDNET-RSI is compared with four corresponding improved methods, namely, YOLOv5, YOLOv5_CBAM, YOLOv5_D, and YOLOv5_D_CBAM, as shown in Figure 10, the different color squares in other column are the object detection results. YOLOv5_D represents a model with a small object detection head; YOLOv5_CBAM indicates a network including a CBAM module; YOLOv5_D_CBAM denotes a model with both a small object detection head and a CBAM module; VDNET-RSI refers to a model that includes a small object detection head, a CBAM module, and an SR reconstruction module simultaneously. It can be seen that the proposed method can effectively improve the detection performance for vehicles. The main reason is that the proposed method improves the super resolution of small objects in the image, to add detailed features of vehicles. Meanwhile, by adding detection heads and attention mechanism modules, the network can extract more useful object feature information, to improve the detection precision for small objects.
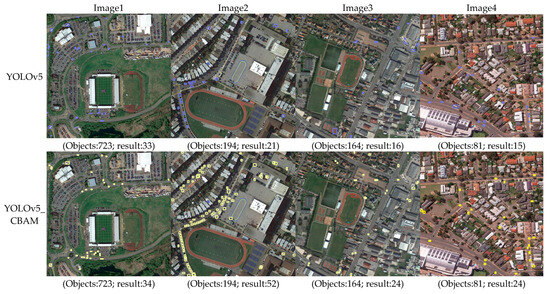
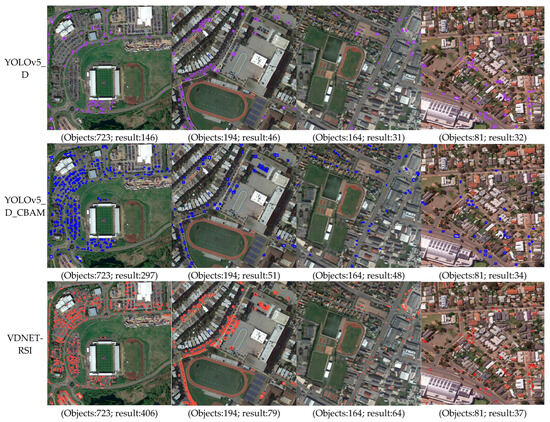
Figure 10.
Comparison results of vehicle detection experiments.
In order to verify the optimization effects of different improvement modules, an ablation comparison experiment was designed in this paper, and verified on the public remote sensing dataset DIOR. The AP values and training time on the DIOR dataset were compared, as shown in Table 4. According to Table 4, it can be concluded that adding different improvement modules to the object detection network improved the model’s performance to a certain extent, verifying the effectiveness of the proposed method. Compared with the original YOLOv5 model, the precision of YOLOv5_CBAM was improved by 1.4%, and the precision of YOLOv5_D improved by 2.8%; the precision of YOLOv5_D_CBAM where the two improvement modules were added simultaneously was improved by 3.9%. Composed of SR, detection heads, and CBAM, the precision of VDNET-RSI increased by 6.3%. VDNET-RSI achieved the highest detection precision on the DIOR dataset. However, due to the addition of small object detection heads and CBAM attention mechanism modules, the number of network layers and parameter calculations of the model increased. Compared with the original YOLOv5 model, the training time of the YOLOv5_CBAM, YOLOv5_D, YOLOv5_D_CBAM and VDNET-RSI models increased by 6.364, 24.024, 29.817, and 116.512 h, respectively. The inference time of the VDNET-RSI increased by 0.128 s compared with that of the original YOLOv5 model. Thus, the method proposed in this paper can effectively increase the model detection precision with a small increase in the inference time.
Table 4.
Comparison of different algorithms in vehicle detection performance on DIOR dataset.
- (4)
- Comparative Experiment and Analysis of Vehicle Detection Effects with Different Small Object Detection Methods
In addition, to better evaluate the performance of the method proposed in this paper, the comparison results with other small object detection methods were also added in the experiment. A comparison was made with the methods dedicated to small object detection (EESRGAN [5], UIU-NET [8]). The experimental results are shown in Figure 11, the different color squares in other column are the object detection results. EESRGAN utilizes ESRGAN, EEN, and detection networks to form a small object detection architecture for vehicle detection. However, EESRGAN does not involve confidence threshold constraints, and migrating directly it to other databases will result in error detection boxes. For small and dense vehicle detection, there may be missed detections and false detections. UIU-Net embeds a tiny U-Net into a larger U-Net backbone, enabling the multi-level and multi-scale representation learning of objects. Moreover, UIU-Net can be trained from scratch, and the learned features can enhance global and local contrast information effectively. More specifically, the UIU-Net model is divided into two modules: the resolution-maintenance deep supervision (RM-DS) module and the interactive-cross attention (IC-A) module. The infrared small object detection is modeled as a semantic segmentation problem. Objects are often missed when the small object detection is vertically applied to the optical image. For similar intra-class ground objects, there are false detections, and the edge effect of small object detection is poor. Compared with the EESRGAN network, the proposed SR method retained the clear edge results of small objects, although the texture details were not good enough. In comparison, the EESRGAN network improved the texture details, and small objects presented an obvious edge-ringing effect. Meanwhile, the vehicle detection precision of VDNET-RSI is 5.1% higher than that of EESRGAN, while its training time is halved. Compared with the UIU-Net network, the proposed SR method can better detect small objects and relatively accurately identify the edges of small objects.
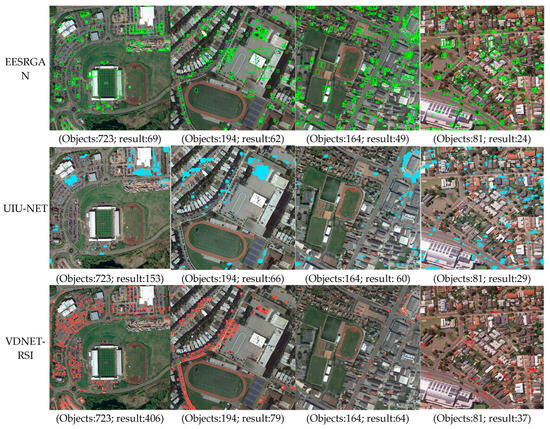
Figure 11.
Comparative experiment of different small object detection methods.
4. Discussion
4.1. Advantages and Disadvantages of Different Object Detection Methods
Through comparative experiments and ablation experiments, the performance of different methods for vehicle detection is explored. Table 5 summarizes the advantages and disadvantages of different methods for small object detection. In the DIOR dataset, vehicles account for a small proportion of the pixels in remote sensing images. The Faster-RCNN model uses fixed-type anchor boxes for object detection, so it shows poor ability to extract small objects and poor scale adaptability to the size of objects to be detected. The FCOS model does not use anchor boxes for prediction, so it takes less time, but with lower precision. When the vehicles are large, the precision of the YOLOv5_D model is not much different from that of the original YOLOv5 model. When the objects are less than 8 × 8 pixels, the YOLOv5_D model can detect more small vehicles, showing significant advantages in detection performance. This is because the original YOLOv5 model can only detect objects with a size of larger than 8 × 8 pixels, and small objects are often missed. The YOLOv5_D model incorporates a small object detection head, and the network can detect objects with a size of larger than 4 × 4 pixels, improving its small object detection performance. On the basis of the YOLOv5_D model, an attention mechanism is added in YOLOv5_D_CBAM to suppress the interference of irrelevant information, which can detect more vehicles under shadow occlusion. This indicates that the attention mechanism module can filter out the interfering background information in the image, thereby improving the detection precision of the object detector. After adding the SR reconstruction module, the precision value for vehicles has increased by 6.3% compared to the original YOLOv5 model, and 2.4% compared to the YOLOv5_D_CBAM model. While improving the precision for small object detection, it also increases the time cost. In subsequent research, the focus will be on the lightweight version of the model.
Table 5.
Comparison of different object detection methods.
4.2. Application Scenarios
A new end-to-end small object detection network with an SR reconstruction module, a detection head, and an attention mechanism is proposed in this paper, to address the challenges of detecting small vehicles commonly found in remote sensing images. In our method, the performance of small object detection is improved through a two-stage network, an improved SR module, a new detection head and an attention mechanism module. After integration of the SR reconstruction module, the results of small object detection are significantly improved. In the experiment, with the increase in the SR reconstruction multiples, the object detection performance does not improve accordingly. The main reason is that, for SR reconstruction based on a single image, the compensation of image information is limited as the SR multiple increases. Meanwhile, at the object detection end, the detection head does not adaptively adjust with the spatial resolution of the image. In this respect, experimental research and further exploration needs to be conducted in the future. In the object detection stage, the detection precision for small objects is further increased through the replacement of the detection head and introduction of attention mechanisms. According to the ablation experiment, the proposed end-to-end small object detection network improves the detection precision. In the experiment, EESRGAN is adopted as the network with SR detector, and compared with the method proposed in this paper. The results indicate that the VDNET-RSI method has a better performance than the EESRGAN method, and spatial resolution enhancement for small objects based on edge preservation helps to increase the detection precision. Another limitation of our experiment is that it demonstrates the performance of small object detection only including one multi-source remote sensing image dataset. We hope to explore the broader performance of our method in detecting small objects in different datasets. With the rapid development of 5G and computer vision intelligent perception technology, the cameras in the streets and alleys have transformed from single video capture devices to multi-source observation and monitoring devices. Remote sensing technology has the advantage of a “clairvoyance”, which can realize wide coverage, high efficiency, and high spatiotemporal resolution monitoring. From another perspective, it provides auxiliary decision-making information for urban transportation and supports the construction of smart transportation.
5. Conclusions
In this paper, the public DIOR dataset is used as experimental data. In view of the characteristics of vehicle detection in remote sensing images with large format and small objects, a vehicle detection network based on remote sensing images (VDNET-RSI) is established. This method takes into account SR reconstruction, which solves the problem that the semantic information and spatial information of vehicle information are difficult to balance in the deep and shallow layers of the deep convolutional neural network. The vehicle detection network framework is optimized while taking into account SR reconstruction, and the receptive field of small objects is increased to improve the robustness of vehicle detection. The experiment selects representative deep learning models for comparative analysis. The conclusions are summarized as follows.
Firstly, when the size of the objects to be detected in large-scale remote sensing images is too small, the existing models cannot effectively extract the vehicle features. It leads to missed and false detections, and cannot directly migrate to small object detection such as vehicles in remote sensing images. In this article, the VDNET-RSI containing a two-stage convolutional neural network for vehicle detection is proposed. The experimental results indicate that VDNET-RSI can extract vehicle features of different sizes adaptively and the overall precision is significantly improved. The overall precision of VDNET-RSI reached 62.9%, about 6.3%, 38.6%, 39.8% higher than that of YOLOv5, Faster-RCNN and FCOS, respectively. Thus, it has got rid of the limitation of traditional feature extraction modules. The above conclusion indicates that the network is significantly superior to existing models in detection performance. Secondly, the vehicle detection network containing the integrated SR module proposed in this paper presented a better vehicle detection performance in the experimental results of ×2 SR reconstruction.
In the future, we will continue to investigate how to improve the detection performance for small objects in large scale SR reconstruction by adding adaptive detection heads and texture detail information. Therefore, an SR reconstruction model framework of detail information and true spatial resolution enhancement is one of the important directions for further research. At the same time, research will focus on lightweight versions of small object detection models, which can efficiently process real-time scenes, provide technical support for intelligent processing on submeter level satellites, achieve small object detection in multi-scale satellite remote sensing images, and provide technical support for intelligent inspection of vehicles in a wide field of view.
Author Contributions
H.Z. proposed the methodology and wrote the manuscript. J.M. contributed to improving the methodology and is the corresponding author. Y.L. (Yanan Lv) helped complete the experiments. Y.L. (YuxuanLiu) and L.H. helped edit and improve the manuscript. J.Y. and X.L. helped revised the manuscript. All authors have read and agreed to the published version of the manuscript.
Funding
This research was jointly supported by grants from the Fundamental Research Funds for the Central Universities (Grant No. ZY20200202); the Hebei Natural Science Foundation (Grant No.D2020512001); the Science technology research and development plan self-fund program of Langfang (Grant No. 2022011020); the Hebei Province Science and Technology Research Project (Grant No. Z2020119).
Data Availability Statement
The data are not publicly available due to privacy restrictions.
Conflicts of Interest
The authors declare no conflict of interest.
Correction Statement
This article has been republished with a minor correction to the correspondence contact information. This change does not affect the scientific content of the article.
References
- Van Etten, A. You only look twice: Rapid multi-scale object detection in satellite imagery. arXiv 2018, arXiv:1805.09512. [Google Scholar]
- Ding, J.; Xue, N.; Xia, G.S.; Bai, X.; Yang, W.; Yang, M.Y.; Belongie, S.; Luo, J.; Datcu, M.; Pelillo, M.; et al. Object detection in aerial images: A large-scale benchmark and challenges. IEEE Trans. Pattern Anal. Mach. Intell. 2021, 19, 1–5. [Google Scholar] [CrossRef] [PubMed]
- Hou, Q.; Wang, Z.; Tan, F.; Zhao, Y.; Zheng, H.; Zhang, W. RISTDnet: Robust Infrared Small Target Detection Network. IEEE Geosci. Remote Sens. Lett. 2022, 19, 7000805. [Google Scholar] [CrossRef]
- Noh, J.; Bae, W.; Lee, W.; Seo, J.; Kim, G. Better to follow, follow to be better: Towards precise supervision of feature super-resolution for small object detection. In Proceedings of the IEEE/CVF International Conference on Computer Vision, Seoul, Republic of Korea, 27 October–2 November 2019; pp. 9725–9734. [Google Scholar]
- Rabbi, J.; Ray, N.; Schubert, M.; Chowdhury, S.; Chao, D. Small-Object Detection in Remote Sensing Images with End-to-End Edge-Enhanced GAN and Object Detector Network. Remote Sens. 2020, 12, 1432. [Google Scholar] [CrossRef]
- Hong, D.; Gao, L.; Yao, J.; Zhang, B.; Plaza, A.; Chanussot, J. Graph convolutional networks for hyperspectral image classification. IEEE Trans. Geosci. Remote Sens. 2020, 59, 5966–5978. [Google Scholar] [CrossRef]
- Hong, D.; Gao, L.; Yokoya, N.; Yao, J.; Chanussot, J.; Du, Q.; Zhang, B. More diverse means better: Multimodal deep learning meets remote-sensing imagery classification. IEEE Trans. Geosci. Remote Sens. 2020, 59, 4340–4354. [Google Scholar] [CrossRef]
- Wu, X.; Hong, D.; Chanussot, J. UIU-Net: U-Net in U-Net for infrared small object detection. IEEE Trans. Image Process 2022, 32, 364–376. [Google Scholar] [CrossRef]
- Redmon, J.; Divvala, S.; Girshick, R.; Farhadi, A. You only look once: Unified, real-time object detection. In Proceedings of the IEEE Conference on Computer Vision and Pattern Recognition, Las Vegas, NV, USA, 26 June–1 July 2016; pp. 779–788. [Google Scholar]
- Redmon, J.; Farhadi, A. YOLO9000: Better, faster, stronger. In Proceedings of the IEEE Conference on Computer Vision and Pattern Recognition, Honolulu, HI, USA, 21–26 July 2017; pp. 7263–7271. [Google Scholar]
- Liu, W.; Anguelov, D.; Erhan, D.; Szegedy, C.; Reed, S.; Fu, C.Y.; Berg, A.C. SSD: Single shot multibox detector. In Proceedings of the European Conference on Computer Vision, Amsterdam, The Netherlands, 11–14 October 2016; pp. 21–37. [Google Scholar]
- Tian, Z.; Shen, C.; Chen, H.; He, T. FCOS: Fully convolutional one-stage object detection. In Proceedings of the IEEE International Conference on Computer Vision, Seoul, Republic of Korea, 27 October–2 November 2019; pp. 9627–9636. [Google Scholar]
- Ren, S.; He, K.; Girshick, R.; Sun, J. Faster R-CNN: Towards real-time object detection with region proposal networks. IEEE Trans. Pattern Anal. Mach. Intell. 2015, 39, 1137–1149. [Google Scholar] [CrossRef]
- Sun, Y.; Cao, B.; Zhu, P.; Hu, Q. Drone-based RGB-Infrared Cross-Modality Vehicle Detection via Uncertainty-Aware Learning. IEEE Trans. Circuits Syst. Video Technol. 2022, 32, 6700–6713. [Google Scholar] [CrossRef]
- Zhou, L.; Zheng, C.; Yan, H.; Zuo, X.; Liu, Y.; Qiao, B.; Yang, Y. RepDarkNet: A Multi-Branched Detector for Small-Target Detection in Remote Sensing Images. ISPRS Int. J. Geo-Inf. 2022, 11, 158. [Google Scholar] [CrossRef]
- Huang, J.; Rathod, V.; Sun, C.; Zhu, M.; Korattikara, A.; Fathi, A.; Murphy, K. Speed/accuracy trade-offs for modern convolutional object detectors. In Proceedings of the IEEE Conference on Computer Vision and Pattern Recognition, Honolulu, HI, USA, 21–26 July 2017; pp. 7310–7311. [Google Scholar]
- Chen, C.; Zhang, Y.; Lv, Q.; Wei, S.; Wang, X.; Sun, X.; Dong, J. Rrnet: A hybrid detector for object detection in drone-captured images. In Proceedings of the IEEE/CVF International Conference on Computer Vision Workshops, Long Beach, CA, USA, 16–17 June 2019; pp. 100–108. [Google Scholar]
- Liu, L.; Ouyang, W.L.; Wang, X.G.; Fieguth, P.; Chen, J.; Liu, X.; Pietikäinen, M. Deep learning for generic object detection: A survey. Int. J. Comput. Vis. 2020, 128, 261–318. [Google Scholar] [CrossRef]
- Zhang, L.; Dong, R.; Yuan, S.; Li, W.; Zheng, J.; Fu, H. Making Low-Resolution Satellite Images Reborn: A Deep Learning Approach for Super-Resolution Building Extraction. Remote Sens. 2021, 13, 2872. [Google Scholar] [CrossRef]
- Guo, Z.; Wu, G.; Song, X.; Yuan, W.; Chen, Q.; Zhang, H.; Shi, X.; Xu, M.; Xu, Y.; Shibasaki, R.; et al. Super-Resolution Integrated Building Semantic Segmentation for Multi-Source Remote Sensing Imagery. IEEE Access 2019, 7, 99381–99397. [Google Scholar] [CrossRef]
- Schuegraf, P.; Bittner, K. Automatic Building Footprint Extraction from Multi-Resolution Remote Sensing Images Using a Hybrid FCN. ISPRS Int. J. Geo-Inf. 2019, 8, 191. [Google Scholar] [CrossRef]
- Shen, H.; Peng, L.; Yue, L.; Yuan, Q.; Zhang, L. Adaptive norm selection for regularized image restoration and super-resolution. IEEE Trans. Cybern. 2017, 46, 1388–1399. [Google Scholar] [CrossRef]
- Yang, W.; Feng, J.; Yang, J.; Zhao, F.; Liu, J.; Guo, Z.; Yan, S. Deep edge guided recurrent residual learning for image super-resolution. IEEE Trans. Image Process. 2017, 26, 5895–5907. [Google Scholar] [CrossRef]
- Dong, C.; Loy, C.; Tang, X. Accelerating the super-resolution convolutional neural network. In Proceedings of the European Conference on Computer Vision, Amsterdam, The Netherlands, 11–14 October 2016; pp. 391–407. [Google Scholar]
- Romano, Y.; Isidoro, J.; Milanfar, P. RAISR: Rapid and accurate image super resolution. IEEE Trans. Comput. Imaging 2017, 3, 110–125. [Google Scholar] [CrossRef]
- Zhang, L.; Wu, X. An edge-guided image interpolation algorithm via directional filtering and data fusion. IEEE Trans. Image Process. 2006, 15, 2226–2238. [Google Scholar] [CrossRef]
- Ishii, M.; Takahashi, K.; Naemura, T. View interpolation based on super resolution reconstruction. Ieice Trans. Inf. Syst. 2010, 93, 1682–1684. [Google Scholar]
- Hsieh, C.C.; Huang, Y.P.; Chen, Y.Y.; Fuh, C.S. Video super-resolution by motion compensated iterative back-projection approach. J. Inf. Sci. Eng. 2011, 27, 1107–1122. [Google Scholar]
- Shi, W.; Caballero, J.; Huszár, F.; Totz, J.; Aitken, A.P.; Bishop, R. Real-time single image and video super-resolution using an efficient sub-pixel convolutional neural network. In Proceedings of the IEEE Conference on Computer Vision and Pattern Recognition, Las Vegas, NV, USA, 26 June–1 July 2016; pp. 1874–1883. [Google Scholar]
- Zhang, H.; Wang, P.; Zhang, C.; Jiang, Z. A Comparable Study of CNN-Based Single Image Super-Resolution for Space-Based Imaging Sensors. Sensors 2019, 19, 3234. [Google Scholar] [CrossRef] [PubMed]
- Gao, M.; Han, X.H.; Li, J.; Ji, H.; Zhang, H.; Sun, J. Image super-resolution based on two-level residual learning CNN. Multimed. Tools Appl. 2020, 79, 4831–4846. [Google Scholar] [CrossRef]
- Dong, C.; Loy, C.C.; He, K.; Tang, X. Learning a deep convolutional network for image super-resolution. In Proceedings of the European Conference on Computer Vision, Zurich, Switzerland, 6–12 September 2014; pp. 184–199. [Google Scholar]
- Lai, W.S.; Huang, J.B.; Ahuja, N.; Yang, M.H. Deep laplacian pyramid networks for fast and accurate super-resolution. In Proceedings of the IEEE Conference on Computer Vision and Pattern Recognition, Honolulu, HI, USA, 21–26 July 2017; pp. 624–632. [Google Scholar]
- Li, K.; Wan, G.; Cheng, G.; Meng, L.; Han, J. Object detection in optical remote sensing images: A survey and a new benchmark. ISPRS J. Photogramm. Remote Sens. 2020, 159, 296–307. [Google Scholar] [CrossRef]
- Agaian, S.; Panetta, K.; Grigoryan, A. Transform-based image enhancement algorithms with performance measure. IEEE Trans. Image Process 2001, 10, 367–382. [Google Scholar] [CrossRef]
- Zhu, H.; Gao, X.; Tang, X.; Xie, J.; Song, W.; Mo, F.; Jia, D. Super-resolution reconstruction and its application based on multilevel main structure and detail boosting. Remote Sens. 2018, 10, 2065. [Google Scholar] [CrossRef]
- Everingham, M.; Van Gool, L.; Williams, C.K.; Winn, J.; Zisserman, A. The Pascal Visual Object Classes (VOC) Challenge. Int. J. Comput. Vis. 2010, 88, 303–338. [Google Scholar] [CrossRef]
Disclaimer/Publisher’s Note: The statements, opinions and data contained in all publications are solely those of the individual author(s) and contributor(s) and not of MDPI and/or the editor(s). MDPI and/or the editor(s) disclaim responsibility for any injury to people or property resulting from any ideas, methods, instructions or products referred to in the content. |
© 2023 by the authors. Licensee MDPI, Basel, Switzerland. This article is an open access article distributed under the terms and conditions of the Creative Commons Attribution (CC BY) license (https://creativecommons.org/licenses/by/4.0/).