Article

A New Approach Based on TensorFlow Deep Neural Networks with ADAM Optimizer and GIS for Spatial Prediction of Forest Fire Danger in Tropical Areas

1
Department of Photogrammetry and Remote Sensing, Faculty of Geomatics and Land Administration, Hanoi University of Mining and Geology, Duc Thang, Bac Tu Liem, Hanoi 100000, Vietnam
2
Department of Geological-Geotechnical Engineering, Hanoi University of Mining and Geology, Hanoi 100000, Vietnam
3
Department of Geodesy and Cartography, Institute of Techniques for Special Engineering, Le Quy Don Technical University, Hanoi 100000, Vietnam
4
Ho Chi Minh City Institute of Resources Geography, Vietnam Academy of Science and Technology, Mac Dinh Chi 1, Ben Nghe, 1 District, Ho Chi Minh City 700000, Vietnam
5
GIS Group, Department of Business and IT, University of South-Eastern Norway, Gullbringvegen 36, 3800 Bø i Telemark, Norway
*
Author to whom correspondence should be addressed.
Remote Sens. 2023, 15(14), 3458; https://doi.org/10.3390/rs15143458
Submission received: 6 June 2023 / Revised: 2 July 2023 / Accepted: 3 July 2023 / Published: 8 July 2023

Abstract

:
Frequent forest fires are causing severe harm to the natural environment, such as decreasing air quality and threatening different species; therefore, developing accurate prediction models for forest fire danger is vital to mitigate these impacts. This research proposes and evaluates a new modeling approach based on TensorFlow deep neural networks (TFDeepNN) and geographic information systems (GIS) for forest fire danger modeling. Herein, TFDeepNN was used to create a forest fire danger model, whereas the adaptive moment estimation (ADAM) optimization algorithm was used to optimize the model, and GIS with Python programming was used to process, classify, and code the input and output. The modeling focused on the tropical forests of the Phu Yen Province (Vietnam), which incorporates 306 historical forest fire locations from 2019 to 2023 and ten forest-fire-driving factors. Random forests (RF), support vector machines (SVM), and logistic regression (LR) were used as a baseline for the model comparison. Different statistical metrics, such as F-score, accuracy, and area under the ROC curve (AUC), were employed to evaluate the models’ predictive performance. According to the results, the TFDeepNN model (with F-score of 0.806, accuracy of 79.3%, and AUC of 0.873) exhibits high predictive performance and surpasses the performance of the three baseline models: RF, SVM, and LR; therefore, TFDeepNN represents a novel tool for spatially predicting forest fire danger. The forest fire danger map from this study can be helpful for policymakers and authorities in Phu Yen Province, aiding sustainable land-use planning and management.

Graphical Abstract

1. Introduction

Forest fires have become a global issue in recent years, with an increasing number of large and intense fires occurring in many regions of the world and having severe environmental and socio-economic impacts [1,2]. According to the UN Environment Programme Frontier report, between 2016 and 2020, fires destroyed around 423 million ha of forests annually [2]. Although forest fires have historically been a vital and natural aspect of the growth and development of vegetation [3], especially in tropical regions, they are becoming increasingly destructive and difficult to anticipate [4]. Given the persistent threat of forest fires caused by climate change, land-use alteration, and an expanding human presence in forested areas [5,6], it is crucial to prioritize the study of forest fire danger and the development of highly accurate prediction models.
The literature review shows a wealth of research and development on forest fire danger prediction, with numerous algorithms and models proposed [7,8,9]. Here, we can identify three primary categories. The first group comprises physically based models [10,11,12] that utilize mathematical functions and consider the location of combustible materials to establish forest fire spreading and propagation. Essentially, this group is capable of producing highly accurate maps of forest fires, but it necessitates very detailed information about the burning materials and their spatial distribution. This can be challenging and expensive, particularly if the research area for the forest fire is large. The second group comprises bivariate statistical techniques, including frequency ratio [13], evidential belief function [14], and weight of evidence [15], which necessitate the collection and processing of a vast amount of input data for modeling. These methods leverage the intersection of forest fire locations with each influencing factor to create a weight map. These weight maps are then combined to generate a final map depicting the forest’s susceptibility to fire. However, the accuracy of the forest-fire-susceptibility map is still limited in many cases. The last group comprises machine learning techniques [16,17,18]. The key distinction between this group and the second one is that the prediction models require both fire and non-fire locations for establishment. Overall, this category has a plethora of innovative algorithms that have arisen from advances in information technology, remote sensing, and geographic information systems. These tools assist in the selection and construction of more adaptable and precise forest-fire-forecasting models, leading to the creation of numerous high-accuracy forest fire danger models, including logistic regression [19], support vector machines [20], random forests [21], neural fuzzy [22,23], and decision trees [24].
In more recent years, deep learning has become a hot topic in natural hazard and environmental modeling [25,26] due to the availability of open-source platforms, i.e., Caffe AI developed by the Berkeley Vision and Learning Center [27], PyTorch developed by Facebook [28], and especially TensorFlow developed by the Google [29]. The main advantage of deep learning is that it is flexible and can learn to recognize complex spatial patterns, leading to higher accuracy in predicting outcomes. Moreover, deep learning libraries can be integrated with ArcGIS Pro software via various Python scripts [30] or the Anaconda Platform [31], which enable an automatic workflow in a geographic information system (GIS) from processing input data to generating final prediction maps. Nevertheless, due to some limited cases of applying deep learning in forest fire danger modeling, as evidenced by studies such as [32,33], further research is still needed to draw more conclusive results.
The current study aims to fill this gap in the literature by introducing and testing a new approach to forest fire danger modeling. Specifically, we utilized TensorFlow deep neural networks (TFDeepNN) in conjunction with geographic information systems (GISs) to model fire danger in the tropical forests of Phu Yen Province, Vietnam. In this province, according to the Agriculture and Rural Development of Phu Yen Province, in 2019 only, there were more than 70 forest fires, damaging around 1180 ha. In addition, El Niño is considered to impact forest fires in Phu Yen Province significantly. During El Niño years, the area tends to experience hotter and drier conditions, which can increase the risk of wildfires [34]. Herein, the hot and dry weather can cause vegetation to become more flammable and make fires easier to spread. Indeed, a prolonged drought in 2019 caused more than 3000 ha of forests to die. Thus, the increasing frequency and severity of forest fires in recent years require research and development of highly accurate forest fire danger models.

2. Background of the Algorithms Used

2.1. TensorFlow Deep Neural Networks

TensorFlow (www.tensorflow.org (accessed on 28 March 2023)) is an open-source library for building and training deep neural networks. It was developed by the Google Brain team, a group of researchers and engineers at Google, and was first released in November 2015 [29]. TensorFlow refers to the data structure used in deep learning algorithms, which is called Tensor, a multidimensional array of numbers [35]. TensorFlow is one of the world’s most widely used machine learning and deep learning libraries, with a large and active community of developers and researchers contributing to its ongoing development and improvement. TensorFlow deep neural networks (TFDeepNN) have successfully been applied for analyzing and processing spatial data in various spatial domains, i.e., floods [36], climate forecasts [37], landslides [38], and forest fire detections [39]. A typical structure of the TensorFlow deep neural networks (TFDeepNN) is shown in Figure 1.
TFDeepNN is a type of artificial neural network that is composed of multiple layers of interconnected neurons (Figure 1). Each layer in a TFDeepNN is responsible for extracting different levels of features from the input data and adjust its internal parameters during training to optimize its ability to make accurate predictions. Let us consider a training dataset D ∈ (Xi, Yi), with Xi ∈ Rd, Yi ∈ (0,1); i = 1 … n is the total number of samples, and d is the dimension of samples. In this research context, X represents the ten forest-fire-driving factors (i = 10), whereas Y ∈ (0,1) refers to the two classes of forest fire and non-forest fire. The TFDeepNN aims to build the inference model f: Rd → (0,1) to infer the ten driving factors into fire danger indices. Then, these indices are used to generate a fire danger map using a geographic information system (GIS).

2.2. Benchmarked Machine Learning Models

In this research, random forests (RF), support vector machines (SVM), and logistic regression (LR) were selected as benchmarked machine learning models for forest fire danger modeling due to their effectiveness in predicting the occurrence and spread of forest fires in various works [24,32,40,41].
RF, proposed by Breiman [42], is a type of ensemble learning method that combines multiple decision trees to form an inference model, which is capable of improving accuracy and reducing overfitting. RF is robust, flexible, and can handle both categorical and continuous input variables [43], making it a powerful tool for forest fire modeling. The global performance of the random forest model relies on several critical parameters [44]: the number of trees in the forest, the maximum depth assigned to each tree, the number of input variables taken into account for splitting at each node, and the evaluation criterion used to measure the split’s quality, such as Gini impurity or entropy. Therefore, these parameters should be carefully determined.
For SVM, this is a supervised learning algorithm that is utilized for classification and regression analyses, making it a versatile tool for forest fire modeling [18]. With a reputation for being robust to noise and outliers, SVM is particularly effective in dealing with complex problems, which is vital in forest fire danger studies, as the data collected from various geospatial sources can be noisy and incomplete. The performance of SVM is dependent on the kernel used and its parameters. Among the most popular kernels, the radial basis function (RBF) kernel with C and gamma parameters [45] is capable of providing the best prediction results, and therefore, it was selected for this analysis.
Regarding LR, this algorithm is simple, fast, and easy to interpret and thus can be used to model the probability of a binary response variable based on one or more predictor variables [46]. By using the sigmoid function, any real value will be mapped into another value in the range of 0 to 1, which can be treated as a probability. Consequently, in forest fire danger modeling, the response variable can be binary, representing whether a forest fire is likely to occur. Thus, based on these predictor variables, it can be used to predict the likelihood of a forest fire.

3. Study Area and Forest Fire Data

3.1. Geographic Setting

The study area is Phu Yen Province, which is situated in the southern part of the central region of Vietnam, with its geographic coordinates ranging from 12°48′ to 13°37′ North latitude and 108°05′ to 109°25′ East longitude (Figure 2); it is around 1165 km to the south of Hanoi and about 561 km to the north of the Ho Chi Minh city. Khanh Hoa Province borders it to the south, Binh Dinh Province to the north, and Gia Lai Province to the west. To the east, the province is bordered by the East Sea.
The province has a diverse topography, including mountains, hills, plains, and a long coastline [47]. Herein, hills and mountains account for 70% of the natural land area. To the north is the Cu Mong Mountain Range, to the south is the Dai Lanh Mountain Range, and to the west is the Truong Son Range. The highest elevation is 1706.3 m in the west of the Dong Xuan District (Figure 1). The slope of the province ranges from 0 to 59.9 degrees, with a mean of 11.4 and a standard deviation of 9.4. The province is also home to several rivers, including the Da Rang, Ky Lo, Ban Thach, and Tra Khuc Rivers [48], which play an essential role in the province’s economy and the daily life of the local population, providing a vital freshwater source for rice cultivation and aquaculture.

3.2. Forest Fire Record

Spatial modeling of forest fire danger requires foundational information regarding forest fires that occurred in the past and present [49,50,51]; therefore, collecting forest fire records and compiling a fire inventory map is a mandatory task that allows for the calibration and validation of models in later steps. The forest fire inventory map should provide location, time, and severity records. In this research, the fire inventory map for Phu Yen Province was compiled based on (1) fire records from the Forest Protection Department, Ministry of Agriculture, and Rural Development of Vietnam (www.watch.pcccr.vn (accessed on 28 March 2023); (2) fire data from the Fire Information for Resource Management System (FIRMS) project of NASA, USA (www. firms.modaps.eosdis.nasa.gov (accessed on 28 March 2023); (3) forest fire events at Phu Yen Province as reported in the Vietnam media; and (4) fire events from fieldworks with handheld GPS coordinates. As a result, 306 forest fire locations that occurred in the last five years, from 2019 to 2023, were identified. A statistical analysis showed that 76.1% of the total forest fires occurred during the four months of June, July, August, and September, most of which occurred during daylight. For example, seven forest fire events occurred from 25 June to 27 June 2019 in the Song Hinh and Phu Hoa Districts, causing more than 200 hectares of damage. A forest fire also broke out at about 10 a.m. on 25 August in the Ky Le Mountain area and then spread to neighboring areas, burning 50 ha.

3.3. Fire-Driving Factors

Understanding the driving factors of forest fires is crucial for predicting the spatial patterns of forest fire danger [52,53]. By identifying the factors that contribute to the occurrence and spread of forest fires, prediction models can be developed to predict where forest fires are most likely to occur. The literature review shows that the most popular driving factors of forest fires are factors related to climate conditions (temperature, precipitation, and wind speed), vegetation type and density, topography, and human activities [16,54,55,56]. In this research, based on analysis of the forest fire inventory map and field works, we considered ten fire-driving factors for the Phu Yen Province: NDVI (normalized difference vegetation index), NDWI (normalized difference water index), LULC (land use/land cover), distance to road, relative humidity, temperature, rainfall, aspect, slope, and elevation.
NDVI and NDWI are commonly used remote sensing indices for forest fire modeling because they provide valuable information on vegetation cover and water availability [57], which are critical factors that contribute to the occurrence and spread of forest fires. Herein, NDVI is a measure of vegetation greenness and density, and areas with higher NDVI values typically have more vegetation cover [58] and are more susceptible to fire. Whereas NDWI measures the presence and extent of water in an area, high NDWI values in forested areas may also indicate areas with high soil moisture content [59], which may influence fire behavior and spread. In this research, NDVI (Figure 3a) and NDWI (Figure 3b) for Phu Yen Province were computed from reflectance values of bands 4, 5, and 6 of Landsat 8 OLI imagery 30 resolution (available at the USGS archive www.earthexplorer.usgs.gov (accessed on 28 March 2023) using Equations (1) and (2) [60,61]. Herein, two images (path-row of 124-051 and 123-051) captured on 10 April 2022 were used.
NDVI = (Band 5 − Band 4)/(Band 5 + Band 4)
NDWI = (Band 5 − Band 6)/(Band 5 + Band 6)
Land use/land cover (LULC) is a vital factor to consider in forest fire modeling because it provides information on the type and distribution of vegetation and other land-cover features in a region [62]. Herein, different land-cover types have varying susceptibility to fire, with some types, such as grasslands and forests, being more prone to fires than others, such as wetlands and water bodies. In this analysis, the LULC map (Figure 3c) for the study area was compiled from the 30 m resolution LULC map products in 2020 provided by the Earth Observation Research Center (EORS), the Japan Aerospace Exploration Agency (JAXA) (available at www.eorc.jaxa.jp, accessed on 28 March 2023). A total of 13 classes were identified: residential land (1); rice paddies (3); croplands (4); grassland (7); barren land (8); scrub/shrub (9); forest (10); wetland (11); open water (12); and aquaculture (13).
Distance to roads is an essential factor in forest fire danger study because it can affect both the occurrence and spread of forest fires. Therein, roads can act as both a source of ignition and a means of fire spread, particularly in areas with high traffic volume or where roads are not well maintained [63]. In this research, distance to road (Figure 3d) with four classes (0–120, 120–240, 240–480, 480–900, and >900 m) for Phu Yen Province was created using the road networks from (1) the national topographic map of Vietnam at 1:50,000 scale and (2) Open Street Map (www.openstreetmap.org (accessed on 28 March 2023)).
Regarding the climate conditions, we considered three factors [33], including relative humidity (Figure 3e), temperature (Figure 3f), and rainfall (Figure 3g). These factor maps were established using the climatic data provided by the POWER project of NASA (National Aeronautics and Space Administration, USA) (available at www.power.larc.nasa.gov, (accessed on 28 March 2023)). Herein, data from three years from 2018–2020 for the four months of June, July, August, and September were used. These months have a high concentration of forest fires, as mentioned in Section 3.2.
Finally, topography-related factors should be considered in forest fire modeling because they can influence the spatial patterns and drivers of forest fires. Herein, topography refers to the physical features of the land, such as slope, aspect, and elevation. For the slope, areas with steep slopes are more prone to fire spread because fires can move more quickly uphill and can be difficult to control [64]. With aspect, this factor refers to the slope directions, which can influence the amount of solar radiation and moisture that a slope receives [65], and can therefore affect the type and density of vegetation present. Regarding elevation, this factor can also affect fire behavior, as higher elevations tend to be cooler and moister than lower elevations [66], which can influence the type and density of vegetation present and the probability of fire occurrence. In this research, the slope map (Figure 3h), the aspect map (Figure 3i), and the elevation map (Figure 3j) for Phu Yen Province were extracted from an ALOS DEM 30 m resolution, provided by the EORS of JAXA (available at www.eorc.jaxa.jp (accessed on accessed on 28 March 2023)).

4. Proposed Methodology of GIS-Based TensorFlow Deep Neural Networks for Spatial Prediction of Forest Fire Danger

This section describes the proposed methodology (Figure 4) for spatial prediction of forest fire danger using TFDeepNN and GIS. This work processed the forest fire records and the driving factors using ArcGIS Pro 3.0. The Python code for TFDeepNN can be found at www.tensorflow.org (accessed on accessed on 28 March 2023). In addition, the authors programmed another Python script to process the ten driving factor maps and connect them to TFDeepNN. The script was also used to compute the output of the model, which was then transformed into a forest fire danger map. For the case of the three benchmarked methods, namely RF, SVM, and LR, the Python-based Weka API was used to generate forest fire danger models.

4.1. Forest Fire Database

In the first step, a forest fire database for Phu Yen Province was constructed using ESRI File Geodatabase format in ArcGIS Pro. Herein, the ESRI File Geodatabase is a robust and reliable format that can handle large amounts of data without sacrificing performance [67]. This makes it an ideal format for organizing and managing forest fire data, which can be extensive and complex. ESRI File Geodatabase in ArcGIS Pro allows for efficient and effective storage and management of large amounts of data and the integration of different data types [68], such as climate conditions, topography, and human activities, into a single database. This makes it easier to analyze the relationships between different factors and identify patterns that can be used to predict forest fire behavior.
After processing the data, the forest fire database for the study area was constructed, containing ten driving factors (NDVI, NDWI, LULC, distance to road, relative humidity, temperature, rainfall, aspect, slope, and elevation) and 306 historical forest fire locations. The driving factors were transformed into raster maps with a resolution of 30 m. As the TFDeepNN model processes data with values ranging from 0 to 1, a normalization process was carried out on the forest fire database. This process involved using the Raster Calculator in the Spatial Analysis tool in ArcGIS Pro to convert all values of the ten driving factors, which have their raster values in various ranges, ranging from 0.01 to 0.99 [22].
Subsequently, a value of “1” was assigned to the forest fire locations, while a value of “0” was assigned to the non-forest fire locations. For modeling purposes, a total of 214 forest fire records (70%) were randomly extracted from the 306 non-forest fire locations to generate the training dataset, while the remaining 92 forest fire records (30%) were used to create the validation dataset. In this research, forest fire modeling is treated as a binary pattern-recognition problem [33]. In order to achieve this, an equal number of locations (214 non-forest fire locations and 92 non-forest fire locations) were randomly sampled from non-forest areas within the study area, respectively. These non-forest areas were identified based on the NDVI map classification (see Figure 3a), with areas with an NDVI value of less than 1.5 classified as non-forest areas. Finally, an extraction process was carried out to generate ten raster values for these locations to build the training and validation datasets.

4.2. Feature Assessment

In forest fire danger modeling, assessing the usefulness or relevance of the driving factors in the training dataset is essential. The resulting evaluation helps determine whether a factor should be included in the model. This process is commonly known as feature assessment, and it is often used to improve the efficiency and accuracy of machine learning models by removing irrelevant or redundant features from the training dataset. In this study, the wrapper-based random forests (WrapRF) algorithm [69] was used to identify significant features for prediction. We selected the WrapRF because this algorithm is widely used in feature selection to determine the most informative factors to the prediction model.
The WRF is a greedy search method that explores all possible combinations of subsets of the ten forest fire driving factors and then evaluates them against the model’s performance. Herein, the evaluation criterion of classification accuracy [70] was used to determine which combination of the driving factors is the best for the data at hand.

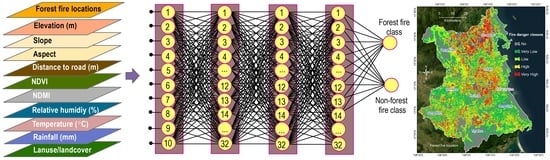
4.3. Designing TensorFlow Deep Neural Networks Model

An appropriate architecture for a TFDeepNN is crucial for modeling forest fire danger in Phu Yen Province. It can help achieve high performance, prevent overfitting and underfitting, and minimize computational resources. However, it requires a good understanding of the forest fire mechanism and knowledge of different available architectures in TensorFlow. In this research, the TFDeepNN model was designed with an input layer (ten neurons), three hidden layers (32 neurons for each layer), and an output layer (one neuron) (Figure 5). As a result, a total of 2497 parameters for the TFDeepNN model was determined (Table 1). Sigmoid and RELU were selected for the activate function and the transfer function [71,72] for the TFDeepNN model, respectively.

4.4. Cost Function

The performance of the TFDeepNN is dependent on how the 2497 parameters are searched and selected. In order to measure this performance, the mean squared error (MSE) (Equation (3)) was employed as the cost function in this research.
M S E = 1 n   i = 1 n ( F F i F O i ) 2
where  F F i is the forest fire value in the training dataset, whereas  F O i is the forest fire danger output from the TFDeepNN model; n is the total number of the training samples used.

4.5. ADAM Optimization

In this study, we utilized the ADAM (adaptive moment estimation) algorithm proposed by Kingma and Ba [73] for optimizing the TFDeepNN model. ADAM is a widely used and versatile optimization algorithm for training deep neural networks and is known for its effectiveness and efficiency [74]. This algorithm uses historical gradient information and adaptive learning rates to update the 2497 parameters of the model. ADAM adjusts the learning rate for each parameter, aiding in faster convergence and avoiding oscillations [75]. Moreover, ADAM is robust against noisy gradients and flexible enough to be used with different neural network architectures and tasks.

4.6. Statistical Metrics

In order to evaluate the performance of the forest fire danger models, various popular metrics were employed, such as classification accuracy, true positive, true negative, false positive, false negative, true positive rate, true negative rate, kappa F-score, receiver operating characteristic (ROC) curve, and area under the curve (AUC). These metrics are well documented in the literature, including for forest fire danger modeling, and therefore, we do not provide a detailed description of them here. Readers can refer to other articles, i.e., [9,20,76].

5. Results and Analysis

5.1. Feature Assessment Result

The results of the usefulness analysis for the ten driving factors of forest fires are presented in Table 1. It can be seen that NDVI provides the most informative value (InV) (0.280), followed by the elevation factor (InV = 0.095) and the NDWI factor (InV = 0.076). Meanwhile, the InV values for three factors, namely surface temperature (°C), rainfall (mm), and slope (°), are almost equal (Table 2). On the other hand, LULC is the least relevant factor to the forest fire model, with an InV of 0.005. Overall, all factors are informative for forest fires, and as a result, no factor was excluded in the modeling process.

5.2. Model Training and Validating

Using the ADAM optimization algorithm and the cost function of MSE, 2497 parameters were searched and optimized, and the TFDeepNNmodel was successfully trained. The training result is shown in Table 3 and Figure 6. It can be seen that the TFDeepNN model demonstrates a strong fit with the training data, where the mean error and the standard error are −0.018 and 0.231 (Figure 6), respectively. Moreover, the error of the TFDeepNN model follows a normal distribution. The accuracy (Acc), F-score, and kappa are 93.2%, 0.934, and 0.864, respectively, indicating that the TFDeepNN model accurately classified the samples in the training dataset (Table 3). The global performance of the TFDeepNN model is summarized via the ROC curve and AUC in Table 3 and Figure 7. The AUC of 0.976 indicates that the TFDeepNN model can differentiate between areas at high risk and areas at low risk of forest fires. The other measured metrics of the model in the training dataset are shown in Table 3 and Figure 6.
In order to evaluate how well the TFDeepNN model generalizes to new data and predicts the occurrence of forest fires in areas outside the training dataset, the model was checked using the validating dataset. The results are presented in Figure 7 and Figure 8 and Table 4. It could be seen that the Acc, kappa, F-score, mean error, and standard error of the model are 79.3%, 0.587, 0.806, −0.055, and 0.404, respectively, indicating that the model works well with the validating data. The AUC of the TFDeepNN model is 0.873 (Figure 7 and Table 4), indicating that the prediction power of the model is satisfied in predicting the likelihood of forest fires. The other measured metrics of the TFDeepNN model in the validating dataset are shown in Table 4 and Figure 8.

5.3. Model Training and Validating

In order to guarantee the TFDeepNN model’s efficacy in predicting forest fire danger in a spatial context, it is crucial to evaluate its predictive ability by comparing it with other benchmarked methods. As mentioned in Section 2.2, RF, SVM, and LR are the three benchmarked methods used. The Weka API used default parameters for the RF and LR models. The Radial Basis Function was selected for the SVM model, and two parameters, namely gamma (0.95) and C (9.9), were chosen using grid search. The result is shown in Table 3 and Table 4. We observe that the RF model (Acc = 81.8%, F-score = 0.805, kappa = 0.636, and AUC = 0.896) and the SVM model (Acc = 77.1%, F-score = 0.777, kappa = 0.542, and AUC = 0.850) fit well with the training dataset, whereas the LR (Acc = 75.5%, F-score = 0.759, kappa = 0.509, and AUC = 0.851) had lower performance (Table 3). Nevertheless, the RF, SVM, and LR models still show a lesser performance compared to the proposed TFDeepNN model.
Regarding prediction performance, both the RF model (Acc = 78.8%, F-score = 0.787, kappa = 0.576, and AUC = 0.865) and the SVM model (Acc = 76.1%, F-score = 0.771, kappa = 0.522, and AUC = 0.851) exhibit satisfactory results. In contrast, the LR model shows slightly lower prediction performance (Table 4). However, compared to the proposed TFDeepNN model, all three models have lower prediction performance (the results in Table 4).
A paired-sample sign test was conducted to determine if there was a statistically significant difference in the prediction capability of the four models: TFDeepNN, RF, SVM, and LR. The null hypothesis (Ho) was that there was no significant difference in prediction capability among these forest fire danger models. We calculated the test statistic and p-value, and if the p-value was less than or equal to 0.05, and the absolute value of the observed test statistic was outside the range of −1.96 to +1.96, the null hypothesis would be rejected. In such a case, we considered the prediction capability of these forest fire danger models to be statistically significant at the 5% level of significance.
The result is shown in Table 5. We observe that the p-value is less than 0.05, and the test statistic value was outside the critical range of −1.96 to +1.96 for the three pairs: TFDeepNN vs. RF, TFDeepNN vs. SVM, and TFDeepNN vs. LR. This indicates that the prediction capability of these forest fire danger models is statistically significant (Table 5).

5.4. Compile the Forest Fire Danger Map

Because the TFDeepNN model was deemed the best in this research, the model was used to compute the forest fire danger index for all pixels of Phu Yen Province using the Python script mentioned in Section 4. Herein, these danger indices were exported directly to the ESRI file geodatabase format of the forest fire (refer to Section 4.1), and in this way, the forest fire danger map could inherit all georeference settings established for this project before. A total of 10,762,508 pixels, corresponding to 2908 rows × 3701 columns, were calculated as the fire danger index; then, the pixels outside the study area’s boundary were masked. This results in a remaining 5,610,757 pixels, where the fire danger index varies from 0.00 to 1.00. The mean and the standard deviation are 0.337 and 0.413, respectively. In order to generate the forest fire danger, these 5,610,757 pixels were reclassified into five classes [22]: very high, high, low, very low, and no (Figure 9).
We defined the thresholds for the five class intervals by cross-referencing the raster map of the forest fire danger index with the forest fire locations (Section 3.2). Then, we computed the percentage of forest fire locations and the percentage of the forest fire danger map where the index values were sorted from high to low to plot a graph (Figure 10). To determine the fire danger index thresholds, 10% of the study area was used for the high class and 20% of the study area each for the moderate, low, and very low classes. Additionally, 25% of the study area was used to define the no class. Based on this approach, we determined four fire danger index thresholds: 0.973 for the very high class, 0.426 for the high class, 0.024 for the low class, and 0.01 for the very low class (as shown in Figure 10).
Table 6 shows the characteristics of the five forest fire danger classes generated from the TFDeepNN model. We observe that 757.5 km2 and 1009.9 km2 of the study area are classified as the very high class and the high class, respectively, and these two classes account for 93.8% of the forest fire locations. In contrast, the low and very low classes have 2019.9 km2 but receive only 6.2% of the forest fire locations. These indicate that the TFDeepNN model works well with the data at hand.

6. Discussion

In recent years, repeated and extensive forest fires have created harmful consequences for the natural environment, including reduced air and water quality, endangerment of various species, and heightened soil erosion risks [77,78,79]. Therefore, studies of forest fires and the development of prediction models with high accuracy are necessary to help mitigate the impacts mentioned above. In this work, we present and verify a new modeling approach, based on TFDeepNN and GIS, for spatial prediction of forest fire danger, focusing on high-frequency tropical forest fire in the Phu Yen Province of Vietnam.
The performance of the TFDeepNN is mainly influenced by the structure used and the optimization algorithm employed; therefore, it must be appropriately determined. In this work, the TFDeepNN structure (10 input neurons, 96 neurons in three layers, and 1 output neuron) provides high prediction power, indicating that the model was designed properly for forest fire danger modeling. Additionally, the ADAM algorithm is capable of optimizing the 2497 parameters of the model.
Comparing the TFDeepNN model with the benchmarks, i.e., RF, SVM, and LR, it indicates superior performance, thereby confirming TFDeepNN as a promising new tool that can be used for forest fire danger modeling. These results are in line with the current literature, which highlights the effectiveness of deep learning as a popular and powerful approach for achieving high prediction accuracy in the domain of natural hazards, outperforming traditional machine learning models [80,81,82].
In this analysis, including the ten forest-fire-driving factors proved informative for predicting forest fire danger, resulting in the high prediction performance of the TFDeepNN model. This success confirms the effectiveness of the selected factors and the successful processing and coding of these inputs. Among the ten factors, NDVI and elevation are the most important. This is reasonable because NDVI is a proxy of the vegetation that strongly influences the spread and intensity of forest fires [83], while the elevation in Phu Yen Province influences temperature and precipitation [84], which are crucial factors for forest fire ignition and spread. On the other hand, LULC (land use/land cover) and aspect were found to be of lower importance, possibly due to the relatively even distribution of forest fire locations across these factors. The result is consistent with forest fire danger modeling findings in other studies conducted in tropical areas [85,86].

7. Concluding Remarks

Based on the findings in this work, our investigation yielded the following conclusions:
Implementing TFDeepNN and the ADAM optimization algorithm can produce forest fire danger maps with a high degree of accuracy;
The performance of the TFDeepNN model was superior to the RF, SVM, and LR models used for benchmarking, suggesting that TFDeepNN represents a promising and innovative tool for mapping forest fire danger;
Among the various factors considered, NDVI and elevation were found to have the highest impact on forest fire danger in Phu Yen Province;
In summary, the forest fire danger map created in this study has the potential to offer valuable insights to policymakers and authorities in Phu Yen Province, supporting sustainable land-use planning and effective management practices.

Author Contributions

Conceptualization: T.X.T., V.-H.N. and D.T.B.; methodology: T.X.T., V.-H.N., D.T.N.P., L.T.N., N.N.H., P.V.H. and D.T.B.; validation, T.X.T., V.-H.N., D.T.N.P., L.T.N. and N.N.H.; writing—original draft preparation: T.X.T., V.-H.N., D.T.N.P., L.T.N., N.N.H., P.V.H. and D.T.B.; writing—review and editing: T.X.T., P.V.H. and D.T.B. All authors have read and agreed to the published version of the manuscript.

Funding

This work was financially supported by the Ministry of Education and Training (MoET) in Vietnam under grant number B2021-MDA-13.

Data Availability Statement

The data presented in this study are available on request from the corresponding author. The data are not publicly available due to privacy.

Conflicts of Interest

The authors declare no conflict of interest.

References

  1. Tyukavina, A.; Potapov, P.; Hansen, M.C.; Pickens, A.H.; Stehman, S.V.; Turubanova, S.; Parker, D.; Zalles, V.; Lima, A.; Kommareddy, I.; et al. Global Trends of Forest Loss Due to Fire From 2001 to 2019. Front. Remote Sens. 2022, 3, 825190. [Google Scholar] [CrossRef]
  2. Dowdy, A.; Purcel, L.; Boulter, S.; Moura, L.C. Wildfires under Climate Change: A Burning Issue; OCHA: New York, NY, USA, 2022; p. 18. [Google Scholar]
  3. The complexities of wildfires. Nat. Geosci. 2019, 12, 81. [CrossRef] [Green Version]
  4. Vitolo, C.; Di Giuseppe, F.; Barnard, C.; Coughlan, R.; San-Miguel-Ayanz, J.; Libertá, G.; Krzeminski, B. ERA5-based global meteorological wildfire danger maps. Sci. Data 2020, 7, 216. [Google Scholar] [CrossRef] [PubMed]
  5. Mansoor, S.; Farooq, I.; Kachroo, M.M.; Mahmoud, A.E.D.; Fawzy, M.; Popescu, S.M.; Alyemeni, M.N.; Sonne, C.; Rinklebe, J.; Ahmad, P. Elevation in wildfire frequencies with respect to the climate change. J. Environ. Manag. 2022, 301, 113769. [Google Scholar] [CrossRef]
  6. Richardson, D.; Black, A.S.; Irving, D.; Matear, R.J.; Monselesan, D.P.; Risbey, J.S.; Squire, D.T.; Tozer, C.R. Global increase in wildfire potential from compound fire weather and drought. NPJ Clim. Atmos. Sci. 2022, 5, 23. [Google Scholar] [CrossRef]
  7. Abid, F. A Survey of Machine Learning Algorithms Based Forest Fires Prediction and Detection Systems. Fire Technol. 2021, 57, 559–590. [Google Scholar] [CrossRef]
  8. Cruz, H.; Gualotuña, T.; Pinillos, M.; Marcillo, D.; Jácome, S.; Fonseca, C.E.R. Machine Learning and Color Treatment for the Forest Fire and Smoke Detection Systems and Algorithms, a Recent Literature Review. In Artificial Intelligence, Computer and Software Engineering Advances; Springer: Cham, Switzerland, 2021; pp. 109–120. [Google Scholar]
  9. Tehrany, M.S.; Jones, S.; Shabani, F.; Martínez-Álvarez, F.; Tien Bui, D. A novel ensemble modeling approach for the spatial prediction of tropical forest fire susceptibility using LogitBoost machine learning classifier and multi-source geospatial data. Theor. Appl. Climatol. 2019, 137, 637–653. [Google Scholar] [CrossRef]
  10. Lattimer, B.Y.; Hodges, J.L.; Lattimer, A.M. Using machine learning in physics-based simulation of fire. Fire Saf. J. 2020, 114, 102991. [Google Scholar] [CrossRef]
  11. Mell, W.; Jenkins, M.A.; Gould, J.; Cheney, P. A physics-based approach to modelling grassland fires. Int. J. Wildland Fire 2007, 16, 1–22. [Google Scholar] [CrossRef]
  12. Moinuddin, K.A.M.; Sutherland, D. Modelling of tree fires and fires transitioning from the forest floor to the canopy with a physics-based model. Math. Comput. Simul. 2020, 175, 81–95. [Google Scholar] [CrossRef]
  13. de Santana, R.O.; Delgado, R.C.; Schiavetti, A. Modeling susceptibility to forest fires in the Central Corridor of the Atlantic Forest using the frequency ratio method. J. Environ. Manag. 2021, 296, 113343. [Google Scholar] [CrossRef] [PubMed]
  14. Pourghasemi, H.R. GIS-based forest fire susceptibility mapping in Iran: A comparison between evidential belief function and binary logistic regression models. Scand. J. For. Res. 2016, 31, 80–98. [Google Scholar] [CrossRef]
  15. Hong, H.; Naghibi, S.A.; Moradi Dashtpagerdi, M.; Pourghasemi, H.R.; Chen, W. A comparative assessment between linear and quadratic discriminant analyses (LDA-QDA) with frequency ratio and weights-of-evidence models for forest fire susceptibility mapping in China. Arab. J. Geosci. 2017, 10, 167. [Google Scholar] [CrossRef]
  16. Naderpour, M.; Rizeei, H.M.; Khakzad, N.; Pradhan, B. Forest fire induced Natech risk assessment: A survey of geospatial technologies. Reliab. Eng. Syst. Saf. 2019, 191, 106558. [Google Scholar] [CrossRef]
  17. Pourghasemi, H.R.; Gayen, A.; Lasaponara, R.; Tiefenbacher, J.P. Application of learning vector quantization and different machine learning techniques to assessing forest fire influence factors and spatial modelling. Environ. Res. 2020, 184, 109321. [Google Scholar] [CrossRef]
  18. Jain, P.; Coogan, S.C.; Subramanian, S.G.; Crowley, M.; Taylor, S.; Flannigan, M.D. A review of machine learning applications in wildfire science and management. Environ. Rev. 2020, 28, 478–505. [Google Scholar] [CrossRef]
  19. Guo, F.; Wang, G.; Su, Z.; Liang, H.; Wang, W.; Lin, F.; Liu, A. What drives forest fire in Fujian, China? Evidence from logistic regression and Random Forests. Int. J. Wildland Fire 2016, 25, 505–519. [Google Scholar] [CrossRef]
  20. Thach, N.N.; Ngo, D.B.T.; Xuan-Canh, P.; Hong-Thi, N.; Thi, B.H.; Nhat-Duc, H.; Dieu, T.B. Spatial pattern assessment of tropical forest fire danger at Thuan Chau area (Vietnam) using GIS-based advanced machine learning algorithms: A comparative study. Ecol. Inform. 2018, 46, 74–85. [Google Scholar] [CrossRef]
  21. Xie, Y.; Peng, M. Forest fire forecasting using ensemble learning approaches. Neural Comput. Appl. 2019, 31, 4541–4550. [Google Scholar] [CrossRef]
  22. Bui, D.T.; Bui, Q.-T.; Nguyen, Q.-P.; Pradhan, B.; Nampak, H.; Trinh, P.T. A hybrid artificial intelligence approach using GIS-based neural-fuzzy inference system and particle swarm optimization for forest fire susceptibility modeling at a tropical area. Agric. For. Meteorol. 2017, 233, 32–44. [Google Scholar]
  23. Moayedi, H.; Mehrabi, M.; Bui, D.T.; Pradhan, B.; Foong, L.K. Fuzzy-metaheuristic ensembles for spatial assessment of forest fire susceptibility. J. Environ. Manag. 2020, 260, 109867. [Google Scholar] [CrossRef]
  24. Sachdeva, S.; Bhatia, T.; Verma, A.K. GIS-based evolutionary optimized Gradient Boosted Decision Trees for forest fire susceptibility mapping. Nat. Hazards 2018, 92, 1399–1418. [Google Scholar] [CrossRef]
  25. Ma, Z.; Mei, G. Deep learning for geological hazards analysis: Data, models, applications, and opportunities. Earth-Sci. Rev. 2021, 223, 103858. [Google Scholar] [CrossRef]
  26. Yuan, Q.; Shen, H.; Li, T.; Li, Z.; Li, S.; Jiang, Y.; Xu, H.; Tan, W.; Yang, Q.; Wang, J.; et al. Deep learning in environmental remote sensing: Achievements and challenges. Remote Sens. Environ. 2020, 241, 111716. [Google Scholar] [CrossRef]
  27. Khan, S.; Rahmani, H.; Shah, S.A.A.; Bennamoun, M. Deep Learning Tools and Libraries. In A Guide to Convolutional Neural Networks for Computer Vision; Khan, S., Rahmani, H., Shah, S.A.A., Bennamoun, M., Eds.; Springer International Publishing: Cham, Switzerland, 2018; pp. 159–167. [Google Scholar]
  28. Ketkar, N.; Moolayil, J. Introduction to PyTorch. In Deep Learning with Python: Learn Best Practices of Deep Learning Models with PyTorch; Ketkar, N., Moolayil, J., Eds.; Apress: Berkeley, CA, USA, 2021; pp. 27–91. [Google Scholar]
  29. Abadi, M.; Barham, P.; Chen, J.; Chen, Z.; Davis, A.; Dean, J.; Devin, M.; Ghemawat, S.; Irving, G.; Isard, M. Tensorflow: A system for large-scale machine learning. In Proceedings of the 12th USENIX Symposium on Operating Systems Design and Implementation (OSDI 16), Savannah, GA, USA, 2–4 November 2016; pp. 265–283. [Google Scholar]
  30. Zandbergen, P.A. Advanced Python Scripting for ArcGIS Pro; Esri Press: Redlands, CA, USA, 2020. [Google Scholar]
  31. Rolon-Mérette, D.; Church, K.; Ross, M.; Rolon-Mérette, T. Introduction and purpose of the tutorial series Python for Research in Psychology. Quant. Methods Psychol. 2020, 16, S1–S3. [Google Scholar] [CrossRef]
  32. Rihan, M.; Bindajam, A.A.; Talukdar, S.; Naikoo, M.W.; Mallick, J.; Rahman, A. Forest Fire Susceptibility Mapping with Sensitivity and Uncertainty Analysis Using Machine Learning and Deep Learning Algorithms. Adv. Space Res. 2023, 72, 426–443. [Google Scholar] [CrossRef]
  33. Van Le, H.; Hoang, D.A.; Tran, C.T.; Nguyen, P.Q.; Hoang, N.D.; Amiri, M.; Ngo, T.P.T.; Nhu, H.V.; Van Hoang, T.; Bui, D.T. A new approach of deep neural computing for spatial prediction of wildfire danger at tropical climate areas. Ecol. Inform. 2021, 63, 101300. [Google Scholar]
  34. Nguyen, H.N.; Hoang, H.T.B. Vietnam. In El Niño Ready Nations and Disaster Risk Reduction: 19 Countries in Perspective; Glantz, M.H., Ed.; Springer International Publishing: Cham, Switzerland, 2022; pp. 159–179. [Google Scholar]
  35. Singh, P.; Manure, A. Learn TensorFlow 2.0: Implement Machine Learning and Deep Learning Models with Python; Apress: Berkeley, CA, USA, 2019. [Google Scholar]
  36. Pally, R.; Samadi, S. Application of image processing and convolutional neural networks for flood image classification and semantic segmentation. Environ. Model. Softw. 2022, 148, 105285. [Google Scholar] [CrossRef]
  37. Osah, S.; Acheampong, A.A.; Fosu, C.; Dadzie, I. Deep learning model for predicting daily IGS zenith tropospheric delays in West Africa using TensorFlow and Keras. Adv. Space Res. 2021, 68, 1243–1262. [Google Scholar] [CrossRef]
  38. Nava, L.; Monserrat, O.; Catani, F. Improving landslide detection on SAR data through deep learning. IEEE Geosci. Remote Sens. Lett. 2021, 19, 1–5. [Google Scholar] [CrossRef]
  39. Ghali, R.; Akhloufi, M.A.; Jmal, M.; Mseddi, W.S.; Attia, R. Forest Fires Segmentation Using Deep Convolutional Neural Networks. In Proceedings of the 2021 IEEE International Conference on Systems, Man, and Cybernetics (SMC), Melbourne, Australia, 17–20 October 2021; pp. 2109–2114. [Google Scholar]
  40. Milanović, S.; Marković, N.; Pamučar, D.; Gigović, L.; Kostić, P.; Milanović, S.D. Forest fire probability mapping in eastern Serbia: Logistic regression versus random forest method. Forests 2020, 12, 5. [Google Scholar] [CrossRef]
  41. Rodrigues, M.; De la Riva, J. An insight into machine-learning algorithms to model human-caused wildfire occurrence. Environ. Model. Softw. 2014, 57, 192–201. [Google Scholar] [CrossRef]
  42. Breiman, L. Random Forests. Mach. Learn. 2001, 45, 5–32. [Google Scholar] [CrossRef] [Green Version]
  43. Riley, K.L.; Grenfell, I.C.; Finney, M.A. Mapping forest vegetation for the western United States using modified random forests imputation of FIA forest plots. Ecosphere 2016, 7, e01472. [Google Scholar] [CrossRef]
  44. Probst, P.; Wright, M.N.; Boulesteix, A.L. Hyperparameters and tuning strategies for random forest. Wiley Interdiscip. Rev. Data Min. Knowl. Discov. 2019, 9, e1301. [Google Scholar] [CrossRef] [Green Version]
  45. Kok, Z.H.; Shariff, A.R.M.; Alfatni, M.S.M.; Khairunniza-Bejo, S. Support vector machine in precision agriculture: A review. Comput. Electron. Agric. 2021, 191, 106546. [Google Scholar] [CrossRef]
  46. Menard, S. Logistic Regression: From Introductory to Advanced Concepts and Applications; Sage: Newcastle upon Tyne, UK, 2010. [Google Scholar]
  47. Hoi, N.D.; Dung, N.T. Structure, diversity and dynamics of natural-anthropogenic landscapes of Phu Yen province. Indian J. Ecol. 2022, 49, 1225–1233. [Google Scholar]
  48. Nguyen, B.D.; Bui, N.A.; Dang, T.M. Estimation of suspended sediment concentration in downstream of the Ba river basin using remote sensing images. Inżynieria Miner. 2021, 1, 293–304. [Google Scholar] [CrossRef]
  49. Chuvieco, E.; Aguado, I.; Jurdao, S.; Pettinari, M.L.; Yebra, M.; Salas, J.; Hantson, S.; de la Riva, J.; Ibarra, P.; Rodrigues, M. Integrating geospatial information into fire risk assessment. Int. J. Wildland Fire 2012, 23, 606–619. [Google Scholar] [CrossRef]
  50. Scott, J.; Helmbrecht, D.; Thompson, M.P.; Calkin, D.E.; Marcille, K. Probabilistic assessment of wildfire hazard and municipal watershed exposure. Nat. Hazards 2012, 64, 707–728. [Google Scholar] [CrossRef] [Green Version]
  51. Pettinari, M.L.; Chuvieco, E. Fire danger observed from space. Surv. Geophys. 2020, 41, 1437–1459. [Google Scholar] [CrossRef]
  52. Guo, F.; Su, Z.; Wang, G.; Sun, L.; Lin, F.; Liu, A. Wildfire ignition in the forests of southeast China: Identifying drivers and spatial distribution to predict wildfire likelihood. Appl. Geogr. 2016, 66, 12–21. [Google Scholar] [CrossRef]
  53. Ruffault, J.; Mouillot, F. Contribution of human and biophysical factors to the spatial distribution of forest fire ignitions and large wildfires in a French Mediterranean region. Int. J. Wildland Fire 2017, 26, 498–508. [Google Scholar] [CrossRef] [Green Version]
  54. Ganteaume, A.; Camia, A.; Jappiot, M.; San-Miguel-Ayanz, J.; Long-Fournel, M.; Lampin, C. A review of the main driving factors of forest fire ignition over Europe. Environ. Manag. 2013, 51, 651–662. [Google Scholar] [CrossRef] [PubMed] [Green Version]
  55. Carrasco, J.; Acuna, M.; Miranda, A.; Alfaro, G.; Pais, C.; Weintraub, A. Exploring the multidimensional effects of human activity and land cover on fire occurrence for territorial planning. J. Environ. Manag. 2021, 297, 113428. [Google Scholar] [CrossRef]
  56. Pausas, J.G.; Keeley, J.E. Wildfires and global change. Front. Ecol. Environ. 2021, 19, 387–395. [Google Scholar] [CrossRef]
  57. Verbesselt, J.; Jonsson, P.; Lhermitte, S.; van Aardt, J.; Coppin, P. Evaluating satellite and climate data-derived indices as fire risk indicators in savanna ecosystems. IEEE Trans. Geosci. Remote Sens. 2006, 44, 1622–1632. [Google Scholar] [CrossRef]
  58. Gouveia, C.; Bastos, A.; Trigo, R.; DaCamara, C. Drought impacts on vegetation in the pre-and post-fire events over Iberian Peninsula. Nat. Hazards Earth Syst. Sci. 2012, 12, 3123–3137. [Google Scholar] [CrossRef] [Green Version]
  59. Teng, J.; Xia, S.; Liu, Y.; Yu, X.; Duan, H.; Xiao, H.; Zhao, C. Assessing habitat suitability for wintering geese by using Normalized Difference Water Index (NDWI) in a large floodplain wetland, China. Ecol. Indic. 2021, 122, 107260. [Google Scholar] [CrossRef]
  60. Ke, Y.; Im, J.; Lee, J.; Gong, H.; Ryu, Y. Characteristics of Landsat 8 OLI-derived NDVI by comparison with multiple satellite sensors and in-situ observations. Remote Sens. Environ. 2015, 164, 298–313. [Google Scholar] [CrossRef]
  61. Gao, B.-C. NDWI—A normalized difference water index for remote sensing of vegetation liquid water from space. Remote Sens. Environ. 1996, 58, 257–266. [Google Scholar] [CrossRef]
  62. Vilar, L.; Herrera, S.; Tafur-García, E.; Yebra, M.; Martínez-Vega, J.; Echavarría, P.; Martín, M.P. Modelling wildfire occurrence at regional scale from land use/cover and climate change scenarios. Environ. Model. Softw. 2021, 145, 105200. [Google Scholar] [CrossRef]
  63. San-Miguel-Ayanz, J.; Schulte, E.; Schmuck, G.; Camia, A.; Strobl, P.; Liberta, G.; Giovando, C.; Boca, R.; Sedano, F.; Kempeneers, P. Comprehensive Monitoring of Wildfires in Europe: The European Forest Fire Information System (EFFIS). In Approaches to Managing Disaster-Assessing Hazards, Emergencies and Disaster Impacts; IntechOpen: London, UK, 2012. [Google Scholar]
  64. Kim, D.-W.; Chung, W.; Lee, B. Exploring tree crown spacing and slope interaction effects on fire behavior with a physics-based fire model. For. Sci. Technol. 2016, 12, 167–175. [Google Scholar] [CrossRef] [Green Version]
  65. Sakellariou, S.; Tampekis, S.; Samara, F.; Flannigan, M.; Jaeger, D.; Christopoulou, O.; Sfougaris, A. Determination of fire risk to assist fire management for insular areas: The case of a small Greek island. J. For. Res. 2019, 30, 589–601. [Google Scholar] [CrossRef]
  66. Alexander, J.D.; Seavy, N.E.; Ralph, C.J.; Hogoboom, B. Vegetation and topographical correlates of fire severity from two fires in the Klamath-Siskiyou region of Oregon and California. Int. J. Wildland Fire 2006, 15, 237–245. [Google Scholar] [CrossRef]
  67. Childs, C. The top nine reasons to use a file geodatabase. ESRI Educ. Serv. 2009, 12–15. [Google Scholar]
  68. Allen, D.W.; Coffey, J.M. Focus on Geodatabases in ArcGIS Pro; Esri Press: Redlands, CA, USA, 2019. [Google Scholar]
  69. Park, C.H.; Kim, S.B. Sequential random k-nearest neighbor feature selection for high-dimensional data. Expert Syst. Appl. 2015, 42, 2336–2342. [Google Scholar] [CrossRef]
  70. Bui, D.T.; Hoang, N.-D.; Samui, P. Spatial pattern analysis and prediction of forest fire using new machine learning approach of Multivariate Adaptive Regression Splines and Differential Flower Pollination optimization: A case study at Lao Cai province (Viet Nam). J. Environ. Manag. 2019, 237, 476–487. [Google Scholar]
  71. Tien Bui, D.; Hoang, N.-D.; Martínez-Álvarez, F.; Ngo, P.-T.T.; Hoa, P.V.; Pham, T.D.; Samui, P.; Costache, R. A novel deep learning neural network approach for predicting flash flood susceptibility: A case study at a high frequency tropical storm area. Sci. Total Environ. 2020, 701, 134413. [Google Scholar] [CrossRef]
  72. Dubey, S.R.; Singh, S.K.; Chaudhuri, B.B. Activation functions in deep learning: A comprehensive survey and benchmark. Neurocomputing 2022, 503, 92–108. [Google Scholar] [CrossRef]
  73. Kingma, D.; Ba, J. Adam: A Method for Stochastic Optimization. In Proceedings of the 3rd International Conference for Learning Representations (ICLR’15), San Diego, CA, USA, 7–9 May 2015; Volume 500. [Google Scholar]
  74. Wang, Y.; Liu, J.; Mišić, J.; Mišić, V.B.; Lv, S.; Chang, X. Assessing optimizer impact on DNN model sensitivity to adversarial examples. IEEE Access 2019, 7, 152766–152776. [Google Scholar] [CrossRef]
  75. Goodfellow, I.; Bengio, Y.; Courville, A. Deep Learning; MIT Press: Cambridge, MA, USA, 2016. [Google Scholar]
  76. Rahmati, O.; Kornejady, A.; Samadi, M.; Deo, R.C.; Conoscenti, C.; Lombardo, L.; Dayal, K.; Taghizadeh-Mehrjardi, R.; Pourghasemi, H.R.; Kumar, S. PMT: New analytical framework for automated evaluation of geo-environmental modelling approaches. Sci. Total Environ. 2019, 664, 296–311. [Google Scholar] [CrossRef]
  77. Abram, N.J.; Henley, B.J.; Sen Gupta, A.; Lippmann, T.J.R.; Clarke, H.; Dowdy, A.J.; Sharples, J.J.; Nolan, R.H.; Zhang, T.; Wooster, M.J.; et al. Connections of climate change and variability to large and extreme forest fires in southeast Australia. Commun. Earth Environ. 2021, 2, 8. [Google Scholar] [CrossRef]
  78. Varela, V.; Vlachogiannis, D.; Sfetsos, A.; Karozis, S.; Politi, N.; Giroud, F. Projection of Forest Fire Danger due to Climate Change in the French Mediterranean Region. Sustainability 2019, 11, 4284. [Google Scholar] [CrossRef] [Green Version]
  79. Stevens-Rumann, C.; Morgan, P. Repeated wildfires alter forest recovery of mixed-conifer ecosystems. Ecol. Appl. 2016, 26, 1842–1853. [Google Scholar] [CrossRef]
  80. Sun, J.; Liu, Y.; Cui, J.; He, H. Deep learning-based methods for natural hazard named entity recognition. Sci. Rep. 2022, 12, 4598. [Google Scholar] [CrossRef]
  81. Haggag, M.; Siam, A.S.; El-Dakhakhni, W.; Coulibaly, P.; Hassini, E. A deep learning model for predicting climate-induced disasters. Nat. Hazards 2021, 107, 1009–1034. [Google Scholar] [CrossRef]
  82. Liu, Z.; Zhang, K.; Wang, C.; Huang, S. Research on the identification method for the forest fire based on deep learning. Optik 2020, 223, 165491. [Google Scholar] [CrossRef]
  83. Costa-Saura, J.M.; Bacciu, V.; Ribotta, C.; Spano, D.; Massaiu, A.; Sirca, C. Predicting and Mapping Potential Fire Severity for Risk Analysis at Regional Level Using Google Earth Engine. Remote Sens. 2022, 14, 4812. [Google Scholar] [CrossRef]
  84. Pham, M.-P.; Nguyen, K.Q.; Vu, G.D.; Nguyen, N.T.T.; Tong, H.T.; Trinh, L.H.; Le, P.V. Drought risk index for agricultural land based on a multi-criteria evaluation. Model. Earth Syst. Environ. 2022, 8, 5535–5546. [Google Scholar] [CrossRef]
  85. Le, H.; Bui, Q.; Bui, D.T.; Tran, H.H.; Hoang, N. A Hybrid Intelligence System Based on Relevance Vector Machines and Imperialist Competitive Optimization for Modelling Forest Fire Danger Using GIS. J. Environ. Inform. 2020, 36, 43–57. [Google Scholar] [CrossRef]
  86. Bui, D.T.; Van Le, H.; Hoang, N.-D. GIS-based spatial prediction of tropical forest fire danger using a new hybrid machine learning method. Ecol. Inform. 2018, 48, 104–116. [Google Scholar]
Figure 1. Typical structure of the TFDeepNN model.
Remotesensing 15 03458 g001
Figure 2. Location of Phu Yen Province and forest fire locations.
Remotesensing 15 03458 g002
Figure 3. Fire-driving factors: (a) NDVI and (b) NDWI, (c) LULC, (d) distance to road (m) (1: Residential land; 3: Rice paddies; 4: Crop lands; 7: Grass land; 8: Barren land; 9: Scrub/Shrub; 10: Forrest; 15: Wetland; 18: Open water; and 19: Aquaculture), (e) relative humidity (%), (f) temperature (°C), (g) rainfall (mm), (h) aspect (N: North; NE: North East; E: East; SE: South East; S: South; SW: South West; W: West; and NW: North West), (i) slope (°), and (j) elevation (m).
Remotesensing 15 03458 g003aRemotesensing 15 03458 g003bRemotesensing 15 03458 g003c
Figure 4. The proposed methodology for spatial prediction of forest fire danger.
Remotesensing 15 03458 g004
Figure 5. TensorFlow deep learning model designed for spatial prediction of forest fire danger.
Remotesensing 15 03458 g005
Figure 6. Performance of the TFDeepNN model in the training dataset.
Remotesensing 15 03458 g006
Figure 7. The ROC curve and the area under the curve (AUC) of the TFDeepNN model.
Remotesensing 15 03458 g007
Figure 8. Performance of the TFDeepNN model in the validating dataset.
Remotesensing 15 03458 g008
Figure 9. Forest fire danger map using the TFDeepNN model for Phu Yen Province.
Remotesensing 15 03458 g009
Figure 10. Graphic curve for determining four thresholds of the forest fire danger for the Phu Yen Province.
Remotesensing 15 03458 g010
Table 1. Summary of the TFDeepNN in this research.
No.DescriptionNumber of ParametersMatrix
1Input Layer 1320IpL10×32
2The bias of Input Layer 132BiasInL32×1
3Layer 11024L132×32
4The bias of Layer 132BiasL132×1
5Layer 21024L232×32
6The bias of Layer 232BiasL232×1
7Layer 332L232×1
8The bias of Layer 31BiasL21×1
Table 2. The usefulness of the driving factors in this research using the WrapRF algorithm.
Fire Driving FactorInformative ValueRanking
NDVI0.2801
Elevation (m)0.0952
NDWI0.0763
Surface temperature (°C)0.0724
Rainfall (mm)0.0715
Slope (°)0.0706
Relative humidity (%)0.0677
Distance to road (m)0.0578
Aspect0.0119
LULC0.00510
Table 3. Performance of the TFDeepNN, RF, SVM, and LR and using the training dataset with 10-fold cross-validation.
Forest Fire ModelMeasured Metrics
TPTNFPFNPPVNPVSensSpecAccF-ScoreKappaAUC
TFDeepNN20519492095.890.791.195.693.20.9340.8640.976
RF161189532575.288.386.678.181.80.8050.6360.896
SVM171159435579.974.375.778.777.10.7770.5420.850
LR165158495677.173.874.776.375.50.7590.5090.851
Table 4. Prediction performance of the TFDeepNN, RF, SVM, and LR and using the validating dataset.
Forest Fire ModelMeasured Metrics
TPTNFPFNPPVNPVSensSpecAccF-ScoreKappaAUC
TFDeepNN7967132585.972.876.083.879.30.8060.5870.873
RF7273201978.379.379.178.578.80.7870.5760.865
SVM7466182680.471.774.078.676.10.7710.5220.851
LR7265202778.370.772.776.574.50.7540.4890.856
Table 5. Paired-sample sign test of the TFDeepNN, RF, SVM, and LR models for spatial prediction of forest fire danger.
No.Model PairTest Statistic Valuep-ValueSignificance
1TFDeepNN vs. RF2.5800.010Yes
2TFDeepNN vs. SVM2.2850.022Yes
3TFDeepNN vs. LR3.1700.002Yes
4RF vs. SVM2.5410.011Yes
5RF vs. LR3.3170.001Yes
6SVM vs. LR0.3770.706No
Table 6. Characteristics of the five forest fire danger classes of the TFDeepNN model for the Phu Yen Province.
No.Forest Fire Danger IndexForest Fire Location (%)Class DescriptionForest Fire Danger Map (%)Occupied Areas
(km2)
10.973–1.00044.1Very High 15757.5
20.426–0.97349.7High201009.9
30.024–0.4263.3Low201009.9
40.001–0.0242.9Very Low201009.9
50.000–0.0010.0No251262.4
Disclaimer/Publisher’s Note: The statements, opinions and data contained in all publications are solely those of the individual author(s) and contributor(s) and not of MDPI and/or the editor(s). MDPI and/or the editor(s) disclaim responsibility for any injury to people or property resulting from any ideas, methods, instructions or products referred to in the content.

