Abstract
Wildfires represent a significant threat to both ecosystems and human assets in Mediterranean countries, where fire occurrence is frequent and often devastating. Accurate assessments of the initial fire severity are required for management and mitigation efforts of the negative impacts of fire. Evapotranspiration (ET) is a crucial hydrological process that links vegetation health and water availability, making it a valuable indicator for understanding fire dynamics and ecosystem recovery after wildfires. This study uses the Mapping Evapotranspiration at High Resolution with Internalized Calibration (eeMETRIC) and Operational Simplified Surface Energy Balance (SSEBop) ET models based on Landsat imagery to estimate fire severity in five large forest fires that occurred in Spain and Portugal in 2022 from two perspectives: uni- and bi-temporal (post/pre-fire ratio). Using-fine-spatial resolution ET is particularly relevant for heterogeneous Mediterranean landscapes with different vegetation types and water availability. ET was significantly affected by fire severity according to eeMETRIC (F > 431.35; p-value < 0.001) and SSEBop (F > 373.83; p-value < 0.001) metrics, with reductions of 61.46% and 63.92%, respectively, after the wildfire event. A Random Forest machine learning algorithm was used to predict fire severity. We achieved higher accuracy (0.60 < Kappa < 0.67) when employing both ET models (eeMETRIC and SSEBop) as predictors compared to utilizing the conventional differenced Normalized Burn Ratio (dNBR) index, which resulted in a Kappa value of 0.46. We conclude that both fine resolution ET models are valid to be used as indicators of fire severity in Mediterranean countries. This research highlights the importance of Landsat-based ET models as accurate tools to improve the initial analysis of fire severity in Mediterranean countries.
1. Introduction
Mediterranean countries are frequently disturbed by wildfire events [1,2,3,4,5]. Wildfires have diverse impacts on various elements within forest ecosystems. They may contribute to the depletion of biomass through processes such as soil erosion [6,7] and water runoff [8,9]. Similarly, wildfires have effects on landscape dynamics by shaping forest composition and structure [10,11], negatively influencing ecosystem multifunctionality [12] and ecosystem biodiversity [13]. Alterations in land use in the last few decades (abandonment of traditional agriculture, increased unmanaged forest plantations, abandonment of forest as a resource, among others) combined with anthropogenic climate change (increasing heat waves and droughts) is leading to an increase in the severity and extent of fire events, in addition to their frequency [14,15].
The assessment of fire impact is crucial for post-fire forest management, in particular to (i) identify priority areas with post-fire restoration needs [16], (ii) evaluate the efficacy of pre-fire fuel treatments [17], and (iii) characterize pre-fire conditions conducive to high fire affectation [18]. Fire severity is the most commonly used measure of fire’s effects on soils and vegetation [19,20,21]. The initial assessment of fire severity focusses on fire’s impacts on vegetation immediately after fire, whereas extended fire severity assessment aims to evaluate vegetative delayed mortality and recovery potential [22]. The excessive costs in time and resources that are required to field-measure fire severity in extensively burned areas make the use of remote sensing data and techniques more cost-effective [22,23]. In particular, fire severity is traditionally estimated from fire-induced changes in vegetation that are observed in red, near-infrared (NIR) and short-wave infrared (SWIR) spectral bands of remotely sensed multispectral data [24,25,26,27,28]. Specifically, the differenced Normalized Burn Ratio (dNBR [22]) computed from NIR and SWIR bands is a standard used to measure fire severity from remote sensing data. It is used in many studies, e.g., [24,26,29,30,31], and by operational programs such as the European Forest Fire Information System (EFFIS) (Rapid Damage Assessment module) and the Monitoring Trends in Burn Severity (MTBS) in the United States [32,33].
The dNBR index is usually categorized using thresholds to estimate the fire severity levels. It is possible, however, to use other classifiers. Parametric classifiers show lower accuracy and efficiency when compared to nonparametric supervised classifiers [34], like Random Forest (RF [35]). The RF algorithm offers a range of advantages, including computational efficiency, strong performance across several applications, and its ability to provide valuable insights into the importance of input variables, thereby enhancing accuracy in the classification process [36]. For this reason, the use of RF models in post-fire studies [37] is increasing and it has resulted in improved assessments of fire damage [21,27,38,39,40,41].
Apart from altering the remotely sensed signal using satellite sensors, wildfires also impact the variables of the energy balance equation [42,43]. In particular, latent heat flux or evapotranspiration (ET) is greatly influenced by modifications in vegetation, including changes in both species composition and structure resulting from fire events [44,45]. Different studies [46,47,48,49,50,51,52] have found a decrease in ET immediately after fire that can be observed for several years following the wildfire event. However, there are very few that use ET as an indicator of fire severity. Fernández-Manso et al. (2020) [53] and Quintano et al., (2020) [54] considered for the first time post-fire ET as a predictor of fire severity in Mediterranean countries. Previous studies on dNBR (and its derived indices) scarcely addressed a main drawback: the dNBR is considered as a proxy variable, which makes its eco-physical interpretation nonintuitive [53]. Hence, it would be highly beneficial to explore methodologies that, while retaining the simplicity of calculation, can be expressed in direct physical units, much like ET is (liters/day). ET is directly related to the physical and biogeochemical processes occurring in ecosystems [55], which make it more relevant for understanding the effects of fire on vegetation and the hydrological cycle [56]. ET can be used to directly assess fire’s impacts on specific aspects such as water availability, vegetation health, and soil quality [54]. Nowadays, ET can be estimated consistently over time and across different geographic areas [43], allowing the comparison of data across multiple regions (or wildfires). This capability proves crucial for evaluating long-term trends and making informed decisions regarding fire mitigation and post-fire restoration efforts.
Many prior studies examining the relationship between fire effects and ET have relied on field-measured surface fluxes [47,48,57,58]. This approach was chosen because estimating ET accurately and at an appropriate spatial resolution from satellite data has been challenging [59]. Among the remote sensing-based ET models, the majority of ET estimation models rely on either complete or simplified versions of the energy balance equation, which consider the energy expended in converting liquid water within soil and plants into water vapor, and then subsequently liberated into the atmosphere [60]. Some models such as the Google Earth Engine (GEE) implementation of the Mapping Evapotranspiration at High Resolution with Internalized Calibration (eeMETRIC, [61,62]), the GEE Implementation of the Surface Energy Balance Algorithm for Land (geeSEBAL, [63,64]) and Atmosphere–Land Exchange Inverse/Disaggregation of the Atmosphere–Land Exchange Inverse (ALEXI/DisALEXI, [65,66]) estimate energy balance variables using both optical (shortwave) and thermal (longwave) data. In contrast, simplified approaches such as Operational Simplified Surface Energy Balance (SSEBop [67,68,69]) and the Priestley–Taylor Jet Propulsion Laboratory (PT-JPL [70]) do not estimate some parameters of the energy balance equation, or calculate them using simplified assumptions. ET serves also as a crucial variable within the ECOsystem Spaceborne Thermal Radiometer Experiment on Space Station (ECOSTRESS) mission [71,72]. Pascolini-Campbell et al. (2022) [73] included it as a measure of pre-fire vegetation water stress, together with evaporative stress index (ESI) and water use efficiency (WUE). Their study showed that plant water stress was the dominant predictor of burn severity for the Southern California Mountain 2020 fires. Presently, the ECOSTRESS mission records data exclusively for the continental United States (CONUS) along with crucial biomes and agricultural regions. Validation sites are chosen from the FLUXNET network [74].
Accordingly, our study aims to estimate fire severity using two daily ET models, a complete one (eeMETRIC) and a simplified one (SSEBop), using an RF classification algorithm. METRIC is a widely recognized surface energy balance-based model [60], which justifies its selection. Fernandez-Manso et al. in 2020 and Quintano et al. in 2020 [53,54] already demonstrated that a post-fire METRIC ET image can be used to estimate fire severity in Mediterranean countries. In this paper, we validate a simplified ET model to estimate fire severity and compare its performance to that of the well-known METRIC model. As our study area has a non-complex topography, based on [75], our hypothesis is that both ET models should yield comparable estimations of fire severity. Additionally, this study can be thought of as a continuation of the first approaches made in this field by [53,54], as there is a need to test the use of ET in a set of study areas representing different bioclimatic situations, using new or different ET models for estimating fire severity. For this purpose, we chose five wildfires that impacted several vegetation types across the northwestern part of the Iberian Peninsula, and conducted the analysis from two perspectives: uni-temporal (post-fire) and bi-temporal (post/pre-fire ratio). Fire severity estimation using the dNBR index was used as a benchmark. In this context, we sought to answer the following research questions: (1) How did the studied wildfires influenced ET both at the wildfire level and the reference plot level? (2) Can the selected ET Landsat-based models estimate fire severity more accurately than a standard methodology based on dNBR spectral index? (3) To what extent do uni- and bi-temporal approaches, as well as the type of ET model (eeMETRIC/SSEBop), exert influences on the above two issues?
2. Material and Methods
2.1. Study Sites
We selected five wildfires that occurred during the summer season of 2022 in the western region of the Mediterranean basin, specifically in northwestern Spain and Portugal (Figure 1). These fire events propagated under meteorological conditions marked by unprecedented drought periods and heat waves in the months preceding the wildfires.
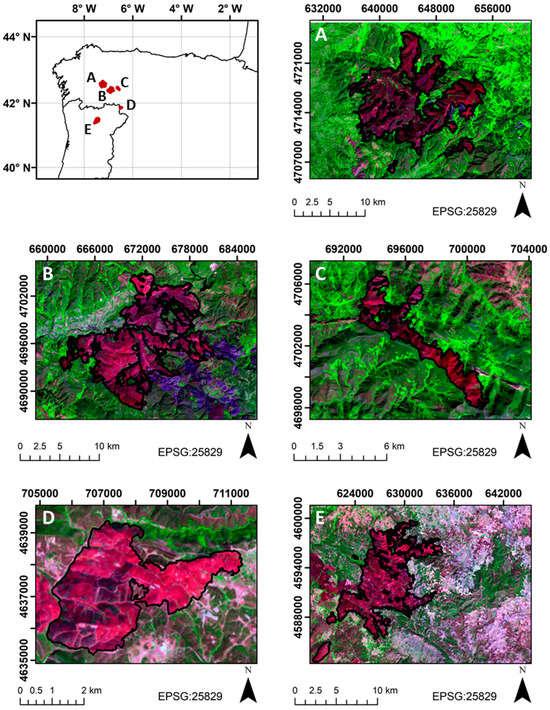
Figure 1.
Location of the Courel (A), Valdeorras (B), Valdueza (C), Figueruela (D) and Vila Real (E) wildfires in the northwestern Iberian Peninsula (Portugal and Spain). The background image is a Landsat-8 false color composite (R = band 7; G = band 5; B = band 4).
The affected sites span a wide range of environmental conditions, as described in detail in Table 1. In general, the terrain is not complex, which is relevant for the SSEBop model. Focusing on forest ecosystems, conifer forests dominated by maritime pine (Pinus pinaster Ait.) were found at lower elevations, while Scots pine (Pinus sylvestris L.) was the predominant conifer species at higher elevations. On the other hand, hardwood forests were mostly composed of species such as holm oak (Quercus ilex L.), Pyrenean oak (Quercus pyrenaica Willd.) and chestnut (Castanea sativa Mill.).

Table 1.
Location and characteristics of the five wildfires considered in this study: Courel (A), Valdeorras (B), Valdueza (C), Figueruela (D) and Vila Real (E).
2.2. Datasets
The five wildfires almost coincided in date and were located reasonably close together. For that reason, only two cloud-free images, one pre-fire (8 July 2022) and one post-fire (9 August 2022), of daily ET, with spatial resolutions of 30 m, were obtained for the eeMETRIC (EEFlux application [76]) and SSEBop [77] products. In addition, we downloaded USGS Landsat-8 Operational Land Imager (OLI) surface reflectance images (Level 2, Collection 2, Tier 1, trajectory/row 204/32) acquired on the same dates as the ET products to calculate the dNBR index.
The official wildfire perimeters were obtained from Copernicus Emergency Management Service (EMS) maps, verified by the Center for Forest Fire Studies (Portugal) and by the Spanish Autonomous Governments (Junta de Castilla y León and Xunta de Galicia). SPOT 6 and 7 images provided by Copernicus-EMS at a spatial resolution of 1.5 m resolution were used to obtain ground reference fire severity data (Table 1).
2.3. Brief Comparative of eeMETRIC and SSEBop ET Models
Both the eeMETRIC and SSEBop models have demonstrated their ability to estimate ET accurately in a variety of applications [78]. The two ET models are energy balance models; thus, they calculate ET by solving the surface energy balance equation (Equation (1)) on a pixel-by-pixel basis. The latent heat flux (energy consumed by the ET process, or heat energy used by water in its phase change from liquid to gas) is calculated as the difference between the net radiation to the surface and losses due to the sensible heat flux (energy used to heat the air) and ground heat flux (energy stored in the surface) [75].
where LE represents latent heat flux (energy consumed by ET) (W m−2); Rn is net radiation flux density (W m−2); G is ground heat flux density (W m−2); H is sensible heat flux density (W m−2). In both ET models Rn, G and H are derived from satellite data. Specifically, Rn is estimated from surface land temperature (LST) and reflectance data; G from LST, vegetation indices and previously calculated Rn and H from surface roughness, wind speed and LST ranges [61]. More detailed information about the METRIC model can be found in [61,79,80]. Similarly, detailed information about the SSEBop model can be found in [80,81,82,83].
Both ET models share numerous similarities, such as their theoretical foundation in the surface energy balance model and the capacity to incorporate both fine- (30 m) and coarse (1 km)-spatial-resolution data from Landsat and MODIS [78]. Nevertheless, they diverge significantly in terms of data prerequisites, implementation complexity, and associated costs. In summary, the eeMETRIC model is more accurate than the SSEBop model, but it has also a more complex mode of implementation, and thus, higher associated costs [75]. Regarding the eeMETRIC ET model, its main advantages are: (i) it computes all components of the energy balance model; (ii) it needs almost no ground-based measurements; and (iii) it is applicable to complex terrain. Its main limitations include: (i) it is very costly in terms of both computational time and monetary resources; (ii) it is owned by a University (Idaho, in particular) rather than by a state agency; and (iii) its uncertainty arises from the user’s choice of hot and cold reference pixels. In contrast, the main advantages of the SSEBop ET model include: (i) no ground-based measurements or manual selections of hot and cold reference pixels are required; (ii) minimal computational time; (iii) it is cost-effective; and (iv) it is owned by the United States Geological Survey (USGS). Among the main limitations of the SSEBop model, we can identify: (i) it is not applicable to complex terrain and (ii) it does not calculate sensible or ground heat fluxes of the surface energy balance equation. A more complete comparison of these two models can be found in [75,78].
2.4. Data Analysis
First, we computed the dNBR index from pre- and post-fire Landsat-8 OLI data using bands 5 (NIR) and 7 (SWIR). dNBR will be used as a benchmark to compare the ET performance in four scenarios, defined by the combination of two perspectives (uni- and bi-temporal) and two ET models (eeMETRIC and SSEBop). Similarly, the post-/pre-fire ratio was calculated for both eeMETRIC ET and SSEBop ET.
Second, a stratified random experimental design was adopted [84]. We defined 355 plots of 30 m × 30 m distributed over the five wildfires as ground reference data (111 low-fire-severity plots, 114 moderate-fire-severity plots, and 130 high-fire-severity plots). We used the coincident eeMETRIC/SSEBop/Landsat grid to randomly establish the plots. The classification of each reference plot was established through visual inspection based on the post-fire SPOT6/7 images (Table 1), relying on the predominant fire severity level observed within the plot. Specifically, a reference plot was assigned to the low-fire-severity category if its dead tree proportion was less than 50%, to the moderate-fire-severity category if the proportion ranged between 50 and 90%, and to the high-fire-severity category if the proportion was higher than 90% [23]. Next, values of dNBR, post-fire eeMETRIC ET, post-fire SSEBop ET, pre-/post-fire eeMETRIC ET ratio, and pre-/post-fire SSEBop ratio, at a 30 m spatial resolution, were extracted for each reference plot.
Third, we conducted a statistical exploratory analysis of pre- and post-fire ET (eeMETRIC and SSEBop) and dNBR at both the wildfire and reference plot levels. We also implemented a one-way Analysis of Variance (ANOVA) to assess significant differences in ET products and dNBR between the fire severity categories. In this way, we could determine the number of fire severity categories that may be discriminated with statistical significance by each input. Consequently, we identified the inputs that could act as indicators of fire severity.
Finally, we implemented an RF classification algorithm (univariate model) to evaluate the capacities of the two ET models (and the two temporal perspectives) to predict fire severity, using dNBR as a benchmark. The selection of the RF classification algorithm was based on its ability to effectively capture non-linear relationships between the dependent variable and predictors, as well as to address complex interactions among these variables [85,86]. To ensure prediction stability, the RF hyperparameter ntree was set to a value of 2000 [87]. The mtry RF hyperparameter was set to one because of the univariate nature of the models. The performance of the RF classification was evaluated by computing the average confusion matrix across 10-fold cross-validation resamples. We took into consideration the following accuracy parameters: overall accuracy (OA; %), Kappa index, user’s accuracy (UA; %), and producer’s accuracy (PA; %). We used a Ζ-test based on the Kappa index to compare the accuracy of the obtained fire severity estimates from each ET model and perspective. This allowed us to verify whether the differences in the Kappa index had statistical significance [84]. Note that zc = 1.96 at the 95% confidence level, and that the null hypothesis H0: (κ1 − κ2) = 0 is rejected when Z > zc. Additionally, wall-to-wall fire severity prediction maps at the wildfire scale were generated from RF model objects and raster images of the corresponding predictors.
All analyses were conducted in R [88] using the RandomForest [89], caret [90] and raster [91] packages.
3. Results
Pre- and post-fire eeMETRIC ET estimates were higher than SSEBop estimates (Table 2). eeMETRIC and SSEBop ET estimates were consistent at both the wildfire and reference plot levels, as was the dNBR index. In the reference plots, ET was reduced by 61.46% and 63.92% in the post-fire situation with respect to the pre-fire scenario according to eeMETRIC and SSEBop estimates, respectively (Table 2). ET was significantly affected by fire severity according to eeMETRIC (F > 431.35; p-value < 0.001) and SSEBop (F > 373.83; p-value < 0.001) post-fire and ratio metrics. The strongest relationships were seen between fire severity and eeMETRIC ET estimates, particularly for the post-fire metric. The dNBR index also showed significant differences between severity categories (F = 266.44; p-value < 0.001). Post-fire ET and post- to pre-fire ET ratio gradually significantly decreased (p-values < 0.05) from low- to high-fire-severity scenarios (Figure 2).
Table 2.
Summary of descriptive statistics for eeMETRIC and SSEBop ET estimates, as well as for the dNBR index, at both the wildfire and reference plot levels.
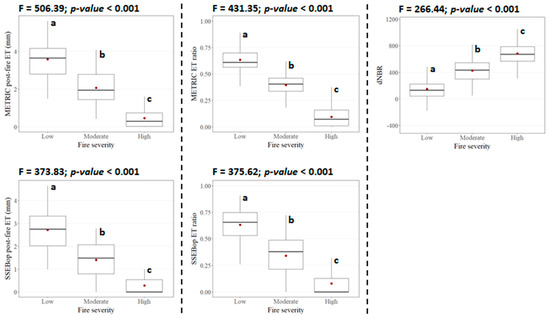
Figure 2.
Boxplots depicting the relationships between ET estimates and dNBR index, and fire severity. We also show one-way ANOVA results. Lowercase letters denote significant differences between fire severity categories at the 0.05 level.
eeMETRIC post-fire ET and the post- to pre-fire ET ratio featured a slightly higher accuracy (OA > 76.26% ± 2.19%; Kappa > 0.65 ± 0.02) than SSEBop metrics (OA > 74.09% ± 1.20%; Kappa > 0.61 ± 0.01) in predicting fire severity through RF classification models, though these differences had no statistical significance (Table 3). The accuracy of fire severity estimates using the dNBR index was rather low (OA = 63.95%; Kappa = 0.46), and it was significantly different from that of any ET-based estimate. Post-fire and ratio products had similar accuracy for eeMETRIC and SSEBop. For eeMETRIC products, the greatest confusion was observed between low and moderate fire severity categories, whereas the moderate fire severity category in SSEBop was misclassified more frequently into high fire severity. The latter category showed consistently high accuracy across all ET products (Table 3).
Table 3.
Accuracy metrics of fire severity RF classification through ET estimates and the dNBR index.
The spatial patterns of the classified fire severity maps are consistent with the performances of the individual ET and dNBR products. Maps derived from the ET metrics show lower noise from isolated pixels than dNBR maps for all wildfires (Figure 3). The high noise (i.e., granularity) in the dNBR maps is consistent with the high classification confusion between fire severity categories when using this product (Table 3). The area classified as high fire severity was larger in SSEBop than in eeMETRIC. In both ET products, the area classified as low fire severity was higher in the ratio than in the post-fire metric, especially for the Valdeorras and Figueruela wildfires (Figure 3).
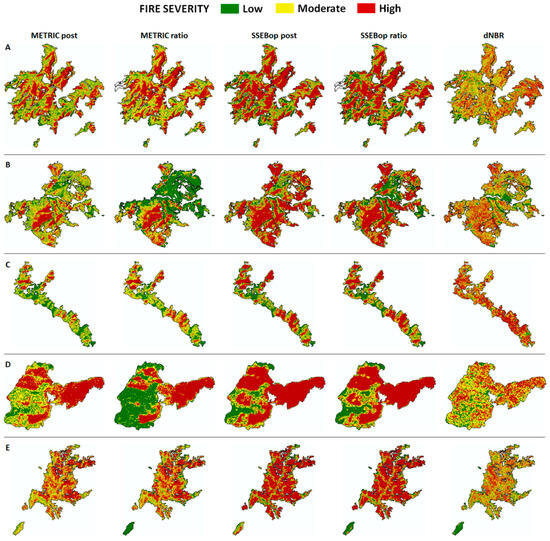
Figure 3.
Predicted fire severity categories through ET estimates and the dNBR index for Courel (A), Valdeorras (B), Valdueza (C), Figueruela (D) and Vila Real (E) wildfires.
4. Discussion
4.1. Question 1: How Did the Studied Wildfires Influence ET?
All of the studied wildfires resulted in a decrease in ET relative to the pre-fire situation immediately after the fire event, both at the wildfire level and the reference plot level. This finding aligns with prior research indicating that ET tends to decrease following a fire event (e.g., [43,47,49,52,54,92,93]) because of fire’s impacts on vegetation, microclimate, water infiltration and runoff processes [45,57,94,95]. While high-severity fires lead to the death of nearly all existing vegetation, low-severity fires result in minimal damage to aboveground vegetation. This reduction in the transpiration of leaf surface area increases bare ground cover, evaporation from soil, and surface runoff immediately after fire. High-severity fires may alter the equilibrium between evaporation and transpiration for extended periods, ranging from years to decades, as vegetation gradually regenerates following the fire [45,50,52,53,93,96,97]. In particular, our study observed an immediate post-fire decrease in daily ET that ranged between 61% and 74% depending on both the ET metric and study level (wildfire or plot), which agrees with the post-fire ET reduction reported by other studies: among others, Fernández-Manso et al. (2020) [53] reported an ET decrease of 75% after a large wildfire in Central Portugal; Mankin and Patel (2023) [52] observed an ET decrease of up to 63% in the four wildfires in South Central USA; and Ma et al. (2020) [50] found an ET reduction in the first year after fire of between 31% and 50% of pre-fire ET in the California’s Sierra Nevada (USA).
4.2. Question 2: Can the Selected ET Landsat-Based Models Estimate Fire Severity More Accurately Than a Standard Methodology Based on dNBR Spectral Index?
Our results confirm that the analyzed ET Landsat-based models can estimate fire severity more accurately than the standard methodology based on the dNBR spectral index (Kappa = 0.46). In particular, the most accurate estimation was based on eeMETRIC post-fire ET (Kappa = 0.67) followed by eeMETRIC post/pre-fire ET ratio (Kappa = 0.64). This result is consistent with previous research. Quintano et al. (2020) [54] used an RF multivariate model to estimate fire severity in Central Portugal (0.71 < Kappa < 0.79), with ET being ranked as one of the most important predictors, followed by char fraction. Fernández-Manso et al. (2020) [53] estimated fire severity from ET using a simple classifier based on thresholds in the Iberian Peninsula. The accuracy of fire severity estimates based on post-fire ET (Kappa = 0.63) was slightly lower than that of the dNBR-based estimate (Kappa = 0.66). The low mean accuracy value of our dNBR-based fire severity estimation is partly caused by the high diversity in the pre-fire vegetation types of the five studied wildfires. This low transferability across space and time has already been documented [98], and relative dNBR indexes have been proposed and shown higher performance [99,100]. The high confusion in the dNBR classification between fire severity categories, as has also previously been documented in relative indexes [101], may arise from signal saturation at high fire severities measured in the field [101,102], and the inability to resolve mixed spectral responses of partially scorched canopies using the limited spectral information inherent to spectral indexes’ formulation [103]. ET encompasses valuable information regarding changes in the energy/water balance caused by fire, so it holds physically meaningful connections to fire damage [47]. Using ET metrics (that have a physical base) instead of dNBR-based indexes adds a better interpretability of the ecosystem changes due to wildfires. To the best of our knowledge, there are no further studies that utilize ET as a variable to estimate fire severity. However, the accessibility of fine-scale Landsat-based ET data could potentially make it a suitable fire severity indicator in future research.
4.3. Question 3: To What Extent Do Uni- and Bi-Temporal Approaches, as Well as the Type of ET Model (eeMETRIC/SSEBop), Exert Influence on the above Two Questions?
The results based on the SSEBop simplified ET model follow generally the same trend as those based on the eeMETRIC ET model. Thus, our study validated the use of SSEBop as a useful indicator of fire severity. We did not observe a clear tendency when comparing uni- and bi-temporal approaches. Bi-temporal fire severity estimates based on the eeMETRIC ET displayed a lower accuracy than the uni-temporal one, whereas the reverse was observed using SSEBop ET, but these differences (mainly observed in the low and moderate fire severity categories) had no statistical significance. However, the uni-temporal approach seems to be more consistent among the five wildfires, probably due to the high dependence on pre-fire vegetation of the pre-fire ET data.
4.4. Concluding Remarks and Future Work
Most of the previous research examining the influence of fire on the surface energy balance fluxes relied on surface flux measurements obtained in the field [47,48,49,96]. However, their findings are applicable only at very local scales. Other studies have relied on temperature variables from satellites with coarse spatial resolutions, such as MODIS, and are only applicable at a global scale [43,104,105]. The arrival of finer-spatial-resolution ET products (based on Landsat thermal data) is making possible studies at local–regional scales with an appropriate accuracy [50,52,53,54,56,106,107,108]. Our study underscores the importance of fine-spatial-resolution ET products used to conduct environmental assessments at local to regional scales, including fire severity assessments. While this study serves as an initial introduction to the SSEBop ET model, showing its adequate performance in estimating fire severity in Mediterranean environments, our results suggest that fine-temporal-and-spatial-resolution ET products may play a pivotal role in addressing critical scientific questions in the current context of extreme wildfire events.
We demonstrated that eeMETRIC and SSEBop ET models could effectively discriminate, with low confusion, three fire severity levels involving initial assessments, considering both uni- and bi-temporal perspectives, as the most commonly used dNBR index does. ANOVA proved that both ET metrics and the dNBR index had different mean values for each fire severity level. However, the number of plots correctly classified was higher using ET metrics than the dNBR index, particularly in moderate and high categories. Unlike spectral indices, ET possesses a tangible physical significance, rendering it more straightforward to interpret. In this context, wildfires disrupt the energy and water balance in forest ecosystems by partially or totally removing the vegetation cover and altering the volume of stored water [109]. As a result of this disruption, the LST increases due to the removal of the cooling effect produced by vegetation cover [110], reductions in soil moisture decreases [111], and increases in soil erosion [112], which have important implications for surface hydrology [109,113]. Altogether, these changes imply a differential ET behavior as a function of vegetation consumption by fire, which explains the higher accuracy of fire severity estimates using a physical magnitude rather than a proxy for fire-induced changes, e.g., the dNBR. Consequently, the utilization of procedures that rely on fine-spatial-resolution ET data can potentially reduce the excessive dependence on spectral indices for assessing fire severity [114], overcoming their known shortcomings [115,116]. Our study has validated a novel methodology to estimate fire severity from fine-resolution ET METRIC models, in particular from the SSEBop ET model, which is similar to the eeMETRIC but has a less complex implementation and lower associated costs. In addition, it is owned by USGS and can be easily downloaded. However, it warrants further validation across a broader range of fire events. It is essential to verify the potential use of ET products as indicators of fire severity across different biomes other than Mediterranean, and distinct ecosystem types and fire regimes.
5. Conclusions
Spectral indexes are commonly used to map post-fire effects, and, in particular, fire severity. However, wildfires have a great impact on energy (water) balance as well. A physical energy-related variable such as ET has already proven its strong relationship to fire severity in different ecosystems around the world. Our study has verified the usefulness of two fine-resolution ET models (eeMETRIC and SSEBop) to estimate fire severity in five wildfires occurring in Mediterranean countries using an RF classifier. The accuracy of ET-based fire severity estimates (both from uni- and bi-temporal perspectives) (0.67 > Kappa > 0.60) was substantially higher than that of dNBR-based estimates (Kappa = 0.46). A clear advantage of these novel ET products versus the commonly used spectral indices is that, in addition to being useful fire severity indicators for extreme wildfires in Mediterranean countries, they may provide critical information about how the energy balance changes due to fire. The clear physical meaning of ET facilitates the understanding of its relationship to fire severity. This higher interpretability makes it easier to understand fire severity estimates for scientists and forest managers. Additionally, the proposed methodology could capitalize on the new missions that will offer high-resolution ET images on a global scale. Furthermore, ET-based fire severity estimates might be extended to fires occurring in different biomes and ecosystems because of their physical basis.
Author Contributions
Conceptualization, C.Q., A.F.-M., J.M.F.-G.; methodology, C.Q., A.F.-M., J.M.F.-G.; formal analysis, C.Q., A.F.-M., J.M.F.-G.; writing—original draft preparation, C.Q. and A.F.-M.; writing—review and editing, C.Q., A.F.-M., J.M.F.-G. and D.A.R.; supervision, D.A.R.; funding acquisition, C.Q., A.F.-M., J.M.F.-G. All authors have read and agreed to the published version of the manuscript.
Funding
This study was financially supported by the Spanish Ministry of Science and Innovation in the framework of the LANDSUSFIRE project (PID2022-139156OB-C21) within the National Program for the Promotion of Scientific–Technical Research (2021–2023); by the Regional Government of Castile and León in the framework of the WUIFIRECYL project (LE005P20); and by the Portuguese Foundation for Science and Technology in the frame of project UIDB/04033/2020. A. Fernández-Manso and C. Quintano were supported as research visitors at VIPER Lab. (University of California, Santa Barbara) by a Spanish Education Ministry grant (Salvador de Madariaga program, codes PRX22/00305 and PRX22/00307, respectively). José Manuel Fernández-Guisuraga was supported by a Ramón Areces Foundation postdoctoral fellowship.
Data Availability Statement
Data will be made available on request due to restrictions of privacy.
Acknowledgments
The authors thank the anonymous reviewers for their comments and suggestions, which have contributed to improve the quality of the manuscript.
Conflicts of Interest
The authors declare that they have no known competing financial interests or personal relationships that could have appeared to influence the work reported in this paper.
References
- Fernández-Guisuraga, J.M.; Calvo, L. Fuel build-up promotes an increase in fire severity of reburned areas in fire-prone ecosystems of the western Mediterranean Basin. Fire Ecol. 2023, 19, 72. [Google Scholar] [CrossRef]
- Koutsias, N.; Karamitsou, A.; Nioti, F.; Coutelieris, F. Assessment of Fire Regimes and Post-Fire Evolution of Burned Areas with the Dynamic Time Warping Method on Time Series of Satellite Images—Setting the Methodological Framework in the Peloponnese, Greece. Remote Sens. 2022, 14, 5237. [Google Scholar] [CrossRef]
- Moreira, F.; Ascoli, D.; Safford, H.; Adams, M.A.; Moreno, J.M.; Pereira, J.M.C.; Catry, F.X.; Armesto, J.; Bond, W.; González, M.E.; et al. Wildfire management in Mediterranean-type regions: Paradigm change needed. Environ. Res. Lett. 2020, 15, 11001. [Google Scholar] [CrossRef]
- Nolè, A.; Rita, A.; Spatola, M.F.; Borghetti, M. Biogeographic variability in wildfire severity and post-fire vegetation recovery across the European forests via remote sensing-derived spectral metrics. Sci. Total Environ. 2022, 823, 153807. [Google Scholar] [CrossRef] [PubMed]
- Pausas, J.; Llovet, J.; Rodrigo, A.; Vallejo, R. Are wildfires a disaster in the Mediterranean basin?—A review. Int. J. Wildland Fire 2008, 17, 713–723. [Google Scholar] [CrossRef]
- Girona-García, A.; Vieira, D.C.S.; Silva, J.; Fernández, C.; Robichaud, P.R.; Keizer, J.J. Effectiveness of post-fire soil erosion mitigation treatments: A systematic review and meta-analysis. Earth-Sci. Rev. 2021, 217, 103611. [Google Scholar] [CrossRef]
- Shakesby, R.A. Post-wildfire soil erosion in the Mediterranean: Review and future research directions. Earth-Sci. Rev. 2011, 105, 71–100. [Google Scholar] [CrossRef]
- Basso, M.; Mateus, M.; Ramos, T.B.; Vieira, D.C.S. Potential Post-Fire Impacts on a Water Supply Reservoir: An Integrated Watershed- Reservoir Approach. Front. Environ. Sci. 2021, 9, 684703. [Google Scholar] [CrossRef]
- Wang, J.; Stern, M.A.; King, V.M.; Alpers, C.N.; Quinn, N.W.T.; Flint, A.L.; Flint, L.E. PFHydro: A New Watershed-Scale Model for Post-Fire Runoff Simulation. Environ. Model. Softw. 2020, 123, 104555. [Google Scholar] [CrossRef]
- Keeley, J.E.; Bond, W.J.; Bradstock, R.A.; Pausas, J.G.; Rundel, P.W. Fire in Mediterranean Ecosystems: Ecology, Evolution and Management; Cambridge University Press: Cambridge, UK, 2011. [Google Scholar]
- Moreira, F.; Viedma, O.; Arianoutsou, M.; Curt, T.; Koutsias, N.; Rigolot, E.; Barbati, A.; Corona, P.; Vaz, P.; Xanthopoulos, G.; et al. Landscape e wildfire interactions in southern Europe: Implications for landscape management. J. Environ. Manag. 2011, 92, 2389–2402. [Google Scholar] [CrossRef]
- Huerta, S.; Marcos, E.; Fernández-García, V.; Calvo, L. Short-term effects of burn severity on ecosystem multifunctionality in the northwest Iberian Peninsula. Sci. Total Environ. 2022, 844, 157193. [Google Scholar] [CrossRef]
- Pausas, J.G.; Keeley, J.E. Wildfires and global change. Front. Ecol. Environ. 2021, 19, 387–395. [Google Scholar] [CrossRef]
- Barbero, R.; Abatzoglou, J.T.; Larkin, N.K.; Kolden, C.A.; Stocks, B. Climate change presents increased potential for very largefires in the contiguous United States. Int. J. Wildland Fires 2015, 24, 892–899. [Google Scholar] [CrossRef]
- Leblon, B.; San-Miguel-Ayanz, J.; Bourgeau-Chavez, L.; Kong, M. Remote sensing of wildfires. In Land Surface Remote Sensing: Environment and Risks; Elsevier: Amsterdam, The Netherlands, 2016; pp. 55–95. ISBN 978-1-78548-105-5. [Google Scholar]
- Espelta, J.M.; Barbati, A.; Quevedo, L.; Tárrega, R.; Navascués, P.; Bonfil, C.; Peguero, G.; Fernández-Martínez, M.; Rodrigo, A. Post-Fire Management of Mediterranean Broadleaved Forests. In Post-Fire Management and Restoration of Southern European Forests. Managing Forest Ecosystems; Moreira, F., Arianoutsou, M., Corona, P., De las Heras, J., Eds.; Springer: Dordrecht, The Netherlands, 2012; Volume 24. [Google Scholar]
- Cruz, M.G.; Alexander, M.E.; Wakimoto, R.H. Modeling the Likelihood of Crown Fire Occurrence in Conifer Forest Stands. For. Sci. 2004, 50, 640–658. [Google Scholar]
- Dimitrakopoulos, A.P.; Mitsopoulos, I.D.; Raptis, D.I. Nomographs for predicting crown fire initiation in Aleppo pine (Pinus halepensis Mill.) forests. Eur. J. For. Res. 2007, 126, 555–561. [Google Scholar] [CrossRef]
- Howe, A.A.; Parks, S.A.; Harvey, B.J.; Saberi, S.J.; Lutz, J.A.; Yocom, L.L. Comparing Sentinel-2 and Landsat 8 for Burn Severity Mapping in Western North America. Remote Sens. 2022, 14, 5249. [Google Scholar] [CrossRef]
- Fernández-Guisuraga, J.M.; Calvo, L.; Quintano, C.; Fernández-Manso, A.; Fernandes, P.M. Fractional vegetation cover ratio estimated from radiative transfer modeling outperforms spectral indices to assess fire severity in several Mediterranean plant communities. Remote Sens. Environ. 2023, 290, 113542. [Google Scholar] [CrossRef]
- Quintano, C.; Calvo, L.; Fernández-Manso, A.; Suárez-Seoane, S.; Fernandes, P.M.; Fernández-Guisuraga, J.M. First evaluation of fire severity retrieval from PRISMA hyperspectral data. Remote Sens. Environ. 2023, 295, 113670. [Google Scholar] [CrossRef]
- Key, C.H.; Benson, N.C. Landscape Assessment (LA) Sampling and Analysis Methods; USDA Forest Service General Technical Reports; Rocky Mountain Research Station: Fort Collins, CO, USA, 2006; RMRS-GTR-164-CD. [Google Scholar]
- Quintano, C.; Fernández-Manso, A.; Roberts, D.A. Multiple Endmember Spectral Mixture Analysis (MESMA) to map burn severity levels from Landsat images in Mediterranean countries. Remote Sens. Environ. 2013, 136, 76–88. [Google Scholar] [CrossRef]
- Fernández-Manso, A.; Fernández-Manso, O.; Quintano, C. SENTINEL-2A red-edge spectral indices suitability for discriminating burn severity. Int. J. Appl. Earth Observ. 2016, 50, 170–175. [Google Scholar] [CrossRef]
- Quintano, C.; Fernández-Manso, A.; Fernández-Manso, O. Combination of Landsat and Sentinel-2 MSI data for initial assessing of burn severity. Int. J. Appl. Earth Obs. Geoinf. 2018, 64, 221–224. [Google Scholar] [CrossRef]
- Chen, Y.; Lara, M.J.; Hu, F.S. A robust visible near-infrared index for fire severity mapping in Arctic tundra ecosystems. ISPRS J. Photogramm. Remote Sens. 2020, 159, 101–113. [Google Scholar] [CrossRef]
- Gibson, R.; Danaher, T.; Hehir, W.; Collins, L. A remote sensing approach to mapping fire severity in south-eastern Australia using sentinel 2 and random forest. Remote Sens. Environ. 2020, 240, 111702. [Google Scholar] [CrossRef]
- Yin, C.; He, B.; Yebra, M.; Quan, X.; Edwards, A.C.; Liu, X.; Liao, Z. Improving burn severity retrieval by integrating tree canopy cover into radiative transfer model simulation. Remote Sens. Environ. 2020, 236, 111454. [Google Scholar] [CrossRef]
- Tran, B.N.; Tanase, M.A.; Bennett, L.T.; Aponte, C. Evaluation of spectral indices for assessing fire severity in Australian temperate forests. Remote Sens. 2018, 10, 1680. [Google Scholar] [CrossRef]
- Gallagher, M.R.; Skowronski, N.S.; Lathrop, R.G.; McWilliams, T.; Green, E.J. An Improved Approach for Selecting and Validating Burn Severity Indices in Forested Landscapes. Can. J. Remote Sens. 2020, 46, 100–111. [Google Scholar] [CrossRef]
- Chen, D.; Fu, C.; Hall, J.V.; Hoy, E.E.; Loboda, T.V. Spatio-temporal patterns of optimal Landsat data for burn severity index calculations: Implications for high northern latitudes wildfire research. Remote Sens. Environ. 2021, 258, 112393. [Google Scholar] [CrossRef]
- Eidenshink, J.; Schwind, B.; Brewer, K.; Zhu, Z.L.; Quayle, B.; Howard, S. A Project for Monitoring Trends in Burn Severity. Fire Ecol. 2007, 3, 3–21. [Google Scholar] [CrossRef]
- Picotte, J.J.; Bhattarai, K.; Howard, D.; Lecker, J.; Epting, J.; Quayle, B.; Benson, N.; Nelson, K. Changes to the Monitoring Trends in Burn Severity program mapping production procedures and data products. Fire Ecol. 2020, 16, 16. [Google Scholar] [CrossRef]
- Belgiu, M.; Drăguţ, L. Random forest in remote sensing: A review of applications and future directions. ISPRS J. Photogramm. Remote Sens. 2016, 114, 24–31. [Google Scholar] [CrossRef]
- Breiman, L. Random forests. Mach. Learn. 2001, 45, 5–32. [Google Scholar] [CrossRef]
- Cutler, D.R.; Edwards, T.C.; Beard, K.H.; Cutler, A.; Hess, K.T.; Gibson, J.; Lawler, J.J. Random forests for classification in ecology. Ecology 2007, 88, 2783–2792. [Google Scholar] [CrossRef]
- Collins, L.; Griffioen, P.; Newell, G.; Mellor, A. The utility of Random Forests for wildfire severity mapping. Remote Sens. Environ. 2018, 216, 374–384. [Google Scholar] [CrossRef]
- Parks, S.A.; Holsinger, L.M.; Koontz, M.J.; Collins, L.; Whitman, E.; Parisien, M.-A.; Loehman, R.A.; Barnes, J.L.; Bourdon, J.-F.; Boucher, J.; et al. Giving ecological meaning to satellite-derived fire severity metrics across North American forests. Remote Sens. 2019, 11, 1735. [Google Scholar] [CrossRef]
- Wang, X.; Gao, X.; Zhang, Y.; Fei, X.; Chen, Z.; Wang, J.; Zhang, Y.; Lu, X.; Zhao, H. Land-cover classification of coastal wetlands using the RF algorithm for Worldview-2 and Landsat 8 images. Remote Sens. 2019, 11, 1927. [Google Scholar] [CrossRef]
- Collins, L.; McCarthy, G.; Mellor, A.; Newell, G.; Smith, L. Training data requirements for fire severity mapping using Landsat imagery and random forest. Remote Sens. Environ. 2020, 245, 111839. [Google Scholar] [CrossRef]
- Montorio, R.; Pérez-Cabello, F.; Borini-Alves, D.; García-Martín, A. Unitemporal approach to fire severity mapping using multispectral synthetic databases and Random Forests. Remote Sens. Environ. 2020, 249, 112025. [Google Scholar] [CrossRef]
- Randerson, J.T.; Liu, H.; Flanner, M.G.; Chambers, S.D.; Jin, Y.; Hess, P.G.; Pfister, G.; Mack, M.C.; Treseder, K.K.; Welp, L.R.; et al. The impact of boreal forest fire on climate warming. Science 2006, 314, 1130–1132. [Google Scholar] [CrossRef]
- Li, X.; Zhang, H.; Yang, G.; Ding, Y.; Zhao, J. Post-fire vegetation succession and surface energy fluxes derived from remote sensing. Remote Sens. 2018, 10, 1000. [Google Scholar] [CrossRef]
- Ivo, I.O.; Biudes, M.S.; Vourlitis, G.L.; Machado, N.G.; Martim, C.C. Effect of fires on biophysical parameters, energy balance and evapotranspiration in a protected area in the Brazilian Cerrado. Remote Sens. Appl. Soc. Environ. 2020, 19, 100342. [Google Scholar] [CrossRef]
- Poulos, H.M.; Barton, A.M.; Koch, G.W.; Kolb, T.E.; Thode, A.E. Wildfire severity and vegetation recovery drive post-fire evapotranspiration in a southwestern pine-oak forest, Arizona, USA. Remote Sens. Ecol. Conserv. 2021, 7, 579–591. [Google Scholar] [CrossRef]
- Lentile, L.; Holden, Z.; Smith, A.; Falkowski, M.; Hudak, A.; Morgan, P.; Lewis, S.; Gessler, P.; Benson, N. Remote sensing techniques to assess active fire characteristics and post-fire effects. Int. J. Wildland Fire 2006, 15, 319–345. [Google Scholar] [CrossRef]
- Rocha, A.V.; Shaver, G.R. Postfire energy exchange in arctic tundra: The importance and climatic implications of burn severity. Glob. Chang. Biol. 2011, 17, 2831–2841. [Google Scholar] [CrossRef]
- Clark, K.L.; Skowronski, N.; Gallagher, M.; Renninger, H.; Schäfer, K. Effects of invasive insects and fire on forest energy exchange and evapotranspiration in the New Jersey pinelands. For. Meteorol. 2012, 166, 50–61. [Google Scholar]
- Roche, J.W.; Goulden, M.L.; Bales, R.C. Estimating evapotranspiration change due to forest treatment and fire at the basin scale in the Sierra Nevada, California. Ecohydrology 2018, 11, e1978. [Google Scholar] [CrossRef]
- Ma, Q.; Bales, R.C.; Rungee, J.; Conklin, M.H.; Collins, B.M.; Goulden, M.L. Wildfire controls on evapotranspiration in California’s Sierra Nevada. J. Hydrol. 2020, 590, 125364. [Google Scholar] [CrossRef]
- Collar, N.M.; Saxe, S.; Rust, A.J.; Hogue, T.S. A CONUS-scale study of wildfire and evapotranspiration: Spatial and temporal response and controlling factors. J. Hydrol. 2021, 603, 127162. [Google Scholar] [CrossRef]
- Mankin, K.L.; Patel, R. Wildfire burn severity affects postfire shifts in evapotranspiration in subalpine forests. J. Nat. Resour. Agric. Ecosyst. 2023, 1, 1–11. [Google Scholar] [CrossRef]
- Fernández-Manso, A.; Quintano, C.; Roberts, D.A. Can Landsat-derived variables related to energy balance improve understanding of burn severity from current operational techniques? Remote Sens. 2020, 12, 890. [Google Scholar] [CrossRef]
- Quintano, C.; Fernández-Manso, A.; Roberts, D.A. Enhanced burn severity estimation using fine resolution ET and MESMA fraction images with machine learning algorithm. Remote Sens. Environ. 2020, 244, 111815. [Google Scholar] [CrossRef]
- Talsma, C.J.; Good, S.P.; Miralles, D.G.; Fisher, M.J.B.; Martens, B.; Jimenez, C.; Purdy, A.J. Sensitivity of Evapotranspiration Components in Remote Sensing-Based Models. Remote Sens. 2018, 10, 1601. [Google Scholar] [CrossRef]
- Sánchez, J.M.; Bisquert, M.; Rubio, E.; Caselles, V. Impact of land cover change induced by a fire event on the surface energy fluxes derived from remote sensing. Remote Sens. 2015, 7, 14899–14915. [Google Scholar] [CrossRef]
- Dore, S.; Kolb, T.E.; Montes-Helu, M.; Eckert, S.E.; Sullivan, B.W.; Hungate, B.A.; Kaye, J.P.; Hart, S.C.; Koch, G.W.; Finkral, A. Carbon and water fluxes from ponderosa pine forests disturbed by wildfire and thinning. Ecol. Appl. 2010, 20, 663–683. [Google Scholar] [CrossRef] [PubMed]
- Montes-Helu, M.C.; Kolb, T.; Dore, S.; Sullivan, B.; Hart, S.C.; Koch, G.; Hungate, B.A. Persistent effects of fire-induced vegetation change on energy partitioning and evapotranspiration in ponderosa pine forests. Agric. For. Meteorol. 2009, 149, 491–500. [Google Scholar] [CrossRef]
- Van der Tol, C.; Norberto-Parodi, G. Guidelines for remote sensing of evapotranspiration. In Evapotranspiration—Remote Sensing and Modeling; Irmak, A., Ed.; InTech: Rijeka, Croatia, 2011; pp. 227–250. [Google Scholar]
- de la Fuente-Sáiz, D.; Ortega-Far, S.; Fonseca, D.; Ortega-Salazar, S.; Kilic, A.; Allen, R. Calibration of METRIC model to estimate energy balance over a drip-irrigated apple orchard. Remote Sens. 2017, 9, 670. [Google Scholar] [CrossRef]
- Allen, R.G.; Tasumi, M.; Trezza, R. Satellite-based energy balance for mapping evapotranspiration with internalized calibration (METRIC)—Model. J. Irrig. Drain. Eng. 2007, 133, 380–394. [Google Scholar] [CrossRef]
- Allen, R.G.; Trezza, R.; Tasumi, M.; Robison, C.; Kjaersgaard, J.; Kilic, A. METRIC—Mapping Evapotranspiration at High Resolution Using Internalized Calibration—Applications Manual for Landsat Satellite Imagery; University of Idaho: Moscow, ID, USA, 2018; p. 187. [Google Scholar]
- Bastiaanssen, W.G.; Menenti, M.; Feddes, R.A.; Holtslag, A.A.M. A remote sensing surface energy balance algorithm for land (SEBAL). 1. Formulation. J. Hydrol. 1998, 212, 198–212. [Google Scholar] [CrossRef]
- Laipelt, L.; Kayser, R.H.B.; Fleischmann, A.S.; Ruhoff, A.; Bastiaanssen, W.; Erickson, T.A.; Melton, F. Long-term monitoring of evapotranspiration using the SEBAL algorithm and Google Earth Engine cloud computing. ISPRS J. Photogramm. Remote Sens. 2021, 178, 81–96. [Google Scholar] [CrossRef]
- Anderson, M.; Gao, F.; Knipper, K.; Hain, C.; Dulaney, W.; Baldocchi, D.; Eichelmann, E.; Hemes, K.; Yang, Y.; Medellin-Azuara, J.; et al. Field-scale assessment of land and water use change over the California Delta using remote sensing. Remote Sens. 2018, 10, 889. [Google Scholar] [CrossRef]
- Anderson, M.C.; Norman, J.M.; Mecikalski, J.R.; Otkin, J.A.; Kustas, W.P. A climatological study of evapotranspiration and moisture stress across the continental United States based on thermal remote sensing: 1. Model formulation. J. Geophys. Res. Atmos. 2007, 112. [Google Scholar] [CrossRef]
- Senay, G.B.; Bohms, S.; Singh, R.K.; Gowda, P.H.; Velpuri, N.M.; Alemu, H.; Verdin, J.P. Operational evapotranspiration mapping using remote sensing and weather datasets: A new parameterization for the SSEB approach. JAWRA J. Am. Water Resour. Assoc. 2013, 49, 577–591. [Google Scholar] [CrossRef]
- Senay, G.B. Satellite psychrometric formulation of the Operational Simplified Surface Energy Balance (SSEBop) model for quantifying and mapping evapotranspiration. Appl. Eng. Agric. 2018, 34, 555–566. [Google Scholar] [CrossRef]
- Senay, G.B.; Friedrichs, M.; Morton, C.; Parrish, G.E.; Schauer, M.; Khand, K.; Kagone, S.; Boiko, O.; Huntington, J. Mapping actual evapotranspiration using Landsat for the conterminous United States: Google Earth Engine implementation and assessment of the SSEBop model. Remote Sens. Environ. 2022, 275, 113011. [Google Scholar] [CrossRef]
- Fisher, J.B.; Tu, K.P.; Baldocchi, D.D. Global estimates of the land–atmosphere water flux based on monthly AVHRR and ISLSCP-II data, validated at 16 FLUXNET sites. Remote Sens. Environ. 2008, 112, 901–919. [Google Scholar] [CrossRef]
- Fisher, J.B.; Hook, R.; Allen, R.G.; Anderson, M.C.; French, A.N.; Hain, C.R.; Hulley, G.; Wood, E.F. The ECOsystem Spaceborne Thermal Radiometer Experiment on Space Station (ECOSTRESS): Science motivation. In Proceedings of the American Geophysical Union Fall Meeting, San Francisco, CA, USA, 15–19 December 2014. [Google Scholar]
- Fisher, J.B.; Melton, F.; Middleton, E.; Hain, C.; Anderson, M.; Allen, R.; McCabe, M.F.; Hook, S.; Baldocchi, D.; Townsend, P.A.; et al. The future of evapotranspiration: Global requirements for ecosystem functioning, carbon and climate feedbacks, agricultural management, and water resources. Water Resour. Res. 2017, 53, 2618–2626. [Google Scholar] [CrossRef]
- Pascolini-Campbell, M.; Lee, C.; Stavros, N.; Fisher, J.B. ECOSTRESS reveals pre-fire vegetation controls on burn severity for Southern California wildfires of 2020. Glob. Ecol. Biogeogr. 2022, 31, 1976–1989. [Google Scholar] [CrossRef]
- Baldocchi, D.; Falge, E.; Gu, L.; Olson, R.; Hollinger, D.; Running, S.; Anthoni, P.; Bernhofer, C.H.; Davis, K.; Evans, R.; et al. FLUXNET: A new tool to study the temporal and spatial variability of ecosystem-scale carbon dioxide, water vapor, and energy flux densities. Bull. Am. Meteorol. Soc. 2001, 82, 2415–2434. [Google Scholar] [CrossRef]
- Senay, G.B.; Budde, M.E.; Verdin, J.P. Enhancing the Simplified Surface Energy Balance (SSEB) approach for estimating landscape ET: Validation with the METRIC model. Agric. Water Manag. 2011, 98, 606–618. [Google Scholar] [CrossRef]
- Allen, R.; Morton, C.; Kamble, B.; Kilic, A.; Huntington, J.; Thau, D.; Gorelick, N.; Erickson, T.; Moore, R.; Trezza, R.; et al. EEFlux: A Landsat-based Evapotranspiration mapping tool on the Google Earth Engine. In Proceedings of the ASABE/IA Irrigation Symposium: Emerging Technologies for Sustainable Irrigation, Long Beach, CA, USA, 10–12 November 2015; ASABE: St. Joseph, MI, USA, 2015. [Google Scholar]
- Senay, G.B.; Kagone, S. Daily SSEBop Evapotranspiration: U. S. Geological Survey Data Release; U.S. Geological Survey: Reston, VA, USA, 2019.
- McShane, R.R.; Driscoll, K.P.; Roy, S. A Review of Surface Energy Balance Models for Estimating Actual Evapotranspiration with Remote Sensing at High Spatiotemporal Resolution over Large Extents; Scientific Investigations Report 2017–5087; U.S. Geological Survey: Reston, VA, USA, 2017.
- Irmak, A.; Allen, R.G.; Kjaersgaard, J.; Huntington, J.; Kamble, B.; Trezza, R.; Ratcliffe, I. Operational remote sensing of ET and challenges. In Evapotranspiration—Remote Sensing and Modeling; Irmak, A., Ed.; InTech: Rijeka, Croatia, 2011; p. 526. [Google Scholar]
- FAO. Remote Sensing Determination of Evapotranspiration—Algorithms, Strengths, Weaknesses, Uncertainty and Best Fit-Forpurpose; FAO: Cairo, Egypt, 2023. [Google Scholar]
- Savoca, M.E.; Senay, G.B.; Maupin, M.A.; Kenny, J.F.; Perry, C.A. Actual Evapotranspiration Modeling Using the Operational Simplified Surface Energy Balance (SSEBop) Approach; Scientific Investigations Report 2013–5126; U.S. Geological Survey: Reston, VA, USA, 2013.
- Senay, G.B.; Friedrichs, M.; Singh, R.K.; Velpuri, N.M. Evaluating Landsat 8 evapotranspiration for water use mapping in the Colorado River Basin. Remote Sens. Environ. 2016, 185, 171–185. [Google Scholar] [CrossRef]
- Singh, R.K.; Senay, G.B.; Velpuri, N.M.; Bohms, S.; Scott, R.L.; Verdin, J.P. Actual Evapotranspiration (Water Use) Assessment of the Colorado River Basin at the Landsat Resolution Using the Operational Simplified Surface Energy Balance Model. Remote Sens. 2014, 6, 233–256. [Google Scholar] [CrossRef]
- Congalton, R.G.; Green, K. Assessing the Accuracy of Remotely Sensed Data. In Principles and Practices, 2nd ed.; CRC Press: Boca Raton, FL, USA; Taylor & Francis: Abingdon, UK, 2009. [Google Scholar]
- Mather, P.; Tso, B. Classification Methods for Remotely Sensed Data; CRC Press: Boca Raton, FL, USA, 2016. [Google Scholar]
- Rodriguez-Galiano, V.F.; Ghimire, B.; Rogan, J.; Chica-Olmo, M.; Rigol-Sanchez, J.P. An assessment of the effectiveness of a random forest classifier for land-cover classification. ISPRS J. Photogramm. Remote Sens. 2012, 67, 93–104. [Google Scholar] [CrossRef]
- Probst, P.; Boulesteix, A.L. To tune or not to tune the number of trees in Random Forest. J. Mach. Learn. Res. 2018, 18, 1–18. [Google Scholar]
- R Core Team. R: A Language and Environment for Statistical Computing; R Foundation for Statistical Computing: Vienna, Austria, 2021. [Google Scholar]
- Liaw, A.; Wiener, M. Classification and regression by RandomForest. R News 2002, 2, 18–22. [Google Scholar]
- Kuhn, M. Caret: Classification and Regression Training. R Package Version 6.0-86. 2020. Available online: https://CRAN.R-project.org/package=caret (accessed on 11 July 2023).
- Hijmans, R. Raster: Geographic Data Analysis and Modeling. R Package Version 3.6-13. 2023. Available online: https://CRAN.R-project.org/package=raster (accessed on 11 July 2023).
- Atchley, A.L.; Kinoshita, A.M.; Lopez, S.R.; Trader, L.; Middleton, R. Simulating surface and subsurface water balance changes due to burn severity. Vadose Zone J. 2018, 17, 180099. [Google Scholar] [CrossRef]
- Roche, J.W.; Ma, Q.; Rungee, J.; Bales, R.C. Evapotranspiration Mapping for Forest Management in: California’s Sierra Nevada. Front. For. Glob. Change. 2020, 3, 69. [Google Scholar] [CrossRef]
- Poon, P.K.; Kinoshita, A.M. Spatial and temporal evapotranspiration trends after wildfire in semi-arid landscapes. J. Hydrol. 2018, 559, 71–83. [Google Scholar] [CrossRef]
- Wine, M.; Cadol, D. Hydrologic effects of large southwestern USA wildfires significantly increase regional water supply: Fact or fiction? Environ. Res. Lett. 2016, 11, 085006. [Google Scholar] [CrossRef]
- Nolan, R.H.; Lane, P.N.J.; Benyon, R.G.; Bradstock, R.A.; Mitchell, P.J. Changes in evapotranspiration following wildfire in resprouting eucalypt forests. Ecohydrology 2014, 7, 1363–1377. [Google Scholar] [CrossRef]
- Shrestha, S.; Williams, C.A.; Rogers, B.M.; Rogan, J.; Kulakowski, D. Wildfire controls on land surface properties in mixed conifer and ponderosa pine forests of Sierra Nevada and Klamath mountains, Western US. Agric. For. Meteorol. 2022, 320, 108939. [Google Scholar] [CrossRef]
- Miller, J.D.; Thode, A.E. Quantifying burn severity in a heterogeneous landscape with a relative version of the delta Normalized Burn Ratio (dNBR). Remote Sens. Environ. 2007, 109, 66–80. [Google Scholar] [CrossRef]
- Safford, H.D.; Miller, J.; Schmidt, D.; Roath, B.; Parsons, A. BAER soil burn severity maps do not measure fire effects to vegetation: A comment on Odion and Hanson (2006). Ecosystems 2008, 11, 1–11. [Google Scholar] [CrossRef]
- Collins, B.M.; Miller, J.D.; Thode, A.E.; Kelly, M.; van Wagtendonk, J.W.; Stephens, S.L. Interactions Among Wildland Fires in a Long-Established Sierra Nevada Natural Fire Area. Ecosystems 2009, 12, 114–128. [Google Scholar] [CrossRef]
- Soverel, N.O.; Perrakis, D.D.B.; Coops, N.C. Estimating burn severity from landsat dNBR and RdNBR indices across western Canada. Remote Sens. Environ. 2010, 114, 1896–1909. [Google Scholar] [CrossRef]
- Van Wagtendonk, J.W.; Root, R.R.; Key, C.H. Comparison of AVIRIS and landsat ETM+ detection capabilities for burn severity. Remote Sens. Environ. 2004, 92, 397–408. [Google Scholar] [CrossRef]
- Roy, D.P.; Boschetti, L.; Trigg, S.N. Remote sensing of fire severity: Assessing the performance of the normalized burn ratio. IEEE Geosci. Remote Sens. Lett. 2006, 3, 112–116. [Google Scholar] [CrossRef]
- Ha, W.; Kolb, T.E.; Springer, A.E.; Dore, S.; O’Donnell, F.C.; Martínez, R.; López, S.; Koch, G.W. Evapotranspiration comparisons between eddy covariance measurements and meteorological and remote-sensing-based models in disturbed ponderosa pine forests. Ecohydrology 2014, 8, 1335. [Google Scholar] [CrossRef]
- García-Llamas, P.; Suárez-Seoane, S.; Taboada, A.; Fernández-García, V.; Fernández-Guisuraga, J.M.; Fernández-Manso, A.; Quintano, C.; Marcos, E.; Calvo, L. Assessment of the influence of biophysical properties related to fuel conditions on fire severity using remote sensing techniques: A case study on a large fire in NW Spain. Int. J. Wildland Fire 2019, 28, 512–520. [Google Scholar] [CrossRef]
- Häusler, M.; Nunes, J.P.; Soares, P.; Sánchez, J.M.; Silva, J.M.N.; Warneke, T.; Keizer, J.J.; Pereira, J.M.C. Assessment of the indirect impact of wildfire (severity) on actual evapotranspiration in eucalyptus forest based on the surface energy balance estimated from remote-sensing techniques. Int. J. Remote Sens. 2018, 39, 6499–6524. [Google Scholar] [CrossRef]
- Collar, N.M.; Saxe, S.; Ebel, B.A.; Boden, K.S.; Rust, A.J.; Hogue, T.S. Linking fire-induced evapotranspiration shifts to streamflow magnitude and timing in the western United States. J. Hydrol. 2022, 612, 128242. [Google Scholar] [CrossRef]
- Wilder, B.A.; Kinoshita, A.M. Incorporating ECOSTRESS evapotranspiration in a paired catchment water balance analysis after the 2018 Holy Fire in California. Catena 2022, 215, 106300. [Google Scholar] [CrossRef]
- Pimentel, R.; Arheimer, B. Wildfire impact on Boreal hydrology: Empirical study of the Västmanland fire 2014 (Sweden). Hydrol. Earth Syst. Sci. Discuss. 2018, 1–26. [Google Scholar] [CrossRef]
- Quintano, C.; Fernández-Manso, A.; Calvo, E.; Marcos, L. Valbuena. Land surface temperature as potential indicator of burn severity in forest Mediterranean ecosystems. Int. J. Appl. Earth Obs. Geoinf. 2015, 36, 1–12. [Google Scholar]
- Van der Ent, R.J.; Wang-Erlandsson, L.; Keys, P.W.; Savenije, H.H.G. Contrasting roles of interception and transpiration in the hydrological cycle—Part 2: Moisture recycling. Earth Syst. Dynam. 2014, 5, 471–489. [Google Scholar] [CrossRef]
- Cerda, A.; Robichaud, P.R. Fire Effects on Soils and Restoration Strategies; CRC Press: Boca Ratón, FL, USA, 2009. [Google Scholar]
- Smith, H.G.; Sheridan, G.J.; Lane, P.N.J.; Nyman, P.; Haydon, S. Wildfire effects on water quality in forest catchments: A review with implications for water supply. J. Hydrol. 2011, 396, 170–192. [Google Scholar] [CrossRef]
- Morgan, P.; Keane, R.E.; Dillon, G.K.; Jain, T.B.; Hudak, A.T.; Karau, E.C.; Sikkink, P.G.; Holden, Z.A.; Strand, E.K. Challenges of assessing fire and burn severity using field measures, remote sensing and modelling. Int. J. Wildland Fire 2014, 23, 1045–1060. [Google Scholar] [CrossRef]
- Lentile, L.; Smith, A.; Hudak, A.; Morgan, P.; Bobbitt, M.; Lewis, S.; Robichaud, P. Remote sensing for prediction of 1-year post-fire ecosystem condition. Int. J. Wildland Fire 2009, 18, 594–608. [Google Scholar] [CrossRef]
- Lewis, S.A.; Hudak, A.T.; Robichaud, P.R.; Morgan, P.; Satterberg, K.L.; Strand, E.K.; Smith, A.M.S.; Zamudio, J.A.; Lentile, L.B. Indicators of burn severity at extended temporal scales: A decade of ecosystem response in mixed-conifer forests of western Montana. Int. J. Wildland Fire 2017, 26, 755–771. [Google Scholar] [CrossRef]
Disclaimer/Publisher’s Note: The statements, opinions and data contained in all publications are solely those of the individual author(s) and contributor(s) and not of MDPI and/or the editor(s). MDPI and/or the editor(s) disclaim responsibility for any injury to people or property resulting from any ideas, methods, instructions or products referred to in the content. |
© 2024 by the authors. Licensee MDPI, Basel, Switzerland. This article is an open access article distributed under the terms and conditions of the Creative Commons Attribution (CC BY) license (https://creativecommons.org/licenses/by/4.0/).