Communication

The Changes in Nighttime Lights Caused by the Turkey–Syria Earthquake Using NOAA-20 VIIRS Day/Night Band Data

1
Key Laboratory of Geographic Information Science, Ministry of Education, East China Normal University, Shanghai 200241, China
2
School of Geographic Sciences, East China Normal University, Shanghai 200241, China
3
Key Laboratory of Spatial Data Mining and Information Sharing of Ministry of Education, National & Local Joint Engineering Research Center of Satellite Geospatial Information Technology, Fuzhou University, Fuzhou 350002, China
4
The Academy of Digital China, Fuzhou University, Fuzhou 350002, China
5
Institute of Cartography and Geographic Information System, Chinese Academy of Surveying and Mapping, Beijing 100830, China
*
Author to whom correspondence should be addressed.
These authors contributed equally to this work.
Remote Sens. 2023, 15(13), 3438; https://doi.org/10.3390/rs15133438
Submission received: 23 May 2023 / Revised: 2 July 2023 / Accepted: 5 July 2023 / Published: 7 July 2023

Abstract

:
The Turkey–Syria earthquake on 6 February 2023 resulted in losses such as casualties, road damage, and building collapses. We mapped and quantified the areas impacted by the earthquake at different distances and directions using NOAA-20 VIIRS nighttime light (NTL) data. We then explored the relationship between the average changes in the NTL intensity, population density, and building density using the bivariate local indicators of the spatial association (LISA) method. In Turkey, Hatay, Gaziantep, and Sanliurfa experienced the largest NTL losses. Ar Raqqah was the most affected city in Syria, with the highest NTL loss rate. A correlation analysis showed that the number of injured populations in the provinces in Turkey and the number of pixels with a decreased NTL intensity exhibited a linear correlation, with an R-squared value of 0.7395. Based on the changing value of the NTL, the areas with large NTL losses were located 50 km from the earthquake epicentre in the east-by-south and north-by-west directions and 130 km from the earthquake epicentre in the southwest direction. The large NTL increase areas were distributed 130 km from the earthquake epicentre in the north-by-west and north-by-east directions and 180 km from the earthquake epicentre in the northeast direction, indicating a high resilience and effective earthquake rescue. The areas with large NTL losses had large populations and building densities, particularly in the areas approximately 130 km from the earthquake epicentre in the south-by-west direction and within 40 km of the earthquake epicentre in the north-by-west direction, which can be seen from the low–high (L-H) pattern of the LISA results. Our findings provide insights for evaluating natural disasters and can help decision makers to plan post-disaster reconstruction and determine risk levels on a national or regional scale.

Graphical Abstract

1. Introduction

Earthquakes can cause significant harm and have wide-ranging impacts, such as serious casualties and economic losses. On 6 February 2023, a 7.8 magnitude earthquake struck southeastern Turkey and northwestern Syria and was accompanied by numerous strong aftershocks [1]. The earthquake had a profound impact on the economy (approximately 191,800 buildings were damaged), livelihoods (approximately 3.2 million people were displaced), geopolitics, and other aspects [2]. After an earthquake, it is necessary to obtain disaster information in a timely manner and accurately assess the disaster losses. Several methods are used to evaluate the influence of earthquakes, such as recording by seismic instrumentation [3], statistics by relevant departments [2], and remote sensing [4,5,6]. However, the information recorded by instruments and statistics both have shortcomings, such as an untimely acquisition and incomplete coverage. Benefiting from its rapid data acquisition, wide coverage, and multiple time series, remote sensing has been used for many disasters [7,8,9,10] and is a reliable data source for post-earthquake analyses. Several satellites, such as SDGSAT-1 [4], Yangwang-1 [11], SNPP [6], Planet, and Maxar [5], captured day/night images of the damaged areas during the Turkey–Syria earthquake, providing opportunities to evaluate the economic losses based on these high-quality satellite images.
Nighttime light (NTL) data have been applied in urban spatial structure analyses [12,13,14,15], urban socioeconomic indicator estimations [16,17,18,19,20,21,22,23,24,25,26], and disaster monitoring [4,11,27,28,29,30,31,32,33,34], etc. [7,35,36,37,38,39,40,41,42,43,44]. They are an important data source for evaluating the losses and impact of earthquakes. Stable monthly and annual composite NTL data, such as DMSP-OLS annual composite data [32] and NPP-VIIRS annual or monthly composite data [28,45], can be used to reliably and effectively assess the long-term impacts of earthquakes. Several earthquake-related indicators, such as peak ground acceleration (PGA) [30,45] and post-earthquake nighttime light piecewise (PNLP) [29], have been proposed to describe the long-term changes in NTL intensity and analyse human activity after earthquakes. The relationship between NTL intensity and population or number of buildings was noticed in the early years [30], making it an essential and important analysis angle that could provide a solid and reliable basis for subsequent earthquake monitoring research. However, it is difficult to assess earthquake damage in real-time using monthly and annual composite NTL data. Daily NTL products can be acquired in near real time [27] and provide data support for rapid loss estimations and the distribution of rescue forces. For instance, after the Turkey–Syria earthquake, several NTL daily datasets, including SDGSAT-1 [4,6,11], NPP-VIIRS [6], and Yangwang-1 [11], were used to analyse the changes in the NTL at various scales and evaluate the earthquake based on the relationship between the NTL intensity reduction and earthquake-related indices. However, current rapid earthquake monitoring research is focused on the evaluation of NTL intensity reduction and lacks a relationship analysis between NTL decreases and population or building densities. In addition, existing earthquake-monitoring research does not consider that earthquakes have different effects on areas at different distances and directions from the epicentre, which was the focus of our analysis.
This study focused on the Turkey–Syria earthquake and used NOAA-20 VIIRS NTL daily data to study the spatial distribution pattern of the NTL changes in the earthquake-affected areas at different distances and directions. The bivariate local indicators of the spatial association (LISA) model were used to explore the relationship between NTL changes and population and building densities. The findings of this study can provide ideas for the rapid analysis and evaluation of natural disasters such as earthquakes.

2. Study Area and Data

2.1. Study Area

The study area has a population of more than 20 million people and spans southeastern Turkey and northwestern Syria [4]. It includes ten provincial administrative units in Turkey and five provincial administrative units in Syria (Figure 1). These units were close to the epicentre of the mainshock with a magnitude of 7.8 that occurred in the East Anatolian Fault Zone. Each region in the study area was affected by the earthquake, particularly Hatay, Kahramanmaraş, Aleppo, and Gaziantep [1,4,46].

2.2. Data

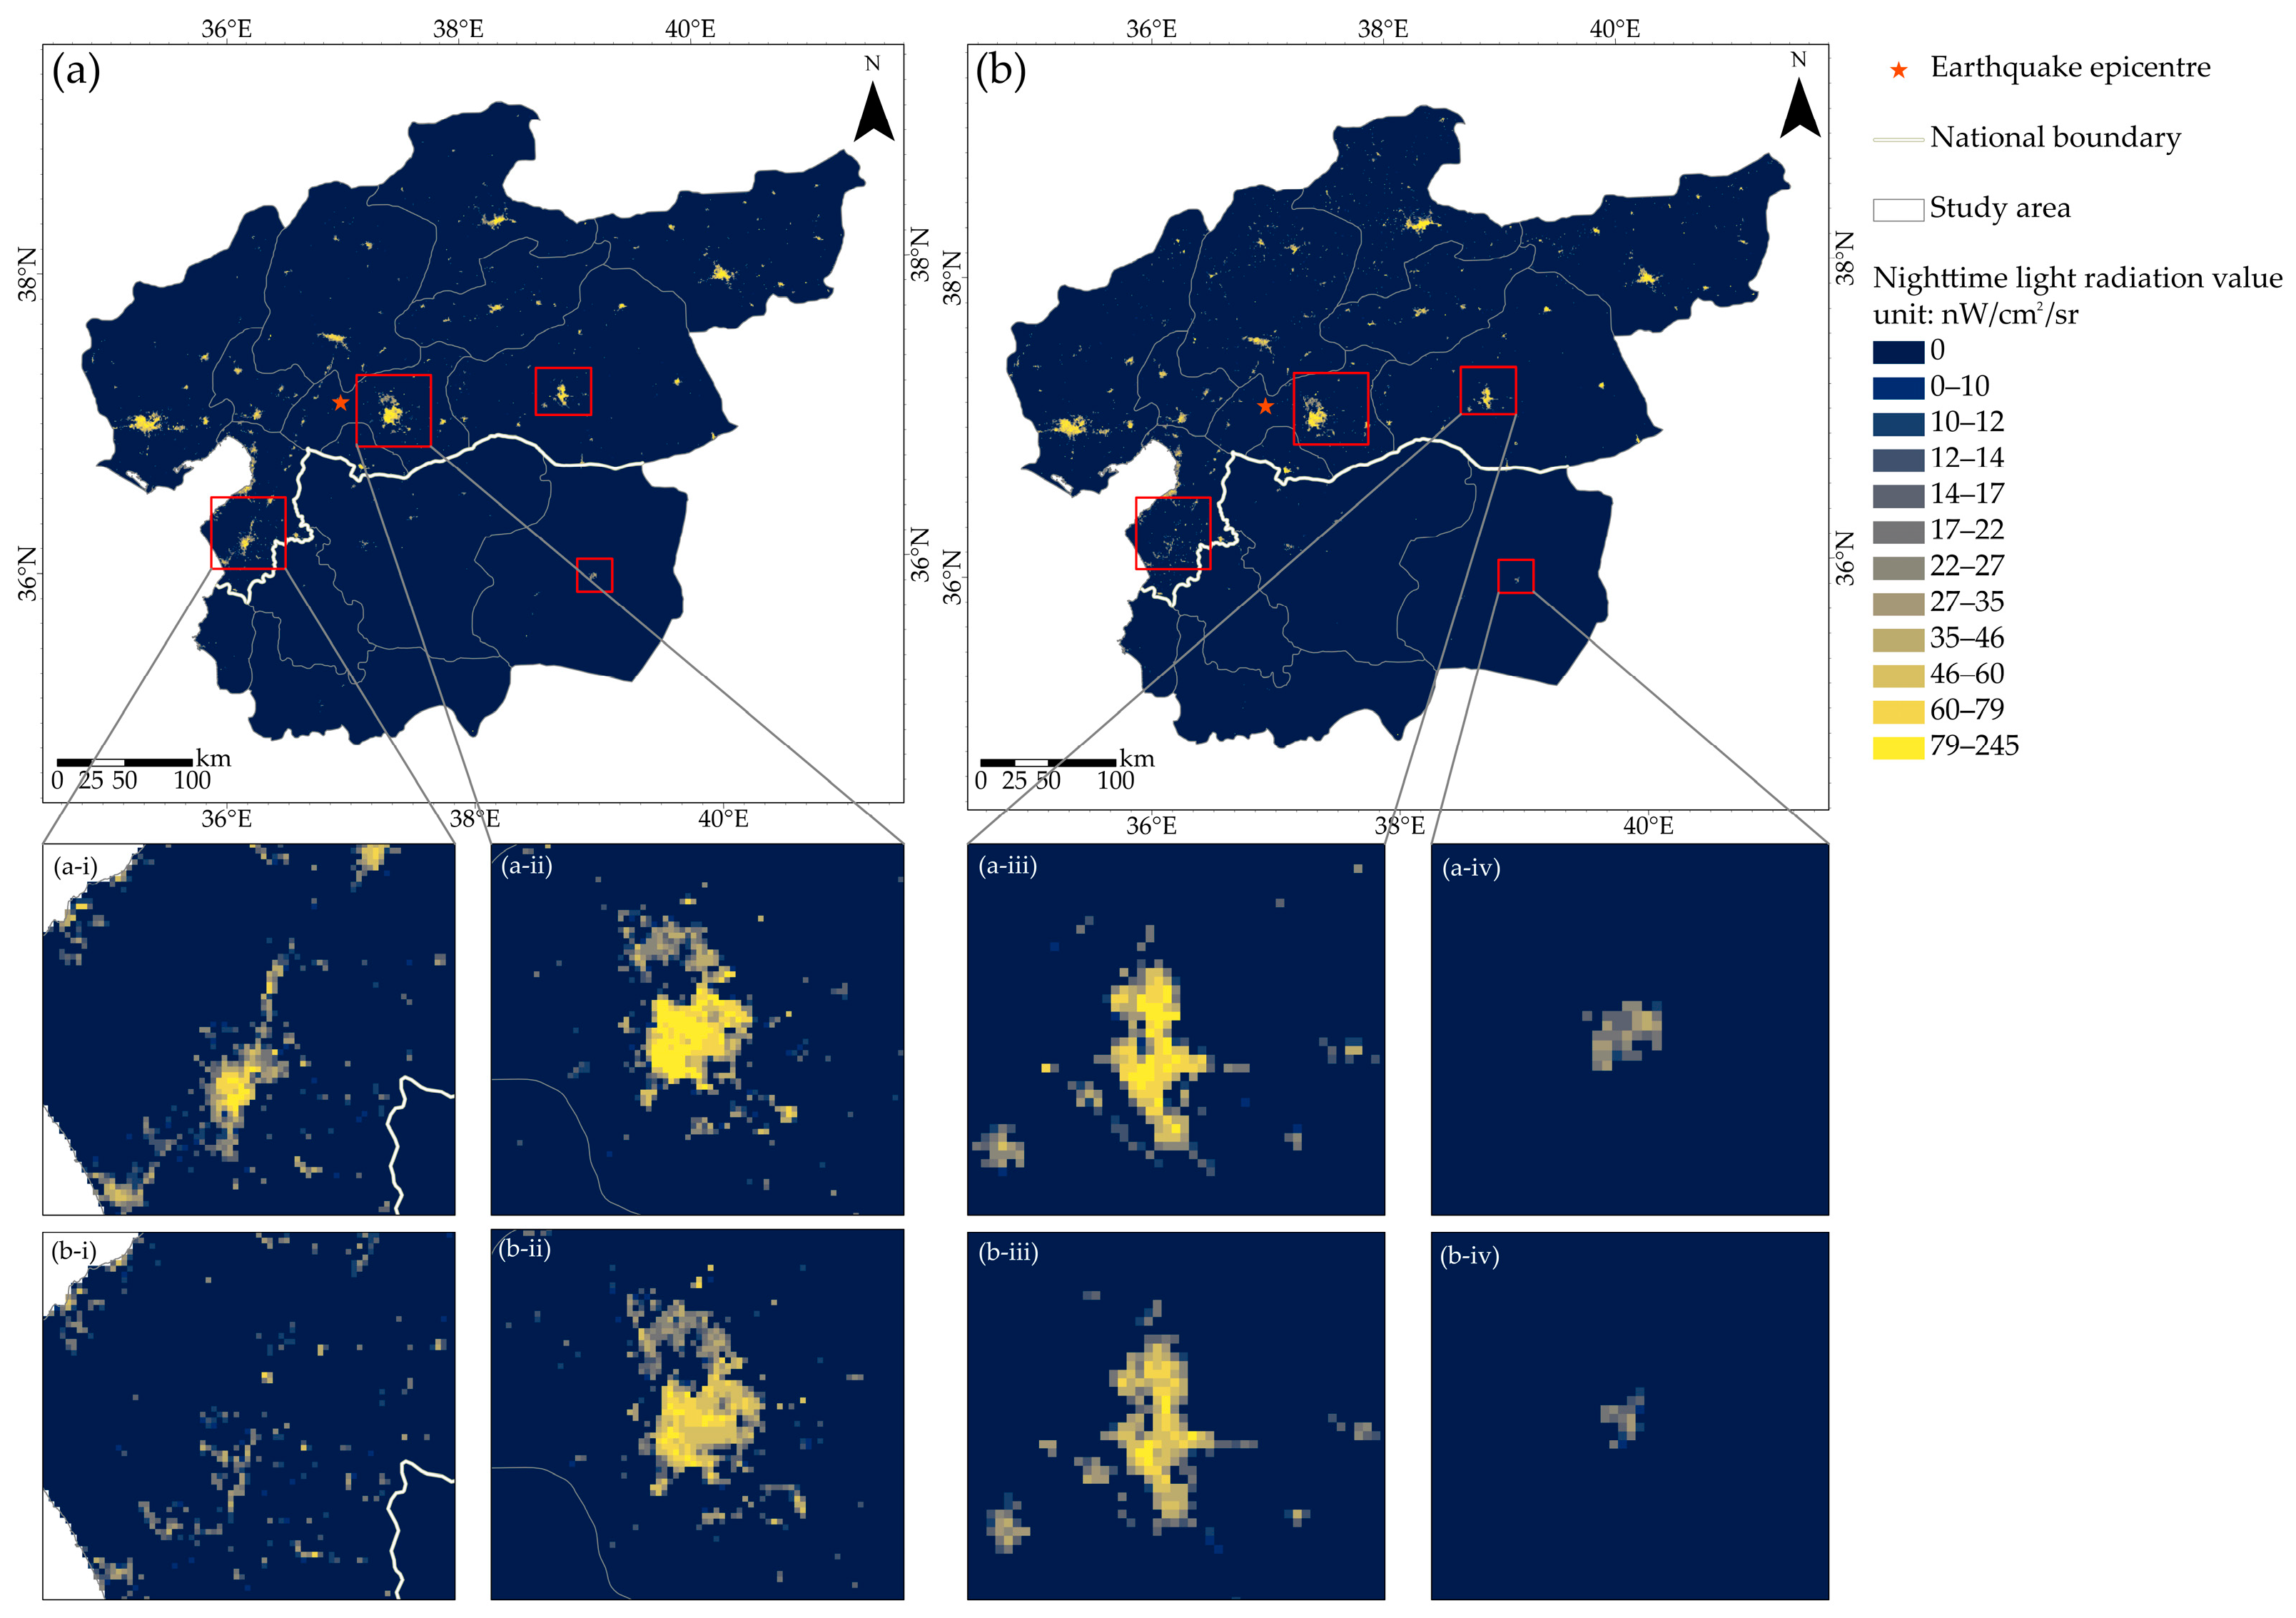
The NTL data for 31 December 2022 and 12 February 2023 were obtained from the National Oceanic and Atmospheric Administration (NOAA, https://www.avl.class.noaa.gov/saa/products/search?sub_id=0&datatype_family=VIIRS_SDR, accessed on 7 February 2023) (Figure 2). The NOAA-20 VIIRS day/night band data provided NTL daily data (nW/cm2/sr) at a spatial resolution of 750 m. The product was processed using radiometric calibration [47].
Snow cover was present in the northern part of the study area on 12 February 2023. To reduce the influence of this snow cover, we only analysed the changes in the NTL for the impervious surface [48]. The impervious surface data with a spatial resolution of 30 m were downloaded from Zenodo (https://zenodo.org/record/5220816; accessed on 6 March 2023).
The earthquake epicentre data were acquired from the US Geological Survey (USGS) [49] (https://earthquake.usgs.gov/earthquakes/eventpage/us6000jllz/executive, accessed on 6 March 2023). The population data for 2020 were acquired from the Global Human Settlements Layer (GHSL, https://ghsl.jrc.ec.europa.eu/download.php?ds=pop, accessed on 8 February 2023) with a spatial resolution of 100 m. The building outlines and administrative division data were downloaded from OpenStreetMap (http://download.geofabrik.de/europe/turkey.html and http://download.geofabrik.de/asia/syria.html, accessed on 28 February 2023). We used these building outline data to calculate the building density using the density analysis tool in ArcGIS. The injured population data were downloaded from reliefweb [1] (https://reliefweb.int/report/turkiye/turkiye-earthquake-february-2023-bi-weekly-highlights-03032023, accessed on 5 June 2023) and used to correlate with the number of pixels with a decreased NTL intensity.
All the spatial data in this study were projected to the Albers Conical Equal Area projection.

3. Methods

3.1. NTL Changes at Different Scales

The changes in the NTL intensity before and after the earthquake were measured at three different scales: provincial, county, and pixel. The NTL change rate and values were calculated using the following formula:
N C R = N C V N T L b e f o r e = N T L a f t e r N T L b e f o r e N T L b e f o r e ,
where N C R and N C V represent the NTL change rate and value, respectively. NTLbefore represents the total radiation value of the NTL before the earthquake (NTL intensity on 31 December 2022) and NTLafter represents the total radiation value of the NTL after the earthquake (NTL intensity on 12 February 2023).
In addition, to ensure that the NTL changing values were statistically significant, this study was tested for significance using the KS-test.

3.2. Changes in NTL Intensity for Different Directions and Distances

To investigate the changes in the NTL intensity at different distances and directions from the earthquake epicentre, a multilevel buffer was used for different directions. The epicentre of the earthquake was located at the centre of this buffer. A multilevel buffer zone was created at a distance of 10 km; thus, the buffer zone covered an area 400 km from the epicentre. The buffer zone was divided evenly into eight directions: north-by-east (0–45°), east-by-north (45–90°), east-by-south (90–135°), south-by-east (135–180°), south-by-west (180–225°), west-by-south (225–270°), west-by-north (270–315°), and north-by-west (315–360°). In each buffer zone, we calculated the average change in the NTL intensity to evaluate the degree of the NTL loss caused by the earthquake.
Earthquakes are often accompanied by casualties and building collapses. To explore the relationship between the NTL changes and the population and building densities, we calculated the population and building densities in each buffer zone. To compare the change in the NTL intensity with the population and building densities on the same scale, we normalised the three variables using the following formula:
N I = x X m i n X m a x X m i n ,
where, for the NTL changes, N I represents the normalised index of the average NTL changing value and x represents the average changing value of the NTL intensity in each buffer. X m a x and X m i n are the maximum and minimum values of the average NTL changing value in all the buffers, separately. For the population, N I represents the normalised index of the average population density and x represents the average value of the population density in each buffer. X m a x and X m i n are the maximum and minimum values of the average population density in all the buffers, separately. For the building density, N I represents the normalised index of the average building density and x represents the average value of the building density. X m a x and X m i n are the maximum and minimum values of the average building density in all the buffers, separately.

3.3. Spatial Correlation between NTL Changes and Population Density or Building Density

We calculated the bivariate LISA to explore the spatial correlation or dependence between the NTL changes and population or building density. LISA reflects the spatial correlation between the spatial distribution of different variables and is based on Moran’s I. The binary local Moran’s I can be defined by the following formula [50]:
I k l = Z k i j = 1 n W i j Z l j
where k is the NTL change value and l is the population or building density. Z k i = X k i X K ¯ σ k , Z l j = X l j X l ¯ σ l , where X k i and X l j are the values of variables k and l at locators i and j . X K ¯ and X l ¯ are the mean values of variables k and l . σ k and σ l are the variances of X for variables k and l . W i j is the spatial weight matrix; in this study, it represents the distance-based weight between locations i and j .
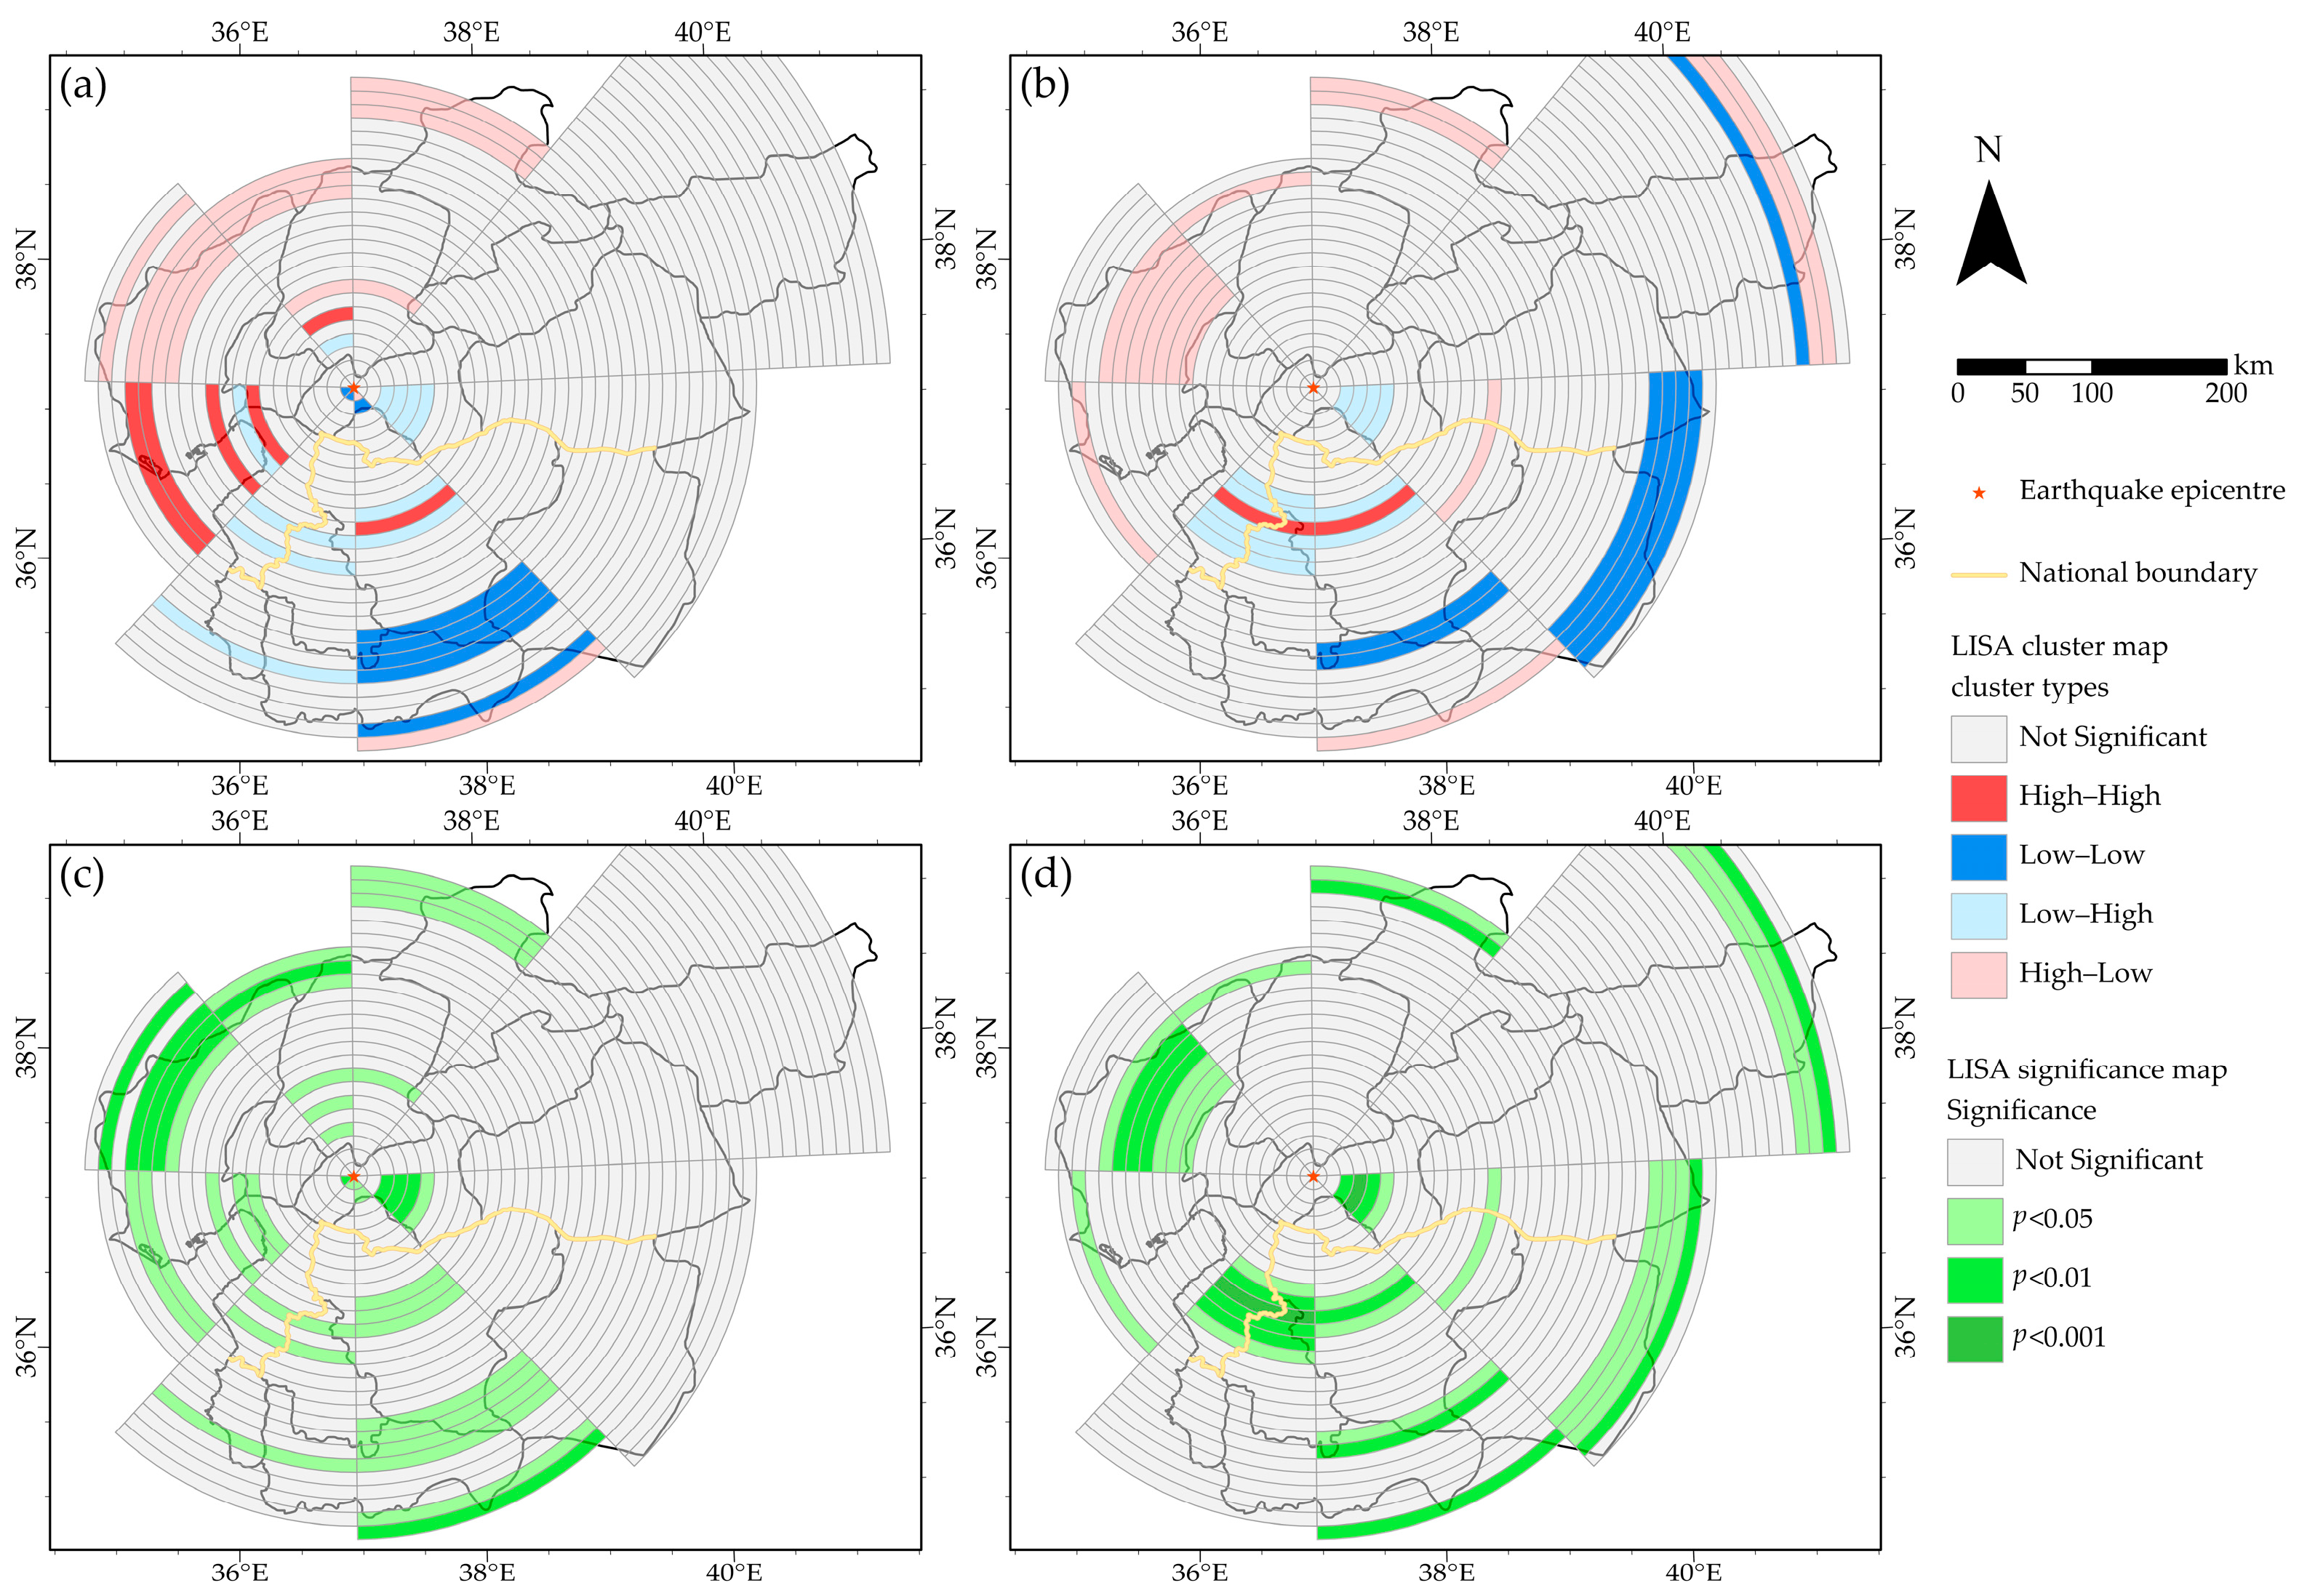
GeoDa (http://geodacenter.github.io/, accessed on 27 February 2023) was used to calculate the bivariate Moran’s I. The LISA cluster results can be divided into five categories: high–high (H–H), high–low (H–L), low–high (L–H), low–low (L–L), and insignificant. H–H corresponds to a high population or building density when the NTL intensity increases. H–L represents a relatively low population or building density when the NTL intensity increases. L–H represents a large population or building density when the NTL intensity is reduced, and L–L represents a relatively low population or building density when the NTL decreases.

4. Results

4.1. NTL Changes at Different Scales

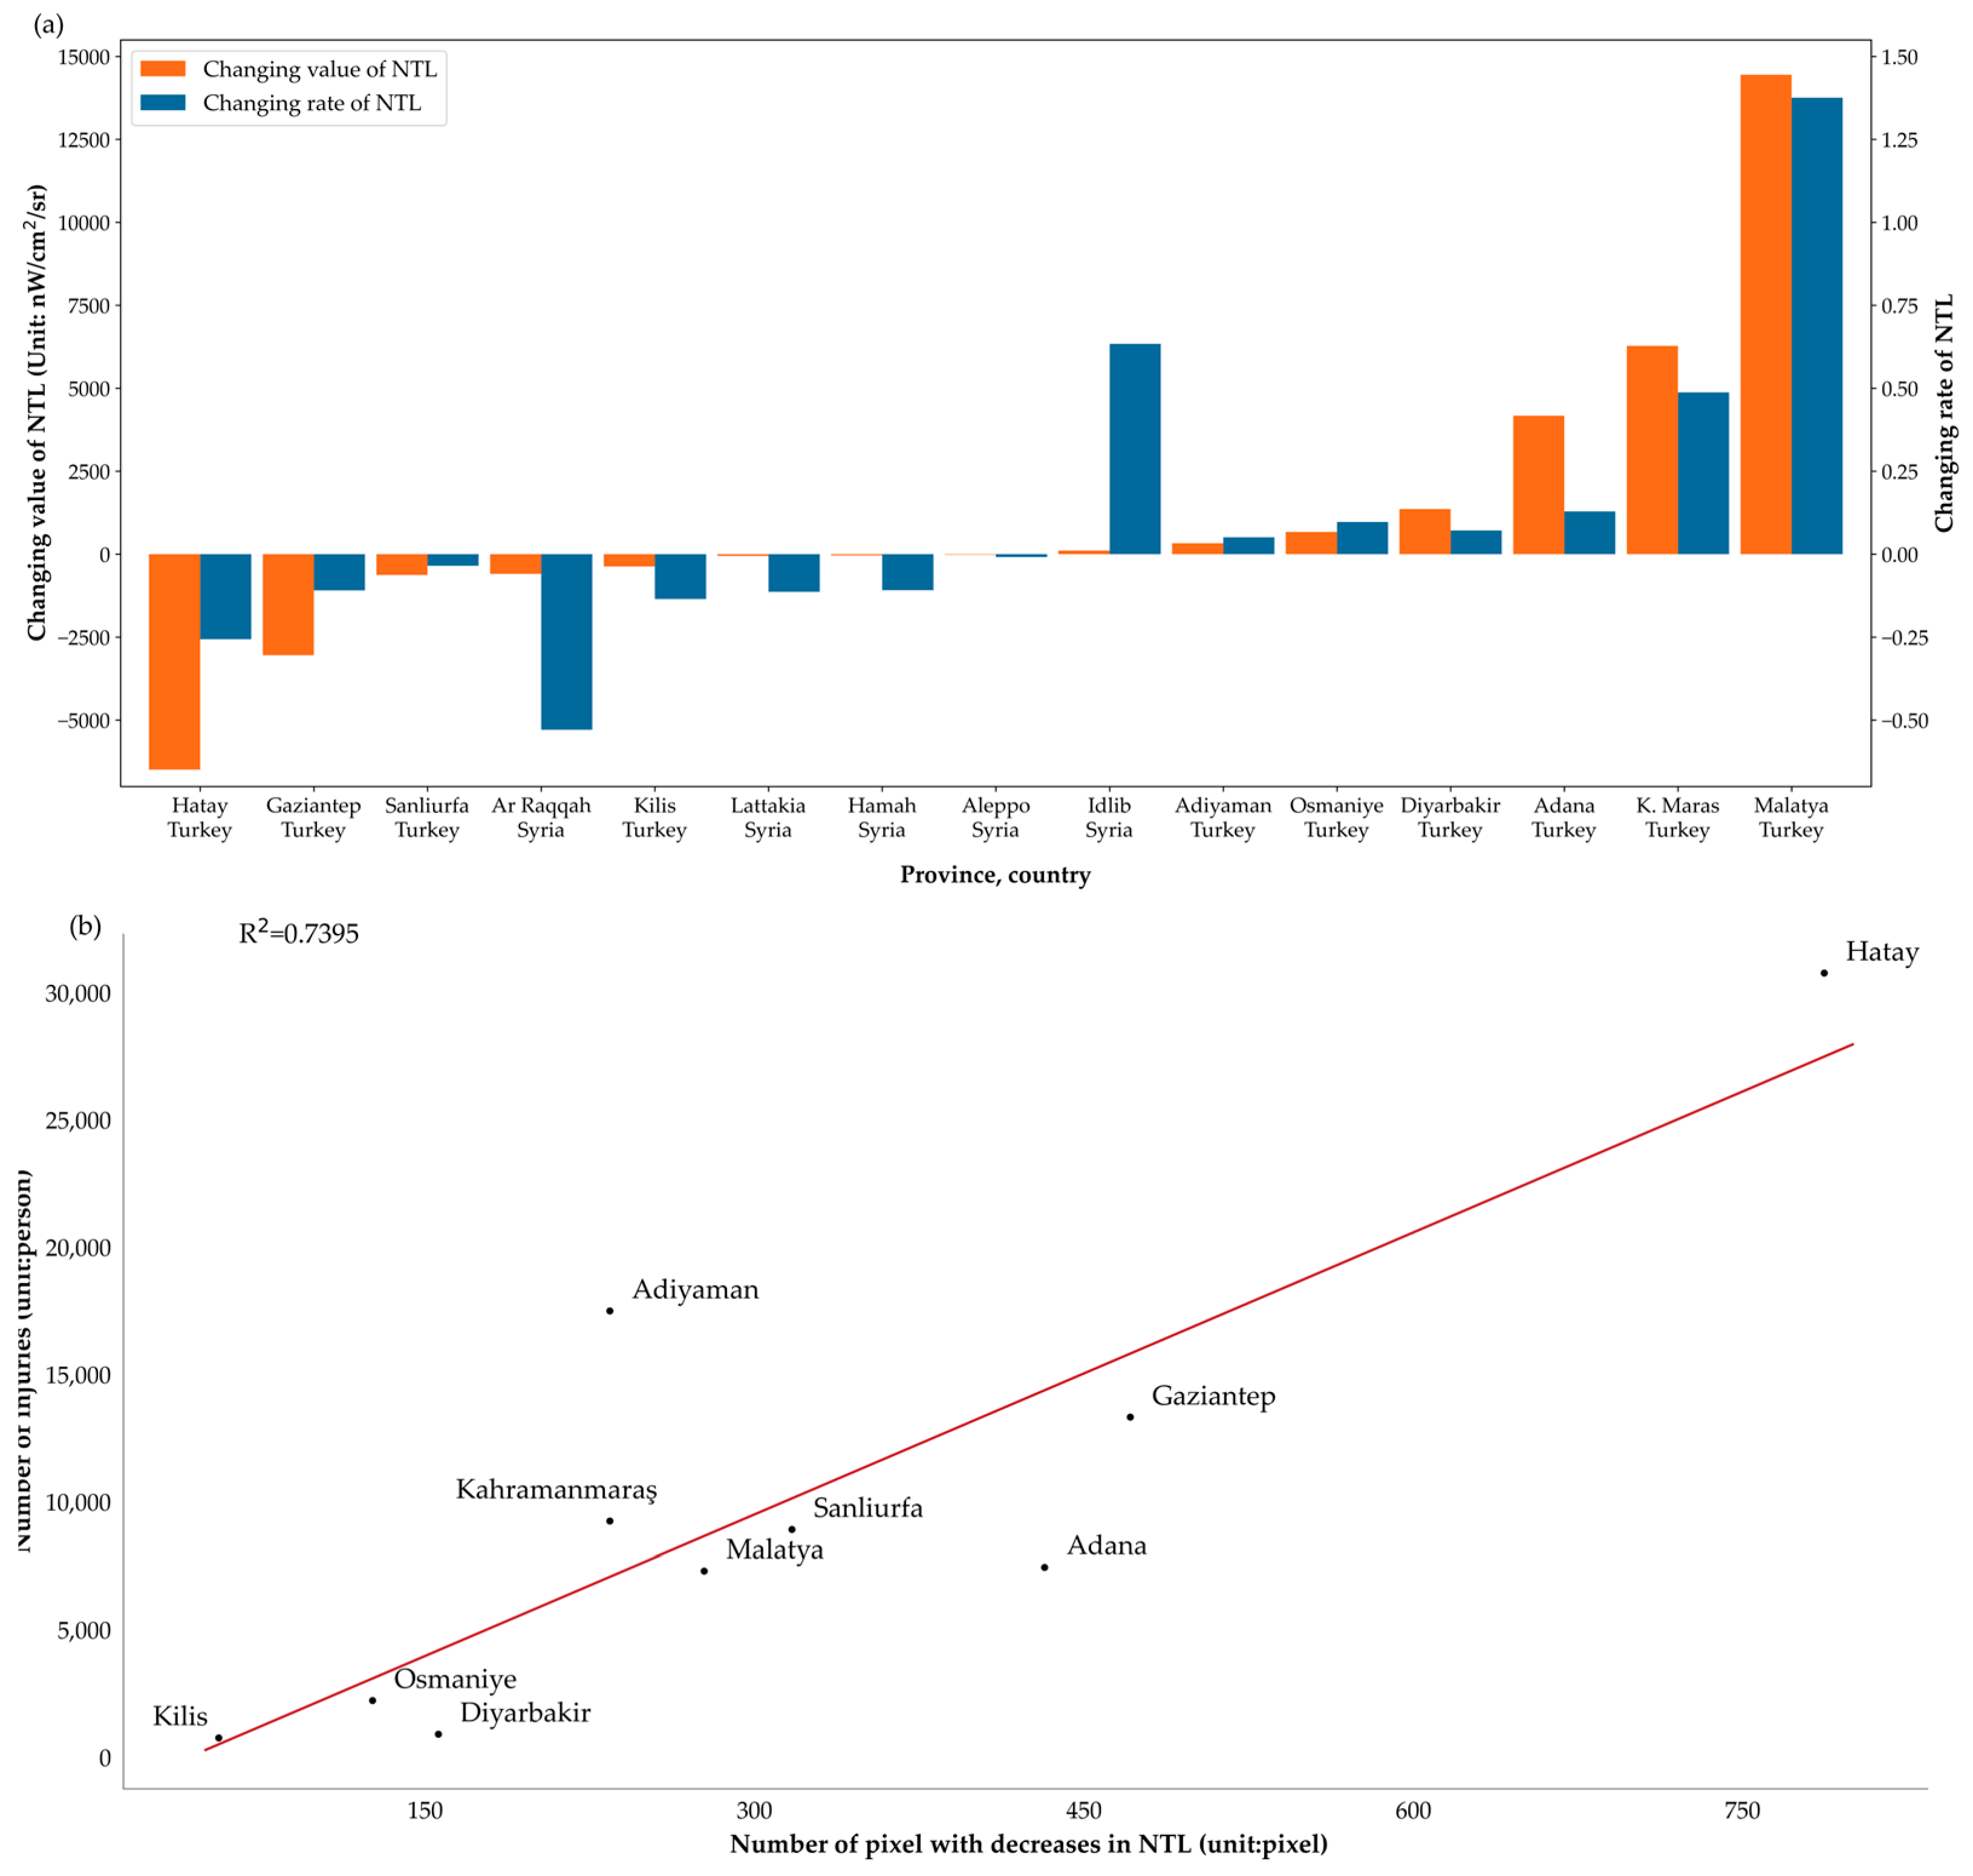
The results of the significance test showed that p was less than 0.01 and the value of the NTL change was statistically significant. The changes in the NTL intensity at the provincial level are shown in Figure 3a. The top five provinces with decreasing NTLs were Hatay, Gaziantep, Sanliurfa, Ar Raqqah, and Kilis, with NTL decreases of 6491, 3044, 625, 592, and 374 nW/cm2/sr, and decrease rates of 25.6%, 10.9%, 3.5%, 52.9%, and 13.5%, respectively. Affected by many factors, such as war [51], the changes in the NTL intensity before the earthquake in Syria were lower than those in Turkey. As a result, the changes in the NTL intensity in the provinces of Syria were also lower, with a change in value ranging from −592 to 108 nW/cm2/sr. Ar Raqqah had a higher rate of decrease compared to Hatay, with a decreasing rate of 52.9%. The rate of decrease in Lattakia (11.3%) was higher than that in Gaziantep (10.9%). Seven provinces (Malatya, Kahramanmaraş, Adana, Diyarbakir, Osmaniye, Adiyaman, and Idlib) showed an increasing NTL intensity. There were two reasons for this: (1) the impact of the earthquake was not as serious [2] and (2) rescue forces were distributed in these places [52,53,54].
At the provincial level, the decrease in the NTL intensity was closely related to earthquake disasters. The number of injured populations [55] in the Turkish provinces and number of pixels with a decreased NTL intensity exhibited a linear correlation, with an R-squared value of 0.7395 (Figure 3b), indicating that the decrease in the NTL could reflect the loss of earthquakes.
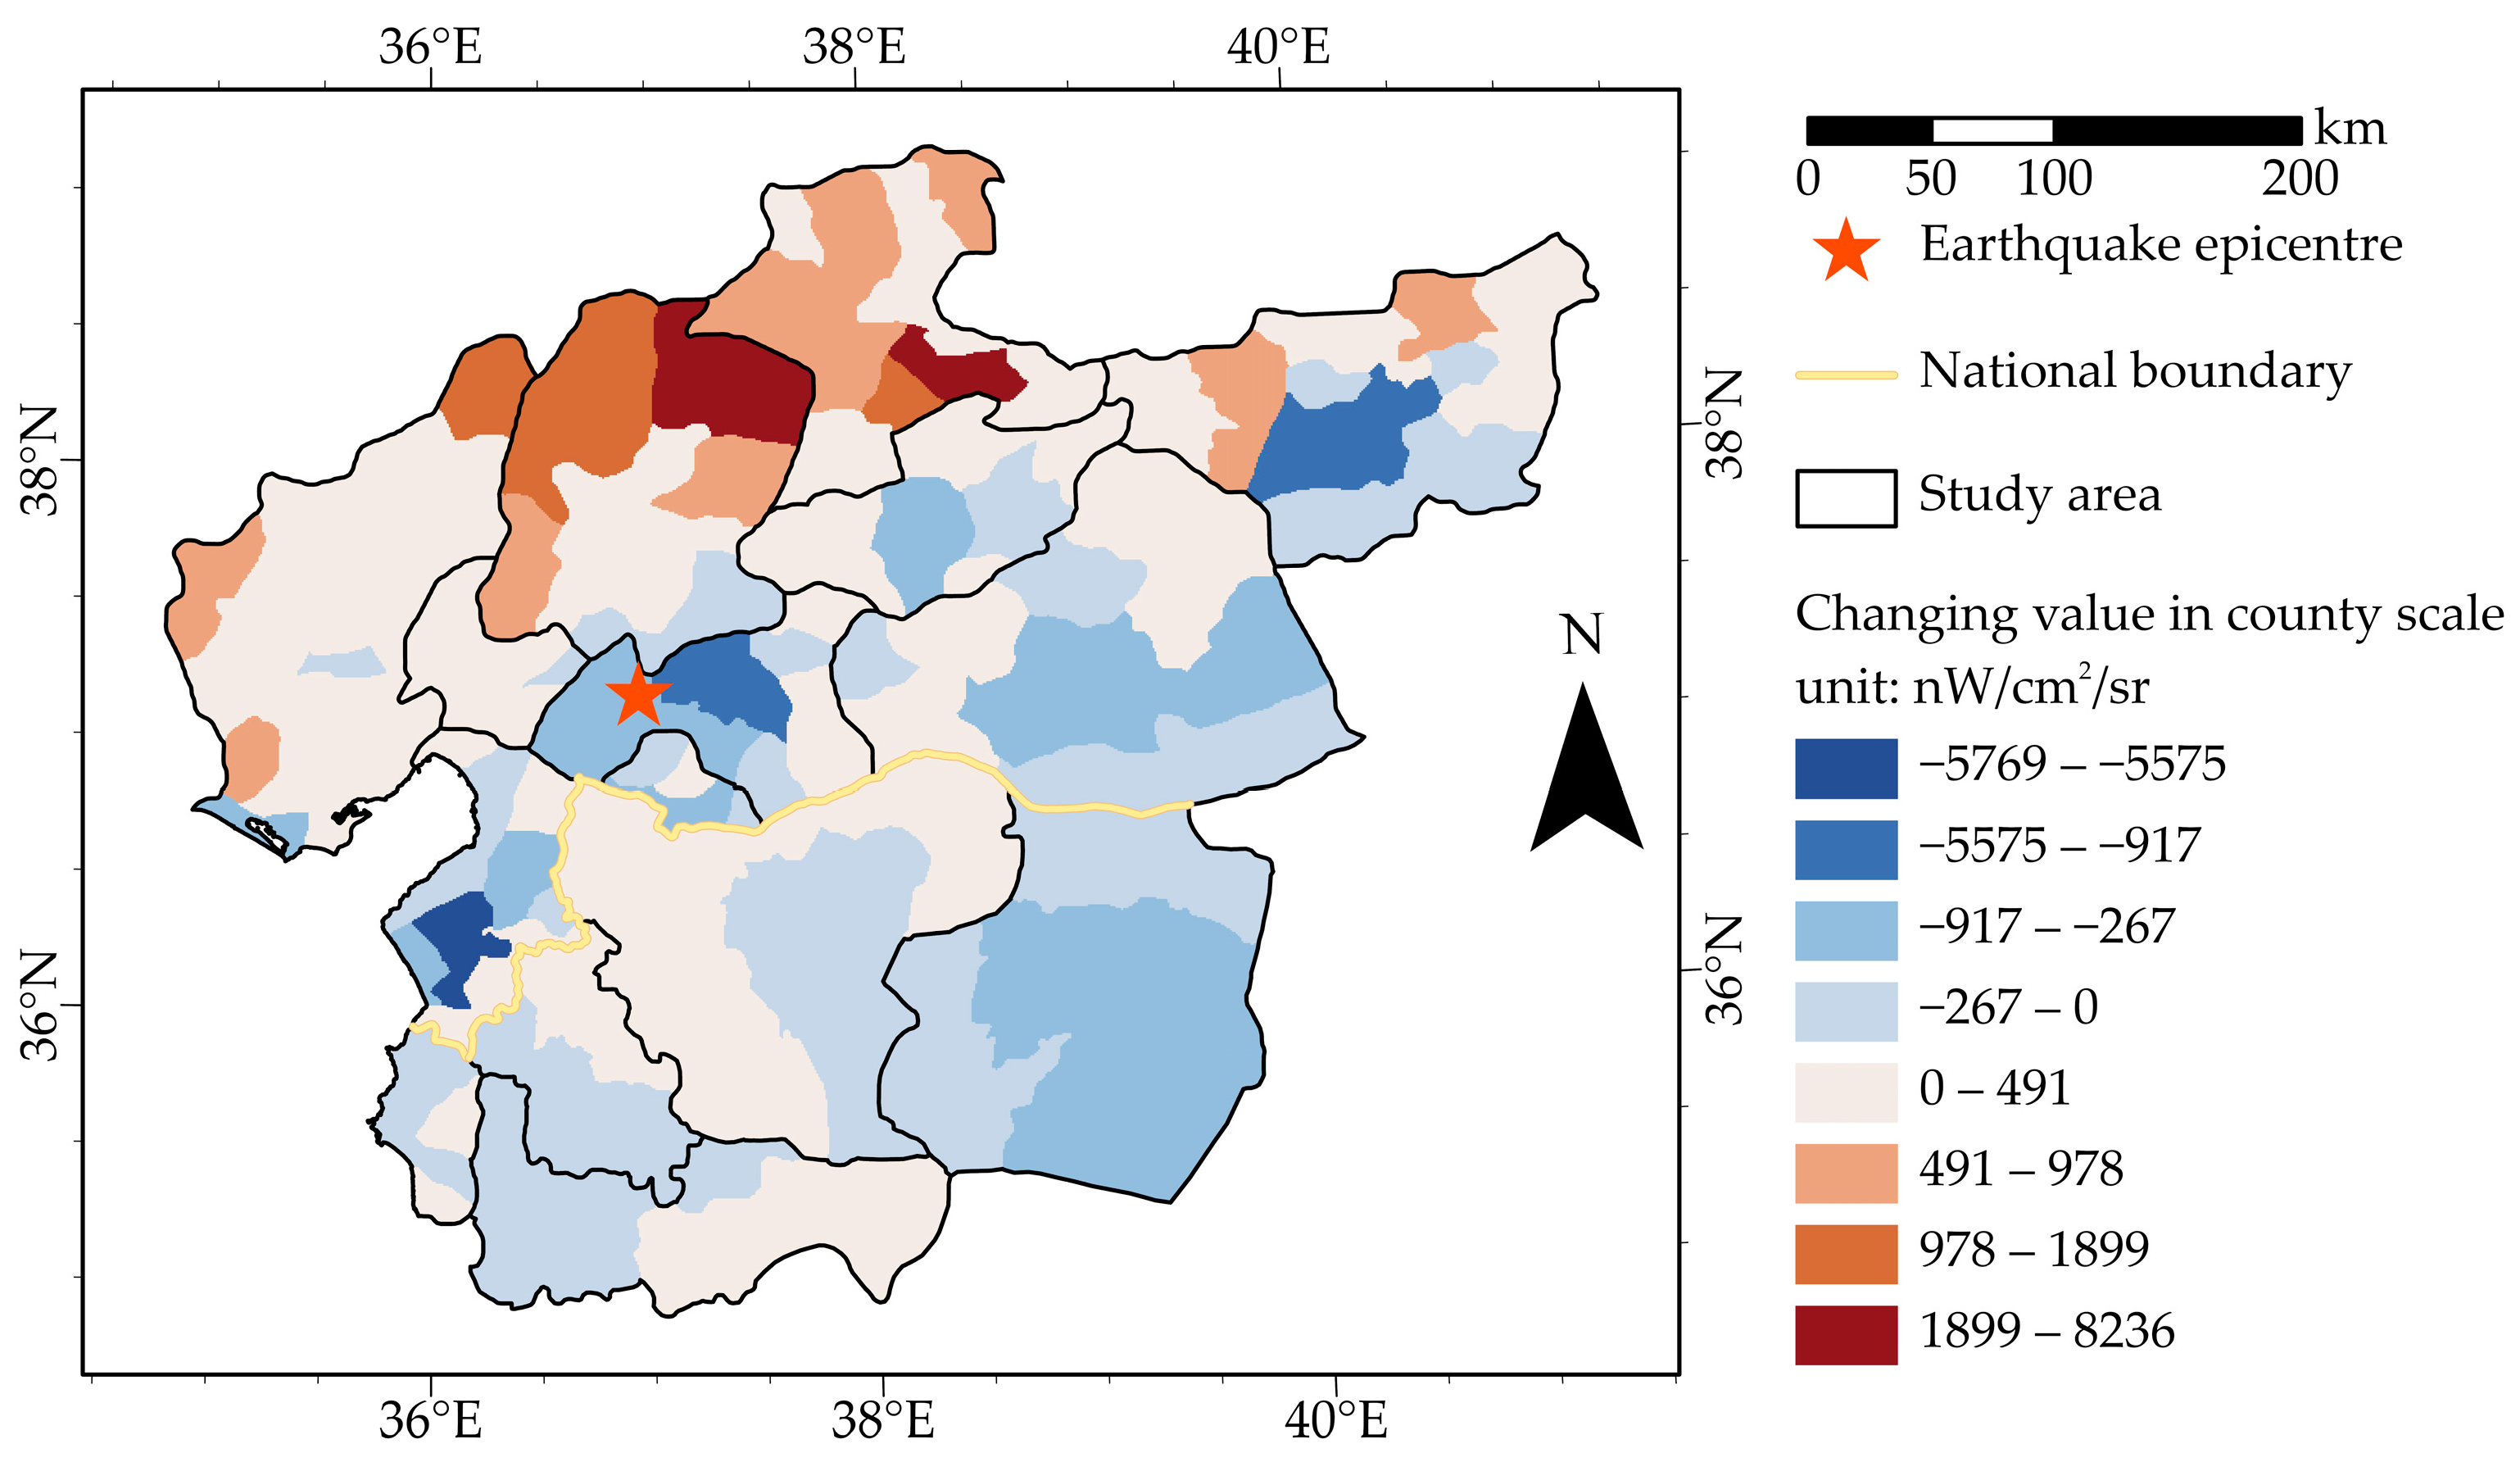
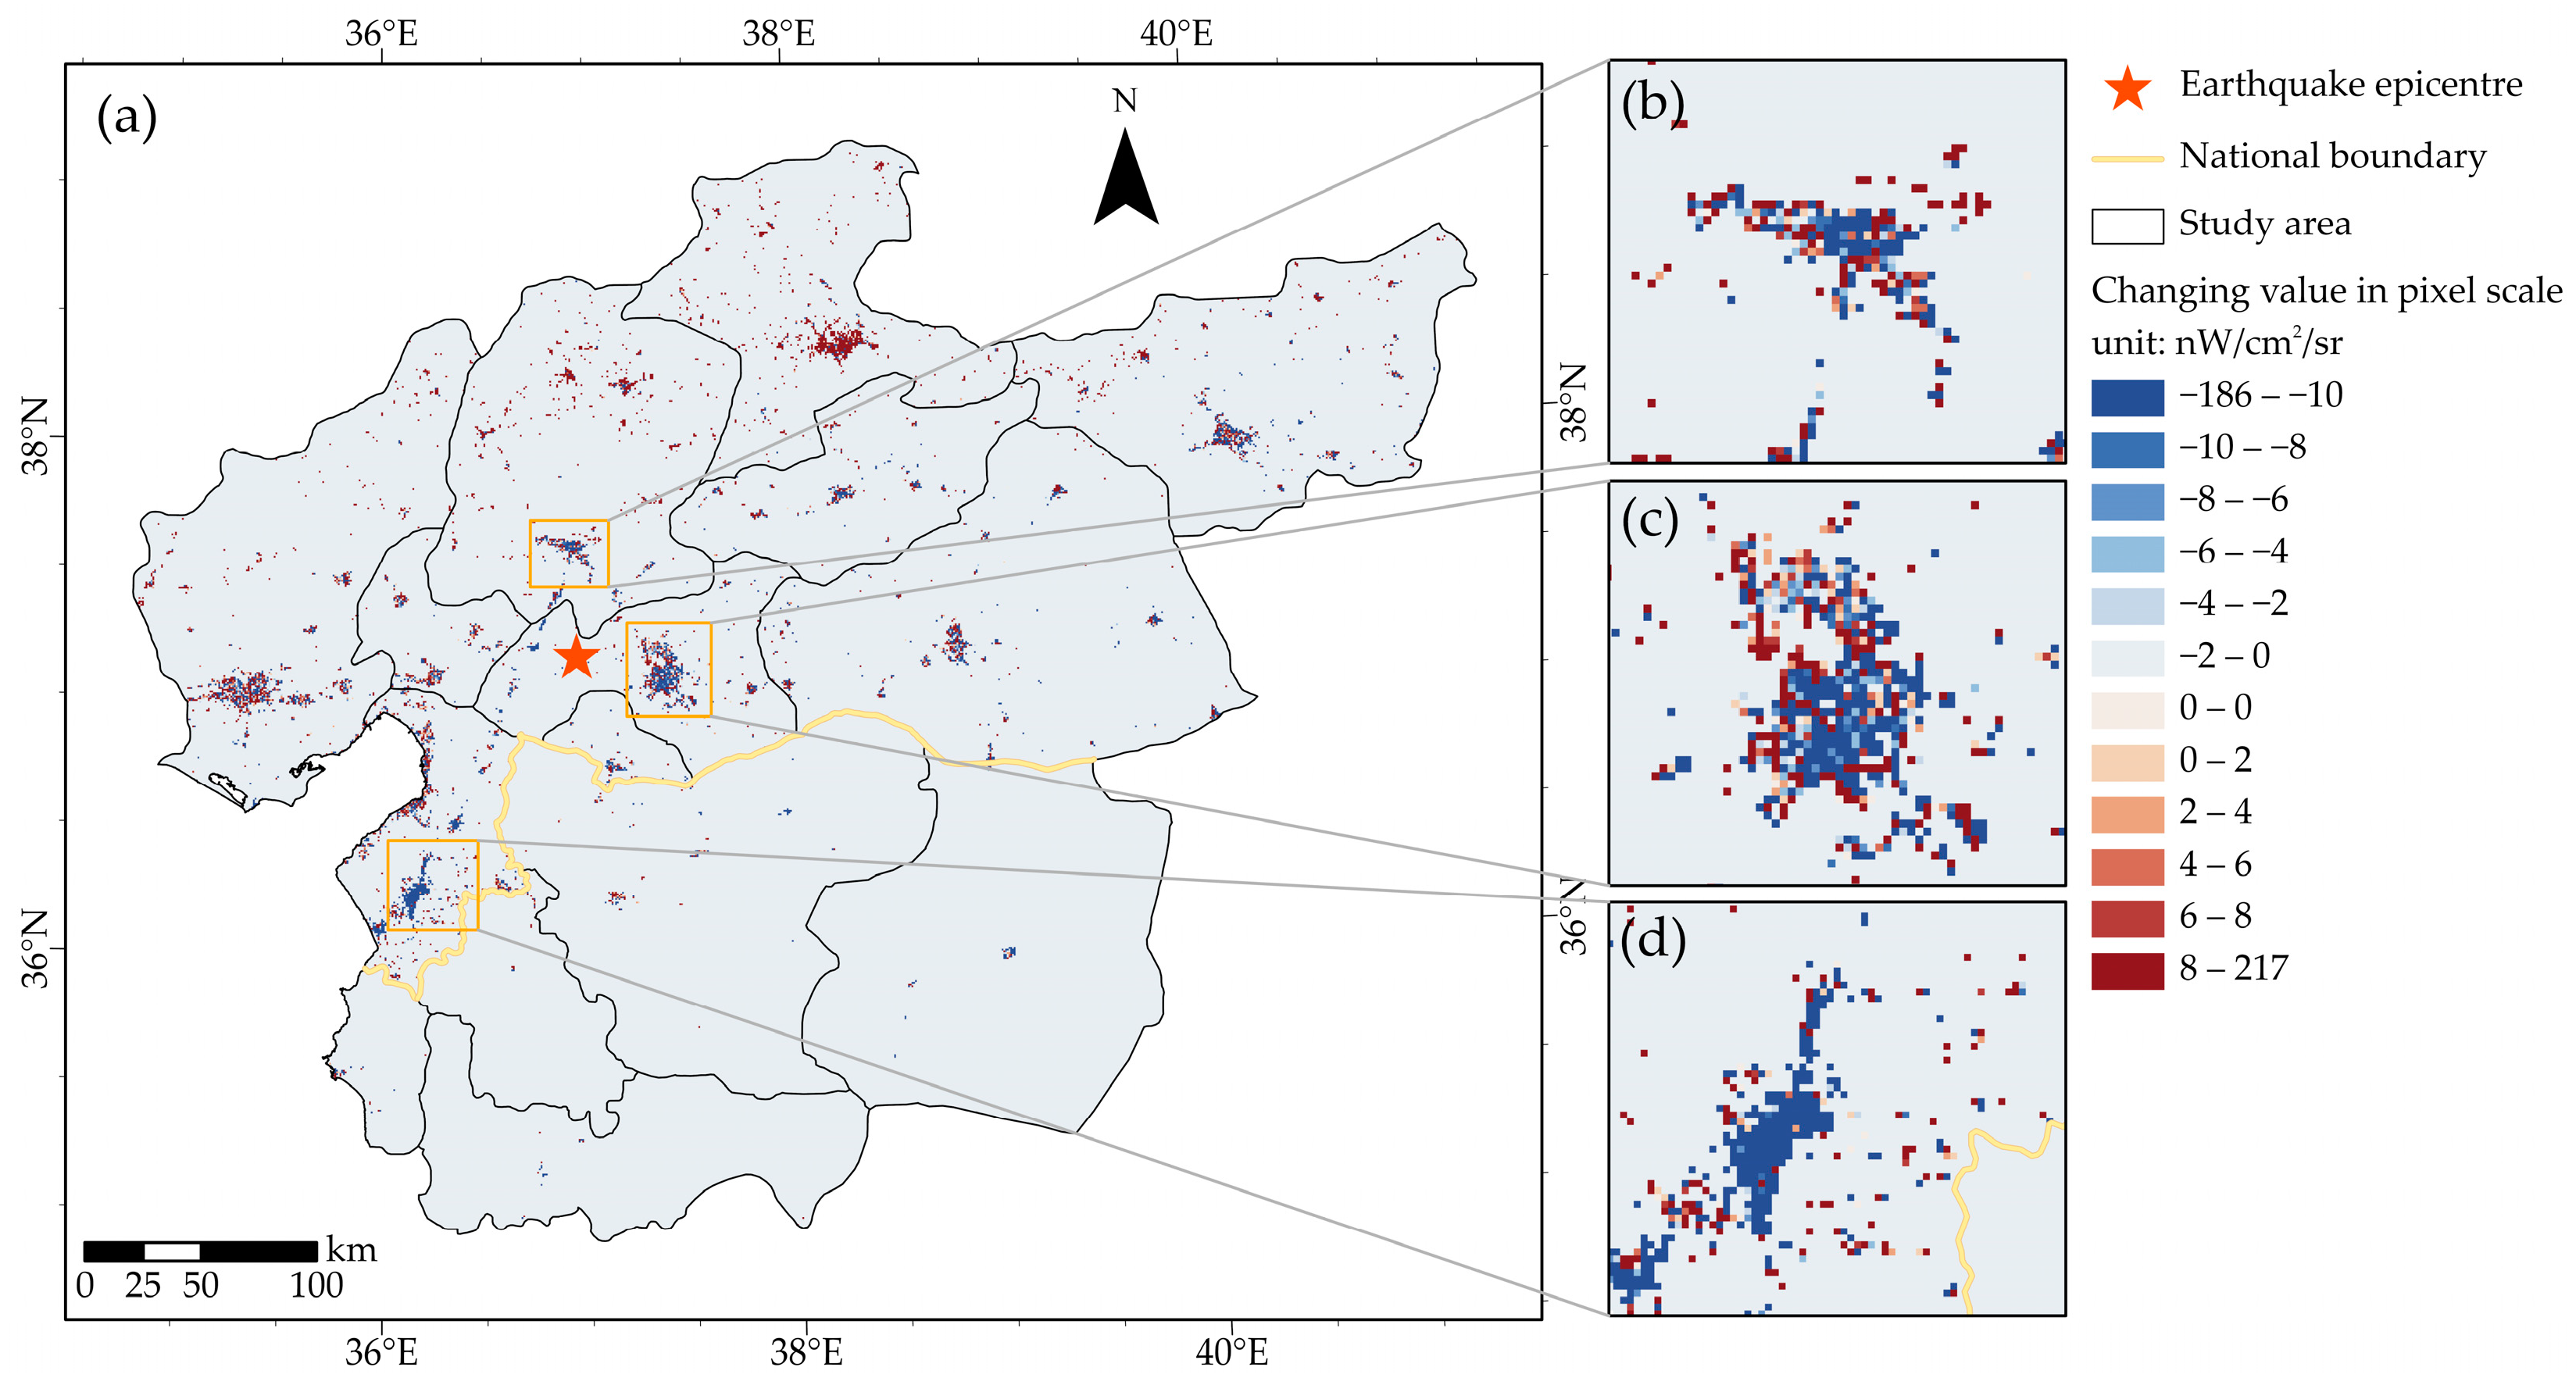
The changes in the NTL intensity at the county and pixel levels are shown in Figure 4 and Figure 5, respectively. The increasing NTL intensity was distributed in the northern region of the study area due to rescue operations [52,53], such as in Kahramanmaraş (Figure 5b), with an increasing value of 39 nW/cm2/sr. A decreasing NTL intensity occurred in Turkish cities such as Gaziantep (Figure 5c) and Antakya (Figure 5d), with decreasing values of 1400 and 5575 nW/cm2/sr, respectively.

4.2. Relationship between NTL, Population, and Building Density in Different Directions and Distances

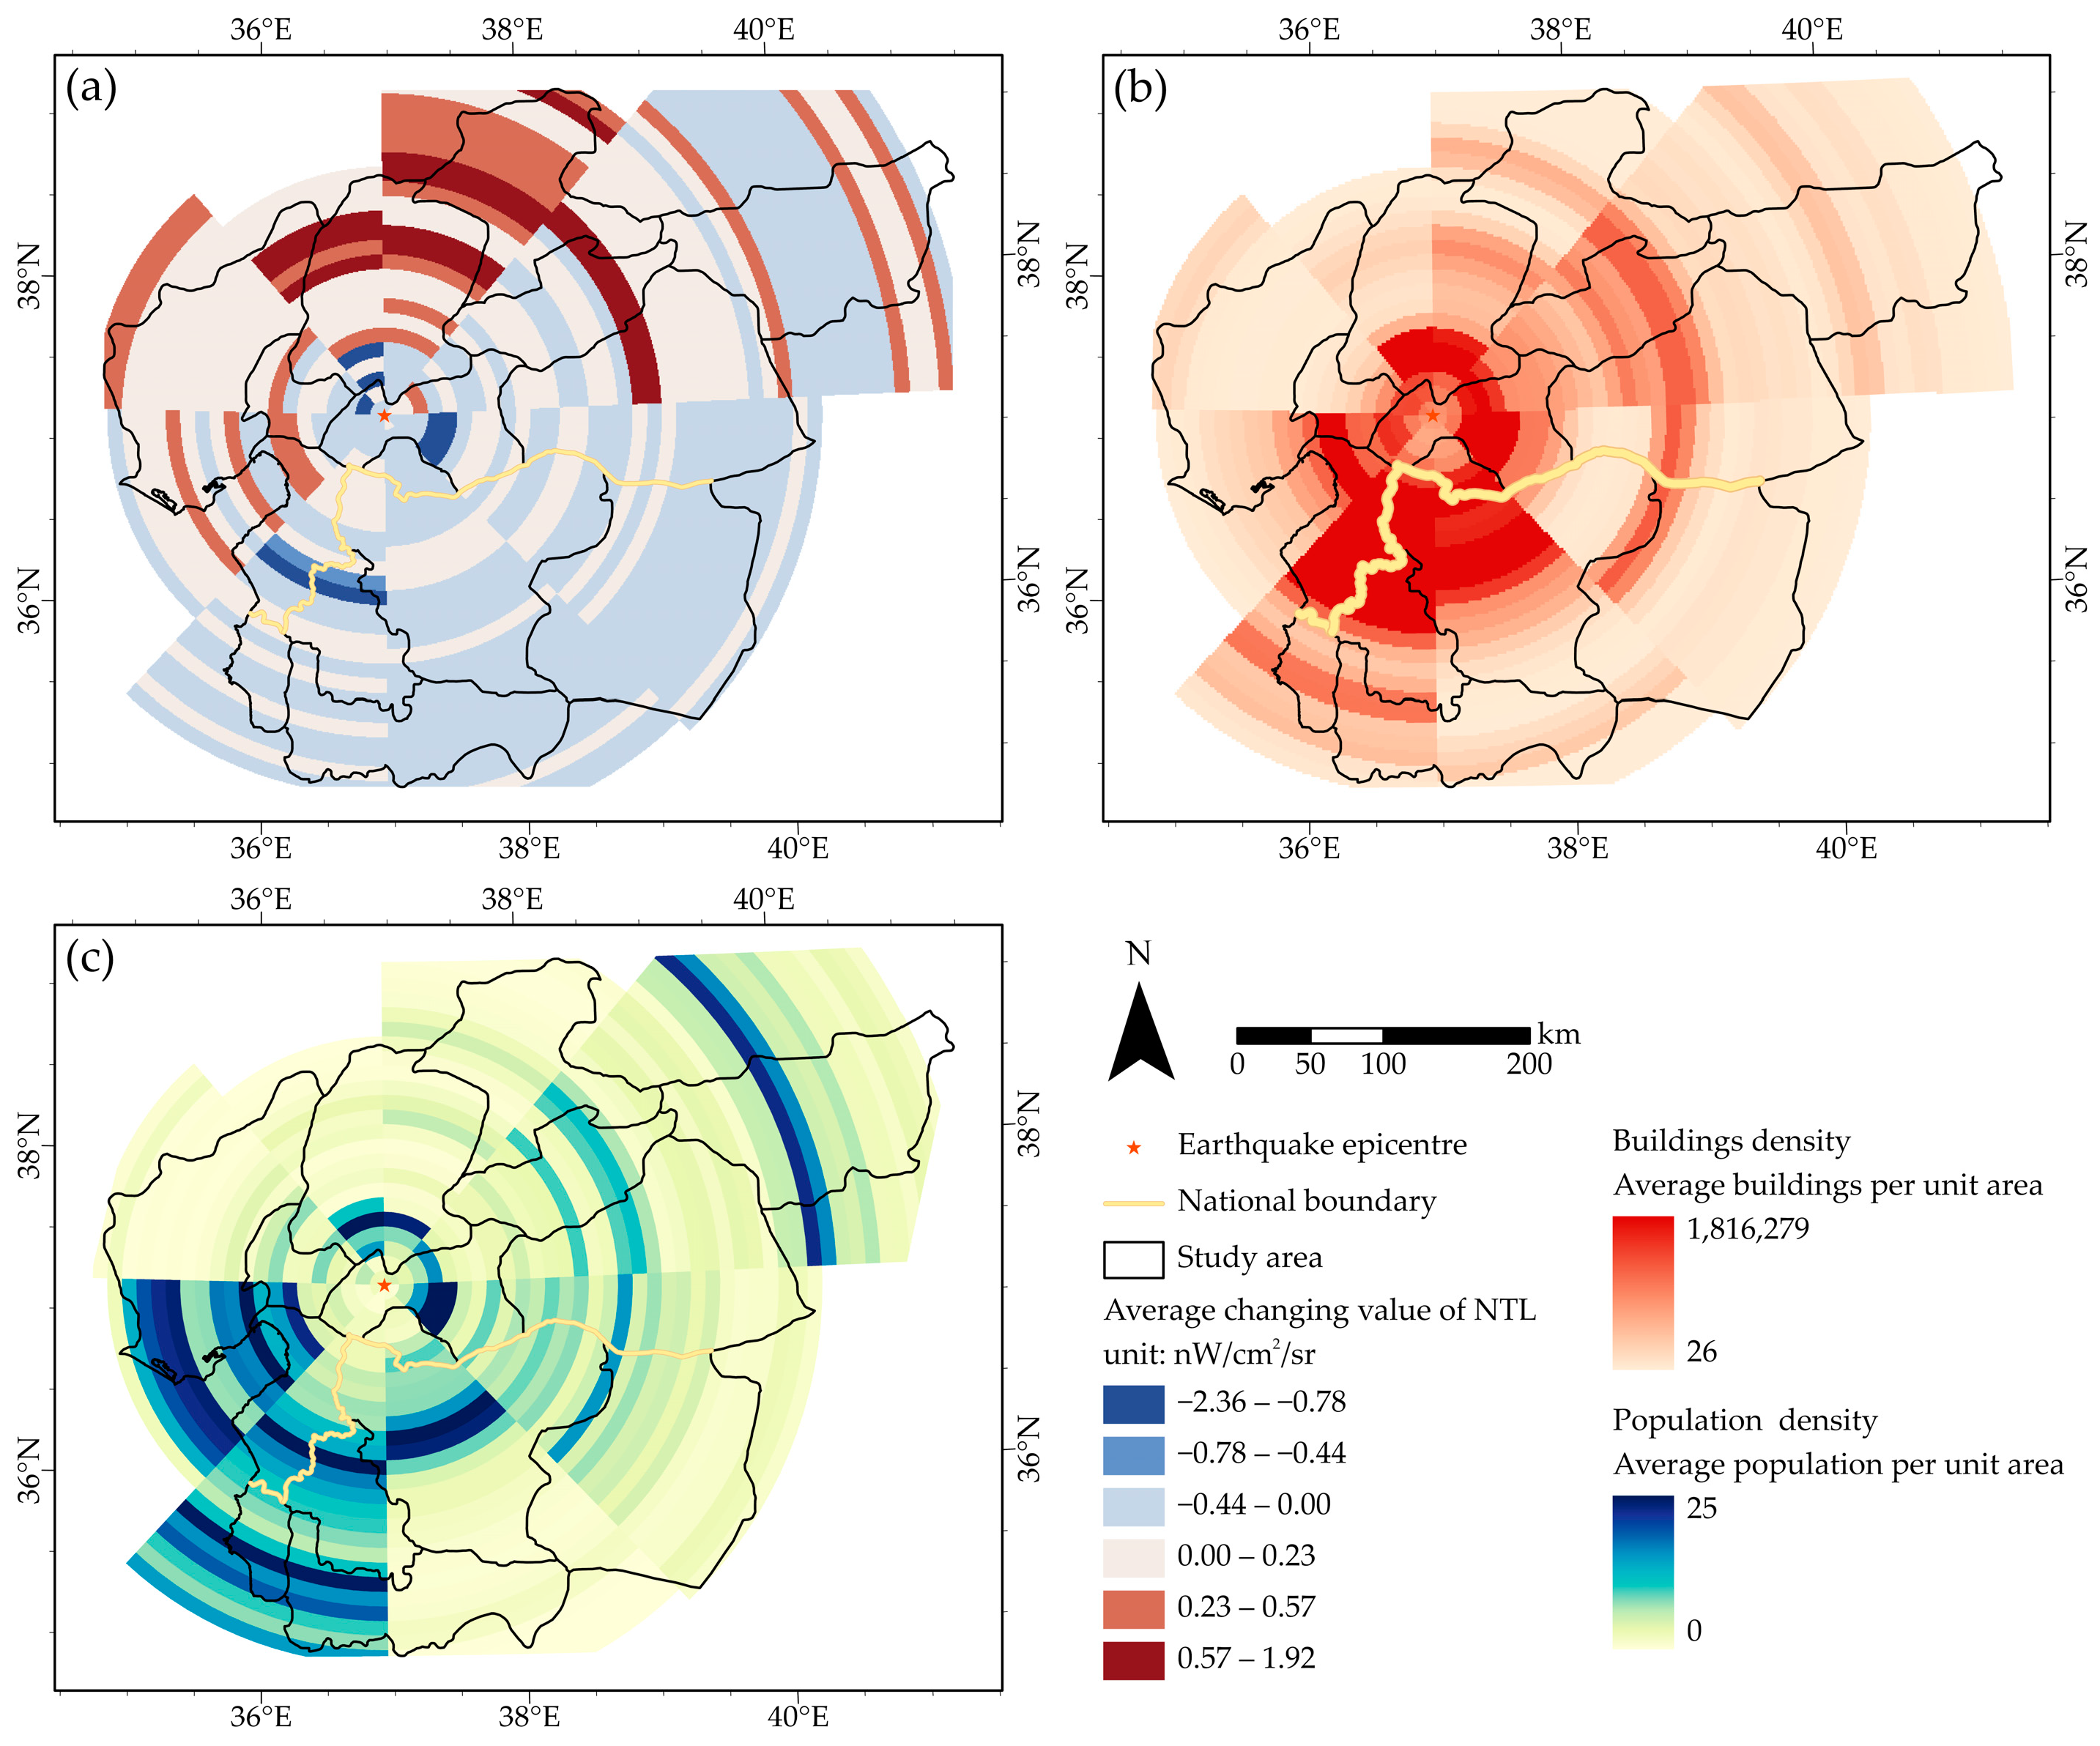
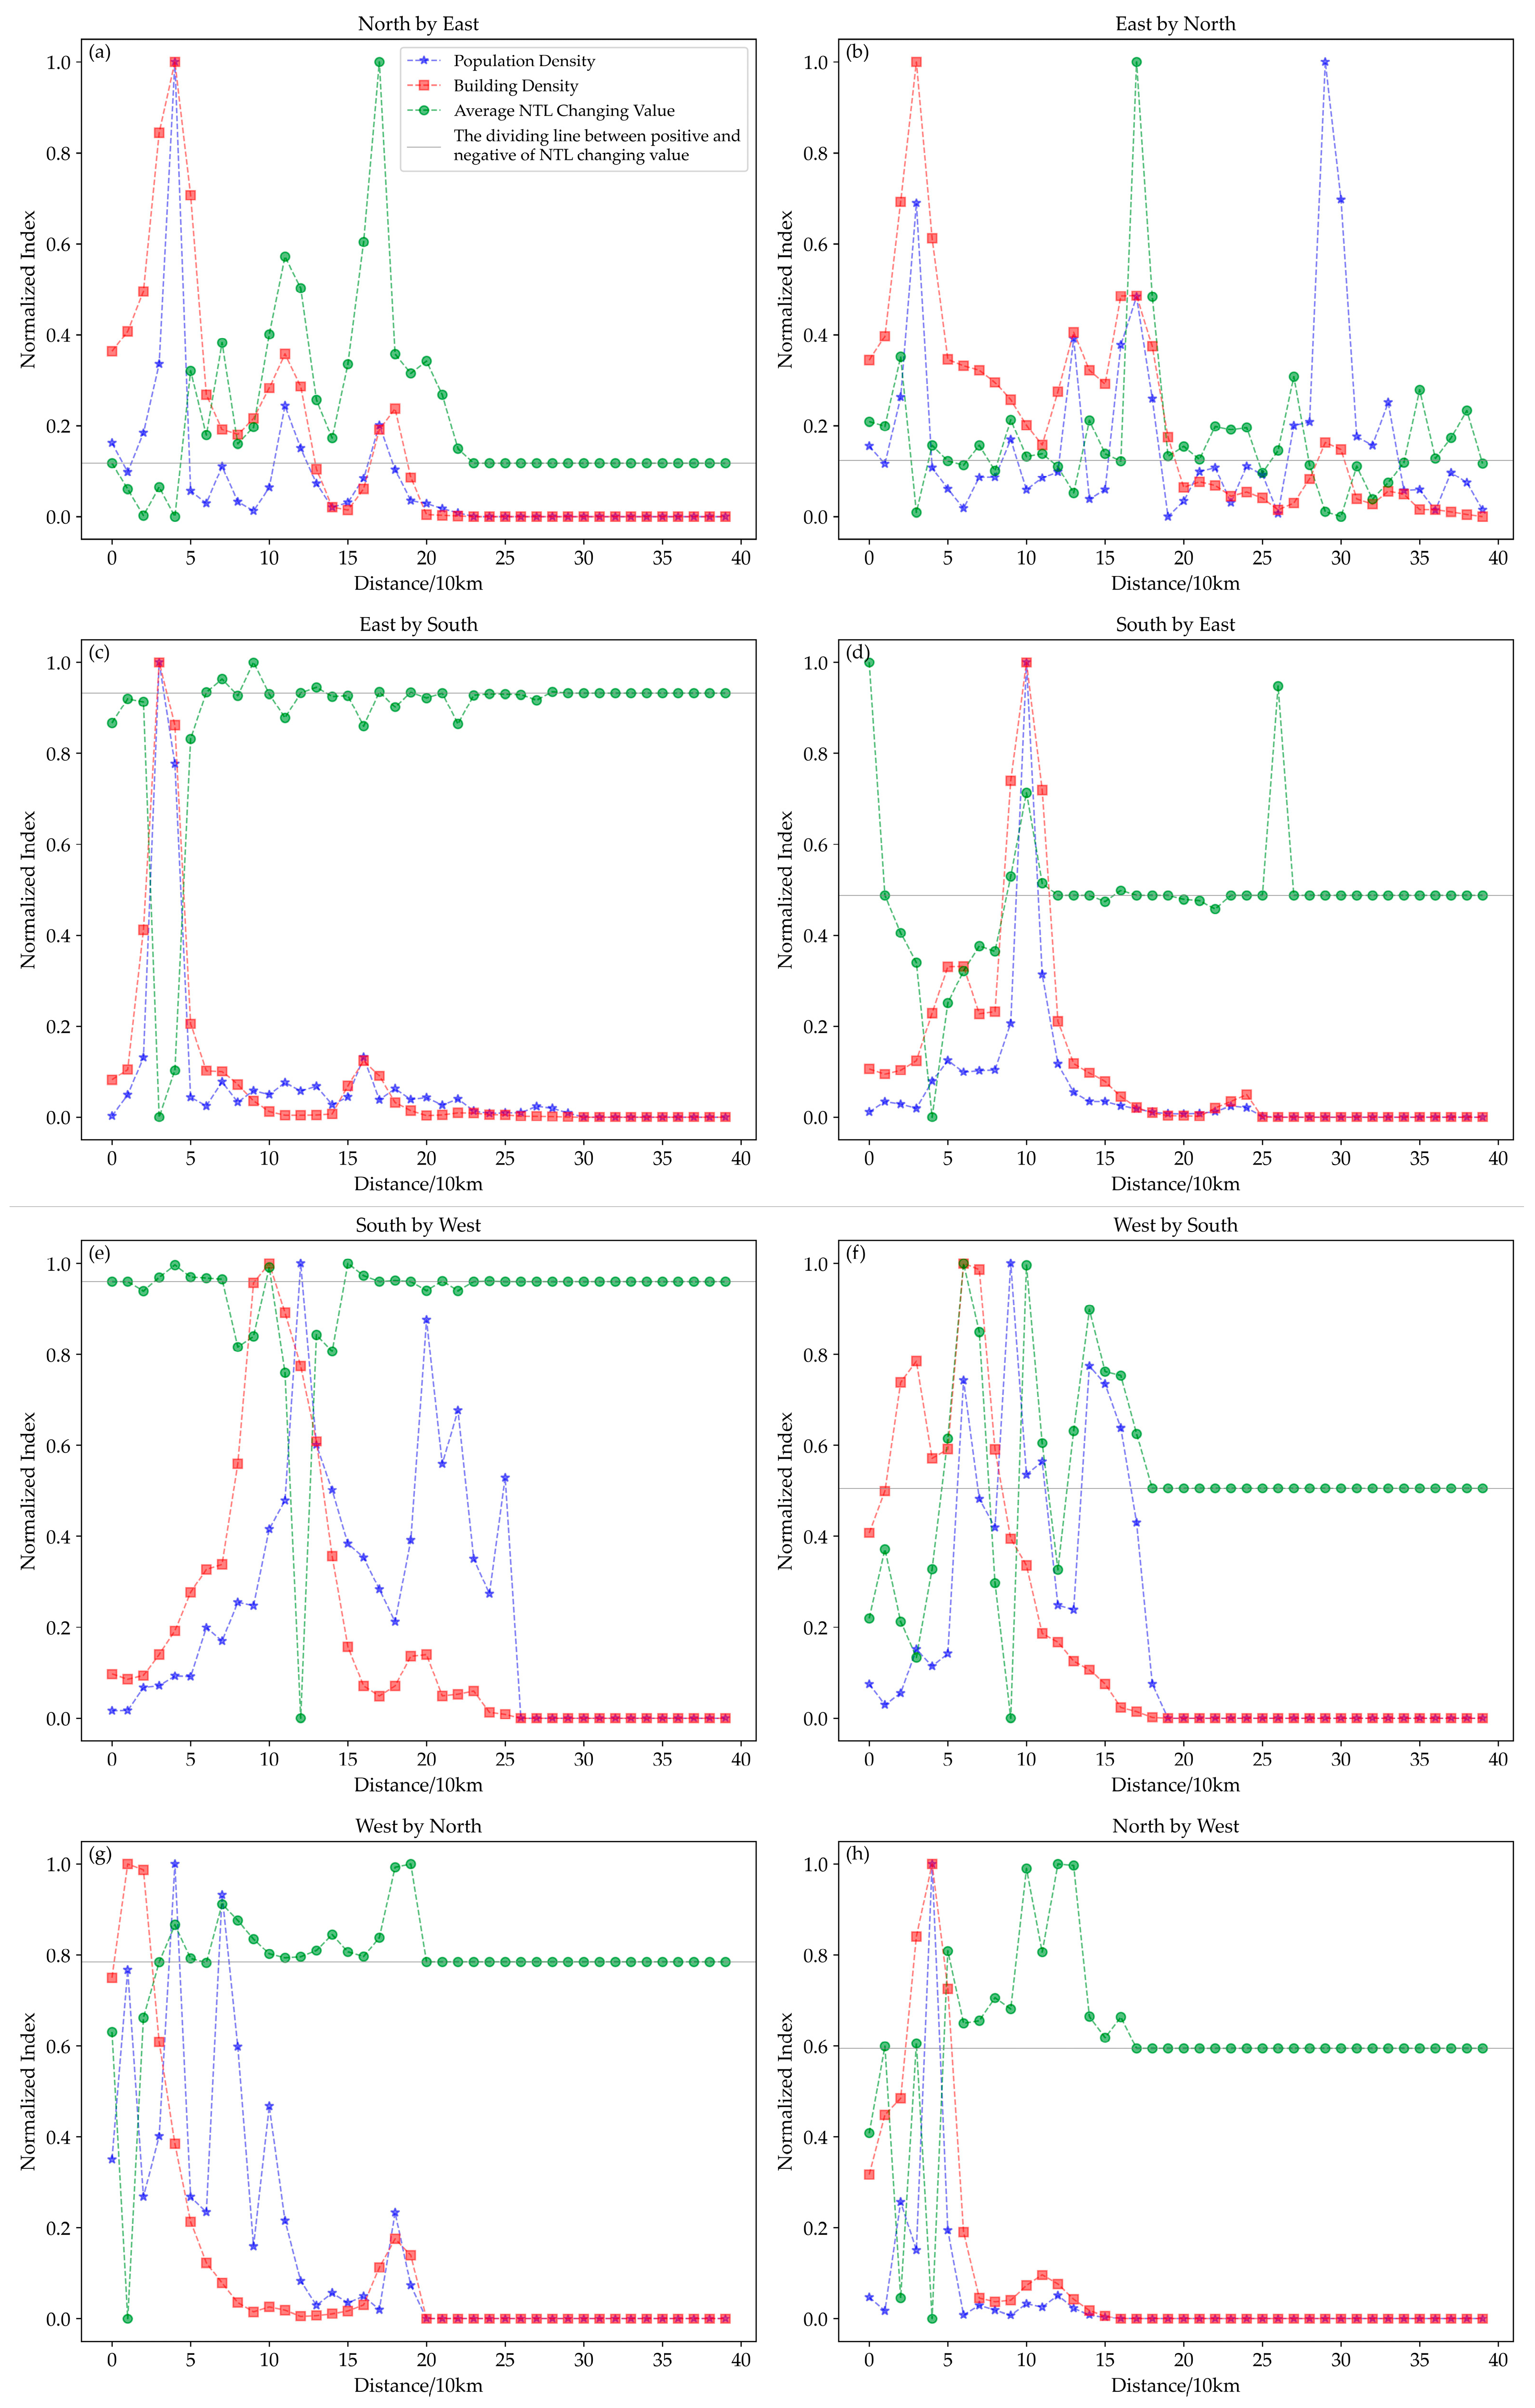
The buffers with the most NTL losses were within a radius of 50 km from the earthquake epicentre in the east-by-south and north-by-west directions and at approximately 130 km from the earthquake epicentre in the south-by-west direction, with the average NTL losses ranging from 0.96 to 2.36 nW/cm2/sr (Figure 6a). In contrast, the buffers with the largest NTL increases occurred at 130 km in the north-by-west direction and 180 km in the north-by-east and east-by-north directions, with average increasing values of 0.65, 1.41, and 1.92 nW/cm2/sr, respectively (Figure 6a). Figure 6b,c show the population and building density, respectively, with each buffer corresponding to Figure 6a. The buffers with highly dense buildings were distributed 50–150 km in the south-by-east direction and 50–120 km to the southwest. The high-population areas were distributed over 70–180 km in the west-by-south direction, approximately 130 km and 210 km in the south-by-west direction, 110 km in the south-by-east direction, and 50 km in the east-by-south, north-by-east, and north-by-west directions. The buffers in the north and southeast of the study area typically had lower populations. We found that the buffers with the largest NTL decreases tended to have high populations and building densities, and these buffers were in several cities with high NTL losses, such as Antakya and Gaziantep. The buffers with increasing NTL intensities tended to have relatively low populations and building densities and were located in Malatya, Aleppo, and Adana. We also normalised the population, building density, and average NTL change values in the eight directions, as shown in Figure 7. We found that the buffers with the largest NTL decreases, high populations, and building densities were approximately 40 km from the earthquake epicentre in the north-by-east direction (Figure 7a), 30 km in the east-by-north direction (Figure 7b), 30 km in the east-by-south direction (Figure 7c), 120 km in the south-by-west direction (Figure 7e), 10 km in the west-by-north direction (Figure 7g), and 40 km in the north-by-west direction (Figure 7h). The buffers with increasing NTL intensities and relatively low populations and building densities were located at 110 km in the north-by-east direction (Figure 7a), 170 km in the east-by-north direction (Figure 7b), and 100 km in the west-by-south direction (Figure 7f).
The significance of the relationship between the NTL intensity changes and population or building density was less than 0.05 (Figure 8c,d). The number of H–L buffers was 15 between both the NTL intensity change and population density (Figure 8a) or building density (Figure 8b), higher than the number of L–H, L–L, and H–H buffers. The numbers of H–H buffers are six and two in Figure 8a,b, respectively, lower than the numbers of H–L, L–H, and L–L. In the bivariate LISA clustering map between the average NTL intensity change and population density, the H–L buffers were mainly distributed at 80 km from the earthquake epicentre in the north-by-east and north-by-west directions, 140 to 170 km in the north-by-west direction, and 210 to 230 km in the north-by-east direction. The L–H buffers appeared at 30–60 km in the east-by-south direction, 100–120 km in the south-by-east direction, 120–140 km in the south-by-west direction, 90 km in the west-by-south direction, and 40 km in the north-by-west direction. The L–L buffers occurred at 10–20 km in the south-by-west and south-by-east directions and 190–220 km in the south-by-east direction. The H–H buffers were located at 110 km in the south-by-east direction, approximately 80–110 km and 160–170 km in the west-by-south direction, and 60 km in the north-by-west direction. In the bivariate LISA clustering map between the average NTL intensity change and building density, the H–L buffers were at 100–160 km in the west-by-north direction. The L–H buffers were at 30–60 km in the east-by-south direction, 100–120 km in the south-by-east direction, and 90–140 km in the south-by-west direction. The L–L buffers were mainly distributed at 200–210 km in the south-by-east direction and 260–290 km in the east-by-south direction. Only two directions had H–H buffers, which were at 110 km in the south-by-east and south-by-west directions. Small or medium cities were usually located inside the H–L buffers. For instance, two cities, Kahramanmaraş [52] and Malatya [53], had average increasing NTL values of 0.35 and 1.92 nW/cm2/sr, respectively. After the earthquake, owing to their relatively low populations and building densities, rescue could be conducted quickly, leading to an increase in light brightness. The cities within the L–H buffers, such as Antakya and Gaziantep, suffered huge losses in the earthquake, with average decreasing NTL values of 2.36 and 1.94 nW/cm2/sr. These cities have high populations and building densities [2,5,8]. Ar Raqqah in Syria is a typical city in an L–L buffer [4]. The cities located in the H–H buffers, including Aleppo and Adana, may have built up a significant amount of temporary lighting equipment for rescue [4]. The calculation results of the LISA model show that population and building density are two variables worth considering in an earthquake.

5. Discussion

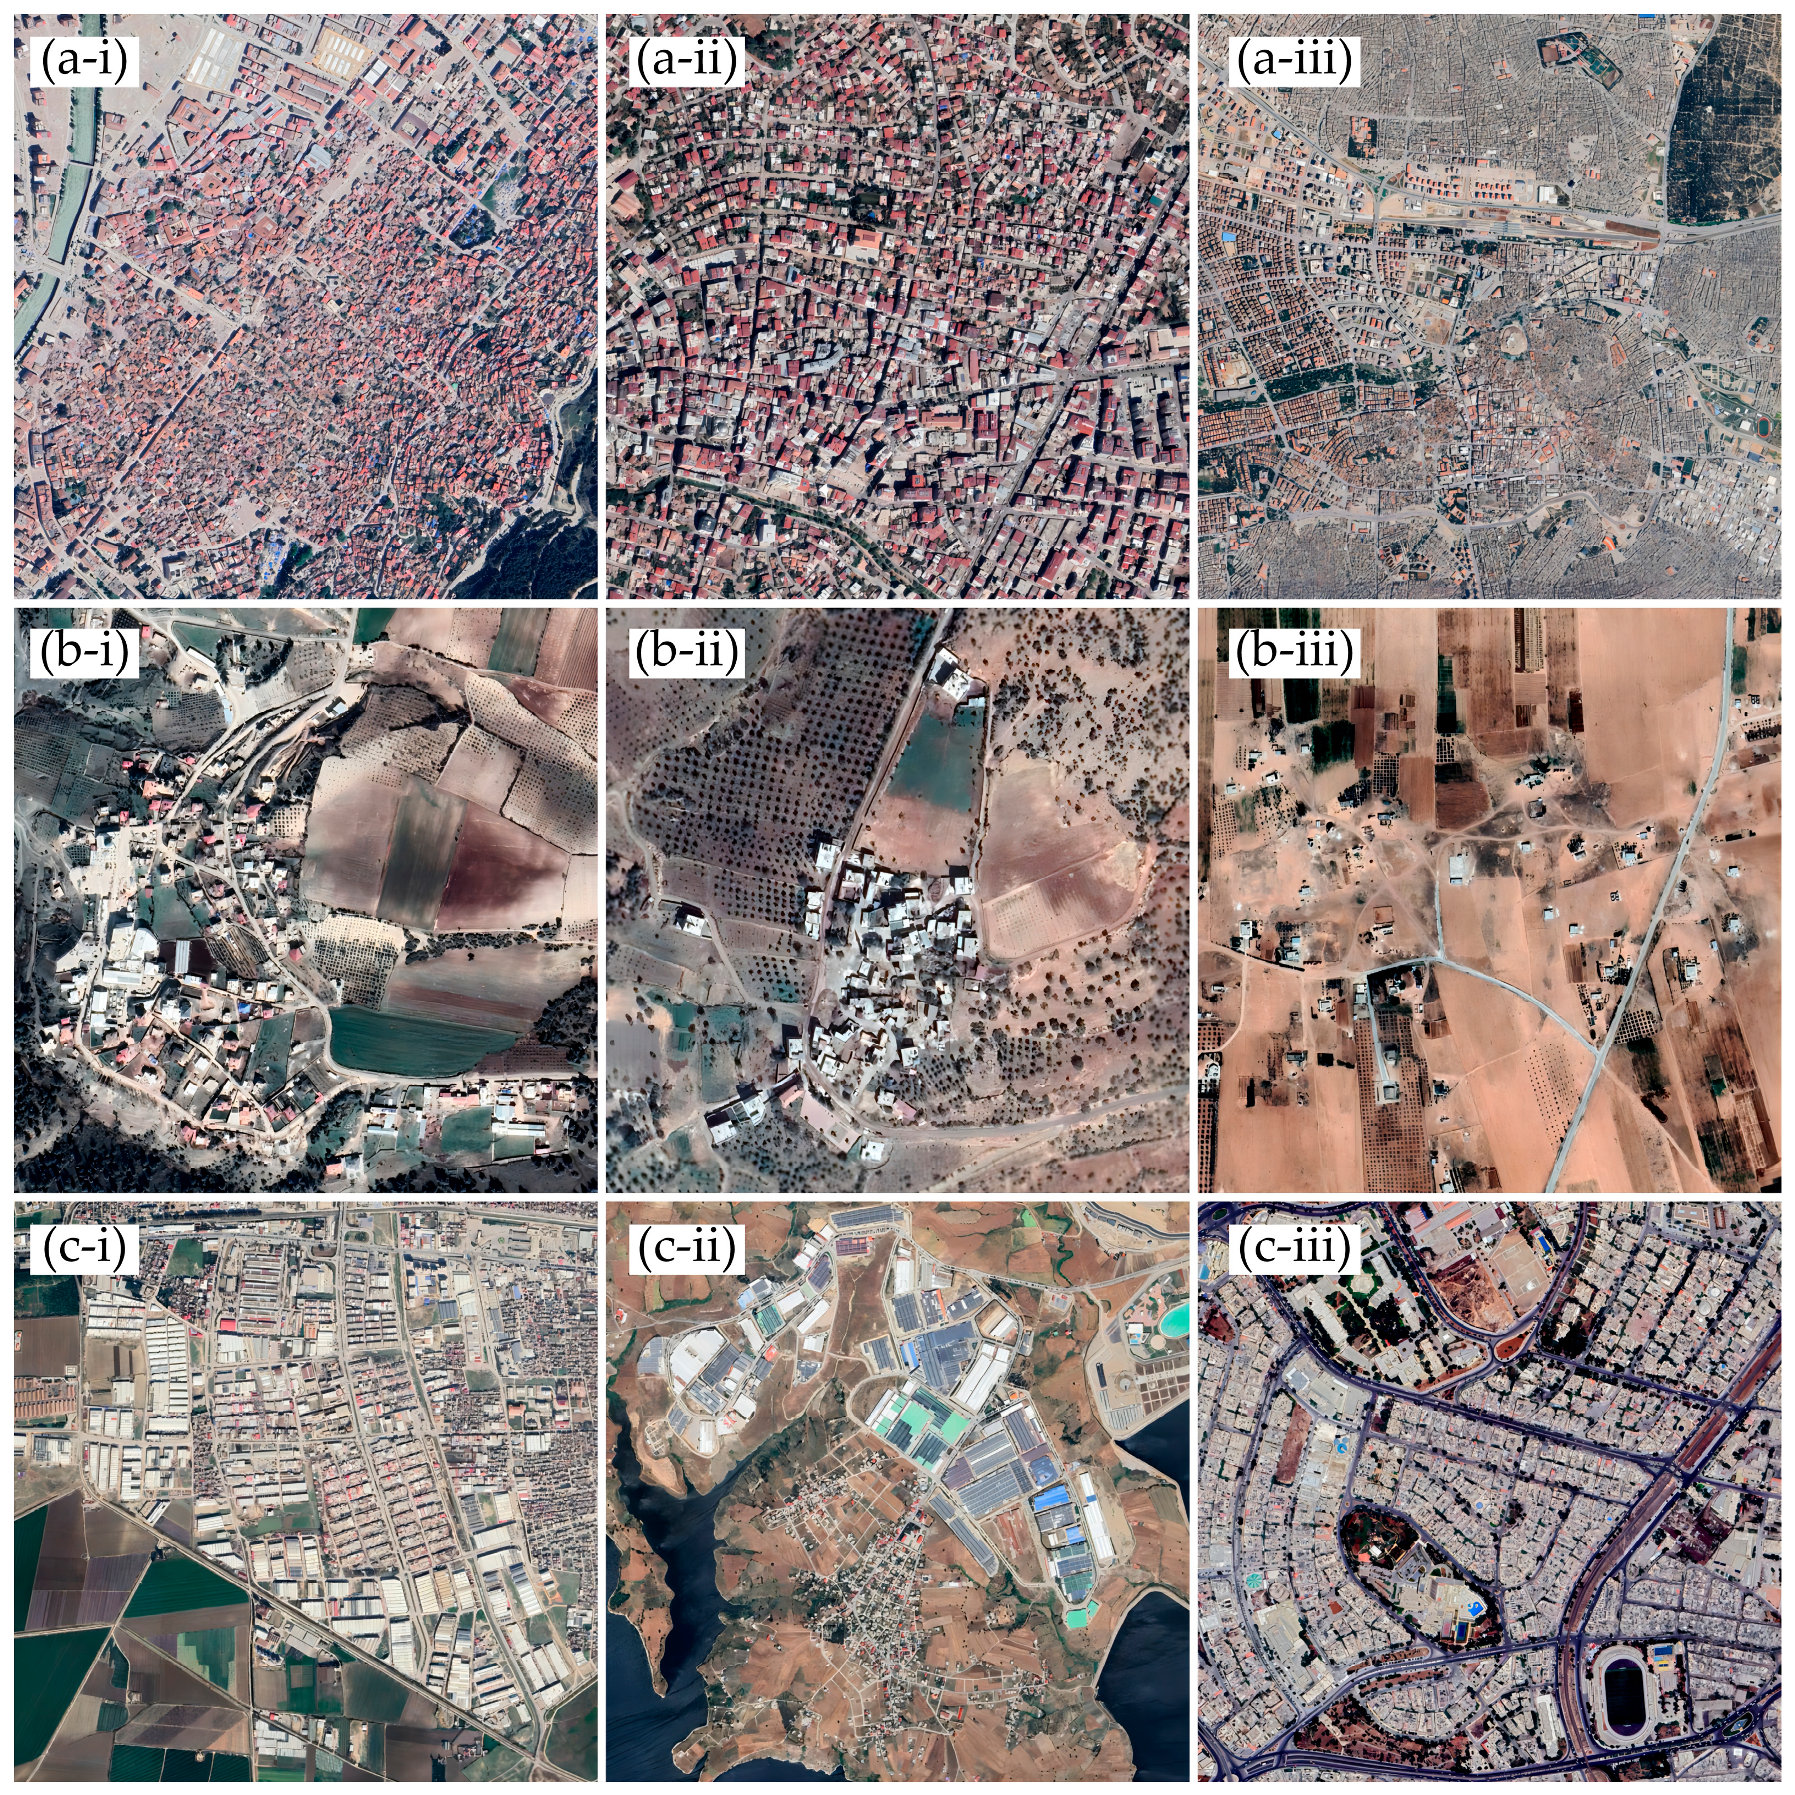
This study classified different regions into various risk levels, namely a high-risk level (regions with the L–H cluster type), medium-risk level (regions with the L–L type), and low-risk level (regions with H–L type or H–H type). Such a classification has the potential to enhance rescue efficiency and facilitate the appropriate allocation of rescue resources. Cities categorized as the L–H type, such as Antakya (Figure 9a-i), Kirikhan (Figure 9a-ii), and Gaziantep (Figure 9a-iii), exhibit relatively high populations or building densities and experienced a decrease in their NTL intensity after the earthquake. These cities are at high risk during earthquakes. In addition to their high populations or building densities, these cities are generally far from transportation hubs and lack transportation facilities, such as main roads for the transportation of essential supplies. Furthermore, the buildings in these areas are characterized by low-rise structures with a high density and lack systematic urban planning. Medium-risk towns (L–L type), such as Hamidiye (Figure 9b-i), Ortaklor (Figure 9b-ii), and Hammamiyah (Figure 9b-iii), exhibit low populations or building densities, experienced a decrease in their NTL intensity after the earthquake, and encountered relatively minor earthquake losses. These regions are distanced from the metropolis and located in mountainous areas or on the city fringes. Low-risk regions (H–L type and H–H type), such as Adana (Figure 9c-i), Kavlaklı (Figure 9c-ii), and Aleppo (Figure 9c-iii), observed an increase in their NTL intensity after the earthquake, reflecting a strong resilience to earthquakes. These regions have well-developed transportation networks, planned building structures, and better urban infrastructure compared to high-risk areas.
This study demonstrated that the changes in NTL intensity caused by an earthquake did not follow a simple linear correlation with population or building densities. For instance, part of the areas in Adana (Figure 9c-i), categorized as an H–H type with a high population density, exhibited an increase in NTL changes after the earthquake. Hence, considering both the population and building density, we can suggest the risk levels in different regions after the earthquake, facilitating the optimization of rescue force allocation and aiding decision makers in offering practical recommendations for enhancing earthquake resilience. Furthermore, we observed a higher prevalence of H–L LISA cluster types in Turkey compared to Syria, while Syria exhibited more L–H types. This phenomenon can be attributed to factors such as the ongoing war [51], a lack of humanitarian assistance [55], weak domestic productivity [56], and the unstable political power in Syria.
Compared with other studies on the Turkey–Syria earthquake using SDGSAT-1 and Yangwang-1 [4,6,11], our research selected NOAA-20 VIIRS data. From the perspective of timeliness, NOAA-20 VIIRS can obtain global daily data in near real time. SDGSAT-1 requires 11 days to revisit the same place [57], and Yangwang-1 could start the data acquisition mode to obtain the data of the adjacent area after two days [11]. The spatial resolution of NOAA-20 VIIRS is 750 m, while the spatial resolution of SDGSAT-1 is 10 m at panchromatic wavelengths and 40 m in the RGB band, and that of Yangwang-1 is up to 38 m, which can meet the requirements for a high-precision analysis. In terms of application scenarios, NOAA-20 VIIRS data could be more suitable for rapid earthquake monitoring and other emergencies to obtain relatively accurate results and a rapid response analysis in the areas not covered by SDGSAT-1 or Yangwang-1, while SDGSAT-1 or Yangwang-1 are a good choice when the precise assessment of a certain region is required because of its high resolution [4,11].
In addition, for evaluation methods and perspectives, existing studies have rarely considered the impact of earthquakes at various distances and directions, which are essential for large-scale earthquake assessments and evaluations. We conducted a bivariate LISA to analyse the spatial extent at different distances and directions and classify the impact of earthquakes in various situations, making the results more complete.

6. Conclusions

This study used daily NOAA-20 VIIRS NTL data to analyse the spatial characteristics of the NTL changes before and after the Turkey–Syria earthquake. We focused on the impacts of the earthquake at different distances and directions and explored the relationship between the changes in the NTL intensity and population or building density using the bivariate LISA method.
The results of the significance test indicated that the value of the NTL change was statistically significant. The results showed that the injured populations of the provinces in Turkey and the number of pixels with a decreased NTL intensity followed a linear correlation, with an R-squared value of 0.7395. In the study area, the two provinces with the largest reductions in NTL intensity were Hatay and Gaziantep in Turkey, with decreasing values of 6491 and 3044 nW/cm2/sr, separately, and the two provinces with the largest light growth were Kahramanmaraş and Malatya in Turkey, with increasing values of 6277 and 14,446 nW/cm2/sr. Ar Raqqah in Syria had the largest rate of decrease, at 52.9%. The buffers with a large NTL reduction were distributed within a radius of 50 km from the earthquake epicentre in the east-by-south and north-by-west directions and 130 km in the south-by-west direction. The buffers with large NTL increases were located in the north-by-west, north-by-east, and east-by-north directions. By combining population and building density data, we found that the buffers with the largest reductions in NTL intensity tended to have high populations and building densities, and the buffers with increasing NTL intensities tended to have relatively low populations and building densities. In the LISA clustering map, the number of H–L and L–H buffers was greater than that in the other types, implying that most of the NTL increases were concentrated in areas with relatively low populations and building densities, whereas areas with high populations and building densities often suffered a huge loss in NTL intensity.
These results provide valuable guidance for post-disaster damage assessment and showcase the value of the direct application of daily NTL data in earthquake analyses.

Author Contributions

Conceptualization, B.Y. and C.W.; methodology, Z.C. and C.W.; data curation, Y.Y., W.L. and L.Z.; validation, Y.Y.; formal analysis, Y.Y.; writing—original draft preparation, Y.Y.; writing—review and editing, C.W., Y.Y., S.L. and B.Y.; visualization, Y.Y. and X.M.; supervision, B.Y.; funding acquisition, C.W., X.M. and B.Y. All authors have read and agreed to the published version of the manuscript.

Funding

This work was supported by the China Postdoctoral Science Foundation (grant no. 2022M721149), the Shanghai Sailing Program (grant no. 23YF1410000), the National Natural Science Foundation of China (grant nos. 41871331), the National Natural Science Foundation of China (grant nos. 42001387), and the Fundamental Research Funds for the Central Universities (grant no. 2022ECNU-XWK-XK001).

Data Availability Statement

The data that support the findings of this study are available from the website given in the manuscript.

Acknowledgments

Acknowledgement for the data support from the National Oceanic and Atmospheric Administration, the US Geological Survey, the Global Human Settlements Layer, OpenStreetMap, and Zenodo.

Conflicts of Interest

The authors declare no conflict of interest.

References

  1. Naddaf, M. Turkey–Syria Earthquake: What Scientists Know. Nature 2023, 614, 398–399. [Google Scholar] [CrossRef] [PubMed]
  2. ReliefWeb. Türkiye Earthquake February 2023, Bi-Weekly Highlights—03/03/2023—Türkiye. Available online: https://reliefweb.int/report/turkiye/turkiye-earthquake-february-2023-bi-weekly-highlights-03032023 (accessed on 29 April 2023).
  3. Alvarez, D.A.; Hurtado, J.E.; Bedoya-Ruíz, D.A. Prediction of Modified Mercalli Intensity from PGA, PGV, Moment Magnitude, and Epicentral Distance Using Several Nonlinear Statistical Algorithms. J. Seismol. 2012, 16, 489–511. [Google Scholar] [CrossRef]
  4. Yu, B.; Chen, F.; Wang, N.; Wang, L.; Guo, H. Assessing Changes in Nighttime Lighting in the Aftermath of the Turkey-Syria Earthquake Using SDGSAT-1 Satellite Data. Innovation 2023, 4, 100419. [Google Scholar] [CrossRef]
  5. Robinson, C.; Gupta, R.; Fobi Nsutezo, S.; Pound, E.; Ortiz, A.; Rosa, M.; White, K.; Dodhia, R.; Zolli, A.; Birge, C.; et al. Turkey Earthquake Report; Microsoft: Redmond, WA, USA, 2023. [Google Scholar]
  6. Levin, N. Using Night Lights from Space to Assess Areas Impacted by the 2023 Turkey Earthquake. Remote Sens. 2023, 15, 2120. [Google Scholar] [CrossRef]
  7. Li, X.; Liu, S.; Jendryke, M.; Li, D.; Wu, C. Night-Time Light Dynamics during the Iraqi Civil War. Remote Sens. 2018, 10, 858. [Google Scholar] [CrossRef] [Green Version]
  8. Tralli, D.M.; Blom, R.G.; Zlotnicki, V.; Donnellan, A.; Evans, D.L. Satellite Remote Sensing of Earthquake, Volcano, Flood, Landslide and Coastal Inundation Hazards. ISPRS J. Photogramm. Remote Sens. 2005, 59, 185–198. [Google Scholar] [CrossRef]
  9. Joyce, K.E.; Belliss, S.E.; Samsonov, S.V.; McNeill, S.J.; Glassey, P.J. A Review of the Status of Satellite Remote Sensing and Image Processing Techniques for Mapping Natural Hazards and Disasters. Prog. Phys. Geogr. Earth Environ. 2009, 33, 183–207. [Google Scholar] [CrossRef] [Green Version]
  10. Geiß, C.; Taubenböck, H. Remote Sensing Contributing to Assess Earthquake Risk: From a Literature Review towards a Roadmap. Nat. Hazards 2013, 68, 7–48. [Google Scholar] [CrossRef]
  11. Li, X.; Gong, Y.; Cao, H. Rapid response to Turkey-Syria earthquake using night-time light remote sensing. Acta Geod. Cartogr. Sin. 2023, 52, 697. [Google Scholar] [CrossRef]
  12. Gong, P.; Li, X.; Wang, J.; Bai, Y.; Chen, B.; Hu, T.; Liu, X.; Xu, B.; Yang, J.; Zhang, W.; et al. Annual Maps of Global Artificial Impervious Area (GAIA) between 1985 and 2018. Remote Sens. Environ. 2020, 236, 111510. [Google Scholar] [CrossRef]
  13. Zhou, Y.; Smith, S.J.; Zhao, K.; Imhoff, M.; Thomson, A.; Bond-Lamberty, B.; Asrar, G.R.; Zhang, X.; He, C.; Elvidge, C.D. A Global Map of Urban Extent from Nightlights. Environ. Res. Lett. 2015, 10, 054011. [Google Scholar] [CrossRef]
  14. Wang, C.; Yu, B.; Chen, Z.; Liu, Y.; Song, W.; Li, X.; Yang, C.; Small, C.; Shu, S.; Wu, J. Evolution of Urban Spatial Clusters in China: A Graph-Based Method Using Nighttime Light Data. Ann. Am. Assoc. Geogr. 2022, 112, 56–77. [Google Scholar] [CrossRef]
  15. Xu, G.; Su, J.; Xia, C.; Li, X.; Xiao, R. Spatial Mismatches between Nighttime Light Intensity and Building Morphology in Shanghai, China. Sustain. Cities Soc. 2022, 81, 103851. [Google Scholar] [CrossRef]
  16. Zhu, X.; Ma, M.; Yang, H.; Ge, W. Modeling the Spatiotemporal Dynamics of Gross Domestic Product in China Using Extended Temporal Coverage Nighttime Light Data. Remote Sens. 2017, 9, 626. [Google Scholar] [CrossRef] [Green Version]
  17. Li, X.; Ge, L.; Chen, X. Detecting Zimbabwe’s Decadal Economic Decline Using Nighttime Light Imagery. Remote Sens. 2013, 5, 4551–4570. [Google Scholar] [CrossRef] [Green Version]
  18. Zhang, L.; Li, X.; Chen, F. Spatiotemporal Analysis of Venezuela’s Nighttime Light During the Socioeconomic Crisis. IEEE J. Sel. Top. Appl. Earth Obs. Remote Sens. 2020, 13, 2396–2408. [Google Scholar] [CrossRef]
  19. Li, X.; Zhao, L.; Han, W.; Faouzi, B.; Washaya, P.; Zhang, X.; Jin, H.; Wu, C. Evaluating Algeria’s Social and Economic Development Using a Series of Night-Time Light Images between 1992 to 2012. Int. J. Remote Sens. 2018, 39, 9228–9248. [Google Scholar] [CrossRef]
  20. Li, Y.; Song, Z.; Wu, B.; Yu, B.; Wu, Q.; Hong, Y.; Liu, S.; Wu, J. Evaluating the Ability of NOAA-20 Monthly Composite Data for Socioeconomic Indicators Estimation and Urban Area Extraction. IEEE J. Sel. Top. Appl. Earth Obs. Remote Sens. 2022, 15, 1837–1845. [Google Scholar] [CrossRef]
  21. Yu, B.; Shi, K.; Hu, Y.; Huang, C.; Chen, Z.; Wu, J. Poverty Evaluation Using NPP-VIIRS Nighttime Light Composite Data at the County Level in China. IEEE J. Sel. Top. Appl. Earth Obs. Remote Sens. 2015, 8, 1217–1229. [Google Scholar] [CrossRef]
  22. Zhao, X.; Yu, B.; Liu, Y.; Chen, Z.; Li, Q.; Wang, C.; Wu, J. Estimation of Poverty Using Random Forest Regression with Multi-Source Data: A Case Study in Bangladesh. Remote Sens. 2019, 11, 375. [Google Scholar] [CrossRef] [Green Version]
  23. Wu, B.; Yang, C.; Wu, Q.; Wang, C.; Wu, J.; Yu, B. A Building Volume Adjusted Nighttime Light Index for Characterizing the Relationship between Urban Population and Nighttime Light Intensity. Comput. Environ. Urban Syst. 2023, 99, 101911. [Google Scholar] [CrossRef]
  24. Shi, K.; Chen, Y.; Yu, B.; Xu, T.; Chen, Z.; Liu, R.; Li, L.; Wu, J. Modeling Spatiotemporal CO2 (Carbon Dioxide) Emission Dynamics in China from DMSP-OLS Nighttime Stable Light Data Using Panel Data Analysis. Appl. Energy 2016, 168, 523–533. [Google Scholar] [CrossRef]
  25. Wang, S.; Liu, X. China’s City-Level Energy-Related CO2 Emissions: Spatiotemporal Patterns and Driving Forces. Appl. Energy 2017, 200, 204–214. [Google Scholar] [CrossRef]
  26. Chen, Z.; Wei, Y.; Shi, K.; Zhao, Z.; Wang, C.; Wu, B.; Qiu, B.; Yu, B. The Potential of Nighttime Light Remote Sensing Data to Evaluate the Development of Digital Economy: A Case Study of China at the City Level. Comput. Environ. Urban Syst. 2022, 92, 101749. [Google Scholar] [CrossRef]
  27. Zhao, X.; Yu, B.; Liu, Y.; Yao, S.; Lian, T.; Chen, L.; Yang, C.; Chen, Z.; Wu, J. NPP-VIIRS DNB Daily Data in Natural Disaster Assessment: Evidence from Selected Case Studies. Remote Sens. 2018, 10, 1526. [Google Scholar] [CrossRef] [Green Version]
  28. Gao, S.; Chen, Y.; Liang, L.; Gong, A. Post-Earthquake Night-Time Light Piecewise (PNLP) Pattern Based on NPP/VIIRS Night-Time Light Data: A Case Study of the 2015 Nepal Earthquake. Remote Sens. 2020, 12, 2009. [Google Scholar] [CrossRef]
  29. Liu, Z.; Zhang, J.; Li, X.; Chen, X. Long-Term Resilience Curve Analysis of Wenchuan Earthquake-Affected Counties Using DMSP-OLS Nighttime Light Images. IEEE J. Sel. Top. Appl. Earth Obs. Remote Sens. 2021, 14, 10854–10874. [Google Scholar] [CrossRef]
  30. Takashima, M.; Hayashi, H.; Nagata, S. Monitoring Spatial Distribution of Population and Buildings Using DMSP Night-Time Imagery and Its Application for Earthquake Damage Assessment. In Proceedings of the IGARSS 2003, 2003 IEEE International Geoscience and Remote Sensing Symposium, Proceedings (IEEE Cat. No.03CH37477), Toulouse, France, 21–25 July 2003; Volume 4, pp. 2430–2432. [Google Scholar]
  31. Fan, X.; Nie, G.; Deng, Y.; An, J.; Zhou, J.; Li, H. Rapid Detection of Earthquake Damage Areas Using VIIRS Nearly Constant Contrast Night-Time Light Data. Int. J. Remote Sens. 2019, 40, 2386–2409. [Google Scholar] [CrossRef]
  32. Li, X.; Liu, Z.; Chen, X.; Meng, Q. Assessment of the Impact of the 2010 Haiti Earthquake on Human Activity Based on DMSP/OLS Time Series Nighttime Light Data. J. Appl. Remote Sens. 2019, 13, 044515. [Google Scholar] [CrossRef]
  33. Li, X.; Zhan, C.; Tao, J.; Li, L. Long-Term Monitoring of the Impacts of Disaster on Human Activity Using DMSP/OLS Nighttime Light Data: A Case Study of the 2008 Wenchuan, China Earthquake. Remote Sens. 2018, 10, 588. [Google Scholar] [CrossRef] [Green Version]
  34. Wang, Z.; Román, M.O.; Sun, Q.; Molthan, A.L.; Schultz, L.A.; Kalb, V.L. Monitoring disaster-related power outages using nasa black marble nighttime light product. Int. Arch. Photogramm. Remote Sens. Spat. Inf. Sci. 2018, XLII–3, 1853–1856. [Google Scholar] [CrossRef] [Green Version]
  35. Elvidge, C.D.; Ghosh, T.; Hsu, F.-C.; Zhizhin, M.; Bazilian, M. The Dimming of Lights in China during the COVID-19 Pandemic. Remote Sens. 2020, 12, 2851. [Google Scholar] [CrossRef]
  36. Liu, Q.; Sha, D.; Liu, W.; Houser, P.; Zhang, L.; Hou, R.; Lan, H.; Flynn, C.; Lu, M.; Hu, T.; et al. Spatiotemporal Patterns of COVID-19 Impact on Human Activities and Environment in Mainland China Using Nighttime Light and Air Quality Data. Remote Sens. 2020, 12, 1576. [Google Scholar] [CrossRef]
  37. Bustamante-Calabria, M.; Sánchez de Miguel, A.; Martín-Ruiz, S.; Ortiz, J.-L.; Vílchez, J.M.; Pelegrina, A.; García, A.; Zamorano, J.; Bennie, J.; Gaston, K.J. Effects of the COVID-19 Lockdown on Urban Light Emissions: Ground and Satellite Comparison. Remote Sens. 2021, 13, 258. [Google Scholar] [CrossRef]
  38. Liu, S.; Li, X.; Levin, N.; Jendryke, M. Tracing Cultural Festival Patterns Using Time-Series of VIIRS Monthly Products. Remote Sens. Lett. 2019, 10, 1172–1181. [Google Scholar] [CrossRef]
  39. Román, M.O.; Stokes, E.C. Holidays in Lights: Tracking Cultural Patterns in Demand for Energy Services. Earths Future 2015, 3, 182–205. [Google Scholar] [CrossRef]
  40. Hong, Y.; Wu, B.; Song, Z.; Li, Y.; Wu, Q.; Chen, Z.; Liu, S.; Yang, C.; Wu, J.; Yu, B. A Monthly Night-Time Light Composite Dataset of NOAA-20 in China: A Multi-Scale Comparison with S-NPP. Int. J. Remote Sens. 2021, 42, 7931–7951. [Google Scholar] [CrossRef]
  41. Chen, Z.; Yu, B.; Yang, C.; Zhou, Y.; Yao, S.; Qian, X.; Wang, C.; Wu, B.; Wu, J. An Extended Time Series (2000–2018) of Global NPP-VIIRS-like Nighttime Light Data from a Cross-Sensor Calibration. Earth Syst. Sci. Data 2021, 13, 889–906. [Google Scholar] [CrossRef]
  42. Chen, Z.; Yu, B.; Ta, N.; Shi, K.; Yang, C.; Wang, C.; Zhao, X.; Deng, S.; Wu, J. Delineating Seasonal Relationships between Suomi NPP-VIIRS Nighttime Light and Human Activity Across Shanghai, China. IEEE J. Sel. Top. Appl. Earth Obs. Remote Sens. 2019, 12, 4275–4283. [Google Scholar] [CrossRef]
  43. Wang, C.; Chen, Z.; Yang, C.; Li, Q.; Wu, Q.; Wu, J.; Zhang, G.; Yu, B. Analyzing Parcel-Level Relationships between Luojia 1-01 Nighttime Light Intensity and Artificial Surface Features across Shanghai, China: A Comparison with NPP-VIIRS Data. Int. J. Appl. Earth Obs. Geoinf. 2020, 85, 101989. [Google Scholar] [CrossRef]
  44. Jiang, W.; He, G.; Long, T.; Guo, H.; Yin, R.; Leng, W.; Liu, H.; Wang, G. Potentiality of Using Luojia 1-01 Nighttime Light Imagery to Investigate Artificial Light Pollution. Sensors 2018, 18, 2900. [Google Scholar] [CrossRef] [PubMed] [Green Version]
  45. Tveit, T.; Skoufias, E.; Strobl, E. Using VIIRS Nightlights to Estimate the Impact of the 2015 Nepal Earthquakes. Geoenviron. Disasters 2022, 9, 2. [Google Scholar] [CrossRef]
  46. Dal Zilio, L.; Ampuero, J.-P. Earthquake Doublet in Turkey and Syria. Commun. Earth Environ. 2023, 4, 71. [Google Scholar] [CrossRef]
  47. Joint Polar Satellite System (JPSS). VIIRS Radiometric Calibration Algorithm Theoretical Basis Document (ATBD). Available online: https://nsidc.org/sites/nsidc.org/files/technical-references/JPSS-ATBD-VIIRS-SDR-C.pdf (accessed on 5 May 2023).
  48. Zhang, X.; Liu, L.; Zhao, T.; Gao, Y.; Chen, X.; Mi, J. GISD30: Global 30-m Impervious Surface Dynamic Dataset from 1985 to 2020 Using Time-Series Landsat Imagery on the Google Earth Engine Platform. Earth Syst. Sci. Data 2022, 14, 1831–1856. [Google Scholar] [CrossRef]
  49. M 7.8—Pazarcik Earthquake, Kahramanmaras Earthquake Sequence. Available online: https://earthquake.usgs.gov/earthquakes/eventpage/us6000jllz/executive (accessed on 6 May 2023).
  50. Wu, S.; Zhou, S.; Bao, H.; Chen, D.; Wang, C.; Li, B.; Tong, G.; Yuan, Y.; Xu, B. Improving Risk Management by Using the Spatial Interaction Relationship of Heavy Metals and PAHs in Urban Soil. J. Hazard. Mater. 2019, 364, 108–116. [Google Scholar] [CrossRef] [PubMed]
  51. Li, X.; Li, D. Can Night-Time Light Images Play a Role in Evaluating the Syrian Crisis? Int. J. Remote Sens. 2014, 35, 6648–6661. [Google Scholar] [CrossRef]
  52. Under the Rubble: Gasps of Air, Protein Powder and Miraculous Rescues. Available online: https://www.nytimes.com/2023/02/14/world/europe/turkey-earthquake-rescue.html (accessed on 5 April 2023).
  53. ReliefWeb. Türkiye—Earthquake Response 2023: Malatya Humanitarian Snapshot (As of 27 April 2023)—Türkiye. Available online: https://reliefweb.int/report/turkiye/turkiye-earthquake-response-2023-malatya-humanitarian-snapshot-27-april-2023 (accessed on 10 May 2023).
  54. ABC News. Miraculous Moments as Survivors Pulled from Earthquake Rubble in Turkey, Syria. Available online: https://abcnews.go.com/International/dramatic-rescues-survivors-pulled-earthquake-rubble-turkey-syria/story?id=96960014 (accessed on 10 May 2023).
  55. Euronews. ‘Slow Humanitarian Response’ to Rebel-Controlled Syria after Earthquake Is ‘Deadly’: HWR|Euronews. Available online: https://web.archive.org/web/20230216041647/https://www.euronews.com/2023/02/16/slow-humanitarian-response-to-rebel-controlled-syria-after-earthquake-is-deadly-hwr (accessed on 19 June 2023).
  56. Sawah, L.; Alkheder, K.; Kibrasli, F. Modern Mechanisms for Restoring the National Economy of Syria. In Education Excellence and Innovation Management: A 2025 Vision to Sustain Economic Development During Global Challenges; Soliman, K.S., Ed.; Int Business Information Management Assoc-Ibima: Norristown, PA, USA, 2020; pp. 9435–9445. [Google Scholar]
  57. Guo, H.; Dou, C.; Chen, H.; Liu, J.; Fu, B.; Li, X.; Zou, Z.; Liang, D. SDGSAT-1: The World’s First Scientific Satellite for Sustainable Development Goals. Sci. Bull. 2023, 68, 34–38. [Google Scholar] [CrossRef]
Figure 1. (a) Study area; (b) cities in the study area.
Remotesensing 15 03438 g001
Figure 2. NOAA-20 VIIRS NTL data for (a) December 31, 2022; (b) and February 12, 2023. (The red rectangles in the figure for December 31, 2022 from left to right represent the NTL intensity of (a-i) Hatay, (a-ii) Gaziantep, (a-iii) Sanliurfa, and (a-iv) Ar Raqqah, respectively. The red rectangles in the figure for February 12, 2023 from left to right represent the NTL intensity of (b-i) Hatay, (b-ii) Gaziantep, (b-iii) Sanliurfa, and (b-iv) Ar Raqqah, respectively).
Remotesensing 15 03438 g002
Figure 3. (a) Change value and rate of NTL at the province scale. (The provinces are arranged in ascending order based on the NTL change value) and (b) correlation between the number of pixels with decreased NTL intensity and the number of injured populations. The red line is the regression line for the linear regression of the number of pixels with decreased NTL intensity and the number of injured populations.
Remotesensing 15 03438 g003
Figure 4. Change value of NTL intensity at the county scale.
Remotesensing 15 03438 g004
Figure 5. Change value of NTL intensity at the pixel scale. (a) Study area. (b) Kahramanmaraş. (c) Gaziantep. (d) Antakya.
Remotesensing 15 03438 g005
Figure 6. (a) Average change values of NTL intensity, (b) building density, and (c) population density for multiple buffers.
Remotesensing 15 03438 g006
Figure 7. Comparison of population density, building density, and average NTL change value. (All data were normalized. The grey thin solid lines in the figures show the threshold between the increase and decrease of NTL intensity, and the threshold values are 0.1174, 0.1236, 0.9325, 0.4871, 0.9602, 0.5056, 0.7847, and 0.5945, respectively). The eight subfigures consist of line charts depicting population density, building density, and average NTL change values in eight different directions: (a) north by east, (b) east by north, (c) east by south, (d) south by east, (e) south by west, (f) west by south, (g) west by north, (h) and north by west.
Remotesensing 15 03438 g007
Figure 8. LISA cluster graph of the relationship (a) between the average NTL intensity changes and population, and (b) between the average NTL intensity change and building density; the LISA significance graph of relationship (c) between the average NTL intensity changes and population and (d) between the average NTL intensity change and building density.
Remotesensing 15 03438 g008
Figure 9. Google Earth images of the part of cities with three risk levels. High-risk regions, such as (a-i) Antakya, (a-ii) Kirikhan, and (a-iii) Gaziantep; medium-risk regions, such as (b-i) Hamidiye, (b-ii) Ortaklor, and (b-iii) Hammamiyah; and low-risk regions, such as (c-i) Adana, (c-ii) Kavlaklı, and (c-iii) Aleppo.
Remotesensing 15 03438 g009
Disclaimer/Publisher’s Note: The statements, opinions and data contained in all publications are solely those of the individual author(s) and contributor(s) and not of MDPI and/or the editor(s). MDPI and/or the editor(s) disclaim responsibility for any injury to people or property resulting from any ideas, methods, instructions or products referred to in the content.