Abstract
Mining-induced or enhanced geo-hazards (MGHs) pose significant risks in rural mountainous regions with underground mining operations by harming groundwater layers, water circulation systems, and mountain stability. MGHs occurring in naturally contaminated environments can severely amplify socio-environmental risks. A high correlation was found among undermining development, precipitation, and hazards; however, details of MGHs have yet to be adequately characterized. This study investigated multiple mining-induced/enhanced geo-hazards in a naturally contaminated mountain region in Bone Bolango Regency, Gorontalo Province, Indonesia, in 2020, where a rapidly developing coexisting mining sector was present. We utilized PlanetScope’s CubeSat constellations and Sentinel-1 dataset to assess the volume, distribution, pace, and pattern of MGHs. The findings reveal that severe landslides and floods accelerated the mobilization of potentially toxic elements (PTEs) via the river water system, thus considerably exacerbating socio-environmental risks. These results indicate potential dangers of enhanced PTE contamination for marine ecosystems and humans at a regional level. The study design and data used facilitated a comprehensive assessment of the MGHs and associated risks, providing important information for decision-makers and stakeholders. However, limitations in the methodology should be considered when interpreting the findings. The societal benefits of this study include informing policies and practices that aim to mitigate the negative impacts of mining activities on the environment and society at the local and regional levels.
1. Introduction
Geological, morphological, climate, human activities, or a combination of these factors increase or enhance the vulnerability and frequency of geo-hazards [1,2,3,4] by altering the capacity of ecosystems around the world [5,6]. These geo-hazards pose considerable threats, leading to human casualties, displacement, loss of livelihoods, infrastructural damage, and agricultural losses [7,8]. Geo-hazards can act as substantial mechanisms for releasing and distributing potentially toxic elements (PTEs) [9]. In regions with severe and harmful underground mining activities in naturally high-PTE environments, geo-hazards would magnify socio-environmental risks by facilitating transport and transformation, thereby enhancing the accumulation of PTEs [10]. Therefore, to better characterize the geo-hazards details and impacts (e.g., locations, distribution, volumes, frequency, and tendency), explore the relationship between geo-hazards and associated factors, and estimate socio-environmental risks, it is vital to develop effective spatiotemporal monitoring methods to support the development of sustainable strategies for ecological and human health.
Mining-induced or enhanced geo-hazards (MGHs) pose significant risks in rural mountainous regions with underground mining operations. These hazards include subsidence, slope deformations, landslides, mud-rock flows, and floods. They harm groundwater layers, water circulation systems, and mountain stability [1,2,3,4]. These MGHs contribute to erosion, affecting downstream aquatic habitats [11]. However, due to the complex geographic settings and strong concealment, these hazards often go unnoticed [2,5,12]. Simultaneously, activities alter the distribution of precipitation, leading to changes in runoff, storage, and evaporation patterns [13]. This alteration increases the risk of floods. Mountaintop mining areas have reported high-risk geo-hazards, including heavy runoff and flash flooding [14,15,16]. Furthermore, global changes such as increases in precipitation magnitude [4] and fluctuations in the international gold price [17] could exacerbate these MGHs.
MGHs occurring in naturally contaminated environments can severely amplify socio-environmental risks. In the mountainous region of Bone Bolango, Indonesia, natural resources such as soil and water are contaminated with arsenic and lead due to the parent rock weathering system of igneous rocks, including volcanic and metamorphic rocks [18]. The coexisting mining sector, comprising large-scale mining (LSM) and artisanal and small-scale gold mining (ASGM), has rapidly expanded in rural mountain areas, driven by increases in the local gold price [19,20]. The ASGM sector excavates underground deposits and opens lands [10,21]. Notable PTEs such as mercury and cyanide are released from the ASGM sector, exacerbating soil and water resource contamination [18,19]. Previous studies have reported exceptionally high concentrations of arsenic, mercury, and lead in plants [22], sediments [22,23], soil [18], and water [22], exceeding regulatory limits [10,24,25,26,27,28,29,30]. The occurrence of MGHs in such geological environments is expected to significantly enhance the flows and accumulation of PTE contamination in water and soil. Hence, there is an urgent need for extensive spatiotemporal analyses to comprehensively understand the impacts of these hazards and the associated risks.
Remote sensing technology has emerged as an essential tool for swiftly and efficiently addressing MGH and disaster areas, including hazardous, inaccessible, and challenging terrains. It achieves this by systematically, synoptically, and cost-effectively capturing the Earth’s ground surface at various scales [4,10,19,20,21,31,32]. Multiple satellites with various spatiotemporal resolutions were used for MGH research, comprising multispectral satellite sensors, which include GeoEye1 (~1.84 m, ~8.3 days), Landsat (~30 m, 16 days), Quickbird (~2.62 m, ~3.5 days), Worldview-2 (~1.84 m, ~3.7 days), Pleiades (~2 m, daily) [5,33,34,35], synthetic aperture radar (SAR) satellite sensors [e.g., ALOS-2 (PALSAR, L-SAR, ~10 m (excluding wide mode), 14 days), COSMO-SkyMed (X-SAR, ~15 m, 16 days), ENVISAT (ASAR, C-SAR, ~30 m, 35 days), RadarSat-2 (C-SAR, ~40 m, 24 days), Sentinel-1 (S-1) (C-SAR, ~20 m, 12 days), TerraSAR-X (X-SAR, ~40 m, 11 days)] [36,37,38,39], or a combination of these [5,40,41]. The multispectral satellite platforms hosting passive sensor systems provide unique data on the ground surface. They have exceptionally high spatial, spectral, and temporal resolution [42], precise and quick retrieval capacity [43], and longer operative ranges. Therefore, they have been primarily utilized for detecting landslides and subsidence that have already occurred [33,34]. Furthermore, regions with heavy cloud coverage or tropical climates may pose a challenge for this type of sensor [4,19,20,21,31,32,44]. Whereas the SAR satellite platforms hosting active sensor systems with microwave domain bands acquire the surface’s backscattered intensity using cloud-penetrating properties [45], thus overcoming the passive sensors’ meteorological challenges. SAR is primarily used for detecting and monitoring slow-moving landslides employing techniques like InSAR [5,38,40], differential interferometric SAR (DInSAR) [36,37,38], and multitemporal interferometric SAR (MTInSAR) [5,37,38,40,41]. Similarly, they are used for flood detection and monitoring [3,43,46,47,48]. Despite SAR techniques’ advances, InSAR-based technology is especially suitable for large-scale geo-hazard detection with high surface coherence and moderate deformation rates [5]. Limited research has been conducted on multiple MGHs in regions characterized by rapid and extensive underground mining in naturally high-PTE environments.
At our research sites in regions with high-PTE contamination, MGHs occurred at high frequencies within and around mining areas, typically at small scales and with high densities. The rapid development of mining activities is strongly linked to massive flash floods [10]. A high correlation was found between undermining development, precipitation, and hazards [10]. However, rural geographic settings pose challenges for conducting sufficient impact assessments and monitoring. As previously discussed, the performance of remote sensing technology depends on technical parameters such as sensor type and spatiotemporal and radiometric resolutions. No single observation technique can be solely relied upon for timely MGH investigation in all fields [4,48,49]. Hence, selecting the most appropriate instrument depends on the targeted geo-hazard type, velocity, volume, and size. In this regard, we propose the use of high-spatiotemporal multispectral observation, such as PlanetScope’s (PS) CubeSat constellations (3 m, daily) comprising multiple satellite groups [50], together with SAR-based information, to identify the detailed characteristics of MGHs over time. Consequently, instead of monitoring a single MGH, our study primarily investigates the multiple MGHs (landslides and floods) in a time-series in Bone Bolango Regency, Gorontalo Province, Indonesia. Our specific objectives were to (1) characterize detailed flood impacts using a combination of the S-1 and PS series and (2) characterize the potential landslides using the PS and the World-Cover 2020 (WC2020) datasets.
Here, the novelty of our study includes the development of a novel spatiotemporal MGHs monitoring system in rapid and extensive underground mining in naturally high-PTE environments using a combination of multiple sensors and data sources.
2. Materials and Methods
2.1. Overall Methodological Workflow
Figure 1 shows the methodological workflow used in this study, organized into three main steps to achieve its primary objective of investigating multiple hazards in a naturally contaminated region. First, flood-induced impacts along the mid-lower Bone River were analyzed using a combination of the S-1 and PS datasets. The unsupervised image thresholding methodologies and supervised classification were applied to the S-1 and PS series. Second, the barren area was detected using the PS series with the supervised classification method and the WC2020 dataset. Third, newly occurring potential landslide areas were detected and characterized through time-series analysis by differentiating the results from Step 2. The methods used in each step are described in the subsequent sections.
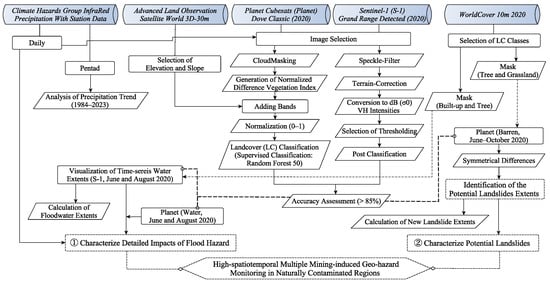
Figure 1.
Overall methodological workflow. Numbers correspond to specific objectives: (1) characterize detailed flood impacts using a combination of the Sentinel-1 and Planet series; (2) characterize the potential landslides using the Planet and the World-Cover 2020 datasets.
2.2. Study Area
The study area is located in the lower to middle part of the Bone River and its southern mountainous regions within Bone Bolango Regency, Indonesia (Figure 2). This area is particularly vulnerable to environmental degradation and threats to human health due to natural and underground mining activities involving PTEs. The Gorontalo Minerals project (a joint venture of LSM) and ASGM are also located in the southern part of the Bone River. In ASGM deposits, including Mohutango, Motomboto West, Motomboto East, and Tulabolo, mercury and cyanide are used in gold extraction [18,19] (Figure 3).
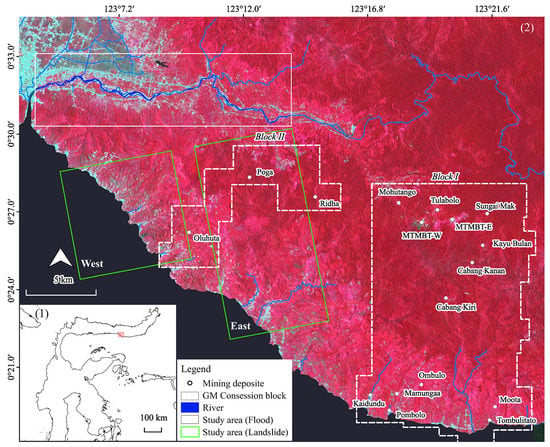
Figure 2.
Study area: (1) regional overview, (2) a median Sentinel-2 imagery from January to December 2020 (cloud coverage < 30, RGB: 843). The study area in the top panel corresponds to the flood assessment caused in August 2020. Study areas in the lower panels (East and West) correspond to potential landslide assessment.
Disasters, such as floods, riverbank erosion, river sedimentation, and landslides, are typical in this area [51,52,53]. This study targets the Bone River flood, peaking on 1 August 2020, due to the high-intensity precipitation, which influenced several subdistricts, affected approximately 2500 people, damaged a 1250 m embankment with a maximum flood depth of 2 m, and caused landslides [54]. Other landslides were reported in the river’s southern district on 7 September 2020 [55].
We refer to our direct field measurements previously conducted at the Motomboto sites in 2020 [19,20,23].
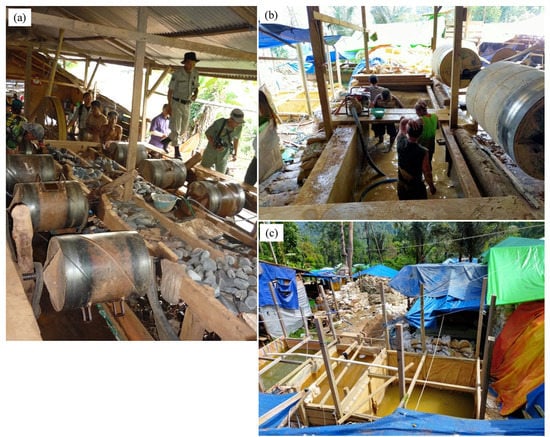
Figure 3.
AGSM activities in the Motomboto deposits in the concession Block I. (a) Small ball mills [56]; (b) pool of water mixed with hydrogen peroxide; and (c) pool of mercury mixed with cyanide for immersing materials [19].
2.3. Satellite Imagery and Data Processing
2.3.1. Sentinel-1 Series
The S-1 C-band SAR level-1 grand range detected datasets (interferometric wide-swath mode, descending, vertical-horizontal polarization) acquired from August to October 2020 were used to extract water extents. By referring to the Climate Hazards Group InfraRed Precipitation with Station (CHIRPS) data, the S-1 image acquired on 3 June 2020 was used as a pre-flood stage. Speckle filtering, terrain correction, and the conversion of the intensity value to σ0, were applied for image processing.
2.3.2. PlanetScope Series
PS’s Dove Classic (hereafter referred to as Planet) surface reflectance products (Ortho Scene–Analytic Level 3B) [57] from June to October 2020 were used to investigate the detailed flood impacts and potential landslide areas. The image acquisition time is based on the image availability during the study period. Although PS’s Dove-R and SuperDove have been operating since March 2019 and March 2020, respectively, only Planet imagery was available based on PS’s operational priorities [58]. After applying a cloud-masking function, the normalized difference vegetation index (NDVI) was generated using Equation (1). The NDVI index and the elevation and slope data from the Advanced Land Observing Satellite World 3D-30 m were added to each composite to increase the image classification quality. Subsequently, the data were normalized, ranging from 0 to 1.
NDVI = (NIR − Red)/(NIR + Red)
2.3.3. World Landcover Dataset
The European Space Agency (ESA) provided a WC2020 map with a 10 m ground resolution, which was generated by the S-1 and Sentinel-2 datasets [59]. The non-built-up and -tree classes and the non-tree and -grassland classes were extracted from the WC2020 product, respectively, for masking results generated from Section 2.4.
2.3.4. Climate Hazards Group InfraRed Precipitation with Station Dataset
Using the CHIRPS data, the time-series precipitation of the study area was simultaneously assessed for vulnerability to flood and landslide hazards. The precipitation trends were also statistically evaluated using the nonparametric Mann–Kendall test with a 95% confidence level of significance, followed by Sen’s slope test if any trend existed.
The S-1, CHIRPS, Planet, and WC2020 datasets were processed through Google Earth Engine; thereby, nine S-1 and five Planet images were generated. Table 1 summarizes the main specifications of the imagery and sensors used in this study.

Table 1.
Specifications of satellite imagery.
2.4. Water Area Detection, Landcover Classification, and Accuracy Assessment
Although various SAR-based techniques for flood detection were used, threshold-based methods are commonly applied in unsupervised classification due to their simplicity and flexibility [60]. For the S-1 datasets generated from Section 2.3.1, we applied 16 different automatic thresholding algorithms [61,62,63,64,65,66,67,68,69,70,71,72,73,74,75] to create water and non-water binary images using an open-source Java image processing package, Fiji (version 2.1.0) software (https://imagej.net/software/fiji/: accessed on 1 May 2023). After applying the best separability thresholding values by image, post-classification was applied.
A supervised classification was applied to the Planet results generated from Section 2.3.2 for the time-series landcover transformation analysis. Landcover classes were categorized as agriculture/barren, built-up, vegetation, water, and river sand. The ground control points were determined at the pixel level. A simple random forest classifier with 50 decision trees, a machine learning method, was used. Overall accuracy was employed to evaluate the accuracy of the produced maps.
The resulting water from the S-1 and Planet series and barren areas from the Planet series were then separately masked by the results generated from Section 2.3.3. Subsequently, the 3 June 2020 (S-1) result was validated using the Planet imagery from 5 June 2020. One hundred points were randomly selected from the S-1 imagery and overlayed with the Planet result. After that, this accuracy level was applied to all S-1 results due to the unavailability of data captured on the same date. For the Planet series, the overall accuracy (OA) from confusion matrices was used to assess the accuracy of the produced map by comparing the predicted and actual values. Based on the imagery, >85% of OA was targeted both for the S-1 and Planet datasets.
The ground control point, classifier, post-classification, accuracy assessment, and masking results were implemented in Google Earth Engine. The total water and landslide extents were calculated and visualized.
2.5. Potential Landslide Detection Using Plant Datasets
Based on the result generated in Section 2.4, symmetrical differences in the barren extent between a two time period, (1) 5 or 17 June to 21 August 2020, (2) 21 August to 21 September 2020, and (3) 21 September to 9 October 2020, were computed, and highlighted areas were visualized. Moreover, remarkable areas were also visualized in 3D using the Quantum Geographic Information System.
3. Results
3.1. Time-Series Flood Inundation Areas Using Multiple Satellite Datasets
Based on the validation, the IJ_Isodata algorithm showed the best locally sensitive algorithm (−15.29, 3 June 2020) in this study, achieving 86.0% accuracy. Subsequently, image-specific thresholding values for water extraction using the S-1 datasets were −16.17 (2 August 2020), −17.10 (14 August 2020), −16.66 (26 August 2020), −16.38 (7 September 2020), −15.95 (19 September 2020), −15.81 (1 October 2020), −15.73 (13 October 2020), and −15.88 (25 October 2020). Figure 4 demonstrates the time-series water extents resulting from Section 2.4. The water extent observed on 3 June 2020 was 3.1 km2 (Figure 4a). As described in Section 2.2, the overflow peaked on 1 August 2020 due to the high-intensity precipitation [54]. A peak change was significantly observed on 2 and 14 August 2020 (4.1 km2, Figure 4b,c) by expanding river extents, followed by 26 August 2020 (3.7 km2, Figure 4d), and 7 September 2020 (3.8 km2, Figure 4e). The increased water extent was again observed on 19 September and 1 October 2020 (4.2 km2, Figure 4f,g), 13 October 2020 (4.3 km2, Figure 4h), and 25 October 2020 (4.7 km2, Figure 4i). Even though the flood peak image was unavailable from S-1, the water expansion showed 131.8% between 3 June and 2 August 2020. High precipitation >15 mm was observed on 6 October (16.7 mm), 14 October (27.7 mm), and 15 October (27.6 mm). Small pixels in the northern river corresponded to the cropland (Figure 4a–i).
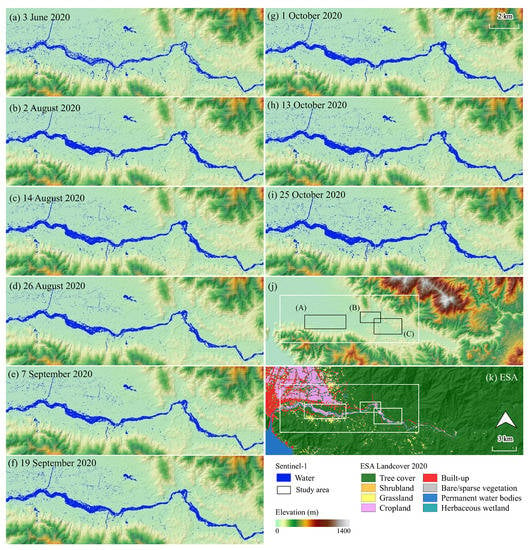
Figure 4.
Study area: (a–i) water extents extracted from the Sentinel-1 datasets using the IJ_Isodata thresholding algorithm overlapped with the topographical setting; (j) topographical setting; and (k) ESA WC2020 overlapped with the data from the Shuttle Radar Topography Mission. The areas with white highlighted in (j,k) are the overview of (a–i), which also correspond to the water-assessing extents. The areas (A–C) in (j,k) correspond to the highlighted areas in Figure 5.
Landcover maps’ overall accuracies generated from the Planet datasets were 87.8% (5 June 2020), 88.0% (17 June 2020), 86.7% (21 August 2020), 93.1% (23 August 2020), 86.4% (21 September 2020), 91.7% (9 October 2020), and 87.5% (22 October 2020). Figure 5 demonstrates the detailed flood-induced changes from 3 June to 23 August 2020, using the S-1 and Planet datasets. The flood expanded the river’s extent, causing changes in the river course and landcover. The Planet images demonstrated significant agricultural land removals between 5 or 17 June and 23 August 2020 [Figure 5(Ae,f,Be,f,Ce,f)]. The river course change was significant in the meandering area [Figure 5(Be,f)].
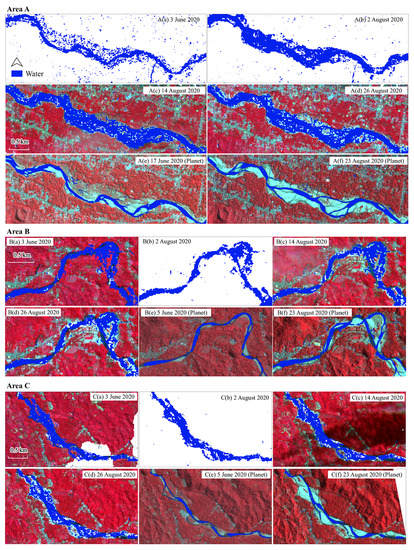
Figure 5.
Water in the area (A–C) generated from Sentinel-1 and Planet series: (Aa–d,Ba–d,Ca–d) water extents extracted from the Sentinel-1 datasets using the IJ_Isodata thresholding algorithm overlapped with Sentinel-2′s color infrared band combination (RGB:843) [3 June (A–Ca), 2 August (A–Cb), 14 August (A–Cc), and 26 August 2020 (A–Cd)]. Here, while areas are either unavailable for imaging (Aa,A–Cb) or covered by cloud (Ca), (Ae,f,Be,f,Ce,f) water is classified by Planet datasets overlayed on the Planet’s color infrared band combination (RGB:432) [17 June (Ae), 5 June (Be,Ce), and 23 August 2020 (A–Cf)]. The area (A–C) corresponds to Figure 4j,k.
3.2. Time-Series Landslide Areas Detection Using Plant CubeSat Datasets
Figure 6 demonstrates the time-series landcover transformations of the east and west areas from 5 June 2017 to 9 October 2020. In the west area, the barren extent observed on 17 June 2020 was 0.92 km2 (Figure 6a). It decreased to 0.56 km2 on 21 August 2020 (Figure 6b). A peak change was significantly observed on 21 September 2020 (1.83 km2) (Figure 6c), followed by 0.95 km2 on 9 October 2020 (Figure 6d). Those in the east area were 2.86 km2 (5 June 2020, Figure 6a), 2.59 km2 (21 August 2020, Figure 6b), 3.09 km2 (21 August 2020, Figure 6c), and 2.02 km2 (9 October 2020, Figure 6d), respectively. A peak change in the east area was also observed on 21 September 2020 (Figure 6f). During the peak period from 21 August to 21 September 2020, landslides were reported on 7 September 2020 [55].
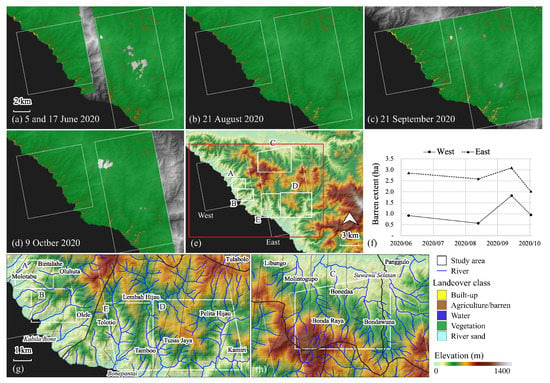
Figure 6.
Study area: (a–d) landcover classification using Planet datasets (June–October 2020) overlapped with the data from the Shuttle Radar Topography; (e) overview of the study area overlapped with the topographical setting. The area highlighted in red in (e) is the overview of (a–d). The areas (east and west) in (e) correspond to the assessing bare extents. The areas (A–E) in (e) correspond to the highlighted areas in Figure 7 and (f) the barren extent of the areas in time-series; and (g,h) provides an overview of the areas (A–E) and village boundary.
Figure 7 demonstrates the potential landslide extents based on three time periods: (1) 5 or 17 June to 21 August 2020; (2) 21 August to 21 September 2020; and (3) 21 September to 9 October 2020. Subsequently, newly occurring extents were graphed (Figure 8). Potential landslides were widespread from the top of mountains and toward the coastal areas; however, notable events were observed at the valley riversides, where built-up areas are concentrated. Notable peaks were found in period (2): 14.4 ha (area A), 19.8 ha (B), and 28.3 ha (E) (Figure 7b,e,n). Area A experienced the highest increase (4.9-fold), followed by areas B and E (2.9-fold). Although these newly occurring barren extents in period (2) were turned into vegetation extents in period (3) [94%, 100%, and 99% in areas A, B, and E, respectively], additional landslides continuously occurred along riverside areas (Figure 7c,f,o). Built-up areas situated in these critical sites are Molotabu (area A) and Oluhata villages (area B) in Kabila Bone District and Lembah Hijau (area E) in Bonepantai District. Whereas significant increases in mountain areas C crossing Molintogupo, Bandra Raya, Bonedaa, and Bondawuna villages in South Suwawa District and area D crossing Pelita Hijau and Kamiri villages in South Suwawa District found in period (1) were demonstrated as 34.8 ha (area C, Figure 7g) and 45.2 ha (area D, Figure 7j). Fewer landslides in area C were observed in periods (2) (9.3 ha) and (3) (2.1 ha), turning large parts back into vegetation extents (Figure 7h,i). Notably, vulnerable areas were also visualized in 3D images (Figure 9).
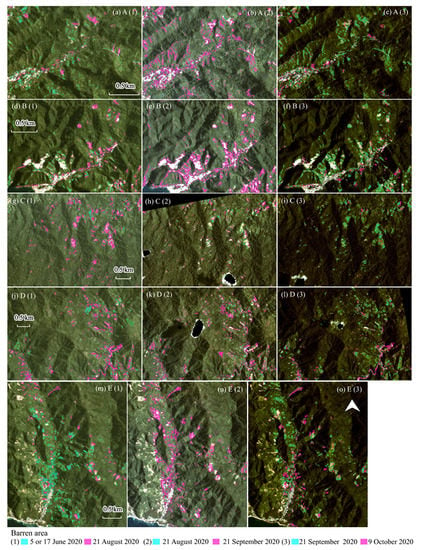
Figure 7.
New potential landslides in areas (A–E) generated from Planet series overlayed on its true color band combination (RGB:321): (1–3) time periods: (1) 5 or 17 June to 21 August 2020; (2) 21 August to 21 September 2020; and (3) 21 September to 9 October 2020. The latter images were set as background images: (a–c) symmetrical differences of barren area (SDoB) in area (A) in period (1–3); (d–f) SDoB in area (B) in period (1–3); (g–i) SDoB in the area (C) in period (1–3); (j–l) SDoB in area (D) in period (1–3); and (m–o) SDoB in area (E) in period (1–3). The areas correspond to the areas (A–E) in Figure 6e,g,h.

Figure 8.
Potential landslide extents by area (A–E).
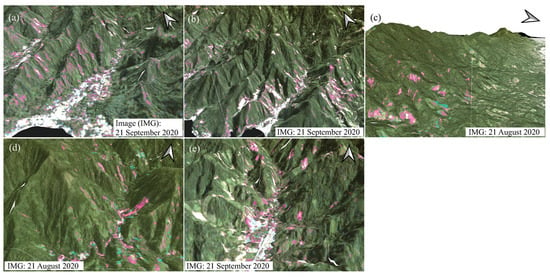
Figure 9.
A 3D map of notable areas generated from Planet series (RGB:321): (a) symmetrical differences of barren area (SDoB) in period (2) in Area A; (b) SDoB in period (2) in Area B; (c) SDoB in period (1) in Area C; (d) SDoB in period (1) in Area D; and (e) SDoB in period (2) in Area E.
3.3. Time-Series Precipitation Trend
The monthly precipitation from January 1981 to March 2023 was computed using the CHIRPS Pentad dataset. The maximum and minimum monthly precipitation were 362.8 mm (June 2006) and 3.8 mm (August 2002), respectively, whereas the average monthly precipitation value was 101.5 mm. The statistical test described in Section 2.3.4 showed a positive increasing trend with a 0.05 slope (p = 0.0037).
4. Discussion
4.1. Time-Series Analysis of Multiple Mining-Enhanced Geo-hazards Combining Multiple Data
PTE contamination from the rapid development of coexisting mining sectors, particularly mercury release, can exacerbate contamination in regions already contaminated with high levels of arsenic and lead via natural processes. These PTEs are quickly mobilized and transformed on a large-scale in surface and groundwater systems and are further accelerated by the powerful and prominent distribution mechanisms of geo-hazards [9]. The systematic analysis of MGHs requires the combination of multiple data sources and methodologies to overcome limitations imposed by meteorological and geometric factors. This study demonstrates the detailed impacts of multiple MGHs, such as floods and landslides, over time using a combination of the high-spatiotemporal resolution multispectral and SAR datasets.
To date, few studies have examined multiple MGHs in naturally contaminated regions. Previous research on MGHs, particularly on landslides in mountainous areas, has primarily involved the exploration of surface subsidence using InSAR-based approaches (e.g., DInSAR and MTInSAR) for detection and monitoring. These studies were limited to large areas with well-known mining histories, where slow-moving surface subsidence is primarily caused by prolonged and intensive mining. Even when optical images were used for landslide detection, they were demonstrated at longer intervals [5,34,40]. In comparison, our study quantified multiple MGHs (floods and fast-moving landslides) in short intervals, addressing the rapidly developing coexisting mining sector using the high-spatiotemporal PS series and associated with possible PTE contamination. Although we demonstrated landslide change detection within 18–31 days due to area coverage, observation within a much shorter period could be available by targeting a particular site.
Other recent investigations have focused on similar study areas, with annual ASGM developments and their activity volume mainly demonstrated using Landsat with ground resolutions of 30 m [19,20]. The mining sites in the northern part of Block I were expanded 18.6-fold from 1995 to 2020 with large influxes of miners, which correlated with increases in local gold prices [19]. The high-spatiotemporal PS series was used to reveal detailed transformations of the ASGM and LSM sites [21], and the potential distribution of enhanced PTE contaminations from coexisting mining and natural activities was further visualized [10]. Currently, a 30 km mining road is under construction with an investment of 24 million USD (MUSD), which connects the mining sites to the southern port in concession Block I [10,21]. Additionally, mining-related infrastructure constructions [e.g., a gold ore processing plant (29 MUSD), drilling two gold prospects (24 MUSD), mining support facilities (21 MUSD), and a waste treatment facility (10 MUSD)] [76] would rapidly follow after the development of the mining road. Although a strong correlation among river hazards, mining development, and precipitation was statistically found from 2019 to 2021 with yearly datasets in a previous study [10], considerable MGH chains were not addressed. In contrast, our study quantified multiple MGHs (floods and landslides) in short intervals to better estimate socio-environmental risks from enhanced PTE contamination (Figure 5, Figure 7 and Figure 9). Therefore, our work expanded upon the study [10], allowing us to assess the MGH volume, distribution, pace, and pattern associated with mining development.
4.2. Potential Impacts of Multiple Mining-Enhanced Geo-Hazards in Contaminated Regions
The increasing trend of precipitation is anticipated to raise socio-environmental risks. Therefore, high-spatiotemporal observations of multiple MGHs can help to characterize and quantify the relative impacts of MGHs and predict socio-environmental risks. Our results showed that floods had critical impacts on river course changes, causing the removal of agricultural lands [Figure 5(Ae,f,Be,f,Ce,f)]. As described in the Introduction section, riverbank sediments were naturally contaminated with arsenic and lead [22,23]. The erosion of agricultural soil with fertilizer, which is a critical anthropogenic factor for PTE soil contamination [77,78], can easily spread to rivers and residential areas, posing a threat to human health and the environment [79].
We also found severe landslides were widely observed in the coastal valley riverside areas, where built-up areas are concentrated (Figure 7 and Figure 9). While notable peaks of landslide occurrence varied, additional landslides continuously occurred along the riverside areas in the valley (Figure 7 and Figure 9). This remarkable tendency can lead to the loss of human lives and accelerate PTE mobilization through the river water system, increasing PTE contamination risks for marine ecosystems and bay-side localities that depend mainly on marine products. In the related mining area, previous field-based approaches were conducted to assess contamination (i.e., arsenic, mercury, and lead) in plants [22], sediments [22,23], soil [18], and water [22] to alert socio-environmental risks. Furthermore, the potential enhanced distribution of multiple PTE contaminations from various sources was addressed [10]. In comparison, our study comprehensively assessed multiple MGHs at a hazardous, inaccessible, and broader scale to evaluate socio-environmental risks.
4.3. Limitations
This study had certain meteorological, geometric, and operational limitations. First, although the PS series is available daily, the region’s high cloud coverage limits cloud-free data. Second, although the SAR is a weather-independent active sensor, geometric errors caused by the SAR’s side-looking operation can result in notable misclassification, particularly in mountain regions. Third, due to the PS series’ operation period, the applied methodologies were limited only to the period after 2016. Furthermore, we assessed the SDoB extents between the two time periods to assess potential landslides; however, barren temporal areas on the image acquisition time could be included.
5. Conclusions
In this study, we utilized a combination of the PS and S-1 datasets to quantify the multiple MGHs (floods and landslides) in Bone Bolango, Indonesia, where PTE contamination from natural and underground mining activities is enhanced by the powerful and prominent distribution mechanisms of geo-hazards. Our geo-hazards-specific spatiotemporal observation methodology allowed us to characterize spatiotemporal impacts, including MGHs’ volume, distribution, pace, pattern, and notably prone areas over a shorter time period. In a region where enhanced PTE contamination is aggravated by, regardless of the occurrence of disasters, MGHs’ continuous high-spatiotemporal monitoring can help identify the factors accelerating PTE contamination on a broader scale. Recognizing this level of detail grants a better understanding of the relationship associated with coexisting mining development’s massive and rapid pace. Understanding the association between MGHs and mining activities can also help estimate and alert to enhanced PTE contamination risks for marine ecosystems and humans locally. While this study focused on quantifying multiple MGHs based on the flood hazard that peaked on 1 August 2020, future work in this area could aim to assess the relationship between multiple detailed disasters and the massive mining development for a longer time. Furthermore, we could estimate contamination levels at river mouths or estuaries in time-series, where contamination would be accumulated through natural activities and the ongoing massive mining development.
Author Contributions
S.K. contributed to the conceptualization of the research, methodology, data analysis, data visualization, writing—original draft preparation, and writing—review and editing. M.N. provided the PS datasets. All authors have read and agreed to the published version of the manuscript.
Funding
Article Processing Charge was supported by the Research Institute for Humanity and Nature (RIHN: a constituent member of NIHU). Project No. RIHN 14200102.
Data Availability Statement
Not applicable.
Acknowledgments
We thank the Center for Research and Application of Satellite Remote Sensing, Yamaguchi University, Japan, for providing the PS datasets for this research. We also thank the anonymous reviewers for their constructive comments that strengthened the work.
Conflicts of Interest
The authors declare no conflict of interest.
References
- U.S. Geological Survey. Landslide Types and Processes. 2004. Available online: https://pubs.usgs.gov/fs/2004/3072/fs-2004-3072.html (accessed on 1 June 2023).
- Yang, Y.-Y.; Xu, Y.-S.; Shen, S.-L.; Yuan, Y.; Yin, Z.-Y. Mining-induced geo-hazards with environmental protection measures in Yunnan, China: An overview. Bull. Eng. Geol. Environ. 2015, 74, 141–150. [Google Scholar] [CrossRef]
- Kimijima, S.; Nagai, M. High Spatiotemporal Flood Monitoring Associated with Rapid Lake Shrinkage Using Planet Smallsat and Sentinel-1 Data. Remote Sens. 2023, 15, 1099. [Google Scholar] [CrossRef]
- Casagli, N.; Intrieri, E.; Tofani, V.; Gigli, G.; Raspini, F. Landslide detection, monitoring and prediction with remote-sensing techniques. Nat. Rev. Earth Environ. 2023, 4, 51–64. [Google Scholar] [CrossRef]
- Jiao, R.; Wang, S.; Yang, H.; Guo, X.; Han, J.; Pei, X.; Yan, C. Comprehensive Remote Sensing Technology for Monitoring Landslide Hazards and Disaster Chain in the Xishan Mining Area of Beijing. Remote Sens. 2022, 14, 4695. [Google Scholar] [CrossRef]
- Shao, L. Geological disaster prevention and control and resource protection in mineral resource exploitation region. Int. J. Low-Carbon Technol. 2019, 14, 142–146. [Google Scholar] [CrossRef]
- Lakshmi, V. Remote Sensing of Hydrological Extremes; Springer Remote Sensing/Photogrammetry: Berlin/Heidelberg, Germany, 2016. [Google Scholar]
- The UN Office for Disaster Risk Reduction. Human Cost of Disasters: An Overview of the Last 20 Years (2000–2019); The UN Office for Disaster Risk Reduction: Geneva, Switzerland, 2020. [Google Scholar] [CrossRef]
- Young, S.; Balluz, L.; Malilay, J. Natural and technologic hazardous material releases during and after natural disasters: A review. Sci. Total. Environ. 2004, 322, 3–20. [Google Scholar] [CrossRef]
- Kimijima, S.; Nagai, M.; Sakakibara, M. Distribution of Enhanced Potentially Toxic Element Contaminations Due to Natural and Coexisting Gold Mining Activities Using Planet Smallsat Constellations. Remote Sens. 2023, 15, 861. [Google Scholar] [CrossRef]
- May, C.; Roering, J.; Eaton, L.; Burnett, K. Controls on valley width in mountainous landscapes: The role of landsliding and implications for salmonid habitat. Geology 2013, 41, 503–506. [Google Scholar] [CrossRef]
- Bekaert, D.P.; Handwerger, A.L.; Agram, P.; Kirschbaum, D.B. InSAR-based detection method for mapping and monitoring slow-moving landslides in remote regions with steep and mountainous terrain: An application to Nepal. Remote Sens. Environ. 2020, 249, 111983. [Google Scholar] [CrossRef]
- Caretta, M.A.; Fernandez, R.; Zegre, N.; Shinn, J. Flooding Hazard and Vulnerability. An Interdisciplinary Experimental Approach for the Study of the 2016 West Virginia Floods. Front. Water 2021, 3, 60. [Google Scholar] [CrossRef]
- Zégre, N.P.; Maxwell, A.; Lamont, S. Characterizing streamflow response of a mountaintop-mined watershed to changing land use. Appl. Geogr. 2013, 39, 5–15. [Google Scholar] [CrossRef]
- Inside Climate News. Appalachia’s Strip-Mined Mountains Face a Growing Climate Risk: Flooding. 2019. Available online: https://insideclimatenews.org/news/21112019/appalachia-mountains-flood-risk-climate-change-coal-mining-west-virginia-extreme-rainfall-runoff-analysis/ (accessed on 1 June 2023).
- Deutsche Welle. Deforestation Causing Flash Floods in Papua; Deutsche Welle: Bonn, Germany, 2019. [Google Scholar]
- World Gold Council. Gold Prices. 2021. Available online: https://www.gold.org/goldhub (accessed on 1 June 2023).
- Gafur, N.A.; Sakakibara, M.; Komatsu, S.; Sano, S.; Sera, K. Environmental Survey of the Distribution and Metal Contents of Pteris vittata in Arsenic–Lead–Mercury-Contaminated Gold Mining Areas along the Bone River in Gorontalo Province, Indonesia. Int. J. Environ. Res. Public Health 2022, 19, 530. [Google Scholar] [CrossRef]
- Kimijima, S.; Sakakibara, M.; Nagai, M.; Gafur, N.A. Time-Series Assessment of Camp-Type Artisanal and Small-Scale Gold Mining Sectors with Large Influxes of Miners Using LANDSAT Imagery. Int. J. Environ. Res. Public Health 2021, 18, 9441. [Google Scholar] [CrossRef]
- Kimijima, S.; Sakakibara, M.; Nagai, M. Detection of Artisanal and Small-Scale Gold Mining Activities and Their Transformation Using Earth Observation, Nighttime Light, and Precipitation Data. Int. J. Environ. Res. Public Health 2021, 18, 10954. [Google Scholar] [CrossRef]
- Kimijima, S.; Nagai, M.; Sakakibara, M. Monitoring Coexisting Rapid Small-Scale and Large-Scale Gold Mining Developments Using Planet Smallsats Constellations. Mining 2022, 2, 566–577. [Google Scholar] [CrossRef]
- Gafur, N.A.; Sakakibara, M.; Sano, S.; Sera, K. A case study of heavy metal pollution in water of Bone river by ASGM activities in Eastern part of Gorontalo, Indonesia. Water 2018, 10, 1507. [Google Scholar] [CrossRef]
- Basir; Kimijima, S.; Sakakibara, M.; Pateda, S.M.; Sera, K. Contamination Level in Geo-Accumulation Index of River Sediments at Artisanal and Small-Scale Gold Mining Area in Gorontalo Province, Indonesia. Int. J. Environ. Res. Public Health 2022, 19, 6094. [Google Scholar] [CrossRef]
- World Health Organization. Guidelines for Drinking-Water Quality. 2022. Available online: https://apps.who.int/iris/bitstream/handle/10665/352532/9789240045064-eng.pdf?sequence=1&isAllowed=y#page=29 (accessed on 1 June 2023).
- U.S. Environmental Protection Agency. Clean Water Act: Section 503; U.S. Environmental Protection Agency: Washington, DC, USA, 1993.
- Palapa, T.M.; Maramis, A.A. Heavy Metals in Water of Stream Near an Amalgamation Tailing Ponds in Talawaan—Tatelu Gold Mining, North Sulawesi, Indonesia. Procedia Chem. 2015, 14, 428–436. [Google Scholar] [CrossRef]
- Persaud, D.; Jaagumagi, R.; Hayton, A. Guidelines for the Protection and Management of Aquatic Sediment Quality in Ontario; Ministry of Environment and Energy: Toronto, ON, Canada, 1993. [Google Scholar] [CrossRef]
- U.S. Environmental Protection Agency. The Incidence and Severity of Sediment Contamination in Surface Waters of the United States, Volume 1—National Sediment Quality Survey; U.S. Environmental Protection Agency: Washington, DC, USA, 1997.
- MacDonald, D.D.; Ingersoll, C.G.; Berger, T.A. Development and Evaluation of Consensus-Based Sediment Quality Guidelines for Freshwater Ecosystems. Arch. Environ. Contam. Toxicol. 2000, 39, 20–31. [Google Scholar] [CrossRef]
- Ontario Ministry of Environment Conservation and Parks. Rules for Soil Management and Excess Soil Quality Standards; Ontario Ministry of Environment Conservation and Parks: Toronto, ON, Canada, 2020. [Google Scholar]
- Kimijima, S.; Sakakibara, M.; Nagai, M. Characterizing Time-Series Roving Artisanal and Small-Scale Gold Mining Activities in Indonesia Using Sentinel-1 Data. Int. J. Environ. Res. Public Health 2022, 19, 6266. [Google Scholar] [CrossRef] [PubMed]
- Kimijima, S.; Sakakibara, M.; Nagai, M. Investigation of Long-Term Roving Artisanal and Small-Scale Gold Mining Activities Using Time-Series Sentinel-1 and Global Surface Water Datasets. Int. J. Environ. Res. Public Health 2022, 19, 5530. [Google Scholar] [CrossRef] [PubMed]
- Wang, Q.; Guo, H.; Chen, Y.; Lin, Q.; Li, H. Application of remote sensing for investigating mining geological hazards. Int. J. Digit. Earth 2013, 6, 449–468. [Google Scholar] [CrossRef]
- Yi, Z.; Liu, M.; Liu, X.; Wang, Y.; Wu, L.; Wang, Z.; Zhu, L. Long-term Landsat monitoring of mining subsidence based on spatiotemporal variations in soil moisture: A case study of Shanxi Province, China. Int. J. Appl. Earth Obs. Geoinf. 2021, 102, 102447. [Google Scholar] [CrossRef]
- Satellite Imaging Corporation. Satellite Sensors. 2023. Available online: https://www.satimagingcorp.com/satellite-sensors/ (accessed on 1 June 2023).
- Xu, X.; Ma, C.; Lian, D.; Zhao, D. Inversion and Analysis of Mining Subsidence by Integrating DInSAR, Offset Tracking, and PIM Technology. J. Sens. 2020, 2020, 4136837. [Google Scholar] [CrossRef]
- Ma, C.; Cheng, X.; Yang, Y.; Zhang, X.; Guo, Z.; Zou, Y. Investigation on Mining Subsidence Based on Multi-Temporal InSAR and Time-Series Analysis of the Small Baseline Subset—Case Study of Working Faces 22201-1/2 in Bu’ertai Mine, Shendong Coalfield, China. Remote Sens. 2016, 8, 951. [Google Scholar] [CrossRef]
- Liu, D.; Shao, Y.; Liu, Z.; Riedel, B.; Sowter, A.; Niemeier, W.; Bian, Z. Evaluation of InSAR and TomoSAR for Monitoring Deformations Caused by Mining in a Mountainous Area with High Resolution Satellite-Based SAR. Remote Sens. 2014, 6, 1476–1495. [Google Scholar] [CrossRef]
- Remote Sensing Technology Center of Japan. Satellite Information Database. 2023. Available online: https://www.restec.or.jp/en/index.html (accessed on 1 June 2023).
- Sousa, J.J.; Liu, G.; Fan, J.; Perski, Z.; Steger, S.; Bai, S.; Wei, L.; Salvi, S.; Wang, Q.; Tu, J.; et al. Geohazards Monitoring and Assessment Using Multi-Source Earth Observation Techniques. Remote Sens. 2021, 13, 4269. [Google Scholar] [CrossRef]
- Ma, D.; Zhao, S. Quantitative Analysis of Land Subsidence and Its Effect on Vegetation in Xishan Coalfield of Shanxi Province. ISPRS Int. J. Geo-Inf. 2022, 11, 154. [Google Scholar] [CrossRef]
- Psomiadis, E.; Diakakis, M.; Soulis, K.X. Combining SAR and Optical Earth Observation with Hydraulic Simulation for Flood Mapping and Impact Assessment. Remote Sens. 2020, 12, 3980. [Google Scholar] [CrossRef]
- Chen, Z.; Zhao, S. Automatic monitoring of surface water dynamics using Sentinel-1 and Sentinel-2 data with Google Earth Engine. Int. J. Appl. Earth Obs. Geoinf. 2022, 113, 103010. [Google Scholar] [CrossRef]
- Kimijima, S.; Nagai, M.; Sakakibara, M.; Jahja, M. Investigation of Cultural–Environmental Relationships for an Alternative Environmental Management Approach Using Planet Smallsat Constellations and Questionnaire Datasets. Remote Sens. 2022, 14, 4249. [Google Scholar] [CrossRef]
- The National Aeronautics and Space Administration. What Is Synthetic Aperture Radar? The National Aeronautics and Space Administration: Washington, DC, USA, 2022. [Google Scholar]
- Ireland, G.; Volpi, M.; Petropoulos, G.P. Examining the Capability of Supervised Machine Learning Classifiers in Extracting Flooded Areas from Landsat TM Imagery: A Case Study from a Mediterranean Flood. Remote Sens. 2015, 7, 3372–3399. [Google Scholar] [CrossRef]
- Long, S.; Fatoyinbo, T.; Policelli, F. Flood extent mapping for Namibia using change detection and thresholding with SAR. Environ. Res. Lett. 2014, 9, 035002. [Google Scholar] [CrossRef]
- Lei, T.; Wang, J.; Li, X.; Wang, W.; Shao, C.; Liu, B. Flood Disaster Monitoring and Emergency Assessment Based on Multi-Source Remote Sensing Observations. Water 2022, 14, 2207. [Google Scholar] [CrossRef]
- Ahamed, A.; Bolten, J.; Doyle, C.; Fayne, J. Near Real-Time Flood Monitoring and Impact Assessment Systems; Springer International Publishing: Cham, Switzerland, 2017. [Google Scholar]
- Planet Labs. PlanetScope. 2022. Available online: https://developers.planet.com/docs/data/planetscope/#:~:text=lastupdated%3AJune01%2C2022,200millionkm2%2Fday (accessed on 1 June 2023).
- Japan International Cooperation Agency. Summary: The Study on Flood Control and Water Management in Limboto-Bolango-Bone Basin; Final Report Volume-II Main Report; Japan International Cooperation Agency: Tokyo, Japan, 2002. [Google Scholar]
- ASEAN Disaster Information Network. SEARCH. 2022. Available online: https://adinet.ahacentre.org/ (accessed on 1 June 2023).
- Kimijima, S.; Sakakibara, M.; Amin, A.K.M.A.; Nagai, M.; Arifin, Y.I. Mechanism of the rapid shrinkage of limboto lake in Gorontalo, Indonesia. Sustainability 2020, 12, 9598. [Google Scholar] [CrossRef]
- ASEAN Disaster Information Network. Indonesia, Flooding and Landslide in Bone Bolango Regency, Gorontalo Province. 2020. Available online: https://adinet.ahacentre.org/report/indonesia-flooding-and-landslide-in-bone-bolango-regency-gorontalo-province-20200804 (accessed on 1 June 2023).
- ZONAUTARA.com. Floods and Landslides Ravaged Bone Bolango Regency. 2020. Available online: https://zonautara.com/2020/09/10/banjir-dan-tanah-longsor-porak-porandakan-kabupaten-bone-bolango/ (accessed on 1 June 2023).
- Research Institute for Humanity and Nature. Let’s Explore RIHN: Gorontalo, Indonesia. 2020. Available online: https://www.chikyu.ac.jp/minna/nozoite/2020/bouken_no6.html (accessed on 1 June 2023).
- Planet Labs. Planet Explore. 2022. Available online: https://www.planet.com/expl (accessed on 1 June 2023).
- Planet Labs. Daily Earth Data to See Change and Make Better Decisions. Available online: https://www.planet.com/ (accessed on 1 June 2023).
- European Space Agency. Worldwide Land Cover Mapping. 2022. Available online: https://esa-worldcover.org/en (accessed on 1 June 2023).
- Zeng, Z.; Gan, Y.; Kettner, A.J.; Yang, Q.; Zeng, C.; Brakenridge, G.R.; Hong, Y. Towards high resolution flood monitoring: An integrated methodology using passive microwave brightness temperatures and Sentinel synthetic aperture radar imagery. J. Hydrol. 2020, 582, 124377. [Google Scholar] [CrossRef]
- Huang, L.-K.; Wang, M.-J.J. Image thresholding by minimizing the measures of fuzziness. Pattern Recognit. 1995, 28, 41–51. [Google Scholar] [CrossRef]
- Prewitt, J.M.S.; Mendelsohn, M.L. The Analysis of Cell Images. Ann. New York Acad. Sci. 2006, 128, 1035–1053. [Google Scholar] [CrossRef]
- Otsu, N. A threshold selection method from gray-level histograms. IEEE Trans. Syst. Man Cybern. 1979, 9, 62–66. [Google Scholar] [CrossRef]
- Doyle, W. Operations Useful for Similarity-Invariant Pattern Recognition. J. ACM 1962, 9, 259–267. [Google Scholar] [CrossRef]
- Shanbhag, A. Utilization of Information Measure as a Means of Image Thresholding. CVGIP Graph. Model. Image Process. 1994, 56, 414–419. [Google Scholar] [CrossRef]
- Zack, G.W.; Rogers, W.E.; Latt, S.A. Automatic measurement of sister chromatid exchange frequency. J. Histochem. Cytochem. 1977, 25, 741–753. [Google Scholar] [CrossRef] [PubMed]
- Yen, J.-C.; Chang, F.-J.; Chang, S. A new criterion for automatic multilevel thresholding. IEEE Trans. Image Process. 1995, 4, 370–378. [Google Scholar] [CrossRef] [PubMed]
- Ridler, T.W.; Calvard, S. Picture Thresholding Using an Iterative Selection Method. IEEE Trans. Syst. Man Cybern. 1978, 8, 630–632. [Google Scholar] [CrossRef]
- Li, C.H.; Lee, C.K. Minimum cross entropy thresholding. Pattern Recognit. 1993, 26, 617–625. [Google Scholar] [CrossRef]
- Li, C.; Tam, P. An iterative algorithm for minimum cross entropy thresholding. Pattern Recognit. Lett. 1998, 19, 771–776. [Google Scholar] [CrossRef]
- Sankur, B.; Sezgin, M. Survey over image thresholding techniques and quantitative performance evaluation. J. Electron. Imaging 2004, 13, 146–168. [Google Scholar] [CrossRef]
- Kapur, J.N.; Sahoo, P.K.; Wong, A.K.C. A new method for gray-level picture thresholding using the entropy of the histogram. Comput. Vis. Graph. Image Process. 1985, 29, 273–285. [Google Scholar] [CrossRef]
- Glasbey, C. An Analysis of Histogram-Based Thresholding Algorithms. Graph. Model. Image Process. 1993, 55, 532–537. [Google Scholar] [CrossRef]
- Kittler, J.; Illingworth, J. Minimum error thresholding. Pattern Recognit. 1986, 19, 41–47. [Google Scholar] [CrossRef]
- Tsai, W.-H. Moment-preserving thresolding: A new approach. Comput. Vis. Graph. Image Process. 1985, 29, 377–393. [Google Scholar] [CrossRef]
- KONTAN. Gorontalo Minerals Immediately Implements Gold Mine Development. 2022. Available online: https://industri.kontan.co.id/news/gorontalo-minerals-segera-melaksanakan-pengembangan-tambang-emas (accessed on 7 July 2022).
- Edelstein, M.; Ben-Hur, M. Heavy metals and metalloids: Sources, risks and strategies to reduce their accumulation in horticultural crops. Sci. Hortic. 2018, 234, 431–444. [Google Scholar] [CrossRef]
- Vardhan, K.H.; Kumar, P.S.; Panda, R.C. A review on heavy metal pollution, toxicity and remedial measures: Current trends and future perspectives. J. Mol. Liq. 2019, 290, 111197. [Google Scholar] [CrossRef]
- Adamo, P.; Arienzo, M.; Imperato, M.; Naimo, D.; Nardi, G.; Stanzione, D. Distribution and partition of heavy metals in surface and sub-surface sediments of Naples city port. Chemosphere 2005, 61, 800–809. [Google Scholar] [CrossRef] [PubMed]
Disclaimer/Publisher’s Note: The statements, opinions and data contained in all publications are solely those of the individual author(s) and contributor(s) and not of MDPI and/or the editor(s). MDPI and/or the editor(s) disclaim responsibility for any injury to people or property resulting from any ideas, methods, instructions or products referred to in the content. |
© 2023 by the authors. Licensee MDPI, Basel, Switzerland. This article is an open access article distributed under the terms and conditions of the Creative Commons Attribution (CC BY) license (https://creativecommons.org/licenses/by/4.0/).