Article

Detection of Cotton Verticillium Wilt Disease Severity Based on Hyperspectrum and GWO-SVM

1
Key Laboratory of Smart Agriculture System Integration, Ministry of Education, China Agricultural University, Beijing 100083, China
2
Key Laboratory of Tarim Oasis Agriculture (Tarim University), Ministry of Education, Alar 843300, China
3
Key Laboratory of Agricultural Information Acquisition Technology, Ministry of Agriculture and Rural Affairs, China Agricultural University, Beijing 100083, China
*
Author to whom correspondence should be addressed.
Remote Sens. 2023, 15(13), 3373; https://doi.org/10.3390/rs15133373
Submission received: 24 May 2023 / Revised: 24 June 2023 / Accepted: 28 June 2023 / Published: 1 July 2023
(This article belongs to the Special Issue Crop Quantitative Monitoring with Remote Sensing)

Abstract

:
In order to address the challenge of early detection of cotton verticillium wilt disease, naturally infected cotton plants in the field, which were divided into five categories based on the degree of disease severity, have been investigated in this study. Canopies of infected cotton plants were analyzed with spectral data measured, and various preprocessing techniques, including multiplicative scatter correction (MSC) and MSC-continuous wavelet analysis algorithms, were used to predict the disease severity. With a combination of support vector machine (SVM) models with such optimization algorithms as genetic algorithm (GA), grid search (GS), particle swarm optimization (PSO), and grey wolf optimizer (GWO), a grading model of cotton verticillium wilt disease was established in this study. The study results show that the MSC-PSO-SVM model outperforms the other three models in terms of classification accuracy, and the accuracy, macro precision, macro recall, and macro F1-score of this model are 80%, 81.26%, 80%, and 79.57%, respectively. Among those eight models constructed on the basis of continuous wavelet analyses using mexh and db3, the MSC-db3(23)-PSO-SVM and MSC-db3(23)-GWO-SVM models perform best, with the latter having a shorter running time. An overall evaluation shows that the MSC-db3(23)-GWO-SVM model is an optimal model, with values of its accuracy, macro precision, macro recall, and macro F1-score indicators being 91.2%, 92.02%, 91.2%, and 91.16%, respectively. Moreover, under this model, the prediction accuracy on disease levels 1 and 5 has achieved the highest rate of 100%, with a prediction accuracy rate of 88% on disease level 2 and the lowest prediction accuracy rate of 84% on both disease levels 3 and 4. These results demonstrate that it is effective to use spectral technology in classifying the cotton verticillium wilt disease and satisfying the needs of field detection and grading. This study provides a new approach for the detection and grading of cotton verticillium wilt disease and offered a theoretical basis for early prevention, precise drug application, and instrument development for the disease.

Graphical Abstract

1. Introduction

Cotton verticillium wilt disease [1,2] is a soil-borne vascular disease that poses significant challenges in disease eradication once it takes hold. It is a widespread and cross-regional disease that causes extensive incidence and spread and has emerged as a major obstacle for cotton yield in Xinjiang [3]. Symptoms of infected plants include leaf wilting, boll shedding, and reduced boll size, leading to substantial yield losses and compromised fiber quality [4]. Consequently, the prevention and monitoring of cotton verticillium wilt disease occurrence and progression have become a primary focus and challenge for cultivators, breeders, pathologists, and remote sensing scientists [5].
Traditional disease monitoring primarily relies on field sampling and surveys. However, these methods are time-consuming, labor-intensive, poorly timed, and susceptible to human factors, all of which can compromise the accuracy of results [6,7]. In light of the rapid outbreak of cotton verticillium wilt disease and the demanding spatial and temporal resolution requirements of satellite sensors, traditional satellites have the challenges of delivering high-quality data to meet the requirements of practical applications [8]. Thus, ground-based spectroscopy measuring technology has become essential for effectively monitoring cotton verticillium wilt disease.
In recent years, there has been more and more research on the diagnoses and monitoring of plant diseases and pests on plant leaf or canopy scales [9,10,11,12,13,14]. When plant leaves are infected by pathogens, they often exhibit various forms of spots, necrotic areas, or wilting, thus resulting in their reduced pigment contents and activities. Consequently, their leaf spectral reflectance of visible light increases, accompanied by a blue shift in the red-edge region (670–730 nm) [15]. Moreover, those disease-susceptible plants undergo significant structural changes on their canopy scales (e.g., altered leaf inclination and stem tilting) and experience variations of plant water status caused by leaf chlorosis, which can even bring out stem inversion under severe stresses. These changes can induce varied leaf spectral reflectance patterns within the near-infrared and short-wave infrared bands [16]. For instance, among peanut crops with leaf spot disease, a significant decrease in the near-infrared spectral reflectance of peanut canopies has been observed with the disease progression, which is utilized for disease detection in that region [17]. In the study of winter wheat powdery mildew, it was discovered that with the increase in disease severity, there is a significant decrease in the leaf near-infrared spectral reflectance, with drred (red-edge slope) being the most sensitive parameter for powdery mildew detection. Eventually, a powdery mildew detection model based on Σdr680–760 nm (the area under the red edge peak) was developed [18]. Therefore, the leaf’s near-infrared spectral reflectance is a critical parameter for monitoring cotton verticillium wilt disease.
Continuous wavelet transform (CWT) is a mathematical tool used for analyzing non-stationary signals, providing time-frequency representations of these signals by decomposing them into scaled and translated wavelets [19]. CWT convolves an input signal with wavelets at different scales and positions, measuring their similarities to the signal at each scale and time position throughout the convolution process. CWT can be used to decompose the spectral data of wheat leaves and quantify their aphid densities, with results better than those of conventional sensitive spectral indices [20]. The machine learning classifier after CWT processing has consistently outperformed the other four machine learning classifiers (k-nearest neighbor (KNN), support vector machine (SVM), neural network (NN), and extreme gradient boosting (Xgboost)) in measuring wheat canopy hyperspectra to distinguish healthy and infected wheat. Moreover, this classifier can accurately distinguish wheat canopies with fusarium head blight (FHB) disease from healthy wheat canopies [21]. With the spectral data, vegetation indices, and wavelet features as described above, a discriminant model was established in this study based on Fisher’s linear discriminant analysis (FLDA) method and SVM [22]. Wavelet features are more effective in classifying crops with different stresses than spectral data and vegetation indices. Therefore, the accuracy of estimation models can be improved through the use of the continuous wavelet method in analyzing crop canopy spectral data.
Optimization algorithms are mathematical tools used to find the best solution (optimal values) for a given problem [23]. These optimization algorithms include genetic algorithm (GA), grid search (GS), particle swarm optimization (PSO), and other algorithms. These algorithms iteratively explore a search space to minimize or maximize an objective function under certain constraints. GA is a heuristic search algorithm that finds the optimal solution to an optimization problem by simulating the process of biological evolution [24]. GS is a commonly used parameter search algorithm determining the optimal combination of hyperparameters for machine learning models [25]. PSO is a population-based metaheuristic optimization algorithm created under the inspiration of the collective behavior of bird flocking or fish schooling [26]. Since the beginning of this century, various optimization algorithms [27,28] have been developed. Compared with traditional population optimization algorithms that are likely to generate optimal local results and have slow convergence speeds, the grey wolf optimization (GWO) algorithm has a higher problem-solving capacity [29]. The GWO algorithm has been widely used in element concentration prediction, crop classification, and other fields [30]. A classification model was constructed in some previous research to distinguish the maturity of pasture purslane based on the improved support vector machine and partial least squares discriminant analysis method using the gray wolf optimizer (GWO-SVM), with good results achieved [31]. A GWO-SVM model was used to detect the adulteration of pepper powder, and this model outperformed the methods of hierarchical clustering analysis, orthogonal partial least squares discriminant analysis, and random forest algorithm in detecting the adulteration of pepper powder [32]. Scholars [33] have verified that the gray wolf optimization algorithm can be used to improve the classification performance of support vector machines in classifying Millennium tomato varieties.
In summary, the GWO-SVM method has been widely used in many fields, and the GWO algorithm has the advantages of few parameters, simple calculation, strong robustness, high result accuracy, and fast convergence speed. Thus, it has been widely used in the classifications of agricultural products. However, in the literature, the GWO algorithm has been rarely used to grade the cotton Fusarium wilt disease. With the development of machine learning and data mining algorithms, GWO algorithm has been increasingly applied in the relevant crop research [34,35,36,37,38,39]. The method and modeling of spectral data analysis have been used in pest and disease recognition and monitoring of rice [40], wheat [41], soybeans [42], and other crops together with the methods of principal component analysis (PCA) [43], SVM [44], and neural networks [45,46], and other methods. With the PCA and competitive adaptative reweighted sampling (CARS) methods, feature variables can be selected, and with SVM, a model can be established [47]. Eventually, it has been verified that the CARS-PCA-SVM model has the best performance and can classify and detect the rice blast disease at an early stage under different field conditions. Moreover, Multiple spectral fluorescence imaging (MFI) and SVM models were used for detecting early-stage powdery mildew disease [48]. Based on the analysis of correlations among spectral transformation, vegetation indices, hyperspectral feature parameters, and disease severity during different time periods, a random forest model for predicting the degree of panicle neck blast disease based on vegetation indices and hyperspectral feature parameters was constructed [49]. With a combination of chlorophyll fluorescence spectra with chemometrics, such algorithms as partial least squares discriminant analysis (PLS-DA) and PCA-SVM were employed to identify tea diseases [50]. Generally speaking, the SVM models outperform most of the other models in crop disease detection [51]. Therefore, this study has used the SVM models to grade the cotton wilt disease.
Based on the above analysis, visible and near-infrared spectra data were used for this grading research. Continuous wavelet decomposition was performed on the spectra data of the cotton crown layer, and radial basis functions were used as the kernel functions of SVM. GA, GS, PSO, and GWO were used to optimize SVM parameters for achieving better classification results. This paper has provided a new method for grading the cotton wilt disease in the cotton crown layer and the technical support for monitoring the cotton wilt disease and precise drug spaying at the field and regional scales.

2. Materials and Methods

2.1. Sample

In 2022, an experiment was conducted in the Shi Tuan Experimental Field (81°21′4.079″E, 40°37′11.418″N) in Alar City, Xinjiang, as shown in Figure 1. Tahe 2-type cotton was planted on 10 April 2022. The data of plants with cotton verticillium wilt disease were collected in the field. Diseased plant samples were collected as described below, and Table 1 shows the number of diseased plant samples collected.
The grading criterion for cotton crown verticillium wilt disease is described as follows. The infected cotton field was evenly divided into 500 plots, each of which had an area of one square meter. Every two adjacent plots were spaced one to two meters apart. The 5-point survey method was employed, with each plot selecting 5 symmetrical points (a total of 5 cotton plants), to investigate disease index. The severity of the plant disease was divided into 5 levels: Plants with a Level 1 disease had no diseased leaves, plants with a Level 2 disease had no more than 25% of diseased leaves, plants with a Level 3 disease had diseased leaves accounting for 25–50% of their total leaves, plants with a Level 4 disease had more than 50% of diseased leaves, and plants with a Level 5 disease were dead or dying plants [1]. The number of plants at each level at each location was recorded, and the disease index (DI) of the test population was calculated with the following formula:
D I = ( X × f ) × 100 n × f
In this equation, X represents the grade value of each level, n represents the highest disease level, and f represents the number of plants at each level.

2.2. Data Acquisition

With the ASD FieldSpec HandHeld 2 (350–1075 nm) portable hyperspectral radiometer manufactured by the American company ASD (Analytical Spectral Device, Boulder, CO, USA), cotton canopy hyperspectral data were measured in this study. The best time period for spectral data collection was from 12:00 to 14:00 local time [5] when the light was more stable and more perpendicular to the ground. During the measurement process, the probe was kept vertically downward and was always 20 cm away from the ground, with a 25° field of view. Throughout the entire process, facing the sun, the observing experimenter always stood behind the target area. The recording member and other experimenters always stood behind the observing experimenter, avoiding walking around in the area and standing between the sunlight and the target area. To conduct the measurement at the next location, all experimenters approached the target area without trampling it. After the test, they left the target area through the entry route. Before and after each measurement, standard reference boards were used for standard calibration, and 5 spectral curves were measured and drawn at each measuring point, with the average curve calculated and used as the spectral curve of that measuring point. Moreover, the spectral reflectance at each point was calculated with the conversion formula of reflectance and whiteboard values.

2.3. Data Processing

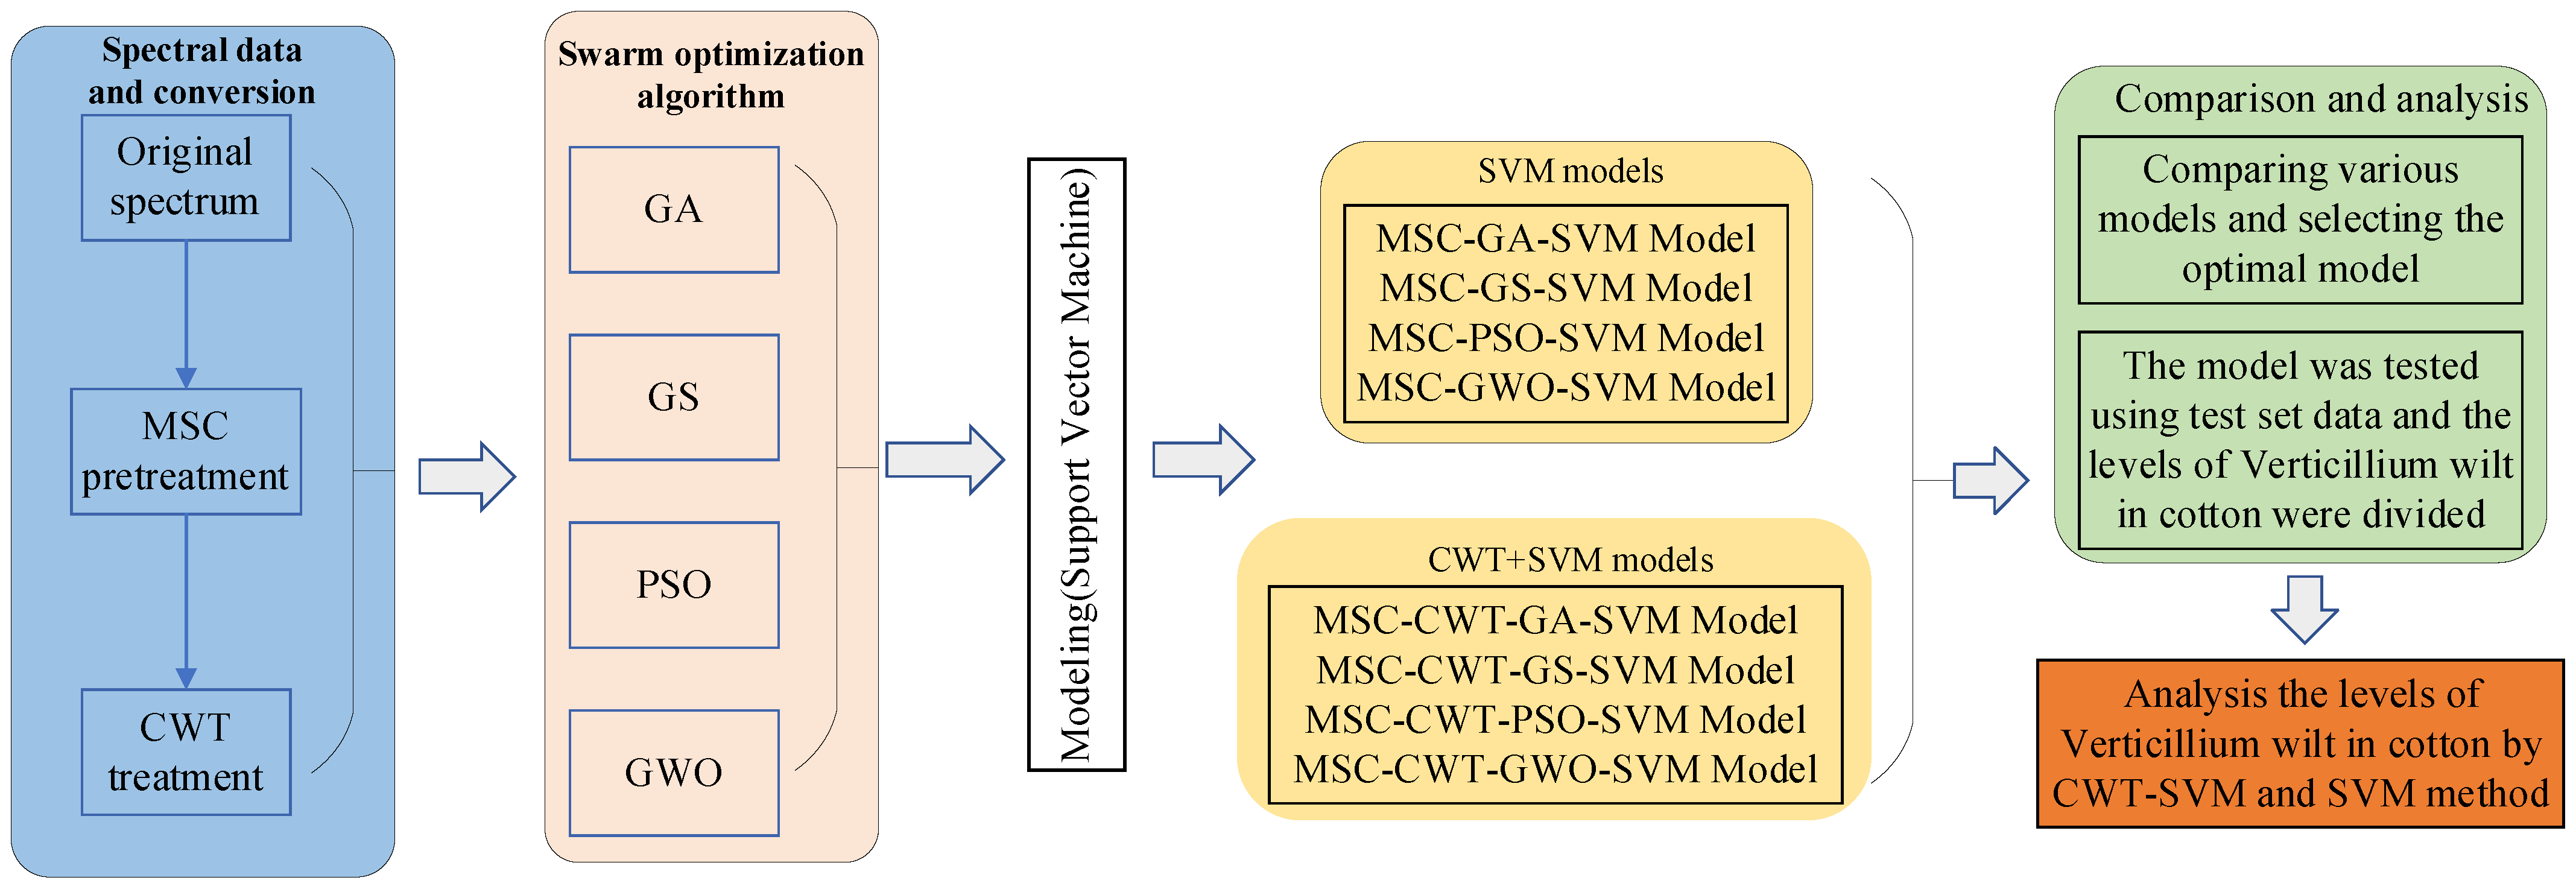
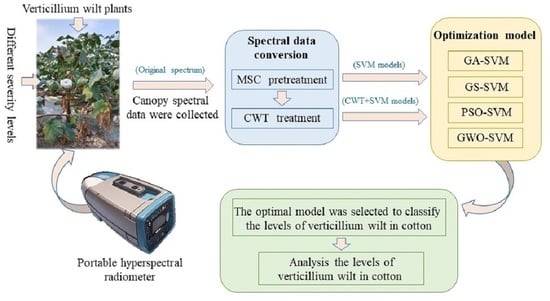
The primary procedure of data processing is shown in Figure 2. The first step was to preprocess the original spectral data using MSC, followed by the processing of continuous wavelet transform (CWT) applied. The second step was to perform the population optimization algorithm, which includes four optimization algorithms: GA, GS, PSO, and GWO. The third step was to establish an analytical model, which includes the SVM models and CWT-SVM models generated with these four optimization algorithms. The fourth step was to compare the performance of different models in evaluating the severity of cotton verticillium wilt disease.

2.4. Continuous Wavelet Analysis

From the perspective of signal processing, the wavelet analysis method can be used to analyze the frequency and time aspects of data and extract useful information from signals. Therefore, CWT can decompose a reflectance spectrum into a series of wavelet energy coefficients at different frequency levels with the following formula.
W f ( a , b ) = 1 a + f ( λ ) ψ ( λ b a ) d λ
In this formula, a is the frequency scale factor, which is set as a gradient of 2n (n = 1, 2, …, 8), and b is the translation factor, which is the central wavelength of the mother wavelet function.
Previous studies have shown that the curve of the absorption characteristics can be described with a Gaussian function [52] or a combination of multiple Gaussian functions [53] to a great extent. Thus, the mother wavelet function ψ(λ) is a second-order Gaussian function. Based on the conclusions of previous research [52], this study used db3 as the mother function [54] for comparative analysis.
In Formula (2), f(λ) represents the one-dimensional reflectance spectrum, and the wavelet coefficients Wf(a,b) (denoted as WFa,b) are two-dimensional data, which include a frequency level dimension (1, 2, …, 8) and a wavelength λ (325–1075 nm) dimension.

2.5. SVM Algorithm

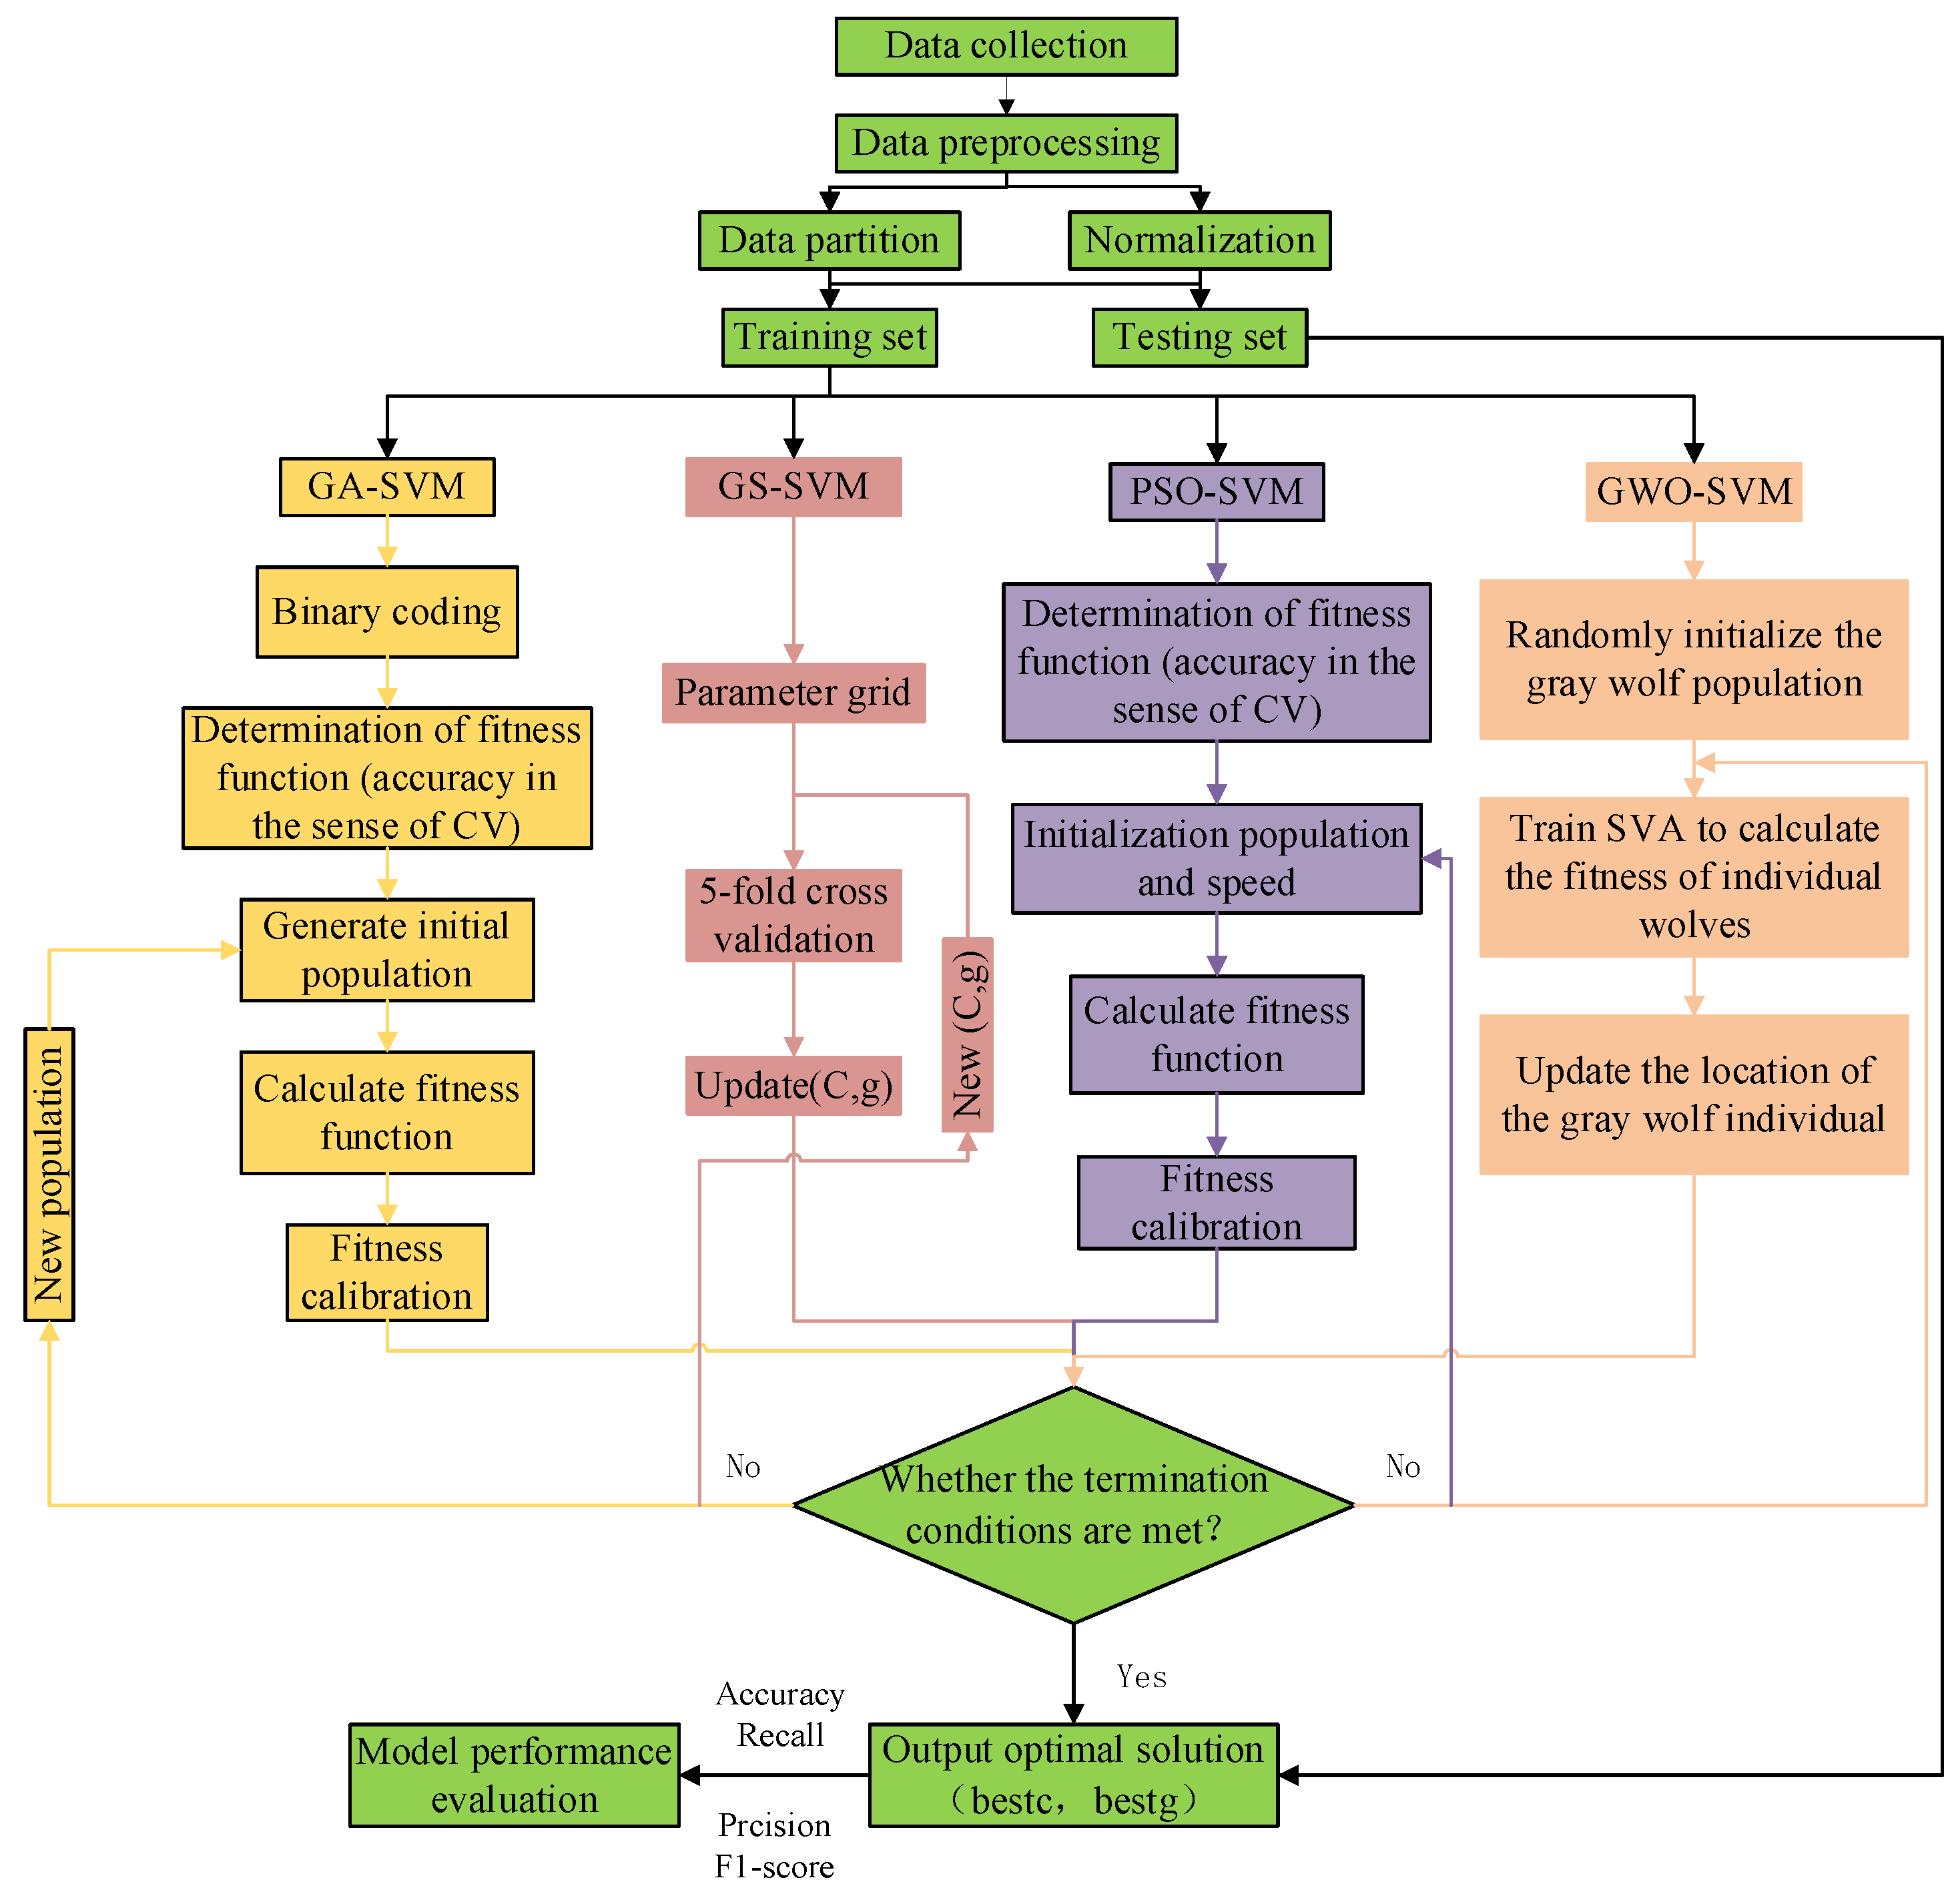
Based on the idea of establishing a classification hyperplane as the decision boundary to maximize the separation margin between positive and negative examples, Support Vector Machine [55] (SVM) has been developed as an approximate implementation of structural risk minimization. Moreover, this algorithm can be used in pattern classification and nonlinear regression. As mentioned earlier, a Gaussian kernel function was used to optimize the SVM model. Therefore, two important parameters, C (penalty factor) and g (RBF kernel deviation) were used as the optimal parameters. In order to optimize the parameters and reduce the parameter search time, such optimization algorithms as GS, GA, PSO, and GWO were used in this study to improve the predictive capacity of SVM in distinguishing different levels of cotton wilt disease. Moreover, the SVM classification program was implemented in the MATLAB R2020a environment. Figure 3 presents the general implementation process of the SVM-based model with GS, GA, PSO, and GWO optimization algorithms. According to the process, data were collected and processed first. Then, the dataset was randomly divided into the training and testing sets with a 3:1 ratio. After that, four intelligent optimization algorithms, which are GA, GS, PSO, and GWO, were performed. The specific algorithms can be found in Section 2.5.1, Section 2.5.2, Section 2.5.3 and Section 2.5.4. When the objective conditions were met, the best parameters were generated and output, and the SVM models were evaluated using metrics, such as Accuracy and Recall.

2.5.1. GA

Genetic Algorithm (GA) [56] has its origin in computer simulation of biological systems and is a practical, efficient, and robust optimization algorithm. In this study, the accuracy of the training set under cross-validation (CV) was used as the parameter of the fit function in GA, and GA was used to optimize the parameters of SVM.

2.5.2. PSO

The particle swarm optimization (PSO) algorithm applies an iterative optimization technique based on swarm intelligence [57]. In this study, the PSO algorithm was also used to optimize the parameters of SVM. With the distinctive particle swarm algorithm utilized, the fitting degrees of particles were continuously updated until an overall optimal solution was obtained.

2.5.3. GS

The optimal values of the GS parameters [58], c and g, within a certain range, have been singled out in the following way: Under a given c value and g value, the training set was used as an original dataset, and the K-CV method was used to obtain the classification accuracy of the validation set. Next, the values of c and g under which the highest classification accuracy of the training set was achieved, were viewed as the optimal values of GS parameters.

2.5.4. GWO

Grey Wolf Optimization Algorithm [29] was used to select the optimal parameters. This algorithm was developed under the inspiration of hunting behaviors of gray wolves. Three main phases are involved in the algorithm: Encircling, attacking, and searching. The wolf pack randomly searches for potential solutions, generates several sets of parameters, and selects the three best-performing wolves from them. In a model constructed based on the GWO optimization function simulating the hunting behaviors of gray wolves, α represents the most capable wolf, followed by β and γ. β and γ primarily assist α in making decisions and obey its instructions for hunting. ω represents the wolf with the lowest rank in the pack. Under the leadership of α, β, and γ, the whole pack collectively attacks the prey and searches for a global optimal solution step by step.

2.6. Model Evaluation Methods

The commonly used evaluation parameters for multi-classification problems [59] include Accuracy, Recall, Precision, and F1-score. The formulas for calculating these parameters are as follows:
Accuracy = (TP + TN)/(TP + TN + FP + FN)
precision = TP/(TP + FP)
recall = TP/(TP + FN)
F1-score = 2 × recall × precision/(recall + precision)
Macro   precision = 1 k i = 1 k p r e c i s i o n i
Macro   recall = 1 k i = 1 k r e c a l l i
Macro   F 1 - score = 1 k i = 1 k F 1 s c o r e i
In Formulas (3)–(6), TP represents the number of positive samples correctly predicted as positive, TN represents the number of negative samples correctly predicted as negative, FN represents the number of positive samples incorrectly predicted as negative, and FP represents the number of negative samples incorrectly predicted as positive. Accuracy represents the percentage of correctly predicted samples among all samples. Recall represents the number of correctly classified instances in the actual category, and precision represents the number of correctly classified instances in the predicted category. The F1-score is a harmonic average of precision and recall, evaluating the accuracy of the model. A value close to 1 indicates a good result for each of these four indicators. The average values of these four indicators of the model were obtained in this study through 20 repeated calculations. This study used the macro-average (arithmetic mean) of the obtained precision, recall, and F1-score of each category to comprehensively evaluate the performance of the classification model. Formulas (7)–(9) are the formulas calculating these macro-averages, with i representing the number of categories classified.

3. Results

3.1. Spectrum Processing and Analysis

The spectral reflectance characteristics of cotton canopy are mainly influenced by leaf pigment content and cell structure, as well as multiple factors such as canopy structure [1,5].
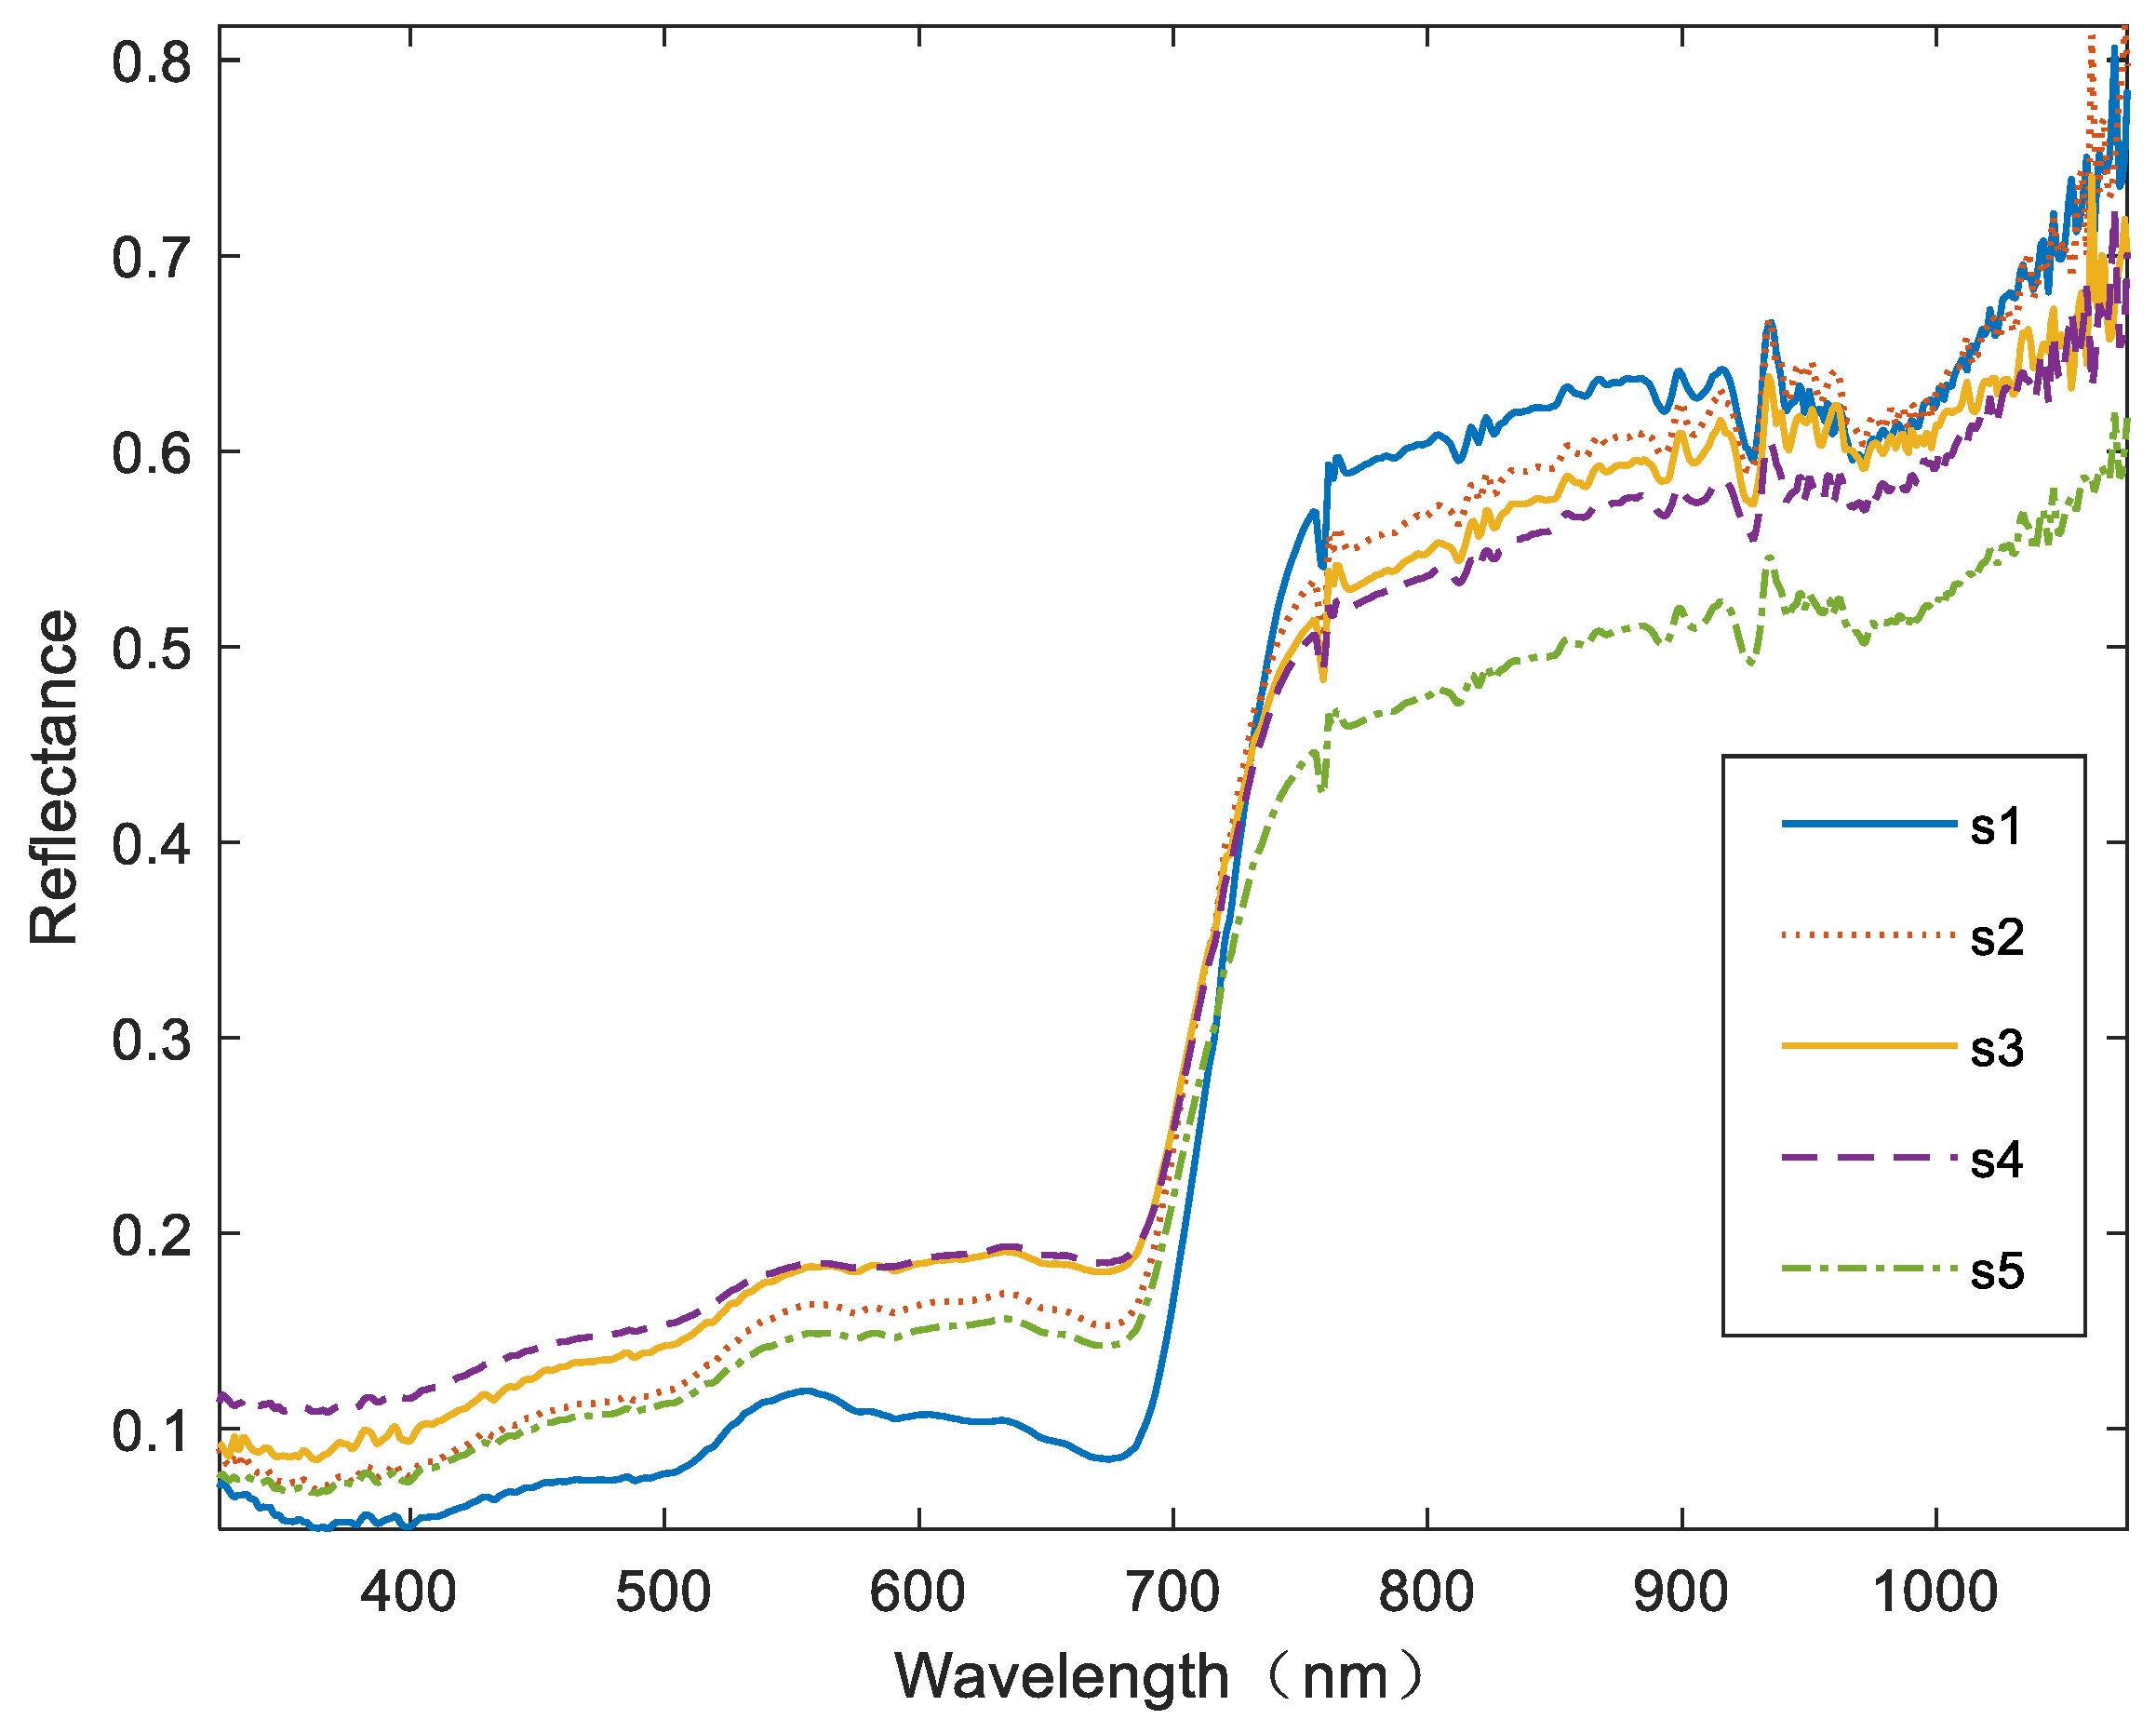
From Figure 4, it can be seen that the spectral curves of cotton canopies with different disease levels exhibit a similar pattern. Their spectral reflectance is low in the visible light range (400–700 nm) and high in the near-infrared range (700–1075 nm). A reflection peak appears near a wavelength of 550 nm, while two absorption valleys appear near wavelengths of 490 and 680 nm.
Their spectral reflectance increases sharply within a wavelength range of 690–750 nm and forms a significantly high reflectance plateau within a near-infrared range of 750–900 nm. There are troughs and peaks at 750 and 900 nm. The reason is that the near-infrared light can penetrate through chlorophyll and form strong reflection at the leaf tissue. Therefore, the spectral reflectance of cotton canopy increases sharply between wavelengths of the red and near-infrared light, resulting in a significantly high reflectance plateau in the near-infrared range. In order to reduce the interference caused by environmental factors, instruments, and measurement methods, MSC was used to process the high-spectrum data. From Figure 5, it can be seen that in the near-infrared (750–1075 nm) range, the spectral reflectance of cotton canopies with different degrees of verticillium wilt disease is lower than that reflectance of a healthy cotton canopy, and the spectral reflectance gradually decreases with the increase of disease severity.

3.2. Grading of Cotton Crown Wilt Disease Based on the SVM Model

After the preprocessing of MSC, the spectra data of cotton canopies with wilt disease were optimized with the GA, GS, PSO, and GWO algorithms. A Radial Basis Function (RBF) was used in the SVM model as a kernel function to perform the classification. The final results are shown in Table 2.
In the GA-SVM algorithm, the population size, maximum breeding generation, crossover probability, and mutation probability were assigned with values of 20, 20, 0.9, and 0.05, respectively. The parameters c and g were assigned a value range of 0–100. After 20 iterations, fitting degrees of all the parameters mentioned above reached a maximum value and then remained stable. The optimal values of c and g were 19.9469 and 7.3388, respectively. Accuracy, macro precision, macro recall, and macro F1-score of the prediction set obtained values of 53.6%, 56.28%, 53.6%, and 51.46%, respectively.
In the GS-SVM model, the population size, crossover probability, and mutation probability were assigned with values of 20, 20, and 0.2, respectively. The maximum number of iterations was set to 20. When the maximum number of iterations has been reached, or the fitting degree of the best individual has not improved for 20 consecutive generations, then the optimization process should be terminated. In this model, the optimal values of c and g obtained were 0.25 and 0.125, respectively, and the CV Accuracy of 100%. In this study, a high-spectrum grading model of cotton crown wilt disease was established with a fine parameter selection method applied for rough data selection. The obtained values of Accuracy, Macro Precision, Macro Recall, and Macro F1-score of the prediction set are 66.4%, 68.12%, 66.4%, and 67.25%, respectively.
In the PSO-SVM model, the particle dimension, the number of particles in each dimension of the particle swarm, and the maximum optimization generation of the particle swarm were assigned, with values of 2, 20, and 20, respectively. The penalty parameter c and the kernel parameter g were assigned with search ranges of 0.1–100 and 0.01–1000, respectively. The obtained optimal values of c and g obtained are 1.841 and 0.01, respectively. The value of CV Accuracy calculated is 100%. Furthermore, a high-spectrum classification model of cotton crown wilt disease was constructed in this model, with the Accuracy, Macro Precision, Macro Recall, and Macro F1-score of the prediction set assigned with values of 80%, 81.26%, 80%, and 80.63%, respectively. Similarly, in the GWO-SVM model, a high spectrum classification model of cotton crown wilt disease was constructed, with the Accuracy, Macro Precision, Macro Recall, and Macro F1-score of the prediction set assigned with values of 64%, 66.2%, 64%, and 65.08%, respectively.
Under all these four models, those four indicators of the training set all obtained a value of 100%. Under the PSO-SVM model, the prediction set achieved the best results in terms of Accuracy, Macro Precision, Macro Recall, and Macro F1-score, with a total running time of 79.72 s. Under the GS-SVM model, the prediction set achieved the 2nd best results in terms of those indicators as described above, with the longest total running time of 146.53 s. Under the GWO-SVM model, the prediction set achieved the 3rd best results in terms of those indicators mentioned above, with the shortest total running time. Compared with the prediction set under the GWO-SVM model, the prediction set under the GA-SVM model had worse results in terms of the indicators as described and a longer total running time. Under the PSO-SVM model, the obtained values of those indicators of the prediction set are acceptable but cannot meet the expectations.
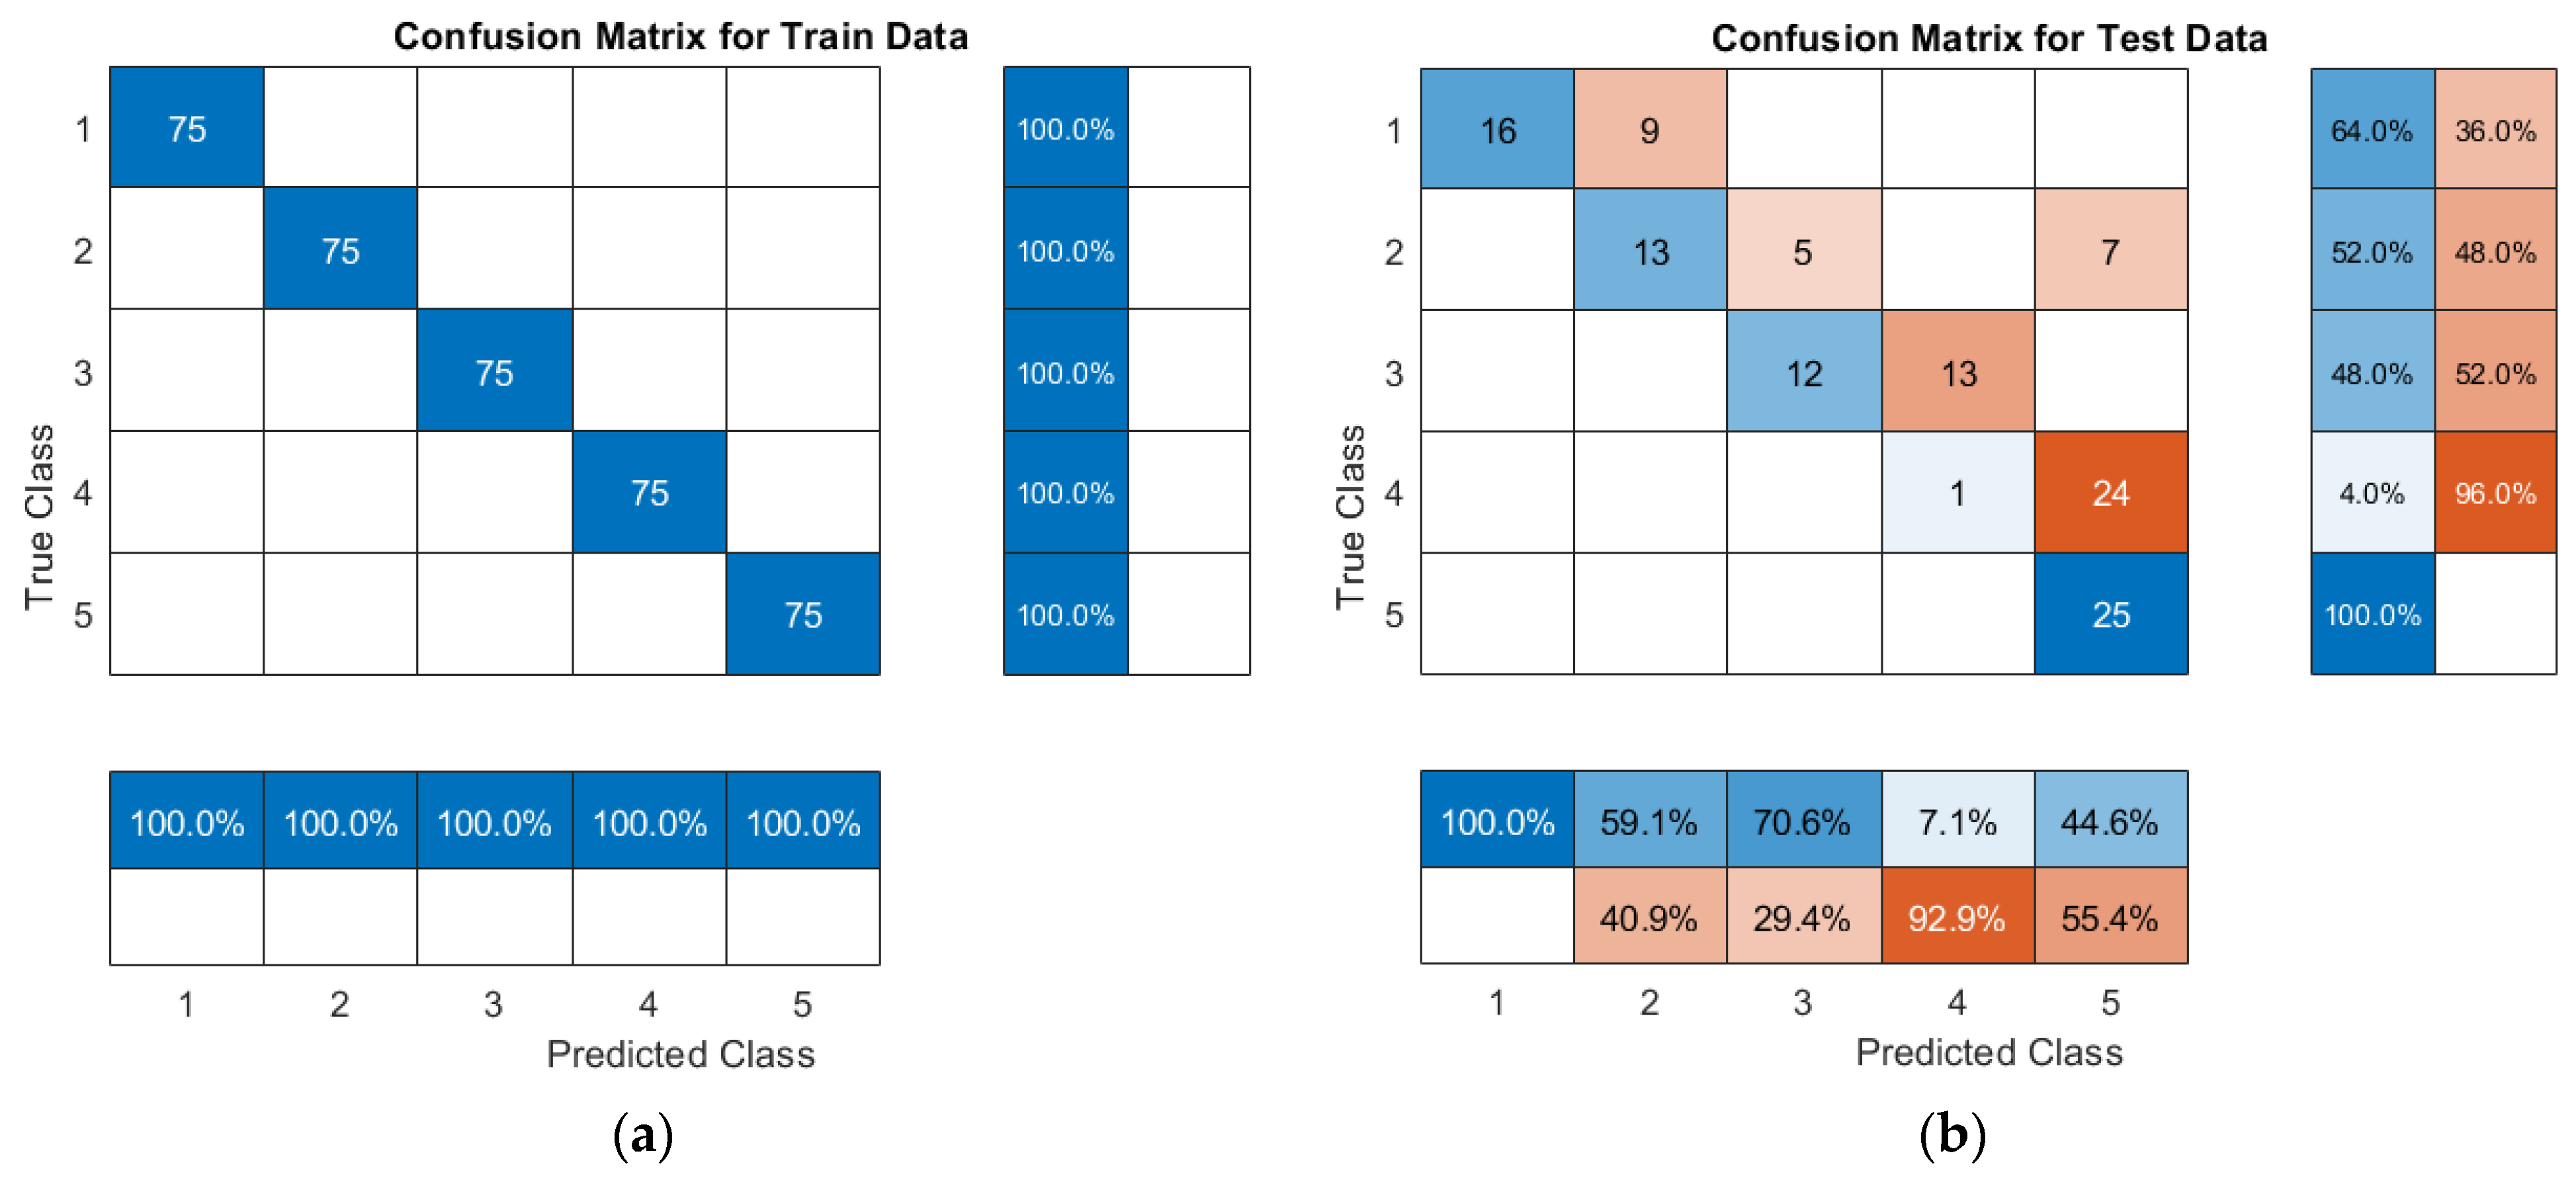
Figure 6 shows the confusion matrices of cotton crown wilt disease severity classifications under the MSC-GA-SVM, MSC-GS-SVM, MSC-PSO-SVM, and MSC-GWO-SVM models. Figure 6a,c,e,g presents the data corresponding to the modeling sets in all these four models, indicating an accuracy of 100% in disease severity classification and no missed or false classifications. From the confusion matrix of the prediction set shown in Figure 6b, it can be seen that the prediction accuracy of disease levels 2 and 3 is all about 50%, and there is only one level-4 sample correctly classified. Figure 6d shows that the prediction accuracy of disease levels 2 and 3 is all less than 40% and that the prediction accuracy of disease levels 1 and 2 is 88% and 84%, respectively. As shown in Figure 6f, the prediction accuracy of disease level 4 is 48%, and there are 13 samples of disease level 4 wrongly classified as samples of disease level 5. It also exhibits that the prediction accuracy of disease level 3 is 72%, and there are seven samples of disease level 3 wrongly classified as samples of disease level 4. Figure 6h indicates that the prediction accuracy of both disease levels 1 and 2 is 64%, and there are nine samples of disease level 1 and nine samples of disease level 2 wrongly classified. It also shows that the prediction accuracy of disease level 3 is 72%, and there are 14 samples of disease level 3 wrongly classified as samples of disease level 4. From this figure, it can also be seen that the prediction accuracy of disease level 4 is 48%, and there are 13 samples of disease level 4 wrongly classified as samples of disease level 5. Among all these four models, disease level 4 has the lowest prediction accuracy, followed by disease levels 3, 1, and 2, subsequently. All samples of disease level 5 are correctly classified. Each wrongly classified sample is mostly classified as the level that is adjacent to its actual level.

3.3. Grading of Cotton Wilt Disease with a Combination of Continuous Wavelet Analysis and SVM Models

3.3.1. Analysis of Wavelet Coefficient Curves at Different Decomposition Levels

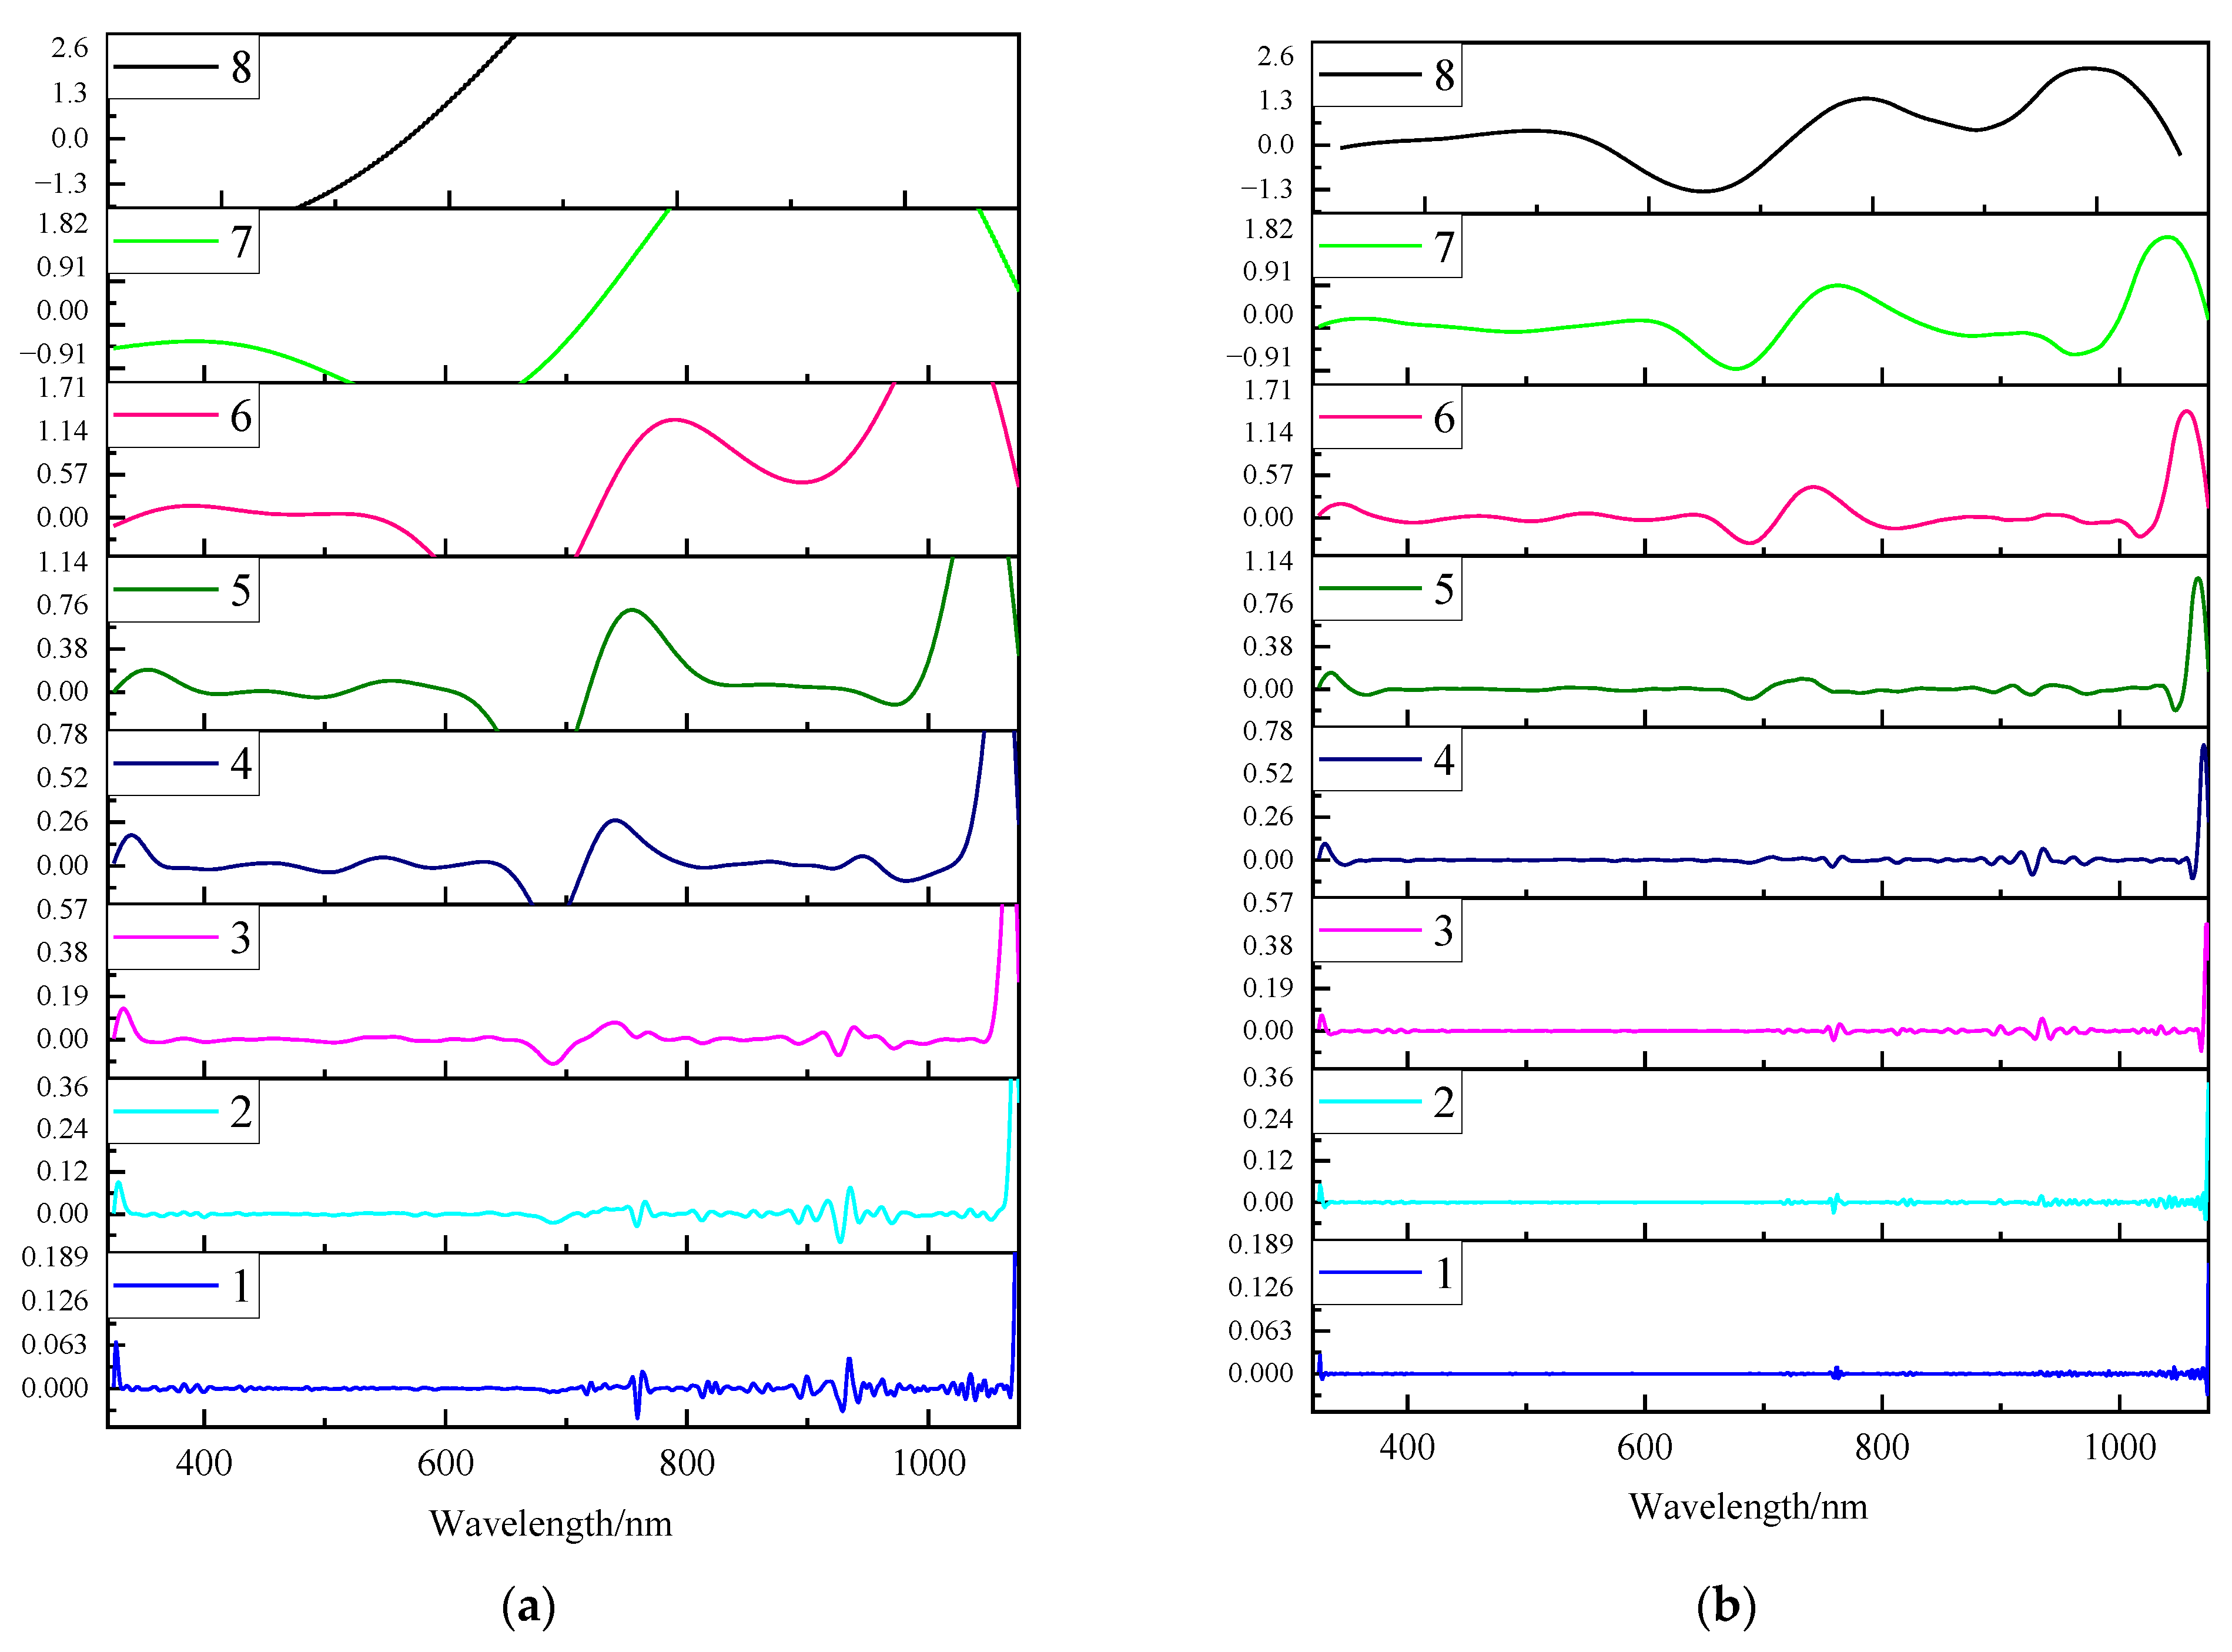
With the continuous wavelet transform method, the MSC-processed spectral curves were decomposed into wavelet coefficients at eight decomposition levels. Figure 7 shows the CWT results of some cotton samples. It can be seen that the values of wavelet coefficients gradually increase with the decomposition level, and the value of high-frequency noise decreases with the increase of the decomposition level. Therefore, with the increase of the decomposition level, the spectral curves flatten out, and some distinctive absorption peaks become more significant at appropriate decomposition levels, as presented by the curves shown in this figure under the decomposition levels of 1–6. However, some absorption peaks of extremely smooth spectral curves under very high decomposition levels will disappear, as shown in Figure 7a. It will make the quantitative analysis difficult.

3.3.2. Establishment and Comparison of Cotton Wilt Disease Grading Models Based on the Continuous Wavelet Analysis and the SVM Model

With the continuous wavelet transform method with mexh and db3 used as the wavelet basis functions, the MSC-preprocessed spectral data of cotton canopies with verticillium wilt disease were decomposed into wavelet coefficients at the decomposition levels of 1–8. Then, the SVM parameters were optimized with the GA, GS, PSO, and GWO algorithms, and finally, the cotton disease levels were classified with the SVM models, with the optimal results of each model shown in Table 3 and Table 4.
Under a continuous wavelet function of mexh, all these four models can achieve their best results within a low-frequency range at decomposition level 1. From Table 3, it can be seen that the Accuracy, Macro Precision, Macro Recall, and Macro F1-score indicators of the prediction set under the MSC-mexh(21)-PSO-SVM model have obtained better values than those indicators of the prediction set under the other three models. Under this model, the obtained values of the Accuracy, Macro Precision, Macro Recall, and Macro F1-score indicators of the prediction set are 89.6%, 90.7%, 89.6%, and 89.53%, respectively.
From Table 4, it can be seen that under a continuous wavelet function of db3, all those four models can achieve their best results within a low-frequency range at decomposition level 3. The prediction sets under the MSC-db3 (23)-PSO-SVM and MSC-db3 (23)-GWO-SVM models obtain the same values of Accuracy, Precision, Recall, and F1-score, which are 91.2%, 92.02%, 91.2%, and 91.16%, respectively. Between these two models, the MSC-db3 (23)-GWO-SVM model has a shorter running time. With the processing of the db3 wavelet function, these four indicators of the prediction set under each model shown in Table 4 have obtained much better results than those indicators of the prediction set shown in Table 2. A comparison between the prediction sets under the MSC-db3(23)-GA-SVM model shown in Table 2 and Table 4 presents an increase in the value of the Macro F1-score indicator from 51.46% to 90.42%, indicating the largest increase in the value of this indicator among all models. Similarly, a comparison between the prediction sets under the MSC-db3(23)-GWO-SVM model shown in Table 2 and Table 4 presents an increase in the value of the Macro F1-score from 63.48% to 91.16%. Therefore, through these comprehensive analyses, it can be determined that the MSC-db3(23)-GWO-SVM model can be used to classify the severity of the cotton verticillium wilt disease.
A comparison between Table 3 and Table 4 indicates that the models with db3 used as a wavelet basis function are better than those models with mexh used as a wavelet basis function in generating the best results of the prediction set. Therefore, this paper has only presented the confusion matrices of level classifications of the cotton canopy verticillium wilt disease under the wavelet (db3) function and the SVM models, with the results shown in Figure 8.
Figure 8 shows the confusion matrices of the cotton canopy verticillium wilt disease classifications under the MSC-db3(23)-GA-SVM, MSC-db3(23)-GS-SVM, MSC-db3(23)-PSO-SVM, and MSC-db3(23)-GWO-SVM models. The data of the modeling sets under all these four models are presented in Figure 8a,c,e,g. It can be seen that all these modeling sets have nearly 100% accuracy in classifying the severity of the cotton verticillium wilt disease, only with a few false classifications. As indicated by the confusion matrix of the prediction set shown in Figure 8a, the prediction accuracy of all those five disease levels is higher than 80%, and the numbers of disease level-3 samples wrongly classified as disease level-2 ones, disease level-3 samples wrongly classified as disease level-4 ones and disease level-4 samples wrongly classified as disease level-3 ones are 3, 5, and 4, respectively. Figure 8d shows that the prediction accuracy of all those five disease levels is higher than 80% (with the 100% prediction accuracy of levels 1 and 5), and the numbers of wrongly classified samples of disease levels 2, 3, and 4 are 3, 5, and 4, respectively. From Figure 8f, it can be seen that the prediction accuracy of disease levels 2, 3, and 4 is 88%, 84%, and 84%, respectively, with the numbers of disease level-2 samples wrongly classified as disease level-5 ones, disease level-3 samples wrongly classified as disease level-2 ones and disease level-4 samples wrongly classified as disease level-1 ones are 3, 4, and 4, respectively. As shown in Figure 8h, disease levels 1 and 5 all have a prediction accuracy of 100%, with the numbers of wrongly classified samples of disease levels 2, 3, and 4 being 3, 4, and 4, respectively. Among all those four models, disease level 5 has the highest prediction accuracy of 100%, followed by disease levels 1, 2, 3, and 4, subsequently.

4. Discussion

4.1. Analysis of Spectrum Features of Cotton Verticillium Wilt Disease

In recent years, the increasing application of hyperspectral technology in agriculture has made it possible to quickly acquire vegetation information. Through vegetation spectral reflectance, the damage caused by plant diseases and pests can be monitored. A study on the rice blast disease has revealed that there are significant differences among the near-infrared spectral reflectance data of rice plants with different disease levels [14]. The more severe blast disease a rice plant suffers, the lower spectral reflectance its leaves will present. Similarly, a study on wheat stripe rust has shown that the spectral reflectance of winter wheat with different damage levels has a “peak” at the “green edge” and a “valley” at the “red edge” and that within the near-infrared range, the spectral reflectance of winter wheat significantly decreases with the increase of the plant’s disease severity [60]. In this study, it has been found that there are “green peaks” and “red valleys” in the reflectance spectrum of a cotton canopy and that in the near-infrared range, the spectral reflectance curve gradually flattens out with the increase of the disease severity, presenting a “red edge” and “blue shift” phenomenon. It indicates that the spectral reflectance curve can well reflect the severity of the cotton wilt disease a plant suffers. In conclusion, it is feasible to use the hyperspectral data to estimate the severity of the wilt disease a cotton canopy suffers.

4.2. Performance Comparison of Different Optimization Algorithms

SVM algorithm can handle the problem of nonlinear and high-dimensional small sample classification, and its classification accuracy is much higher than that of neural networks. The penalty factor C and the kernel function σ play a very important role in the improvement of SVM’s classification accuracy. If C and σ are too large or too small values, the data will be “over-fitted” or “under-fitted”. In order to avoid using those C and σ with too large or too small values, in this study, GA, GS, PSO, and GWO algorithms were used to search the optimal values of these two SVM parameters intelligently.
Among those four algorithms compared in Table 2, the modeling and prediction results of the MSC-PSO-SVM algorithm are better than those results of the other three algorithms, and the GWO-SVM model is superior to the other three models in terms of the algorithm running time. The GS-SVM model has a poor prediction performance, with the longest running time. These findings are consistent with the results of the previous studies [61], in which the PSO-SVM algorithm was compared with such traditional machine learning algorithms as SVM and random forest and such optimization algorithms as GWO-SVM and convolutional neural network (CNN). The PSO-SVM algorithm has the best performance, with an identification accuracy of 92.11%, a precision of 90%, a recall rate of 94.74%, and an F1 score of 92.31%.

4.3. Improving Model Performance through CWT De-Noising at Different Decomposition Levels

As shown in Table 2, the MSC-PSO-SVM model is the best prediction model among all four models, with the values of Accuracy, Macro Precision, Macro Recall, and Macro F1-score of the prediction set being 80%, 81.26%, 80%, and 79.57%, respectively. However, the results presented by the confusion matrix of cotton verticillium wilt disease classification shown in Figure 6h cannot meet the expectations. In order to further improve the prediction accuracy of this model, CWT was used to process the spectral data, with the spectral reflectance converted into wavelet coefficients, as shown in Figure 7. With the number of decomposition level increased from 1 to 6, the wavelet coefficient curves flatten out, and some distinctive absorption peaks are amplified. However, when the curves become too flat, some absorption peaks will disappear. Those wavelet decomposition levels within a low-to-medium frequency range can maintain the absorption characteristics of crop spectral reflectance [62] and effectively eliminate the high-frequency noises in spectral data [58]. Thus, with the high-frequency wavelet decomposition technique, the absorption features can hardly be figured out in the crop spectral reflectance curve, which is not conducive to the analysis of crop’s physiological and biochemical composition [63].
A comparison between Table 2 and Table 4 reveals that, after the CWT processing, all models’ prediction accuracy of the severity of cotton verticillium wilt disease has improved significantly, with the GA-SVM model showing the largest improvement. The values of Accuracy, Macro Precision, Macro Recall, and Macro F1-score of the prediction set in this model have increased from 53.6%, 56.28%, 53.6%, and 51.46% to 89.6%, 91.26%, 90.4%, and 90.42%, respectively. Meanwhile, after the CWT processing, the results of the PSO-SVM model have been slightly improved. A comparison between Table 2 and Table 3 shows similar results, indicating that the CWT can improve the prediction accuracy of the cotton disease severity through decomposing spectral data. Previous studies [20,21,22,64] have also presented similar results. Some scholars have pointed out that the CWT-processed spectral data can reflect the quantity of aphids [20]. Some other scholars have found that the prediction accuracy of the severity of wheat stripe rust disease can be enhanced by processing the spectral data with CWT [22]. This study shows that, with a wavelet mother function of mexh and a wavelet decomposition level 1, the wavelet decomposition coefficients have the strongest correlation with the severity of cotton verticillium wilt disease, and all those four models have achieved their optimal results. Meanwhile, with a wavelet mother function of db3 and a wavelet decomposition level 3, the wavelet decomposition coefficients also have the strongest correlation with the severity of cotton verticillium wilt disease, and all those four models have also achieved their optimal results. In most previous studies, mexh has been used as the wavelet mother function, with good results achieved. In this study, both mexh and db3 were used as the mother function, with their results being compared. It shows that the results with db3 as the mother function are better than those results with mexh as the mother function. However, it is yet to be discussed which mother wavelet function and which decomposition level should be used in the optimization. Like some previous research, this study has used sym8 as the wavelet mother function, with the best prediction accuracy achieved under a wavelet decomposition level 6 [65].

4.4. Limitations of This Study and Future Work

In this study, the canopy-layer spectral data of the tahe 2-type cotton with wilt disease were collected. With the methods of MSC spectral data preprocessing and continuous wavelet analysis, a cotton wilt disease detection model was established based on the SVM algorithm combined with various optimization algorithms, with the results shown in Table 3 and Table 4 and Figure 8g,h. The study results show that the MSC-db3(23)-GWO-SVM model has achieved the best classification results with the shortest algorithm running time.
However, this study has only investigated the spectral data of a specific cotton variety. Therefore, in order to verify the stability and accuracy of the MSC-db3(23)-GWO-SVM model in classifying the cotton wilt disease, more cotton varieties, planting patterns, and field data sets should be taken into consideration in future studies.
This study has only focused on the disease levels of cotton plants. Future studies can use the multi-spectral remote sensing image data collected by drones to implement real-time monitoring of cotton fields and formulate management plans for cotton fields based on the continuous wavelet analysis method and GWO-SVM models, thus providing a research basis for the large-scale, low-cost, and accurate monitoring and diagnosis of cotton fields. Hyperspectral instruments have been identified as relatively expensive. In response, ongoing research focuses on developing cost-effective instruments that are specifically designed to meet the requirements of farmers. These endeavors aim to enhance the practical applicability of hyperspectral models in agricultural settings.

5. Conclusions

This study has used cotton plants with canopy wilt disease as an experimental object and analyzed their crown spectral data. The cotton canopy wilt disease was divided into five different grades in this study. Four models, namely GA-SVM, GS-SVM, PSO-SVM, and GWO-SVM, were established and then optimized with the continuous wavelet analysis method (mexh and db3). Based on the cotton crown hyperspectral data, this study has classified and predicted the cotton verticillium wilt disease severity, with the conclusions shown below:
(1)
Based on the cotton crown spectral data, the SVM models combined with the GA, GS, PSO, GWO optimization algorithms can be used to classify the cotton wilt disease severity. The MSC-PSO-SVM model can achieve good classification results with a relatively long running time. The GWO-SVM model has the shortest running time with relatively low parameters, but the results generated through this model are not satisfactory.
(2)
After different CWT processing, the accuracy, macro precision, macro recall, and macro F1-score indicators under all eight models have obtained better values. Among these eight models, those four indicators under the MSC-db3(23)-PSO-SVM and MSC-db3(23)-GWO-SVM models have obtained the same and highest values. After the wavelet (db3) processing, the accuracy, macro precision, macro recall, and macro F1-score indicators under the GWO-SVM model have achieved the biggest increase in their values. The algorithm running time of this model is relatively short.
(3)
Under the MSC-db3(23)-GWO-SVM model, the best results have been obtained on the classification of cotton crown wilt disease severity, and the prediction accuracy rates of the prediction set in this model on disease levels 1, 2, 3, 4, and 5 are 100%, 88%, 84%, 84%, and 100%, respectively.
This study has used a specific cotton variety to perform disease research at the plant level. In future studies, multi-spectral image data collected by unmanned aerial vehicles can be introduced to perform real-time monitoring of cotton fields and formulate management plans for cotton fields. Therefore, the prescription maps provided by these unmanned aerial vehicles can be used to conduct the spraying of pesticides in various ways, thus reducing the use of pesticides and protecting the ecological environment.

Author Contributions

L.L. and T.B. are co-corresponding authors. Conceptualization, N.Z.; methodology, X.Z., X.Y. and R.M.; software, N.Z. and X.Z.; validation, X.Z. and N.Z.; formal analysis, X.Z. and P.S.; investigation, N.Z.; resources, X.Z. and N.Z.; data curation, P.S. and R.M.; writing-original draft preparation, N.Z.; writing-review and editing, N.Z., L.L. and T.B.; visualization, N.Z. and X.Z.; supervision, L.L. and T.B.; project administration, L.L.; funding acquisition, N.Z. All authors have read and agreed to the published version of the manuscript.

Funding

This work was funded by the National Natural Science Foundation of China, grant number 32101621, 62061041, 31960503, and the Bingtuan Science and Technology Program, grant number 2022CB001-05, 2021BB023-02, and Tarim University President’s Fund, grant number TDZKSS202345, and Graduate Scientific Research Innovation project of Tarim University, grant number TDGRI202256.

Data Availability Statement

The data that support the findings of this study are available on request from the corresponding author.

Conflicts of Interest

The authors declare no conflict of interest.

References

  1. Kang, X.; Huang, C.; Zhang, L.; Yang, M.; Zhang, Z.; Lyu, X. Assessing the Severity of Cotton Verticillium Wilt Disease from in Situ Canopy Images and Spectra Using Convolutional Neural Networks. Crop J. 2022, 12, 933–940. [Google Scholar] [CrossRef]
  2. Kaur, K.; Vyas, A. Suppression of Verticillium Wilt of Cotton through Liquid Material and Antagonistic Fungal Strains under Natural Field Conditions. Mater. Today Proc. 2022, 60, 1186–1198. [Google Scholar] [CrossRef]
  3. Chen, B.; Li, S.; Wang, K.; Zhou, G.; Bai, J. Evaluating the Severity Level of Cotton Verticillium Using Spectral Signature Analysis. J. Remote Sens. 2012, 33, 2706–2724. [Google Scholar] [CrossRef]
  4. Zhu, Y.; Zhao, M.; Li, T.; Wang, L.; Liao, C.; Liu, D.; Zhang, H.; Zhao, Y.; Liu, L.; Ge, X.; et al. Interactions between Verticillium Dahliae and Cotton: Pathogenic Mechanism and Cotton Resistance Mechanism to Verticillium Wilt. Front. Plant Sci. 2023, 14, 1174281. [Google Scholar] [CrossRef] [PubMed]
  5. Chen, B.; Li, S.; Wang, K.; Wang, J.; Wang, F.; Xiao, C.; Lai, J.; Wang, N. Spectrum Characteristics of Cotton Canopy Infected with Verticillium Wilt and Applications. Agric. Sci. China 2008, 7, 561–569. [Google Scholar] [CrossRef]
  6. Zhang, H.; Yang, X.; Ran, W.; Xu, Y.; Shen, Q. Screening of bacteria antagonistic against soil-borne cotton Verticillium wilt and their biological effects on the soil-cotton system. Acta Pedol. Sin. 2008, 45, 1095–1101. [Google Scholar] [CrossRef]
  7. Bock, C.H.; Barbedo, J.G.A.; Del Ponte, E.M.; Bohnenkamp, D.; Mahlein, A.-K. From Visual Estimates to Fully Automated Sensor-Based Measurements of Plant Disease Severity: Status and Challenges for Improving Accuracy. Phytopathol. Res. 2020, 2, 9. [Google Scholar] [CrossRef] [Green Version]
  8. Chen, B. Study on Monitoring Cotton Infected with Verticillium Wilt Based on Multi-platform Remote Sensing. Ph.D. Thesis, Shihezi University, Shihezi, China, 2010. [Google Scholar]
  9. Feng, L.; Wu, B.; Zhu, S.; Wang, J.; Su, Z.; Liu, F.; He, Y.; Zhang, C. Investigation on Data Fusion of Multisource Spectral Data for Rice Leaf Diseases Identification Using Machine Learning Methods. Front. Plant Sci. 2020, 11, 577063. [Google Scholar] [CrossRef]
  10. Feng, Z.-H.; Wang, L.-Y.; Yang, Z.-Q.; Zhang, Y.-Y.; Li, X.; Song, L.; He, L.; Duan, J.-Z.; Feng, W. Hyperspectral Monitoring of Powdery Mildew Disease Severity in Wheat Based on Machine Learning. Front. Plant Sci. 2022, 13, 828454. [Google Scholar] [CrossRef]
  11. Galieni, A.; Nicastro, N.; Pentangelo, A.; Platani, C.; Cardi, T.; Pane, C. Surveying Soil-Borne Disease Development on Wild Rocket Salad Crop by Proximal Sensing Based on High-Resolution Hyperspectral Features. Sci. Rep. 2022, 12, 5098. [Google Scholar] [CrossRef]
  12. Jing, X.; Du, K.; Duan, W.; Zou, Q.; Zhao, T.; Li, B.; Ye, Q.; Yan, L. Quantifying the Effects of Stripe Rust Disease on Wheat Canopy Spectrum Based on Eliminating Non-Physiological Stresses. Crop J. 2022, 10, 1284–1291. [Google Scholar] [CrossRef]
  13. Liu, Z.; Huang, J.; Shi, J.; Tao, R.; Zhou, W.; Zhang, L. Characterizing and Estimating Rice Brown Spot Disease Severity Using Stepwise Regression, Principal Component Regression and Partial Least-Square Regression. J. Zhejiang Univ. Sci. B 2007, 8, 738–744. [Google Scholar] [CrossRef] [PubMed] [Green Version]
  14. Zhao, D.; Feng, S.; Cao, Y.; Yu, F.; Guan, Q.; Li, J.; Zhang, G.; Xu, T. Study on the Classification Method of Rice Leaf Blast Levels Based on Fusion Features and Adaptive-Weight Immune Particle Swarm Optimization Extreme Learning Machine Algorithm. Front. Plant Sci. 2022, 13, 879668. [Google Scholar] [CrossRef] [PubMed]
  15. Zhang, J.; Yuan, L.; Wang, J.; Luo, J.; Du, S.; Huang, W. Research progress of crop diseases and pests monitoring based on remote sensing. Trans. CSAE 2012, 28, 1–11. [Google Scholar]
  16. Chen, Q.; Fan, Y.; Wu, H.; Yang, Q.; Wang, D.; Deng, Y.; Wang, C. Spectral Characteristics Analysis of Cotton Verticillium Wilt Canopy and Establishment of Its Severity Estimation Model. J. Xinjiang Agric. Univ. 2020, 43, 261–269. [Google Scholar] [CrossRef]
  17. Chen, T.; Zhang, J.; Chen, Y.; Wan, S.; Zhang, L. Detection of Peanut Leaf Spots Disease Using Canopy Hyperspectral Reflectance. Comput. Electron. Agric. 2019, 156, 677–683. [Google Scholar] [CrossRef]
  18. Cao, X.; Luo, Y.; Zhou, Y.; Duan, X.; Cheng, D. Detection of Powdery Mildew in Two Winter Wheat Cultivars Using Canopy Hyperspectral Reflectance. Crop Prot. 2013, 45, 124–131. [Google Scholar] [CrossRef]
  19. Li, L.; Geng, S.; Lin, D.; Su, G.; Zhang, Y.; Chang, L.; Ji, Y.; Wang, Y.; Wang, L. Accurate Modeling of Vertical Leaf Nitrogen Distribution in Summer Maize Using in Situ Leaf Spectroscopy via CWT and PLS-Based Approaches. Eur. J. Agron. 2022, 140, 126607. [Google Scholar] [CrossRef]
  20. Luo, J.; Huang, W.; Yuan, L.; Zhao, C.; Du, S.; Zhang, J.; Zhao, J. Evaluation of Spectral Indices and Continuous Wavelet Analysis to Quantify Aphid Infestation in Wheat. Precis. Agric. 2013, 14, 151–161. [Google Scholar] [CrossRef]
  21. Mustafa, G.; Zheng, H.; Khan, I.H.; Tian, L.; Jia, H.; Li, G.; Cheng, T.; Tian, Y.; Cao, W.; Zhu, Y.; et al. Hyperspectral Reflectance Proxies to Diagnose In-Field Fusarium Head Blight in Wheat with Machine Learning. Remote Sens. 2022, 14, 2784. [Google Scholar] [CrossRef]
  22. Huang, W.; Lu, J.; Ye, H.; Kong, W.; Hugh Mortimer, A.; Shi, Y. Quantitative Identification of Crop Disease and Nitrogen-Water Stress in Winter Wheat Using Continuous Wavelet Analysis. Int. J. Agric. Biol. Eng. 2018, 11, 145–152. [Google Scholar] [CrossRef] [Green Version]
  23. Tang, J.; Liu, G.; Pan, Q. A Review on Representative Swarm Intelligence Algorithms for Solving Optimization Problems: Applications and Trends. IEEE/CAA J. Autom. Sinica 2021, 8, 1627–1643. [Google Scholar] [CrossRef]
  24. Li, L.; Ustin, S.L.; Riano, D. Retrieval of Fresh Leaf Fuel Moisture Content Using Genetic Algorithm Partial Least Squares (GA-PLS) Modeling. IEEE Geosci. Remote Sens. Lett. 2007, 4, 216–220. [Google Scholar] [CrossRef]
  25. Wang, X.; Zhang, F.; Kung, H.; Johnson, V.C.; Latif, A. Extracting Soil Salinization Information with a Fractional-Order Filtering Algorithm and Grid-Search Support Vector Machine (GS-SVM) Model. J. Remote Sens. 2020, 41, 953–973. [Google Scholar] [CrossRef]
  26. Bonah, E.; Huang, X.; Yi, R.; Aheto, J.H.; Yu, S. Vis-NIR Hyperspectral Imaging for the Classification of Bacterial Foodborne Pathogens Based on Pixel-Wise Analysis and a Novel CARS-PSO-SVM Model. Infrared Phys. Technol. 2020, 105, 103220. [Google Scholar] [CrossRef]
  27. Saremi, S.; Mirjalili, S.; Lewis, A. Grasshopper Optimisation Algorithm: Theory and Application. Adv. Eng. Softw. 2017, 105, 30–47. [Google Scholar] [CrossRef] [Green Version]
  28. Zhong, L.; Zhou, Y.; Zhou, G.; Luo, Q. Enhanced Discrete Dragonfly Algorithm for Solving Four-Color Map Problems. Appl. Intell. 2023, 53, 6372–6400. [Google Scholar] [CrossRef]
  29. Mirjalili, S.; Mirjalili, S.M.; Lewis, A. Grey Wolf Optimizer. Adv. Eng. Softw. 2014, 69, 46–61. [Google Scholar] [CrossRef] [Green Version]
  30. Zhang, Y.; Kang, C.; Liu, Y.; Fu, X.; Zhang, J.; Wang, M.; Yang, L. Rapidly Detection of Total Nitrogen and Phosphorus Content in Water by Surface Enhanced Raman Spectroscopy and GWO-SVR Algorithm. Spectrosc. Spectr. Anal. 2021, 41, 3147–3152. [Google Scholar]
  31. Gao, Q.; Wang, P.; Niu, T.; He, D.; Wang, M.; Yang, H.; Zhao, X. Soluble Solid Content and Firmness Index Assessment and Maturity Discrimination of Malus Micromalus Makino Based on Near-Infrared Hyperspectral Imaging. Food Chem. 2022, 370, 131013. [Google Scholar] [CrossRef]
  32. Wu, S.; Wang, L.; Zhou, G.; Liu, C.; Ji, Z.; Li, Z.; Li, W. Strategies for the Content Determination of Capsaicin and the Identification of Adulterated Pepper Powder Using a Hand-Held near-Infrared Spectrometer. Food Res. Int. 2023, 163, 112192. [Google Scholar] [CrossRef] [PubMed]
  33. Zhang, F.; Wang, X.; Cui, X.; Cao, W.; Zhang, X.; Zhang, Y. Classification of Qianxi Tomatoes by Visible/Near Infrared Spectroscopy Combined with GMO-SVM. Spectrosc. Spectr. Anal. 2022, 42, 3291–3297. [Google Scholar] [CrossRef]
  34. Du, L.; Yang, H.; Song, X.; Wei, N.; Yu, C.; Wang, W.; Zhao, Y. Estimating Leaf Area Index of Maize Using UAV-Based Digital Imagery and Machine Learning Methods. Sci. Rep. 2022, 12, 15937. [Google Scholar] [CrossRef] [PubMed]
  35. Gutiérrez, S.; Fernández-Novales, J.; Diago, M.P.; Tardaguila, J. On-The-Go Hyperspectral Imaging Under Field Conditions and Machine Learning for the Classification of Grapevine Varieties. Front. Plant Sci. 2018, 9, 1102. [Google Scholar] [CrossRef]
  36. He, Y.; Zhang, W.; Ma, Y.; Li, J.; Ma, B. The Classification of Rice Blast Resistant Seed Based on Ranman Spectroscopy and SVM. Molecules 2022, 27, 4091. [Google Scholar] [CrossRef]
  37. Wang, Z.; Fan, S.; Wu, J.; Zhang, C.; Xu, F.; Yang, X.; Li, J. Application of Long-Wave near Infrared Hyperspectral Imaging for Determination of Moisture Content of Single Maize Seed. Spectrochim. Acta A Mol. Biomol. Spectrosc. 2021, 254, 119666. [Google Scholar] [CrossRef]
  38. Zhao, G.; Pei, Y.; Yang, R.; Xiang, L.; Fang, Z.; Wang, Y.; Yin, D.; Wu, J.; Gao, D.; Yu, D.; et al. A Non-Destructive Testing Method for Early Detection of Ginseng Root Diseases Using Machine Learning Technologies Based on Leaf Hyperspectral Reflectance. Front. Plant Sci. 2022, 13, 1031030. [Google Scholar] [CrossRef]
  39. Zhu, H.; Chu, B.; Zhang, C.; Liu, F.; Jiang, L.; He, Y. Hyperspectral Imaging for Presymptomatic Detection of Tobacco Disease with Successive Projections Algorithm and Machine-Learning Classifiers. Sci. Rep. 2017, 7, 4125. [Google Scholar] [CrossRef] [Green Version]
  40. Zhang, G.; Xu, T.; Tian, Y. Hyperspectral Imaging-Based Classification of Rice Leaf Blast Severity over Multiple Growth Stages. Plant Methods 2022, 18, 123. [Google Scholar] [CrossRef]
  41. Zhao, J.; Fang, Y.; Chu, G.; Yan, H.; Hu, L.; Huang, L. Identification of Leaf-Scale Wheat Powdery Mildew (Blumeria graminis f. Sp. tritici) Combining Hyperspectral Imaging and an SVM Classifier. Plants 2020, 9, 936. [Google Scholar] [CrossRef]
  42. Liu, S.; Yu, H.; Sui, Y.; Zhou, H.; Zhang, J.; Kong, L.; Dang, J.; Zhang, L. Classification of Soybean Frogeye Leaf Spot Disease Using Leaf Hyperspectral Reflectance. PLoS ONE 2021, 16, e0257008. [Google Scholar] [CrossRef] [PubMed]
  43. Das, B.; Manohara, K.K.; Mahajan, G.R.; Sahoo, R.N. Spectroscopy Based Novel Spectral Indices, PCA- and PLSR-Coupled Machine Learning Models for Salinity Stress Phenotyping of Rice. Spectrochim. Acta. A Mol. Biomol. Spectrosc. 2020, 229, 117983. [Google Scholar] [CrossRef] [PubMed]
  44. He, Y.; Zhao, X.; Zhang, W.; He, X.; Tong, L. Study on the Identification of Resistance of Rice Blast Based on near Infrared Spectroscopy. Spectrochim. Acta A Mol. Biomol. Spectrosc. 2022, 266, 120439. [Google Scholar] [CrossRef] [PubMed]
  45. Geetharamani, G.; Pandian, A. Identification of Plant Leaf Diseases Using a Nine-Layer Deep Convolutional Neural Network. Comput. Electr. Eng. 2019, 76, 323–338. [Google Scholar] [CrossRef]
  46. Lu, J.; Tan, L.; Jiang, H. Review on Convolutional Neural Network (CNN) Applied to Plant Leaf Disease Classification. Agriculture 2021, 11, 707. [Google Scholar] [CrossRef]
  47. Kang, L.; Yuan, J.; Gao, R.; Kong, Q.; Jia, Y.; Su, Z. Early Detection and Identification of Rice Blast Based on Hyperspectral Image. Spectrosc. Spectr. Anal. 2021, 41, 898–902. [Google Scholar]
  48. Zhang, Z.; Wang, P.; Yao, Z.; Qin, L.; He, D.; Xu, Y.; Zhang, J.; Hu, J. Early Detection of Downy Mildew on Grape Leaves Using Multicolor Fluorescence Imaging and Model SVM. Spectrosc. Spectr. Anal. 2021, 41, 828–834. [Google Scholar]
  49. Han, Y.; Liu, H.; Zhang, X.; Yu, Z.; Meng, X.; Kong, F.; Song, S.; Han, J. Prediction Model of Rice Panicles Blast Disease Degree Based on Canopy Hyperspectral Reflectance. Spectrosc. Spectr. Anal. 2021, 41, 1220–1226. [Google Scholar]
  50. Liu, Y.; Lin, X.; Gao, H.; Wang, S.; Gao, X. Research on Tea Cephaleuros Virescens Kunze Model Based on Chlorophyll Fluorescence Spectroscopy. Spectrosc. Spectr. Anal. 2021, 41, 2129–2134. [Google Scholar]
  51. Kok, Z.H.; Mohamed Shariff, A.R.; Alfatni, M.S.M.; Khairunniza-Bejo, S. Support Vector Machine in Precision Agriculture: A Review. Comput. Electron. Agric. 2021, 191, 106546. [Google Scholar] [CrossRef]
  52. Li, F.; Wang, L.; Liu, J.; Wang, Y.; Chang, Q. Evaluation of Leaf N Concentration in Winter Wheat Based on Discrete Wavelet Transform Analysis. Remote Sens. 2019, 11, 1331. [Google Scholar] [CrossRef] [Green Version]
  53. Le Maire, G.; François, C.; Dufrêne, E. Towards Universal Broad Leaf Chlorophyll Indices Using PROSPECT Simulated Database and Hyperspectral Reflectance Measurements. Remote Sens. Environ. 2004, 89, 1–28. [Google Scholar] [CrossRef]
  54. Zhao, J.; Xiong, Z.; Ning, J.; Xie, D. Wavelet transform combined with spa to optimize the near-infrared analysis model of caffeine in tea. J. Anal. Sci. 2021, 37, 611–617. [Google Scholar] [CrossRef]
  55. Ding, Y.; Yan, Y.; Li, J.; Chen, X.; Jiang, H. Classification of Tea Quality Levels Using Near-Infrared Spectroscopy Based on CLPSO-SVM. Foods 2022, 11, 1658. [Google Scholar] [CrossRef]
  56. Nkongolo, M.; Van Deventer, J.P.; Kasongo, S.M.; Zahra, S.R.; Kipongo, J. A Cloud Based Optimization Method for Zero-Day Threats Detection Using Genetic Algorithm and Ensemble Learning. Electronics 2022, 11, 1749. [Google Scholar] [CrossRef]
  57. Huang, C.-L.; Dun, J.-F. A Distributed PSO–SVM Hybrid System with Feature Selection and Parameter Optimization. Appl. Soft Comput. 2008, 8, 1381–1391. [Google Scholar] [CrossRef]
  58. Wang, Z.; Chen, J.; Fan, Y.; Cheng, Y.; Wu, X.; Zhang, J.; Wang, B.; Wang, X.; Yong, T.; Liu, W.; et al. Evaluating Photosynthetic Pigment Contents of Maize Using UVE-PLS Based on Continuous Wavelet Transform. Comput. Electron. Agric. 2020, 169, 105160. [Google Scholar] [CrossRef]
  59. Chicco, D.; Jurman, G. The Advantages of the Matthews Correlation Coefficient (MCC) over F1 Score and Accuracy in Binary Classification Evaluation. BMC Genom. 2020, 21, 6. [Google Scholar] [CrossRef] [Green Version]
  60. Guo, W.; Zhu, Y.; Wang, H.; Zhang, J.; Dong, P.; Qiao, H. Monitoring Model of Winter Wheat Take-all Based on UAV Hyperspectral Imaging. Trans. Chin. Soc. Agric. Mach. 2019, 50, 162–169. [Google Scholar] [CrossRef]
  61. Song, L.; Liang, Q.; Chen, H.; Hu, H.; Luo, Y.; Luo, Y. A New Approach to Optimize SVM for Insulator State Identification Based on Improved PSO Algorithm. Sensors 2022, 23, 272. [Google Scholar] [CrossRef]
  62. Li, D.; Wang, X.; Zheng, H.; Zhou, K.; Yao, X.; Tian, Y.; Zhu, Y.; Cao, W.; Cheng, T. Estimation of Area- and Mass-Based Leaf Nitrogen Contents of Wheat and Rice Crops from Water-Removed Spectra Using Continuous Wavelet Analysis. Plant Methods 2018, 14, 76. [Google Scholar] [CrossRef] [PubMed]
  63. Li, D.; Cheng, T.; Jia, M.; Zhou, K.; Lu, N.; Yao, X.; Tian, Y.; Zhu, Y.; Cao, W. PROCWT: Coupling PROSPECT with Continuous Wavelet Transform to Improve the Retrieval of Foliar Chemistry from Leaf Bidirectional Reflectance Spectra. Remote Sens. Environ. 2018, 206, 1–14. [Google Scholar] [CrossRef]
  64. Ma, H.; Huang, W.; Dong, Y.; Liu, L.; Guo, A. Using UAV-Based Hyperspectral Imagery to Detect Winter Wheat Fusarium Head Blight. Remote Sens. 2021, 13, 3024. [Google Scholar] [CrossRef]
  65. Chen, X.; Li, F.; Chang, Q. Combination of Continuous Wavelet Transform and Successive Projection Algorithm for the Estimation of Winter Wheat Plant Nitrogen Concentration. Remote Sens. 2023, 15, 997. [Google Scholar] [CrossRef]
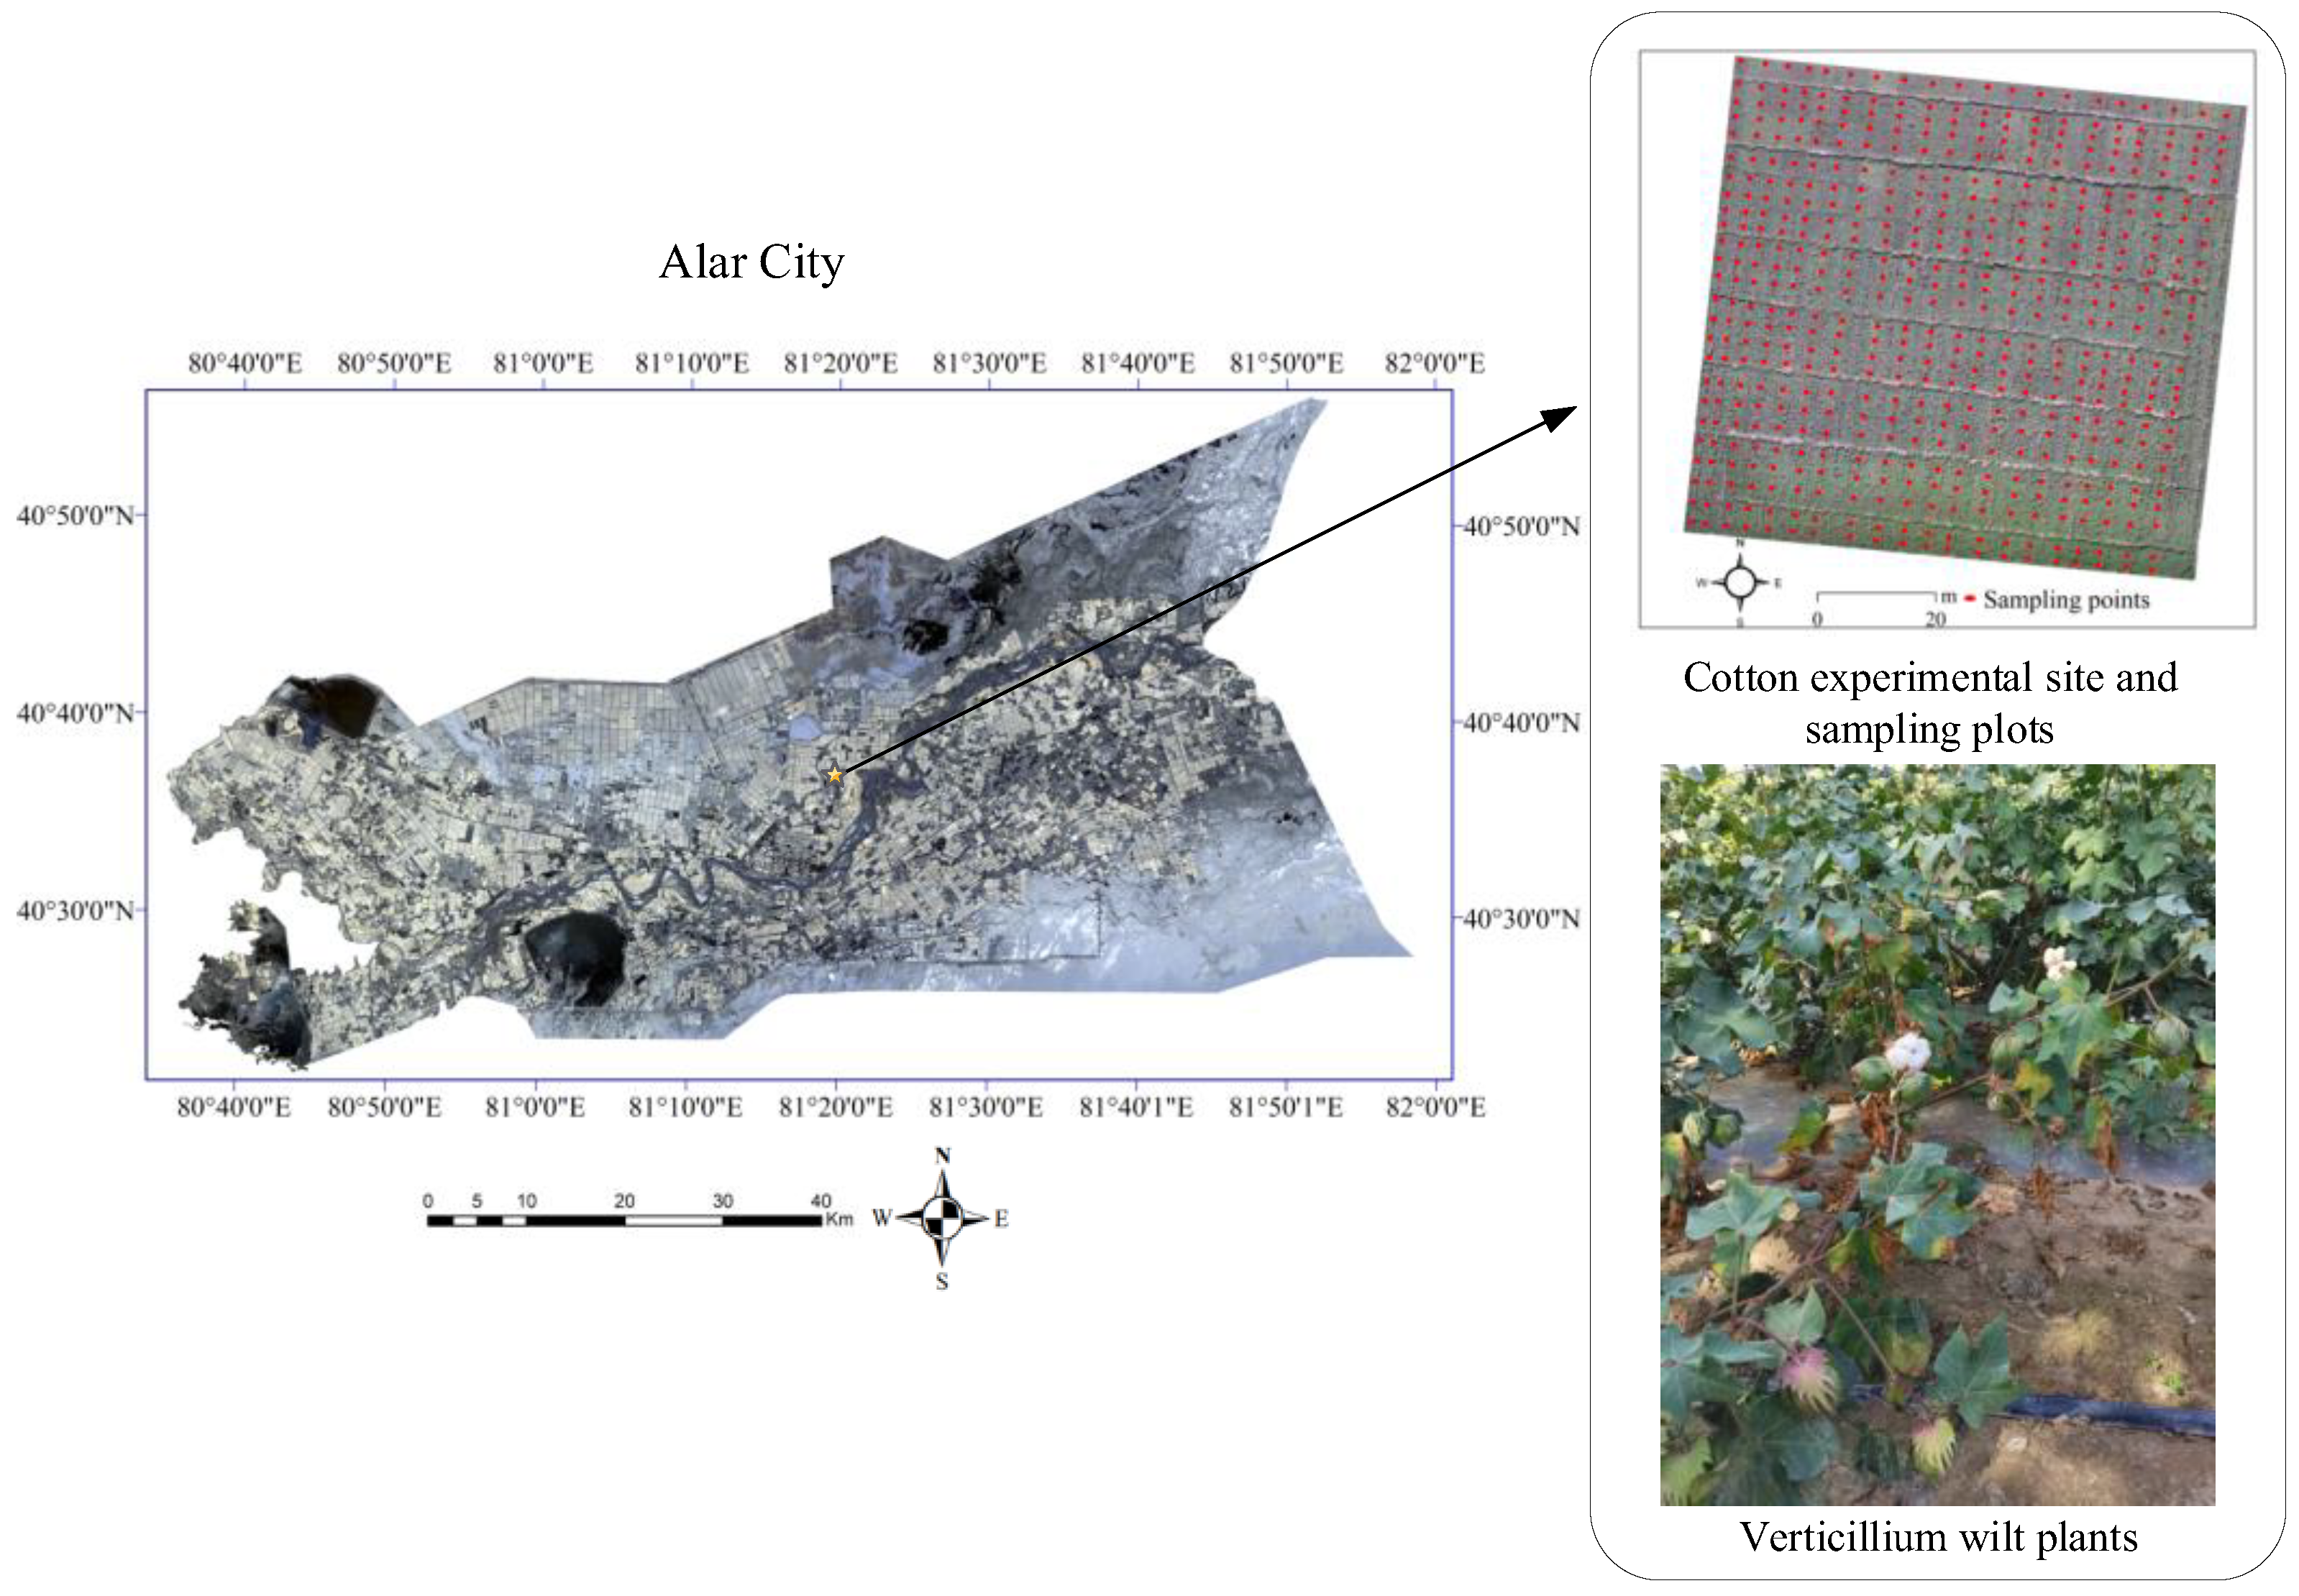
Figure 1. Location of the experimental field and photos of cotton crops.
Remotesensing 15 03373 g001
Figure 2. Flowchart of primary data processing procedure.
Remotesensing 15 03373 g002
Figure 3. Process architecture of the proposed SVM-based model with GS, GA, PSO, and GWO optimization algorithms.
Remotesensing 15 03373 g003
Figure 4. Canopy spectral reflectance curves of cotton plant.
Remotesensing 15 03373 g004
Figure 5. Five different levels of cotton canopy wilt disease (s1—normal (healthy); s2—mild; s3—moderate; s4—severe; s5—extremely severe).
Remotesensing 15 03373 g005
Figure 6. Confusion matrices of level classifications of cotton canopy wilt disease under the SVM models. (a) Training set of the GA-SVM model, (b) testing set of the GA-SVM model, (c) training set of the GS-SVM model, (d) testing set of the GS-SVM model, (e) training set of the PSO-SVM model, (f) testing set of the PSO-SVM model, (g) training set of the GWO-SVM model, (h) testing set of the GWO-SVM model.
Remotesensing 15 03373 g006aRemotesensing 15 03373 g006b
Figure 7. Wavelet coefficient curves at different decomposition levels. (a) Wavelet basis functions (mexh), (b) wavelet basis functions (db3).
Remotesensing 15 03373 g007
Figure 8. Confusion matrices of level classifications of cotton canopy wilt disease under the wavelet function and the SVM models. (a) Training set under the db3(23)-GA-SVM model, (b) testing set under the db3(23)-GA-SVM model, (c) training set under the db3(23)-GS-SVM model, (d) testing set under the db3(23)-GS-SVM model, (e) training set under the db3(23)-PSO-SVM model, (f) testing set under the db3(23)- PSO -SVM model, (g) training set under the db3(23)-GWO-SVM model, (h) testing set under the db3(23)-GWO-SVM model.
Remotesensing 15 03373 g008aRemotesensing 15 03373 g008b
Table 1. Quantitative statistics of samples.
LevelTraining SetTesting SetNumber of Samples
17525100
27525100
37525100
47525100
57525100
Entire sample set375125500
Table 2. Classification results of the cotton verticillium wilt disease based on the SVM models.
ModelDatasetAccuracy (%)Macro
Precision (%)
Macro
Recall (%)
Macro
F1-Score (%)
Time (s)
MSC-GA-SVMTraining set10010010010050.74
Testing set53.656.2853.651.46
MSC-GS-SVMTraining set100100100100146.53
Testing set66.468.1266.464.67
MSC-PSO-SVMTraining set10010010010079.72
Testing set8081.268079.57
MSC-GWO-SVMTraining set1001001001005.33
Testing set6466.26463.48
Table 3. Classification results of cotton canopy wilt disease based on the wavelet (mexh) method and SVM models.
ModelDatasetAccuracy (%)Macro
Precision (%)
Macro
Recall (%)
Macro
F1-Score (%)
Time (s)
MSC-mexh(21)-GA-SVMTraining set100100100100126.48
Testing set81.684.1482.482.18
MSC- mexh(21)-GS-SVMTraining set100100100100319.02
Testing set88.890.2888.888.67
MSC-mexh(21)-PSO-SVMTraining set100100100100178.6
Testing set89.690.789.689.53
MSC-mexh(21)-GWO-SVMTraining set10010010010030.39
Testing set87.287.9487.287.16
Table 4. Classification results of cotton canopy wilt disease based on the wavelet (db3) method and the SVM models.
ModelDatasetAccuracy (%)Macro
Precision (%)
Macro
Recall (%)
Macro
F1-Score (%)
Time (s)
MSC-db3(23)-GA-SVMTraining set100100100100266
Testing set89.691.2690.490.42
MSC-db3(23)-GS-SVMTraining set100100100100389.38
Testing set88.891.590.490.33
MSC-db3(23)-PSO-SVMTraining set99.7399.7499.7499.74135.3
Testing set91.292.0291.291.16
MSC-db3(23)-GWO-SVMTraining set97.697.6897.697.6141.68
Testing set91.292.0291.291.16
Disclaimer/Publisher’s Note: The statements, opinions and data contained in all publications are solely those of the individual author(s) and contributor(s) and not of MDPI and/or the editor(s). MDPI and/or the editor(s) disclaim responsibility for any injury to people or property resulting from any ideas, methods, instructions or products referred to in the content.