


Surface Subsidence of Nanchang, China 2015–2021 Retrieved via Multi-Temporal InSAR Based on Long- and Short-Time Baseline Net

Abstract
1. Introduction
2. Data and Methods
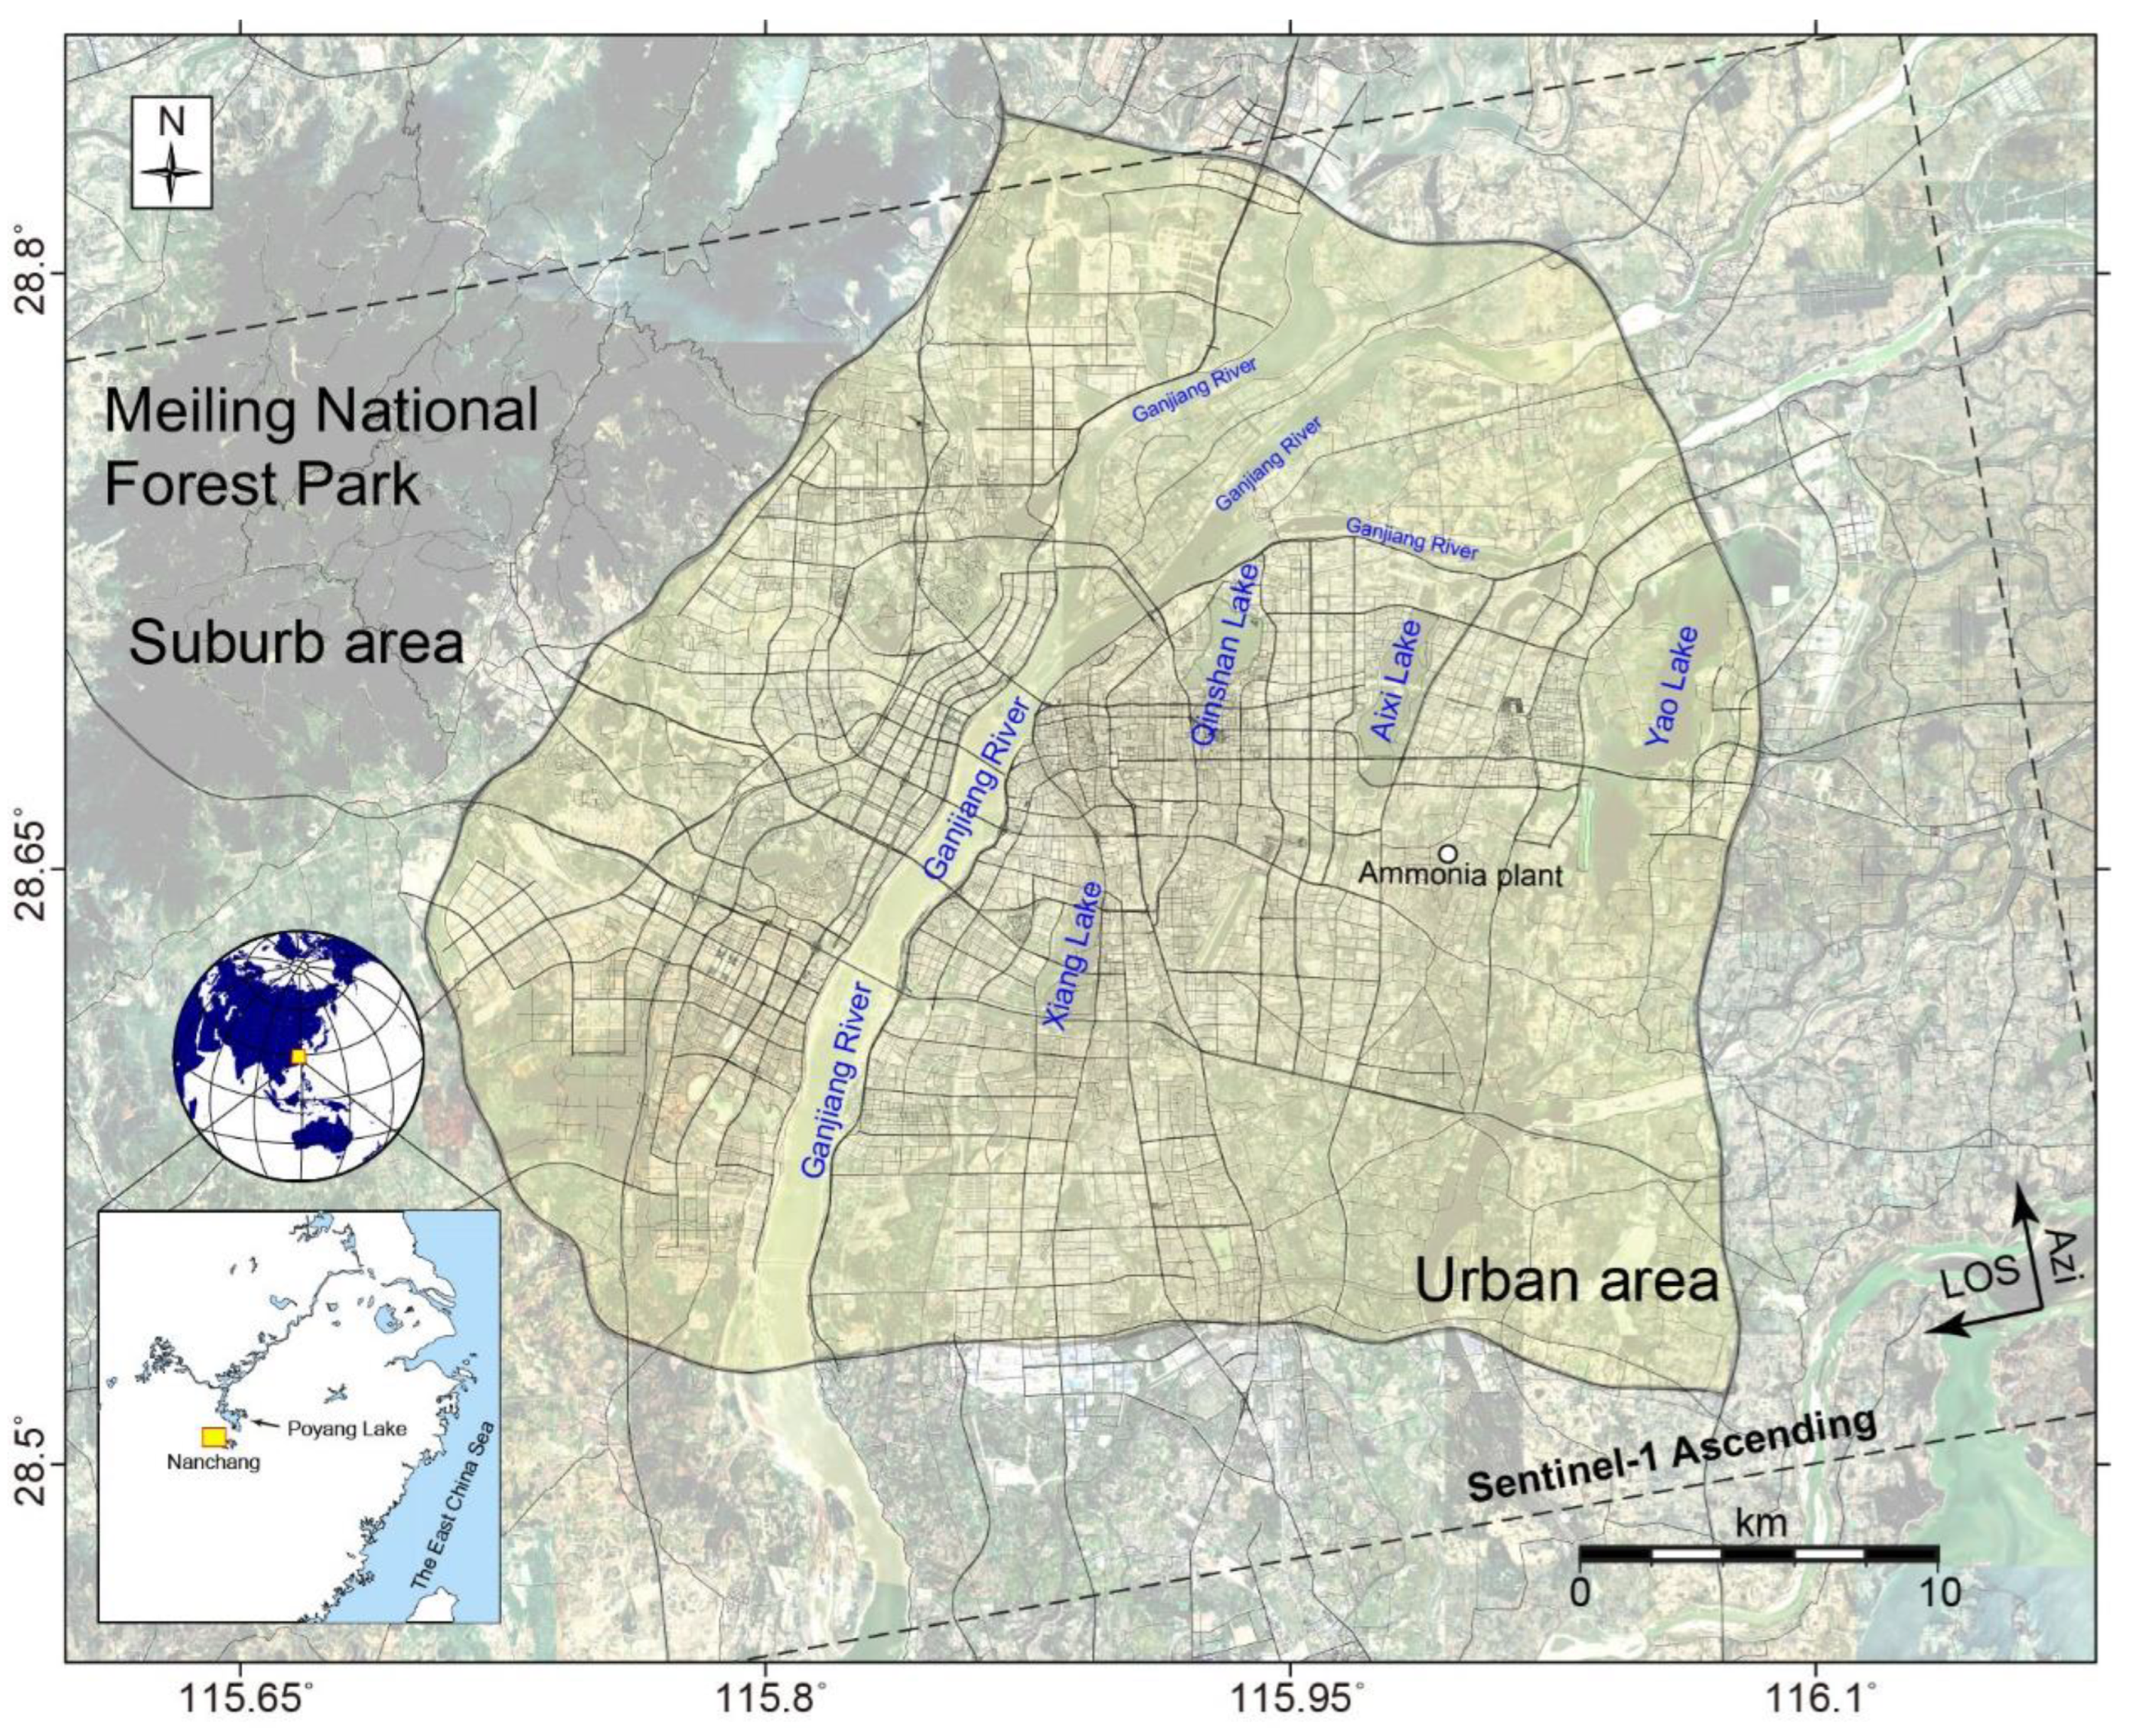
2.1. Data Coverage
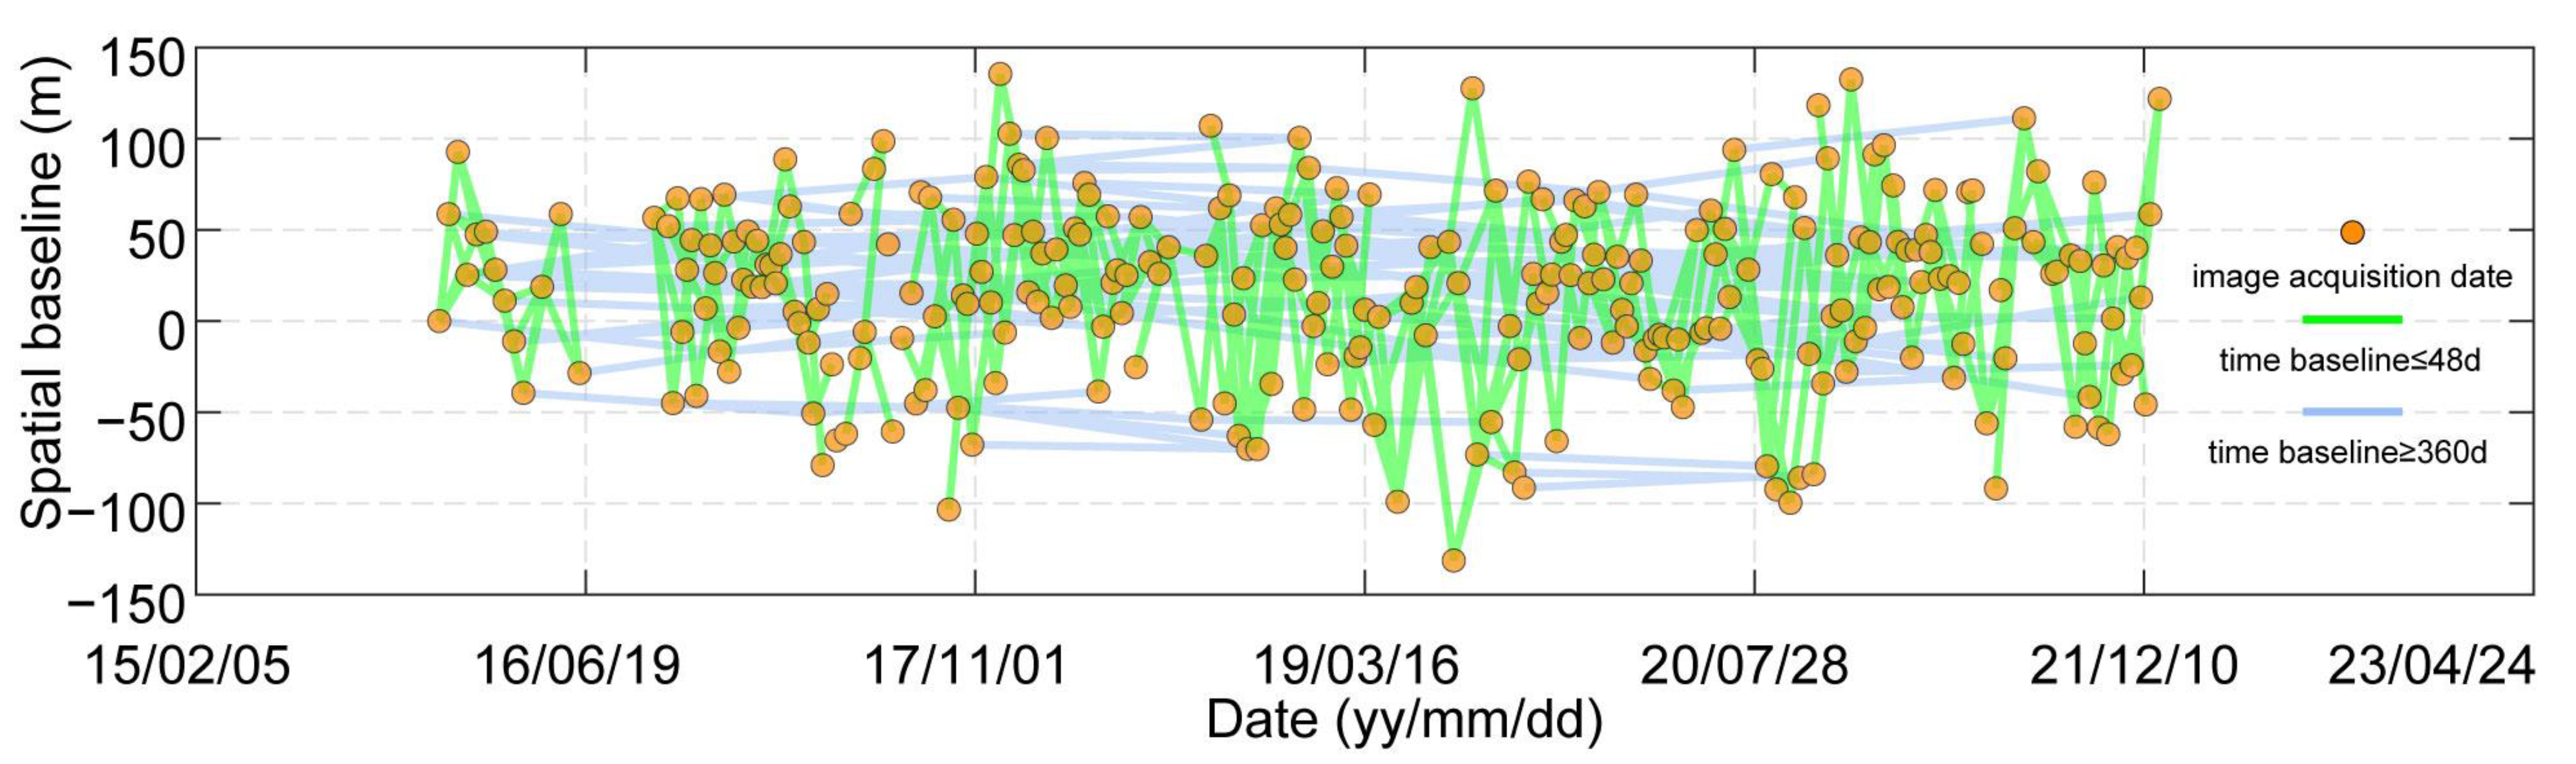
2.2. Time Series InSAR Analysis Method and the Strategy Adopted in This Study
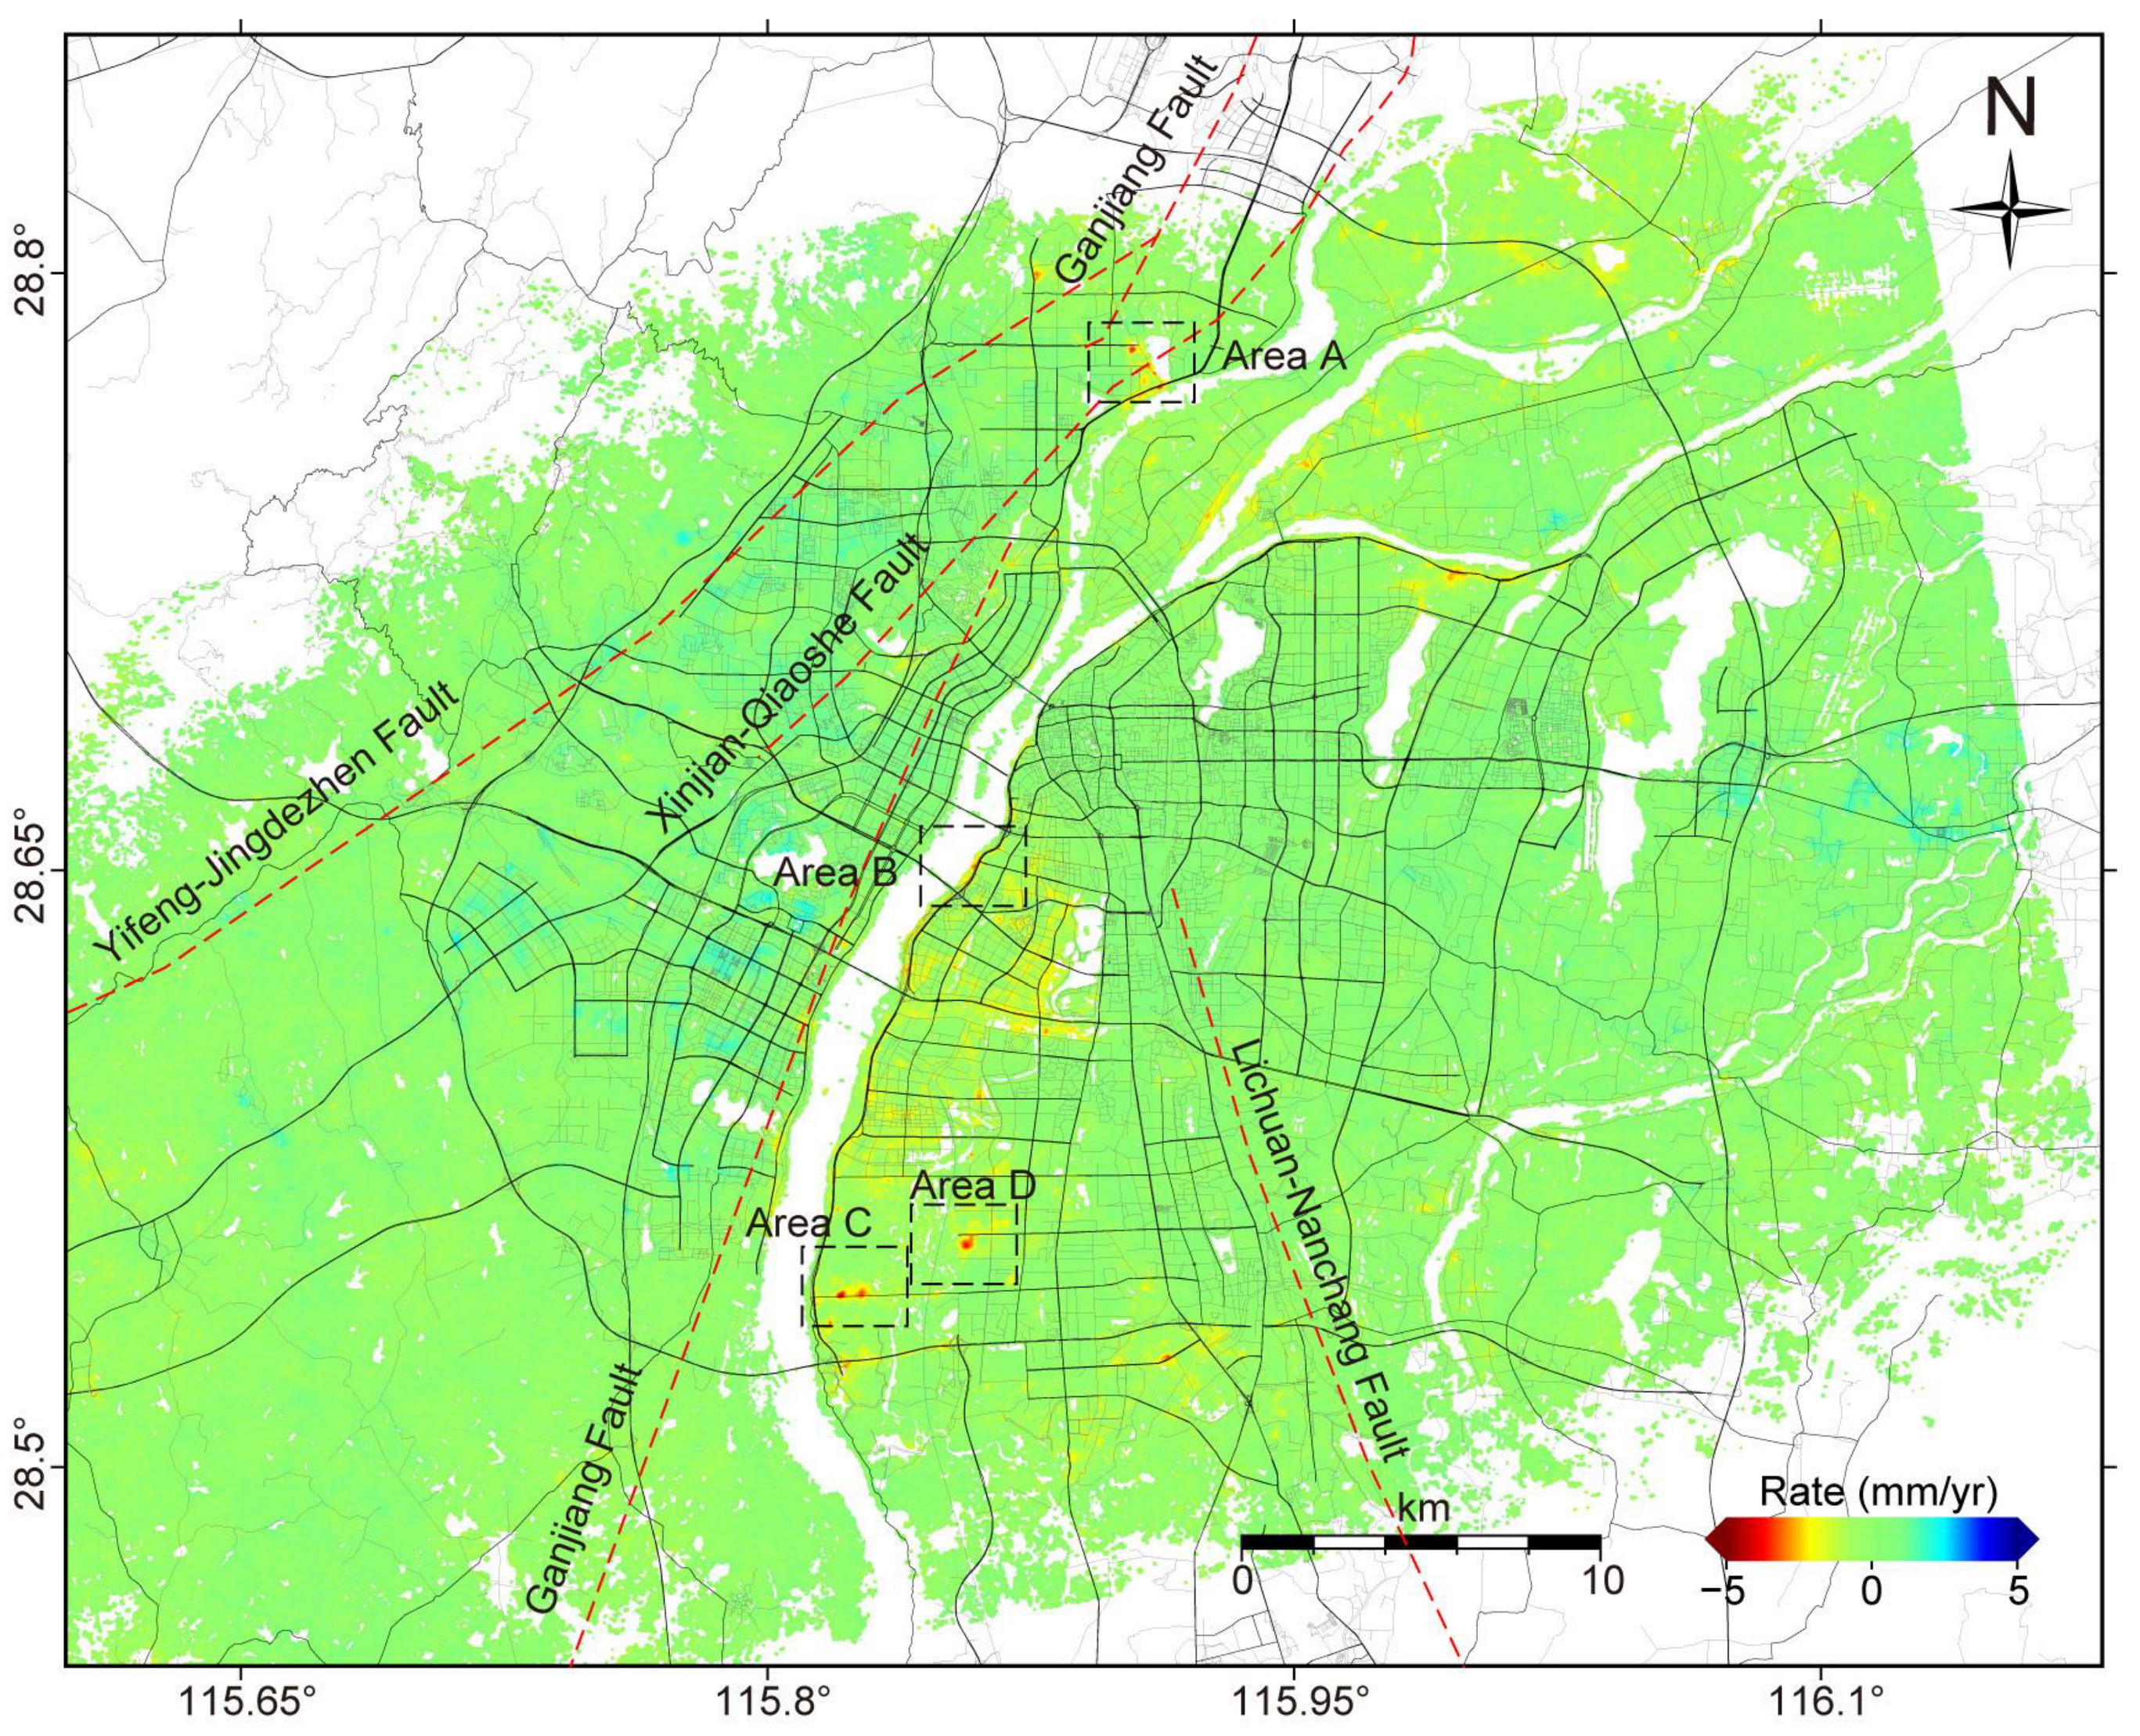
3. Results
4. Discussion
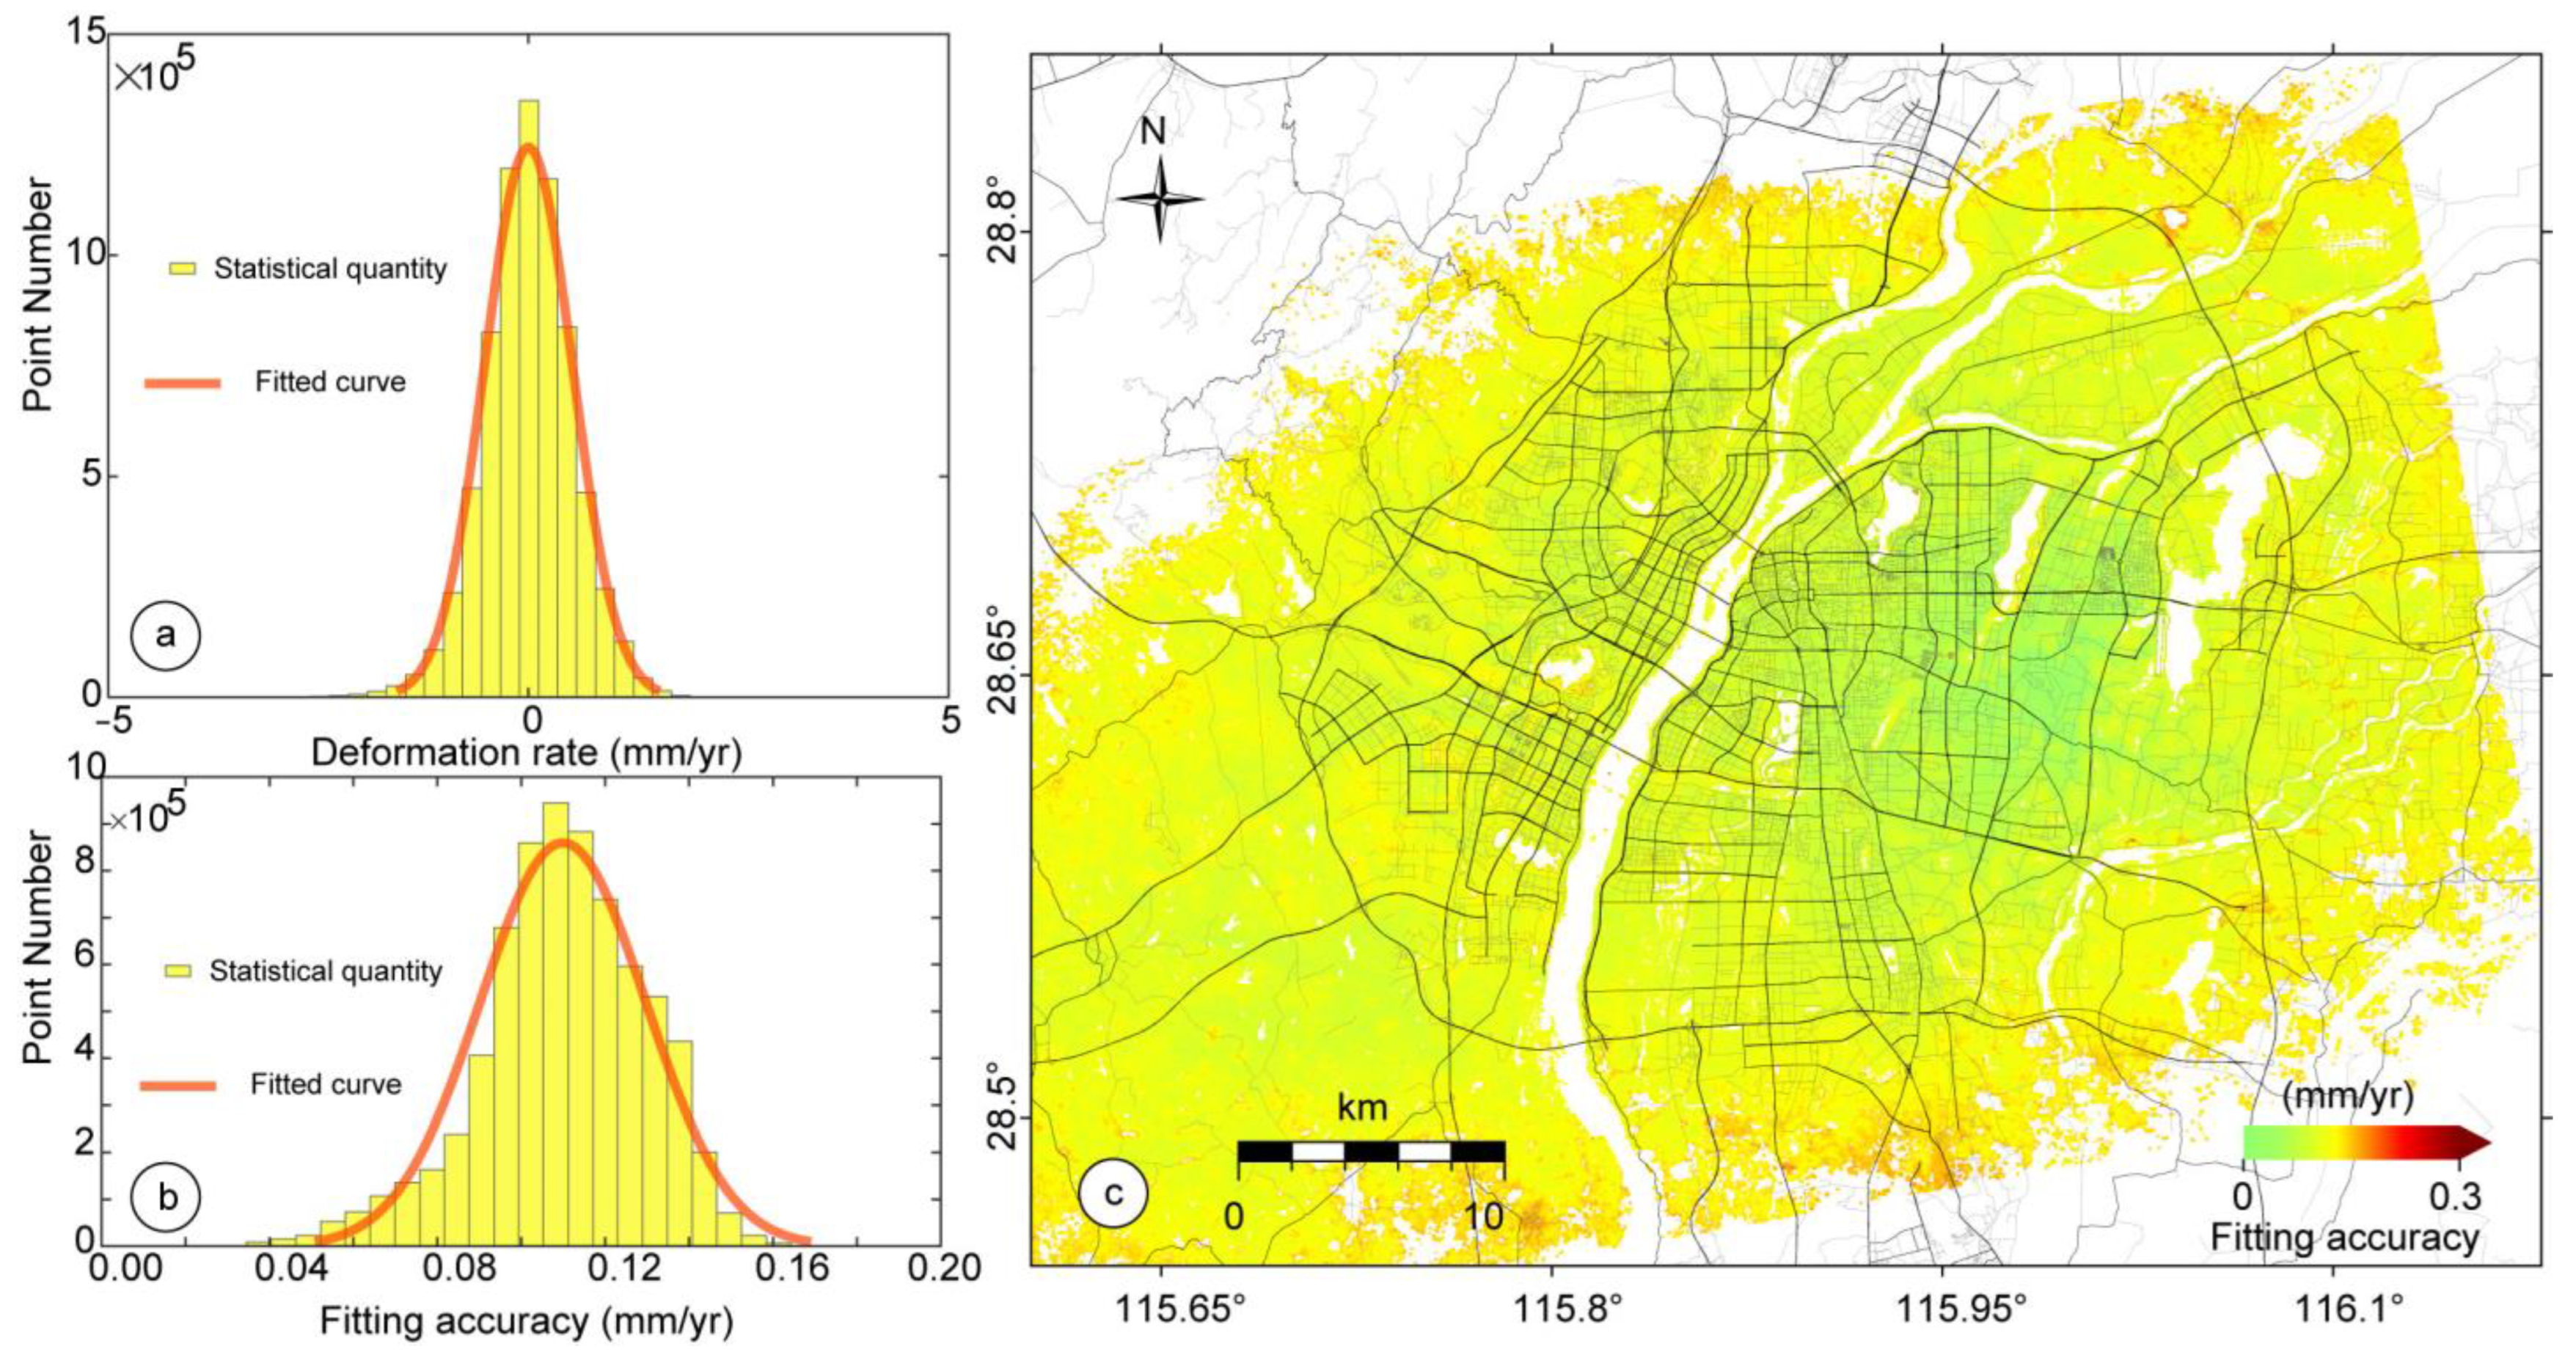
4.1. Precision Checking
4.2. Cause Analysis of the Deformation in Nanchang
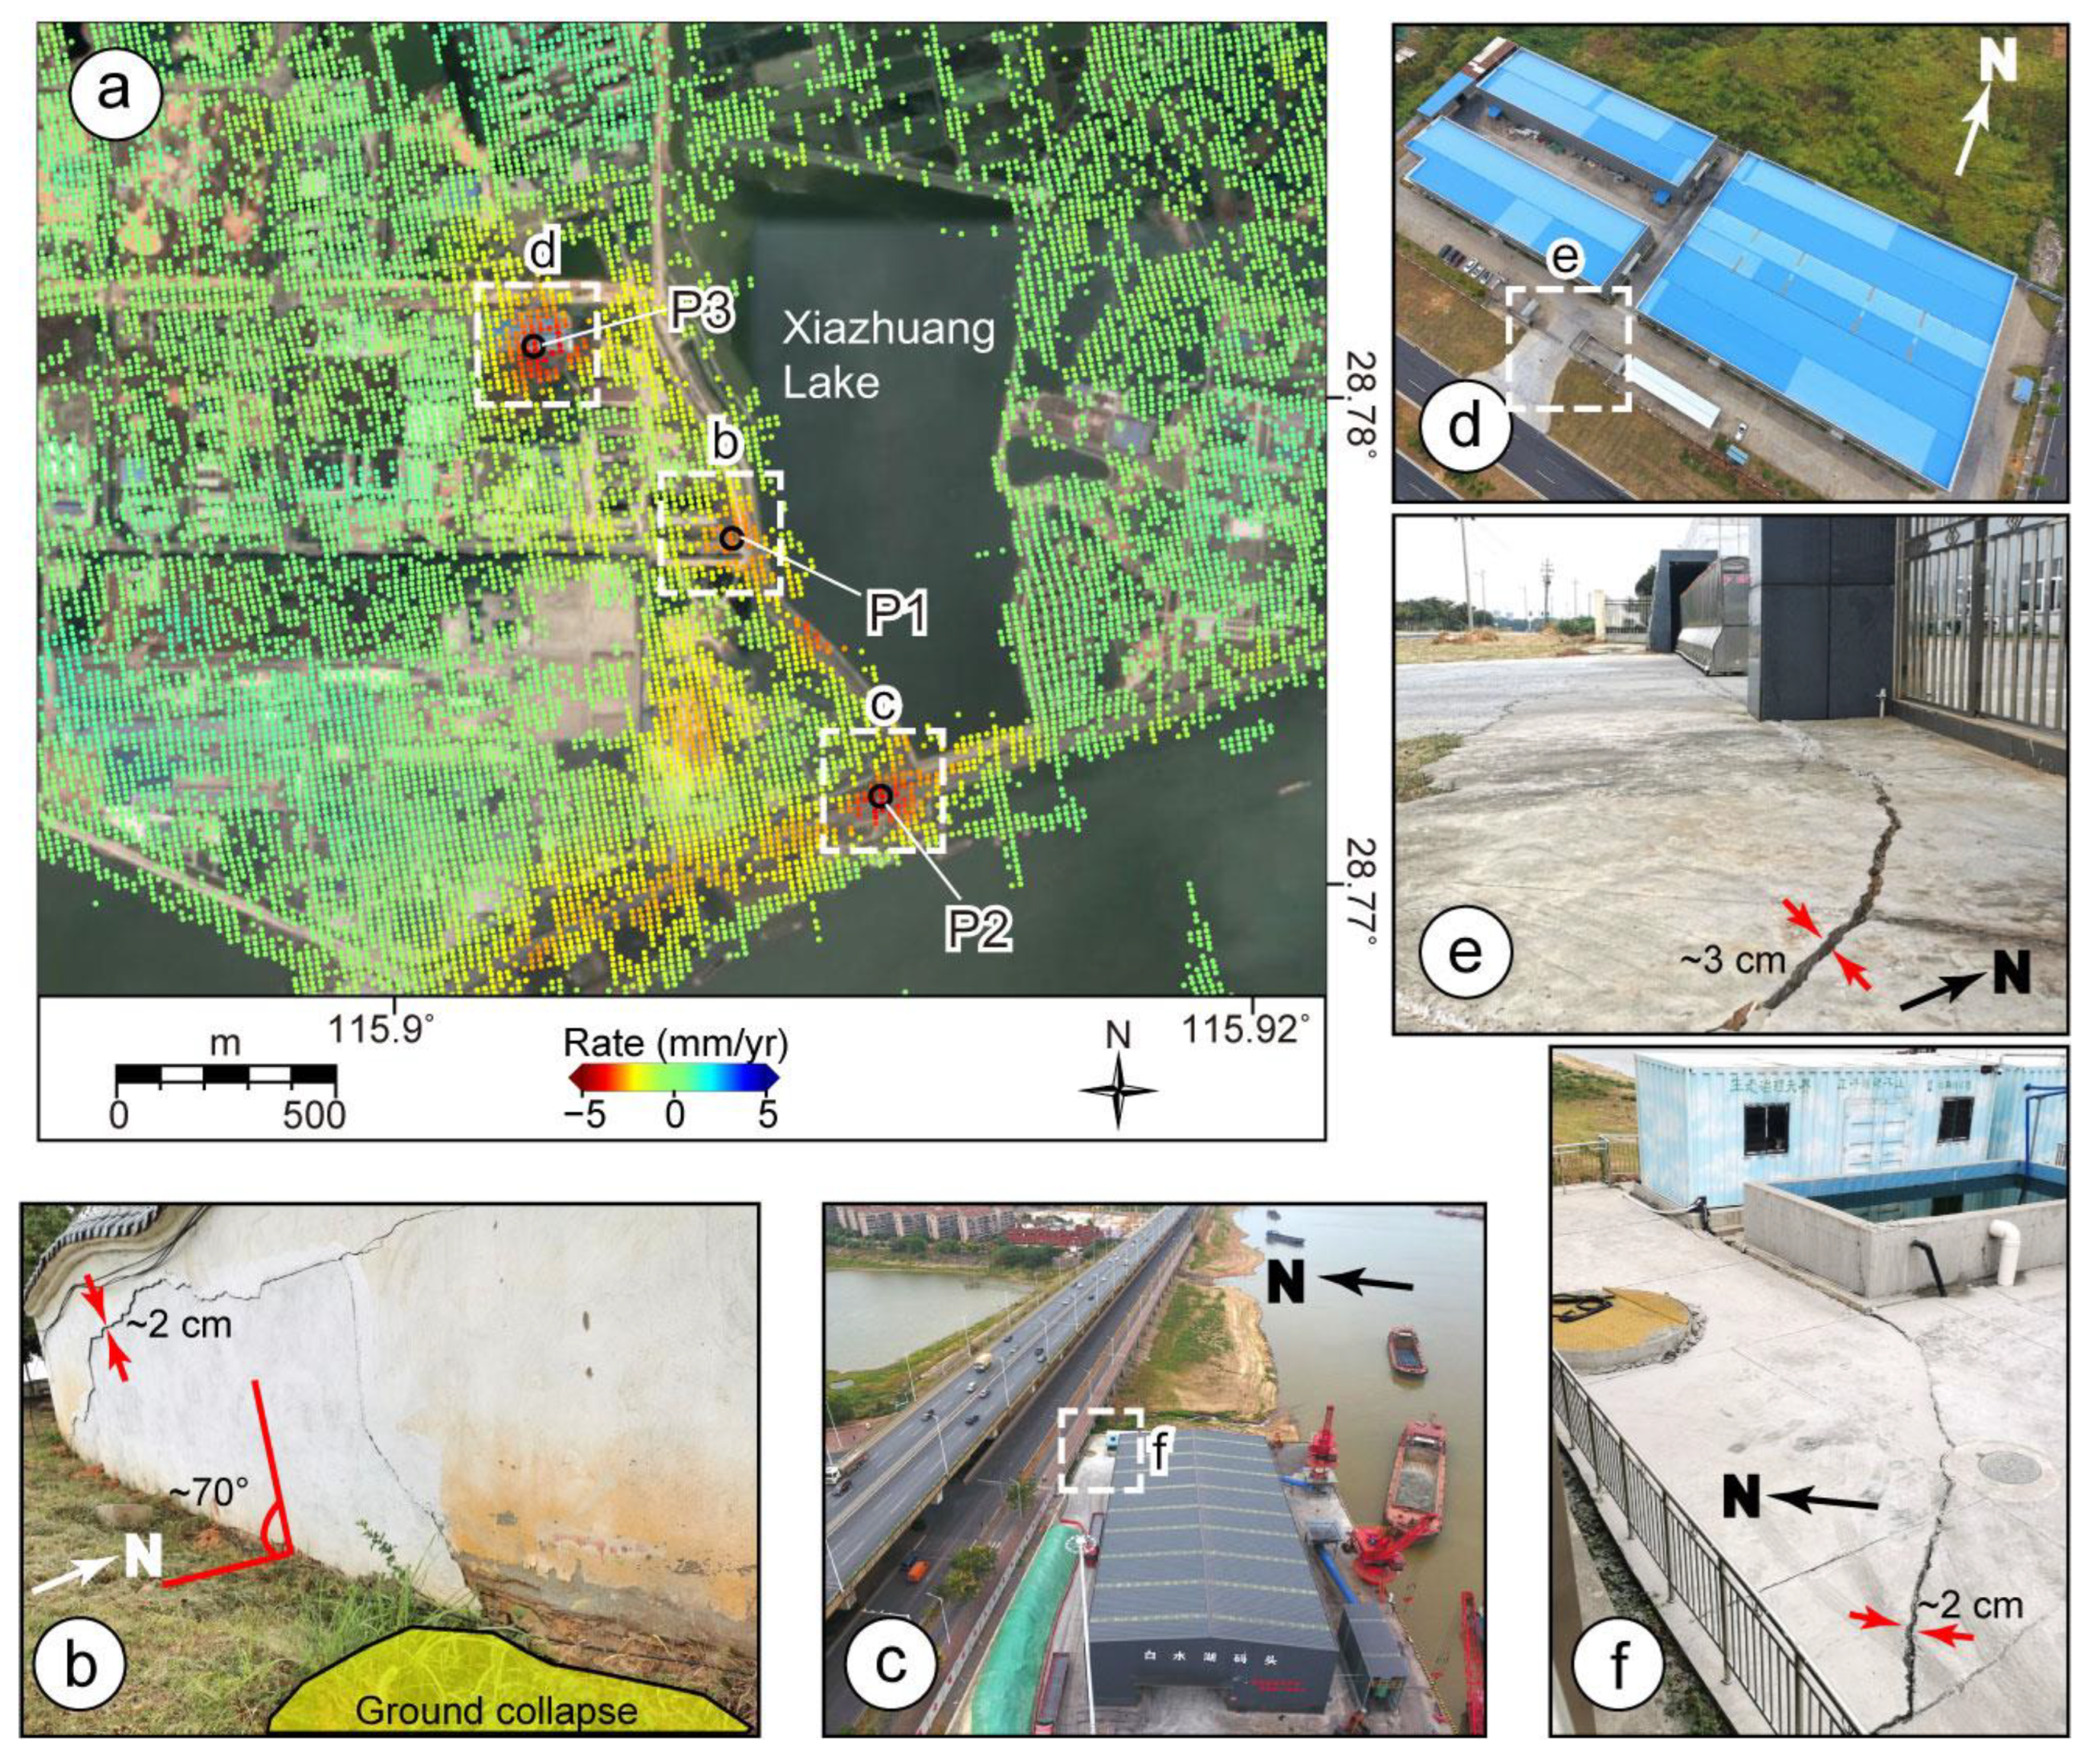
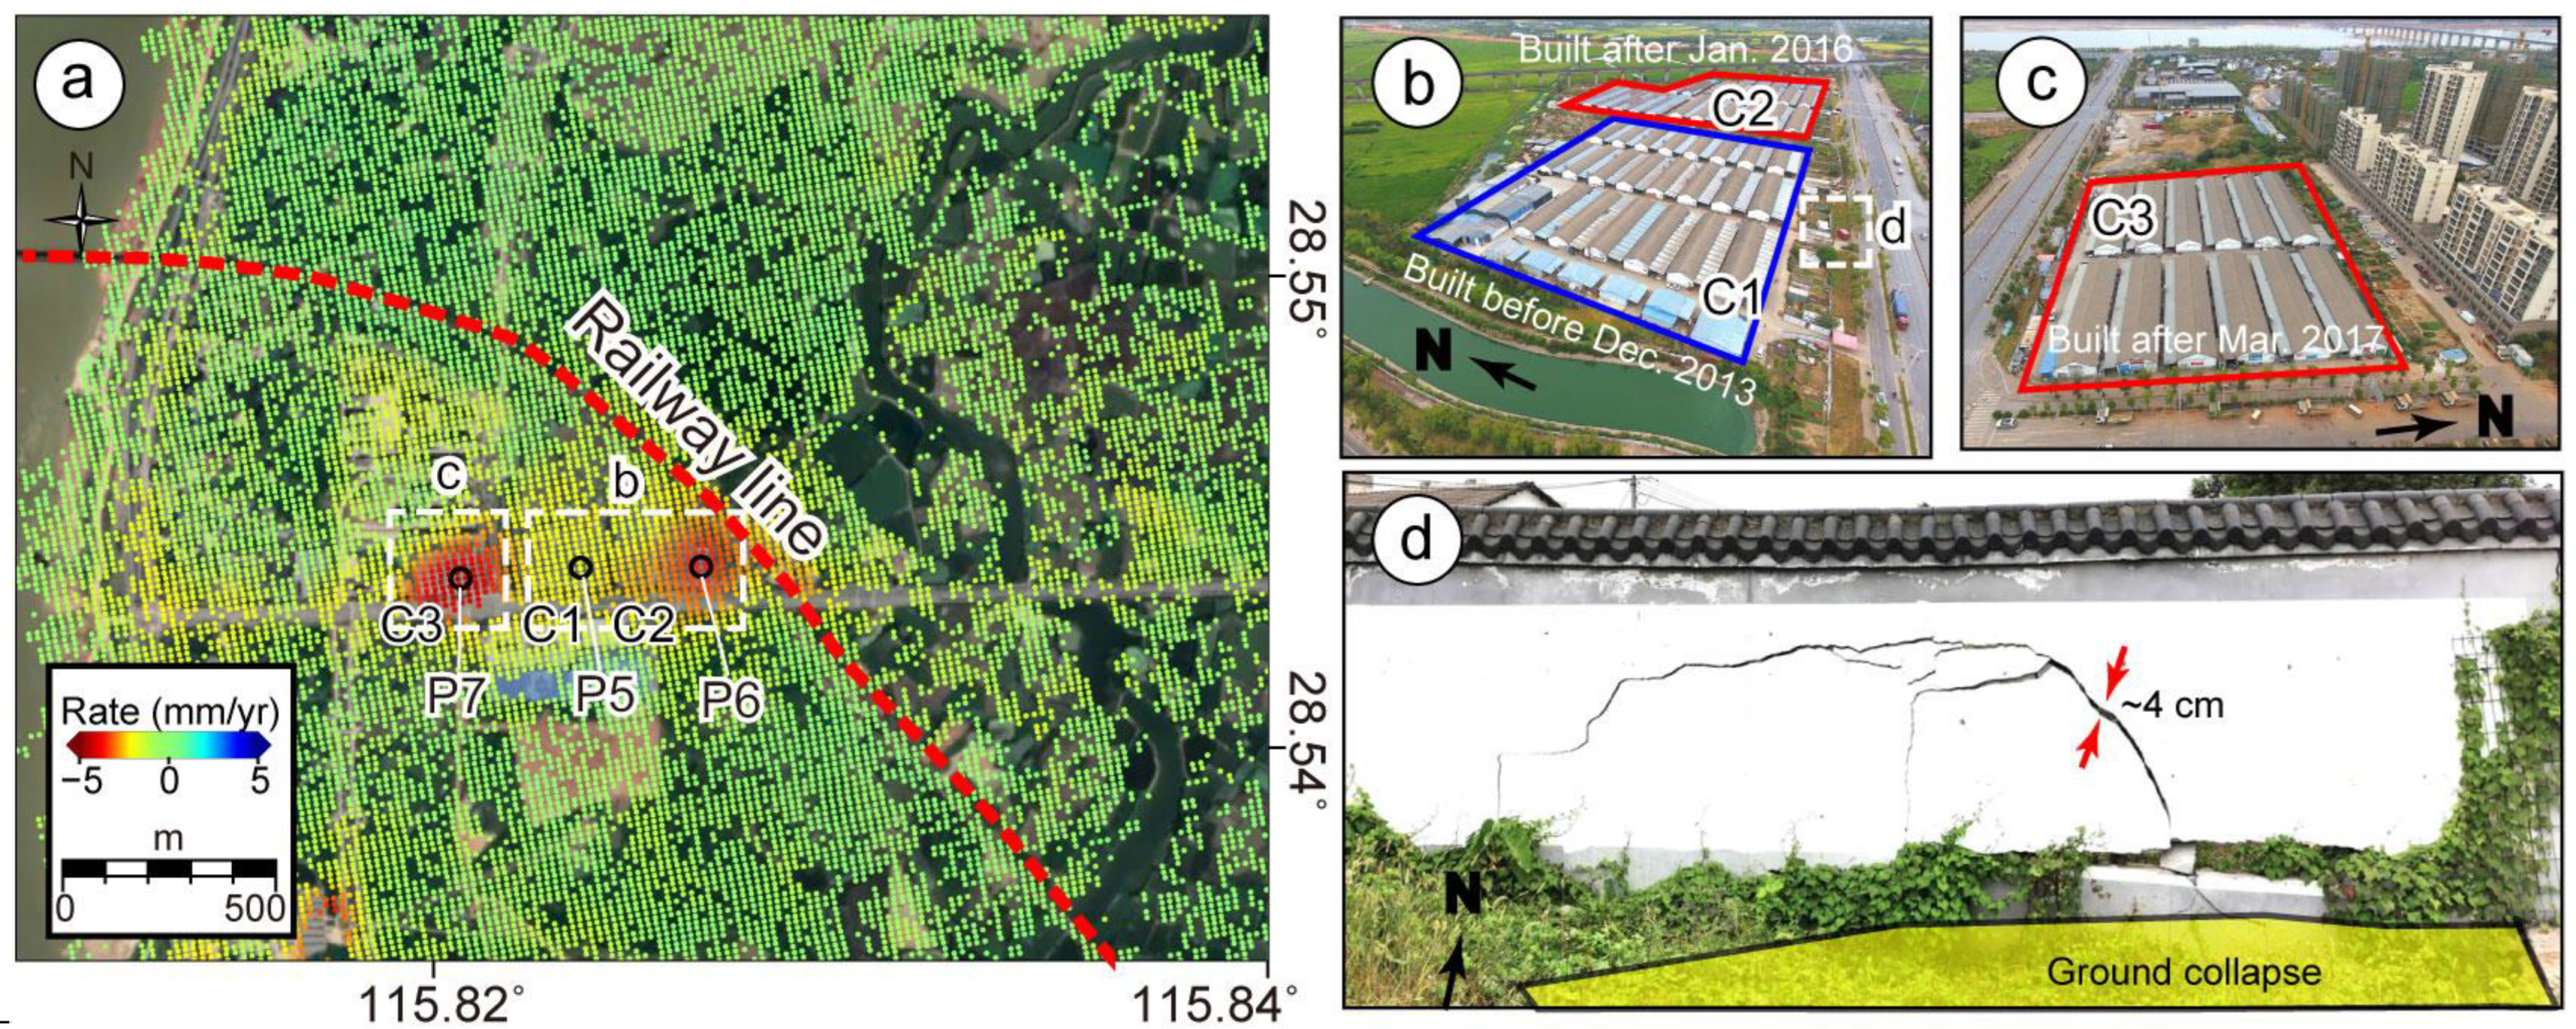
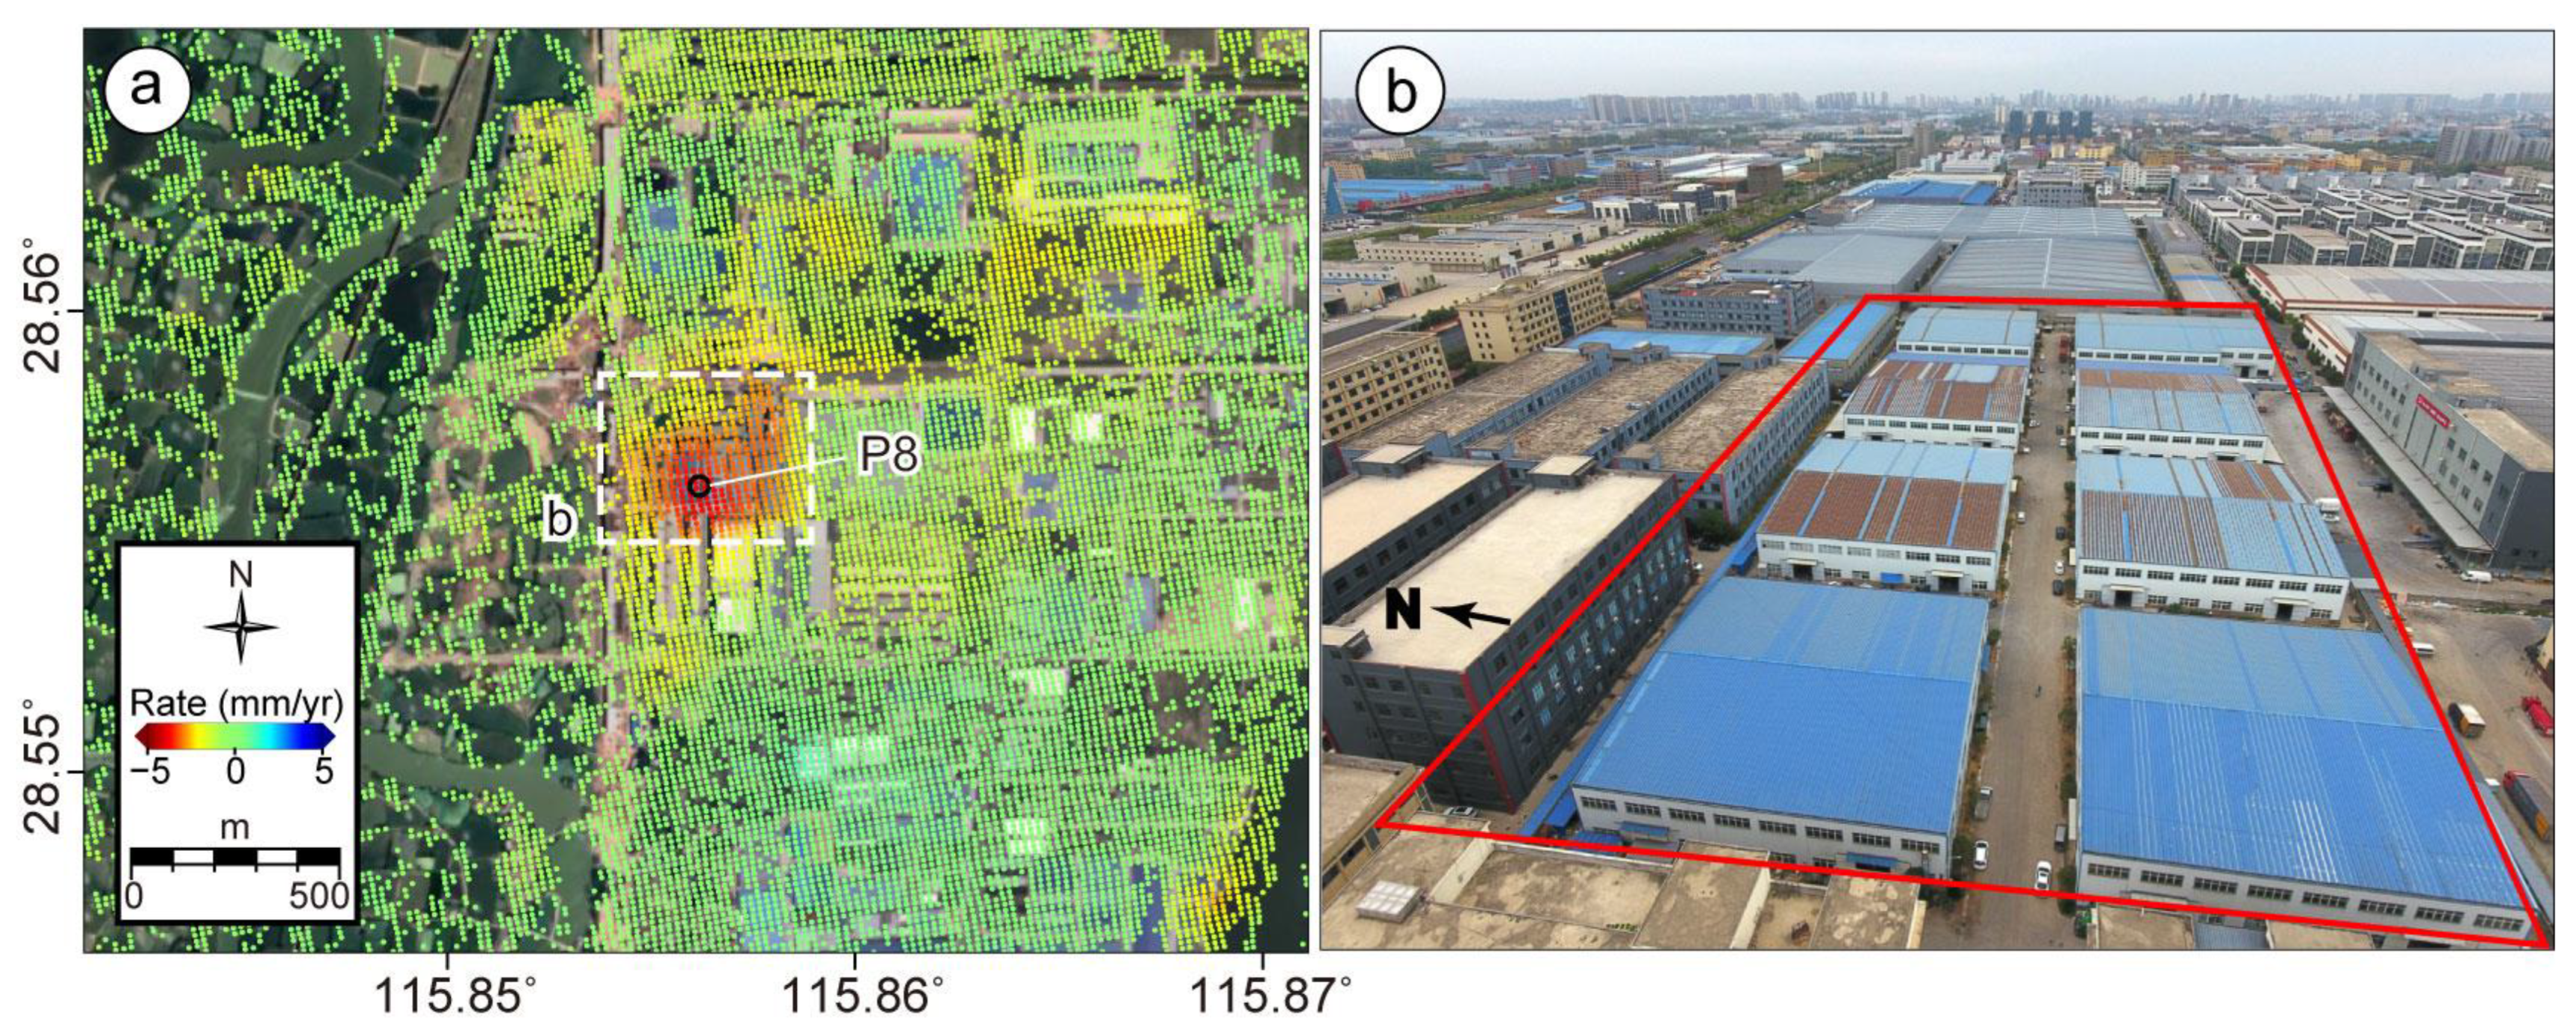
4.2.1. Subsidence of Building
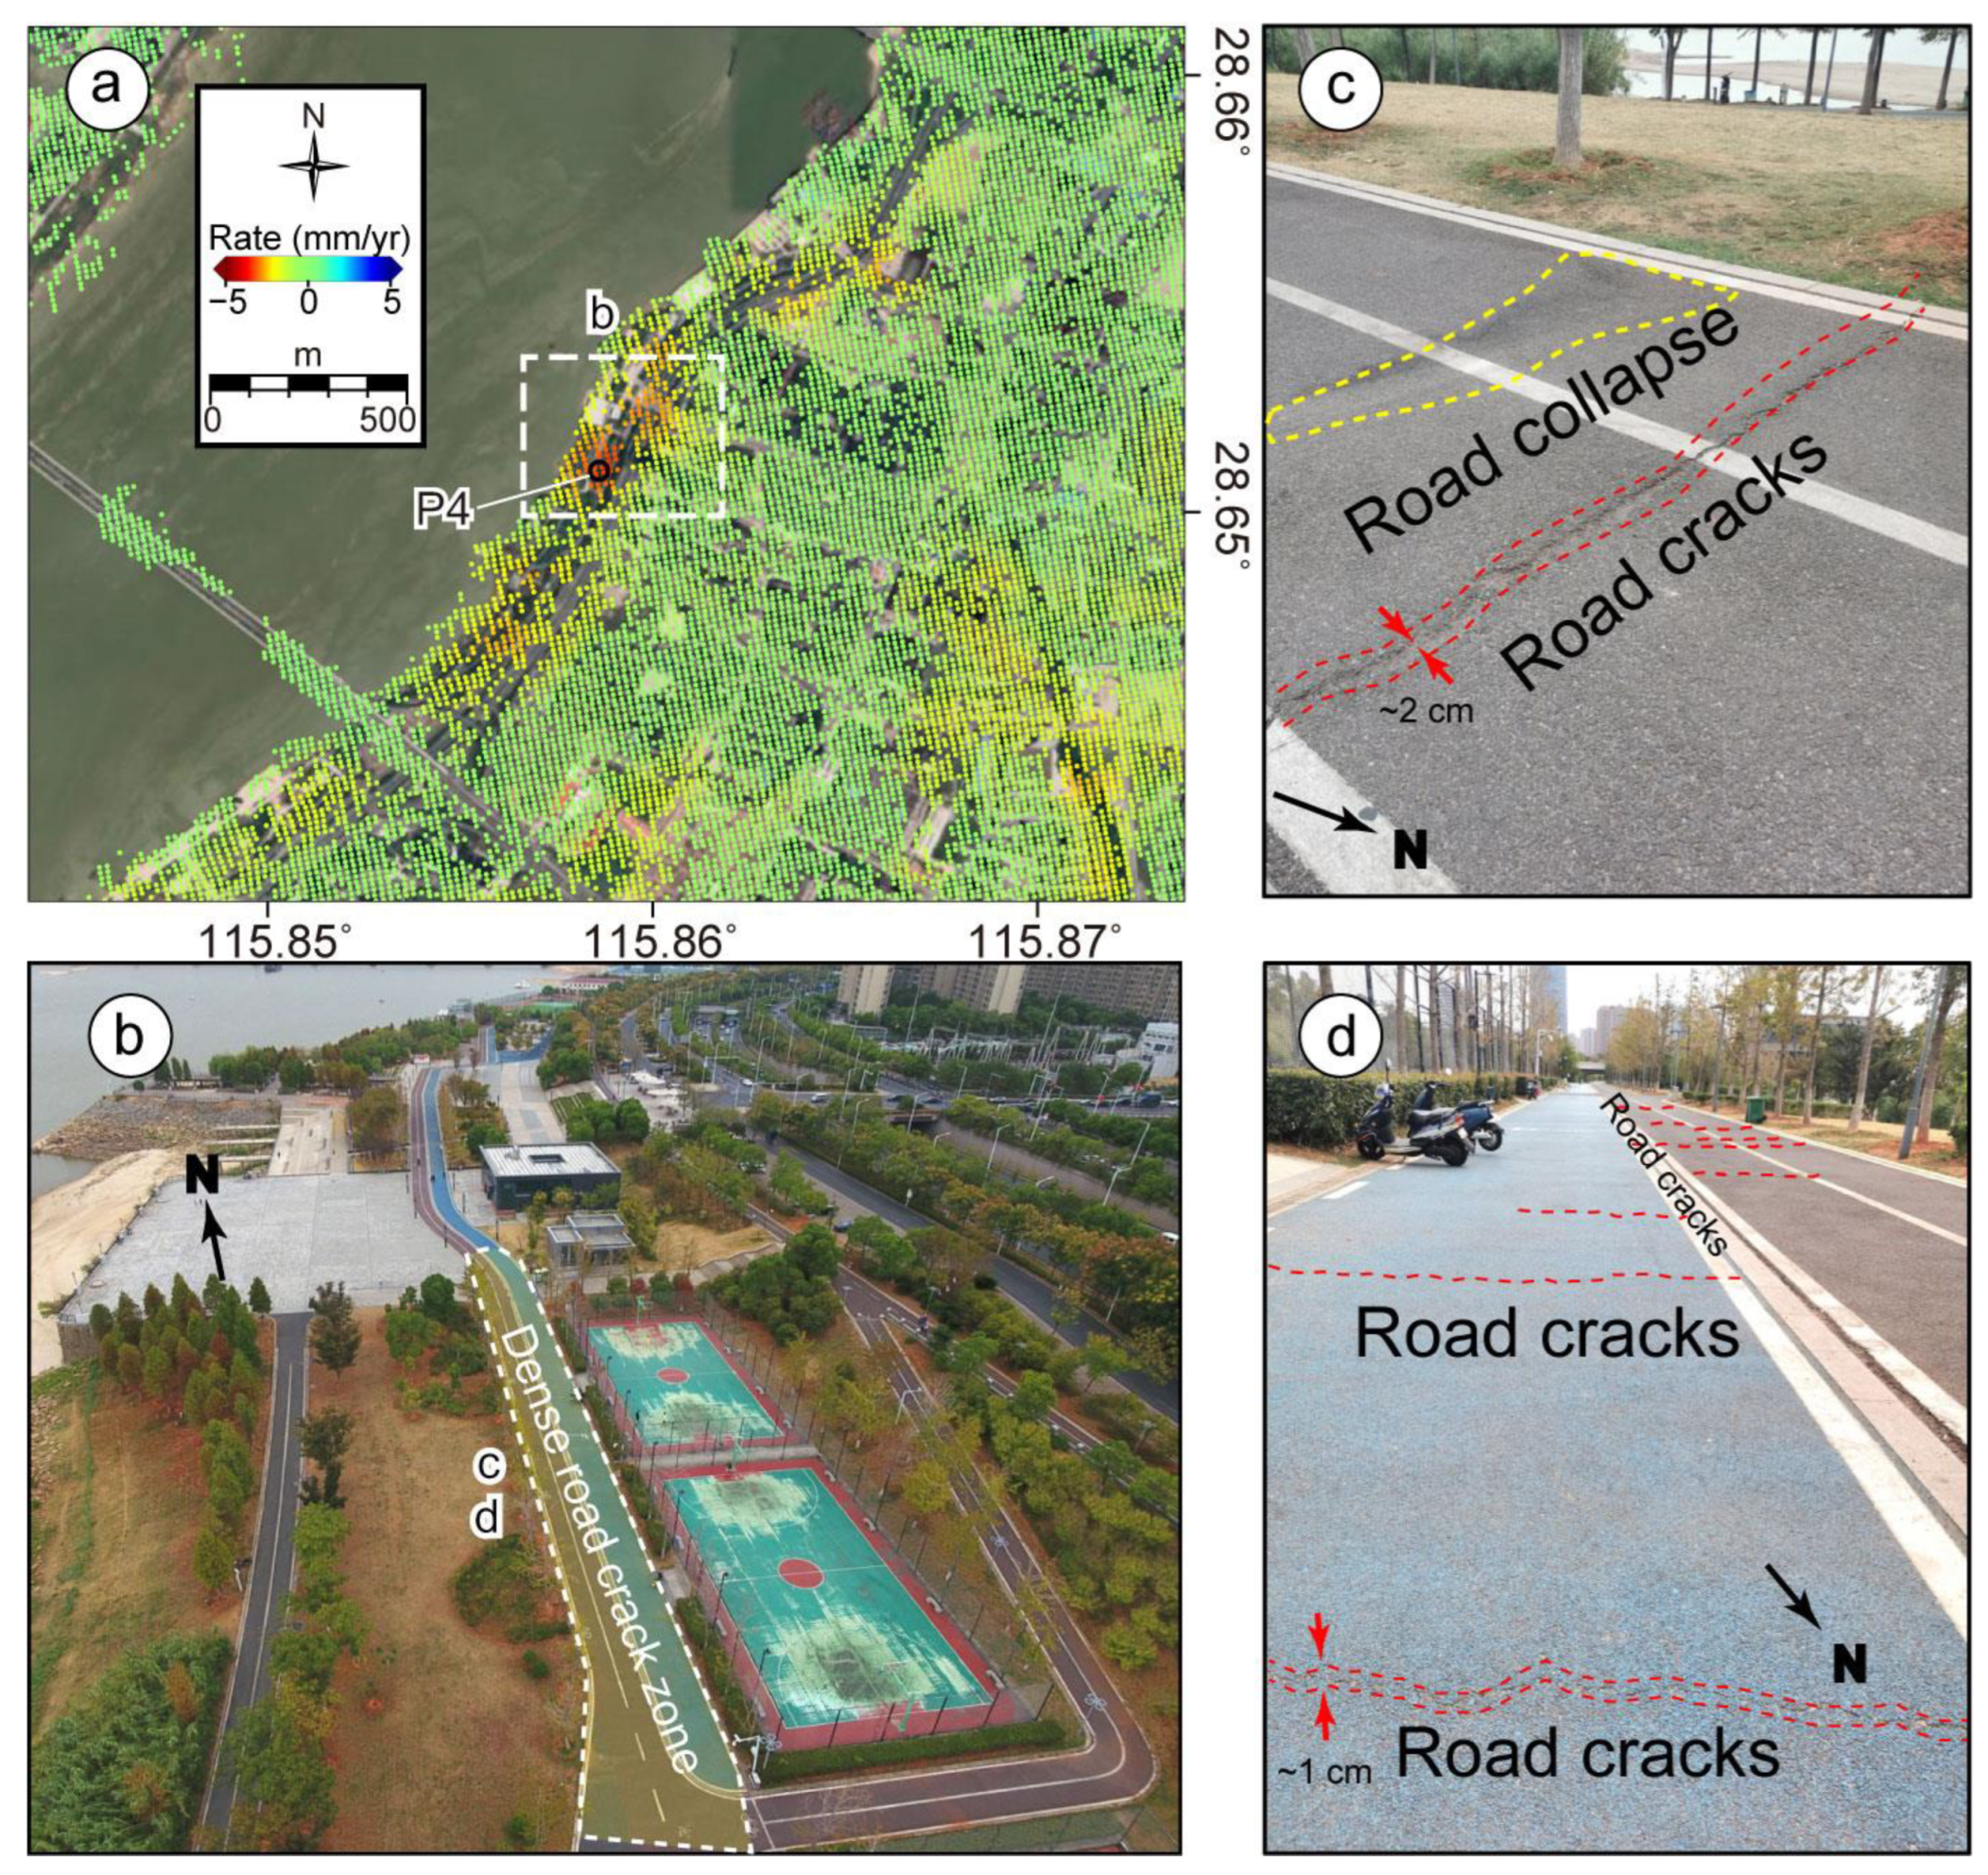
4.2.2. Subsidence of Bare Land
4.2.3. Subsidence Related to Subway Line
4.2.4. Impact of Errors
4.3. The Difference between our Results and the Existing Results
4.3.1. Time and Space Coverage
4.3.2. Stability and Accuracy of the Results
4.3.3. Observed Subsidence Area
5. Conclusions
Author Contributions
Funding
Data Availability Statement
Acknowledgments
Conflicts of Interest
References
- Liao, M.S.; Wang, T. Time Series InSAR Technology and Application; Science Press: Beijing, China, 2014. [Google Scholar]
- Raspini, F.; Caleca, F.; Del Soldato, M.; Festa, D.; Confuorto, P.; Bianchini, S. Review of satellite radar interferometry for subsidence analysis. Earth-Sci. Rev. 2022, 235, 104239. [Google Scholar] [CrossRef]
- Lu, Z.; Danskin, W.R. InSAR analysis of natural recharge to define structure of a ground-water basin, San Bernardino, California. Geophys. Res. Lett. 2001, 28, 2661–2664. [Google Scholar] [CrossRef]
- Tong, X.; Sandwell, D.T.; Smith-Konter, B. High-resolution interseismic velocity data along the San Andreas Fault from GPS and InSAR. J. Geophys. Res. Solid Earth 2013, 118, 369–389. [Google Scholar] [CrossRef]
- Perissin, D.; Wang, Z.; Lin, H. Shanghai subway tunnels and highways monitoring through Cosmo-SkyMed persistent scatterers. ISPRS J. Photogramm. Remote Sens. 2012, 73, 58–67. [Google Scholar] [CrossRef]
- Chaussard, E.; Amelung, F.; Abidin, H.; Hong, S.H. Sinking cities in Indonesia: ALOS PALSAR detects rapid subsidence due to groundwater and gas extraction. Remote Sens. Environ. 2013, 128, 150–161. [Google Scholar] [CrossRef]
- Chaussard, E.; Wdowinski, S.; Cabral-Cano, E.; Amelung, F. Land subsidence in central Mexico detected by ALOS InSAR time-series. Remote Sens. Environ. 2014, 140, 94–106. [Google Scholar] [CrossRef]
- Yang, C.S.; Zhang, Q.; Zhao, C.Y.; Wang, Q.L.; Ji, L.Y. Monitoring land subsidence and fault deformation using the small baseline subset InSAR technique: A case study in the Datong Basin, China. J. Geodyn. 2014, 75, 34–40. [Google Scholar] [CrossRef]
- Xu, B.; Feng, G.C.; Li, Z.W.; Wang, Q.J.; Wang, C.C.; Xie, R.G. Coastal subsidence monitoring associated with land reclamation using the point target based SBAS-InSAR method: A case study of Shenzhen, China. Remote Sens. 2016, 8, 652. [Google Scholar] [CrossRef]
- Guzy, A.; Malinowska, A.A. State of the art and recent advancements in the modelling of land subsidence induced by groundwater withdrawal. Water 2020, 12, 2051. [Google Scholar] [CrossRef]
- Yang, Z.F.; Li, Z.W.; Zhu, J.J.; Wang, Y.D.; Wu, L.X. Use of SAR/InSAR in mining deformation monitoring, parameter inversion, and forward predictions: A review. IEEE Geosci. Remote Sens. Mag. 2020, 8, 71–90. [Google Scholar] [CrossRef]
- Hooper, A.; Bekaert, D.; Spaans, K.; Arıkan, M. Recent advances in SAR interferometry time series analysis for measuring crustal deformation. Tectonophysics 2012, 514, 1–13. [Google Scholar] [CrossRef]
- Biggs, J.; Wright, T.J. How satellite InSAR has grown from opportunistic science to routine monitoring over the last decade. Nat. Commun. 2020, 11, 3863. [Google Scholar] [CrossRef] [PubMed]
- Osmanoğlu, B.; Sunar, F.; Wdowinski, S.; Cabral-Cano, E. Time series analysis of InSAR data: Methods and trends. ISPRS J. Photogramm. Remote Sens. 2016, 115, 90–102. [Google Scholar] [CrossRef]
- Ferretti, A.; Prati, C.; Rocca, F. Nonlinear subsidence rate estimation using permanent scatterers in differential SAR interferometry. IEEE Trans. Geosci. Remote Sens. 2000, 38, 2202–2212. [Google Scholar] [CrossRef]
- Berardino, P.; Fornaro, G.; Lanari, R.; Sansosti, E. A new algorithm for surface deformation monitoring based on small baseline differential SAR interferograms. IEEE Trans. Geosci. Remote Sens. 2002, 40, 2375–2383. [Google Scholar] [CrossRef]
- Zhang, Y.J.; Heresh, F.; Falk, A. Small baseline InSAR time series analysis: Unwrapping error correction and noise reduction. Comput. Geosci. 2019, 133, 104331. [Google Scholar] [CrossRef]
- Mo, Y. Land subsidence monitoring and risk assessment based on time series InSAR technology in Nanchang City. Master′s Thesis, East China University of Technology, Nanchang, China, 2020. (In Chinese). Available online: http://www.cnki.net/ (accessed on 1 March 2023).
- Xiong, J.C.; Xiao, R.Y.; He, X.F. Land surface deformation in Nanchang, China 2018–2020 revealed by multi-temporal InSAR. Nat. Hazard. Res. 2021, 1, 187–195. [Google Scholar] [CrossRef]
- Hu, B.; Chen, B.X.; Na, J.; Yao, J.Q.; Zhang, Z.M.; Du, X.F. Urban surface deformation management: Assessing dangerous subsidence areas through regional surface deformation, natural factors, and human activities. Sustainability 2022, 14, 10487. [Google Scholar] [CrossRef]
- Li, S.W.; Xu, W.B.; Li, Z.W. Review of the SBAS InSAR time-series algorithms, applications, and challenges. Geod. Geodyn. 2022, 12, 114–126. [Google Scholar] [CrossRef]
- Gao, H.; Liao, M.S.; Liang, X.; Feng, G.C.; Wang, G.H. Coseismic and Postseismic fault kinematics of the July 22, 2020, Nima (Tibet) Ms6. 6 earthquake: Implications of the forming mechanism of the active N-S-trending grabens in Qiangtang, Tibet. Tectonics 2022, 41, e2021TC006949. [Google Scholar] [CrossRef]
- Ou, Q.; Daout, S.; Weiss, J.R.; Shen, L.; Lazecký, M.; Wright, T.J.; Parsons, B.E. Large-scale interseismic strain mapping of the NE Tibetan Plateau from Sentinel-1 interferometry. J. Geophys. Res. Solid Earth 2022, 127, e2022JB024176. [Google Scholar] [CrossRef]
- Goldstein, R.M.; Werner, C.L. Radar interferogram filtering for geophysical applications. Geophys. Res. Lett. 1998, 25, 4035–4038. [Google Scholar] [CrossRef]
- Costantini, M. A novel phase unwrapping method based on network programming. IEEE Trans. Geosci. Remote Sens. 1998, 36, 813–821. [Google Scholar] [CrossRef]
- Wegmuller, U.; Werner, C. Retrieval of vegetation parameters with SAR interferometry. IEEE Trans. Geosci. Remote Sens. 1997, 35, 18–24. [Google Scholar] [CrossRef]
- Institute of Geology, China Seismological Bureau. China Seismic Fault Information System. (In Chinese). Available online: https://data.activetectonics.cn/arcportal/apps/webappviewer/index.html?id=684737e8849c4170bbca14447608c451 (accessed on 1 March 2023).
- Dong, S.; Samsonov, S.; Yin, H.; Ye, S.; Cao, Y. Time-series analysis of subsidence associated with rapid urbanization in Shanghai, China measured with SBAS InSAR method. Environ. Earth Sci. 2014, 72, 677–691. [Google Scholar] [CrossRef]
- Luo, H.; Wang, T.; Wei, S.; Liao, M.S.; Gong, J.Y. Deriving centimeter-level coseismic deformation and fault geometries of small-to-moderate earthquakes from time-series Sentinel-1 SAR images. Front. Earth Sci. 2021, 9, 636398. [Google Scholar] [CrossRef]
- U.S. Geological Survey. Earthquake Lists, Maps, and Statistics. Available online: https://earthquake.usgs.gov/earthquakes/search/ (accessed on 1 March 2023).
- Zou, Y.Q.; Lan, Y.Y.; Zhou, W.B.; Zhong, M.S. Numerical simulations of groundwater systems in Nanchang city. J. Nanchang Univ. (Nat. Sci.) 2012, 36, 507–510. [Google Scholar]
- He, Y.; Chen, Y.; Wang, W.; Yan, H.; Zhang, L.; Liu, T. TS-InSAR analysis for monitoring ground deformation in Lanzhou New District, the loess Plateau of China, from 2017 to 2019. Adv. Space Res. 2021, 67, 1267–1283. [Google Scholar] [CrossRef]
- Zhou, L.; Guo, J.M.; Hu, J.Y.; Li, J.W.; Xu, Y.F.; Pan, Y.J.; Shi, M. Wuhan surface subsidence analysis in 2015–2016 based on Sentinel-1A data by SBAS-InSAR. Remote Sens. 2017, 9, 982. [Google Scholar] [CrossRef]
- Dal Zilio, L.; Hegyi, B.; Behr, W.; Gerya, T. Hydro-mechanical earthquake cycles in a poro-visco-elasto-plastic fluid-bearing fault structure. Tectonophysics 2022, 838, 229516. [Google Scholar] [CrossRef]
- Root, A.W. California Experience in construction of highways across Marsh Deposits. Highw. Res. Board Bull. 1958, 173, 46–64. Available online: http://onlinepubs.trb.org/Onlinepubs/hrbbulletin/173/173-003.pdf (accessed on 1 March 2023).


Disclaimer/Publisher’s Note: The statements, opinions and data contained in all publications are solely those of the individual author(s) and contributor(s) and not of MDPI and/or the editor(s). MDPI and/or the editor(s) disclaim responsibility for any injury to people or property resulting from any ideas, methods, instructions or products referred to in the content. |
© 2023 by the authors. Licensee MDPI, Basel, Switzerland. This article is an open access article distributed under the terms and conditions of the Creative Commons Attribution (CC BY) license (https://creativecommons.org/licenses/by/4.0/).
Share and Cite
Gao, H.; Xiong, L.; Chen, J.; Lin, H.; Feng, G. Surface Subsidence of Nanchang, China 2015–2021 Retrieved via Multi-Temporal InSAR Based on Long- and Short-Time Baseline Net. Remote Sens. 2023, 15, 3253. https://doi.org/10.3390/rs15133253
Gao H, Xiong L, Chen J, Lin H, Feng G. Surface Subsidence of Nanchang, China 2015–2021 Retrieved via Multi-Temporal InSAR Based on Long- and Short-Time Baseline Net. Remote Sensing. 2023; 15(13):3253. https://doi.org/10.3390/rs15133253
Chicago/Turabian StyleGao, Hua, Luyun Xiong, Jiehong Chen, Hui Lin, and Guangcai Feng. 2023. "Surface Subsidence of Nanchang, China 2015–2021 Retrieved via Multi-Temporal InSAR Based on Long- and Short-Time Baseline Net" Remote Sensing 15, no. 13: 3253. https://doi.org/10.3390/rs15133253
APA StyleGao, H., Xiong, L., Chen, J., Lin, H., & Feng, G. (2023). Surface Subsidence of Nanchang, China 2015–2021 Retrieved via Multi-Temporal InSAR Based on Long- and Short-Time Baseline Net. Remote Sensing, 15(13), 3253. https://doi.org/10.3390/rs15133253