Abstract
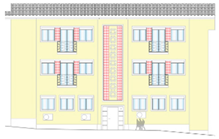
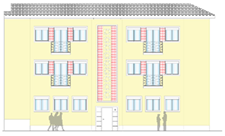
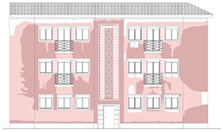
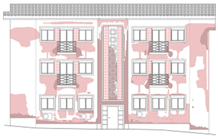
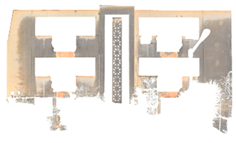
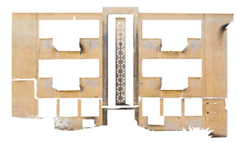
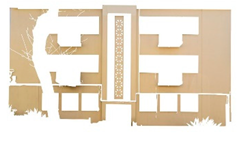
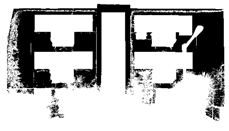
The new Construction 4.0 paradigm takes advantage of existing technologies. In this scope, the development and application of image-based methods for evaluating and monitoring the state of conservation of buildings has shown significant growth, including support for maintenance plans. Recently, powerful algorithms have been applied to automatically evaluate the state of conservation of buildings using deep learning frameworks, which are utilised as a black-box approach. The large amount of data required for training, the difficulty in generalising, and the lack of parameters to assess the quality of the results often make it difficult for non-experts to evaluate them. For several applications and scenarios, simple and more intuitive image-based approaches can be applied to support building inspections. This paper presents the StainView, which is a fast and reliable method. The method is based on the classification of the mosaic image, computed from a systematic acquisition, and allows one to (i) map stains in facades; (ii) locate critical areas; (iii) identify materials; (iv) characterise colours; and (v) produce detailed and comprehensive maps of results. The method was validated in three identical buildings in Bairro de Alvalade, in Lisbon, Portugal, that present different levels of degradation. The comparison with visual inspection demonstrates that StainView enables the automatic location and mapping of critical areas with high efficiency, proving to be a useful tool for building inspection: differences were of approximately 5% for the facade with the worst and average state of conservation, however, the values deteriorate for the facade under good conditions, reaching the double of percentage. In terms of processing speed, StainView allows a facade mapping that is 8–12 times faster, and this difference tends to grow with the number of evaluated façades.
1. Introduction
The construction sector is undergoing a paradigm shift in the scope of the emerging Construction 4.0 revolution. This implies strengthening collaborations between different areas of knowledge, as well as increasing the scope of their applications. Such collaborations have been taking advantage of image-based methods to improve the inspection of buildings, showing excellent reactions from research communities and inspection teams in the field. The evaluation and monitoring of the state of conservation of buildings has shown significant growth not only in the field of preserving vestiges of architectural heritage but also monitor and maintain contemporary constructions and structures [1,2]. This is entirely in line with the new Construction 4.0 paradigm, which can benefit the areas of intelligent design, construction, and maintenance. The ongoing transformation is also based on the integration of intelligent algorithms, computer vision, and robotic systems, among other technologies [3,4]. The development of digital imaging and hardware systems enables innovative computer vision solutions, which are useful for supporting the inspection of buildings facades. These portable and non-invasive approaches, based on hardware (digital cameras and computers) and algorithms for computer vision, are being used and replacing traditional methods. Solutions based on the analysis of multi-spectral images, including information from outside of the visible electromagnetic spectrum such as near-infrared (NIR), were developed for the mapping of materials and anomalies [5]. The latest improvements also comprise hyperspectral image analysis or image clustering leveraged by HSV (hue, saturation, and value) colour space to detect biological colonisation, which may also be used for colour characterisation and variation assessment on the surfaces [6,7,8].
Lately, the accessibility of powerful machine learning and deep learning frameworks promotes their application in building inspection [9,10]. The problems of such image-based approaches are related with the models training, mainly in the case of complex backgrounds. The presence of multiple and combined materials and anomalies are difficult to model, since these are too broad to be included in datasets, e.g., the presence of moisture stains, efflorescence, biological colonisation, detachment, among other usual anomalies on building facades. The automatic classification of facades is also influenced by natural and dynamic light conditions. In addition, all external elements and equipment, such as air conditioning devices and other facilities or trees, leads to a more complex image classification and requires a comprehensive analysis. Deep learning applications, which mostly work as black-box, also require large and labelled datasets for training and validation, restraining their application to datasets within the training samples’ characteristics, i.e., these are often difficult to generalize to unseen complex backgrounds and cannot extend the limits of validation beyond the training dataset [11]. The widespread use of commercial robotic platforms, such as unmanned aerial vehicles (UAVs), fosters new approaches to data collection [12]. Nevertheless, the automation of data acquisition and processing is still under development, with the aim of becoming a user-friendly tool for building inspection. At present, all the technology referred to herein are usually difficult to use by non-experts in computer vision. In that sense, the development of image-based solutions that are simple to apply and accessible represents a significant contribution to the construction sector, and a gateway to generalising their use in practice.
A fast, accessible, and reliable method for mapping stains in facades is presented herein. This method, called StainView, is based on the classification of images obtained from a systematic acquisition procedure to detect and map pathologies on building facades, by: (i) mapping stains in facades; (ii) locating critical areas with a high probability of containing damages; (iii) detecting and separating materials; (iv) characterising colours; and (v) producing a detailed and comprehensive maps of results. The StainView can support the inspection or be used as a complement or even a substitute method to reach a digital map of stains. Regarding other image-based solutions, StainView is a minimalist approach that mimics the visual inspection based on the perception of colour differences, dispensing complex algorithms with a high computational cost. Thus, it results in a user-friendly and easily understandable procedure for non-experts in computer vision, such as inspectors who perform the visual inspections of buildings.
The proposed method was validated onsite by applying it to three identical buildings in the Bairro de Alvalade, in Lisbon, Portugal. The facades of the three buildings present different degradation levels. The results were confronted with traditional visual inspections and reveal that StainView enables the automatic location and mapping of anomalies with high efficiency allowing one to conduct a reliable evaluation; reduce the inspection time, and decrease the possibility of human error. On the other hand, the pixel-wise classification performed derives from a reference area selected by the user and, in the current version, does not allow one to classify and relate the stains to different levels of damage.
2. Method StainView
The StainView takes advantage of classifying images, at the pixel level, based on the HSV (hue, saturation, and value) and CIELab colour spaces. In the first case for colour characterisation and, in the second case, to perform a detailed evaluation of colour differences (hereinafter ΔE). In addition, a structured image survey is carried out for the automatic generation of high-resolution image mosaics of the facades. The main steps of the proposed method are shown in (Figure 1):
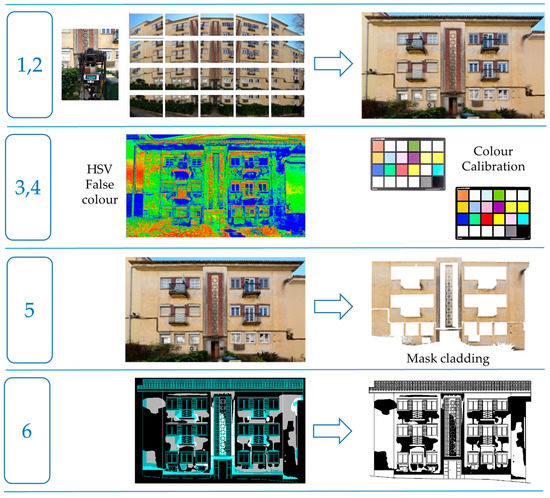
Figure 1.
Main steps of the method StainView.
- Image acquisition
The automatic image acquisition of facades is performed with an high-resolution camera mounted on a robotic platforms to capture a structured dataset in a pre-defined order, e.g., top–bottom, and left–right. The images are acquired with off-the-shelf cameras on the visible light spectrum. The robotic platform may be terrestrial or aerial, for example using a pan-tilt robotic head or a unmanned aerial vehicles (UAV) to enable automatic surveying. A colour calibration board must be used if colour characterisation is a goal.
- 2.
- Built mosaic image
Generate mosaics from the structured dataset using specific software for these operations. The stitching software must be tunned to accept the structured dataset, with respect to the sequence of images set in the acquisition plan (step 1).
- 3.
- Image pre-processing
Convert the mosaic to HSV and CIELab colour systems [13]. This conversion is performed automatically, and it is necessary to save the mosaic in both colour systems for colour characterisation and colour difference measurement.
- 4.
- Colour characterisation
The colour is characterised in the HSV colour system after properly corrected with a colour calibration board. Firstly, the image is colour calibrated using a calibration chart. The software automatically detects the measured colours in the image. Then, a correlation matrix is calculated to minimise the differences between the measured colours and the known colours of the chart. This transformation is then applied to the entire image to analyse. The colour measurement is performed on the corrected image within a user-selected area.
- 5.
- Mask cladding
Produce a mask to remove the non-cladding areas based on a threshold. This value is set by the user based on the live visualisation of the image. The user should select a region of interest (ROI) that encompasses the multiple materials of the facade, in addition to cladding, to ensure a more accurate adjustment.
- 6.
- Mapping stains
Process the mosaic and build maps of the stains over the image of the facade. The images are processed using the three CIELab channels and the colour difference, ΔE, is computed. The user can define the ΔE value used as a threshold by the method. The ΔE values are discretised and analysed according to Standard EN 15886:2010 [14], which establishes the level of colour changes that are perceptible by the human eye.
For mapping and analysing the results, it is important to consider the reference values for ΔE. As a general guide, the values shown in Table 1 were considered [15]. Furthermore, the just noticeable differences (JNDs), i.e., the threshold from which the colour differences are perceptible by the human eye, are also taken into account, considering ΔE = 2.3 as the JND [8].

Table 1.
General guide for ΔE perception (adopted from [15]).
The method was evaluated by comparing the maps obtained with the maps resulting from the visual inspection, computing: (i) the percentage of stains, considered as critical and possible damage areas; and (ii) the Interception over Union (IoU), i.e., the degree of overlap between both maps computed according to Equation (1), as well as plotting those differences (Figure 2).
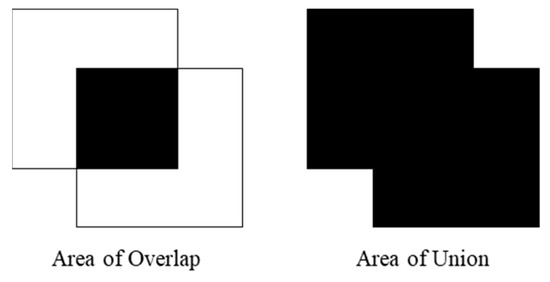
Figure 2.
Interception over Union (IoU).
3. The Case of Bairro de Alvalade in Lisbon, Portugal
3.1. Scope and Location
The masterplan for the Alvalade neighbourhood was elaborated in the 1940s by the architect Faria da Costa and was developed as part of the urban expansion policies of the city of Lisbon and the promotion of new housing areas [16]. The Alvalade neighbourhood was designed to cover a vast area of approximately 250 hectares, intended to house 45,000 inhabitants, taking the coexistence of different social categories as a structuring principle [17]. To significantly increase the amount of social housing, the previous model of single-family housing was replaced by collective housing, with a maximum of four floors to avoid the placement of elevators, according to a left/right typology [17]. The proposed method was applied to the facades of three identical buildings built in 1948 in Alvalade, in the low-rent housing area named Bairro das Caixas. A large-scale construction program of economic income houses started between 1947 and 1956. The case studies belong to Cell I and were built in 1948. They are in João Lúcio St. (the front facades of buildings No. 4, No. 7, and No. 9), a dead-end street with a parking line for vehicles and abundant vegetation (i.e., trees and shrubs) that grows in the front gardens of each private property [17]. According to the Köppen–Geiger classification, Lisbon has a hot-summer Mediterranean climate. In the last 20 years (1998–2018), the mean annual and minimum–maximum mean temperatures were, respectively, 13.6 °C and 21.8 °C, the minimum relative humidity was 47.6%, maximum relative humidity was 85.4% and the average rainfall rate was 66.6 mm, according to the records of the meteorological station situated in Lat: 38°46′N; Lon:09°08W; Alt.:104 m, from Instituto Português do Mar e da Atmosfera (IPMA) [18]. The orientation of the street—east/west—favours the growth of vegetation, and all kinds of biological organisms, as evidenced by the high degree of soil moisture and indirect sunlight in the front gardens [19,20]. The front facades of properties No. 7 and No. 9 do not receive the direct incidence of solar radiation at any time due to their northward orientation (Figure 3).
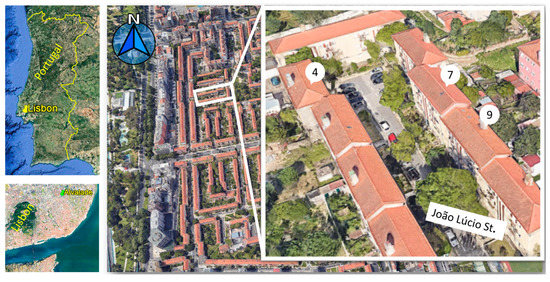
Figure 3.
General overview of the Alvalade neighbourhood at Lisbon, Portugal, and the locations of the three identical buildings (4, 7, and 9) (taken from Google Earth).
3.2. Area of Study and Anomalies
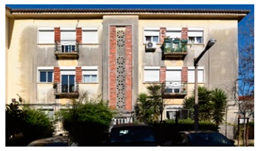
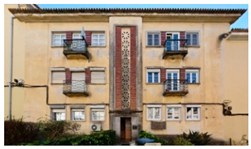
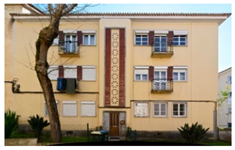
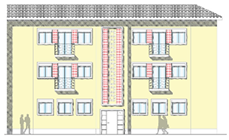
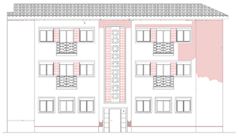
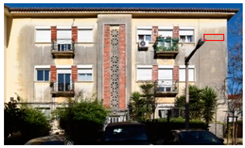
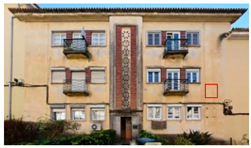
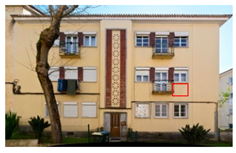
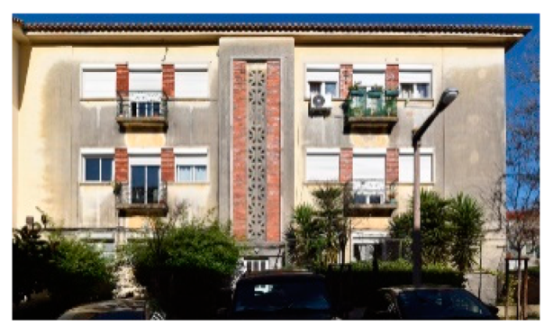
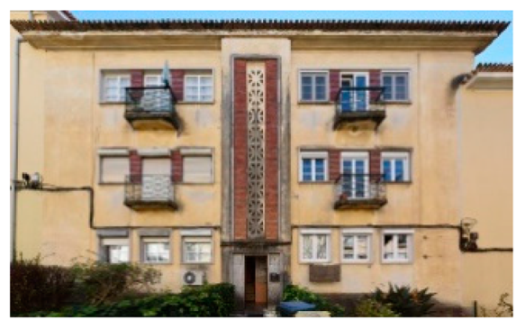
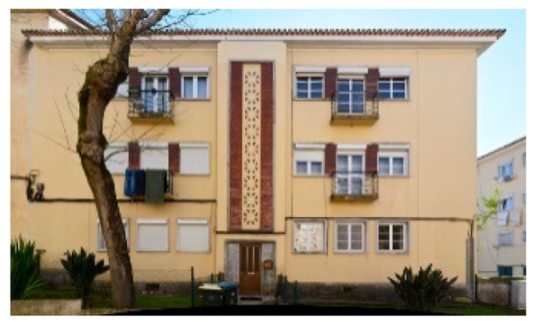
These case study facades present a main central entrance to six dwellings, a central core of vertical communication, fourteen windows, and four balconies with locksmith, a large cornice of ceramic tiles, wiring for electrical installations, and external air conditioning equipment fixed to the facade (Figure 4). The main materials used in the cladding of the facades are red brick glazed, a 50 cm high plinth made of cement mortar, and current renderings with yellow pigments (reference colour, according to measurements taken in situ). The construction of these buildings was based on modular coordination principles. As stated in the Regulamento Geral de Construção Urbana [21], all the dwellings had reinforced concrete slabs on the floors of the kitchens and bathrooms, while the rest were built with wooden beams and Portuguese floors. Additionally, the introduction of reinforced concrete beams on all floors on the facades is noteworthy.

Figure 4.
Three facades analysed in João Lúcio street in Bairro de Alvalade, Lisbon: (a) building No. 4; (b) building No. 7; and (c) building No. 9.
The three facades were built more than 50 years ago, and a progressive state of degradation is evidenced from worst to best, i.e., from Facade No. 4 to Facade No. 9, respectively, in Figure 4. Facade No. 4 presents the worst state of conservation, since it is the only one without a maintenance intervention. Despite its current appearance, this facade is the one that has been under better “in situ” preservation conditions thanks to the direct sunlight due to its southward orientation. On the contrary, Facade No. 9 (with a northward orientation) was recently renovated, presenting fewer anomalies, and it is considered the reference to be used for the comparison. The anomalies considered in this work were the stains—superficial dirt, runoff, raising damps, thermophoresis, biological growth, corrosion stains, and graffiti—mainly originating from the moisture and the relatively humid conditions in this area of the city. As shown in Figure 5, the cladding does not present the original colour in all facades, and lighter and darker areas can be found.
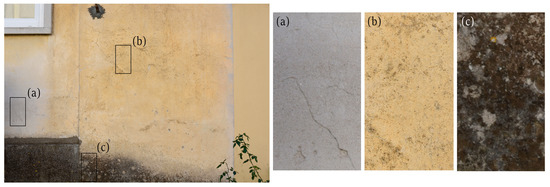
Figure 5.
Example of the state of degradation of the cladding on facade No. 7: location and zoomed area for (a) salts; (b) presence of superficial dirt; and (c) biological colonisation.
3.3. Built Mosaic Image
The automatic and structured image acquisition of the facades was carried out using a camera Nikon D810 equipped with a lens with a focal length of 50 mm, allowing to acquire images of 7369 × 4912 pixels. The camera was mounted on a GigaPan robotic head for structured acquisition. This set-up allowed to capture a set of images of a selected scene with a pre-define path to build high-resolution mosaics of the facades (Figure 6). The ortho-mosaic of each facade was built in post-processing procedures using the Image Composition Editor version X from Microsoft Research [22].
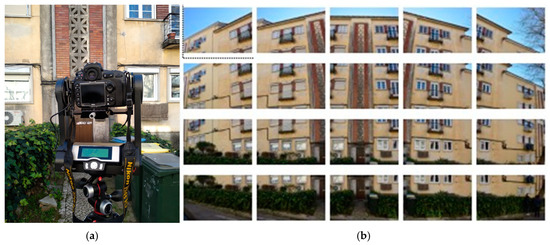
Figure 6.
Image acquisition: (a) set-up; and (b) mosaic of images acquired.
3.4. Colour Evaluation
The chromatic characterisation of each facade can be also computed by applying image processing techniques. This allows a larger and continuous evaluation due to the high discretisation achieved at the pixel level, on the contrary to the single point and discreet characterisation computed with traditional instruments such as the colorimeter. A classic ColorChecker board was used and placed in the field of view (FOV) for colour calibration, (Figure 7a). The images are processed to set values in the three HSV and CIELab channels [13,23]. In the case of HSV, the colour is characterised based on three parameters, namely hue (H), saturation (S), and value (V) or brightness: (i) ‘H’ indicates the pure colour, excluding white or black and with maximum saturation and brightness. Thus, this enables us to distinguish pure colours for values between 0° and 360°, for example, 0° or 360° represents red, 60° represents yellow, 120° represents green, and 240° represents blue; (ii) ‘S’ represents colour purity, ranging from 0%, which signifies the absence of colour to 100%, which signifies the full colour saturation; and (iii) ‘V’ ranges between dark and light, with 0% standing for black and 100% for white (Figure 7b). Briefly, the HSV colour space is quantified by an angle, and variations of shades and tones for each colour are reached by adjusting the brightness and/or saturation [8,24]. In the CIELAB (Lab), L* expresses the brightness in a white–black axis, and a and b are the parameters of chromaticity that represent variation between the four unique colours of human vision, where a represents the green–red trend and b represents the blue–yellow trend (Figure 7b). Furthermore, the CIELab space is also used to measure colour differences (ΔE), and several classifications were defined to evaluate these differences, namely, whether the values are perceptible to the human eye [8]. All algortithms were implementd in Matlab [25].
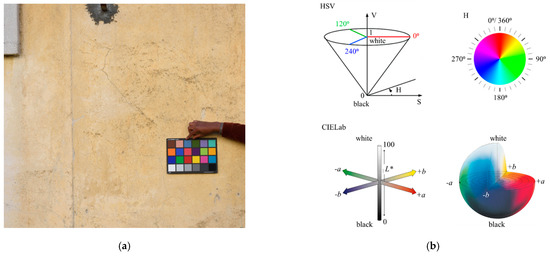
Figure 7.
Colour characterisation: (a) ColorChecker; and (b) HSV and CIELab colour system.
3.5. Mapping Stains
The automatic mapping of stains intends to mimic the visual inspection produced by the technicians, mainly based on the analysis of the colour differences of the facades. A threshold was establish for the colour differences (ΔE) value, below which the differences are not perceptible by the human eye [14,15]. The European standard [14] describes a test method for measuring the surface colour of porous inorganic materials, such as natural stones or synthetic materials, like mortar, plaster, brick, among others.
The total colour difference ΔE between two measurements (L1, a1, b1 and L2, a2, b2) is the Euclidian distance between their positions in the CIELab colour space. It is calculated by applying Equation (2):
where ΔL = L2 − L1 corresponds to the difference in clarity; Δa = a2 − a1 corresponds to the red/green difference; and Δb = b2 − b1 corresponds to the yellow/blue difference.
Thus, if the value is greater than five (ΔE > 5), the colour variation is perceptible by the human eye. However, in many cases, a values of ten can be adopted, i.e., if the differences are less than ten (ΔE < 10), they are difficult to distinguish by the human eye [8,14,15].
4. Results and Discussion
4.1. Traditional Visual Inspection
The traditional visual inspection includes the definition and labelling of materials and pathologies, before compiling results from the on-site survey in a drawing software [26], aiming to identify and map all of the stains present in the facades. From the on-site observation, it became clear that there were dark and light stains. The visual inspection works as a reference to evaluate the quality of the maps automatically obtained based on the colour difference evaluations. A panorama for each of the three facades analysed was elaborated from the planimetric survey, as defined in Section 2, and the stains observed were drawn by an expert using a time-consuming approach with rough precision results (Table 2).

Table 2.
Planimetric survey and mapping of the stains by visual inspection.
4.2. Colour Evaluation
The first step towards proper colour characterisation is the colour calibration of the image. This is done using the classic ColorChecker positioned over the area to be measured. The colour calibration of the image is performed by a transformation computed from the twenty-four reference colours of ColorChecker. The colour reference areas are automatically detected and the colour difference ΔE is measured (Figure 8). Then, a transformation is computed to minimise the ΔE for all twenty four colours, and applied to the whole image, resulting in a true colour image. The colour can be measured and characterised in this true colour image for all colour space and at any selected area, as exemplified in Figure 9.
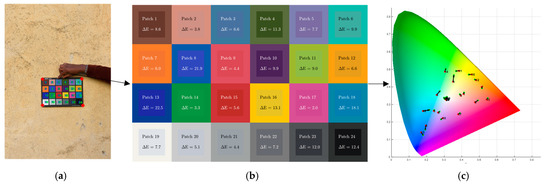
Figure 8.
Colour calibration: (a) ColorChecker detection; (b) colour correction matrix; and (c) colour correction directions.
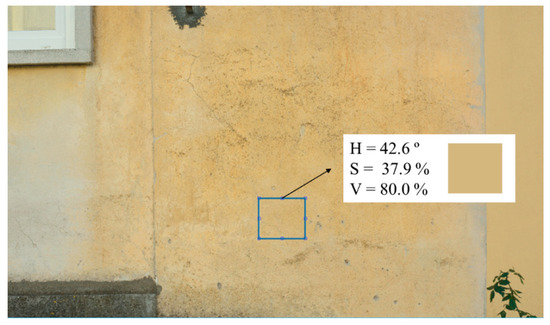
Figure 9.
Colour characterisation in HSV colour space.
4.3. Image Classification
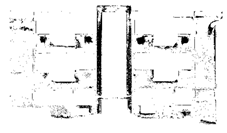
A previous general analysis was conducted using the H, S, and V channels for colour evaluation. The selection of the main yellow colour of the facade is performed using the H (hue) channel and, if useful, the user can also analyse the S and V channels. In this case, the yellow colour, which represents a good state of conservation, is related to the human perception, because the H channel values are just slightly affected by shadows and brightness, which in the HSV colour spaces are manifested in the two other channels. The analysis was performed manually and supervised by the user based on a visual analysis, allowing us to define a mask that removes external elements such as trees, cars, windows, or air-conditioning equipment, as exemplified in Figure 10. Table 3 presents the final masks generated for each of the three facades, which only saves the relevant pixels that represent the facade cladding.
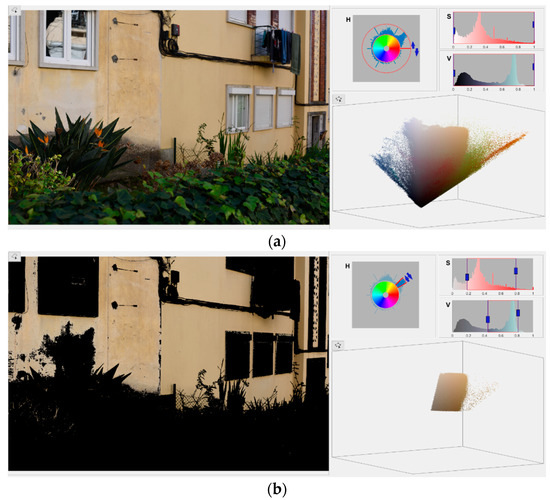
Figure 10.
Facade mask to remove the external elements (example of facade No. 4): (a) image for mask calibration; and (b) definition of mask threshold.

Table 3.
HSV analysis of the three facades by the user.
Table 4 presents the results based in ΔE, taking as reference a yellow colour computed in an area selected by the user, and marked with a red rectangle in the images of the facades in Table 3. Then, the maps for ΔE > 2.3, ΔE > 5, ΔE > 10, ΔE > 15, ΔE > 20, and ΔE > 30 were plotted to map the stains areas. The percentage of stains measured in each map was also added to Table 4.

Table 4.
Analysis of ΔE in the three case studies.
4.4. Analysis of Results
For comparison purposes, the visual inspection was filtered by the facade cladding mask (see Figure 2). Figure 11 shows the overlap of that mask (in blue) with the manual mapping performed. This way, the area analysed by both methods are exactly the same.

Figure 11.
Visual inspection map with the automatic mask in blue: (a) building No. 4; (b) building No. 7; and (c) building No. 9.
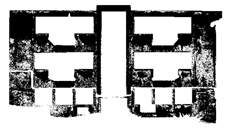
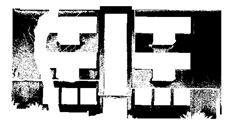
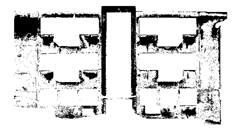
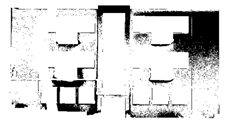
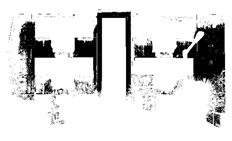
Different facts were revealed when comparing the manual drawing carried out in Section 4.1 with the image classification performed in Section 4.3. Figure 12 presents the comparison between the areas mapped with the stains from both approaches. The results show that regardless of the applied method, Facade No. 4 clearly presented the worst apparent state of conservation, since a large majority of the facade was classified with stains. The stains in this facade are well differentiated from the cladding reference yellow colour, and the maps computed for ΔE > 2.3 provide a huge area of stains (90.6%). For ΔE > 5, the value reduces to 76.6%. The visual inspection leads to a total area of stains of 81.1%, i.e., between the automatic maps for ΔE > 2.3 and ΔE > 5. On the opposite side, the results of facade No. 9 reveal an apparent best state of conservation. The areas computed for ΔE > 5 and ΔE > 10 are 35.3% and 4.4%, respectively, while the visual mapping reaches 18.4%. For facade No. 7, with an apparent state of conservation between the two other buildings’ facade, the automatic mapping for ΔE > 5 is 43.3%, which is identical to the values obtained for the visual mapping, which is 41.2%.

Figure 12.
Comparison between the results obtained by manual and automatic classification methods: (a) area of stains; (b) Interception over Union (IoU).
Briefly, the results indicate that, for the facade with the worst state of conservation (No. 4), the automatic mapping is close to the manual mapping for ΔE between 2.3 and 5; for facade No. 7, with an average state of conservation, the automatic and manual mapping is similar for ΔE > 5; and for the facade with the best state of conservation, No. 9, the manual mapping reaches an area of stains between the automatic mapping obtained for ΔE > 5 and ΔE > 10. These results are in line with the classification of Table 1, which mentions that the colour differences are perceptible at a glance for ΔE between 2 and 10. At a glance, and for a non-trained human eye, values lower that 10 are hardly noticeable. The automatic mapping for JND (ΔE > 2.3) is important to analyse the colour changes throughout close observation, something which is not usually performed in visual inspection, especially when there are no doubts about the condition.
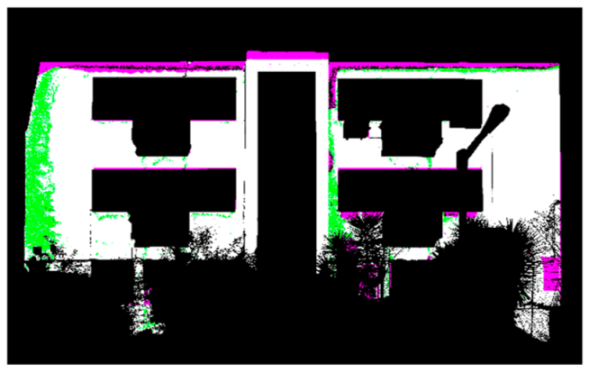
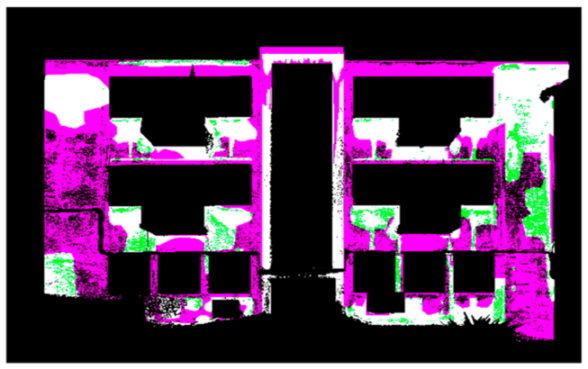
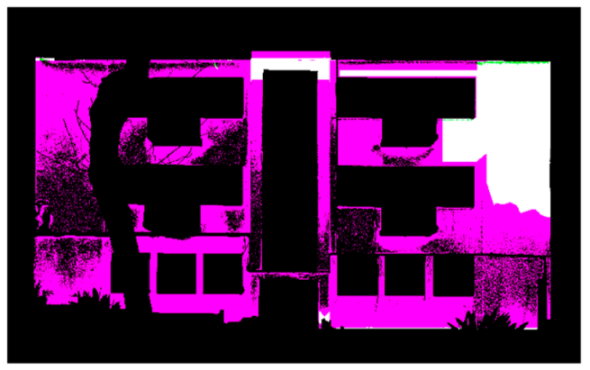
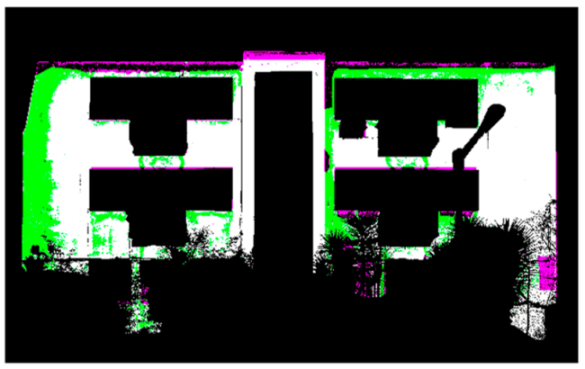
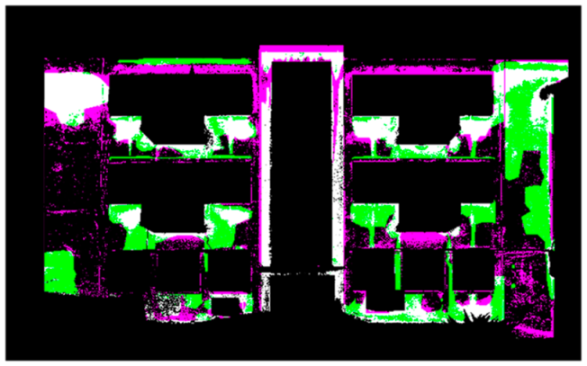
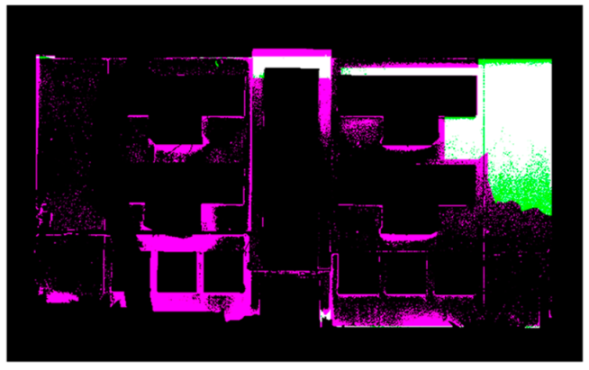
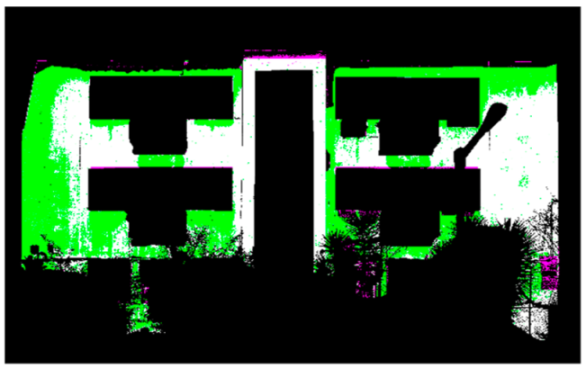
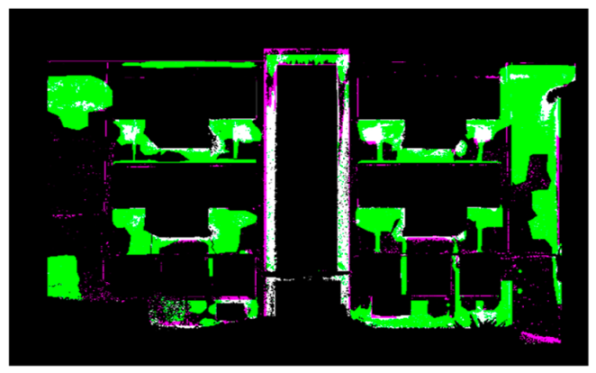
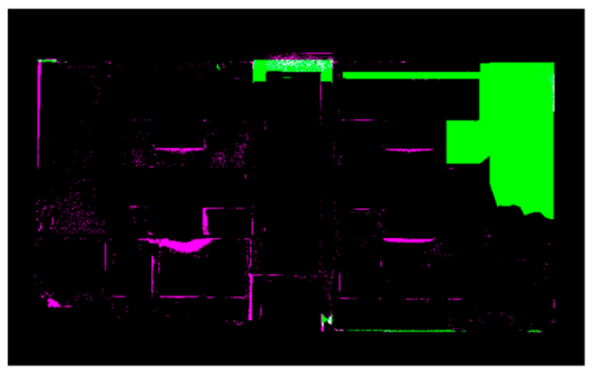
To a comprehensively analysis of the results, the IoU between the classification maps was computed, using the Jaccard Index, and the maps highlighting its differences were plotted (Table 5). The maps indicate the areas classified as stains for manual and automatic mapping (white areas), the areas classified as stains by manual mapping and as cladding by the StainView (in Green), as well as the areas classified as stains by the StainView and classified as cladding by the manual mapping. The results show that: (i) for facade No. 4, differences are concentrated in the edge of the analysed cladding area; (ii) for facade No. 7, despite the identical total area of stain measures, more than an half of this area does not match between the approaches; (iii) for facade No. 9, greater difficulty in the visual classification is revealed, given the good conditions preserving absence of stains. Furthermore, the user influence can also be noticed in the automatic mapping, since the area selected as the reference colour is close to the area selected as stain in the visual inspection.

Table 5.
Maps with differences in relation to the visual inspection and IoU values (Jaccard index).
5. Conclusions
The StainView is a fast and user-friendly method that enabling a support to a first approach for the analysis of the state of conservation of facades, being a valuable tool for inspection and diagnosis.
The final maps produced facilitate the identification of critical areas by the detection of stains, which have a higher probability of containing anomalies, identically to the visual inspections usually performed. Furthermore, this allows the identification and separation of materials, specifically, the cladding is extracted for analysis, and external elements such as trees, cars, windows, air-conditioning equipment, among others, are removed from the images. Additionally, the method also allows the colour characterisation in the whole facade. Finally, the mosaic image produced can be analysed at any time, including being processed with new approaches and analysis.
The results show that the classification based on colour differences (ΔE) mimic the traditional visual inspection, which is more evident for the cases in the worst and average states of conservation, in which the stains are more clear. In cases of good conditions, there may still be a tendency for the inspector who is carrying out the visual analysis to look for defects in greater detail rather than relying on a quick assessment, as is the case with obvious faults. For the three cases analysed in Bairro de Alvalade, in Lisbon, this is evident for facade No. 9 (with best state of conservation), which is less accurate when compared with the remaining facades. For facades No. 4 and No. 7, ΔE can identify slight colour differences that may not be observed by naked eye.
The automatic approach significantly reduces the inspection time, allowing for a facade mapping that is 8–12 times faster. This advantage becomes even more pronounced as the number of facades being evaluated increases. Additionally, bias evaluation and accuracy are improved, since these reduce human intervention. The facades present a different yellow colour reference for cladding depending on the light exposition. However, the advantage of using a specific reference colour to measure relative colour differences makes the method versatile and easy to apply by technicians which are non-experts in computer vision.
A drawback of the method is its performance when dealing with facade panoramas with ‘noise’ elements, such as urban furniture, vegetation, and vehicles, which hide parts of the facade from the panorama. This means that the analysis is not performed on the entire facade. This can be overcome by more complex image surveying, from different points of view, to avoid facade blind spots. However, the error is often not relevant at this scale.
Author Contributions
Conceptualization, J.V.; methodology, M.T.-G. and J.V.; software, J.V. and B.O.S.; validation, M.T.-G. and J.V.; formal analysis, M.T.-G., J.V., A.S. and M.P.M.; visualisation, M.T.-G., J.V., A.S. and M.P.M. writing—original draft preparation, M.T.-G.; writing—review and editing, J.V., B.O.S., A.S. and M.P.M.; project administration, J.V., A.S. and M.P.M.; funding acquisition, J.V., A.S. and M.P.M. All authors have read and agreed to the published version of the manuscript.
Funding
This research was supported by Fundação para a Ciência e Tecnologia (FCT) through funding UIDB/04625/2020 from the research unit CERIS, in the scope of CERIS Transversal seed project Feeling the City. Marta Torres-Gonzáles acknowledges the funding granted from the VI PPIT-US. J. Valença and A. Silva acknowledge the support of FCT through the individual projects CEECIND/04463/2017 and CEECIND/01337/2017, respectively. B.O. Santos also acknowledges the support of FCT through the Ph.D. Grant SFRH/BD/144924/2019.
Data Availability Statement
The data presented in this study are available upon request from the corresponding author.
Acknowledgments
The authors are grateful for the Fundação para a Ciência e Tecnologia support through funding UIDB/04625/2020 from the research unit CERIS.
Conflicts of Interest
The authors declare no conflict of interest.
References
- Torres-González, M.; Cabrera Revuelta, E.; Calero-Castillo, A.I. Photogrammetric state of degradation assessment of decorative claddings: The plasterwork of the Maidens’ Courtyard (The Royal Alcazar of Seville). Virtual Archaeol. Rev. 2023, 14, 110–123. [Google Scholar] [CrossRef]
- Damięcka-Suchocka, M.; Katzer, J.; Suchocki, C. Application of TLS Technology for Documentation of Brickwork Heritage Buildings and Structures. Coatings 2022, 12, 1963. [Google Scholar] [CrossRef]
- Baduge, S.; Thilakarathna, S.; Perera, J.S.; Arashpour, M.; Sharafi, P.; Teodosio, B.; Shringi, A.; Mendis, P. Artificial intelligence and smart vision for building and construction 4.0: Machine and deep learning methods and applications. Autom. Constr. 2022, 141, 104440. [Google Scholar] [CrossRef]
- Schönbecka, P.; Löfsjögårda, M.; Ansella, A. Collaboration and knowledge exchange possibilities between industry and construction 4.0 research. Procedia Comput. Sci. 2021, 192, 129–137. [Google Scholar] [CrossRef]
- Valença, J.; Gonçalves, L.; Júlio, E. Damage assessment on concrete surfaces using multi-spectral image analysis. Constr. Build. Mater. 2013, 40, 971–981. [Google Scholar] [CrossRef]
- Santos, B.-O.; Valença, J.; Júlio, E. Automatic mapping of cracking patterns on concrete surfaces with biological stains using hyper-spectral images processing. Struct. Control. Heal. Monit. 2019, 26, e2320. [Google Scholar] [CrossRef]
- Santos, B.-O.; Valença, J.; Júlio, E. Classification of biological colonization on concrete surfaces using false colour HSV images, including near-infrared information. In Optical Sensing and Detection V; Berghmans, F., Mignani, A.G., Eds.; SPIE: Washington, DC, USA, 2018; Volume 10680, pp. 13–22. [Google Scholar] [CrossRef]
- Miranda, J.; Valença, J.; Júlio, E. Colored concrete restoration method: For chromatic design and application of restoration mortars on smooth surfaces of colored concrete. Struct. Concr. 2019, 20, 1391–1401. [Google Scholar] [CrossRef]
- Guo, J.; Wang, Q.; Li, Y.; Liu, P. Façade defects classification from imbalanced dataset using meta learning-based convolutional neural network. Comput. Civ. Infrastruct. Eng. 2020, 35, 1403–1418. [Google Scholar] [CrossRef]
- Lee, K.; Hong, G.; Sael, L.; Lee, S.; Kim, H.Y. Multidefectnet: Multi-class defect detection of building façade based on deep convolutional neural network. Sustainability 2020, 12, 9785. [Google Scholar] [CrossRef]
- Santo, B.-O.; Valença, J.; Costeira, J.P.; Júlio, E. Domain adversarial training for classification of cracking in images of concrete surfaces. AI Civ. Eng. 2022, 1, 8. [Google Scholar] [CrossRef]
- Chen, K.; Reichard, G.; Akanmu, A.; Xu, X. Geo-registering UAV-captured close-range images to GIS-based spatial model for building façade inspections. Autom. Constr. 2021, 122, 103503. [Google Scholar] [CrossRef]
- Wyszecki, G.; Stiles, W.S. Color Science: Concepts and Methods, Quantitative Data and Formulae, 2nd ed.; John Wiley & Sons: New York, NY, USA, 1982. [Google Scholar]
- EN-15886:2010; Conservation of Cultural Property. Test Methods. Colour Measurement of Surfaces. AENOR: Madrid, Spain, 2011.
- Schuessler, Z. Delta E 101. Available online: http://zschuessler.github.io/DeltaE/learn/ (accessed on 24 April 2022).
- Alegre, A.; Heitor, T. The First Generation of Reinforced Concrete Building Type. In Proceedings of the First International Congress on Construction History, Madrid, Spain, 20–24 January 2003. [Google Scholar]
- SIPA—Sistema de Informação para o Património Arquitectónico. Available online: http://www.monumentos.gov.pt/Site/APP_PagesUser/SIPA.aspx?id=30357 (accessed on 12 June 2022).
- IPMA—Instituto Português do Mar e da Atmosfera. Available online: https://www.ipma.pt/pt/index.html (accessed on 10 June 2022).
- Barberousse, H.; Lombardo, R.; Tell, G.; Couté, A. Factors involved in the colonisation of building façades by algae and cyanobacteria in France. Biofouling 2006, 22, 69–77. [Google Scholar] [CrossRef]
- Guillitte, O. Bioreceptivity: A new concept for building ecology studies. Sci. Total Environ. 1995, 167, 215–220. [Google Scholar] [CrossRef]
- Regulamento Geral das Edificações Urbanas; DL n.º 38382/51, de 07 de Agosto; Conselho Directivo Regional do Sul: Lisboa, Portugal, 1951.
- Microsoft. Image Composite Editor Version 2.0.3; Microsoft Research Computational Photographic Group: Redmond, WA, USA, 2015. [Google Scholar]
- Shevell, S.K. (Ed.) The Science of Color, 2nd ed.; Elsevier: Oxford, UK, 2003. [Google Scholar]
- Luong, Q.-T. Color in Computer Vision. In Handbook of Pattern Recognition and Computer Vision; Chen, C.H., Pau, L.F., Wang, P.S.P., Eds.; Elsevier: Amsterdam, The Netherlands, 1993; pp. 311–336. [Google Scholar] [CrossRef]
- MATLAB 9.11.0.17699689, version R2021b; The MathWorks Inc.: Natick, MA, USA, 2021.
- Autodesk Autocad, version 2021; Autodesk Inc.: San Rafael, CA, USA, 2021.
Disclaimer/Publisher’s Note: The statements, opinions and data contained in all publications are solely those of the individual author(s) and contributor(s) and not of MDPI and/or the editor(s). MDPI and/or the editor(s) disclaim responsibility for any injury to people or property resulting from any ideas, methods, instructions or products referred to in the content. |
© 2023 by the authors. Licensee MDPI, Basel, Switzerland. This article is an open access article distributed under the terms and conditions of the Creative Commons Attribution (CC BY) license (https://creativecommons.org/licenses/by/4.0/).
