Article

Common-Mode Clutter Filtering for the Problem of Sounding Multilayer Media Using Ground-Penetrating Radar

1
Radiophysics Faculty, Tomsk State University, 634050 Tomsk, Russia
2
Radiovision LLC., 143026 Moscow, Russia
3
Research and Production Association “Terrazond”, 115230 Moscow, Russia
4
TIM LLC., 453700 Uchali, Russia
*
Author to whom correspondence should be addressed.
Remote Sens. 2023, 15(11), 2751; https://doi.org/10.3390/rs15112751
Submission received: 31 March 2023 / Revised: 15 May 2023 / Accepted: 16 May 2023 / Published: 25 May 2023

Abstract

:
Eliminating common-mode clutter in data is one of the key aspects of road sensing with GPR. Common-mode interference can occur as a result of multipath propagation of an electromagnetic signal when the reflected signal from the same object arrives at the receiver from different directions and with different delays. Similar phenomena also occur when using antennas raised above the surface due to multiple reflections between the air–surface interface and the antenna. These interferences can significantly distort the data received by the GPR and interfere with the accurate determination of the parameters of the roadway. Therefore, the elimination of common-mode clutter is an important task to improve the quality of the obtained results. In this paper, we consider a method for filtering common-mode clutter in the radar data of the multichannel GPR “Terrazond”, which were obtained by sounding a test section of a highway. The results obtained during filtering can then be used to determine the thickness of the pavement layers using approaches that take into account the signal delay determined by the amplitude jump, for example, the common point method or if the permittivity of each layer is known. The obtained thicknesses of pavement layers are compared with the results obtained during core drilling by the Russian Road Research Institute.

1. Introduction

Various methods are used to eliminate interference in GPR data, such as signal filtering, correction of phase and amplitude distortions, the use of special data processing algorithms, etc. The development of a signal processing method that eliminates the problem of accurately determining the boundaries of the pavement layers is an urgent task, since the accuracy of determining the boundaries of the pavement layers directly affects the quality and efficiency of road work. The problem of accurately defining the boundaries of the pavement layers arises from the heterogeneity of materials and the complex structure of the pavement, as well as from the presence of defects and damage on the road surface. Existing signal processing methods used to determine the boundaries of pavement layers have shortcomings that limit their application under practical conditions, mainly due to the inability to clearly define the boundaries of the pavement layers. One of the approaches for calculating the boundaries of layers is the common point method (CPM) [1,2], a method of processing GPR signals that is used to determine the geometric characteristics of underground objects, such as the thickness and depth of soil layers, layer boundaries, the presence of obstacles, etc. Using the common point method and other approaches that explicitly use signal amplitude jumps to highlight layer boundaries requires preprocessing of the signal in order to suppress common-mode clutter. One way to implement this approach is the use of inverse convolution algorithms [3,4,5,6,7]. Such approaches require knowledge of the hardware function or the presence of a test signal, for example, reflected from a metal surface. The use of these approaches makes it possible to take into account the effects of multiple reflections and, due to amplitude-phase compensation, to synthesize a signal close to the delta function reflected from the interface. However, this processing has a number of disadvantages, the first of which is the standard inverse convolution problem. The main signal narrowing leads to the appearance of new non-physical side lobes, including before the signal appears, which violates the principle of causality. These side lobes can mask the edges of low-contrast layers or subsurface features. It is possible to deal with the violation of the principle of causality if the amplitude and phase of the signal are related by the Kramers–Kronigrelation [8,9,10,11]. It should also be taken into account that the Kramers–Kronigratio is not implemented using fast algorithms, preventing it from being used in real time. The second problem is that the signal reflected from the second and subsequent boundaries has a different phase distribution due to the presence of some unknown refractive index of the medium, which can no longer be compensated for by the calculated instrumental function. This results in an even higher level of side lobes. Signal-sharpening approaches use super-resolution methods [12,13,14,15]. When applying these approaches in practice, one should take into account their complexity due to the use of iterative algorithms and the instability that always occurs when solving inverse problems. Thus, the development of a new signal processing method to filter out in-phase clutter that eliminates the problem of accurately determining the boundaries of road surface layers is an important issue. The use of processed data improves the quality of the image obtained by ground-penetrating radar, making it more accurate and reliable for research on road surfaces to determine thickness and layer boundaries, as well as detecting other underground objects, which makes it highly useful in geology, construction, and other fields. Decluttered ground-penetrating radar data can be further used by neural networks [16,17,18,19,20,21,22,23] to obtain large amounts of data automatically in road surface investigations, significantly improving the accuracy and efficiency of this process. Several articles note that the accuracy of determining characteristics using neural networks depends on the quality of the data obtained through GPR and that the precision of the methods may decrease in the presence of strong clutter in the data. Therefore, using the in-phase clutter filtering method allows for wider use of neural networks in processing large datasets. For instance, neural networks can automate the processing of data collected from GPR or other tools used in road surface investigations. These networks can be trained to recognize various road defects, such as cracks, potholes, and breaks, allowing for faster and more accurate identification of their location and size. These data are then used to create a map of road conditions and plan for their repair.

2. Hardware for Conducting Experiments

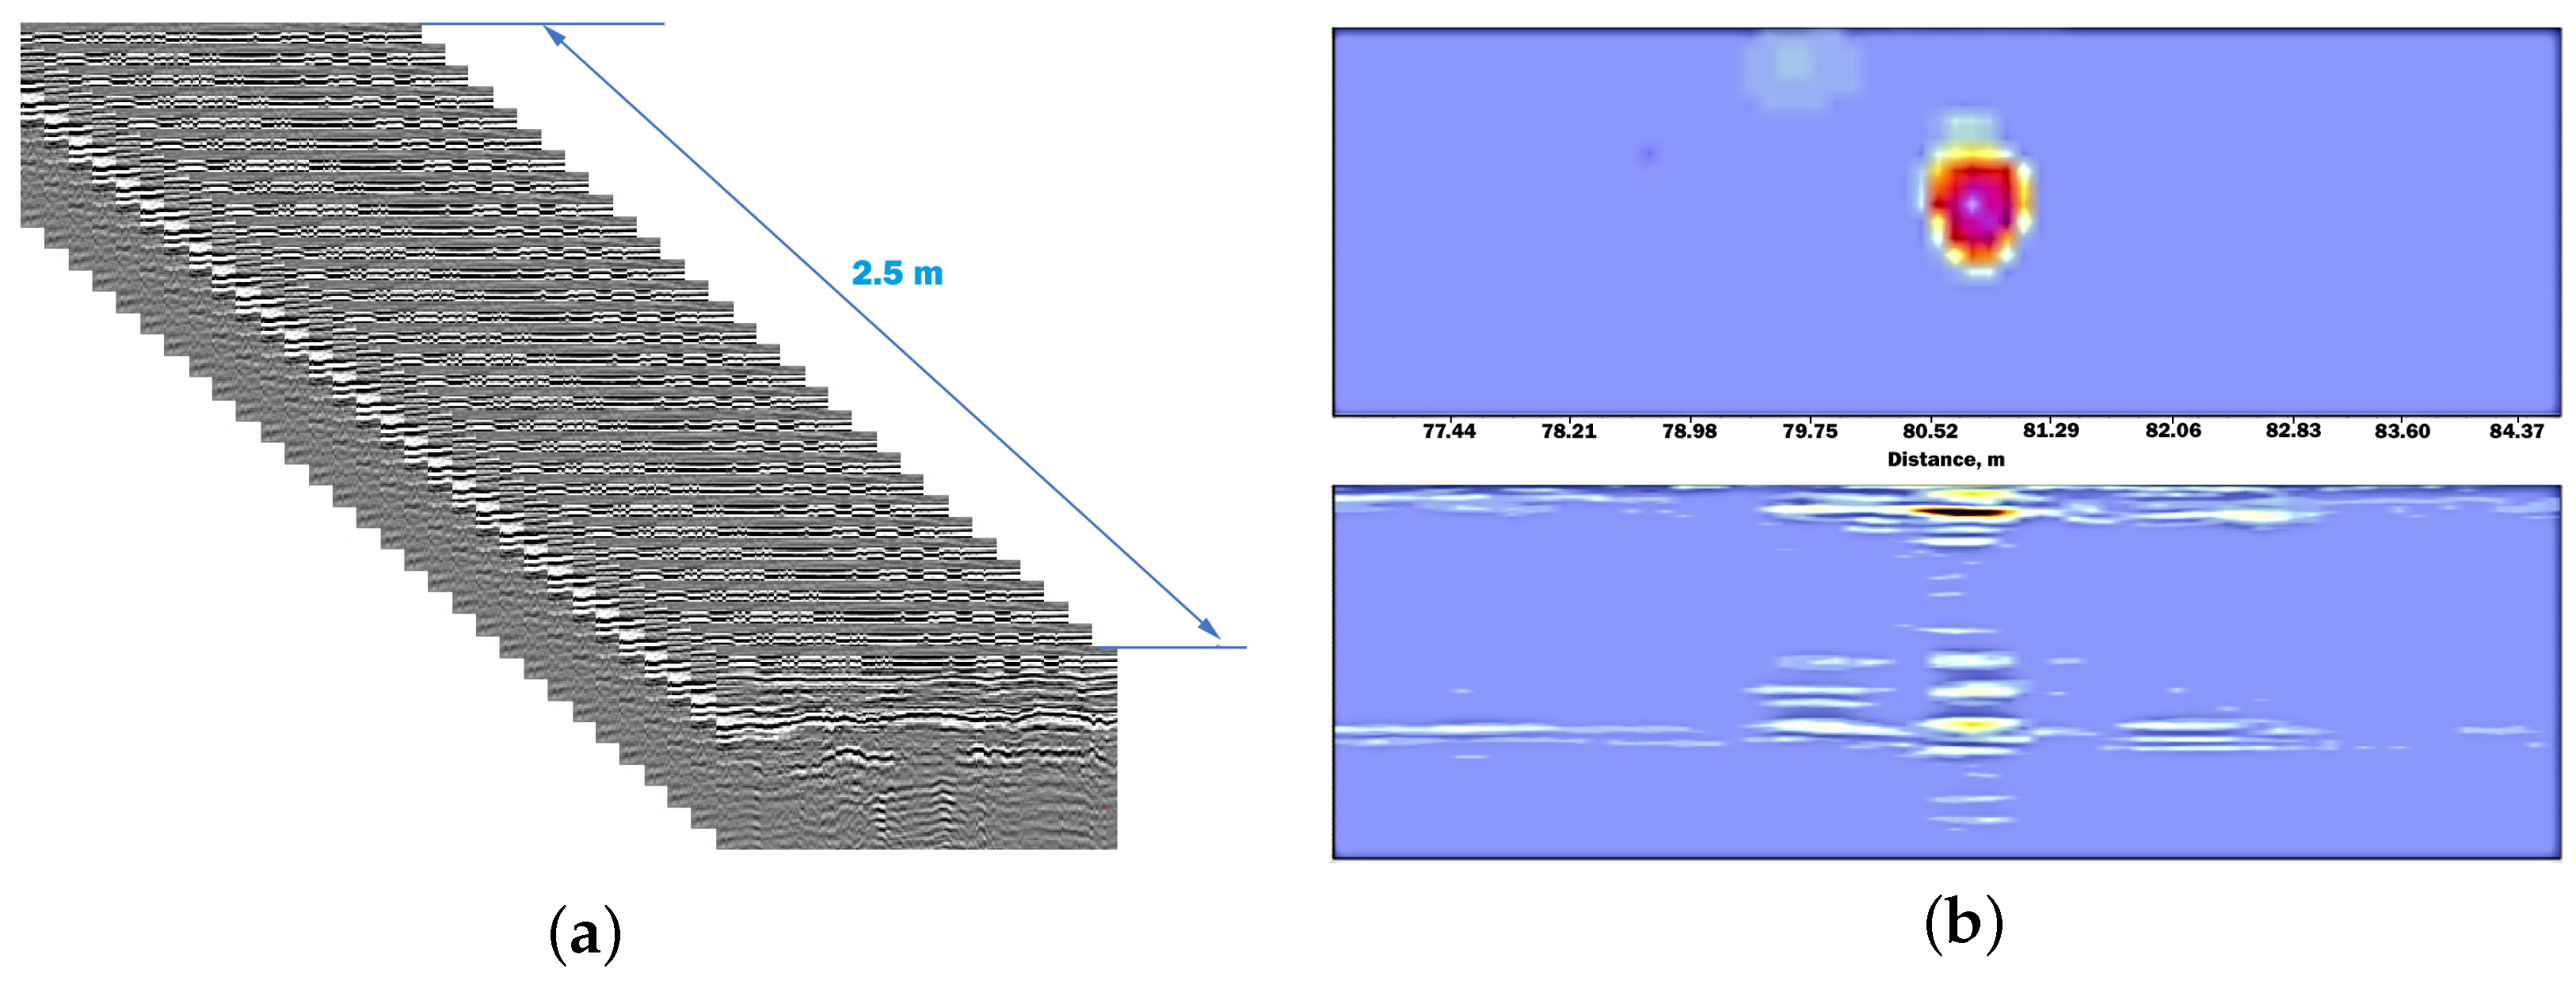
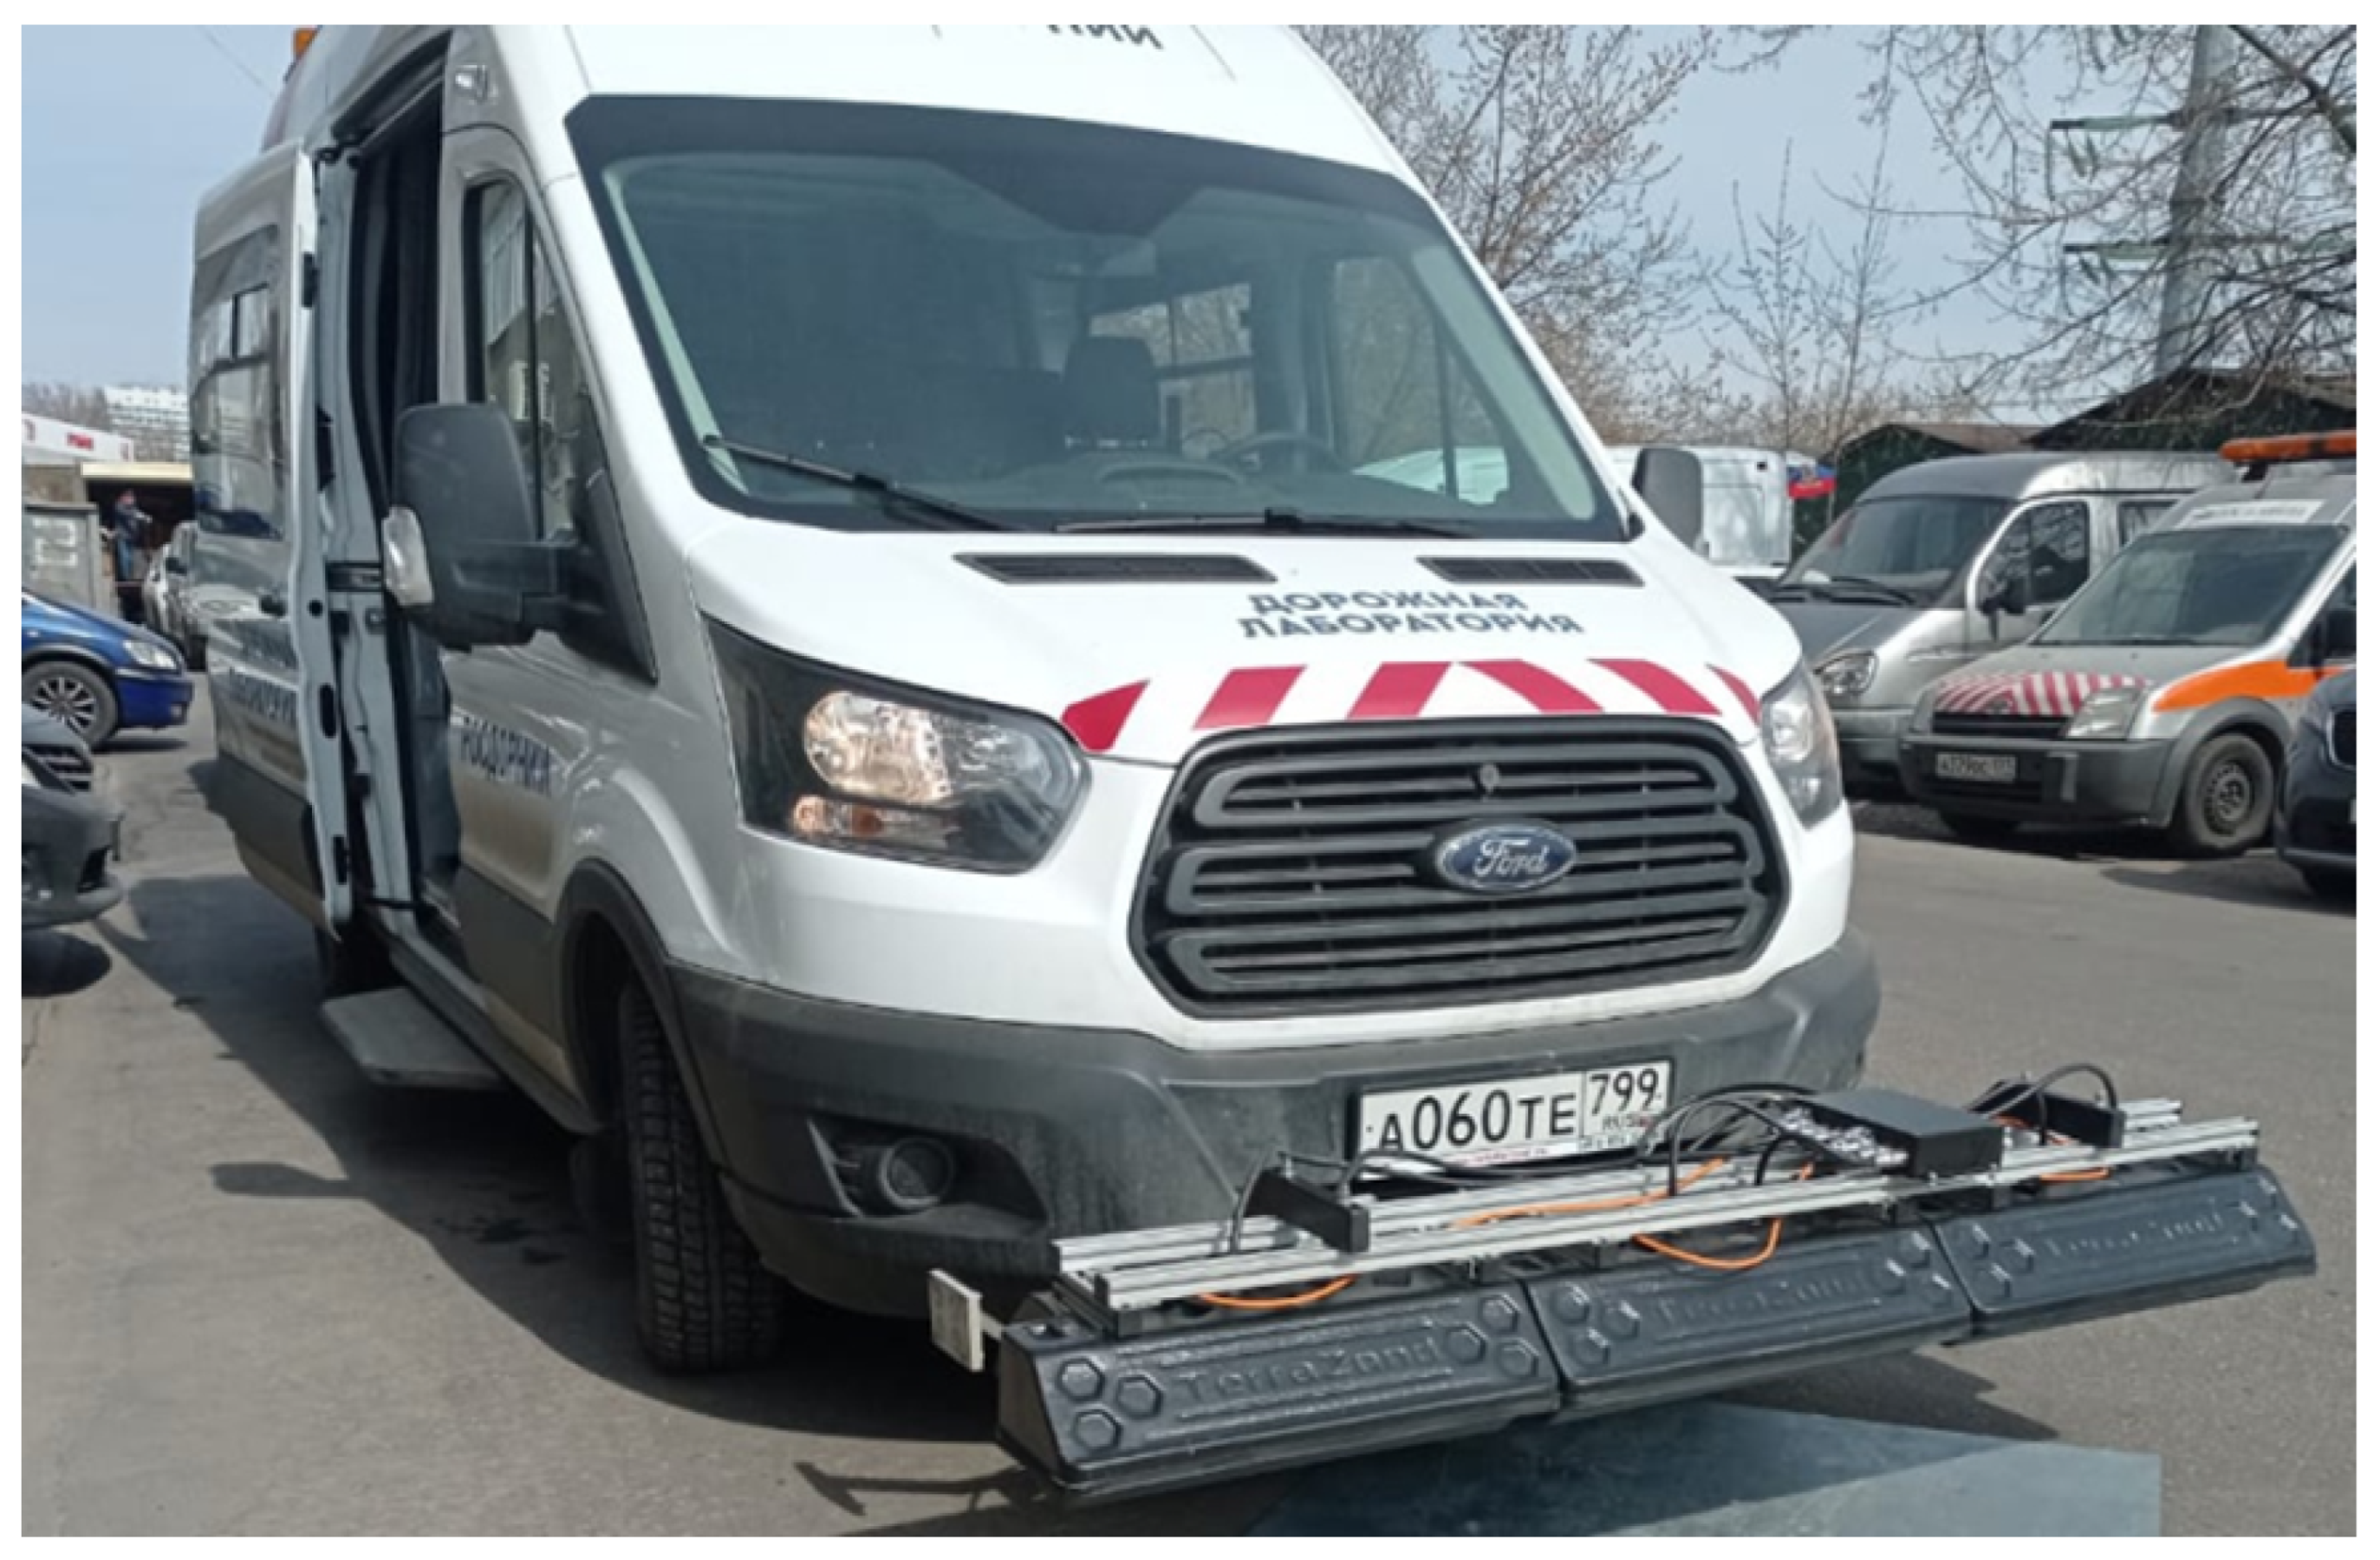
Ground-penetrating radar technology is promising for various studies of multilayered media without disturbing their integrity [24]. The objectives of road pavement diagnostics include determining the thickness of structural layers; detecting engineering communications; obtaining information about their condition, size, and depth [25]; localizing (confirming the presence of) reinforcement mesh [26]; and qualitatively assessing the condition of subsurface layers (moisture, cracking, and swelling zones) [27,28]. TerraZond multichannel wide-aperture ground-penetrating radar (Figure 1) was used as the main measuring tool to obtain GPR data, which has several advantages compared to conventional monopulse GPR systems. Some important characteristics of this radar are listed below. First, this device is a distributed antenna array with high-speed electronic switching, allowing for simultaneous probing through 32 channels with coverage of up to 2.5 m of road width (Figure 2a). This enables evaluation of pavement characteristics and heterogeneities across the entire road surface (Figure 2b) rather than just along a single lane. Secondly, the radar is equipped with a high-speed signal generator based on the principle of LFM location, which provides probing at speeds up to 130 km/h. The GPR includes a UWB antenna block of receiving and transmitting antennas working in the frequency range of 0.71 to 2.6 GHz; a sensitive high-speed LFM generator, providing radar operation at a speed of up to 130 km/h (with a recording density of GPR traces every 10 cm); high-speed electronic relay; and a programmable logic-integrated circuit (PLIC) for receiving, processing, and storing geodata (Figure 3). The GPR antenna array is mounted on the front or rear of the vehicle at a height of 30–40 cm above the road surface (Figure 4). Currently, TerraZond GPR is produced in series and equipped in road laboratories of organizations such as the Russian Road Research Institute and Federal Highway Agency. Advantages of using “Terrazond” multichannel ground-penetrating radar over single-channel systems include:
  • Measuring radar reflections from the road surface in both transverse and longitudinal directions while the radar device is moved by a vehicle;
  • Processing the corresponding data to obtain a three-dimensional array and amplitude maps with geolocation;
  • The ability to use the common depth point method, which enables the calculation of the electromagnetic properties of road layers, providing opportunities for more detailed analysis [29,30];
  • Real-time software performs primary signal processing functions simultaneously on all channels, such as converting received FMCW signals into temporal sequences of data, filtering coherent clutter, and correlating obtained tracks with GPS.
The hardware parameters of the system are also presented to understand the detection efficiency.
System hardware parameters:
  • ADC 14 allows bits, taking into account the isolation between the receiving and front antennas of about 20 dB of the available range of about 90 dB;
  • The use of chirp technology to receive signals and receive signals sending pulses of 10 K per second;
  • Implemented using FPGA technology, signal processing process allows for real-time processing of chirp data and outputs a fast signal of 10 K per second;
  • After Fourier measurement, the frequency of the probing pulse in the frequency band of 0.5–2.5 GHz is 0.5 ns. Taking into account the high dynamic frequency, this leads to an error in measuring the upper layer of the road surface (dielectric permeability impurities) of no more than 4 mm.

3. Mathematical Apparatus for the Method Used to Filter Coherent Clutter

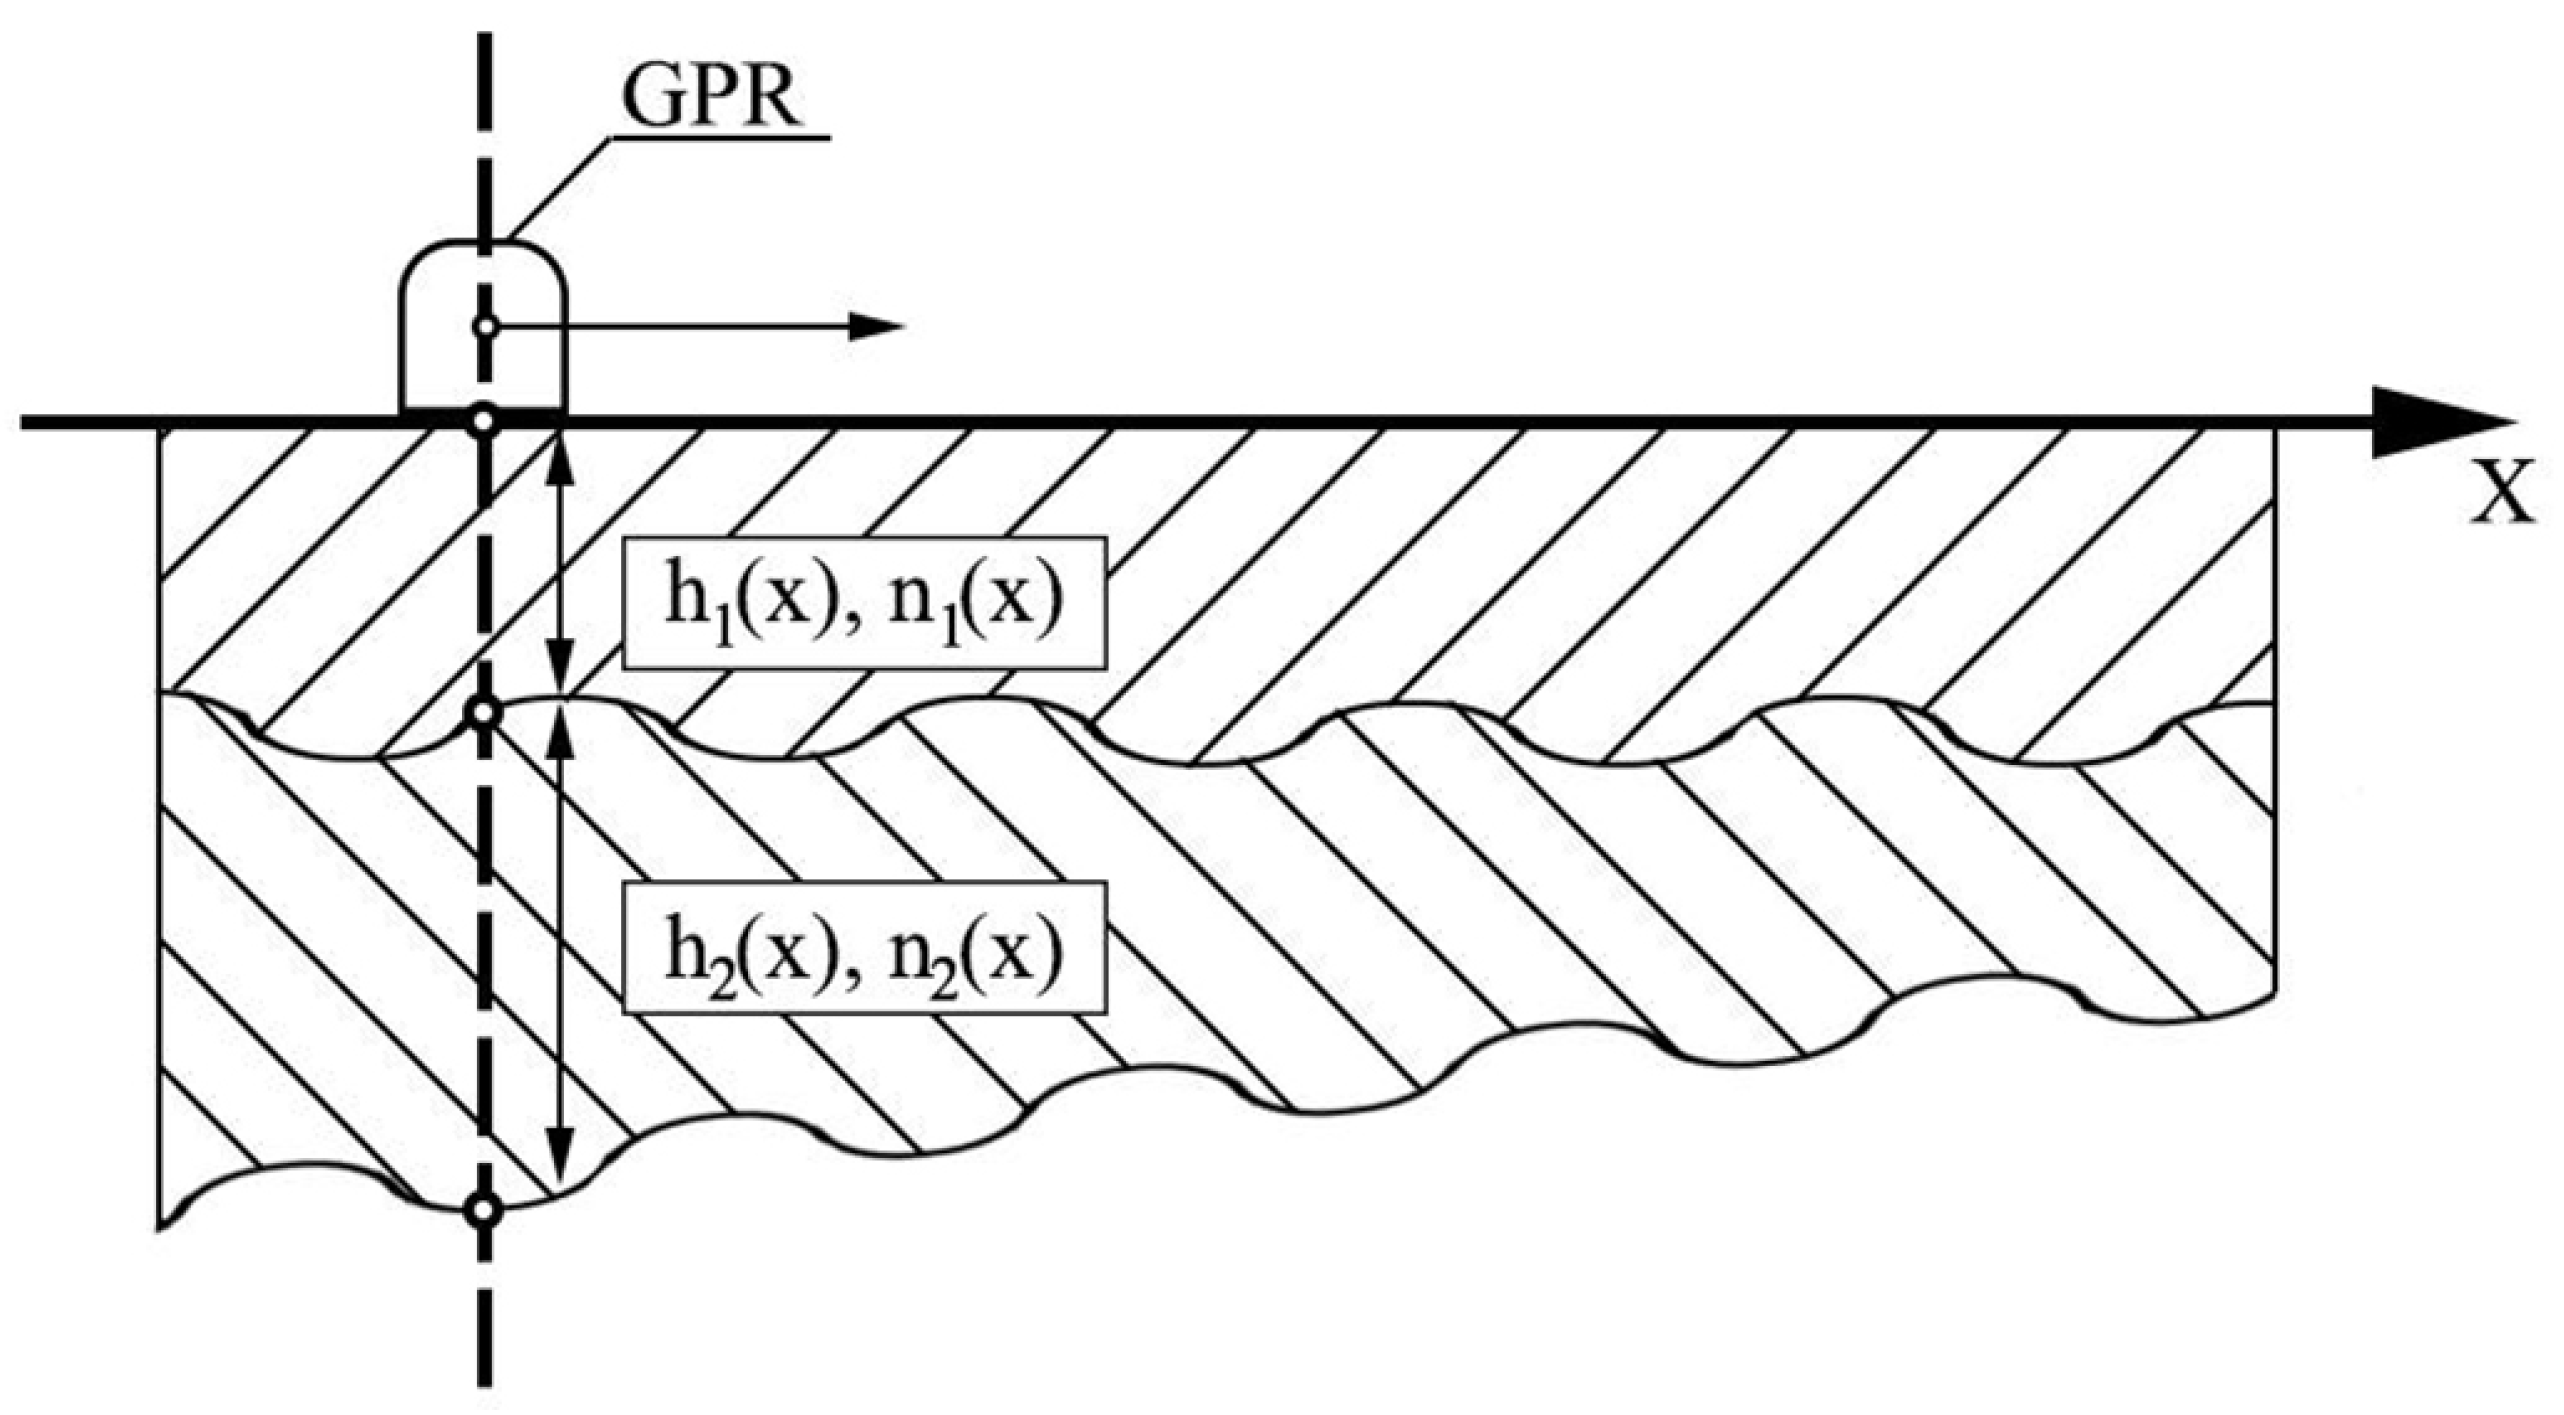
Let us consider the mathematical expression of the signal of the georadar moving along the X-axis with coherent clutter. For the sake of brevity in the notation of mathematical operations, we limit ourselves to the consideration of the interaction of the signal with two layer boundaries (Figure 5).
The received signal in the case of two layer boundaries has the following form.
S ( x , t ) = a 1 ( x ) S 0 ( t τ = 2 h 1 ( x ) n 1 c ) + k b k , 1 ( x ) S 0 ( t τ k ( x ) ) + a 2 ( x ) S 0 ( t τ = 2 h 1 ( x ) n 1 + h 2 ( x ) n 2 c ) + m b m , 1 ( x ) S 0 ( t τ m ( x ) ) + η ( t )
where S 0 ( t ) is the probing signal at the output of the transmitting antenna; a 1 and a 2 are reflection coefficients from the layer boundaries at the current location of the ground-penetrating radar; b k , 1 and b m , 1 are amplitude coefficients of the in-phase clutter for layers 1 and 2, respectively; h 1 and h 2 are layer thicknesses; n 1 and n 2 are refractive indices of the layers; and η ( t ) is additive noise. To represent a signal with a larger number of layers, additional terms are introduced in analogy with Expression (1). In case of detachment of the ground-penetrating radar antenna from the surface, n 1 is the refractive index of air.
The algorithm used to eliminate coherent clutter involves an iterative procedure whereby the coherent clutter of the upper layer is first eliminated, followed by a transition to the subsequent lower layer. We introduce a series of physically justified approximations to simplify the problem of eliminating coherent clutter by uniquely determining the position of the signal amplitude corresponding to the layer boundary at each iteration.
  • The values of h 1 , h 2 , n 1 , and n 2 change slightly within the selected spatial window [ x , x + Δ x ] ;
  • According to the causality principle, the synchrophase interferences of lower layers do not mix in time with interferences from upper layers;
  • The amplitude of the signal reflected from the layer boundary is higher than the amplitude of any additive interference corresponding to the same layer ( a i ( x ) > b k , i ( x ) ), and the amplitudes of the signals reflected from the layer boundaries obey the inequality ( a i ( x ) > a 2 ( x ) > > a i ( x ) ).
First, the temporal position of signal peaks ( T 1 ( x ) ) in each spatial measurement point of the GPR within the selected spatial window [ x , x + Δ x ] is determined. To do this, an envelope of the signal is constructed, and its maximum is found. Then, all signals are aligned relative to the first signal in the spatial observation window. The resulting signal is written in the following form:
S ( 1 ) ( x , t ) = S ( x , t T 1 ( x ) )
In parentheses above the signal, there is a number indicating the sequence of mathematical operations. Next, it is necessary to align the signal amplitudes. To do this, we find the maximum value ( a m a x ) in the window [ x , x + Δ x ] and perform signal normalization ( S ( 1 ) ( x , t ) ):
S ( 2 ) ( x , t ) = S ( 1 ) ( x , t ) a m a x , 1 a 1 ( x )
The next step in processing is to apply a window function ( W ( t ) ) to remove the part of the overall signal that corresponds to the signal reflected from the first layer. The width of the window is selected based on the width of the probing signal. The operation is carried out for all signals in the selected spatial observation window.
S ( 3 ) ( x , t ) = S ( 2 ) ( x , t ) ( 1 W ( t ) ) , Δ S 1 ( x , t ) = S ( 2 ) ( x , t ) W ( t ) , W ( t ) = e x p ( ( t T ) 10 ( Δ T ) 10 )
where Δ S ( x , t ) essentially represents the signal reflected from the boundary of the first layer, T is the position of the center of the window, and Δ T is its width. Next, we calculate the mean value ( S x ¯ ( t ) ) of the signal ( S ( 3 ) ( x , t ) ) over the entire spatial observation window for each time sample and subtract it.
S ( 4 ) ( x , t ) = S ( 3 ) ( x , t ) S x ¯ ( t ) , S x ¯ ( t ) = j S ( 3 ) ( x j , t )
Expression (4) is a signal in which all in-phase interferences associated with the boundaries of the first layer have been eliminated. Next, a series of reverse operations is performed to restore the original temporal position and amplitude of the signal.
S ( 5 ) ( x , t ) = S ( 4 ) ( x , t + T 1 ( x ) ) a 1 ( x ) a m a x , 1
Thus, the proposed processing ensures the removal of in-phase interference from the first layer in the signal. Each subsequent iteration sequentially removes in-phase interference from deeper layers in the signal. The operation can be carried out until the intensity level of the filtered signal exceeds the level of measurement noise variance ( η ( t ) ). At the end of all iterations, the resulting signal ( S R ( x , t ) ) must be supplemented with the found values with a correction of the temporal position and amplitude.
S R ( x , t ) = S R ( x , t ) + Δ S 1 ( x , t + T 1 ( x ) ) a 1 ( x ) a m a x , 1 + Δ S 2 ( x , t + T 2 ( x ) ) a 2 ( x ) a m a x , 2

Experimental Verification of the Method for Filtering Coherent Clutter

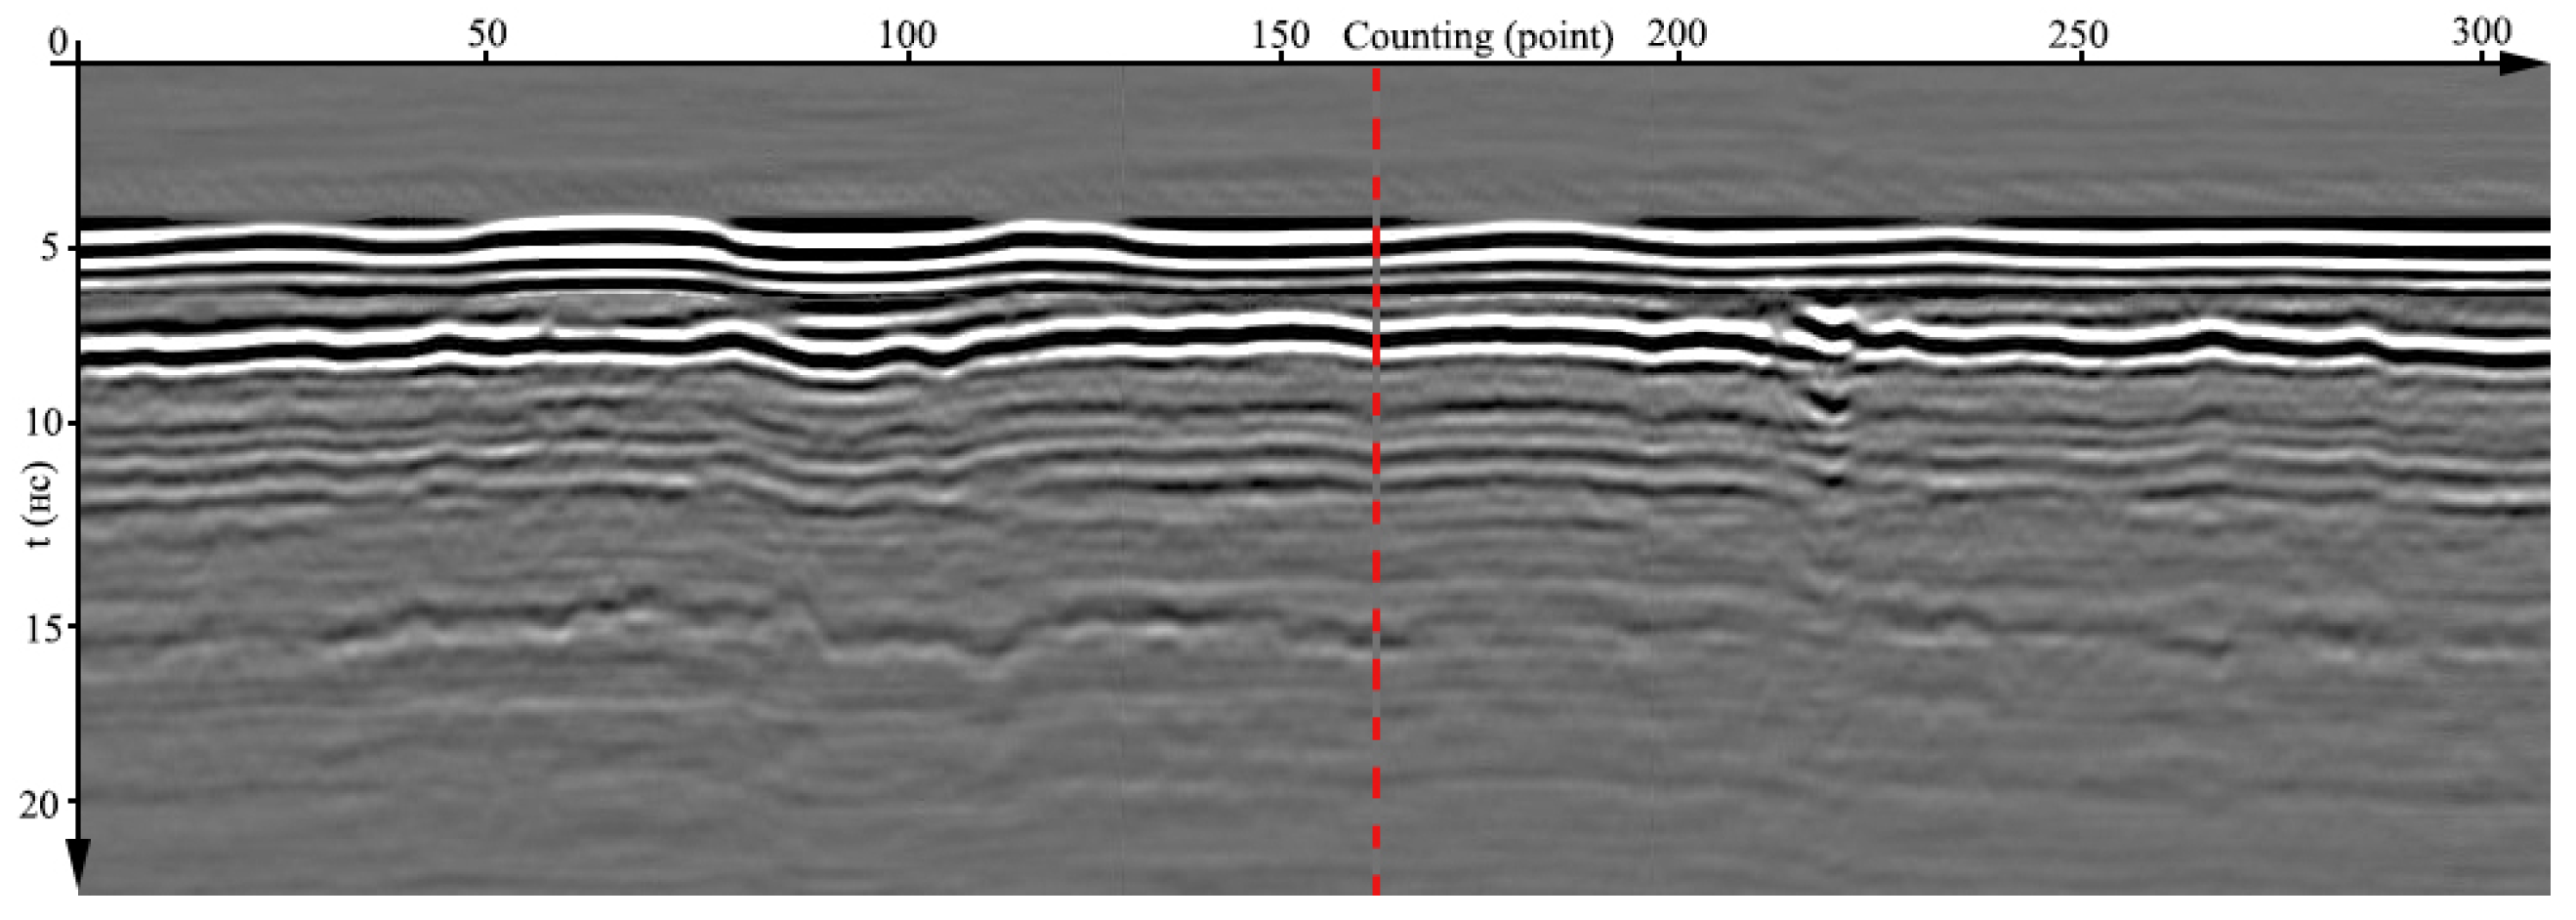
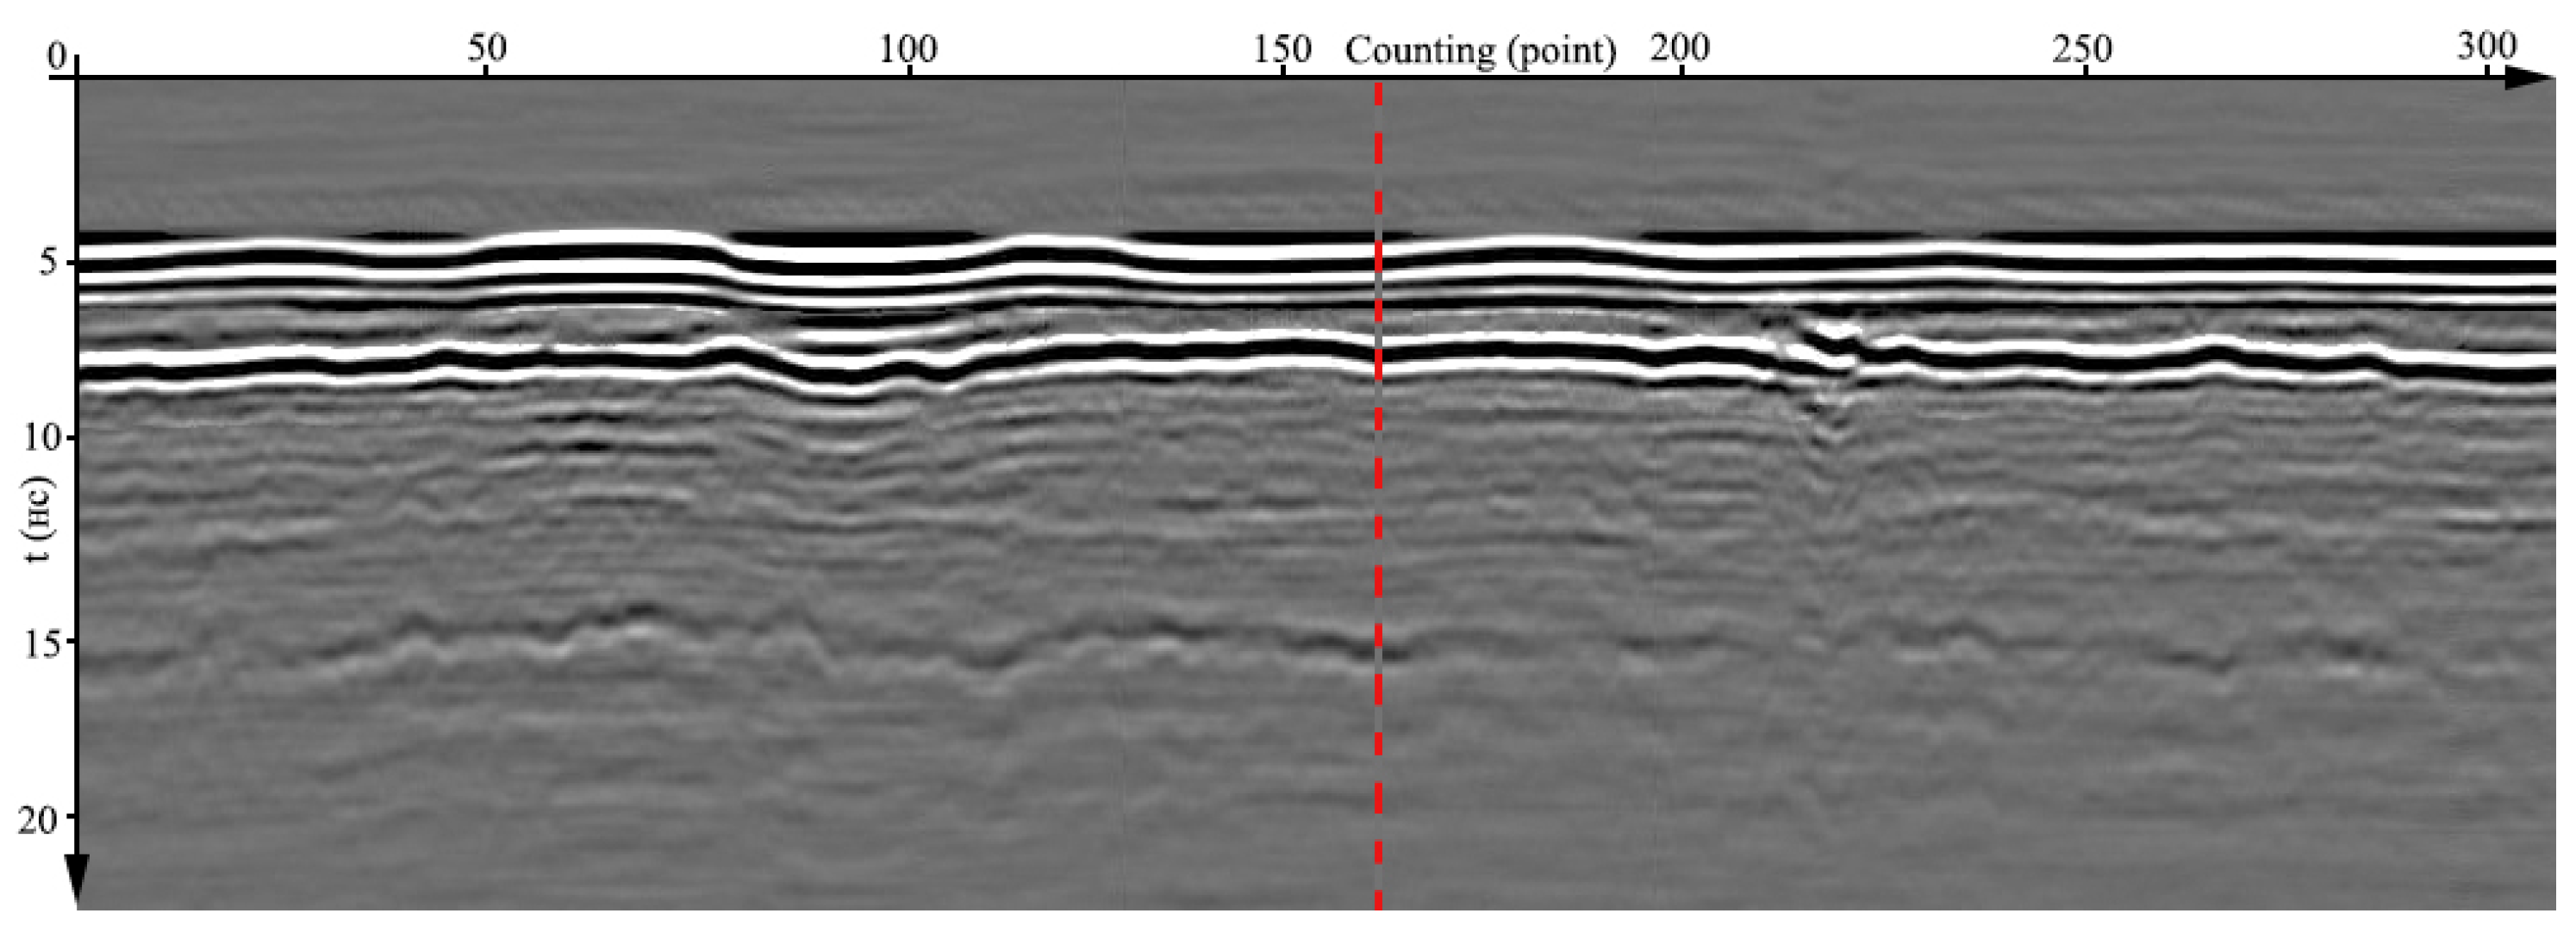
A test site for the “Terrazond” ground-penetrating radar was selected on the M-12/Russian Road Research Institute federal highway in Moscow in 2022. A small section of the road with a length of 160 m was chosen for analysis. The original radargram of the section is presented in Figure 6.
As shown in the figure, due to the multiple interferences between the antenna and the air–medium boundary, in-phase interference arises in the radargram. These interferences manifest as multiple bands, which prevent the determination of the boundaries of road layers. They primarily arise due to the multiple reflections of the probing signal from the road surface and other reflectors that relate to the design of the antenna array and its suspension on the vehicle. The above-described method for filtering in-phase interference can be applied to the experimental data presented in Figure 6.
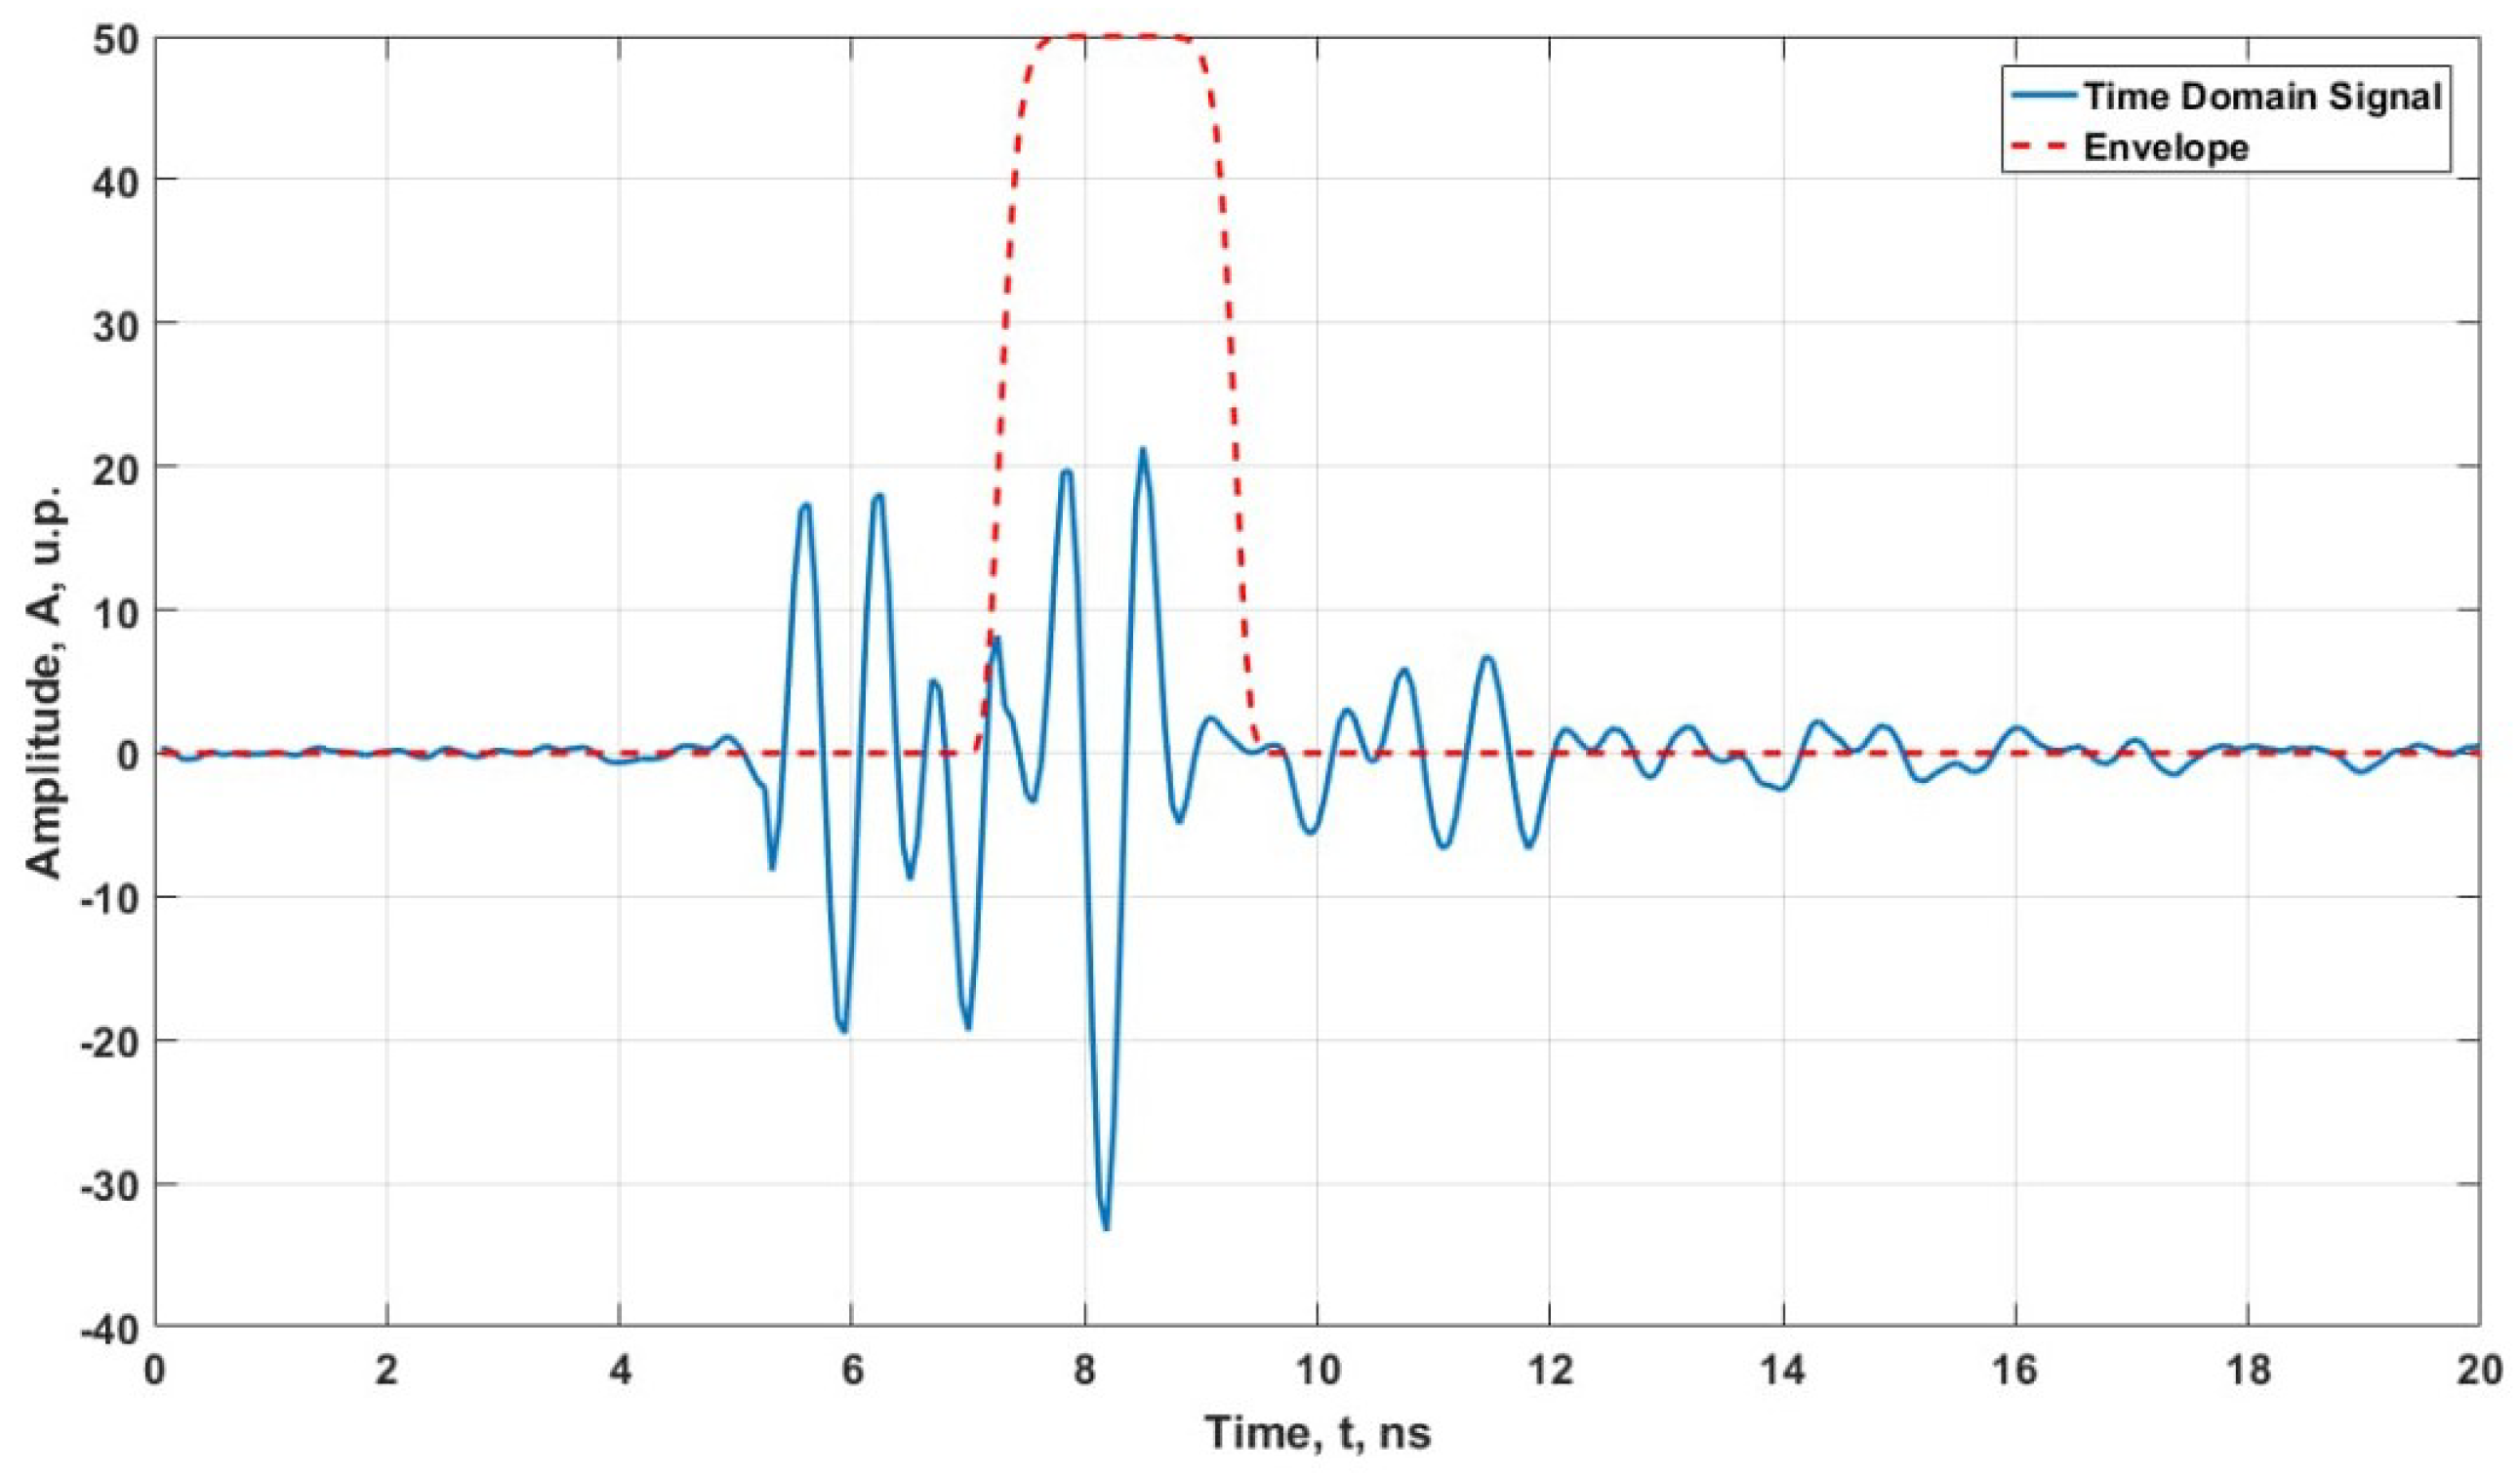
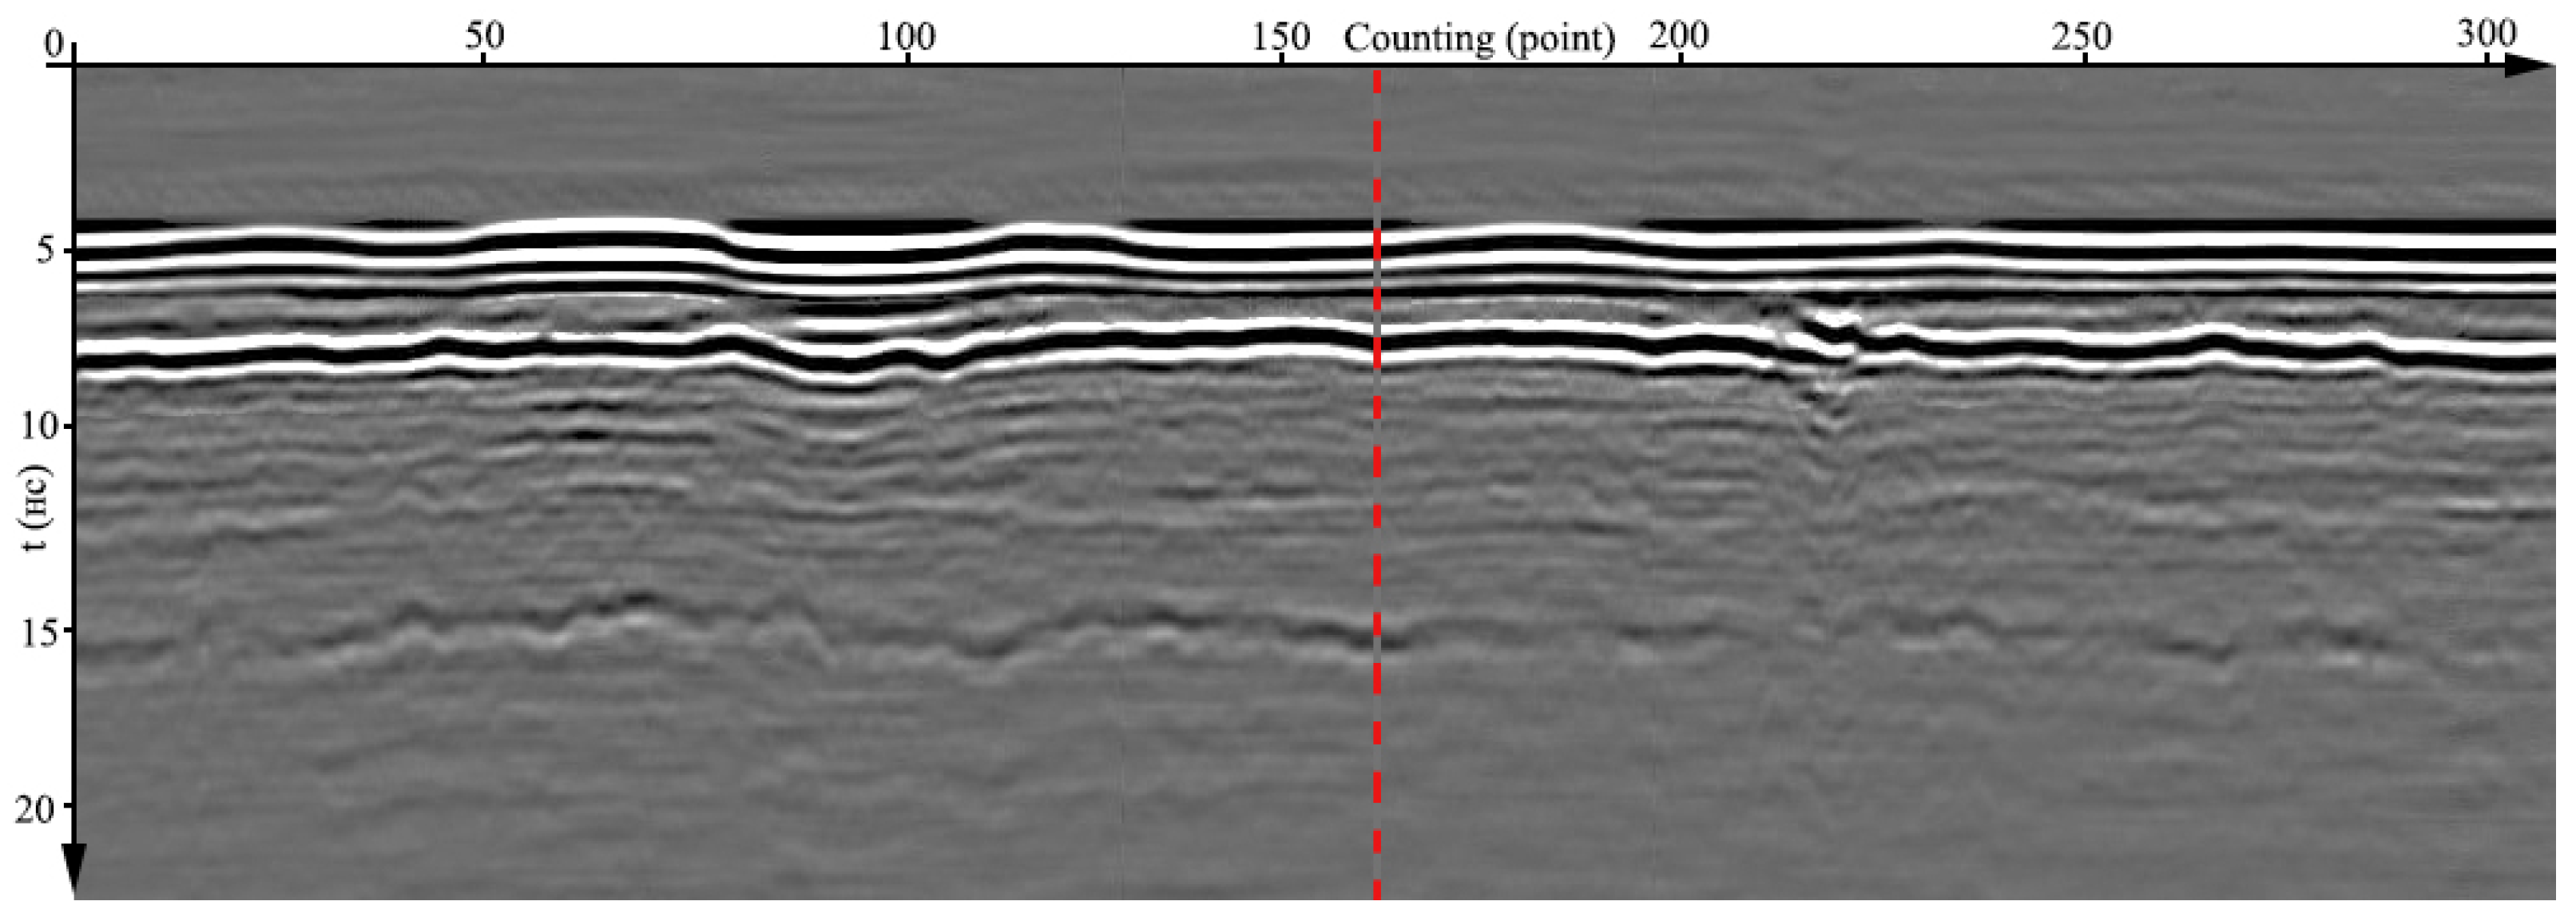
At the first step, we identify the first signal maximum for a certain spatial position of the ground-penetrating radar, which characterizes the reflection from the air–road boundary (Figure 7, blue line). This signal is called the reference signal. We set a window function that selects this signal within the pulse duration of 2 ns (Figure 7, red line). As a result of applying the window function, the rest of the signal becomes zero. We perform this operation for all radargrams. Next, we align these signals to the maximum of the reference signal, recording the time shifts for each radargram. We apply this shift to the original radargrams and subtract the mean signal value along the movement of the ground-penetrating radar. After the subtraction operation, we return each radargram to its original time position by applying the shift operation in the opposite direction (Figure 8). The entire process of radargram processing described above is called the first iteration of the method for filtering in-phase clutter.
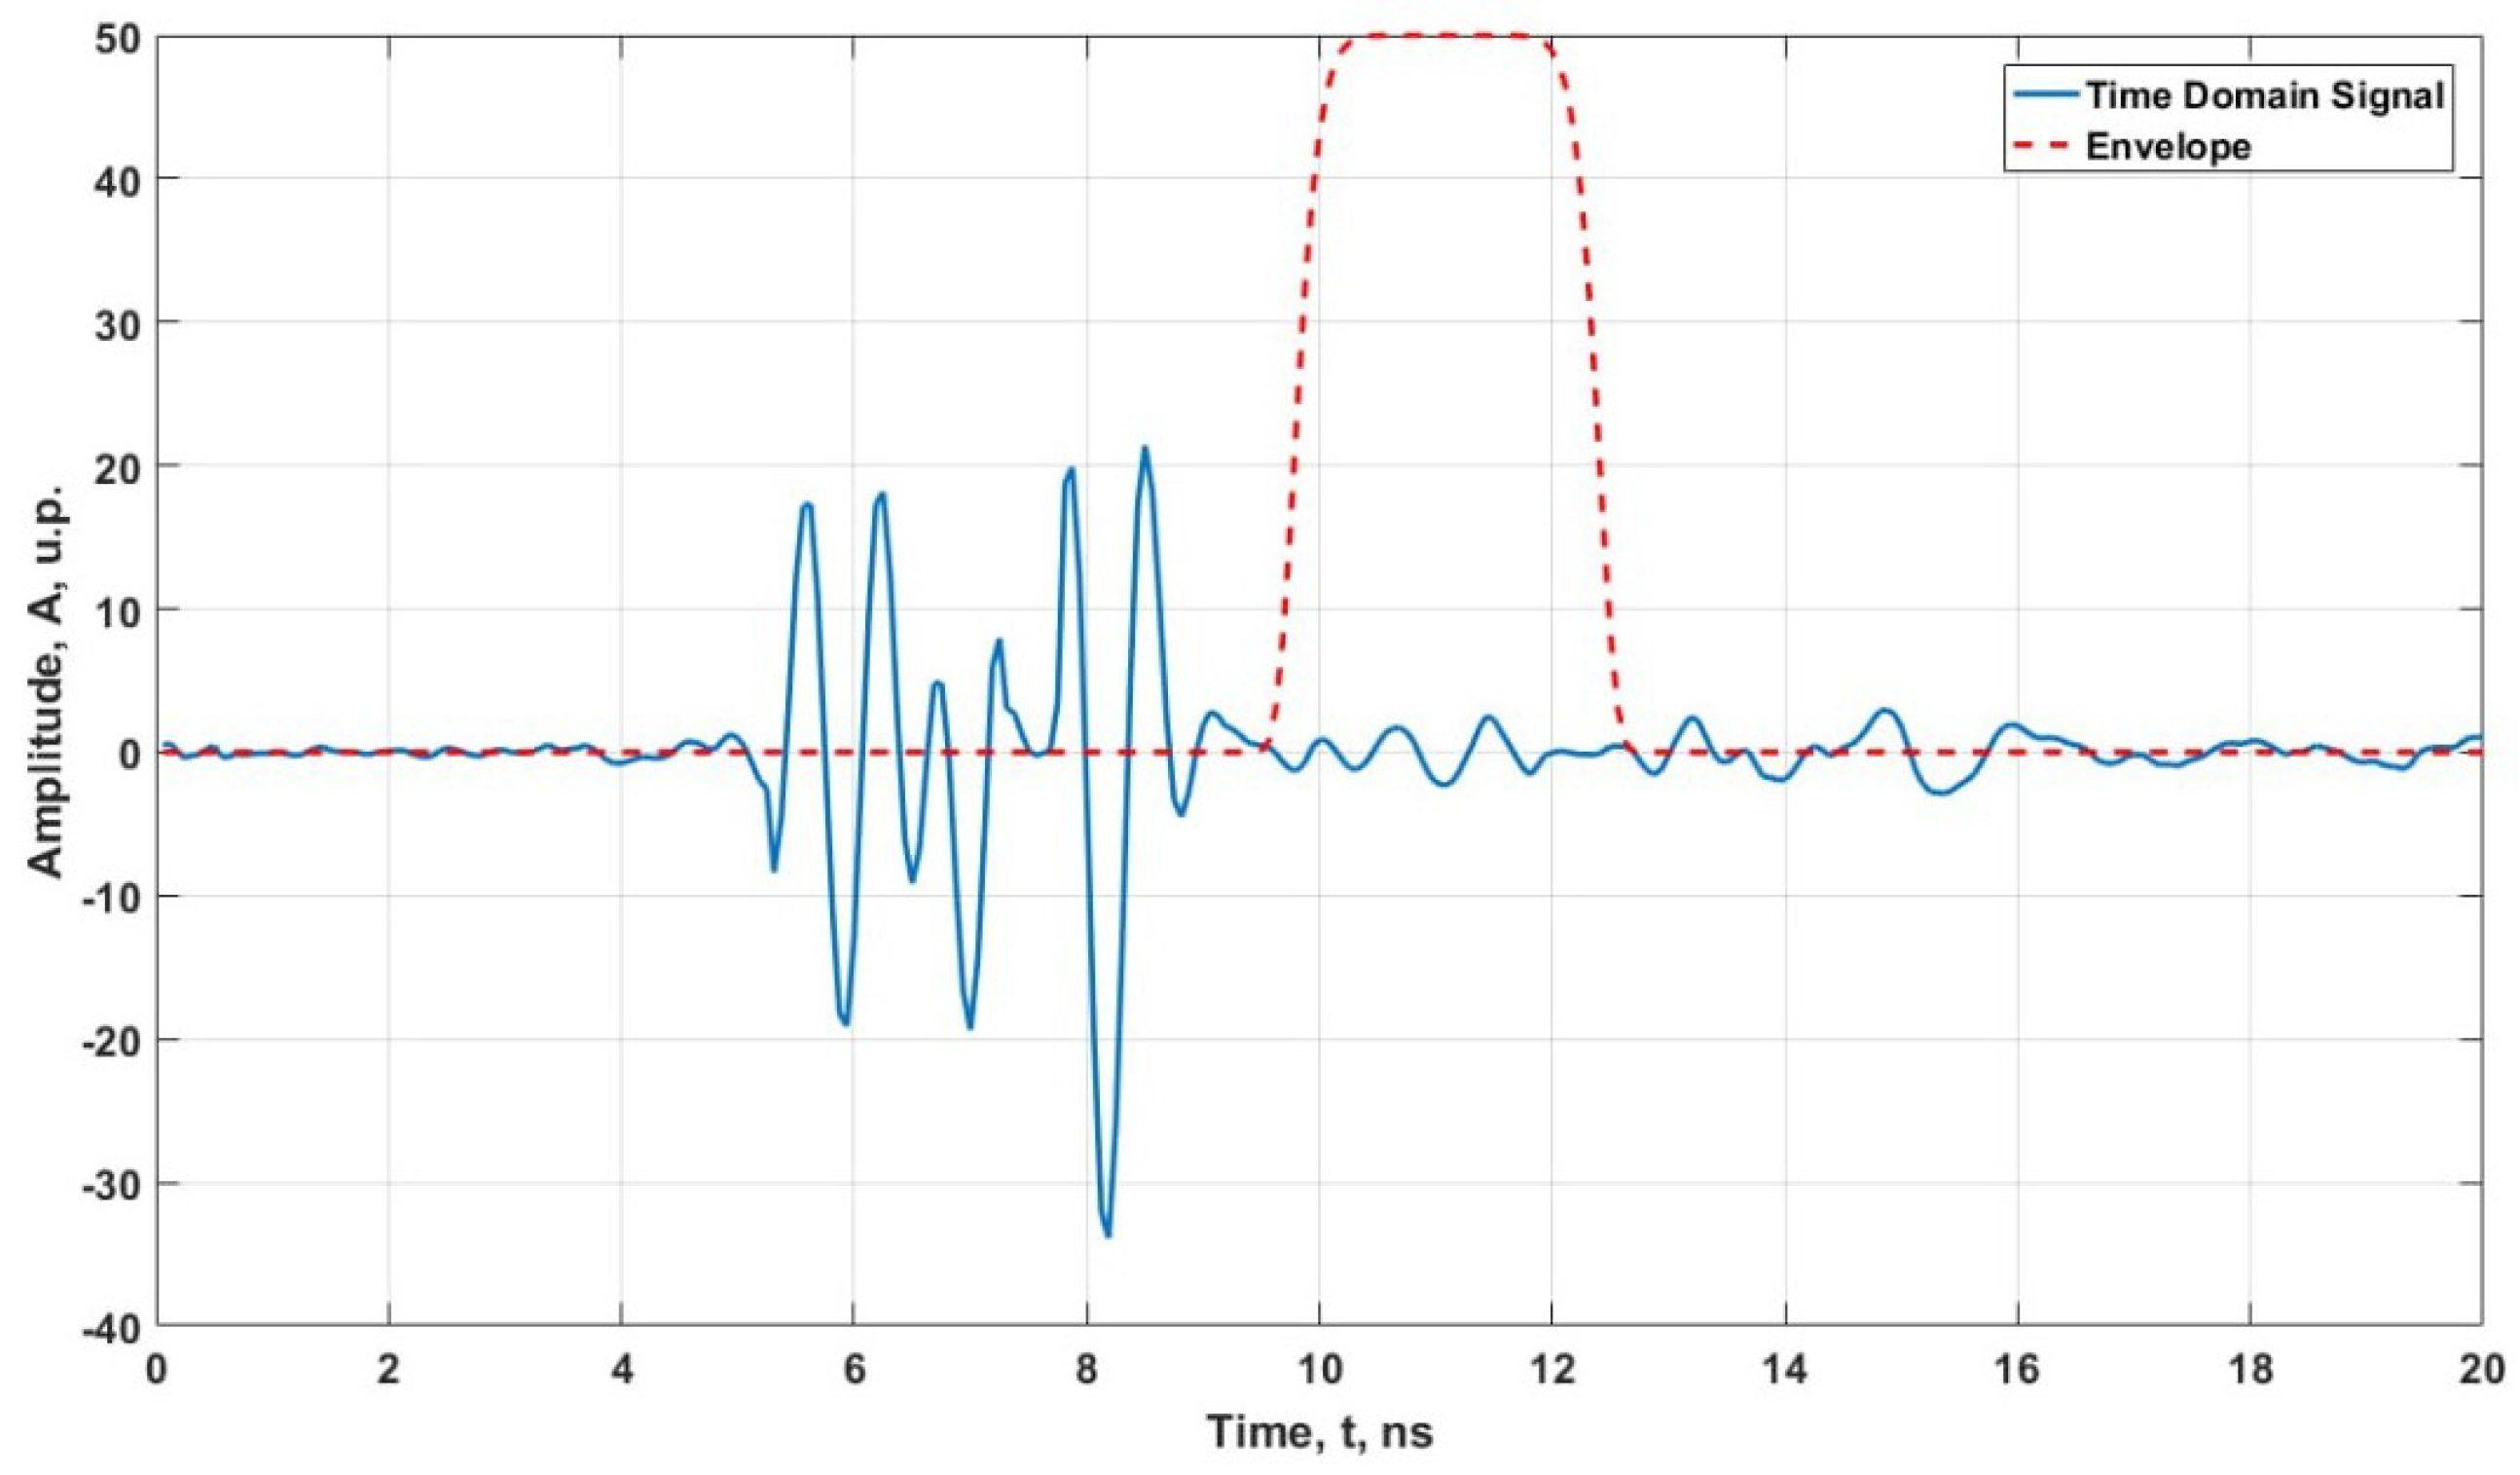
The result obtained during the first iteration makes it possible to isolate the upper layer of the road surface in the signal. The third layer also begins to manifest more distinctly. We perform the second iteration of filtering out coherent clutter. For this, we use a window function to isolate the beginning of the second layer on the reference signal (see Figure 9). Next, we carry out the same sequence of operations on the radargrams as in the first iteration. As a result, we obtain the set of radargrams shown in Figure 10.
On the radargram, the third layer of the road surface becomes clearly visible. One more iteration of interference filtering is performed by setting the window function for the third layer (Figure 11). As a result, we obtain a radargram in which three layers of the road surface are distinctly highlighted (Figure 12).
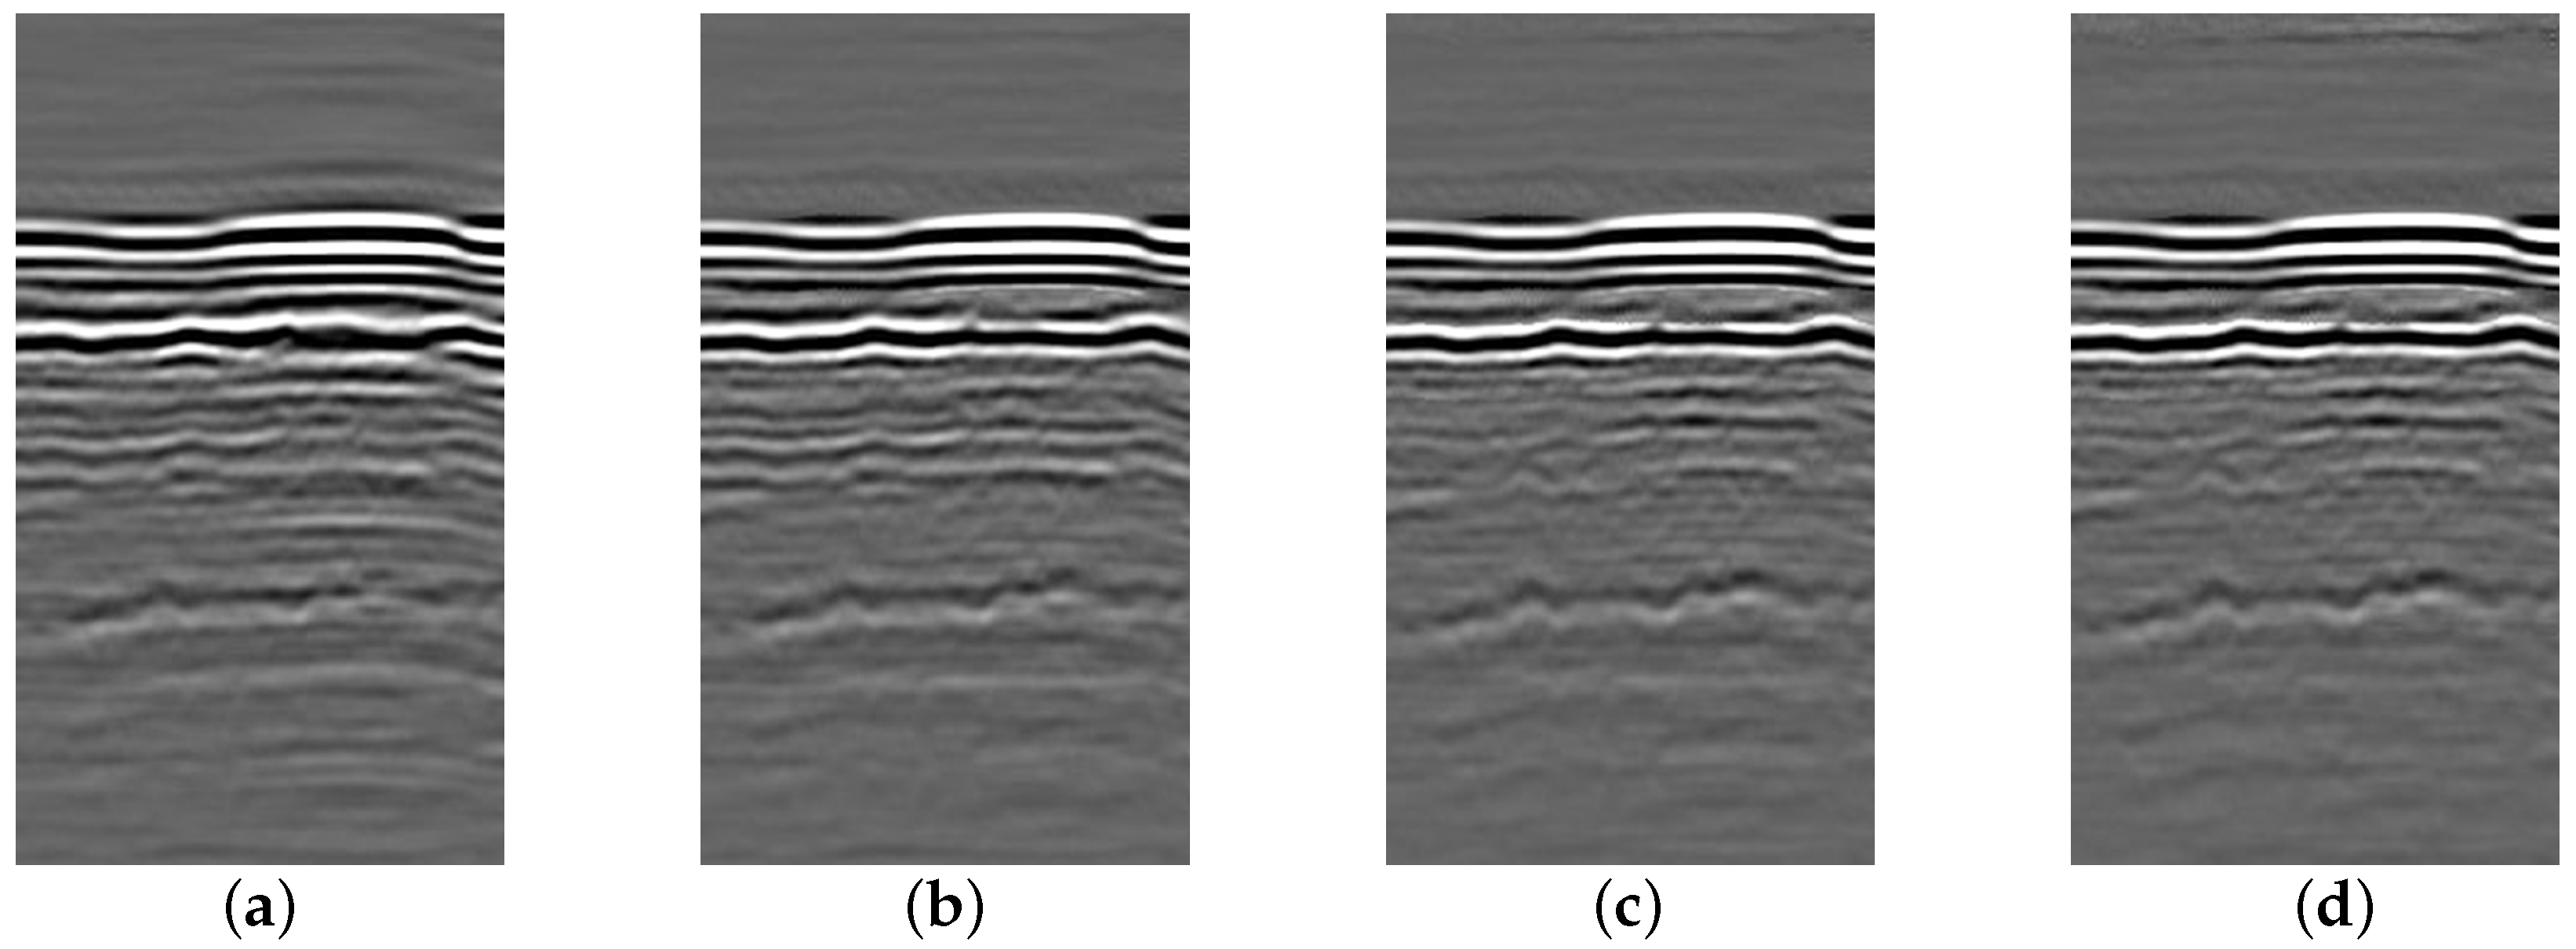
The dynamics of filtering over three iterations are shown in Figure 13.
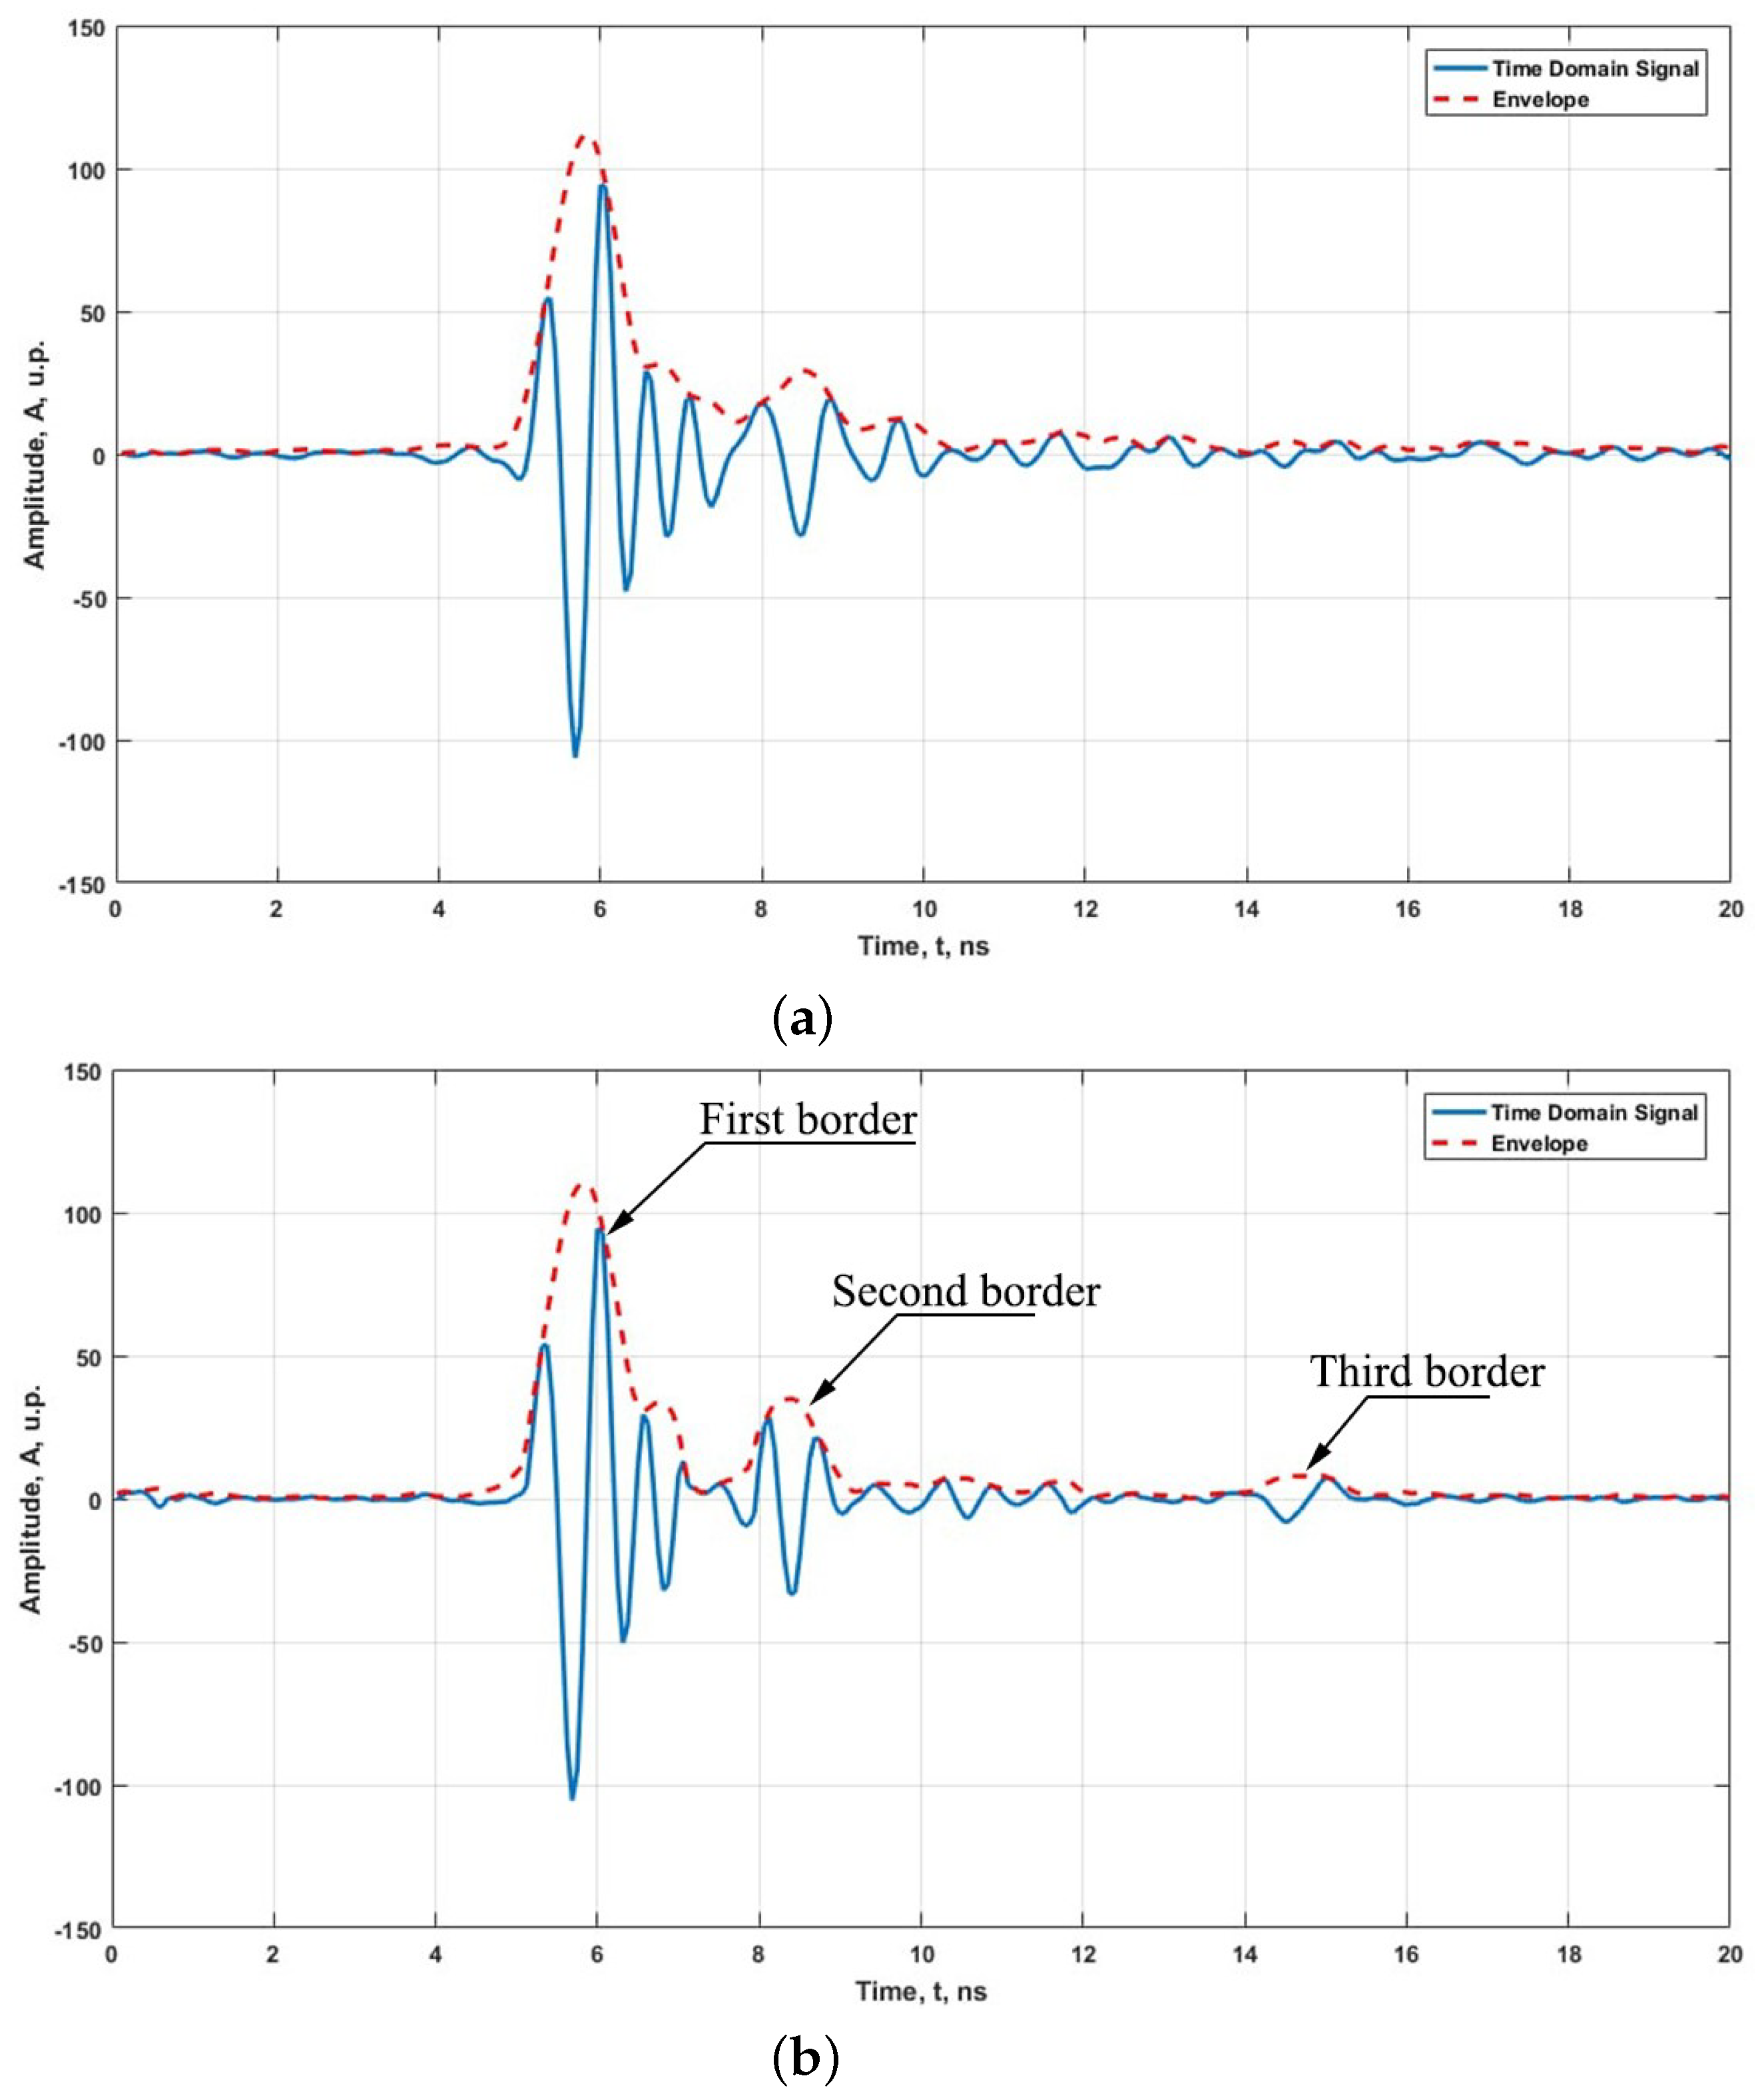
Let us compare the ability to determine the boundaries of road layers using raw and processed data. As an example, we highlight one of the signal realizations (red dashed line in Figure 14) and present the temporal waveforms of signals corresponding to this realization.
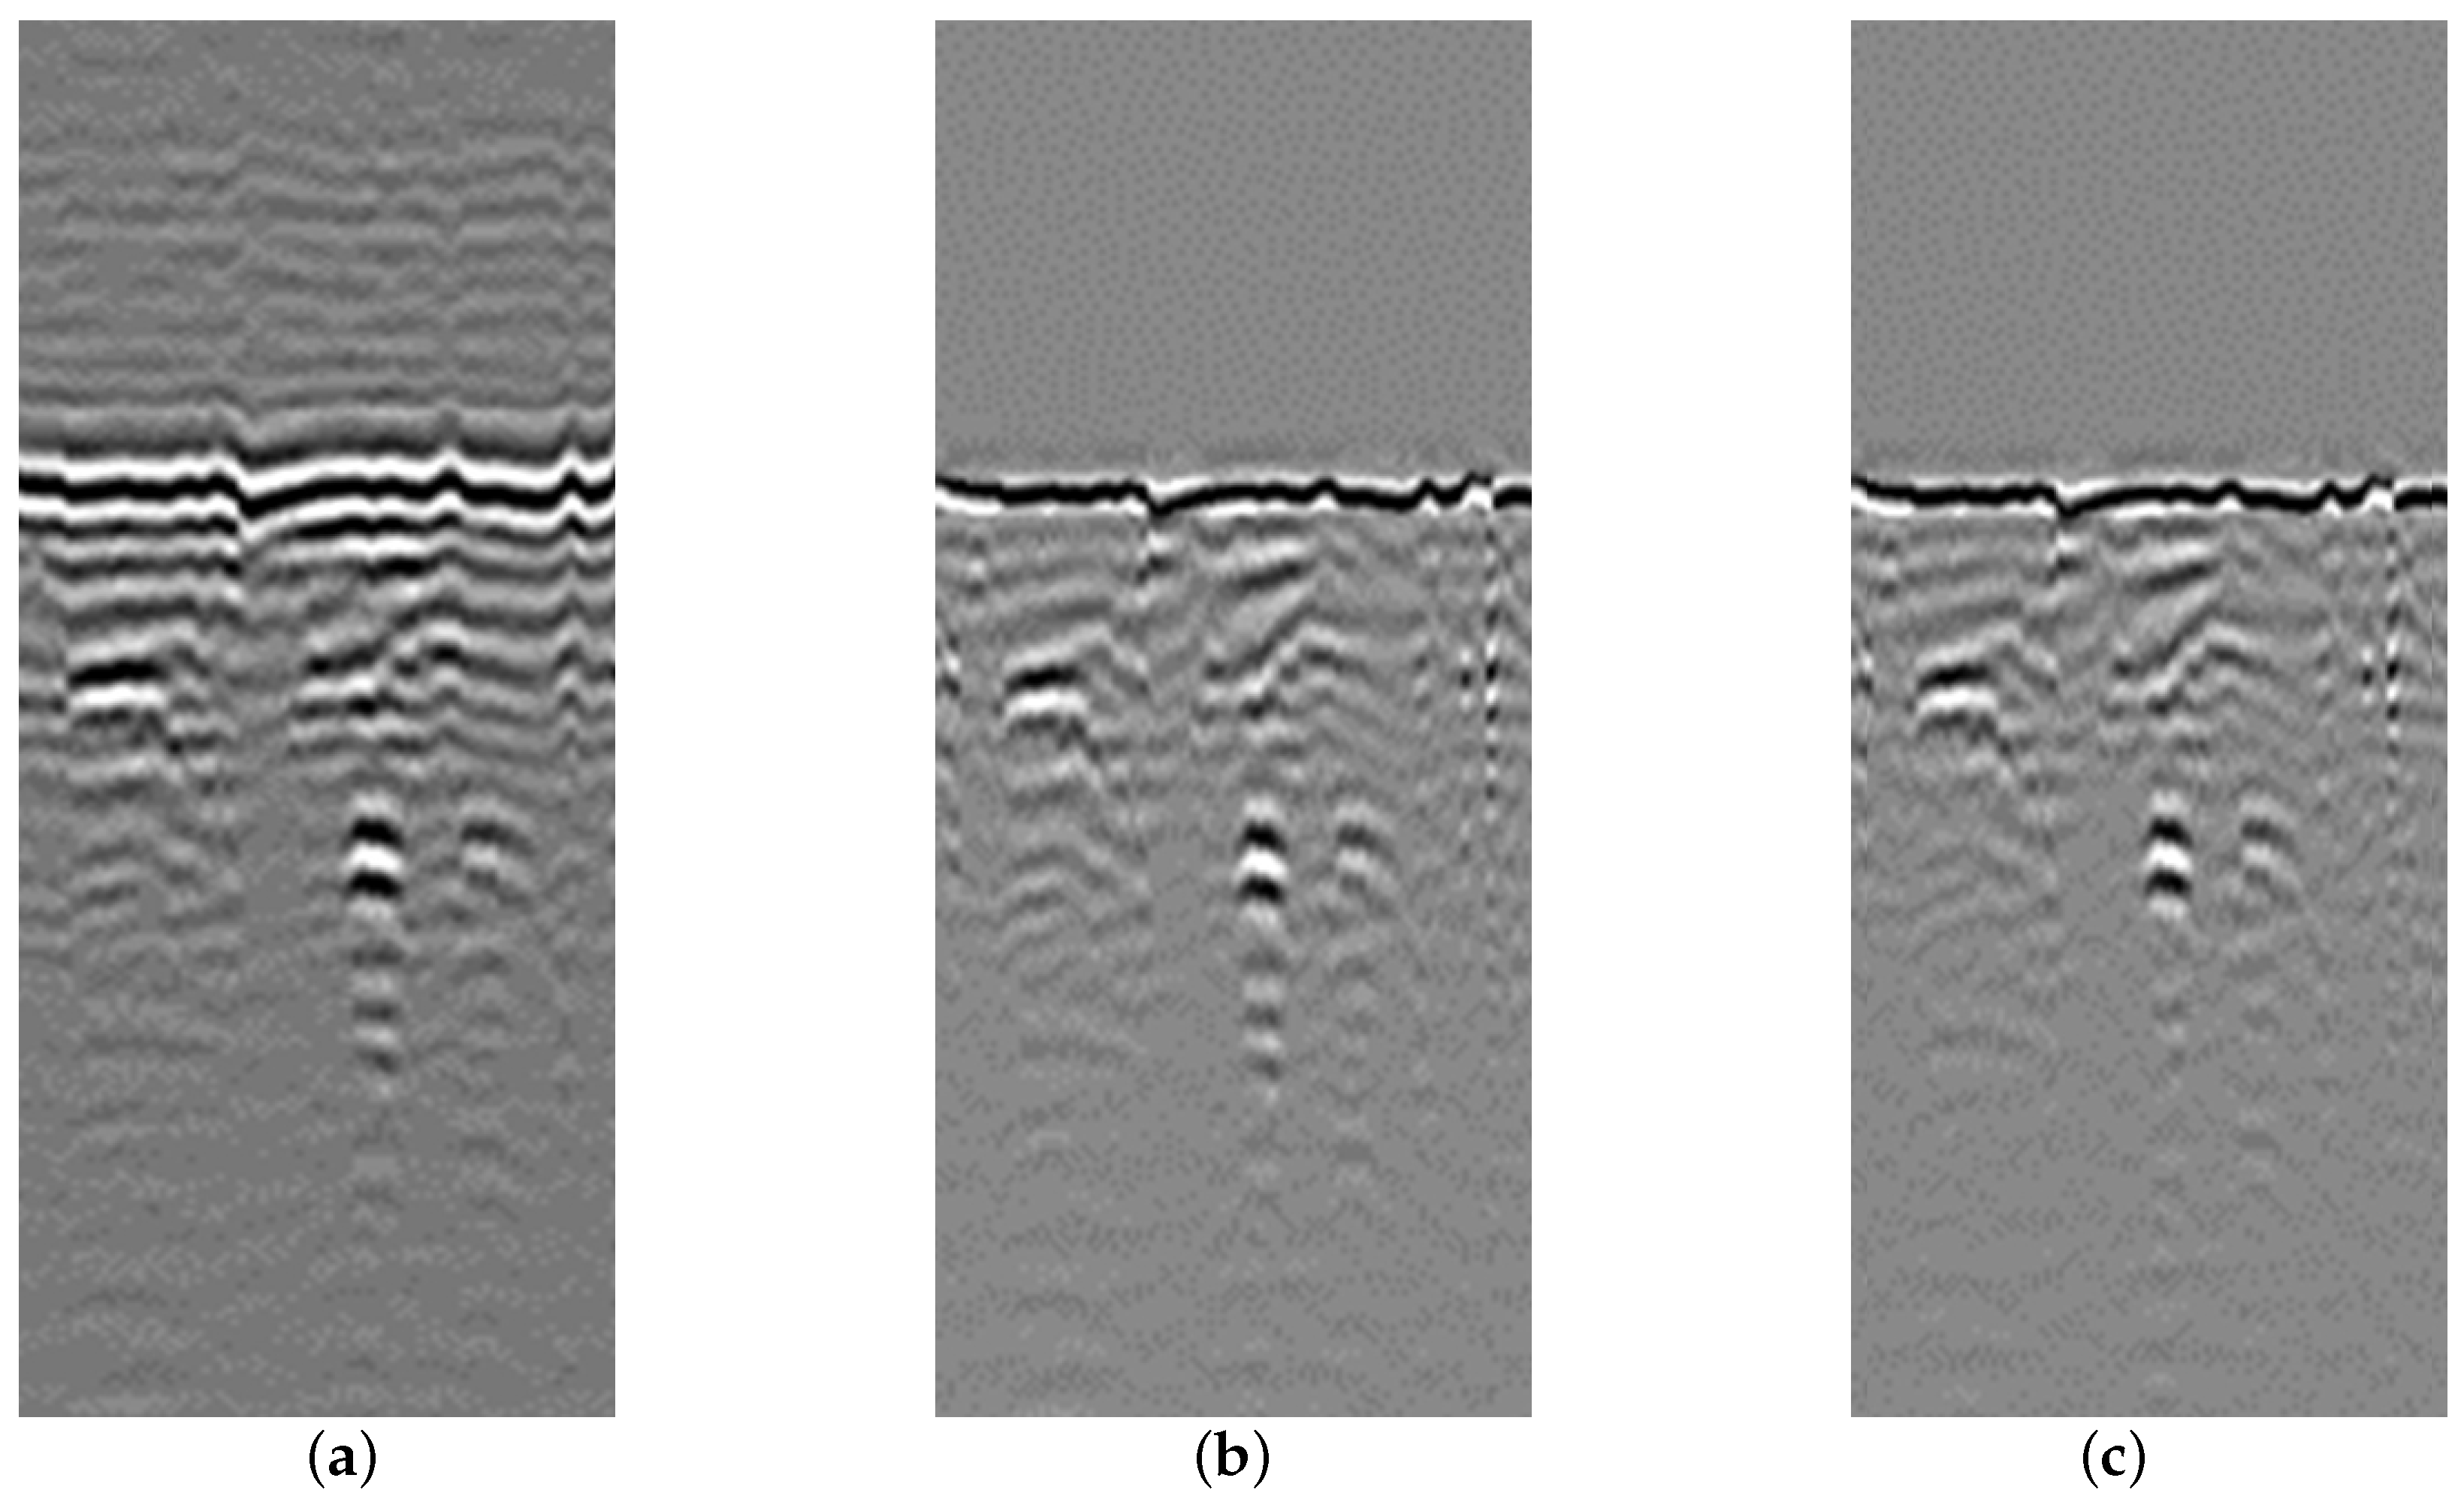
Figure 14 shows that the localization of peaks corresponding to three layers significantly increases after filtering, which allows us to speak not only about the increased accuracy of determining the boundary location but also, in some cases, about the possibility of layer separation. This last feature gives hope for the application of this technology as a preliminary filter in the task of layer boundary construction using neural networks. Figure 15 shows an example of using the proposed method of filtering in-phase interferences to highlight an object, i.e., a sewage pipe.
Figure 15 shows an increase in the contrast of the object after filtering, which also allows for the application of neural network technologies for the automatic detection of similar objects in the processing of large datasets.

4. Ways to Calibrate Ground-Penetrating Radar Data

The initial ground-penetrating radar profile constructed in the time domain reflects, on the horizontal scale, the number of samples along the scanning profile with respect to the traversed distance and, on the vertical scale, the time of propagation of the electromagnetic wave in the subsurface medium. Dependence (8) is used to convert the vertical axis from time to depth in ground-penetrating radar data, (Report on the conducted experimental comparative georadiolocation surveys of the section of the M-12 highway/Federal Agency for Road Maintenance “Russian Road Research Institute”/Moscow 2022):
H = v × t 2
where H is the depth of the object, t is the time of the electromagnetic wave propagation from the emitting antenna of the ground-penetrating radar to the object and back to the receiving antenna, and V is the speed of the electromagnetic wave calculated using Formula (9):
v = c ε r e l
where c is the speed of electromagnetic wave propagation in vacuum (speed of light), which is 30 cm/ns, and ε r e l is the relative dielectric permittivity of the layer material.
To determine the relative dielectric permittivity of the layer material, the following approaches can be used (Report on the conducted experimental comparative georadar surveys of the section of the M-12 highway/Federal Road Agency “Russian Road Research Institute”/Moscow 2022):
  • Based on the hyperbola of the diffracted wave generated from a local object, the dimensions of which are smaller or comparable to the wavelength;
  • Based on drilling data;
  • Based on archive reference data;
  • Using the common midpoint method, whereby the travel times of the electromagnetic waves are measured at different distances between the receiving and transmitting antennas of the georadar.
Of all the approaches described above, calibrating georadar data based on drilling results is the most common and accurate.

4.1. Calibration of GPR Data Based on Drilling Results

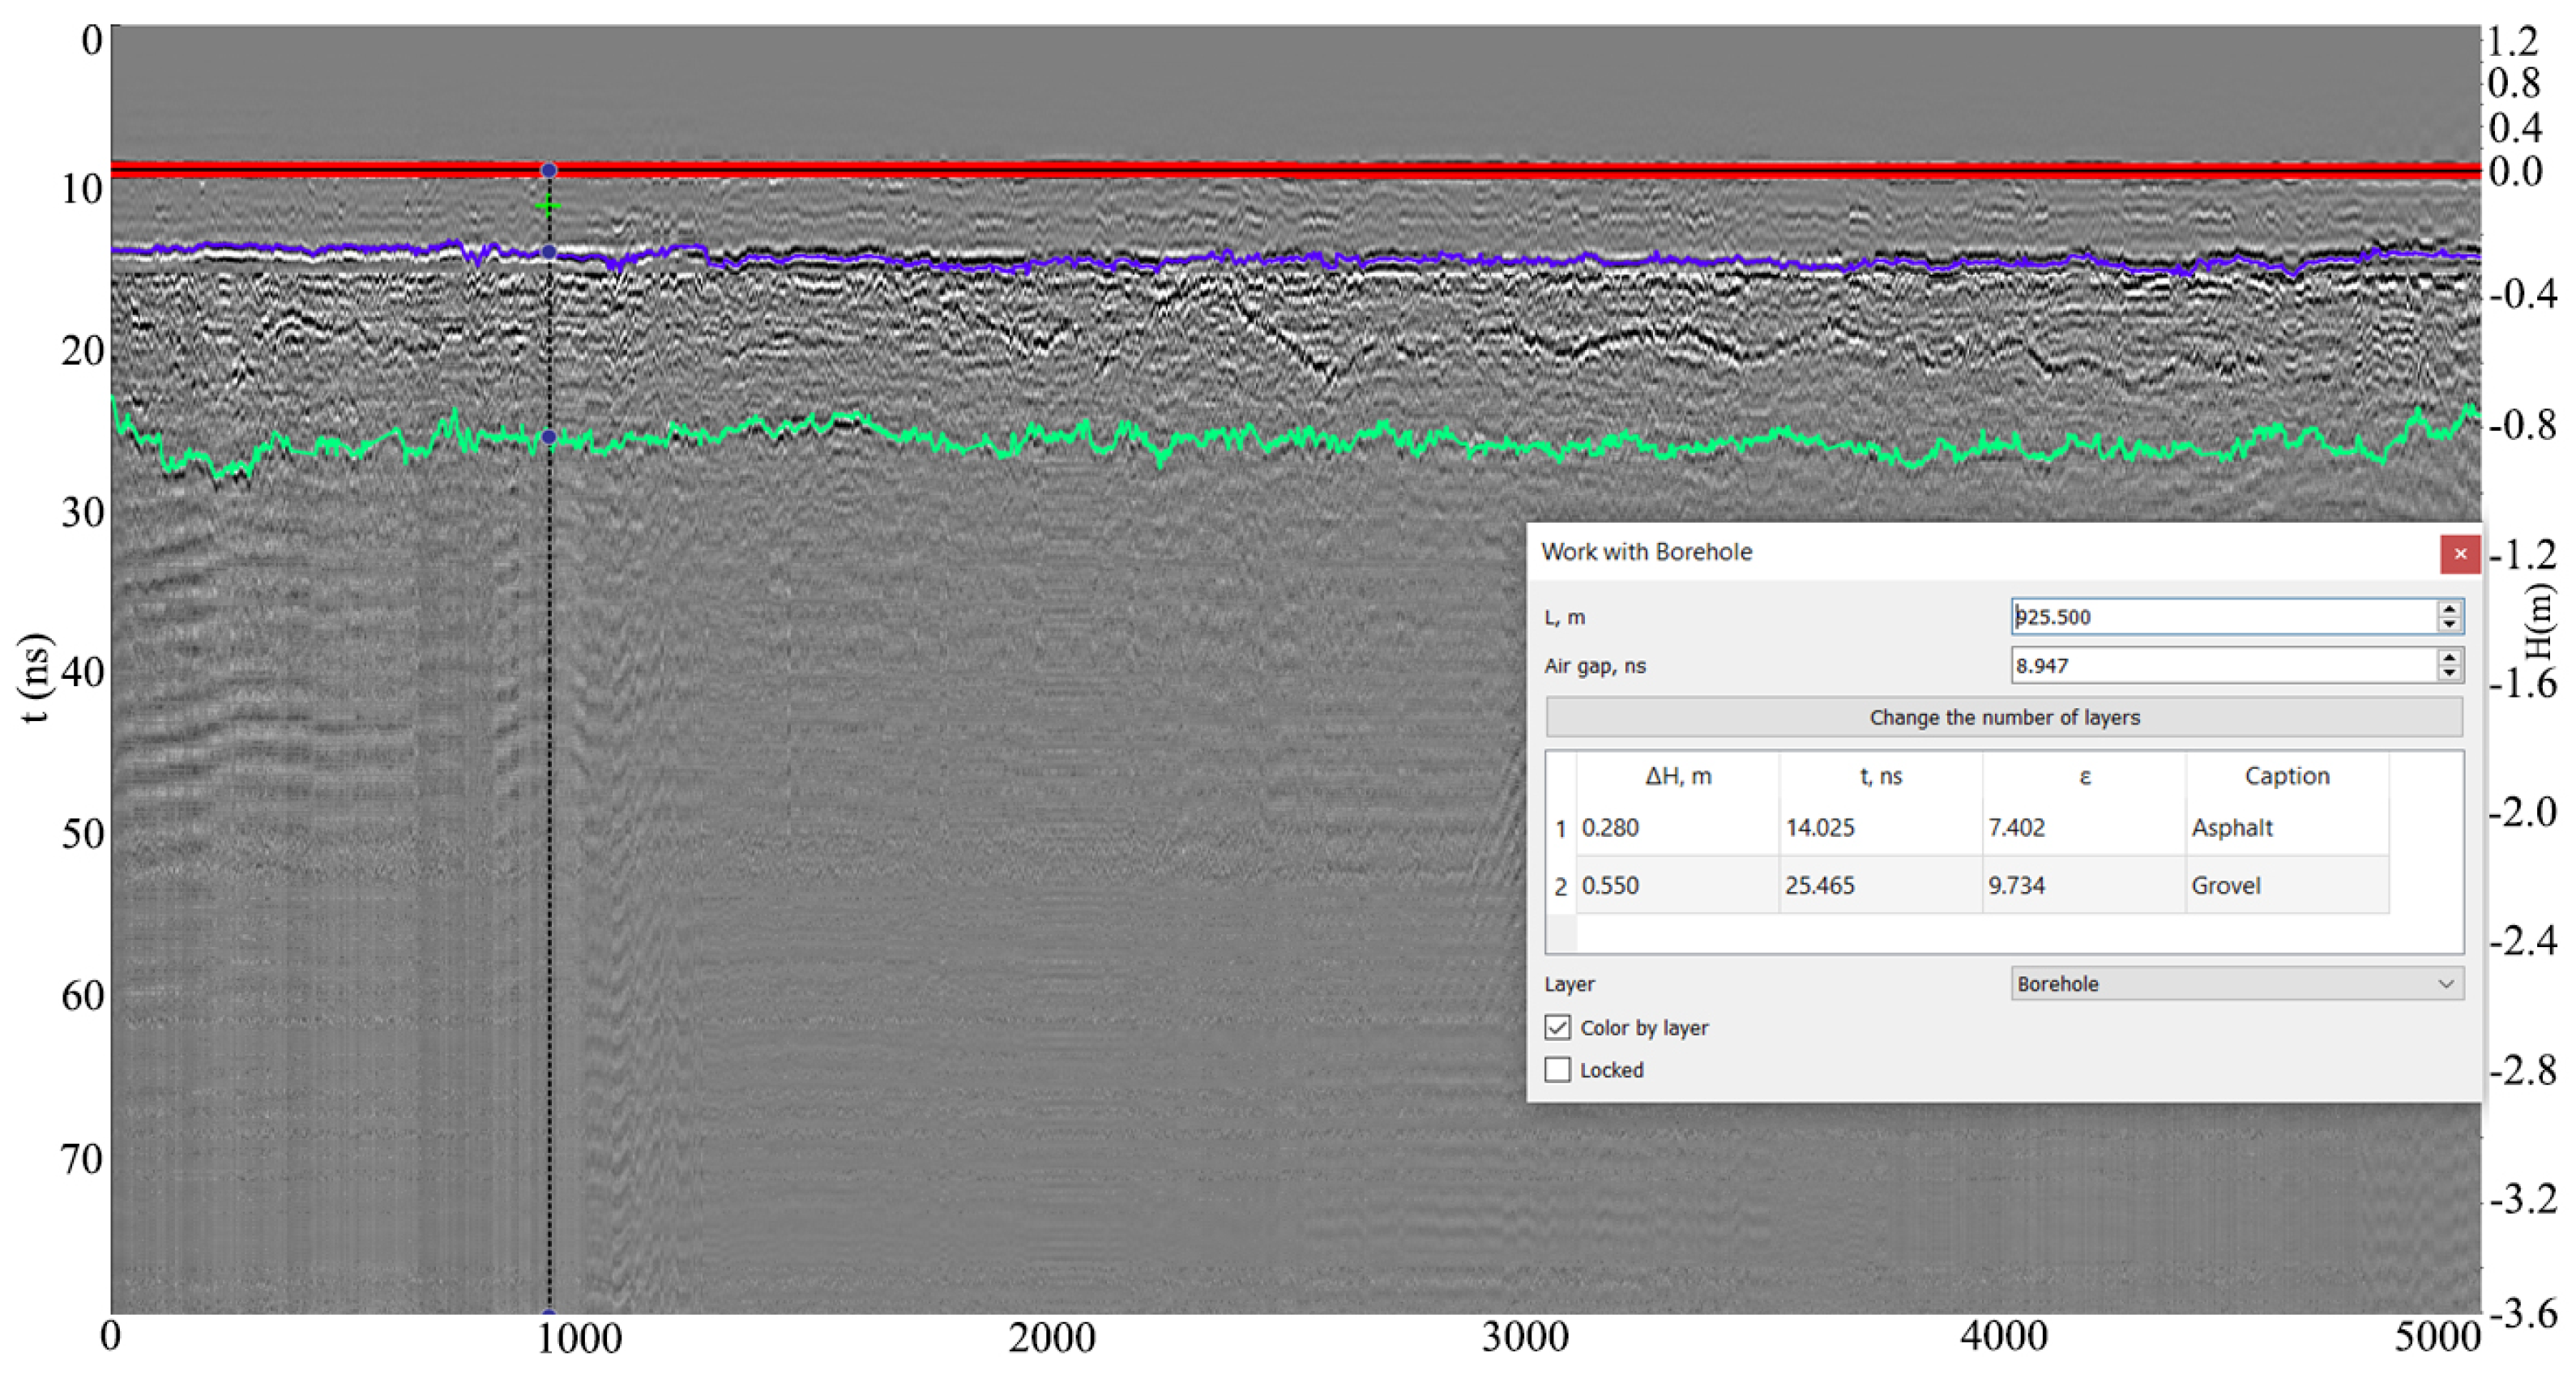
The methodology for calibrating GPR data using “Terrazond” equipment involves data processing in GeoReader software [31]. After drawing the boundaries of pavement layers on the GPR profile, the user identifies the location of the borehole (Figure 16). The red blue and green lines show the boundaries of the pavement layers. The borehole parameters specify the layer thicknesses based on drilling results, and the soil model is recalculated. The software recalculates the pavement layer thickness at each point of the GPR profile with respect to the calibration borehole. The survey results are exported in a test file format with linear and coordinate referencing or a spatial digital model.

4.2. Verification of the Results of Ground-Penetrating Radar Determination of the Thickness of Road Construction Layers

The first verification of Terrazond georadar data regarding the thickness of road construction layers was carried out within the framework of comparative studies of georadar devices from different manufacturers at the experimental test site for geosynthetic materials in 2019 (Research report. Results of work at the “A-107 Moscow Small Ring Road between Kiev and Minsk highways, near the village of Kobyakovo and NII Radio” site using Falling Weight Deflectometer (FWD) and georadars. Book 1/Russian Road Research Institute/Moscow 2019). As part of the event, all participants who collected data using their own georadar equipment were invited to determine the thickness of road construction layers at certain locations on the road. The organizer marked out five locations for drilling and sampling of materials of road construction layers. Participants were provided with information on layer thickness at three of these locations to calibrate the results of georadar surveys. The results obtained by participants at the remaining two locations were subject to verification by the event organizer. The results of determining the thickness of the asphalt concrete layer package of the road structure by the “Terrazond” series ground-penetrating radar (GPR) are presented in Table 1.
Table 1 shows that the maximum error in determining the thickness of asphalt concrete using the “Terrazond” ground-penetrating radar did not exceed 0.5 cm or 5%.

5. Conclusions

A method for eliminating coherent interference in road surface radargrams was developed. This method was tested on the results of probing a test site of the M-12 highway/Federal Road Agency “Russian Road Research Institute”/Moscow 2022. This work describes the sequence of mathematical operations that provide filtration in detail. Using the radargram of the test site as an example, we showed that three iterations of the proposed filtration method distinctly identify three layers of the road surface. The methodology of comparing the obtained thickness data with the results obtained during core drilling by the Russian Road Research Institute was used for calibration and verification of the data. According to the comparison, the maximum error in determining the thickness of asphalt concrete using the “Terrazond” ground-penetrating radar did not exceed 0.5 cm or 5%. Therefore, the comparison of the data obtained by the ground-penetrating radar with the core measurements demonstrates the possibility of using this method for the survey of urban roads and streets to determine the thickness of the road surface. By utilizing specialized software mapping algorithms to contrast areas of the radargram, as well as mathematical calculation of the electromagnetic properties using the common midpoint method with a multichannel ground-penetrating radar device, it is possible to determine the actual thickness of the structural layers of road surfaces.

Author Contributions

Conceptualization, A.G. and V.K.; methodology, S.S.; software, A.G.; validation, I.T., A.E. and R.S.; formal analysis, S.S.; investigation, R.S.; resources, A.G.; data curation, A.E.; writing—original draft preparation, A.G.; writing—review and editing, I.F.; visualization, A.G.; supervision, D.R.; project administration, A.G.; funding acquisition, R.E. All authors have read and agreed to the published version of the manuscript.

Funding

This work was supported by Russian Science Foundation grant No. 22-22-20101, “Development of methods for identifying potentially dangerous sections on highways using georadio tomography”, and by the Administration of the Tomsk Region.

Data Availability Statement

Not applicable.

Conflicts of Interest

The authors declare no conflict of interest. The funders had no role in the design of the study; in the collection, analyses, or interpretation of data; in the writing of the manuscript; or in the decision to publish the results.

References

  1. Lu, Y.; Song, W.; Lu, J.; Wang, X.; Tan, Y. An examination of soil moisture estimation using ground-penetrating radar in desert steppe. Water 2017, 9, 521. [Google Scholar] [CrossRef]
  2. Neal, A. Ground-penetrating radar and its use in sedimentology: Principles, problems and progress. Earth-Sci. Rev. 2004, 66, 261–330. [Google Scholar] [CrossRef]
  3. Downs, C.; Jazayeri, S. Resolution enhancement of deconvolved ground-penetrating radar images using singular value decomposition. J. Appl. Geophys. 2021, 193, 104401. [Google Scholar] [CrossRef]
  4. Zoubir, A.M.; Chant, I.J.; Brown, C.L.; Barkat, B.; Abeynayake, C. Signal processing techniques for landmine detection using impulse ground-penetrating radar. IEEE Sens. J. 2002, 2, 41–51. [Google Scholar] [CrossRef]
  5. Klotzsche, A.; van der Kruk, J.; Meles, G.A.; Doetsch, J.; Maurer, H.; Linde, N. Full-waveform inversion of cross-hole ground-penetrating radar data to characterize a gravel aquifer close to the Thur River, Switzerland. Near Surf. Geophys. 2010, 8, 635–649. [Google Scholar] [CrossRef]
  6. Shrestha, S.M.; Arai, I.; Miwa, T. Application possibilities of super-resolution technique for GPR imaging. In Proceedings of the Ninth International Conference on Ground-Penetrating Radar, Santa Barbara, CA, USA, 29 April–2 May 2002; Volume 4758, pp. 508–513. [Google Scholar]
  7. Shrestha, S.M.; Arai, I. Signal processing of ground-penetrating radar using spectral estimation techniques to estimate the position of buried targets. EURASIP J. Adv. Signal Process. 2003, 2003, 1–12. [Google Scholar] [CrossRef]
  8. Waters, K.R.; Mobley, J.; Miller, J.G. Causality-imposed (Kramers-Kronig) relationships between attenuation and dispersion. IEEE Trans. Ultrason. Ferroelectr. Freq. Control. 2005, 52, 822–823. [Google Scholar] [CrossRef]
  9. Bradford, J.H. Frequency-dependent attenuation analysis of ground-penetrating radar data. Geophysics 2007, 72, J7–J16. [Google Scholar] [CrossRef]
  10. Teixeira, F.L.; Chew, W.C.; Straka, M.; Oristaglio, M.; Wang, T. Finite-difference time-domain simulation of ground-penetrating radar on dispersive, inhomogeneous, and conductive soils. IEEE Trans. Geosci. Remote Sens. 1998, 36, 1928–1937. [Google Scholar] [CrossRef]
  11. Koshelev, V.; Sarychev, V.; Shipilov, S. Using the kramers-kronig relation for estimation of the impulse responses of extra-wide-band systems. Radiophys. Quantum Electron. 2000, 43, 390–395. [Google Scholar] [CrossRef]
  12. Gao, K.; Donahue, C.M.; Henderson, B.G.; Modrak, R.T. SREMI: Super-resolution electromagnetic imaging with single-channel ground-penetrating radar. J. Appl. Geophys. 2022, 205, 104777. [Google Scholar] [CrossRef]
  13. Miwa, T.; Arai, I. Super-resolution imaging for point reflectors near transmitting and receiving array. IEEE Trans. Antennas Propag. 2004, 52, 220–229. [Google Scholar] [CrossRef]
  14. Qu, L.; Sun, Q.; Yang, T.; Zhang, L.; Sun, Y. Time-delay estimation for ground-penetrating radar using ESPRIT with improved spatial smoothingtechnique. IEEE Geosci. Remote Sens. Lett. 2013, 11, 1315–1319. [Google Scholar]
  15. Friedt, J.M.; Saintenoy, A.; Chrétien, S.; Baron, T.; Lebrasseur, E.; Laroche, T.; Ballandras, S.; Griselin, M. High-overtone bulk acoustic resonator as passive ground-penetrating RADAR cooperative targets. J. Appl. Phys. 2013, 113, 134904. [Google Scholar] [CrossRef]
  16. Liu, Z.; Gu, X.; Chen, J.; Wang, D.; Chen, Y.; Wang, L. Automatic recognition of pavement cracks from combined GPR B-scan and C-scan images using multiscale feature fusion deep neural networks. Autom. Constr. 2023, 146, 104698. [Google Scholar] [CrossRef]
  17. Le Bastard, C.; Wang, Y.; Baltazart, V.; Derobert, X. Time delay and permittivity estimation by ground-penetrating radar with support vector regression. IEEE Geosci. Remote Sens. Lett. 2013, 11, 873–877. [Google Scholar] [CrossRef]
  18. Kang, M.S.; Kim, N.; Lee, J.J.; An, Y.K. Deep learning-based automated underground cavity detection using three-dimensional ground-penetrating radar. Struct. Health Monit. 2020, 19, 173–185. [Google Scholar] [CrossRef]
  19. Yang, X.; Guan, J.; Ding, L.; You, Z.; Lee, V.C.; Hasan, M.R.M.; Cheng, X. Research and applications of artificial neural network in pavement engineering: A state-of-the-art review. J. Traffic Transp. Eng. 2021, 8, 1000–1021. [Google Scholar] [CrossRef]
  20. Liang, X.; Yu, X.; Chen, C.; Jin, Y.; Huang, J. Automatic Classification of Pavement Distress Using 3D Ground-Penetrating Radar and Deep Convolutional Neural Network. IEEE Trans. Intell. Transp. Syst. 2022, 23, 22269–22277. [Google Scholar] [CrossRef]
  21. Li, Y.; Liu, C.; Yue, G.; Gao, Q.; Du, Y. Deep learning-based pavement subsurface distress detection via ground penetrating radar data. Autom. Constr. 2022, 142, 104516. [Google Scholar] [CrossRef]
  22. Tong, Z.; Yuan, D.; Gao, J.; Wei, Y.; Dou, H. Pavement-distress detection using ground-penetrating radar and network in networks. Constr. Build. Mater. 2020, 233, 117352. [Google Scholar] [CrossRef]
  23. Torbaghan, M.E.; Li, W.; Metje, N.; Burrow, M.; Chapman, D.N.; Rogers, C.D. Automated detection of cracks in roads using ground-penetrating radar. J. Appl. Geophys. 2020, 179, 104118. [Google Scholar] [CrossRef]
  24. Zhao, S.; Al-Qadi, I. Pavement drainage pipe condition assessment by GPR image reconstruction using FDTD modeling. Constr. Build. Mater. 2017, 154, 1283–1293. [Google Scholar] [CrossRef]
  25. Liu, H.; Deng, Z.; Han, F.; Xia, Y.; Liu, Q.H.; Sato, M. Time-frequency analysis of air-coupled GPR data for identification of delamination between pavement layers. Constr. Build. Mater. 2017, 154, 1207–1215. [Google Scholar] [CrossRef]
  26. Diamanti, N.; Redman, D. Field observations and numerical models of GPR response from vertical pavement cracks. J. Appl. Geophys. 2012, 81, 106–116. [Google Scholar] [CrossRef]
  27. Khamzin, A.K.; Varnavina, A.V.; Torgashov, E.V.; Anderson, N.L.; Sneed, L.H. Utilization of air-launched ground-penetrating radar (GPR) for pavement condition assessment. Constr. Build. Mater. 2017, 141, 130–139. [Google Scholar] [CrossRef]
  28. Zhang, Y.; Xia, T. Extracting sparse crack features from correlated background in ground penetrating radar concrete imaging using robust principal component analysis technique. In Proceedings of the Nondestructive Characterization and Monitoring of Advanced Materials, Aerospace, and Civil Infrastructure 2016, Las Vegas, NV, USA, 21–24 March 2016; Volume 9804, p. 980402. [Google Scholar]
  29. Ahmed, M.; Tarefder, R.; Maji, A. Incorporating transmitter–receiver offset to interpret pavement layer thicknesses by GPR. Case Stud. Nondestruct. Test. Eval. 2016, 6, 94–104. [Google Scholar] [CrossRef]
  30. Romanov, D.; Zykov, A.; Fedyanin, I.; Sukhobok, Y.A. Experimental Investigations of a Possibility of Determining the Physical and Electrophysical Properties of Multilayer Media Using Radiowave Tomography. Russ. Phys. J. 2020, 63, 214–220. [Google Scholar] [CrossRef]
  31. Sukhobok, Y.A.; Kurbatov, M.S. Software for information modeling of georadar data GeoReader. CAD GIS Roads 2019, 2, 26–31. [Google Scholar] [CrossRef]
Figure 1. The appearance of the ground-penetrating radar (GPR): 1—antenna array; 2—connecting cables; 3—transceiver module; 4—GPS antenna.
Remotesensing 15 02751 g001
Figure 2. Illustration of the multichannel mode of “Terrazond” ground-penetrating radar. Radarograms when driving 2.5 m (a). Ground-penetrating radar program window (b).
Remotesensing 15 02751 g002
Figure 3. Structural diagram of the device.
Remotesensing 15 02751 g003
Figure 4. The arrangement of the radar antenna array on the road laboratory vehicle of the Russian Road Research Institute.
Remotesensing 15 02751 g004
Figure 5. Model of a two-layer medium.
Remotesensing 15 02751 g005
Figure 6. The set of original radargrams of a 160-meter section of the road.
Remotesensing 15 02751 g006
Figure 7. Temporal shape of the reference signal and window function for the first layer.
Remotesensing 15 02751 g007
Figure 8. Radargram of the road section after the first iteration of clutter filtering.
Remotesensing 15 02751 g008
Figure 9. Temporal shape of the reference signal and window function for the second layer.
Remotesensing 15 02751 g009
Figure 10. Radargram of the road section after the second iteration of interference filtering.
Remotesensing 15 02751 g010
Figure 11. Time waveform of the reference signal and window function for the third layer.
Remotesensing 15 02751 g011
Figure 12. Radargram of the road section after the third iteration of clutter filtering.
Remotesensing 15 02751 g012
Figure 13. The dynamics of filtering over three iterations, where (a) represents the initial data, (b) shows the data after applying the filter for the first layer, (c) shows the data after applying the filter for the second layer, and (d) shows the data after applying the filter for the third layer.
Remotesensing 15 02751 g013
Figure 14. Comparison of signal waveforms before (a) and after (b) applying the method of in-phase interference filtering.
Remotesensing 15 02751 g014
Figure 15. The result of filtering (a) original data, (b) data after applying the first boundary filtering, and (c) data after applying the second boundary filtering.
Remotesensing 15 02751 g015
Figure 16. Calibration of the ground-penetrating radar profile using borehole data.
Remotesensing 15 02751 g016
Table 1. The results of determining the thickness of the package of asphalt concrete layers of the road structure using “Terrazond” georadar.
Measuring Point No.Point AssignmentLayer Thickness, cmDiscrepancy
Drilling MeasurementMeasurement by GPR Series GRT-3cm%
1Verification11.511.9−0.4−3.48
2Calibration11.010.50.54.55
3Calibration11.011.3−0.3−2.73
4Calibration13.013.4−0.4−3.08
5Verification11.011.5−0.5−4.55
Disclaimer/Publisher’s Note: The statements, opinions and data contained in all publications are solely those of the individual author(s) and contributor(s) and not of MDPI and/or the editor(s). MDPI and/or the editor(s) disclaim responsibility for any injury to people or property resulting from any ideas, methods, instructions or products referred to in the content.