Article

Comparisons of the Urbanization Effect on Heat Stress Changes in Guangdong during Different Periods

1
School of Atmospheric Sciences, Sun Yat-sen University, Key Laboratory of Tropical Atmosphere-Ocean System, Ministry of Education, Zhuhai 519082, China
2
College of Geographical Science, Inner Mongolia Normal University, Hohhot 010022, China
3
Tianjin Meteorological Information Center, Tianjin Meteorological Bureau, Tianjin 300074, China
4
School of Geographical Sciences, Nanjing University of Information Science and Technology, Nanjing 210044, China
*
Authors to whom correspondence should be addressed.
These authors contributed equally to the work.
Current address: Southern Laboratory of Ocean Science and Engineering (Guangdong Zhuhai), Zhuhai 519082, China.
Remote Sens. 2023, 15(11), 2750; https://doi.org/10.3390/rs15112750
Submission received: 23 April 2023 / Revised: 20 May 2023 / Accepted: 23 May 2023 / Published: 25 May 2023
(This article belongs to the Special Issue Remote Sensing and Parameterization of Air-Sea Interaction)

Abstract

:
While rapid urbanization promotes social and economic development, it exacerbates human outdoor thermal comfort, which increases the risks to human health. This paper uses four thermal comfort indices and multiple satellite observations to explore the urbanization effect on summer heat stress in Guangdong from 1979–2018, a coastal province of China. Two types of thermal comfort index are used here, namely the direct thermal comfort index (Heat Index, HI; Temperature–Humidity Index, THI; Discomfort Index, DI) and the physiological thermal comfort index (Universal Thermal Climate Index, UTCI). We compare the differences in the urbanization effects on the changes in the three direct thermal comfort indices (HI, THI, and DI) and a physiological thermal comfort index (UTCI). The results show that all four thermal comfort indices indicate an overall warming trend. Of them, urban sites show a higher warming trend than rural sites, indicating that heat stress changes are significantly influenced by urbanization from 1979–2018, which is consistent with the effect of urbanization on surface air temperature. However, except for the UTCI, this warming of direct thermal comfort indices affected by urbanization has become insignificant under the regional vegetation greening from 2004–2018 (also consistent with surface air temperature). This is primarily attributed to the different effects of wind speed on the physiological thermal comfort index in urban and rural areas: Decreasing wind speeds in urban areas lead to an increase in UTCI, while wind speeds in rural areas increase instead and decrease UTCI, thus widening the UTCI differences between urban and rural areas. Our results indicate that urbanization has a different effect on thermal comfort indices. When using the thermal comfort index, it is necessary to consider that different thermal comfort indices may bring different results. UTCI considers more factors that affect human heat perception, so it can better describe human outdoor thermal comfort. It also highlights the importance of urban ventilation and urban greenness in mitigating urban outdoor thermal comfort in the sustainable construction of future urbanization in coastal cities.

Graphical Abstract

1. Introduction

The global warming caused by climate change, including the frequency of extreme events such as heat waves, has received widespread attention from governments, scientists, and the public. In urban areas, especially in faster-growing cities (or urban agglomerations), the warming is greatly amplified by the heat island effect, making city dwellers highly vulnerable to the combined effects of both [1,2]. China is the world’s most populous country, with approximately 59% of its population living in urban areas, and with increasing levels of urbanization, heat stress from rising urban temperatures can exacerbate people’s health risks [3]. The human body functions optimally in the range of 37 ± 1 °C. In scorching and humid climates, its ability to evaporate heat through sweat is reduced, causing heat stress and possibly inducing diabetes, respiratory diseases, cardiovascular diseases, and other disorders [4], and possibly even death [5,6,7]. With the adverse effects of excessive heat stress on rapidly growing urban populations, there is great concern about how heat stress affects productive life.
To better understand how heat stress affects people, several thermal comfort indices have been established to relate to the assessment of human thermal response and thermal strain [8,9,10,11]. Some researchers use meteorological parameters that determine the level of human thermal comfort, primarily considering atmospheric temperature and relative humidity, namely the direct thermal comfort index [8], which includes the Heat Index (HI) [12,13,14], the Temperature–Humidity Index (THI) [15], and the Discomfort Index (DI) [16]. Other researchers have concentrated on modeling and evaluation from a thermal-physiological perspective and physiological indicators [17]. Many studies have shown that solar radiation and wind have a great influence on human thermal comfort [18,19]. With the continuous progress of computers, combined with human physiological models [17], the International Society of Biometeorology proposed the Universal Thermal Climate Index (UTCI) in recent years [20]. This physiological index incorporates the human body’s physiological characteristics and considers air temperature, humidity, wind speed, and the average temperature reflecting environmental radiation to the body (namely the mean radiation temperature, Tmrt). Compared to the use of a single crucial parameter, the thermal comfort index can better describe human outdoor thermal comfort [11]. Currently, these thermal comfort indices have been widely used to evaluate the changes in human heat stress [21,22,23] and the impact of urbanization on heat stress [24,25,26,27,28].
Previous studies indicated that the estimation of the degree of heat stress is highly dependent on the choice of the thermal comfort index, as the definitions of different indices are diverse [29,30]. Moreover, the estimation of heat stress based on a single thermal comfort index varies among cities with different urban density grades and climate environments [28,29]. Luo and Lau [22,26] used direct thermal comfort indices to study the variation of heat stress in Chinese regions and analyzed the driving factor causing heat stress. They found that warm air temperature rather than high humidity was the leading cause of the variation in heat stress and that the severity of the condition had increased by almost 30% in urban areas compared to rural areas. Luo and Lau [26] used eight different heat stress metrics and found that urbanization substantially increased heat stress at lower altitudes and denser-populated areas, while the intensifying effect was relatively weak in some arid and high-altitude areas. These results indicated that heat stress is not only the result of the combined effect of various atmospheric variables [23,31,32] but is also related to the geographical distribution and urbanization level [33,34]. Therefore, it is necessary to investigate the influence of urbanization on heat stress based on the integrated evaluation of different thermal comfort indices, to obtain a more comprehensive understanding.
Guangdong Province, a southern coastal area in China with a subtropical hot summer climate, has experienced rapid urbanization and intensifying heat stress in recent decades [27]. In the future, it will experience continuous urbanization and exacerbating thermal discomfort [35], which will increase human health risks. Therefore, this study uses a combination of two thermal comfort indices (direct and physiological) for the last 40 years of summer (June–August) in Guangdong to examine the similarities and differences in how they are affected by urbanization and their causes, as well as how to lessen the impact of urbanization on their respective heat stress. A better understanding of the relationship between urbanization and heat stress can provide some suggestions for local government’s urban construction to mitigate outdoor thermal discomfort and reduce human health risks. The chapters of this paper are organized as follows: Section 2 describes the data and methods, Section 3 discusses the temporal and spatial variation of different thermal comfort indices in Guangdong and the differences in their respective effects of urbanization, and Section 4 further explores the main meteorological drivers leading to the variation of thermal comfort indices.

2. Materials and Methods

2.1. Data Sources

The daily instrumental data used in this paper include the surface air temperature (T2m), relative humidity (RH), wind speed (WIN), pressure (AP), precipitation (PRE), and sunshine hours (SSD). These data were collected from the China Surface Climate Data Daily Dataset (V3.0) of the National Meteorological Information Center, China Meteorological Administration (CMA) in 86 meteorological stations of the Guangdong Province. Cloudiness data from CRU TS v.4 monthly data at a 0.5° resolution [36] and the instrumental data were used to calculate the thermal comfort index. All these datasets cover the period from 1979 to 2018 and were used to calculate the thermal comfort indices.
Three satellite datasets with a 1 km spatial resolution were used in the study to investigate the effect of urbanization on heat stress or drive the analysis of heat stress warming, including the daytime land surface temperature (LSTd) and the nighttime land surface temperature (LSTn) from the Moderate-resolution Imaging Spectroradiometer (MODIS) (an 8-day product named MYD11A2, version 6) [37], the Enhanced Vegetation Index (EVI) from a monthly MODIS product (MYD13A3, version 6) [38], and the annual anthropogenic heat flux (AHF) from [39,40]. These datasets cover the period from 2004 to 2018. In addition, the yearly nighttime light data (NTL) from 2018 from the Visible Infrared Imaging Radiometer Suite (VIIRS) sensor on the Suomi National Polar-orbiting Partnership (NPP) satellite with a 500 m spatial resolution (https://www.ngdc.noaa.gov/eog/download.html, accessed on 20 March 2022) and the demographic data from the Chinese population spatial distribution kilometer grid dataset [41] with a 1 km spatial resolution (https://www.resdc.cn/, accessed on 20 March 2022) were used to identify the urban and rural stations in Guangdong Province. Digital Elevation Model (DEM) data with a 90 m spatial resolution (http://www.gscloud.cn/, accessed on 20 March 2022) was obtained from the Shuttle Radar Topography Mission (SRTM, version V4.1), which was jointly measured by NASA and the National Imagery and Mapping Agency (NIMA) [42]. Both the instrumental data and the MODIS product were temporally aggregated to a monthly timescale.

2.2. Methods

2.2.1. Computations of Thermal Comfort Indices

Considering the subtropical hot summer climate in Guangdong with higher temperatures and relative humidity, we used two types of thermal comfort indices to estimate heat stress, namely the direct thermal comfort index (HI, THI, and DI) and the physiological thermal comfort index (UTCI), which have been used in some areas with the same climate [35,43]. The direct thermal comfort index was calculated using the temperature and relative humidity, and the calculation is shown in Table 1. Compared to the direct thermal comfort index, the calculation of UTCI was more complex, and its equation consists of the Fiala multi-node model [44] and an adaptive clothing model [45]. The UTCI index could be calculated using a polynomial equation of the sixth order, where the variables were the air temperature (T), water vapor pressure (P) or relative humidity (RH), wind speed (WIN), and mean radiation temperature (Tmrt) [20]. It should be noted that the calculation of the Tmrt is complex and varies slightly depending on the method used. In this paper, Tmrt was obtained from the following Equations (1)–(3) [46], thus the UTCI was denoted as UTCI_OBS, where Rprim was the solar radiation absorbed by the human body, which was evaluated by the SolAlt model combined with cloud data and other observational site data (including the air temperature, wind, and pressure) [47].
Tmrt = Rprim + 0.5 L g + 0.5 L a 0.95 × 5.667 × 10 8 1 4 273
L g = 5.5 × 10 8 × 273 + T 4
L a = 5.5 × 10 8 273 + T 4 0.82 0.25 × 10 0.094 × 0.75 P
Moreover, for comparison, the Tmrt with a 0.25° × 0.25° spatial resolution provided by the ERA5 reanalysis data [48] was also used to calculate another UTCI (all denoted as UTCI_ERA5 in the following). Tmrt from ERA5 was interpolated to each observational site using an inverse distance interpolation (IDW) method.

2.2.2. Separation of Urban and Rural Site Divisions and Urbanization Impacts

To investigate the influence of urbanization on heat stress, we used nighttime light data (NTL) and demographic data to first classify 86 meteorological stations in Guangdong Province as urban and rural stations. Areas with higher NTL and populations indicate that the region has a high urbanization level. First, we identified the average NTL value in the economically developed areas of the study area as the threshold for distinguishing urban and rural stations. Then, the average NTL value in a buffer zone within a 10 km radius around each station was calculated. When the NTL value of a station was larger than the threshold and the population exceeded 800 people/km2, it was identified as an urban station. Based on this classification scheme, we classified 86 weather stations into 44 urban stations and 42 rural stations in the study area (Figure 1) [49].
The urbanization effect on thermal comfort indices and the air temperature was calculated by subtracting the average series (thermal comfort indices or temperature) of rural stations (excluding the impact of urban stations, R) from the average series (thermal comfort indices or temperature) of all stations (including the impact of urban stations, A), (All minus Rural, AMR), and the formula could be expressed as TAMR = TA − TR. TA represents the trend of the average series in all stations, TR represents the trend of the average series in rural stations, and TAMR represents the trend of the urbanization effect. The contribution rate of urbanization is given by TAMR/TA × 100%.
The average regional series of the thermal comfort indices and air temperature for different types of stations were calculated by adopting the Principal components analysis (PCA) load-weighting method [50], which helps reduce the sampling biases and eliminate the biases caused by individual stations with problematic data quality.

2.2.3. Drivers Analysis Methods

We used the partial least squares (PLSR) method to examine the drivers of thermal comfort indices warming, which has been used to study the drivers of urbanization warming. The advantages of PLSR analysis are as follows: (1) It is able to establish regression models for multiple sets of dependent variables and independent variables. (2) It can better solve the problems existing in the multiple linear regression model: Multicollinearity between independent variables and the number of sample points being less than the number of variables in the modeling analysis [51,52]. In the PLSR analysis, thermal comfort indices were set as dependent variables, while seasonal averages of RH, PRE, SSD, WIN, LSTd, LSTn, and EVI and annual averages of AHF and DEM were set as independent variables. It should be noted that the environment within a 5 km radius of the weather station would affect the recording of atmospheric variables in field observations [53,54,55]. To reduce the uncertainty of driving factor analysis, the average value of satellite observations (EVI, LST, and AHF) in a buffer zone within a 5 km radius around each station were used in the PLSR analysis. According to the contribution of each factor, the importance of each factor to thermal comfort indices warming can be determined.

3. Results

3.1. Characteristics of Long-Term Changes of Various Thermal Comfort Indices

Figure 2 shows the spatial distribution of trends for the four thermal comfort indices during the summer in Guangdong from 1979 to 2018. As shown in Figure 2a–c, at least 80% of the stations in each of the three direct thermal comfort indices considering only temperature and humidity show an increasing trend (indicated by red dots). The maximum trend values of DI and THI are approximately 0.30 °C/10a (Figure 2b,c). Although the number of stations showing increasing and decreasing trends indicated by HI is basically the same as DI and THI, most of the stations showing rising trends have a more considerable increase than DI and THI, especially in the coastal urban areas, where the upward trends are close to or exceed 0.5 °C/10a (Figure 2a). Compared with the other three direct thermal comfort indices, the physiological thermal comfort index UTCI exhibits an upward trend in fewer sites. The difference is primarily that the direct thermal comfort indices show a weaker increasing trend in the central region, while the UTCI shows a decreasing trend. The changes indicated by UTCI_OBS are consistent with that of UTCI_ERA5, which means that the Tmrt calculated by observational data is in good agreement with the Tmrt provided by ERA5. The UTCI shows the largest increasing trend in the coastal urban areas, and the maximum value can reach 0.70 °C/10a (Figure 2d,e). The overall spatial distribution of variations in the four thermal comfort indices is similar in form. The trend is gradually increasing from north to south, especially in coastal regions such as the Greater Bay Area, western Guangdong, and Chaoshan areas (eastern Guangdong), where the warming trend is significantly higher than inland areas. These areas have experienced rapid urban expansion and population growth in the past decades, implying that urbanization may further exacerbate regional high heat stress in Guangdong, which is consistent with several previous findings [26,27]. From the corresponding relationship diagram between the nighttime light value of each station and its 40-year trend of thermal comfort indices (see Figure S1), all four thermal comfort indices increase with the increase in nighttime light. This has shown intuitively that urbanization has a warming effect in both direct and physiological thermal comfort indices.
The above variations in the thermal comfort indices are closely related to the changes in the corresponding meteorological elements (air temperature, relative humidity, and wind speed). The long-term changes in the summer mean air temperature and those in the thermal comfort indices are consistent (see Figure 3a), except for sporadic stations, in which the air temperature in the region shows a significant warming trend. In contrast to the air temperature, approximately 76% of the stations show a decreasing trend in relative humidity, indicating that most of the study area is dominated by relative drying (see Figure 3b), with the most prominent trend in coastal urban areas (especially in the Great Bay area). Approximately 33% of the sites (also concentrated in coastal urban areas) exhibit a declining trend in wind speed (see Figure 3c). The gradual increase in buildings in urban development has a blocking effect on the wind, leading to a decrease in wind speed in urban areas, which is consistent with the previous studies [56,57]. Although the changes in the two Tmrt are not completely consistent (see Figure S2), the changes in UTCI calculated using different Tmrt are generally similar.
The regional average time series of all stations and urban and rural stations for the four thermal comfort indices are established using the results of the classification of urban and rural stations in Guangdong (Figure 4). Although there are fluctuations in the interannual variation of the thermal comfort indices from 1979 to 2018, the different indices show an increasing trend from the regional average of the different types of sites. The changes in all four thermal comfort indices are flat between 1979 and 1997 while varying degrees of oscillation changes occurred from 1998 to 2018. This is clearly in agreement with the changes in meteorological elements within the corresponding period (see Figure S3a). HI trends were higher than the other three indices, with the largest range in variation, and the maximum anomaly value is as high as 1.8 °C (Figure 4a). The changes in THI and DI are almost the same, and the magnitude of change is small compared with HI, with a maximum anomaly of only 0.8 °C (Figure 4b,c). THI and DI are essentially different development stages of the same indicator, so they can be mixed [9]. The maximum UTCI anomaly is up to 1.2 °C, and the UTCI_OBS fluctuation is slightly higher than UTCI_ERA5, but both are consistent in terms of long-term changes (Figure 4d,e). As shown in Figure 4, the warming trend of each thermal comfort index from 1979 to 2018 is also significantly higher for all stations and urban stations than rural stations, indicating that urban regions are experiencing more severe heat stress than rural ones.

3.2. Contribution of Urbanization to Thermal Comfort Indices and Its Variations through Time

From 1979 to 2018, the warming trend of the summer mean air temperature in Guangdong is significant at the 5% confidence level with values of 0.13 °C/10a (p < 0.05) (Table 2). The warming trends of the direct thermal comfort indices are all significant at the 5% confidence level with values of 0.25 °C/10a, 0.07 °C/10a, and 0.09 °C/10a, respectively, while the warming trend of the UTCI is not statistically significant in Guangdong, with a value of 0.08 °C/10a. In urban areas, the changes in direct thermal comfort indices and mean temperature are significant at the 5% confidence level. In rural areas, only the changes in the mean temperature reach significance at the 5% level (Table 2). The four thermal comfort indices show a warming rate of 0.07–0.25 °C/10a in the study area and 0.03–0.17 °C/10a in the non-urban areas. Figure 5 further shows that the urbanization contribution to warming of all four thermal comfort indices reaches the 5% significance level between 1979 and 2018, indicating that urbanization has had a significant impact on heat stress change in the research area during the previous 40 years. Among the warming contribution of urbanization to the four thermal comfort indices, HI is higher than other thermal comfort indices (0.08 °C/10a), followed by UTCI, DI, and THI (0.04 °C/10a, 0.03 °C/10a, and 0.02 °C/10a, respectively), which are close to that of the contribution of urbanization to air temperature. In other words, the additional warming of the four thermal comfort indices caused by urbanization over the last 40 years is 0.02–0.08 °C/10a. The contribution rate of urbanization to the summer direct thermal comfort indices is close to one-third of the total warming from 1979–2018 (Table 2), which is consistent with the contribution rate of urbanization warming to the mean temperature (32.03%), while the contribution rate of urbanization to UTCI is significantly higher (50%).
However, from 2004 to 2018, the greening in Guangdong Province has a mitigating effect on urbanization warming [55]. Therefore, to investigate whether urbanization contributes significantly to the thermal comfort indices warming during the greening period, we also use the AMR approach to quantify the effect of urbanization on the four thermal comfort indices from 2004–2018 (greening mitigated warming in this period) (Table 2, see also Figure 5). The warming trend of the summer mean temperature and the direct thermal comfort indices (HI, THI, and DI) from 2004 to 2018 become insignificant in the Guangdong region, urban, and rural areas. However, the significance of UTCI has no change in this period compared to 1979–2018. Correspondingly, the contribution of urbanization to direct thermal comfort indices is no longer significant during the period of 2004–2018 (greening period). This indicates that the greening of regional vegetation is likely to offset the warming effect caused by urbanization to a certain extent, which leads to the insignificant warming trend of direct thermal comfort. However, urbanization’s contribution to the warming of the physiological index (UTCI) remains significant at approximately 0.17 °C/10a, exceeding urbanization’s contribution to the three direct thermal comfort indices in the greening period. The urbanization effect on changes in the physiological index still reaches significant levels and needs to be considered.

4. Discussions

4.1. Variation of Different Thermal Comfort Indices with Temperature and Humidity

From 1979 to 2018, the three direct thermal comfort indices show a significant upward trend in the urban areas of Guangdong Province, while the warming trend in rural areas was not significant. In contrast, air temperatures in both urban and rural areas have shown significant warming. Although the warming trend of UTCI is not significant in both urban and rural areas (except for UTCI_ERA5 in the city), the urbanization contribution to the warming of UTCI is significant, which is consistent with the situation of the direct thermal comfort indices and air temperature.
The consistency of changes between air temperature and thermal comfort indices may be related to the definition of thermal comfort indices. Air temperature and relative humidity are important variables for calculating the thermal comfort index. Therefore, we examine the relationship between thermal comfort indices and air temperature and relative humidity within a certain range. The results show that the four thermal comfort indices have similar variations with changes in air temperature and humidity and the thermal comfort indices increase with an increase in both temperature and relative humidity, but there are some differences in the sensitivity of each index to these two variables (Figure 6). Taking into account the law of changing air temperatures and relative humidity in Guangdong (Figure S4), this study takes the air temperature from 28 °C to 29 °C and the relative humidity from 75% to 85% as an example (this is the most common situation) to further examine the differences in the sensitivity of thermal comfort indices to air temperature and relative humidity (Figure 6). A 1 °C increase in the air temperature at a certain relative humidity leads to an increase in HI by 2.3–3.0 °C, and a 10% increase in relative humidity at a certain temperature leads to an increase in HI by 1.5–2.3 °C. HI is a high air temperature index and is more suitable for high air temperatures [25]. THI and DI behave similarly regarding variation in changes in air temperature and relative humidity, with a 1 °C increase in air temperature leading to increases in THI and DI of 0.8–1.0 °C and a 10% increase in relative humidity leading to increases in THI and DI of less than 0.8 °C. Under the conditions of fixed wind speed and Tmrt, the variation of UTCI with air temperature and relative humidity is similar to THI and DI but with a slightly larger magnitude (1.0–1.5 °C). A 10% decrease in relative humidity (from 85% to 75%) at 28 °C can result in a decrease of approximately 0.72–1.5 °C in the four thermal indices, while a 1 °C decrease in air temperature at a certain relative humidity can result in a decrease of approximately 1–2.3 °C in the four thermal indices. Accordingly, the direct thermal comfort indices are marginally more sensitive to air temperature changes than relative humidity, which may lead to urbanization having exactly the same effect on the direct thermal comfort indices as air temperature [22,26,29,55]. In the context of continuous urbanization and climate change, the sensitivity of thermal comfort indices to temperature changes remains higher than that of relative humidity even in coastal areas with high relative humidity [35]. Given that greenery can mitigate urban warming, greening construction may also alleviate the exacerbation of heat stress to some extent [58].

4.2. Driving Factors Analysis of Regional Thermal Comfort Indices

The PLSR model is established by using several meteorological, environmental, and geographical factors to analyze the driving factors of thermal comfort indices in Guangdong from 2004–2018 (Table 3). In general, the drivers of the three direct thermal comfort indices are relatively consistent across the study area, urban, and rural areas. The driving factors of all three direct thermal comfort indices are DEM and LSTn (at the 5% significance level), while the coefficient weights with significant effects on UTCI are WIN, DEM, and LSTn (at the 5% significance level). The importance of DEM to thermal comfort may be related to the local geographical distribution of cities, with cities in Guangdong usually located in low-altitude areas. In Guangdong, the NTL of cities increased with the decrease in altitude (Figure S5). Wind speed is ranked first in importance among the driving factors of UTCI, indicating that wind speed has a highly significant effect on UTCI. According to the relationship between wind and UTCI (see Figure 7a), it is also apparent that the change in UTCI is very sensitive to the change in wind velocity.
According to the analysis in Section 4.1, we know that the direct thermal comfort indices are more sensitive to air temperature [22]. However, Chao et al. [55] found that the large-scale vegetation greening in Guangdong from 2004–2018 had an important modulating effect on the land surface temperature, especially the nighttime land surface temperature (LSTn). The urbanization warming of both the maximum daytime air temperature and the minimum nighttime air temperature has become insignificant during this period. From Table 3, it can be seen that the factors with important modulating effects in different thermal comfort indices include LSTn, indicating that vegetation greening may indirectly mitigate thermal comfort indices by regulating the nighttime land surface temperature. This may further make the contribution of urbanization to the three direct thermal comfort indices warming become insignificant. Previous studies have proved that vegetation greening affects the local temperature by reducing albedo and improving the water and heat exchange rate between the surface and the atmosphere [59]. The decreased solar heat through vegetation shading and the increased latent cooling due to the increase in evapotranspiration can reduce the air temperature [60,61]. Ng et al. [60] showed that vegetation accounted for more than 33% of the urban area in Hong Kong, which could reduce the temperature by 1 °C. Fan et al. [43] pointed out that in the Guangdong–Hong Kong–Macau Greater Bay Area, low vegetation types have a better cooling effect on air temperature. Therefore, vegetation greening is an important heat mitigation strategy for urban outdoor thermal comfort, primarily through reducing the air temperature.
However, the physiological thermal comfort index UTCI is sensitive to both air temperature and wind [62]. From Table 3, the driving factors of UTCI are WIN, DEM, and LSTn (at the 5% significance level), and WIN is the most important modulation factor. In the past 15 years, the urban wind speed has decreased, while the rural wind speed has continued increasing (see Figure 7b). Since the limited open space between high-rise buildings reduces the permeability of air ventilation near the surface, the urban wind speed decreases with the development of cities, even in coastal cities (Figure 3c) [63,64,65]. UTCI increase with the decrease in wind speed (see Figure 7a), resulting in the UTCI still maintaining a significant level of urbanization warming. Meanwhile, as shown in Figure S6d–e, there is a good correlation between the trend of UTCI and the trend of wind speed. UTCI shows a warming trend when the wind speed shows a decreasing trend. The decrease in ventilation caused by continuous urban construction is one of the most important factors exacerbating urban outdoor thermal comfort [66]. Wind can reduce the urban air temperature by increasing cool air advection and atmosphere mixing of cool and hot air [67]. He et al. [68] found that wind cooling performance does exist and is more significant in a wider area. He et al. [66] found that there may be differences in the wind cooling capacity between inland winds and sea winds because compared to inland winds, sea winds weaken more urban heat island effects and more areas experience cold island effects. Therefore, the urban air ventilation environment of a city should be noted immediately, as rational urban construction that increases the penetration of cold air can mitigate the urban outdoor thermal comfort [66]. In future urban planning, natural factors can be considered to improve urban ventilation, such as the prevailing wind or the land–sea breeze. In coastal cities, high-rise buildings in a line should be avoided, which will separate the seaside from inland, thus blocking the path of the fresh air flow from the sea into the city [69]. Due to the coarse spatial resolution of LST, EVI, and AHF, there is the problem of mixed pixels, which may deviate from the actual situation of the site area. With the development of remote sensing technology, the spatial resolution of various remote sensing data products has been improved. In the future, relevant research can be conducted based on high-spatial-resolution data to reduce the uncertainty caused by a rough spatial resolution. For example, compared to NTL from the Defense Meteorological Satellite Program’s Operational Linescan System (DMSP-OLS) with a coarse spatial resolution, NTL from NPP-VIIRS with a finer spatial resolution has a better NTL detecting ability [70]. In addition, the physiological thermal comfort index (UTCI), which considers how humans perceive the thermal environment, has certain advantages in describing the impact of urbanization on the regional climate and environment [43], which should also be fully considered when formulating future policies to deal with the impacts of urbanization on climate.

5. Conclusions

Based on four thermal comfort indices (three direct thermal comfort indices, HI, THI, DI, and a physiological thermal comfort index, UTCI), we explore urbanization’s influence on the heat stress change in summer in Guangdong over different periods, namely 1979–2018 and 2004–2018. Furthermore, the influence of urbanization on thermal comfort indices and their driving factors were analyzed in a PLSR model using multi-source remote sensing data (including land surface temperature, vegetation index, anthropogenic heat flux, and a digital elevation model) and meteorological observation station data.
(1)
All four thermal comfort indices show an overall warming trend between 1979 and 2018. The direct thermal comfort indices (e.g., HI, THI, and DI) show warming trends at the 5% significance level (0.25 ± 0.18 °C/10a, 0.07 ± 0.06 °C/10a, and 0.09 ± 0.07 °C/10a, respectively), while the physiological thermal comfort index (UTCI) does not warm significantly (0.08 ± 0.12 °C/10a, 0.08 ± 0.10 °C/10a). This indicates that using different thermal comfort indices helps to understand the temporal and spatial changes in regional heat stress in southern China from different perspectives.
(2)
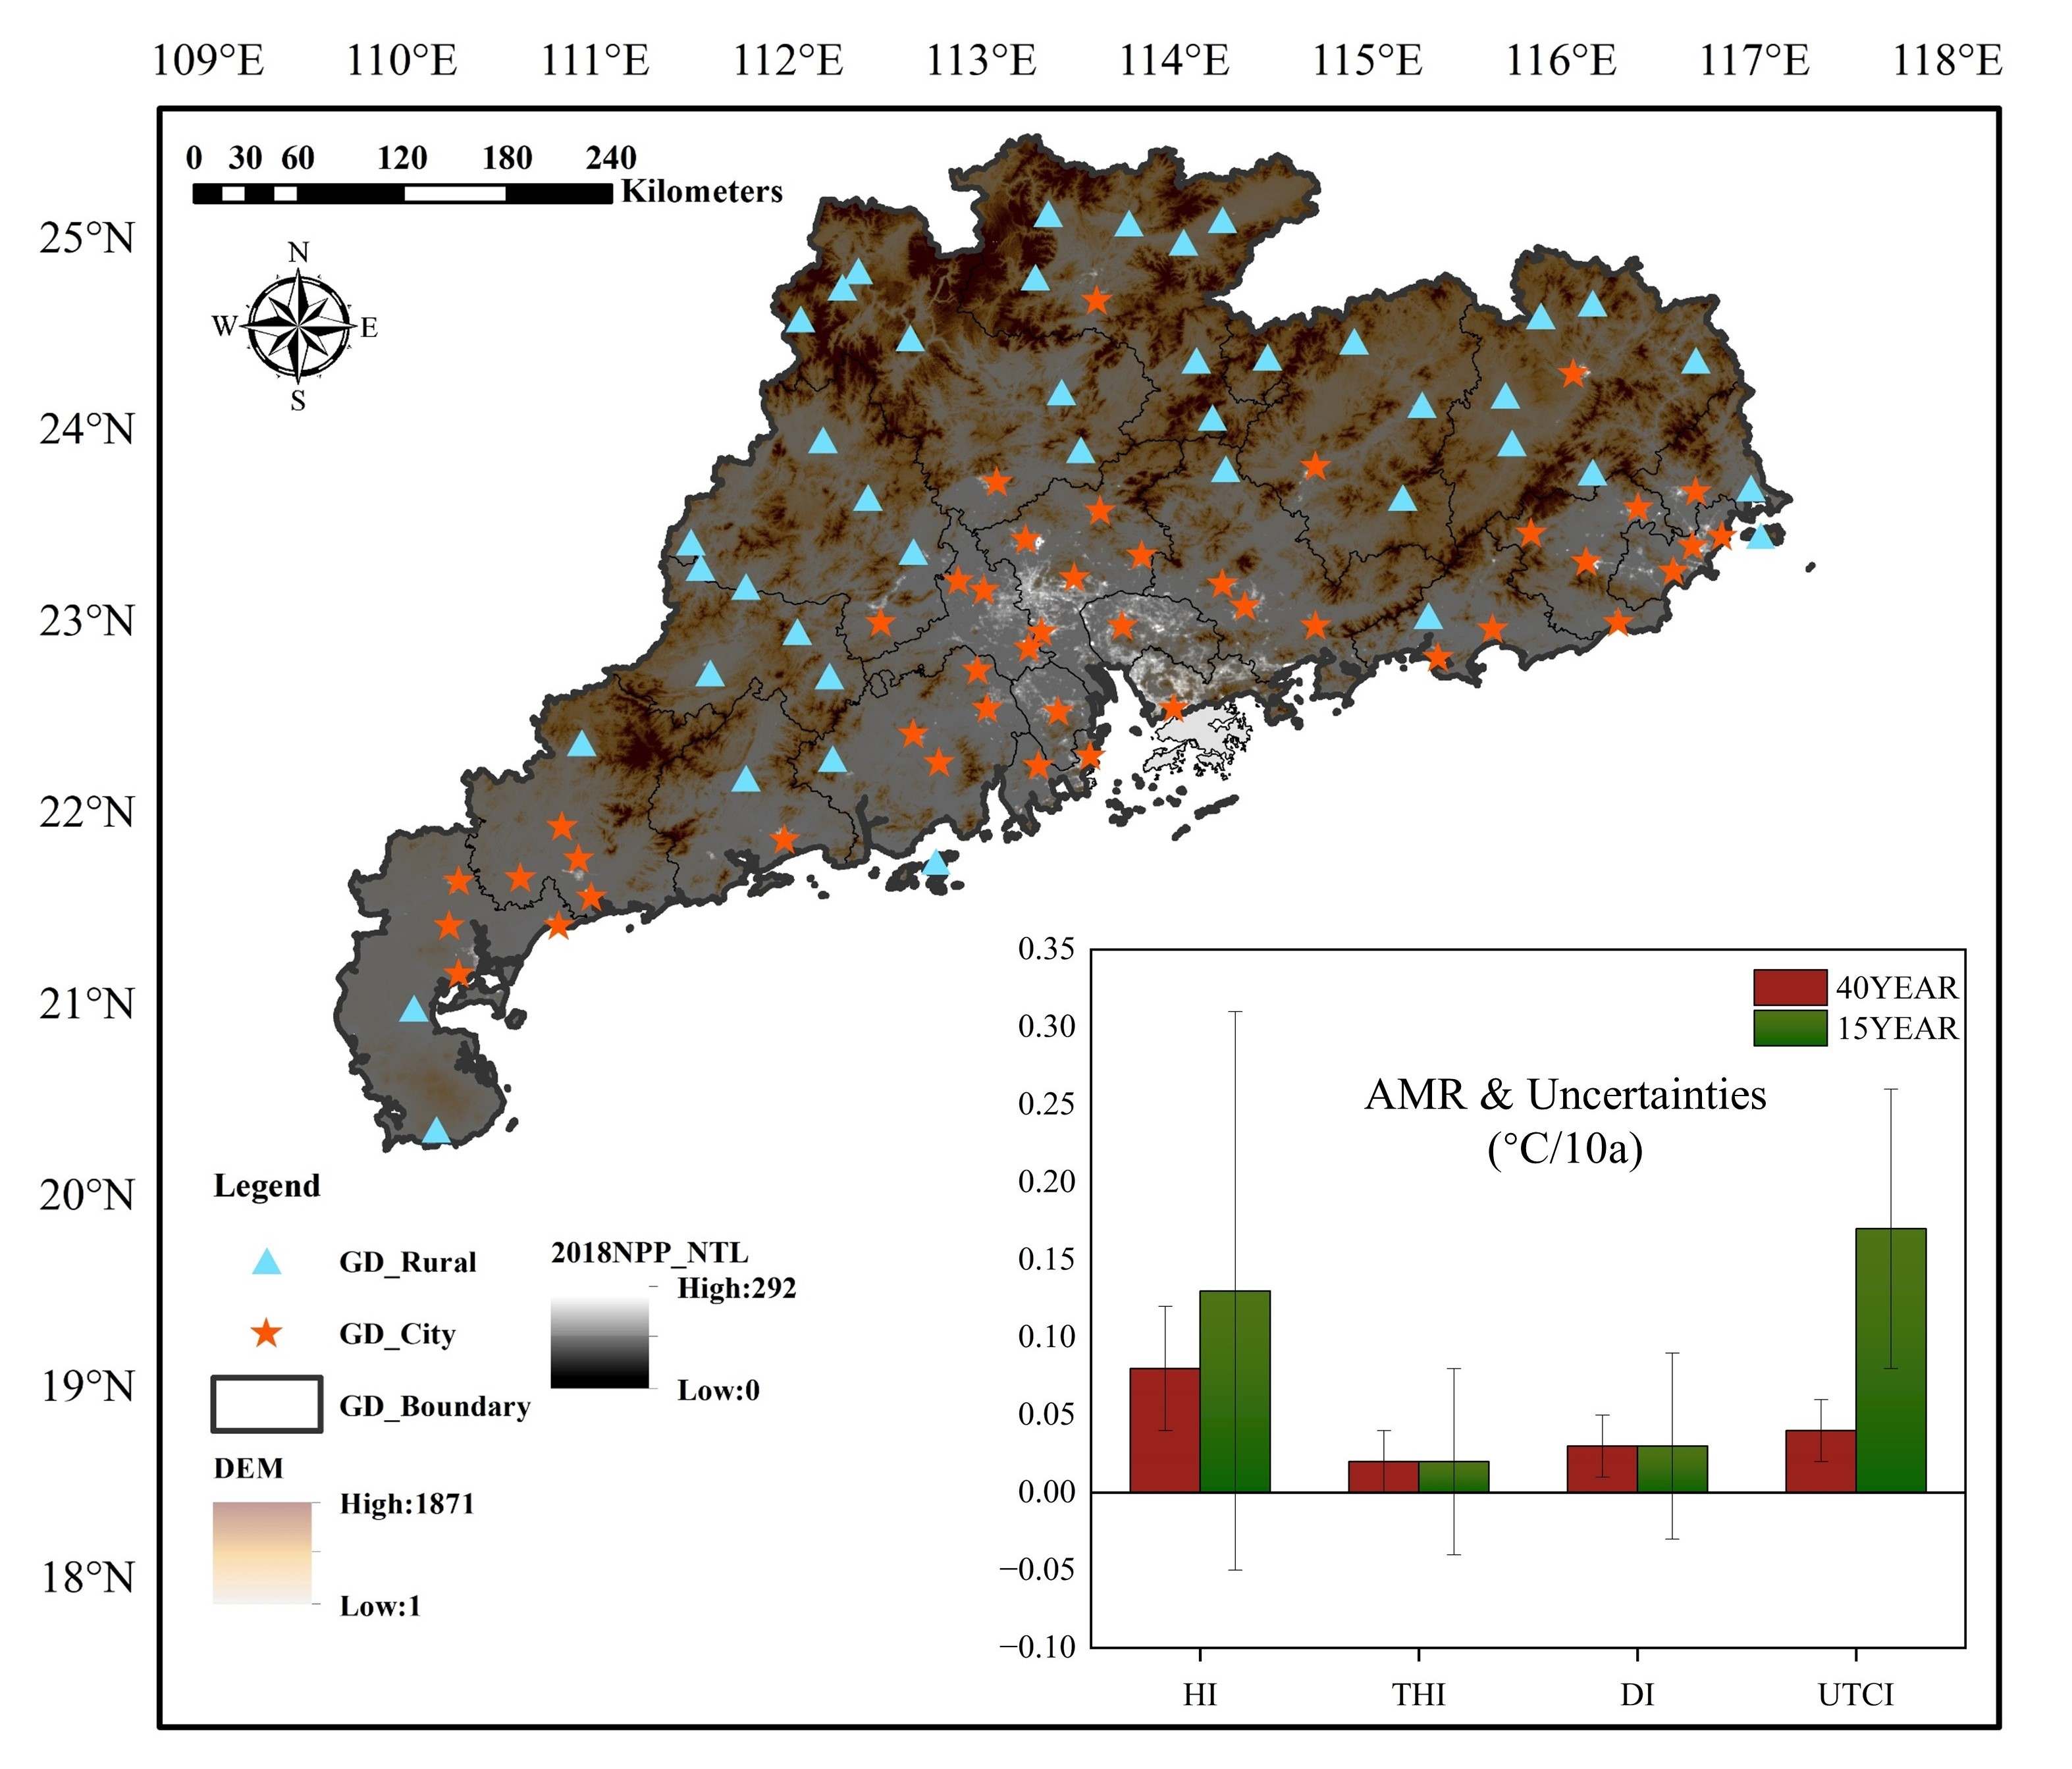
In terms of spatial distribution, the thermal comfort indices show more pronounced warming trends in urban areas than those in rural areas, which shows that the heat stress in the study area is affected by urbanization to a certain extent. From 1979–2018, the urbanization effect on all four thermal comfort indices reaches significance at the 5% level (0.08 ± 0.04 °C/10a, 0.02 ± 0.01 °C/10a, 0.03 ± 0.01 °C/10a, 0.04 ± 0.02 °C/10a, 0.04 ± 0.02 °C/10a); during the period of 2004–2018 when regional vegetation greening occurs, the urbanization effect on the direct thermal comfort indices becomes insignificant (0.13 ± 0.18 °C/10a, 0.02 ± 0.06 °C/10a, and 0.03 ± 0.06 °C/10a, respectively), while it remains significant (0.17 ± 0.09 °C/10a) for UTCI. From the perspective of human thermal health problems caused by urbanization, we agree with Fan et al. [43] that the UTCI in the Guangdong–Hong Kong–Macau Greater Bay Area has certain advantages over the above direct thermal comfort indices.
(3)
Analysis of the driving factors of thermal comfort indices may aptly explain the difference in the urbanization effects of specific indices. The direct thermal comfort indices (HI, THI, and DI) in the study area are primarily determined by the air temperature. Due to the greening of vegetation over the past few years, the warming due to urbanization has become insignificant [55], and thus the urbanization effects on the direct thermal comfort indices are similarly insignificant. However, wind speed plays a more critical role in the physiological index (UTCI): Decreasing wind speeds in urban areas leads to an increase in UTCI, while wind speeds in rural areas increase instead, thus widening the UTCI differences between urban and rural.
Based on the above findings, the coordination of the main function layout in urban construction should be strengthened in relation to the response to global warming caused by greenhouse gases. In addition to focusing on the rise of urban temperature, the impact of other meteorological factors (e.g., wind speed) on human heat stress must be taken into account. Building urban ventilation corridors and improving urban vegetation at lower levels are, from the perspective of this paper, effective means to help humans adapt to the increased heat stress.

Supplementary Materials

The following supporting information can be downloaded at: https://www.mdpi.com/article/10.3390/rs15112750/s1. Figure S1: The relationship between the urbanization trends and the NTL values in HI (a), THI (b), DI (c), UTCI_OBS (d), and UTCI_ERA5 (e) anomaly in Guangdong during the summer of 1979 to 2018. Figure S2: Spatial distribution of the change trends of Tmrt_OBS (a) and Tmrt_ERA5 (b), and the anomaly time series of Tmrt_OBS (c) and Tmrt_ERA5 (d) at all, urban and rural stations in Guangdong during the summer from 1979 to 2018. Figure S3: Time series of T2m (a), RH (b), and WIN (c) anomaly at all, urban and rural stations in Guangdong during the summer of 1979 to 2018. Figure S4: Actual distribution of T2m and RH in Guangdong during the summer of 1979 to 2018. Figure S5: The relationship between the DEM and the NTL values in Guangdong. Figure S6: The relationship between the thermal comfort indices anomaly trend and the wind anomaly trend in HI (a), THI (b), DI (c), UTCI_OBS (d), and UTCI_ERA5 (e) anomaly in Guangdong during the summer of 2004 to 2018.

Author Contributions

Conceptualization, Q.L. and L.C.; methodology, L.C., W.L. and Q.L.; validation, W.L. and H.Z.; data curation, W.L. and L.C.; writing—original draft, W.L., H.Z. and L.C.; writing—review and editing, H.Z., Q.L., L.C. and P.S.; visualization, W.L.; manuscript supervision, H.Z. and Q.L. All authors have read and agreed to the published version of the manuscript.

Funding

This research was funded by the Natural Science Foundation of China (grant 41975105) and the National Key R&D Programs of China (grants 2018YFC1507705 and 2017YFC1502301).

Data Availability Statement

The data presented in this study are available upon request from all the authors.

Acknowledgments

We thank the China National Meteorological Information Center (NMIC) for providing the observational data. The ERA5 reanalysis data were provided by ECMWF. The cloudiness data were obtained from Climatic Research Unit (University of East Anglia) and Met Office. The MODIS data were provided by NASA. The nighttime light (NTL) data were obtained from NOAA. The population spatial distribution dataset was provided by the China Institute of Geographic Sciences and Natural Resources Research (IGSNRR). The Digital Elevation Model (DEM) was originally produced by NASA. We thank Bing Chen, School of Earth Sciences, Yunnan University, China, for providing the AHF dataset for the Guangdong from 2004–2018. The specific calculation of UTCI was performed using BioKlima 2.6 software [71].

Conflicts of Interest

The authors declare no conflict of interest.

References

  1. Wang, J.; Chen, Y.; Liao, W.; He, G.; Tett, S.; Yan, Z.; Zhai, P.; Feng, J.; Ma, W.; Huang, C.; et al. Anthropogenic Emissions and Urbanization Increase Risk of Compound Hot Extremes in Cities. Nat. Clim. Chang. 2021, 11, 1084–1089. [Google Scholar] [CrossRef]
  2. Mora, C.; Dousset, B.; Caldwell, I.; Powell, F.; Geronimo, R.; Bielecki, C.; Counsell, C.; Dietrich, B.; Johnston, E.; Louis, L.; et al. Global Risk of Deadly Heat. Nat. Clim. Chang. 2017, 7, 501–506. [Google Scholar] [CrossRef]
  3. Wang, Y.; Wang, A.; Zhai, J.; Tao, H.; Jiang, T.; Su, B.; Yang, J.; Wang, G.; Liu, Q.; Gao, C.; et al. Tens of Thousands Additional Deaths Annually in Cities of China between 1.5 °C and 2.0 °C Warming. Nat. Commun. 2019, 10, 3376. [Google Scholar] [CrossRef] [PubMed]
  4. Guo, Y.; Gasparrini, A.; Li, S.; Sera, F.; Vicedo-Cabrera, A.; Coelho, M.; Saldiva, P.; Lavigne, E.; Tawatsupa, B.; Punnasiri, K.; et al. Quantifying Excess Deaths Related to Heatwaves under Climate Change Scenarios: A Multicountry Time Series Modelling Study. PLoS Med. 2018, 15, e1002629. [Google Scholar] [CrossRef]
  5. Baldwin, J.; Dessy, J.; Vecchi, G.; Oppenheimer, M. Temporally Compound Heat Wave Events and Global Warming: An Emerging Hazard. Earths Future 2019, 7, 411–427. [Google Scholar] [CrossRef]
  6. Matthews, T.; Wilby, R.; Murphy, C. Communicating the Deadly Consequences of Global Warming for Human Heat Stress. Proc. Natl. Acad. Sci. USA 2017, 114, 3861–3866. [Google Scholar] [CrossRef]
  7. Kephart, J.L.; Sánchez, B.N.; Moore, J.; Schinasi, L.H.; Bakhtsiyarava, M.; Ju, Y.; Gouveia, N.; Caiaffa, W.T.; Dronova, I.; Arunachalam, S.; et al. City-Level Impact of Extreme Temperatures and Mortality in Latin America. Nat. Med. 2022, 28, 1700–1705. [Google Scholar] [CrossRef]
  8. Chen, L.; Ng, E. Outdoor Thermal Comfort and Outdoor Activities: A Review of Research in the Past Decade. Cities 2012, 29, 118–125. [Google Scholar] [CrossRef]
  9. Yan, Y.; Yue, S.; Liu, X.; Wang, D.; Chen, H. Advances on Assessment of Bioclimatic Comfort Conditions at Home and Abroad. Adv. Earth Sci. 2013, 28, 1119–1125. [Google Scholar] [CrossRef]
  10. Coccolo, S.; Kampf, J.; Scartezzini, J.-L.; Pearlmutter, D. Outdoor Human Comfort and Thermal Stress: A Comprehensive Review on Models and Standards. Urban Clim. 2016, 18, 33–57. [Google Scholar] [CrossRef]
  11. Potchter, O.; Cohen, P.; Lin, T.-P.; Matzarakis, A. Outdoor Human Thermal Perception in Various Climates: A Comprehensive Review of Approaches, Methods and Quantification. Sci. Total Environ. 2018, 631–632, 390–406. [Google Scholar] [CrossRef]
  12. Steadman, R.G. A Universal Scale of Apparent Temperature. J. Appl. Meteorol. Climatol. 1984, 23, 1674–1687. [Google Scholar] [CrossRef]
  13. Rothfusz, L.P.; NWSSR Headquarters. The Heat Index Equation (or, More than You Ever Wanted to Know about Heat Index); National Oceanic and Atmospheric Administration, National Weather Service, Office of Meteorology: Fort Worth, TX, USA, 1990; Volume 9023, p. 640. [Google Scholar]
  14. Blazejczyk, K.; Epstein, Y.; Jendritzky, G.; Staiger, H.; Tinz, B. Comparison of UTCI to Selected Thermal Indices. Int. J. Biometeorol. 2012, 56, 515–535. [Google Scholar] [CrossRef]
  15. Schlatter, T.W. Temperature-Humidity Index. In Climatology; Springer: Boston, MA, USA, 1987; pp. 837–838. ISBN 978-0-387-30749-7. [Google Scholar]
  16. Thom, E.C. The Discomfort Index. Weatherwise 1959, 12, 57–61. [Google Scholar] [CrossRef]
  17. Gulyás, A.; Unger, J.; Matzarakis, A. Assessment of the Microclimatic and Human Comfort Conditions in a Complex Urban Environment: Modelling and Measurements. Build. Environ. 2006, 41, 1713–1722. [Google Scholar] [CrossRef]
  18. Ji, Y.; Song, J.; Shen, P. A Review of Studies and Modelling of Solar Radiation on Human Thermal Comfort in Outdoor Environment. Build. Environ. 2022, 214, 108891. [Google Scholar] [CrossRef]
  19. Yang, W.; Wong, N.H.; Jusuf, S. Thermal Comfort in Outdoor Urban Spaces in Singapore. Build. Environ. 2013, 59, 426–435. [Google Scholar] [CrossRef]
  20. Brode, P.; Fiala, D.; Błażejczyk, K.; Holmér, I.; Jendritzky, G.; Kampmann, B.; Tinz, B.; Havenith, G. Deriving the Operational Procedure for the Universal Thermal Climate Index (UTCI). Int. J. Biometeorol. 2012, 56, 481–494. [Google Scholar] [CrossRef]
  21. Fong, C.; Aghamohammadi, N.; Ramakreshnan, L.; Sulaiman, N.; Mohammadi, P. Holistic Recommendations for Future Outdoor Thermal Comfort Assessment in Tropical Southeast Asia: A Critical Appraisal. Sustain. Cities Soc. 2019, 46, 101428. [Google Scholar] [CrossRef]
  22. Luo, M.; Lau, N. Characteristics of Summer Heat Stress in China during 1979-2014: Climatology and Long-Term Trends. Clim. Dyn. 2019, 53, 5375–5388. [Google Scholar] [CrossRef]
  23. Di Napoli, C.; Allen, T.; Méndez-Lázaro, P.A.; Pappenberger, F. Heat Stress in the Caribbean: Climatology, Drivers, and Trends of Human Biometeorology Indices. Int. J. Climatol. 2023, 43, 405–425. [Google Scholar] [CrossRef] [PubMed]
  24. Lin, L.; Ge, E.; Liu, X.; Liao, W.; Luo, M. Urbanization Effects on Heat Waves in Fujian Province, Southeast China. Atmospheric Res. 2018, 210, 123–132. [Google Scholar] [CrossRef]
  25. Luo, M.; Lau, N. Increasing Heat Stress in Urban Areas of Eastern China: Acceleration by Urbanization. Geophys. Res. Lett. 2018, 45, 13060–13069. [Google Scholar] [CrossRef]
  26. Luo, M.; Lau, N. Increasing Human-Perceived Heat Stress Risks Exacerbated by Urbanization in China: A Comparative Study Based on Multiple Metrics. Earth’s Future 2021, 9, e2020EF001848. [Google Scholar] [CrossRef]
  27. Wang, Y.; Chen, L.; Song, Z.; Huang, Z.; Ge, E.; Lin, L.; Luo, M. Human-Perceived Temperature Changes over South China: Long-Term Trends and Urbanization Effects. Atmos. Res. 2019, 215, 116–127. [Google Scholar] [CrossRef]
  28. Wang, P.; Luo, M.; Liao, W.; Xu, Y.; Wu, S.; Tong, X.; Tian, H.; Xu, F.; Han, Y. Urbanization Contribution to Human Perceived Temperature Changes in Major Urban Agglomerations of China. Urban Clim. 2021, 38, 100910. [Google Scholar] [CrossRef]
  29. Oleson, K.; Monaghan, A.; Wilhelmi, O.; Barlage, M.; Brunsell, N.; Feddema, J.; Hu, L.; Steinhoff, D. Interactions between Urbanization, Heat Stress, and Climate Change. Clim. Chang. 2015, 129, 525–541. [Google Scholar] [CrossRef]
  30. Epstein, Y.; Moran, D.S. Thermal Comfort and the Heat Stress Indices. Ind. Health 2006, 44, 388–398. [Google Scholar] [CrossRef]
  31. Chakraborty, T.; Venter, Z.S.; Qian, Y.; Lee, X. Lower Urban Humidity Moderates Outdoor Heat Stress. AGU Adv. 2022, 3, e2022AV000729. [Google Scholar] [CrossRef]
  32. Wu, F.; Yang, X.; Shen, Z. Regional and Seasonal Variations of Outdoor Thermal Comfort in China from 1966 to 2016. Sci. Total Environ. 2019, 665, 1003–1016. [Google Scholar] [CrossRef]
  33. Qaid, A.; Bin Lamit, H.; Ossen, D.R.; Raja Shahminan, R.N. Urban Heat Island and Thermal Comfort Conditions at Micro-Climate Scale in a Tropical Planned City. Energy Build. 2016, 133, 577–595. [Google Scholar] [CrossRef]
  34. Wang, C.; Zhan, W.; Liu, Z.; Li, J.; Li, L.; Fu, P.; Huang, F.; Lai, J.; Chen, J.; Hong, F.; et al. Satellite-Based Mapping of the Universal Thermal Climate Index over the Yangtze River Delta Urban Agglomeration. J. Clean. Prod. 2020, 277, 123830. [Google Scholar] [CrossRef]
  35. Wang, Z.; Xiao, Z.; Tam, C.-Y.; Pan, W.; Chen, J.; Hu, C.; Ren, C.; Wei, W.; Yang, S. The Projected Effects of Urbanization and Climate Change on Summer Thermal Environment in Guangdong-Hong Kong-Macao Greater Bay Area of China. Urban Clim. 2021, 37, 100866. [Google Scholar] [CrossRef]
  36. Harris, I.; Osborn, T.J.; Jones, P.; Lister, D. Version 4 of the CRU TS Monthly High-Resolution Gridded Multivariate Climate Dataset. Sci. Data 2020, 7, 109. [Google Scholar] [CrossRef]
  37. Wan, Z.; Hook, S.; Hulley, G. MYD11A2 MODIS/Aqua Land Surface Temperature/Emissivity 8-Day L3 Global 1km SIN Grid V006. In NASA EOSDIS Land Process; LP DAAC: Sioux Falls, SD, USA, 2015. [Google Scholar] [CrossRef]
  38. Didan, K. MYD13A3 MODIS/Aqua Vegetation Indices Monthly L3 Global 1km SIN Grid V006. In NASA EOSDIS Land Process; LP DAAC: Sioux Falls, SD, USA, 2015. [Google Scholar] [CrossRef]
  39. Chen, B.; Shi, G. Estimation of the Distribution of Global Anthropogenic Heat Flux. Atmos. Ocean. Sci. Lett. 2012, 5, 108–112. [Google Scholar] [CrossRef]
  40. Chen, B.; Dong, L.; Shi, G.; Li, L.; Chen, L. Anthropogenic Heat Release: Estimation of Global Distribution and Possible Climate Effect. J. Meteorol. Soc. Jpn. 2014, 92A, 157–165. [Google Scholar] [CrossRef]
  41. Xu, X. Chinese Population Spatial Distribution Kilometer Grid Dataset. Data Registration and Publication System of Resource and Environment Data Cloud Platform. p. 2017. Available online: http://www.resdc.cn/DOI (accessed on 20 March 2022).
  42. Jarvis, A.; Reuter, H.I.; Nelson, A.; Guevara, E. Hole-Filled SRTM for the Globe Version 4. 2008, Volume 15, p. 5. Available online: http://srtm.csi.cgiar.org (accessed on 20 March 2022).
  43. Fan, P.; Chun, K.; Mijic, A.; Mah, D.; He, Q.; Choi, B.; Lam, C.; Yetemen, O. Spatially-Heterogeneous Impacts of Surface Characteristics on Urban Thermal Environment, a Case of the Guangdong-Hong Kong-Macau Greater Bay Area. Urban Clim. 2022, 41, 101034. [Google Scholar] [CrossRef]
  44. Fiala, D.; Havenith, G.; Brode, P.; Kampmann, B.; Jendritzky, G. UTCI-Fiala Multi-Node Model of Human Heat Transfer and Temperature Regulation. Int. J. Biometeorol. 2012, 56, 429–441. [Google Scholar] [CrossRef]
  45. Havenith, G.; Fiala, D.; Blazejczyk, K.; Richards, M.; Bröde, P.; Holmer, I.; Rintamaki, H.; Benshabat, Y.; Jendritzky, G. The UTCI-Clothing Model. Int. J. Biometeorol. 2012, 56, 461–470. [Google Scholar] [CrossRef]
  46. Matzarakis, A.; Rutz, F.; Mayer, H. Modelling Radiation Fluxes in Simple and Complex Environments: Basics of the RayMan Model. Int. J. Biometeorol. 2010, 54, 131–139. [Google Scholar] [CrossRef] [PubMed]
  47. Blazejczyk, K. Assessment of Recreational Potential of Bioclimate Based on the Human Heat Balance. In Proceedings of the First International Workshop on Climate, Tourism and Recreation. Report of a Workshop, Halkidiki, Greece, 5–10 October 2001; pp. 133–152. [Google Scholar]
  48. Di Napoli, C.; Barnard, C.; Prudhomme, C.; Cloke, H.; Pappenberger, F. ERA5-HEAT: A Global Gridded Historical Dataset of Human Thermal Comfort Indices from Climate Reanalysis. Geosci. Data J. 2021, 8, 2–10. [Google Scholar] [CrossRef]
  49. Chao, L.; Huang, B.; Yuanjian, Y.; Jones, P.; Cheng, J.; Yang, Y.; Li, Q. A New Evaluation of the Role of Urbanization to Warming at Various Spatial Scales: Evidence from the Guangdong-Hong Kong-Macau Region, China. Geophys. Res. Lett. 2020, 47, e2020GL089152. [Google Scholar] [CrossRef]
  50. Li, Q.; Zhang, H.; Liu, X.; Huang, J. Urban Heat Island Effect on Annual Mean Temperature during the Last 50 Years in China. Theor. Appl. Climatol. 2004, 79, 165–174. [Google Scholar] [CrossRef]
  51. Li, Q. Statistical Modeling Experiment of Land Precipitation Variations since the Start of the 20th Century with External Forcing Factors. Chin. Sci. Bull. 2020, 65, 2266–2278. [Google Scholar] [CrossRef]
  52. Qian, G.; Li, Q.; Li, C.; Li, H.; Wang, X.L.; Dong, W.; Jones, P. A Novel Statistical Decomposition of the Historical Change in Global Mean Surface Temperature. Environ. Res. Lett. 2021, 16, 054057. [Google Scholar] [CrossRef]
  53. Yang, Y.; Wu, B.; Shi, C.; Zhang, J.; Li, Y.; Tang, W.; Wen, H.; Zhang, H.; Shi, T. Impacts of Urbanization and Station-Relocation on Surface Air Temperature Series in Anhui Province, China. Pure Appl. Geophys. 2013, 170, 1969–1983. [Google Scholar] [CrossRef]
  54. Yang, Y.; Zhang, M.; Li, Q.; Chen, B.; Gao, Z.; Ning, G.; Liu, C.; Li, Y.; Luo, M. Modulations of Surface Thermal Environment and Agricultural Activity on Intraseasonal Variations of Summer Diurnal Temperature Range in the Yangtze River Delta of China. Sci. Total Environ. 2020, 736, 139445. [Google Scholar] [CrossRef]
  55. Chao, L.; Li, Q.; Dong, W.; Yang, Y.; Guo, Z.; Huang, B.; Zhou, L.; Jiang, Z.; Zhai, P.; Jones, P. Vegetation Greening Offsets Urbanization-Induced Fast Warming in Guangdong, Hong Kong, and Macao Region (GHMR). Geophys. Res. Lett. 2021, 48, e2021GL095217. [Google Scholar] [CrossRef]
  56. Guo, H.; Xu, M.; Hu, Q. Changes in Near-Surface Wind Speed in China: 1969–2005. Int. J. Climatol. 2011, 31, 349–358. [Google Scholar] [CrossRef]
  57. Li, Z.; Song, L.; Ma, H.; Xiao, J.; Wang, K.; Chen, L. Observed Surface Wind Speed Declining Induced by Urbanization in East China. Clim. Dyn. 2018, 50, 735–749. [Google Scholar] [CrossRef]
  58. Castiglia Feitosa, R.; Wilkinson, S.J.; Oliveira, B.; Hacon, S. Wind and Greenery Effects in Attenuating Heat Stress: A Case Study. J. Clean. Prod. 2021, 291, 125919. [Google Scholar] [CrossRef]
  59. Li, Y.; Li, Z.; Wu, H.; Zhou, C.; Liu, X.; Leng, P.; Yang, P.; Wu, W.; Tang, R.; Shang, G.; et al. Biophysical Impacts of Earth Greening Can Substantially Mitigate Regional Land Surface Temperature Warming. Nat. Commun. 2023, 14, 121. [Google Scholar] [CrossRef]
  60. Ng, E.; Chen, L.; Wang, Y.; Yuan, C. A Study on the Cooling Effects of Greening in a High-Density City: An Experience from Hong Kong. Build. Environ. 2012, 47, 256–271. [Google Scholar] [CrossRef]
  61. Lai, D.; Liu, W.; Gan, T.; Liu, K.; Chen, Q. A Review of Mitigating Strategies to Improve the Thermal Environment and Thermal Comfort in Urban Outdoor Spaces. Sci. Total Environ. 2019, 661, 337–353. [Google Scholar] [CrossRef]
  62. Sajad, Z.; Naser, H.; Elahi, S.H.; Rasoul, H.; Keyvan, S.; Saeid, A. Comparing Universal Thermal Climate Index (UTCI) with Selected Thermal Indices/Environmental Parameters during 12 Months of the Year. Weather Clim. Extrem. 2018, 19, 49–57. [Google Scholar] [CrossRef]
  63. Ng, E.; Yuan, C.; Chen, L.; Ren, C.; Fung, J.C.H. Improving the Wind Environment in High-Density Cities by Understanding Urban Morphology and Surface Roughness: A Study in Hong Kong. Landsc. Urban Plan. 2011, 101, 59–74. [Google Scholar] [CrossRef]
  64. Ng, E. Policies and Technical Guidelines for Urban Planning of High-Density Cities—Air Ventilation Assessment (AVA) of Hong Kong. Build. Environ. 2009, 44, 1478–1488. [Google Scholar] [CrossRef]
  65. He, Y.; Liu, Z.; Ng, E. Parametrization of Irregularity of Urban Morphologies for Designing Better Pedestrian Wind Environment in High-Density Cities—A Wind Tunnel Study. Build. Environ. 2022, 226, 109692. [Google Scholar] [CrossRef]
  66. He, B.; Ding, L.; Prasad, D. Wind-Sensitive Urban Planning and Design: Precinct Ventilation Performance and Its Potential for Local Warming Mitigation in an Open Midrise Gridiron Precinct. J. Build. Eng. 2020, 29, 101145. [Google Scholar] [CrossRef]
  67. He, B. Potentials of Meteorological Characteristics and Synoptic Conditions to Mitigate Urban Heat Island Effects. Urban Clim. 2018, 24, 26–33. [Google Scholar] [CrossRef]
  68. He, B.; Ding, L.; Prasad, D. Outdoor Thermal Environment of an Open Space under Sea Breeze: A Mobile Experience in a Coastal City of Sydney, Australia. Urban Clim. 2020, 31, 100567. [Google Scholar] [CrossRef]
  69. He, B.; Ding, L.; Prasad, D. Relationships among Local-Scale Urban Morphology, Urban Ventilation, Urban Heat Island and Outdoor Thermal Comfort under Sea Breeze Influence. Sustain. Cities Soc. 2020, 60, 102289. [Google Scholar] [CrossRef]
  70. Yong, Z.; Li, K.; Xiong, J.; Cheng, W.; Wang, Z.; Sun, H.; Ye, C. Integrating DMSP-OLS and NPP-VIIRS Nighttime Light Data to Evaluate Poverty in Southwestern China. Remote Sens. 2022, 14, 600. [Google Scholar] [CrossRef]
  71. Błażejczyk, K. BioKlima-Universal Tool for Bioclimatic and Thermophysiological Studies. Available online: https://www.igipz.pan.pl/bioklima-crd.html (accessed on 8 August 2022).
Figure 1. Digital elevation model (DEM, orange color scale), nighttime light data (NTL) for the classification of urban and rural sites (black and white color scale), and spatial distribution information of meteorological sites for Guangdong Province in China.
Remotesensing 15 02750 g001
Figure 2. Spatial distribution of temperature trends for four thermal comfort indices HI (a), THI (b), DI (c), UTCI_OBS (d), and UTCI_ERA5 (e) in Guangdong during the summer of 1979–2018.
Remotesensing 15 02750 g002
Figure 3. Spatial distribution of the trends of surface air temperature (T2m) (a), relative humidity (RH) (b), and wind (WIN) (c) in Guangdong during the summer of 1979–2018.
Remotesensing 15 02750 g003
Figure 4. Time series of HI (a), THI (b), DI (c), UTCI_OBS (d), and UTCI_ERA5 (e) thermal comfort indices (anomaly) at all, urban, and rural stations in Guangdong during the summer of 1979–2018. A black asterisk indicates 5% significance level.
Remotesensing 15 02750 g004
Figure 5. The warming contribution of urbanization to the four thermal comfort indices from 1979 to 2018 (red) and from 2004–2018 (green). Trend: Mean ± 1.96 × Standard Error.
Remotesensing 15 02750 g005
Figure 6. Dependence of the HI (a), THI (b), DI (c) (unit: °C) on relative humidity (RH, unit: %) and air temperature (T2m, unit: °C), and dependence of the UTCI (d) (unit: °C) on relative humidity and air-temperature-fixed wind speed and mean radiation temperature.
Remotesensing 15 02750 g006
Figure 7. Dependence of the UTCI (unit: °C) on (a) wind speed (WIN, unit: m/s) and air temperature (T2m, unit: °C) fixed relative humidity and mean radiation temperature, and (b) regional mean wind speed variation for all, urban, and rural stations from 2004 to 2018. A black asterisk indicates 5% significance level.
Remotesensing 15 02750 g007
Table 1. Thermal comfort indices used in this study.
Thermal Comfort IndicesFormulaReferences
Heat Index (HI) HI = 8.784695 +   T × 1.61139411 + RH × 2.338549 0.14611605 × T × RH 0.012308094 × T   2 0.016424828 × RH 2 + 2.211732 × 10 3 ×   T 2 × RH + 7.2546 × 10 4 × RH 2 × T   3.582 × 10 6 ×   RH 2 × T 2 [14]
Temperature-Humidity Index (THI) THI = T 0.55 × 1 RH × 0.01   × T 14.4   [15]
Discomfort Index (DI) DI   =   0.5 ×   Tw + 0.5 ×   T , and:
Tw = Tarctan ( 0.151977 RH + 8.313659 ) + arctan ( T   + RH ) arctan ( RH 1.676331 ) + 0.00391838 RH 3 / 2 arctan ( 0.023101 RH ) 4.68035
[16,29]
Universal Thermal Climate Index (UTCI)
UTCI = T + Offset(T, Tmrt, v, P)
[20]
T: 2 m Air temperature (°C); RH: Relative humidity (%); Tw: Wet-bulb temperature (°C); v: 10 m wind speed (m/s); P: Water vapor pressure (hPa); Tmrt: Mean radiation temperature (°C).
Table 2. The change trends for the summer mean temperature and the thermal comfort indices in Guangdong from 1979 to 2018 and 2004 to 2018 (°C/10a).
TimeVariableALLCityRuralAMR
1979–2018T2m0.13 ± 0.080.17 ± 0.080.09 ± 0.080.04 ± 0.02
HI0.25 ± 0.180.33 ± 0.200.17 ± 0.170.08 ± 0.04
THI0.07 ± 0.060.10 ± 0.060.05 ± 0.060.02 ± 0.01
DI0.09 ± 0.070.11 ± 0.070.06 ± 0.070.03 ± 0.01
UTCI_OBS0.08 ± 0.120.12 ± 0.130.04 ± 0.110.04 ± 0.02
UTCI_ERA50.08 ± 0.100.12 ± 0.110.04 ± 0.090.04 ± 0.02
2004–2018T2m0.09 ± 0.350.12 ± 0.400.05 ± 0.320.04 ± 0.08
HI0.75 ± 0.850.87 ± 0.970.62 ± 0.760.13 ± 0.18
THI0.30 ± 0.310.32 ± 0.330.28 ± 0.290.02 ± 0.06
DI0.29 ± 0.320.32 ± 0.350.27 ± 0.300.03 ± 0.06
UTCI_OBS0.46 ± 0.560.62 ± 0.620.29 ± 0.500.17 ± 0.09
UTCI_ERA50.44 ± 0.500.61 ± 0.560.27 ± 0.460.17 ± 0.10
The bolded numbers indicate 5% significance level. Trend: Mean ± 1.96 × Standard Error.
Table 3. Ranking of different thermal comfort index drivers in Guangdong during the summer of 2004 to 2018.
Station ClassificationThermal Comfort IndicesR2Drive Factor Ranking
AllHI0.82DEM * LSTn * RH PRE SSD LSTd AHF WIN EVI
THI0.83DEM * LSTn * PRE LSTd SSD AHF WIN RH EVI
DI0.83DEM * LSTn * RH PRE SSD LSTd WIN AHF EVI
UTCI_OBS0.75WIN * DEM * LSTn * RH PRE SSD EVI LSTd AHF
UTCI_ERA50.72WIN * DEM * LSTn * PRE EVI RH ANF SSD LSTd
CityHI0.49LSTn * DEM * LSTd RH EVI WIN SSD PRE AHF
THI0.52DEM * LSTn * RH LSTd PRE AHF SSD WIN EVI
DI0.50DEM * LSTn * LSTd PRE SSD AHF EVI RH WIN
UTCI_OBS0.70WIN * DEM * LSTn * RH SSD EVI LSTd AHF PRE
UTCI_ERA50.69WIN * DEM * LSTn * SSD EVI PRE AHF RH LSTd
RuralHI0.78DEM * LSTn * RH PRE AHF SSD LSTd WIN EVI
THI0.80DEM * LSTn * PRE WIN RH AHF LSTd SSD EVI
DI0.79DEM * LSTn * PRE RH WIN AHF SSD LSTd EVI
UTCI_OBS0.73WIN * DEM * LSTn * PRE AHF RH EVI SSD LSTd
UTCI_ERA50.67WIN * DEM * LSTn * PRE EVI SSD AHF LSTd RH
Notes: * indicates 5% significance level.
Disclaimer/Publisher’s Note: The statements, opinions and data contained in all publications are solely those of the individual author(s) and contributor(s) and not of MDPI and/or the editor(s). MDPI and/or the editor(s) disclaim responsibility for any injury to people or property resulting from any ideas, methods, instructions or products referred to in the content.

