Article

An Active Service Recommendation Model for Multi-Source Remote Sensing Information Using Fusion of Attention and Multi-Perspective

1
Suzhou Aerospace Information Research Institute, Suzhou 215123, China
2
School of Information Science and Technology, University of Science and Technology of China, Hefei 230026, China
3
Aerospace Information Research Institute, Chinese Academy of Sciences, Beijing 100094, China
*
Author to whom correspondence should be addressed.
Remote Sens. 2023, 15(10), 2564; https://doi.org/10.3390/rs15102564
Submission received: 7 March 2023 / Revised: 6 May 2023 / Accepted: 12 May 2023 / Published: 14 May 2023
(This article belongs to the Special Issue Deep Learning and Big Data Mining with Remote Sensing)

Abstract

:
With the development and popularization of remote sensing earth observation technology and the remote sensing satellite system, the problems of insufficient proactiveness, relevance and timeliness of large-scale remote sensing supporting services are increasingly prominent, which seriously restricts the application of remote sensing resources in multi-domain and cross-disciplinary. It is urgent to help terminal users make appropriate decisions according to real-time network environment and domain requirements, and obtain the optimal resources efficiently from the massive remote sensing resources. In this paper, we propose a recommendation algorithm using fusion of attention and multi-perspective (MRS_AMRA). Based on MRS_AMRA, we further implement an active service recommendation model (MRS_ASRM) for massive multi-source remote sensing resources by combining streaming pushing technology. Firstly, we construct value evaluation functions from multi-perspective in terms of remote sensing users, data and services to enable the adaptive provision of remote sensing resources. Then, we define multi-perspective heuristic policies to support resource discovery, and fusion these policies through the attention network, to achieve the accurate pushing of remote sensing resources. Finally, we implement comparative experiments to simulate accurate recommendation scenarios, compared with state-of-the-art algorithms, such as DIN and Geoportal. Furthermore, MRS_AMRA achieves an average improvement of 10.5% in the recommendation accuracy NDCG@K, and in addition, we developed a prototype system to verify the effectiveness and timeliness of MRS_ASRM.

1. Introduction

1.1. Research Background

In recent years, the remote sensing satellite system has maintained high-speed growth and formed an application system covering various series of satellites, including communication satellites, navigation satellites, earth observation satellites and engineering test satellites. With the deep integration of remote sensing earth observation technology with emerging technologies, such as Internet, cloud computing and artificial intelligence, remote sensing resources have obtained a wide application. It has played an important role in many pivotal domains, such as land resource, economic construction, disaster prevention and mitigation, meteorological service and environmental monitoring [1]. Meanwhile, the demand for remote sensing resources from users in different industries and domains has changed disruptively. In the past, the demand for static investigation and statistics of qualitative analysis was homogeneous, normative and posterior. Nowadays, it has been upgraded to the demand for dynamic monitoring and forecasting based on quantitative research, which has the characteristics of diversification, thematicization and perspectiveness. However, it is difficult for users to comprehensively assess and expeditiously locate the satisfying content of numerous remote sensing resources in the system. At first, the remote sensing information system is an open and negotiable resource center, in which remote sensing resources (such as data and services) from different organizations are brought together with strong professionalism and distinctive spatio-temporal characteristics. They have structural and functional differences that cannot be ignored, as well as exhibit similar characteristics, such as spatio-temporal characteristics, etc. Thus, it seems difficult for non-professional users to distinguish them through in-depth information analysis. Moreover, diverse users may have vastly different experiences on similar resources, due to the contrasts among users in terms of professional background, research domains, and resource requirements. Additionally, the network bandwidth, server performance, access load and user location of the runtime environment are also factors that cannot be ignored. At present, most existing remote sensing information services are in the modes of a query-based and subscription-based service. To be specific, in the query-based service, users set query criteria to express their requirements including key words, product grade, satellite model, etc. Then, the satisfactory resources will be provided to them accordingly. As for subscription-based service, users always encapsulate query criteria as resource orders and submit them to the remote sensing information system. Once there exist remote sensing resources meeting the requirements, the system will push them to users automatically. Although these two methods help to complete the process of remote sensing resource discovery to a certain extent, there are still evident shortcomings, such as high professionalism in use and low accuracy, and diversity in results. These approaches require users to have a professional background and be able to translate their needs into specific retrieval criteria, thus inevitably setting obstacles for ordinary users. Moreover, these approaches are essentially resource filtering methods based on simple metrics, which limit the search scope and make it difficult for users to access high-value resources with implicit relevance. Nowadays, users pay more attention to the proactiveness, pertinence and timeliness of remote sensing information services. The contradiction between these demands and the traditional remote sensing information service, with characteristics of passiveness, posteriority and monotony, is increasingly prominent [2]. To alleviate the above problem, it is urgent to design a “fast, accurate and flexible” remote sensing information service method to help end-users in different domains make a comprehensive evaluation and appropriate judgment.
A log of research has been carried out on remote sensing information services to improve user experience, in which various excellent recommendation algorithms are introduced to address the information filtering problem, such as collaborative filtering recommendation [3,4,5,6,7], context-based recommendation [7,8,9,10,11,12] and hybrid recommendation [13]. Unfortunately, these methods always face the challenge of achieving high accuracy and novelty in remote sensing resources discovery, due to the lack of consideration for the domain characteristics in information analysis and knowledge fusion. Specifically, these methods fail to recommend remote sensing resources that are truly satisfying and valuable from the perspective of remote sensing users, and especially lack the modeling analysis of remote sensing users, and quantitative evaluation of remote sensing data and remote sensing service resources, resulting in many valuable remote sensing resources unmined, and the remote sensing resources finally recommended to users are too popular. To address this issue, we propose an active service recommendation model for multi-source remote sensing information, using a fusion of attention and multi-perspective, to enable self-regulated filtration and the intelligent recommendation of remote sensing resources. Firstly, we characterize remote sensing users, then we build a user behavior information model and divide user groups. On the basis of user modeling and grouping, we conduct value evaluation methods of remote sensing information from multi-perspectives. Specifically, we build the user-side value evaluation function by analyzing and mining the composition, access the frequency and behavior trajectory of users, as well as the resource-side value evaluation function of remote sensing data and services by way of analyzing their characteristics, costs and actual value generated in applications. Then, three different heuristic policies with multi-perspective value evaluation are defined to support resource discovery, including the user interest value policy, the expert value policy and the domain value policy. The user interest value policy can help users discover high-value remote sensing resources that are highly relevant to their own historical trajectories. Additionally, the expert value policy can help users discover resources that are of interest to expert users in the same group, in order to encourage users to pursue the trajectories of domain experts. The domain value policy can help the users to discover hot resources in the domain they belong to, thereby effectively expanding the scope of users’ interests. Finally, based on the attention network, we propose a multi-source remote sensing information recommendation algorithm (MRS_AMRA) by fusion of the multi-perspective resource discovery polices. Based on MRS_AMRA, we further implement an active service recommendation model (MRS_ASRM) for massive multi-source remote sensing resources, by combining streaming pushing technology, to achieve the accurate pushing of remote sensing data and service resources.

1.2. Contributions

The main contributions of our study are as follows:
  • We optimize the remote sensing information evaluation method by modeling and analyzing actual metrics in user behaviors, remote sensing data and remote sensing services, and reduce the impact on remote sensing resource representation from the uncertainty of the cloud environment and mutual independence of disciplinary domains.
  • We put forward a series of targeted heuristic policies to support remote sensing information discovery, which optimizes the value assessment results from multi-perspectives, and meet the demands for remote sensing resources in different domains and groups.
  • We innovatively put forward a recommendation model, which based on the attention mechanism, fuses different resource discovery policies into the deep collaborative filtering technology to upgrade the “foresight” ability of the remote sensing information system platform.

1.3. Paper Organization

The rest of the current paper is organized as follows: Section 2 summarizes some of the previous studies closely related to our work. Our proposed methodology is presented and described in Section 3, including the problem formulation, information value evaluation and recommendation model design. Experimental evaluation and result analysis are carried out in Section 4. Finally, conclusions and prospects are given in Section 5.

2. Related Work

With the continuous development of satellite remote sensing technology, various satellite systems emerge endlessly, and the comprehensive observation capability of the earth has reached an unprecedented level. Remote sensing data acquisition systems are in a gradual perfection process conformably, in which the remote sensing data show exponential growth in quantity, diverseness and technical indicators, such as spatial resolution, temporal resolution and spectral resolution [14,15]. Simultaneously, the updating periods of remote sensing data are gradually shortened and lead to stronger timeliness [16]. Remote sensing data exhibit the obvious characteristics of big data: volume, variety, velocity, veracity, and value, as well as new characteristics, such as multi-load, multi-resolution, multi-temporal and multi-feature [15,17]. Remote sensing big data covers a large amount of spatio-temporal continuous global data with high-resolution, which can provide more detailed information of ground objects. Their value mainly lies in the representation of ground surface in a multi-grain, multi-temporal and multi-level comprehensive manner, and potentially useful knowledges, such as geoscience, social, cultural, etc. [16] These knowledges can be mined and refined to gain insight into macro-level trends, to conduct a holistic study of the earth system, and to reveal intricate inter-connections in it [18]. The unique value of remote sensing big data also promotes the wide application of remote sensing technology in the fields of land resource, urban planning, agroforestry meteorology, ecological environment, disaster reduction, and defense security [15]. The research on remote sensing big data has mainly oriented to the specific applications involving information exaction [19,20], data retrieval [21,22], data fusion [23,24] and data mining [25,26]. In a broad sense, remote sensing big data consists of data from satellite remote sensing and ground sensor networks, which can reflect the characteristics of earth-surface environment, and data from social sensing equipment, such as smart phones, navigation devices, wearable devices, video surveillance devices, etc., which can illustrate the patterns in human activities, and social and economic forms. However, the characteristics of remote sensing big data such as huge volume-wide sources and complex diversity make it a difficult research task in order to analyze and utilize these data effectively. In this context, the remote sensing active service technology comes into being. Active service technology can automatically generate models and rules through deep analysis, the mining and processing of remote sensing big data to assist decision makers in strategic planning and scientific research, and improve the utilization and accuracy of remote sensing big data [27]. Active service technology can help decision makers better understand remote sensing big data, and thus provide more valuable decision-making support. For example, in the field of agriculture [28], active service technology can help solve the problem of wasted agricultural resources, reduce the incidence of pests and diseases, and improve the quality and yield of agricultural products. In the field of environmental monitoring [29], active service can quickly and effectively discover pollution sources, detect the condition of vegetation, etc., and provide the corresponding determination results and countermeasures, as well as quickly extract the high-precision data needed in urban planning. In conclusion, the application of active service technology can enable the transformation of massive remote sensing data into valuable information to support decision making and planning. In the future, active service technology will provide more credible and valuable data support for Geoscience research.
In recent years, active service technology has been continuously developed and optimized in the field of Geoscience, and is widely used in the research of remote sensing big data processing and analysis. Remote sensing the active service is the premise of remote sensing big data information mining and promoting the transformation of remote sensing data to remote sensing knowledge. It can help users combine the application field characteristics and their own needs to discover valuable remote sensing data resources and service resources from the remote sensing cloud platform, laying the foundations for the subsequent realization of comprehensive analysis and deep application of remote sensing resources. The remote sensing active service in the traditional mode mainly provides remote sensing data downloads and remote sensing service invocations by the way of catalogue search. However, the degree of remote sensing information extraction and analysis is far from enough to support the adaptive provision of remote sensing resource information according to the dynamic changes of the environment and users’ needs, which makes it arduous to realize service on demand [16]. In addition, remote sensing application scenarios are becoming more and more complicated and personalized, which requires comprehensive consideration of storage capacity, access time, scalability, data security, service quality and other aspects for resource evaluation, as well as the dynamic changes of above indicators with the environment. It is also necessary to deliberate the pyramidally personalized requirements of remote sensing resources brought by the expanding user category [30]. Therefore, it is necessary to measure the diversity and similarity among different resources [30], analyze their intrinsic connection and the degree of matching with users’ demands, then provide users with the optimal remote sensing data resources and remote sensing service resources on this basis to enhance the resource utilization efficiency of the remote sensing cloud platform. Existing remote sensing services are mostly tailored towards particular utilizations. However, the potential needs of information fusion and knowledge discovery are ignored, which forms a situation of data explosion and knowledge shortage. It is a very pressing need to upgrade from the traditional query-based remote sensing service to the remote sensing knowledge service with knowledge reasoning ability. In order to address the problems above, researchers intend to provide remote sensing knowledge services, an intelligent service with significant cognitive characteristics, to proactively recommend data of potential interest to users, based on the analysis of their preferences [31]. Existing studies on remote sensing knowledge service are mainly in the conceptual stage, in which remote sensing information discovery and remote sensing information recommendation are typical application scenarios and essential parts. Remote sensing information discovery is a passive-method of service provision, which helps users find qualified remote sensing services on demand. Studies in this domain can be divided into two categories: content matching based discovery and semantic similarity based discovery. Jordy Sangers et al. proposed a service discovery method using natural language processing technology, which determined the search target according to keywords provided by users, and improved the matching degree by the word sense disambiguation method [8]. Manoj Paul et al. calculated the matching degree and ranked the services from the perspective of service parameters and text descriptions to accomplish remote sensing service discovery [9]. These methods usually have low accuracy in service similarity calculation and therefore an enormous keyword set must be built in advance. In semantic similarity-based service discovery, the ontology method is introduced to measure the semantic similarity between user requests and remote sensing services. An Luo et al. used geographic ontology to propose a multi-level semantic-based remote sensing information matching method [11]. QY Wu et al. achieved different levels of remote sensing information matching via hierarchical matching and ontology classification [12]. All above methods realize the importance of efficient remote sensing information discovery. Nevertheless, their accuracy decreases significantly when users are neither professional nor purposeful. Remote sensing information recommendation is an active method which could push the remote sensing data of users’ interests despite their vague requirements [32]. Corresponding research can be divided into two categories: the preference-based recommendation and the feature-based recommendation. The preference-based recommendation analyzes the behavior patterns of users from historical records and excavates their interests for selection. LN Yao. et al. adopted probabilistic generation model to collect rating data and semantic content data of Internet services, and captured user tendency through large amounts of hidden variables in the model [7]. Hao Tian et al. used user experience, the recommendation effect and evaluation tendency to build trust relationships to realize personalized recommendations [33]. Blessina Gonsalve et al. considered the user location in collaborative filtering and improved recommendation accuracy by analyzing the historical load between clients and remote sensing services [34]. These methods mainly concentrate on the analysis of user behavior, ignoring the utilization of inherent spatio-temporal characteristics of remote sensing services, whereas the feature-based recommendation takes them into account. JH Hong et al. proposed a location-based remote sensing resources finding engine (LIFE) to rank and recommend a series of relevant remote sensing images to users according to the user-specific AOI [35]. Xu Chen et al. extracted the content information of remote sensing images to construct the topic model, and used the continuity of spatio-temporal features to enhance recommendation performance [27]. XH Zhang et al. proposed a recommendation model of remote sensing data by using retrieval history records and the unstructured meta-data of them, and discussed the influences of the granularity of spatial location and the number of latent tasks on top- K recommendation, as well [36]. Benefiting from the development of artificial intelligence technology, resource recommendation gradually shields the barriers in underlying domain and semantics, and helps ordinary users obtain satisfied resources conveniently. It is worth noting that the migration and application of the prevalent recommendation algorithm need to be carried out on the basis of delicate knowledge mining of remote sensing resources.
The method we proposed can be counted as the application and the expansion of remote sensing knowledge service in the remote sensing domain. As previously mentioned, the remote sensing information system carries abundant multi-resolution, multi-temporal and multi-type remote sensing data and services. Although current studies mostly focus on the integration, organization and management of these resources, they did not provide enough consideration to the explosion of information caused by the expanding scale of resources, leading to a polarization problem that remote sensing resources are huge in quantity but scarce in application. Most importantly, the incredibly valuable remote sensing resources are not fully evaluated and mined out, which ultimately affects user experience. Therefore, we propose a recommendation model using the fusion of attention and multi-perspective. We design a working model of remote sensing knowledge service to analyze, mine and transform the information and knowledge from both user-side and resource-side. Meanwhile, relying on expert experiences and scientific research needs in remote sensing domain, we propose the recommendation method for remote sensing resources, and endow the remote sensing information platform with the ability of resource perception and scientific decision-making.

3. Proposed Methodology

This section introduces the proposed recommendation model in detail. Firstly, we point out the problems that need to be solved urgently in conventional remote sensing information service methods. Then, by modeling and analyzing the actual metrics of remote sensing information system, we establish a value evaluation method of remote sensing information from multi-perspective, such as the value of remote sensing users, data and service resources. Finally, we take advantage of the attention network to fuse multi-perspective resource discovery policies, and propose a neural network based recommendation algorithm. Based on the recommendation algorithm, we further propose and implement an active service recommendation model for massive multi-source remote sensing information by combining streaming pushing technology.

3.1. Problem Formulation

In the conventional service model of remote sensing resource, there are human-computer interface, the remote sensing resource portal, remote sensing resource catalog, remote sensing resource service and remote sensing resource database, as shown in Figure 1. Users access the remote sensing resource portal through the human-computer interface, and provide keywords based on specialized domain knowledge to retrieve relevant resources from the remote sensing resource catalog. The remote sensing resource catalog uses keyword filtering to extract eligible results from the remote sensing resource service and the remote sensing resource database and return them to users. There are large amounts of remote sensing resources with similarities in features and functions, especially in the same domain or relevant domains, which may lead to high volumes of retrieval results. Thus, it is difficult for users to seek relatively consistent and useful resources through filtering returned records one-by-one and repeatedly updating query criteria. Users who lack domain expertise are caught in a situation where they spend lots of time and still find that it is an arduous task to find satisfying resources. More importantly, many users in the remote sensing information system do not realize their implicit requirements in most cases, which limits the service ability of the system and significantly reduces the user experience.

3.2. Value Evaluation of Remote Sensing Information from Multi-Perspective

3.2.1. User Value Evaluation Function

With the development of the remote sensing industry and the intensification of competition, more and more researchers begin to realize that the competitiveness of the remote sensing information system ultimately comes from creating and delivering excellent user value, and improving the experience and loyalty of remote sensing users. Thus, the collection and analysis of remote sensing users’ behavior information is the basis of the value evaluation of remote sensing information. This section specifically introduces the proposed value evaluation method of user information, which is used to integrate and analyze the information of remote sensing users and to complete the value quantification.
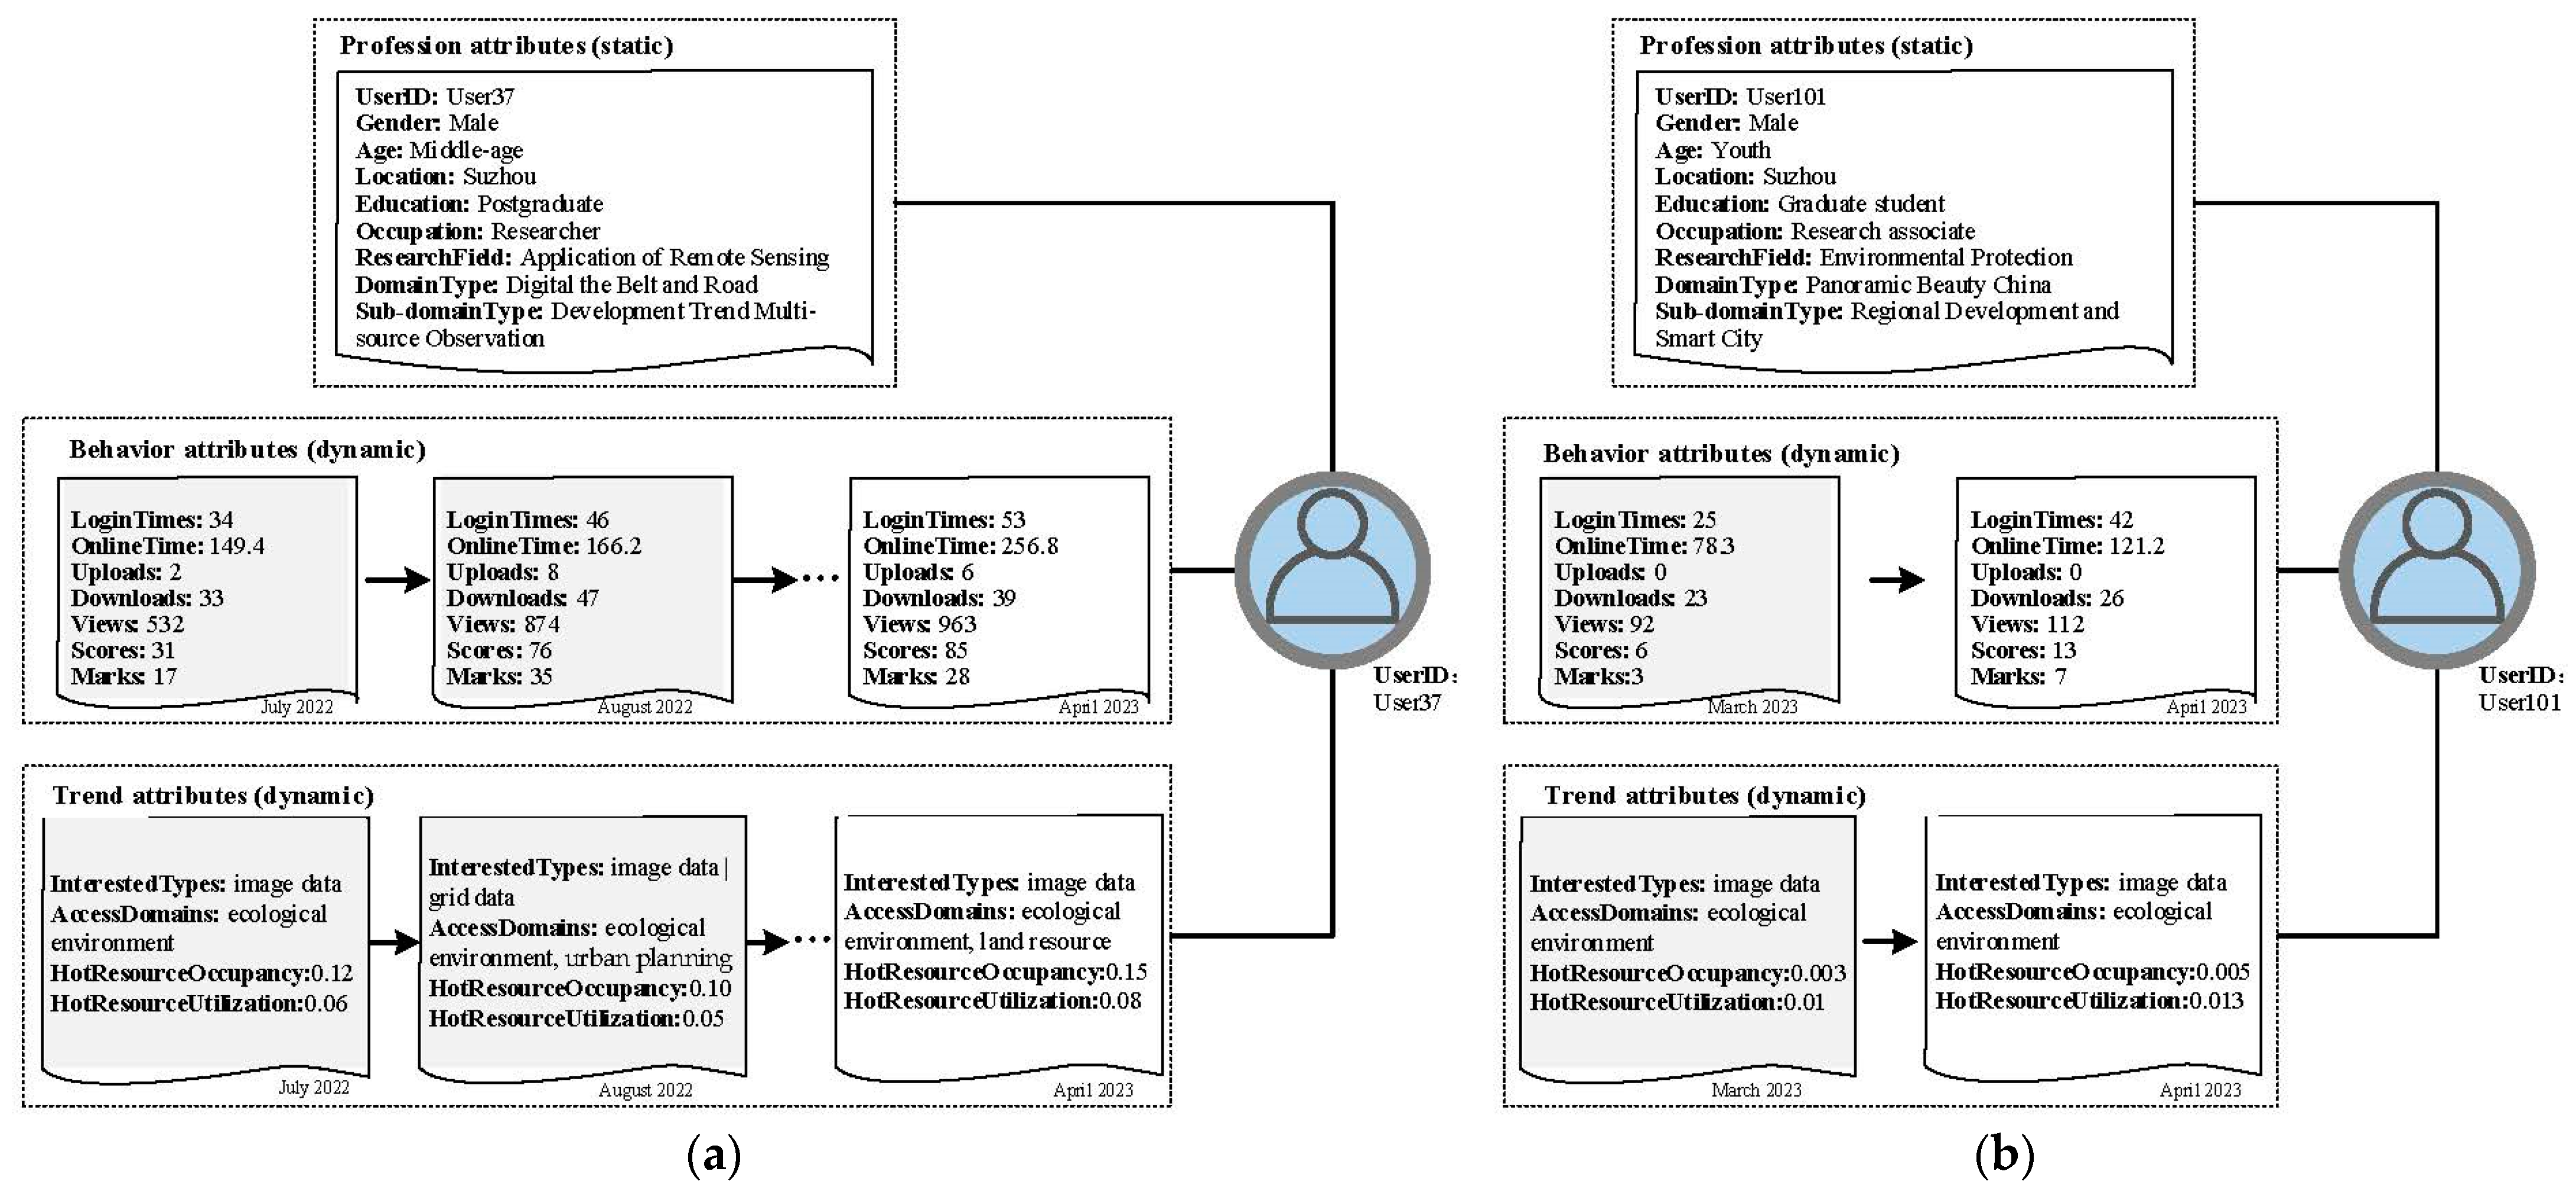
  • Behavior information model of remote sensing users
Users in the remote sensing information system mainly come from different scientific research institutes, government agencies or the public. The resource requirements of users are always discrepant due to their different domains and backgrounds. Among them, the personnel of scientific research institutes are both the providers of resources in this domain and the consumers of resources in related domains, and their fields of concern are relatively concentrated. At present, many global-level thematic studies have been carried out on remote sensing technology, such as climate change, vegetation and land use, land coverage change, biodiversity change, etc. This research usually relies on massive remote sensing data and the services on the remote sensing information system to complete multi-disciplinary scientific calculation and statistical analysis. Therefore, users in scientific research institutes always log in for a long time and access remote sensing data and invoke remote sensing services frequently. Government institutional users are more engaged in the work related to social sustainable development on remote sensing information system with a wide range of area concerns. They usually take countries, cities, market towns, villages and communities as research objects to conduct the corresponding dynamic monitoring and analysis of environment, economy, society and population. Relying on the powerful resource integration ability of the remote sensing information system, they intend to obtain accurate statistical results more efficiently rather than the demand for remote sensing resource production. In comparison, therefore, they have a shorter login time and lower operation frequency. The public users generally expect to obtain the research status or experimental results in the domains they care about through the remote sensing information system, which may have strong dispersion. The access trajectories of different users in different time periods may be quite different, which is the most difficult to model. According to the general access patterns of different users in the remote sensing information system, we carry out a unified abstract description of remote sensing users from the three aspects in terms of profession, behavior and trend, and then we establish the behavior information model, as shown in Figure 2.
The behavior information model is based on a series of actual behavior data, including the profession attribute, behavior attribute and trend attribute, which can reflect the overall picture of remote sensing user information. Among them, the profession attribute provides static characteristics of remote sensing users, which consists of base information, such as user ID, geographical region, occupation, research direction, etc., and domain information including military command, land resource, marine resource, ecological environment, urban planning, population distribution and disaster emergency. The behavior attribute and the trend attribute are dynamic characteristics of remote sensing users. Among them, the behavior attribute describes the interaction information between users and the system, including login information, such as login frequency and login duration, and operation information, such as upload frequency, download frequency, browsing frequency, etc. The trend attribute is the description of potential interest pattern formed through user behavior trajectory analysis and mining, including base interest information, such as user access resource types and domains, as well as hot interest information, such as hot resource occupancy and hot resource utilization, reflecting users’ contribution to the system. Among them, hot resources refer to the resources that are frequently used in the remote sensing information system. Hot resource occupancy refers to the ratio of the count of hot resources used by the target user, in order to count the total hot resources. Hot resource utilization refers to the ratio of the number of times a target user employs hot resources to the total times all users employ them. Profession, behavior, and trend attributes are associated to the target user by user ID. Additionally, the behavior attribute and the trend attribute are connected by time slot ID. We split users’ online duration into time slots to master the changes of the user’s behavior pattern over a period of time. Significantly, the user behavior information model is the foundation of user division and association, and is a core element of remote sensing information recommendation.
2.
Division and association of remote sensing users
The user behavior information model expresses a single remote that senses the user’s historical behavior. Additionally, user behavior in the remote sensing information system is always diverse, complex and interrelated. So, we further analyze and mine the behavior trajectories among different users and put forward the concept of user group to divide and associate users. According to relevant application scenarios and domain requirements, there are strong correlations among different users in the same group under certain conditions, which can be used to reduce the search scope of optimal resources and reduce the calculation cost of user value evaluation.
Based on the user behavior information model, we propose a method to divide and associate remote sensing users, as shown in Algorithm 1. Firstly, cluster all users from the two dimensions of user static attribute (profession attribute) and user dynamic attribute (behavior attribute and trend attribute) to generate two kinds of clustering results. Then, the groups of target users under the two clustering methods are aggregated, that is, the associated user groups of target users are obtained after the group results are merged and de-duplicated.
Algorithm 1 Division and Association of Remote Sensing Users
INPUT: the user attribute set U A = { u d a t a 1 , u d a t a 2 , , u d a t a M } , the number of groups K ;
OUTPUT: the user group U G ;
  • for  u d a t a  in  U A  parallel do:
  • user_static_vector, user_dynmic_vector = Word2vecEmbedding( u d a t a );
  • add user_static_vector to user_static_vectors;
  • add user_dynmic_vector to user_dynamic_vectors;
  • end for
  • user_static_groups = Kmeans(user_static_vectors, K );
  • user_dynamic_groups = Kmeans(user_dynamic_vectors, K );
  • U G = combine(user_static_groups, user_dynamic_groups);
  • return U G ;
3.
Value evaluation function of remote sensing users
Firstly, we decompose the composition of user value from the three aspects of user activity, system familiarity and user credibility and conduct quantitative characterization. Then, we further propose the value evaluation function of remote sensing users to comprehensively identify and measure the contribution degree of users.
For the set U = u 1 , u 2 , , u N composed of N users, it is divided into M groups according to Algorithm 1, and the set G i is used to represent the group to which the current user u i belongs, then the detailed definitions of user activity, system familiarity and user credibility are as follows:
User activity refers to the intensity of the user’s memory of the system. Only when users log in the system frequently and have higher levels of stickiness, the value of remote sensing information system can be reflected. We quantified user activity by counting the system login frequency and login duration, as shown in Formula (1):
U A u i = Ω · j Ω T j u i / 24 D 2 ,
where D represents the total number of days from the date when users registered in the system to the current date, Ω represents the set of user login dates, Ω represents the size of set Ω , and T j represents the total login duration of u i on date j (unit: h). The more days the user logs into the system and persists for a longer period of time, the more active the user will be. For cold-start users, the user activity cannot be directly calculated because the system interaction has not been carried out. Considering the similarity of user activity between users in the same group, we use the average activity of all historical users with similarities in the group G i instead.
System familiarity refers to how often users interact with the system. The interactive behaviors of users in the remote sensing information system include uploading, downloading, browsing and evaluating remote sensing data and service resources. Users’ active interaction behavior can bring vitality to the system and effectively promote the benign development of the remote sensing ecosystem. Combined with the characteristics of user access, we tag the remote sensing users with two roles: the producers who always upload resources, and the consumers who usually consume and evaluate resources. We quantify system familiarity through Formula (2):
S F u i = α i · D U R 1 u i + 1 α i · D U R 2 u i , s . t .   α i = D U R 1 u i / D U R 1 u i + D U R 2 u i ,
where resource update rate D U R 1 u i represents the ratio of update times of remote sensing data and service resources by u i to all users. Resource consumption rate D U R 2 u i is the ratio of usage times by u i to all users. The weighting coefficient α i is used to balance the two. Similarly, the system familiarity of cold-start users is expressed by the mean of all historical users in G i .
User credibility refers to the degree to which a user can be trusted in the system. A large amount of behavioral data will be generated when users interact with the system, in which we can find with similarities via trajectory analysis. We use 3-sigma [37] to detect the abnormal behavior of remote sensing users. Under this hypothesis, the user behavior statistics data conform to the standard Gaussian distribution. Since the probability of data points falling within µ ± 3 σ in the Gaussian distribution is 99.73%, the behavior statistics data outside µ ± 3 σ can be defined as outliers, where µ is the mean of all user behavior statistics data in group G i , and σ is its variance. We comprehensively quantify user credibility from two aspects, abnormal rate of resource access and evaluation, as shown in Formula (3):
U C u i = β i · 1 A R A u i + 1 β i · 1 A R E u i , s . t .   β i = 1 A R A u i / A R A u i + A R E u i ,
where the abnormal rate of resource access A R A u i represents the ratio of abnormal access times of remote sensing data and service resources by u i to all users. Additionally, the abnormal rate of resource evaluation A R E u i represents the ratio of abnormal evaluation times by u i to all users. Weighting coefficient β i is used to balance the two. Similarly, the credibility of cold-start users is expressed by the mean of all historical users in G i .
Finally, we standardize U A u i , S F u i and U C u i , respectively, and divide them into γ i 1 i 3 segments, respectively. The value level of each segment is defined in Table 1. Then the user’s comprehensive value level can be expressed as Formula (4):
U V L u i = 1 i = 1 3 K i γ 1 · U A u i + γ 2 · S F u i + γ 3 · U C u i ,
where U A u i , S F u i and U C u i , respectively, represent the value levels of each segment U A , S F and U C . Notice that the number and level of segmentation in Table 1 can be determined based on a specific business scenario.

3.2.2. Data Value Evaluation Function

Remote sensing data consists of unstructured image data and structured description information (metadata) attached to the image, which can be divided into raw data and thematic products from the perspective of application. The amount of raw data is huge, usually tens of GB or even TB scale. The result of raw data analysis by thematic application models is called thematic products. Remote sensing thematic products have been widely used in agriculture, forestry, water resources, geological environment investigation, environmental protection, land use, urban planning and major engineering construction. Different from the value composition of general intangible assets, the value formation process of remote sensing data has the characteristics of creativity, fuzziness of cost and expense, and risk in the process of value transformation. By analyzing the features of remote sensing data, domain characteristics, and the actual effects produced in applications, we comprehensively evaluate the value of remote sensing data from two aspects: explicit value and implicit value.
As for the explicit value, we adopt statistical analysis of the evaluation data provided by remote sensing users and use the improved Bayesian average model [38] to evaluate the comprehensive value of remote sensing data, as shown in Formula (5):
D V L j = N · i , j λ i , j R i , j + M · R a v g N + M ,
where R ( i , j ) represents the rating of user i on remote sensing data j , and N represents the total number of users participating in the rating of j . R a v g represents the mean ratings of all remote sensing data in the same domain as j , and M is the preset number of rating users. By increasing the number of preset rating users and the mean ratings of all remote sensing data, the Bayesian average model reduces the influence of the one-sided evaluation of the data value caused by the sparsity of actual ratings. In addition, considering the difference of rating contribution users, we introduce user value levels to weigh the historical ratings of remote sensing data to improve the accuracy of the Bayesian average model. The weighted coefficient is shown in Formula (6):
λ i , j = U V L i / i U j U V L i ,
where U j represents the set of all users who have rated remote sensing data j , and U V L ( i ) represents the value level of user i . Formula (6) indicates that the higher the value level of users, the greater the proportion of their rating in the value evaluation of remote sensing data, which reflects the importance of high-value users’ evaluation.
In the actual scenario, users’ explicit evaluation of remote sensing data is extremely sparse, but implicit evaluation data, such as clicking, browsing and collecting, are considerably abundant. These implicit data contain valuable information that can be used to compensate for the data sparsity of explicit evaluation. We carry out explicit processing on the implicit evaluation data, as shown in Formula (7):
R i , j = n i , j · R a v g / N , δ i , j = 0 , n i , j > 0 R m a x ,       δ i , j = 1 , n i , j > N R a v g ,          e l s e
where n i , j represents the number of visits to remote sensing data j by user i , and N represents the average number of visits to all remote sensing data in the same domain as j . R a v g and R m a x are the mean and maximum explicit ratings of all remote sensing data in the same domain as j . Indicator function δ i , j shows whether remote sensing data j is collected by user i , δ i , j = 1 indicates collection and 0, otherwise, · is used for rounding down.

3.2.3. Service Value Evaluation Function

Remote sensing services are an important resource in the remote sensing information system, which is mainly used for remote sensing data-oriented analysis, processing, access, decision-making with a characteristic of high integration, complete platform independence and language independence. We analyze the domain characteristics, access performance and running state of remote sensing services and evaluate them in terms of application value, maintenance cost, as well as service performance.
The application value of the remote sensing service refers to the value of remote sensing data it carries. The remote sensing service in the remote sensing information system is mainly oriented to the analysis, processing and production of remote sensing data: the core element. Therefore, the value of remote sensing data is the crucial part of the value of remote sensing service. The set of remote sensing data carried by the remote sensing service j is denoted as D G = D G 1 , D G 2 , , D G M , and the set of values of them is denoted as D V L = D V L 1 , D V L 2 , , D V L M . Then, the application value of j can be generated, as shown in Formula (8):
A V j = i = 1 M D V L i / M .
The maintenance cost can be expressed by the storage space required by remote sensing data, whereas the service performance is mainly composed of response delay, throughput, S L A violation rate and request error rate of the remote sensing service. More storage space indicates that the remote sensing service consumes more resources, such as storage, computing and network, which raises operation and maintenance costs. However, longer response latency or lower throughput indicates poorer performance of the remote sensing service, which degrades the user experience. It is noteworthy that the storage and service performance of the remote sensing service for diverse businesses are quite different. As an example, the remote sensing services for offline data processing are usually disk-intensive and in need of more storage overhead, while remote sensing services for data accessing are mainly bandwidth-intensive and have a smaller response latency. At this point, there is little practical significance in cross-domain and cross-business comparison. Our discussion on the evaluation of different remote sensing services covers the ones in the same domain and for the same business, in terms of maintenance costs and service performance.
We use the improved TOPSIS [39] to comprehensively measure maintenance costs and service performance, in which the entropy weight method is introduced to objectify the weight of the decision-making factors accounting for low accuracy, which is caused by subjective weighting in earlier studies. The remote sensing service evaluation vector is composed of five critical metrics, as shown in Formula (9):
F S j = Q j , R T j , T H j , S L A j , E R R j ,
where Q j is the storage space of remote sensing service j , R T j is the average response time in concurrent access scenarios, and the throughput T H j is the number of requests successfully processed per unit time. S L A j is the S L A violation rate of j and can be expressed as S L A j = R T j δ / R T j . δ is the tolerance threshold of response time. E R R j is the request error rate, which is the proportion of the number of failed requests to the number of requests in total. In Formula (9), T H j is a positive metric, while the others are negative metrics. Thus, the optimal evaluation vector A + and the worst evaluation vector A of TOPSIS can be expressed as Formulas (10) and (11):
A + = m i n Q , m i n R T , m a x T H , m i n S L A ,
A = m a x Q , m a x R T , m i n T H , m a x S L A ,
where Q = Q 1 , Q 2 , , Q j , Q N is the storage space set served by all remote sensing services, m i n Q is the element with the minimum value in Q , while m a x Q is the element with the maximum value, and so on, for each of the others in Formulas (10) and (11).
We respectively calculate the distance between the evaluation vector of the remote sensing service and the optimal evaluation vector, A + , and the worst evaluation vector, A , and then get the value of the remote sensing service with respect to maintenance costs and service performance, as shown in Formula (12):
R I j = D j / D j + + D j s . t .   D j + = k = 1 K W k A + k F S j , k 2 D j = k = 1 K W k A k F S j , k 2 ,
where D j + denotes the distance between F S j and A + , D j denotes the distance between F S j and A . F S j , k is the k -th element of F S j , A + k and A k , respectively, denotes the k -th element of A + and A , and W k is the weight coefficient of the feature of F S j in the k -th dimension.
As shown in Formula (13), the comprehensive value of the remote sensing service can be obtained by synthesizing the multi-dimensional evaluation results, such as application value, maintenance cost and service performance.
S V L j = β · i = 1 M D V L i M + 1 β · D j D j + + D j ,
where the first part in Formula (13) is the application value, and the second part is the value in relation to maintenance cost and service performance, weighed by β .

3.3. Recommendation Model of Multi-Source Remote Sensing Information

3.3.1. Definition of Heuristic Policies to Support Resource Discovery

The heuristic policies supporting resource discovery defines the rules for discovering high-quality remote sensing data and service resources in the remote sensing information system. These rules are based on the multi-perspective value evaluation including users, data and services, and summarized according to the characteristics of remote sensing domain, application scenarios, etc.
We divide N users in the set U = u 1 , u 2 , , u N into M groups using Algorithm 1, and use the matrix G = G i j N × M to represent the user division result, where G i j = 1 if u i belongs to the j -th group, and G i j = 0 otherwise. Then the detailed definitions of interest value policy, expert value policy and domain value policy are as follows:
  • User interest value policy (ST1)
There are massive behavior trajectories that are generated during the interaction between users and the remote sensing information system, which are cross-correlated with each other and contain a wealth of valuable information. Firstly, we analyze the behavior trajectories of users to capture their interest patterns. Then we extract the interactive resources of all members in the same group. Finally, we intercept the top K resources with the highest value that the current user has not interacted with as interest resources to support the user to “discover current research trends”. The formal expression of user interest value policy is given in Formula (14):
u i G H U Q u i | H G = r e d u c e G i j 0 , Q u i = t o p K R V L H G , Q u i H u i = Ø ,
where H U = H u 1 , H u 2 , , H u N denotes the set of interacted resources of all users, H G denotes the set of interacted resources of the current user group members, and Q u i denotes the set of interest resources recalled to u i with the top K value ranking. In the constraints, r e d u c e G i j 0 means to aggregate the interacted resources of group members, R V L H G means to evaluate the value of interacted resources in set H G , which is based on Formula (5) for remote sensing data and Formula (13) for remote sensing services. t o p K means to intercept resources with the top 𝐾 value ranking into set Q u i , and Q u i H u i = Ø represents to extract resources in Q u i that the current user has not interacted with.
2.
Expert value policy (ST2)
The experts in remote sensing information system are defined as the most valuable users in each group, who usually have higher user activity, system familiarity and user credibility. Expert value policy focuses on analyzing the behavior of experts, and recalls resources which are used more frequently by experts to help unprofessional users “follow the expert track”. The formal expression of the expert value policy is given in Formula (15).
u i G H U Q u ^ | u ^ = a r g m a x U V L G i j 0 , Q u ^ = t o p K R V L H u ^ , Q u ^ H u i = Ø ,
where H U = H u 1 , H u 2 , , H u N denotes the set of interacted resources of all users, u ^ denotes experts in groups to which u i belongs, and Q u ^ denotes the set of expert resources recalled to u i with the top K value ranking. In the constraints, U V L G i j 0 calculates the value of user group members, as specified in Formula (4). a r g m a x means extracting the group member with the highest value as experts; R V L H u ^ means value evaluation of the interacted resources of u ^ ; t o p K means to intercept resources with the top 𝐾 value ranking into set Q u ^ , and Q u ^ H u i = Ø represents to extract resources in Q u ^ that the current user has not interacted with.
3.
Domain value policy (ST3)
As mentioned earlier, the applications of remote sensing technology have entered into many domains, such as military command, land resource, marine resource, ecological environment, urban planning, population distribution and disaster emergency. Generally speaking, there are also intrinsic connections among users and remote sensing resources in related domains. The domain always represents a high level of technical expertise in a certain field. Thus, in the domain value policy, resources with a greater value ranking in the relevant domains will be recalled to help users “recognize the hot research in a specific field”. The formal expression of the domain value policy is provided in Formula (16).
u i G H U Q s | E i = e k u k G i , G i j 0 , D = r e d u c e E i , Q s = t o p K R V L D , Q s H u i = Ø ,
where H U = H u 1 , H u 2 , , H u N denotes the set of interacted resources of all users; E i represents the associated domain set that is the concatenated set of domains to which all members in user groups belong; D represents the set of domain resources in E i , Q s represents the set of interest value resources recalled to u i with the top K value ranking. In the constraints, r e d u c e E i means aggregating all resources in associated domains; R V L D means value evaluation of domain resources; t o p K means to intercept resources with the top K value ranking into set Q s , and Q s H u i = Ø represents to extract resources in Q s that the current user has not interacted with.

3.3.2. Recommendation Algorithm of Multi-Source Remote Sensing Information

The network structure of multi-source remote sensing information recommendation using the fusion of attention and multi-perspective, is shown in Figure 3, which consists of a sparse input layer, embedding layer, policy fusion layer, concatenation layer, deep collaborative filtering layer and output layer. The sparse input layer realizes feature space modeling by fusing the attribute information of remote sensing users, remote sensing data and service resources. The embedding layer reduces the computation complexity of the neural network by mapping the high-dimensional sparse vector from the sparse input layer into the low-dimensional dense embedding vector. In the policy fusion layer, an attention activation unit is designed to fuse three heuristic policies proposed for resource discovery. The concatenation layer splices the user embedding vector and the attention-weighted resource embedding vector, and inputs the obtained vector to the deep collaborative filtering layer. The deep collaborative filtering layer realizes the deep fusion and interaction of the remote sensing user, remote sensing data and service features through the tower structure composed of multi-layer neural networks. Through the sigmoid activation function, the output layer maps the interactive features to the users’ evaluation of remote sensing resources. Then, we will illustrate the design of the network structure in detail, in terms of the feature space, the value policy fusion, and network output, and further propose a recommendation algorithm for multi-source remote sensing information.
  • Design of feature space
Users always give priority to the applicability of remote sensing resources, which requires that the recommended resources are highly consistent with their historical trajectory. Secondly, it is necessary to ensure the value and novelty of resource contents. The value indicates the excellent quality and high performance of resources, and the novelty refers to the diversity of resources, which can help users broaden their horizons and discover new knowledge. Therefore, the Feature Space (FS) input to the above recommendation network consists of five components: the User Feature Field (UFF), the Candidate Resource Feature Field (CRFF), the Interest Resource Feature Field (IRFF), the Expert Resource Feature Field (ERFF) and the Domain Resource Feature Field (DRFF), as shown in Formula (17):
F S = U F F , C R F F , I R F F , E R F F , D R F F ,
where U F F includes attribute features such as user ID, gender, age, geographical region, user domain, etc. C R F F includes data and service features of the resource to be evaluated currently. Among them, Data Features (DF) are composed of satellite identification, sensor identification, shooting time, production time, reference system, etc., and Service Features (SF) are composed of response time, throughput, request error rate, and S L A violation rate, etc. I R F F is a feature sequence of resources within the user’s range of interests recalled by policy ST1. E R F F and D R F F are the feature sequence of resources recalled by ST2 and ST3, respectively. The attribute features of users and resources are summarized in Table 2. Additionally, Algorithm 2 provides a method in which the three heuristic policies mentioned above are integrated to recall resources and prepare data to feed into recommendation networks.
Algorithm 2 Recall of Remote Sensing Resources Based on Heuristic Polices
INPUT: the user set U , the user grouping matrix G, the number of recalled resources K 1 , K 2 , K 3 ;
OUTPUT: the recalled resource set Q ;
  • for  u i  in  U  parallel do:
  • Get member set G i according to G ;
  • if  K 1 > 0  then: // recall interest value resources using policy ST1;
  • for  u k  in  G i  do:
  • H G H G H u k //aggregate user group resources;
  • end for
  • for  q j  in  H G  do:
  • Evaluate value of q j using Formulas (5) or (13) according to resource type;
  • end for
  • Encapsulate K 1 resources with the highest value from H G as Q 1 u i ;
  • else if  K 2 > 0  then: // recall expert value resources using policy ST2;
  • for  u k  in  G i  do:
  • Evaluate value of u k using Formula (4);
  • end for
  • Take user with the greatest value as expert u ^ ;
  • for  q j  in  H u ^  do:
  • Evaluate value of q j using Formulas (5) or (13) according to resource type;
  • end for
  • Encapsulate K 2 resources with the highest value from H u ^ as Q 2 u i ;
  • else if  K 3 > 0  then: // recall domain value resources using policy ST3;
  • for  u k  in  G i  do:
  • Add e k to set E i // e k is the domain that u k belongs to;
  • end for
  • Aggregate all resources in domains E i into set D ;
  • for  q j  in  D  do:
  • Evaluate value of q j using Formulas (5) or (13) according to resource type;
  • end for
  • Encapsulate K 3 resources with the highest value from D as Q 3 u i ;
  • end if
  • Q u i = Q 1 u i Q 2 u i Q 3 u i ;
  • end for
  • return  Q ;
  • Design of value policy fusion
In Section 3.3.1, we design three heuristic policies to support remote sensing resource discovery. These policies focus on the availability, value and novelty of recalled resources, respectively, so we need to fusion them according to the actual scenarios to meet different user requirements. We design an “Attention Activation Unit” using neural network, and comprehensively characterize the candidate resources in terms of applicability, value and novelty by adjusting attention weights adaptively, as shown in Formula (18):
V j A = l = 1 L s i m V j , V l · V l , s . t .   V l = 1 K k = 1 K V k l ,
where V j A denotes the attention-weighted vector of candidate resource j , s i m V j , V l denotes attention weight, V j denotes the original vector of j , and V l ( 1 l L ) denotes user attention vector in applicability, value or novelty. Specifically, V l is quantified by the mean vector of recalled resources using value policy “ST l (ST1, ST2, ST3)”. In its expansion, V k l denotes the embedding vector of recalled resource k ( 1 k K ) . In terms of implementation, we use a small neural network as the “Attention Activation Unit” to calculate attention weight. Its specific structure is shown in the upper right corner of Figure 3. A similar method can be referred to Alibaba’s DIN model [40]. The input layer of the activation unit are two embedding vectors, which are connected with the original embedding vectors after element-wise minus operation, and finally the attention weight is the output through a single neuron output layer.
  • Design of network output
In Figure 3, user vector V i and attention-weighted resource vector V j A are concatenated in a concatenation layer as the input of neural network with deep collaborative filtering (NeuralCF) [41]. This neural network deeply interacts with the feature of user and resource, and maps it to the user’s evaluation R i , j (such as rating or click-through rate) through the Sigmoid function for top-K recommendation, as shown in Formula (19):
R i , j = N e u r a l C F V i , V j A .
As shown in Figure 4, there are seven steps in the flow of the recommendation algorithm of multi-source remote sensing information using the fusion of attention and multi-perspective (MRS_AMRA).
Step 1: Initialize the algorithm parameters. The parameters of neural network are initialized with random weights on the interval 0–1. Corresponding codes are line 1.
Step 2: Divide and associate users. Users are divided and associated by Algorithm 1 to reduce the search scope of optimal resources. Corresponding codes are in line 2.
Step 3: Recall resources with heuristic policies. The interest, expert, and domain value resources are recalled using Algorithm 2. Corresponding codes are in line 5.
Step 4: Construct attention vectors. Calculate user attention vectors in terms of availability, value and novelty of remote sensing resources. Corresponding codes are in lines 7–17.
Step 5: Construct attention-weighted vector. Firstly, calculate th attention weight s i m ( V j , V k ) through the attention neural network. Then, attention vectors are weighted to obtain the attention-weighted vector of candidate resources to realize the comprehensive characterization of candidate resources on applicability, value and novelty. Corresponding codes are in lines 19–22.
Step 6: Predict users’ evaluation. Concatenate user vector and attention-weighted resource vector, and conduct feature interactions using the deep collaborative filtering network to predict the user’s evaluation on candidate resources. Corresponding codes are in line 23.
Step 7: Top- K recommendation. rank all candidate resources according to evaluation value, and recommend the top K remote sensing resources for the current user. Corresponding codes are in line 26.
MRS_AMRA is trained in a similar way to Alibaba’s DIN model, which will not be repeated here. In terms of time complexity, the time consumption of MRS_AMRA mainly lies in the multi-layer for loop of Steps 7–17 and 18–25. Assuming that the number of users is M , the number of resources is N , and each user has K attention resources, the time complexity of Steps 7–17 is O ( M × N ) , and Steps 18–25 is O ( M × N × K ) . So, the time complexity of MRS_AMRA is O ( M × N × K ) . Since parallel computing can be performed using a distributed framework, such as Spark, the time complexity can be controlled to linear level, which can fully meet the time requirements of actual recommendation scenarios in the remote sensing information system. Corresponding pseudo-code of MRS_AMRA is provided in Algorithm 3.
Algorithm 3 MRS_AMRA
INPUT: the user set U , the resource set D, the number of recalled resources K 1 , K 2 , K 3 ,
    and the number of recommended resources K ;
OUTPUT: the recommended resource set R S ;
  • Initialize network with random weights;
  • Divide user groups using Algorithm 1;
  • for  u i  in  U parallel do:
  • Get the attribute features of u i and build Embedding vector V i ;
  • Recall resources using Algorithm 2
    Q u i = Q 1 u i Q 2 u i Q 3 u i ;
  • Initialize vector V 1 , V 2 , V 3 , V j A to 0 and set A F G to Ø ;
  • for  r j  in  Q u i  parallel do: // Construct attention vectors;
  • Get the attribute features of r j and build Embedding vector V j ;
  • if  r j Q 1 u i  do:
  • V 1 = V 1 1 K 1 V j // availability attention;
  • else if  r j Q 2 u i  do:
  • V 2 = V 2 1 K 2 V j // value attention;
  • else:
  • V 3 = V 3 1 K 3 V j // novelty attention;
  • end if
  • add V 1 , V 2 , V 3 to set A F G ;
  • end for
  • for  r j  in  Q u i  parallel do:
  • for  V l  in  A F G  do:
  • s i m V j , V l = N e u r a l N e t V j , V l ;
  • V j A = V j A s i m V j , V l · V l // Construct attention-weighted vector;
  • end for
  • R i , j = N e u r a l C F V i , V j A // Predict users’ evaluation;
  • add R i , j to set S ;
  • end for
  • R S ( i ) = T o p K ( S , K ) // Top-K recommendation;
  • end for
  • return RS;

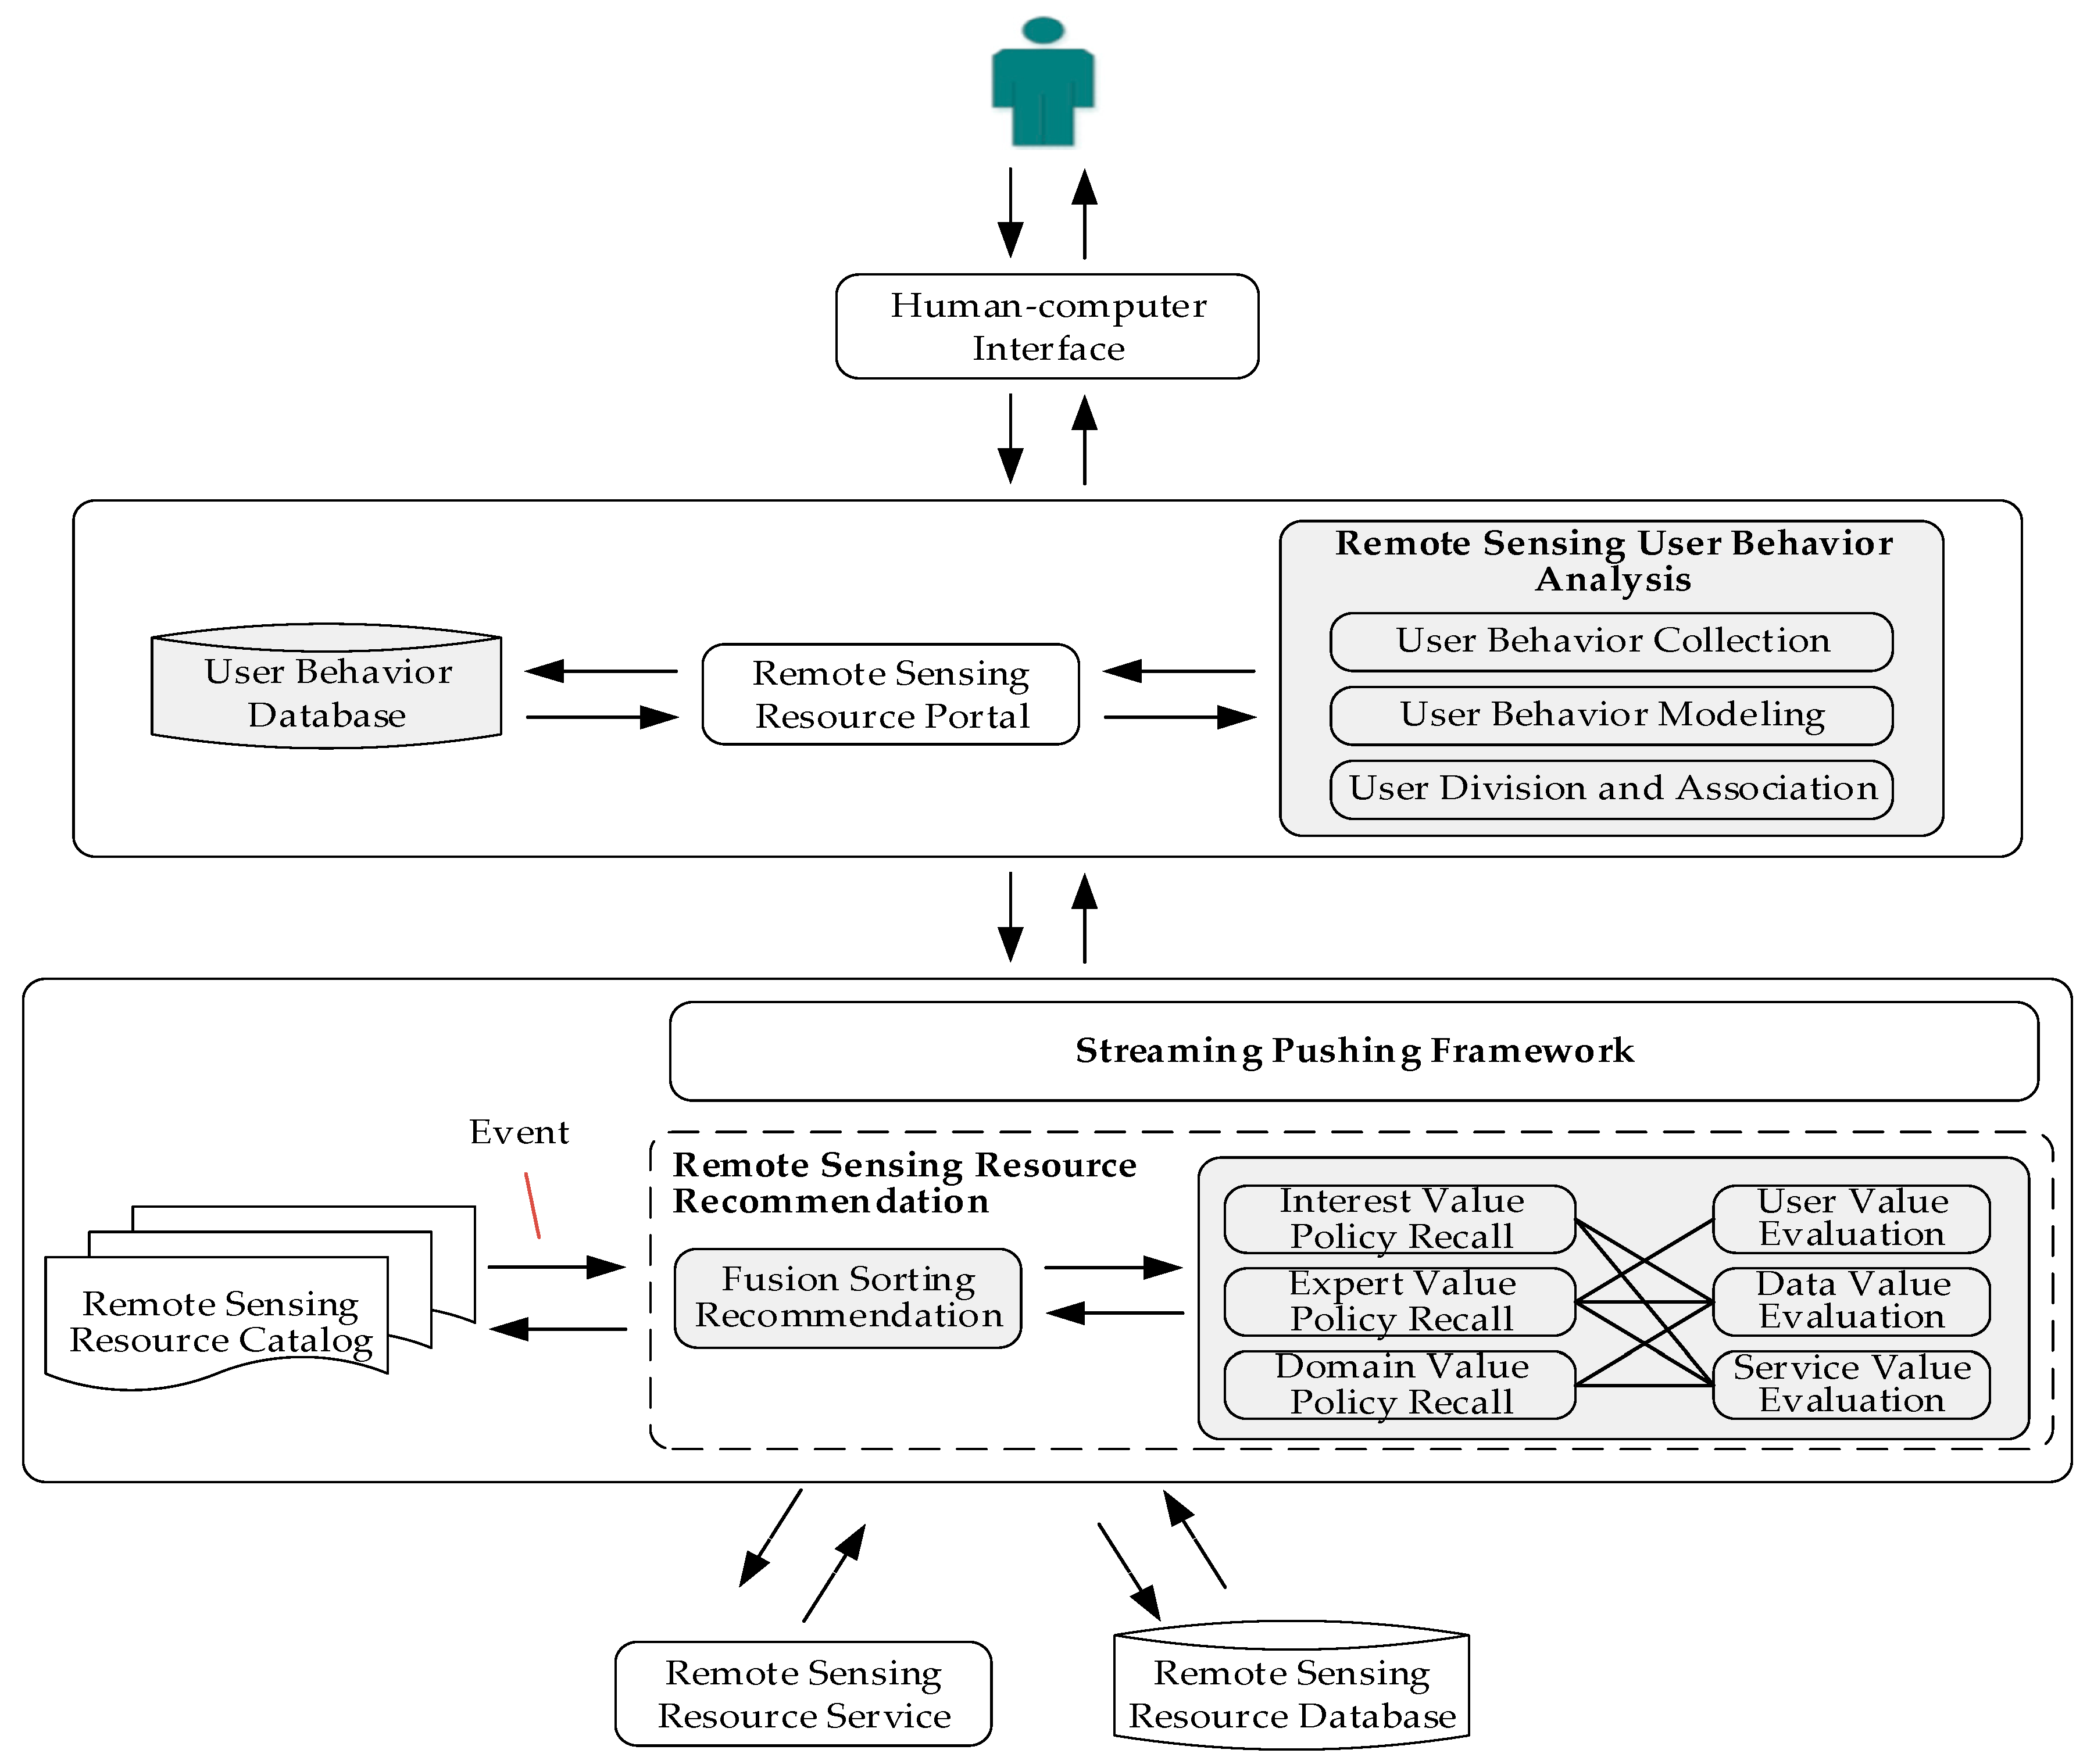
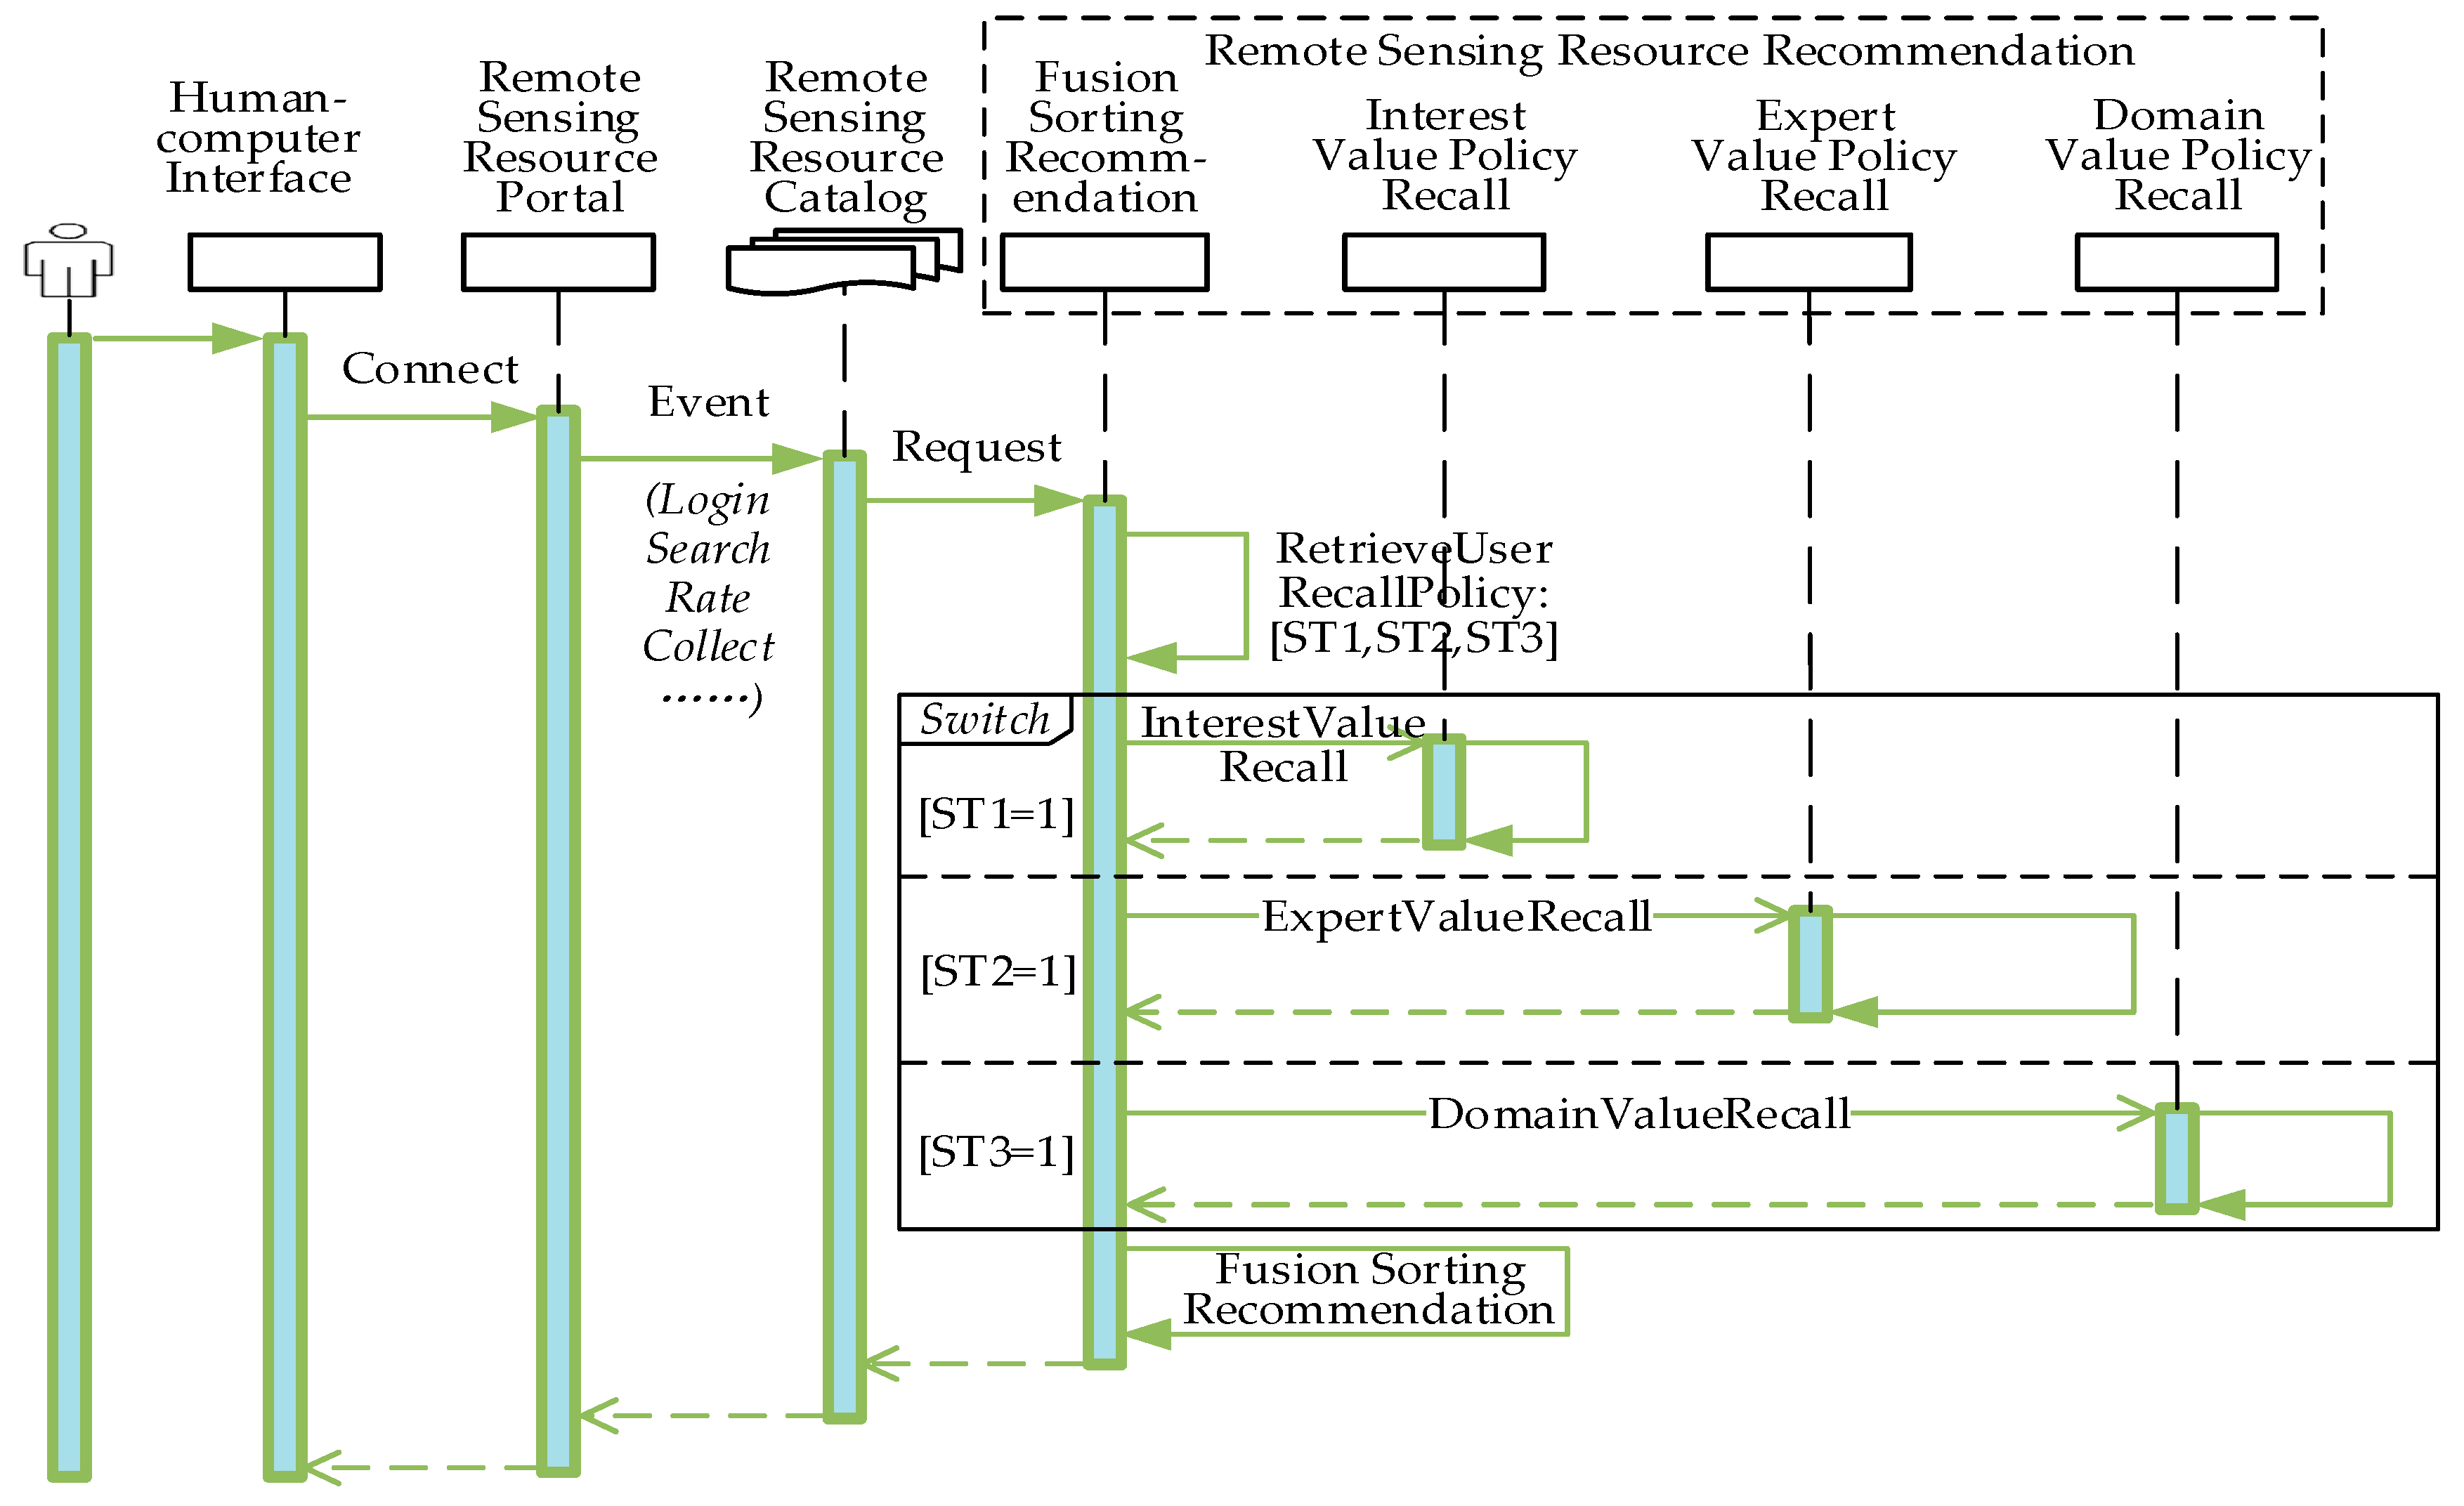
3.3.3. The Implementation of Recommendation Algorithm

On the base of MRS_AMRA algorithm, we design the remote sensing user behavior analysis component, remote sensing resource recommendation component and streaming pushing framework as supplements to the conventional service model provided in Figure 1, and propose an active service recommendation model of multi-source remote sensing information (MRS_ASRM), as shown in Figure 5. In this model, the remote sensing user behavior analysis component, as an integral part of the remote sensing resource portal, realizes the user behavior collection, user behavior modeling, user division and association at the application-side, and persists the analysis results to the user behavior database. The remote sensing resource recommendation component, as an integral part of the remote sensing resource catalog, realizes fusion sorting and the recommendation of remote sensing data and service resources at the service-side. It integrates resource discovery policies (user interest value policy, expert value policy and domain value policy) through deep collaborative filtering technology combined with the attention mechanism to improve recommendation performance. The streaming pushing framework realizes real-time information interaction between the remote sensing portal and the remote sensing resource catalog.
Based on the WebSocket technology [42], we design and implement a streaming pushing framework for remote sensing resources recommendation, as shown in Figure 6. The framework uses a reactor thread pool to manage the massive WebSocket connection channels from application clients, and uses an I/O thread pool to handle resource pushing tasks from different client channels. In Figure 6, each reactor aggregates a multiplexed WebSocket channel selector, which can register, monitor and poll hundreds of channels at the same time, so that a thread can handle the connections of many clients at the same time, thus improving the substantial concurrent request processing capability of the system. Meanwhile, we encapsulate time-consuming processes, including recall and recommendation, as tasks, and employ an I/O thread pool for concurrent processing to meet high real-time pushing requirements of remote sensing users.
Figure 7 shows the timing diagram of remote sensing resources recommendation. Firstly, users connect to the remote sensing resource portal through human-computer interfaces and log in to the system. When the event notification that the user has successfully logged in is received, then after receiving the user operation event, such as search, rate, collect, etc., the remote sensing resource recommendation component performs resource recommendation in real time: ① Obtain the resource discovery policies set by the user through the R e t r i e v e U s e r R e c a l l P o l i c y method. ② Conduct value evaluation from multi-perspective and recall resources according to the policies. ③ Carry out fusion sorting and top-K recommendation.

4. Experiments

In this section, comparative experiments are carried out to verify the effectiveness of the methodology we proposed, consisting of the performance experiment of the recommendation algorithm, MSR_AMRA, and the availability experiment of recommendation model, MSR_ASRM. In experiments, the remote sensing resources that were accumulated in production operations and the opensource dataset are used as materials, and the traditional collaborative filtering methods (such as DIN [40] and NeuralCF [41]), and the most advanced geographic resource recommendation methods (such as Geoportal [13]), are used for comparison.

4.1. Experimental Setting

We conduct comparative experiments on a platform built on TensorFlow-GPU 2.4.3 deep learning framework and Python 3.7 under the environment of CentOS 7 with a corresponding hardware configuration of CPU 8-core Intel Xeon E5-2630 v4, 64 GB memory, 1 TB disk, Nvidia Tesla P100 GPU and 16 GB video memory.
We take the WS-DREAM [43] open-source dataset to verify the performance of the recommendation algorithm, and use the remote sensing resources dataset in an actual project dataset to verify the availability of the recommendation model.
  • The WS-DREAM dataset
The WS-DREAM dataset is a well-known, open-source dataset, which contains 339 users’ real-world usage data on 5825 web services. WS-DREAM is the largest published service resource dataset in a real-world environment and consists of four files: userlist.txt, wslist.txt, rtMatrix.txt, and tpMatrix.txt, which provide user information, service information, service response time, and throughput respectively, as shown in Table 3. However, this dataset does not directly provide users with evaluation labels of resources. So, we convert the service response time ( r t ) and throughput ( t p ) into the click-through rate ( c t r ) using Formula (20), and generate a set of user labels for algorithm training by marking the resources with c t r that are greater than 0.65 as “user likes” and the remaining resources as “user dislikes”.
c t r = λ · r t + 1 λ · t p , s . t .   r t = r t m a x r t / r t m a x , t p = t p / t p m a x .
  • The remote sensing resource dataset
Typical remote sensing data resources and remote sensing service resources are gathered in this dataset. There are ten types of typical remote sensing data resources covering the whole world, including satellite image data, three-dimensional terrain data, street view image data, vector map data, etc. The remote sensing data resources in this dataset belong to different domains, such as land resource, marine resource, ecological environment, urban planning, population distribution, etc., and the resolution of them is over 30 m. The remote sensing service resources in the dataset contain a large number of services accumulated in the remote sensing production business, including offline batch processing, spatial analysis, image processing, data extraction, data access, product production, environmental assessment, spatial calculation, decision support and other business types.
In terms of experimental evaluation, we selected metrices widely used in the domain of information recommendation for algorithm performance evaluation, including Mean Absolute Error (MAE), F1-Score, Normalized Discounted Cumulative Gain (NDCG), as shown in Formulas (21)–(23):
M A E = i = 1 N y ^ i y i / N ,
where y i and y ^ i represent the real value and predicted value of the resource evaluation respectively, and N is the total number of resources. The smaller the M A E , the higher the prediction accuracy, and vice versa.
F 1 S c o r e = 2 × P r e c i s i o n × R e c a l l P r e c i s i o n + R e c a l l s . t .   P r e c i s i o n = T P / T P + F P R e c a l l = T P / T P + F N ,
where T P denotes the number of samples that are both positive, in fact, and predicted; F P denotes the number of samples that are negative but predicted to be positive; F N denotes the number of samples that are positive but predicted to be negative. F 1 S c o r e is a compromise between P r e c i s i o n and R e c a l l .
N D C G K = D C G K I D C G K s . t .   D C G K = i = 1 K 2 r e l i 1 l o g 2 ( i + 1 ) I D C G K = i = 1 R E L 2 r e l i 1 l o g 2 ( i + 1 ) , r e l i 0 , 1 ,
where N D C G K is the normalized discounted cumulative gain, D C G K is the discounted cumulative gain, and I D C G K is the ideal discounted cumulative gain. r e l i = 1 means that the resource at position i in the recommendation sequence is really liked by the user, otherwise r e l i = 0 . R E L and K represent the number of recalled resources and recommended resources, respectively. A larger value of N D C G K indicates that the recommended performance of top-K is better, and vice versa.

4.2. Experimental Results

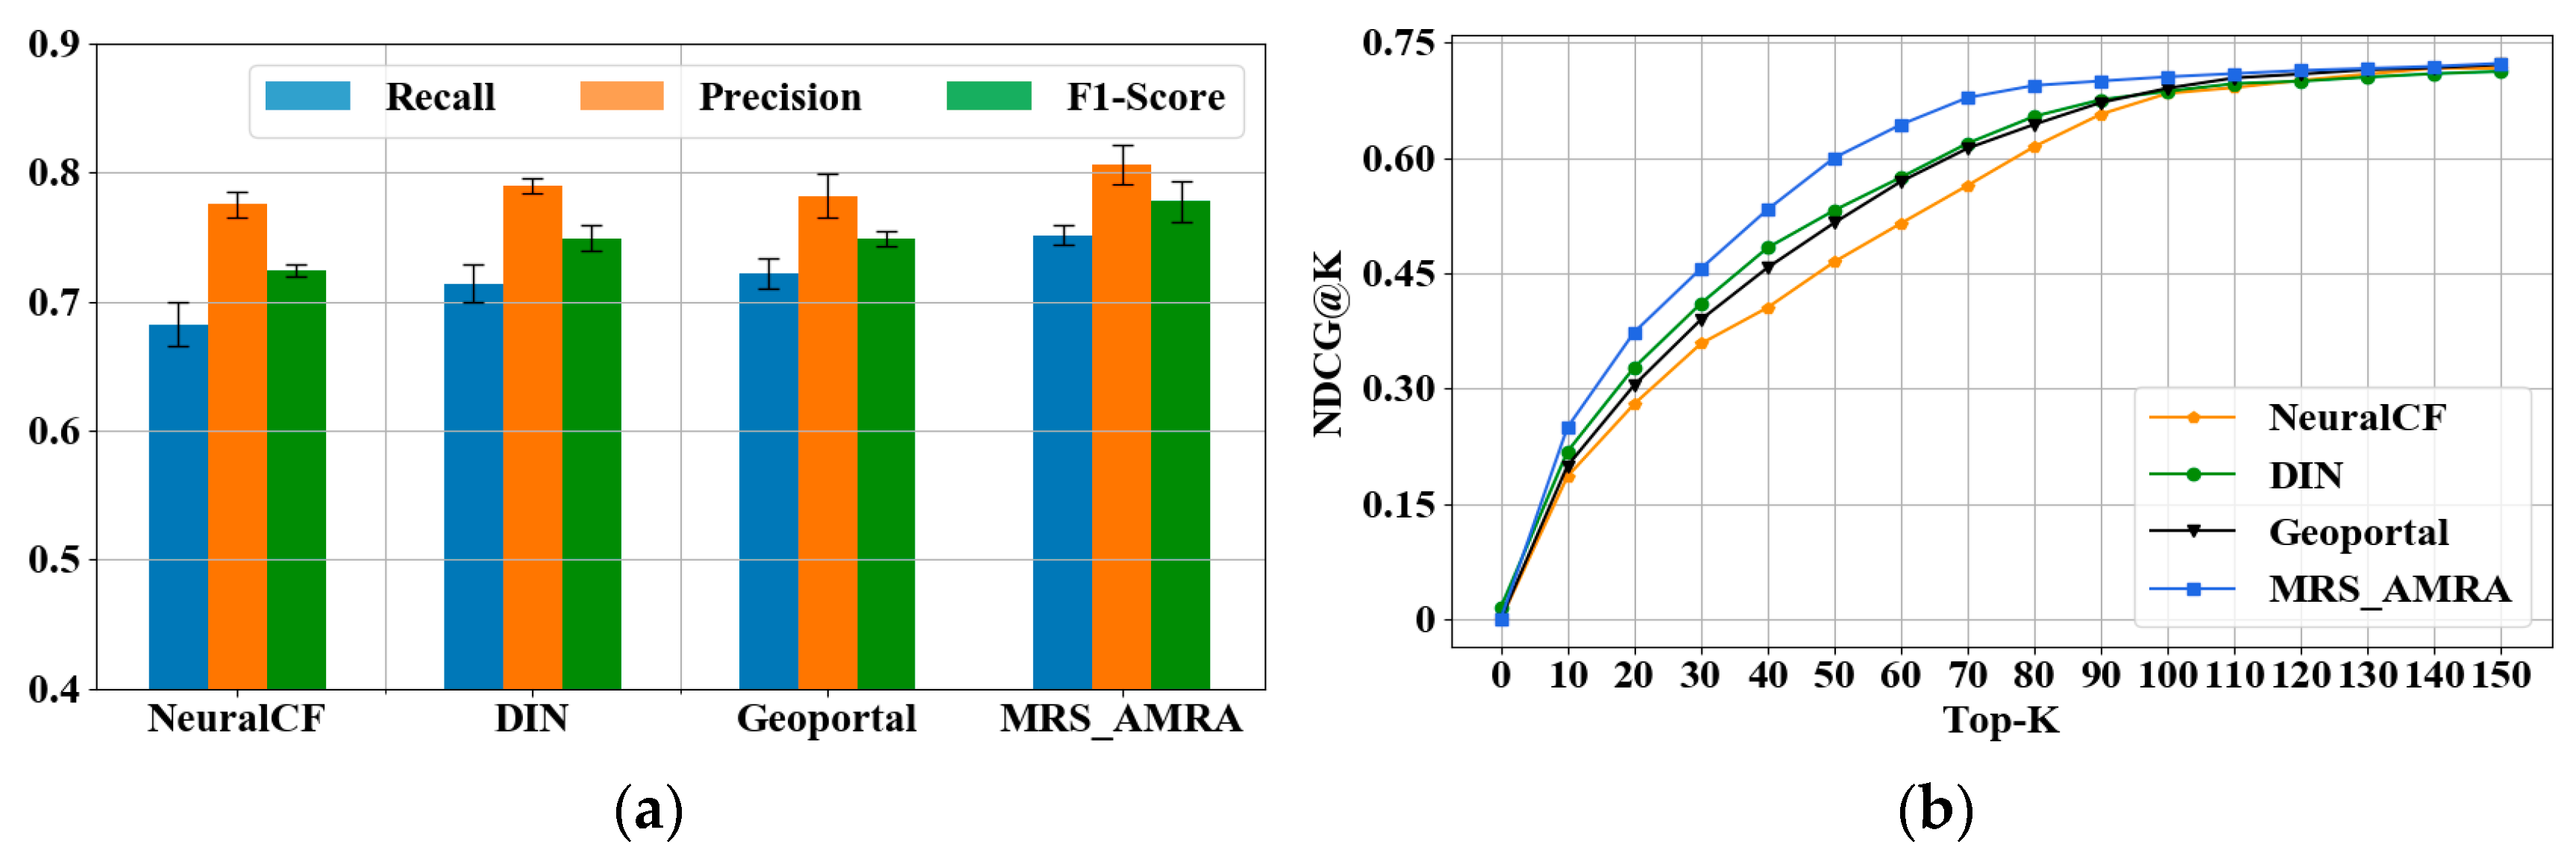
4.2.1. Performance Experiment of Recommendation Algorithm

At first, we evaluate the convergence stability of the algorithm. We use 70% of the data in WS-DREAM dataset as user historical behavior data for algorithm training (training set), and 30% as user future behavior data for algorithm testing (testing set). As can be seen from the Train Loss in Figure 8 that after a few iterations, the MAE errors of all algorithms decrease rapidly, which mainly benefits the matrix decomposition technology, which can deeply mine the high-level features of users and resources and has good convergence. With the number of iterations increasing to A point, Geoportal and DIN began to outperform NeuralCF. However, as the iteration continues to increase, the Geoportal and DIN declines began to slow. Note that MRS_AMRA has gradually widened the gap with the comparison algorithms. When the iteration increases to point B, MRS_AMRA has achieved the same performance evaluation as the final convergence of Geoportal and DIN, and continues to decline until stable convergence. From the convergence trend, MAE forms three obvious levels, the top is NeuralCF, the middle is Geoportal and DIN, and the bottom is MRS_AMRA, which shows that the convergence performance of MRS_AMRA is obviously superior. As can be seen from the Test Loss in Figure 8, the test error and training error of each comparison algorithm maintain a strong consistency, and the performance ranking is MRS_AMRA > Geoportal ≈ DIN > NeuralCF. Numerical analysis shows that the MAE error of MRS_AMRA is improved by about 10.3% 7.6%, and 7.9% on average, compared with NeuralCF, Geoportal and DIN. By grouping users from two dimensions of static and dynamic attributes, MRS_AMRA reduces the search scope of optimal resources and speeds up the algorithm convergence. At the same time, by integrating the characteristics of current users’ historical interests, domain experts, and high-value resources in related domains, more accurate user interest prediction is achieved, and the accuracy of resource evaluation is improved. However, the convergence of NeuralCF is difficult to improve due to network structure deficiencies. The performance of DIN proves the effectiveness of the attention mechanism, but faces bottlenecking due to the lack of domain information considerations. Despite Geoportal using collaborative filtering to integrate user domain and geographic similarity information, the use of traditional matrix decomposition methods limits the final convergence performance of the algorithm.
Then, we evaluate the top- K recommendation performance of the algorithm. By fixing the number of recalled resources, we compared the three metrices of Recall, Precision and F1-Score. By changing the number of recommended resources, we compared the normalized discounted cumulative gain (NDCG@ K ). As can be seen from Figure 9a, the F1-Score of MRS_AMRA is superior to comparison algorithms, and the Recall is greatly improved while ensuring substantial Precision. Meanwhile, From Figure 9b, with the increase of recommendation number K , NDCG@ K metric of MRS_AMRA is gradually superior to comparison algorithms, which shows that the resource sequence recommended by MRS_AMRA is substantially similar to the real resource sequence used by users. Compared with NeuralCF, Geoportal and DIN, MRS_AMRA achieves the maximum performance improvement of about 22.5%, 14.5% at K = 50, respectively. Even when K = 10, performance improvements about 12.7%, 10% and 6.3% were achieved. In actual application scenarios, users usually focus on the top 50 resources in the recommendation sequence, so the top- K recommendation performance of MRS_AMRA can fully meet user requirements. The experimental results show that MRS_AMRA is effective in integrating heuristic resource discovery policies with the attention mechanism. Firstly, the heuristic policies ensure high-resource Recall and Precision in terms of interest value, expert value, and domain value, and effectively reduces the range of candidate resources. Then, the attention mechanism reacts adaptively and adjusts the weight coefficients of different candidate resources in applicability, value and novelty, so it effectively capture users’ potential interests and value pattern changes to achieve an accurate recommendation. However, comparison algorithms pose recommendation accuracy problems due to their single resource screening policies, such as DIN using only interest matching, which is difficult to broaden the user’s interest domain and effectively capture user interest drift.
Next, we evaluate the cold-start recommendation performance of the algorithm. By setting the number of cold-start users in different proportions, we compared the F1-Score and NDCG@K metrics of each algorithm. As can be seen from Figure 10a, with the increase of the number of cold-start users, the F1-Score of all algorithms gradually decreases due to the increasing sparsity of the training dataset, but the downward trend of MRS_AMRA is relatively flat, especially when the proportion of cold-start users is 50–70%. NeuralCF, DIN and Geoportal have a precipitous decline, as can be seen from Figure 10b–e; the fluctuation range of NDCG@K metrics fluctuates greatly at this stage. The reason is that these algorithms mainly rely on the decomposition of the user-resource contribution matrix; when the matrix sparsity becomes larger, less feature the information of users, and resources can be extracted, which leads to lower recommendation accuracy. On the contrary, MRS_AMRA reduces the search scope of optimal resources by grouping users, and effectively compounds the popularized recommendation problem caused by the lack of features of cold-start users and resources through the recommendation of expert users and domain value resources.
Finally, we conduct an ablation experiment to evaluate the effectiveness of the multi-perspective fusion network (MFN) and the attention network (AN). Specifically, MFN and AN are sequentially integrated on the basis of NeuralCF to evaluate the algorithm’s recommendation performance. F1-Score and NDCG@K metric values are recorded, as shown in Figure 11. Data analysis shows that the F1-Score, NDCG@30, and NDCG@50 metrics improve by about 6.9%, 10.3%, and 12.5% after integrating MFN alone, compared to NeuralCF, and the performance improves by about 12.1%, 21.3%, and 22.5% after integrating both MFN and AN. Therefore, the deep collaborative filtering network integrates the multi-perspective fusion network and attention network, which can improve the recall performance and recommendation accuracy of the algorithm. MFN reduces the retrieval of user-preferred resources through multiple heuristic resource discovery policies based on user grouping and value evaluation, while AN achieves comprehensive evaluation and precise recommendation of resources in terms of applicability, value and novelty through the user attention mechanism.

4.2.2. Availability Experiment of Recommendation Model

We carried out an availability experiment on an actual project dataset to testify the effectiveness and functional superiority of the recommendation model we proposed when compared to traditional methods, such as the traditional content-based retrieval method and subscription-based retrieval method. We validate the general process and critical functions of the recommendation model at first. Then, we illustrate its efficaciousness through horizontal contrast with the traditional content-based retrieval method and subscription-based retrieval method from aspects of service mode, usage threshold and retrieval accuracy. Finally, we substantiated the real-time recommendation capability of the recommendation model when resources are newly available in the remote sensing information platform.
Benefiting from the completed user-behavior analysis process in the proposed recommendation model, including user-behavior modeling, user division and association, users can acquire satisfactory remote sensing data and remote sensing services without tedious procedures, such as query criteria input and resource orders submission. We randomly select two kinds of users with different data scales for experimental study, in which User37 has 10 months of historical interaction data, while User101 has only 2 months. The user behavior information models are shown in Figure 12, and Figure 13 provides the distribution of recommended resources in the multi-perspective space.
In Figure 12, the professional attributes of users are filled at registration, while the behavior attributes and the trend attributes are initialized at registration and updated with periodic analysis of the behavior information. Figure 13 shows the distribution of the resources recommended in the multi-perspective space. The coordinates of resources in three-dimensions indicate their evaluations based on three policies. Additionally, different colors are used to represent different recommendation levels. Meanwhile, we extracted the attributes of the top three remote sensing data resources and remote sensing service resources, including service ID, business type, data type, data level, provider and timestamp. Analysis of the results in Figure 13 show that the recommended resources for User37, with a large historical data scale, have a more balanced distribution in the multi-perspective space, indicating that the recommended resources have greater evaluation results among multiple resource recall policies. However, for User101 with a small historical data scale, recommendation resources tend to favor expert value policy and domain value policy, indicating that proactive service can compensate for the recommendation problem caused by sparse user data through expert and domain collaborations. This leads to the conclusion that the digital earth proactive service can effectively recommend resources that meet users’ needs in policies, such as user interest value, expert value and domain value, and help users to discover content of potential interest, which is practical in the remote sensing resource supply.
Then, we adopt the proposed active service recommendation model, the content-based retrieval method [44] and subscription-based retrieval method [45] to successfully execute remote sensing resource query operations 100 times under the same experimental environment. We record detailed system interaction information during each query, such as the time required for users to perform operations, i.e., filling in query conditions, and the query time of each execution. Then, we calculate the count of system interactions, system interaction time, average query time and total query time when all queries are completed. The user provides a satisfaction rating after each query, such as “Satisfied”, “Slightly Satisfied”, “Not very satisfied” and “Unsatisfied”. The satisfaction rating with the highest percentage among all queries is regarded as the final result. Finally, we list the characteristics and experimental results of the three service methods in Table 4 to conduct comprehensive comparisons.
As shown in Table 4, compared with the content-based retrieval method and subscription-based retrieval method, the active service recommendation has a greater user satisfaction, lower system operation complexity, and higher query efficiency. Additionally, users only need to offer a simple interaction to be provided with resources matching their interests from the massive remote sensing data and remote sensing services. However, the content-based retrieval method relies strongly on contextual input conditions, which are difficult to adapt to potential changes in user interests. Furthermore, the subscription-based retrieval method requires users to specify their preferred types of resources and initiate subscriptions, but in most cases, users fail to explicitly indicate their preferences, which requires extensive retrieval operations and independent judgment by users. This is mainly due to how the active service recommendation performs its optimization from two aspects. Firstly, the active service recommendation carries out user behavior analysis and user grouping in real time through the daemon process. Users are not required to input query criteria and perform the search process manually to obtain resources. When a user logs in to the system or browses resources, the active service process is triggered to automatically recommend resources of interest, simplifying the interaction between the user and the system. Secondly, instead of manually adjusting the query criteria to improve accuracy, the proactive service method will fuse and rank the results that are recalled from multi-perspectives in terms of user interest value, expert value, and domain value, and can meet user needs by capturing changes in user interests. Thus, the proposed active service recommendation model can reduce interactions and save resource acquisition time effectively.
When new remote sensing data resources and remote sensing service resources are released in the platform, the remote sensing resource catalog will instantly notify the resource recommendation component to execute recommendation process again via event triggering. We use the average value of other resources in the domain, to which the new resources belong as the initial value, to solve the cold-start problem caused by the lack of historical interactive information. Taking User37 as an example, the recommendation results after new resources going online are provided in Figure 14, and red rectangular boxes are used to indicate the new online resources.
Analyzing the results in Figure 14, we can see that the remote sensing information recommendation can recall newly available resources from the perspective of domain value (ST3), and recommend them to users as a supplement to the primal results. Therefore, it can be considered that the recommendation model we proposed can recommend remote sensing data and remote sensing services to users in real-time, and help them to perceive new values in the remote sensing information platform.

5. Conclusions

Aiming at the complex problems of information management and active service in the remote sensing information system, we innovatively put forward the recommendation model of multi-source remote sensing using a fusion of attention and multi-perspective. Firstly, we construct a method of information extraction and value evaluation on the user-side by analyzing and mining the composition, access frequency and behavior trajectory of remote sensing users. Additionally, the value evaluation method on the resource-side is constructed by the use of characteristics, cost accounting and actual value of the remote sensing data and remote sensing service resources in the online process of the remote sensing information system. Then, we defined multi-perspective heuristic policies to support resource discovery, including the user interest value policy, the expert value policy and the domain value policy. We take advantage of the attention network to fuse these multi-perspective resource discovery policies, and propose a neural network based recommendation algorithm. Based on the recommendation algorithm, we further propose and implement an active service recommendation model by combining streaming pushing technology. Finally, we implement comparative experiments to simulate various recommendation scenarios and verify the effectiveness from the aspects of service availability and recommendation accuracy. The proposed active service recommendation model can be potentially applied in many fields to help users achieve efficient data acquisition and accurate analysis, improve work efficiency and decision-making. For example, in the fields of environmental detection and urban planning, applications, such as water pollution analysis, urban expansion monitoring and forest resource monitoring, can be realized through the recommendation and intelligent combination of remote sensing service resources. In the field of agricultural production, the recommendation of remote sensing data resources can assist users to carry out a land resource survey, precise fertilization, etc., and improve the efficiency of agricultural production. In addition, another direction of research application is to provide effective data support for other domain technologies, such as UAV cluster system [46], new mechanized operation system [47], etc. Although we have done lots of work on remote sensing resource assessment and real-time recommendation in this study, we were not able to bring the algorithm online to a large-scale, real production environment for A/B testing due to the limitation of the research environment, and we failed to consider the time-series process of the remote sensing user and resource value change in this study. In the following research, we will attempt to establish a sequence model of value changes on remote sensing users and resources, and adopt reinforcement learning technology for online real-time learning and update of the model, to further improve the timeliness and effectiveness of the remote sensing resource recommendation.

Author Contributions

Conceptualization, L.Z., F.W. and K.F.; Formal analysis, F.W., K.F., Y.H. and Y.W.; Investigation, Y.W.; Methodology, L.Z.; Project administration, F.W. and Y.H.; Resources, X.T.; Software, L.Z.; Supervision, Y.W. and X.T.; Validation, K.H.; Visualization, K.H.; Writing—original draft, L.Z.; Writing—review & editing, F.W. and K.F. All authors have read and agreed to the published version of the manuscript.

Funding

This research was funded by the Science and Technology Innovation 2030 Major Project-Application Verification of Decision-making Support Scenarios of Science and Technology Strategic Game in Big Countries, grant number 2022ZD0116407.

Data Availability Statement

Publicly available datasets were analyzed in this study. This data can be found here: http://wsdream.github.io/dataset/wsdream_dataset1.html (accessed on 6 May 2023).

Conflicts of Interest

The authors declare no conflict of interest.

References

  1. Li, D.R.; Ding, L.; Shao, Z.F. Application-oriented real-time remote sensing service technology. Natl. Remote Sens. Bull. 2020, 25, 15–24. [Google Scholar]
  2. Long, E.; Lü, S.Y.; Cen, P.R.; Yang, Y.; Weir, E.; Bai, L. An intelligent recommendation method of multi-source remote sensing information considering user portrait. Acta Geod. Cartogr. Sin. 2022, 52, 297–306. [Google Scholar]
  3. Zheng, Z.; Ma, H.; Lyu, M.R.; King, I. QoS-aware web service recommendation by collaborative filtering. IEEE Trans. Serv. Comput. 2011, 4, 140–152. [Google Scholar] [CrossRef]
  4. Tang, M.; Jiang, Y.; Liu, J.; Liu, X. Location-aware collaborative filtering for qos-based service recommendation. In Proceedings of the 19th International Conference Web Services (ICWS’12), Honolulu, HI, USA, 24–29 June 2012; pp. 202–209. [Google Scholar]
  5. Chelliah, B.J.; Vivekanandan, K. Location-aware collaborative filtering for web service recommendations based on user and service history. J. Eng. Sci. Technol. Rev. 2017, 10, 190–194. [Google Scholar] [CrossRef]
  6. Peng, Q.; You, L.; Dong, N. A location-aware GIServices quality prediction model via collaborative filtering. Int. J. Remote Sens. Inf. Syst. 2018, 11, 897–912. [Google Scholar] [CrossRef]
  7. Yao, L.; Sheng, Q.Z.; Ngu, A.H.H.; Yu, J.; Segev, A. Unified collaborative and content-based web service recommendation. IEEE Trans. Serv. Comput. 2015, 8, 453–466. [Google Scholar] [CrossRef]
  8. Sangers, J.; Frasincar, F.; Hogenboom, F.; Chepegin, V. Semantic web service discovery using natural language processing techniques. Expert Syst. Appl. 2013, 40, 4660–4671. [Google Scholar] [CrossRef]
  9. Paul, M.; Ghosh, S.K. Toward assessing semantic similarity of geospatial services. In Proceedings of the Tencon IEEE Region 10 Conference, Hong Kong, China, 14–17 November 2006; pp. 1–4. [Google Scholar]
  10. Bener, A.B.; Ozadali, V.; Ilhan, E.S. Semantic matchmaker with precondition and effect matching using SWRL. Expert Syst. Appl. 2009, 36, 9371–9377. [Google Scholar] [CrossRef]
  11. Luo, A.; Wang, Y.; Wang, L.; He, Y. Multi-level semantic matching of geospatial web services. In Proceedings of the 2009 17th International Conference on Geoinformatics, Fairfax, Virginia, 12–14 August 2009; pp. 1–5. [Google Scholar]
  12. Wu, Q.Y.; Zheng, X.M.; Kang, L.J. A semantic geospatial service matching algorithm. In Proceedings of the The 2nd International Conference on Information Science and Engineering, Hangzhou, China, 4–6 December 2010; pp. 3475–3478. [Google Scholar]
  13. Dareshiri, S.; Farnaghi, M.; Sahelgozin, M. A recommender geoportal for geospatial resource discovery and recommendation. J. Spat. Sci. 2019, 64, 49–71. [Google Scholar] [CrossRef]
  14. Lai, J.B.; Kang, X.D.; Lu, X.K.; Li, S.T. A review of land observation satellite remote sensing application technology with new generation artificial intelligence. Natl. Remote Sens. Bull. 2022, 26, 1530–1546. [Google Scholar]
  15. Yan, K.; Chen, H.M.; Fu, D.J.; Zeng, Y.L.; Dong, J.W.; Li, S.W.; Wu, Q.S.; Li, H.L.; Du, S.Y. Bibliometric visualization analysis related to remote sensing cloud computing platforms. Natl. Remote Sens. Bull. 2022, 26, 310–323. [Google Scholar]
  16. Li, D.R.; Zhang, L.P.; Xia, G.S. Automatic analysis and mining of remote sensing big data. Acta Geod. Cartogr. Sin. 2014, 43, 1211–1216. [Google Scholar]
  17. Fu, K.; Sun, X.; Qiu, X.L. Multi-satellite integrated processing and analysis method under remote sensing big data. Natl. Remote Sens. Bull. 2021, 25, 691–707. [Google Scholar]
  18. Fu, D.J.; Xiao, H.; Su, F.Z.; Zhou, C.H.; Dong, J.W.; Zeng, Y.L.; Yan, K.; Li, S.W.; Wu, J.; Wu, W.Z.; et al. Remote sensing cloud computing platform development and Earth science application. Natl. Remote Sens. Bull. 2021, 25, 220–230. [Google Scholar]
  19. Liu, W.Q.; Wang, C.; Zang, Y.; Hu, Q.; Yu, S.S.; Lai, B.Q. A survey on information extraction technology based on remote sensing big data. Big Data Res. 2022, 14, 28–57. [Google Scholar]
  20. Geng, Y.; Tao, C.; Shen, J.; Zou, Z. High-resolution remote sensing image semantic segmentation based on semi-supervised full convolution network method. Geod. Cartogr. Sin. 2020, 49, 499–508. [Google Scholar]
  21. Ge, Y.; Ma, L.; Chu, J. Remote sensing image retrieval combining discriminant correlation analysis and feature fusion. J. Image Graph. 2020, 25, 2665–2676. [Google Scholar]
  22. Chen, W.T.; Te, R.G. Research on retrieval of remote sensing data service system based on PostGIS. Geomat. Spat. Inf. Technol. 2021, 44, 78–83. [Google Scholar]
  23. Li, S.Y.; Zhang, W.F.; Yang, S. Intelligence fusion method research of multisource high-resolution remote sensing images. J. Remote Sens. 2017, 21, 415–424. [Google Scholar]
  24. Hu, T.Y.; Zhao, D.; Zeng, Y.; Guo, Q.H.; He, H.L. Advances in multi⁃source data fusion for ecosystem assessment. Acta Ecol. Sin. 2023, 43, 542–553. [Google Scholar]
  25. Zhang, J.X.; Gu, H.Y.; Yang, Y.; Zhang, H.; Li, H.T. Research progress and trend of high-resolution remote sensing imagery intelligent interpretation. Natl. Remote Sens. Bull. 2021, 25, 2198–2210. [Google Scholar]
  26. Zhang, B.; Yang, X.M.; Gao, L.R.; Meng, Y.; Sun, X.; Xiao, C.; Ni, L. Geo-cognitive models and methods for intelligent interpretation of remotely sensed big data. Acta Geod. Cartogr. Sin. 2022, 51, 1398–1415. [Google Scholar]
  27. Chen, X.; Liu, Y.; Li, F.; Li, X.; Jia, X. Remote sensing image recommendation based on spatial–temporal embedding topic model. Comput. Geosci. 2022, 157, 104935–104946. [Google Scholar] [CrossRef]
  28. Hu, L.; Zhang, C.; Zhang, M.; Shi, Y.; Lu, J.; Fang, Z. Enhancing FAIR data services in agricultural disaster: A review. Remote Sens. 2023, 15, 2024. [Google Scholar] [CrossRef]
  29. Li, J.; Pei, Y.; Zhao, S.; Xiao, R.; Sang, X.; Zhang, C. A review of remote sensing for environmental monitoring in China. Remote Sens. 2020, 12, 1130. [Google Scholar] [CrossRef]
  30. Li, G.Q.; Huang, Z.C. Data infrastructure for remote sensing big data: Integration, management and on-demand service. J. Comput. Res. Dev. 2017, 54, 267–283. [Google Scholar]
  31. Shen, L.; Xu, Z.; Li, Z.L.; Liu, W.Z.; Cui, B.L. From geographic information service to geographic knowledge service: Research problems and development roadmap. J. Surv. Mapp. 2021, 50, 1194–1202. [Google Scholar]
  32. Zhang, X.W.; He, K.Q.; Wang, J.; Liu, J.X. A Survey of Web Service Personalized Recommendation Research. Comput. Eng. Sci. 2013, 35, 132–140. [Google Scholar]
  33. Tian, H.; Liang, P. Personalized service recommendation based on trust relationship. Sci. Program. 2017, 2017, 4106134. [Google Scholar] [CrossRef]
  34. Gonsalves, B.; Patil, V. LoQoS location and QoS sensitive web service recommender. In Proceedings of the 2017 International Conference on Innovations in Information, Embedded and Communication Systems (ICIIECS), Beijing, China, 24–26 June 2017; pp. 1–4. [Google Scholar]
  35. Hong, J.H.; Su, Z.L.T.; Lu, E.H.C. A recommendation framework for remote sensing images by spatial relation analysis. J. Syst. Softw. 2014, 90, 151–166. [Google Scholar] [CrossRef]
  36. Zhang, X.; Chen, D.; Liu, J. A space-time periodic task model for recommendation of remote sensing images. ISPRS Int. J. Geo-Inf. 2018, 7, 40. [Google Scholar] [CrossRef]
  37. Liu, Y.M. Fundamentals of Statistics; China Statistics Press: Beijing, China, 2002. [Google Scholar]
  38. Raftery, A.E.; Madigan, D.; Hoeting, J.A. Bayesian model averaging for linear regression models. J. Am. Stat. Assoc. 1997, 92, 179–191. [Google Scholar] [CrossRef]
  39. Papathanasiou, J.; Ploskas, N. Topsis. In Multiple Criteria Decision Aid; Springer: Cham, Switzerland, 2018. [Google Scholar]
  40. Zhou, G.; Zhu, X.; Song, C.; Fan, Y.; Zhu, H.; Ma, X.; Yan, Y.; Jin, J.; Li, H.; Gai, K. Deep interest network for click-through rate prediction. In Proceedings of the 24th ACM SIGKDD International Conference on Knowledge Discovery & Data Mining, London, UK, 19–23 August 2018; pp. 1059–1068. [Google Scholar]
  41. He, X.; Liao, L.; Zhang, H.; Nie, L.; Hu, X.; Chua, T.S. Neural collaborative filtering. In Proceedings of the 26th International Conference on World Wide Web, Perth, Australia, 3–7 April 2017; pp. 173–182. [Google Scholar]
  42. Lu, Z. Research and Implementation of Distributed cloud Push System Based on Websocket Protocol; Dalian University of Technology: Dalian, China, 2019. [Google Scholar]
  43. Zheng, Z.; Zhang, Y.; Lyu, M.R. Investigating QoS of real-world web services. IEEE Trans. Serv. Comput. 2012, 7, 32–39. [Google Scholar] [CrossRef]
  44. Wang, M.; Song, T. Remote sensing image retrieval by scene semantic matching. IEEE Trans. Geosci. Remote Sens. 2012, 51, 2874–2886. [Google Scholar] [CrossRef]
  45. Hu, Z.H.; Meng, L.K.; Zhang, W. Research on subscribe /publish mechanism for incremental data in GIS. Bull. Surv. Mapp. 2016, 1, 45–48. [Google Scholar]
  46. Yan, L.; Ahmad, M.W.; Jawarneh, M.; Shabaz, M.; Raffik, R.; Kishore, K.H. Single-input single-output system with multiple time delay PID control methods for UAV cluster multiagent system. Secur. Commun. Netw. 2022, 2022, 3935143. [Google Scholar] [CrossRef]
  47. Gao, H.; Kareem, A.; Jawarneh, M.; Ofori, I.; Raffik, R.; Kishore, K.H. Metaheuristics based modeling and simulation analysis of new integrated mechanized operation solution and position servo system. Math. Probl. Eng. 2022, 2022, 1466775. [Google Scholar] [CrossRef]
Figure 1. Conventional service model of remote sensing resource.
Remotesensing 15 02564 g001
Figure 2. Behavior information model of remote sensing user. Where 1 and * represent a one-to-many relationship between entities.
Remotesensing 15 02564 g002
Figure 3. Overview of network structure of multi-source remote sensing information recommendation using the fusion of attention and multi-perspective.
Remotesensing 15 02564 g003
Figure 4. The algorithm flow of MRS_AMRA.
Remotesensing 15 02564 g004
Figure 5. Active service recommendation model of multi-source remote sensing information (MRS_ASRM).
Remotesensing 15 02564 g005
Figure 6. Streaming pushing framework for remote sensing resources.
Remotesensing 15 02564 g006
Figure 7. Timing diagram of remote sensing resources recommendation.
Remotesensing 15 02564 g007
Figure 8. Comparison of training error and test error on WS-DREAM dataset: (a) is the relationship between MAE train loss and iteration number, (b) is the relationship between MAE test loss and iteration number.
Remotesensing 15 02564 g008
Figure 9. Comparison of performance of resource recall (a) and top- K recommendation (b) on WS-DREAM dataset.
Remotesensing 15 02564 g009
Figure 10. Comparison of cold-start recommendation performance on WS-DREAM dataset: (a) is the relationship between F1-Score and the proportion of cold-start users, and (be) are the relationship between NDCG@K and the proportion of cold-start users.
Remotesensing 15 02564 g010aRemotesensing 15 02564 g010b
Figure 11. Ablation experiment of multi-perspective fusion network (MFN) and attention network (AN): (a) is the comparison of F1-Score metric after sequentially adding MFN and AN on NeuralCF, (b) is the comparison of NDCG@K metric.
Remotesensing 15 02564 g011
Figure 12. User behavior information models with different data scales: (a) User37 with 10 months’ data, (b) User101 with 2 months’ data.
Remotesensing 15 02564 g012
Figure 13. The distribution of recommended resources in multi-policy space: (a) User37, (b) User101.
Remotesensing 15 02564 g013
Figure 14. Recommendation results after new resources going online: (a) Recommended remote sensing data resources; (b) Recommended remote sensing service resources.
Remotesensing 15 02564 g014
Table 1. Mapping of remote sensing user value level.
UA SegmentationValue LevelSF SegmentationValue LevelUC SegmentationValue Level
0 , r 1 R 1 0 , f 1 F 1 0 , m 1 M 1
r 1 , r 2 R 2 f 1 , f 2 F 2 m 1 , m 2 M 2
r γ 1 1 , 1 R γ 1 f γ 2 1 , 1 F γ 2 m γ 3 1 , 1 M γ 3
Table 2. Description of user and resource features in remote sensing information system.
CategoriesFeaturesAttributesDescription
UserBasic FeatureUserIDUser’s identification
GenderUser’s gender
AgeUser’s age
GeoRegionUser’s geographical region
EducationUser’s education background
OccupationUser’s occupation
ResearchDirectionUser’s research direction
Domain FeatureUserDomainUser’s domain
UserSubDomainUser’s sub-domain
ResourceData FeatureSatelliteCodeSatellite identification of remote sensing data
SensorCodeSensor identification of remote sensing data
ShootingTimeShooting time of remote sensing data
ProductionTimeProduction time of remote sensing data
ReferenceSystemReference system of remote sensing data
SpatialResolutionSpatial resolution of remote sensing data
DataCategoryCategory of remote sensing data
DataFormatFormat of remote sensing data
Service FeatureSvcIDIdentification of remote sensing service
SvcResponseTimeResponse time of remote sensing service
SvcThroughputThroughput of remote sensing service
SvcErrorRateRequest error rate of remote sensing service
SLAViolationRateSLA violation rate of remote sensing service
Table 3. Information statistics of WS-DREAM dataset.
StatisticsValue
Num. of Web Service Invocations1,974,675
Num. of Service Users339
Num. of Web Services5825
Num. of User Countries30
Num. of Web Service Countries73
Mean of Response-Time1.43 s
Standard Deviation of Response-Time31.9 s
Mean of Throughput102.86 kbps
Standard Deviation of Throughput531.85 kbps
Table 4. Comparison of different resource retrieval methods.
Comparison Items Active Service Recommendation ModelContent-Based Retrieval
Method [44]
Subscription-Based
Retrieval Method [45]
Service modeProactivePassiveSemi-active
User satisfactionSatisfiedNot very satisfiedNot very satisfied
Count of interactions207523336
System interaction time93 s13.2 min7.1 min
Average query time0.37 s1.08 s0.85 s
Total query time78 s9.4 min4.8 min
Disclaimer/Publisher’s Note: The statements, opinions and data contained in all publications are solely those of the individual author(s) and contributor(s) and not of MDPI and/or the editor(s). MDPI and/or the editor(s) disclaim responsibility for any injury to people or property resulting from any ideas, methods, instructions or products referred to in the content.

