
Application of Geomatic Techniques for the Assessment of Anthropogenic Changes in the Urban Beaches of “La Magdalena” (Santander, Spain)

 ,
, 

Abstract
1. Introduction
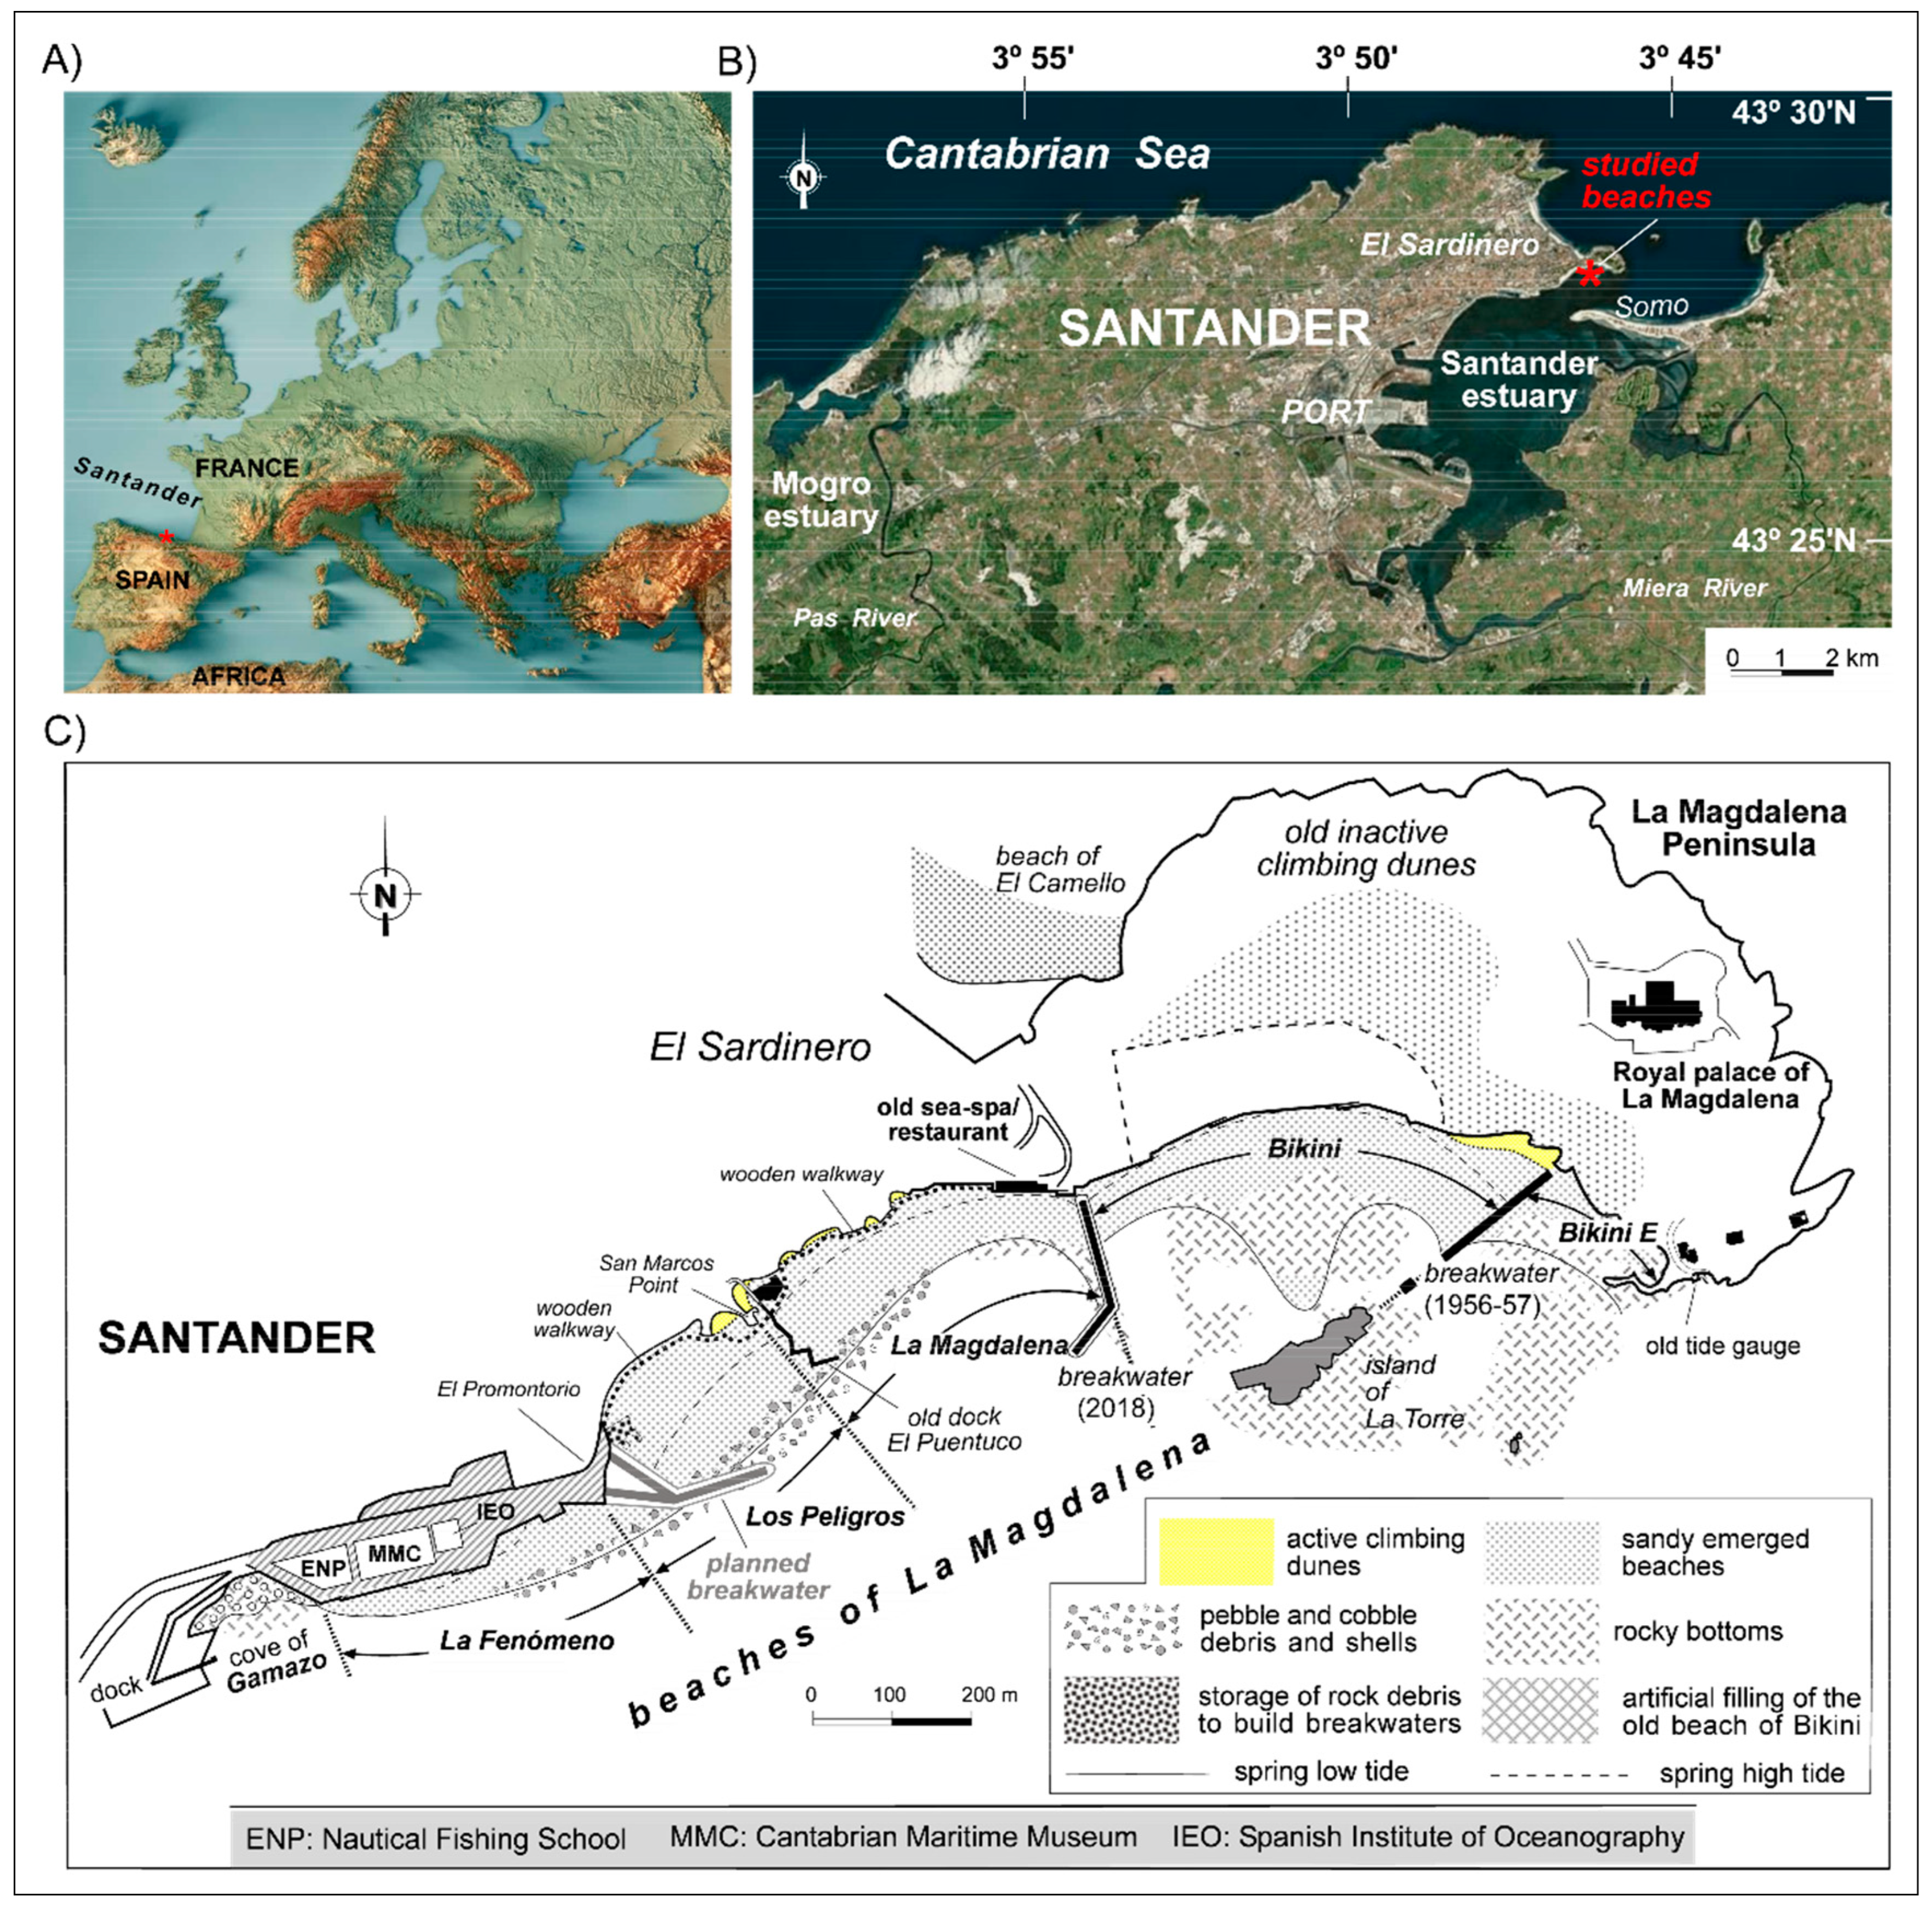
2. Study Area
3. Methodology
3.1. Aerial Photogrammetry (2005–2017)
3.2. Terrestrial Laser Scanner (2018–2021)
4. Results
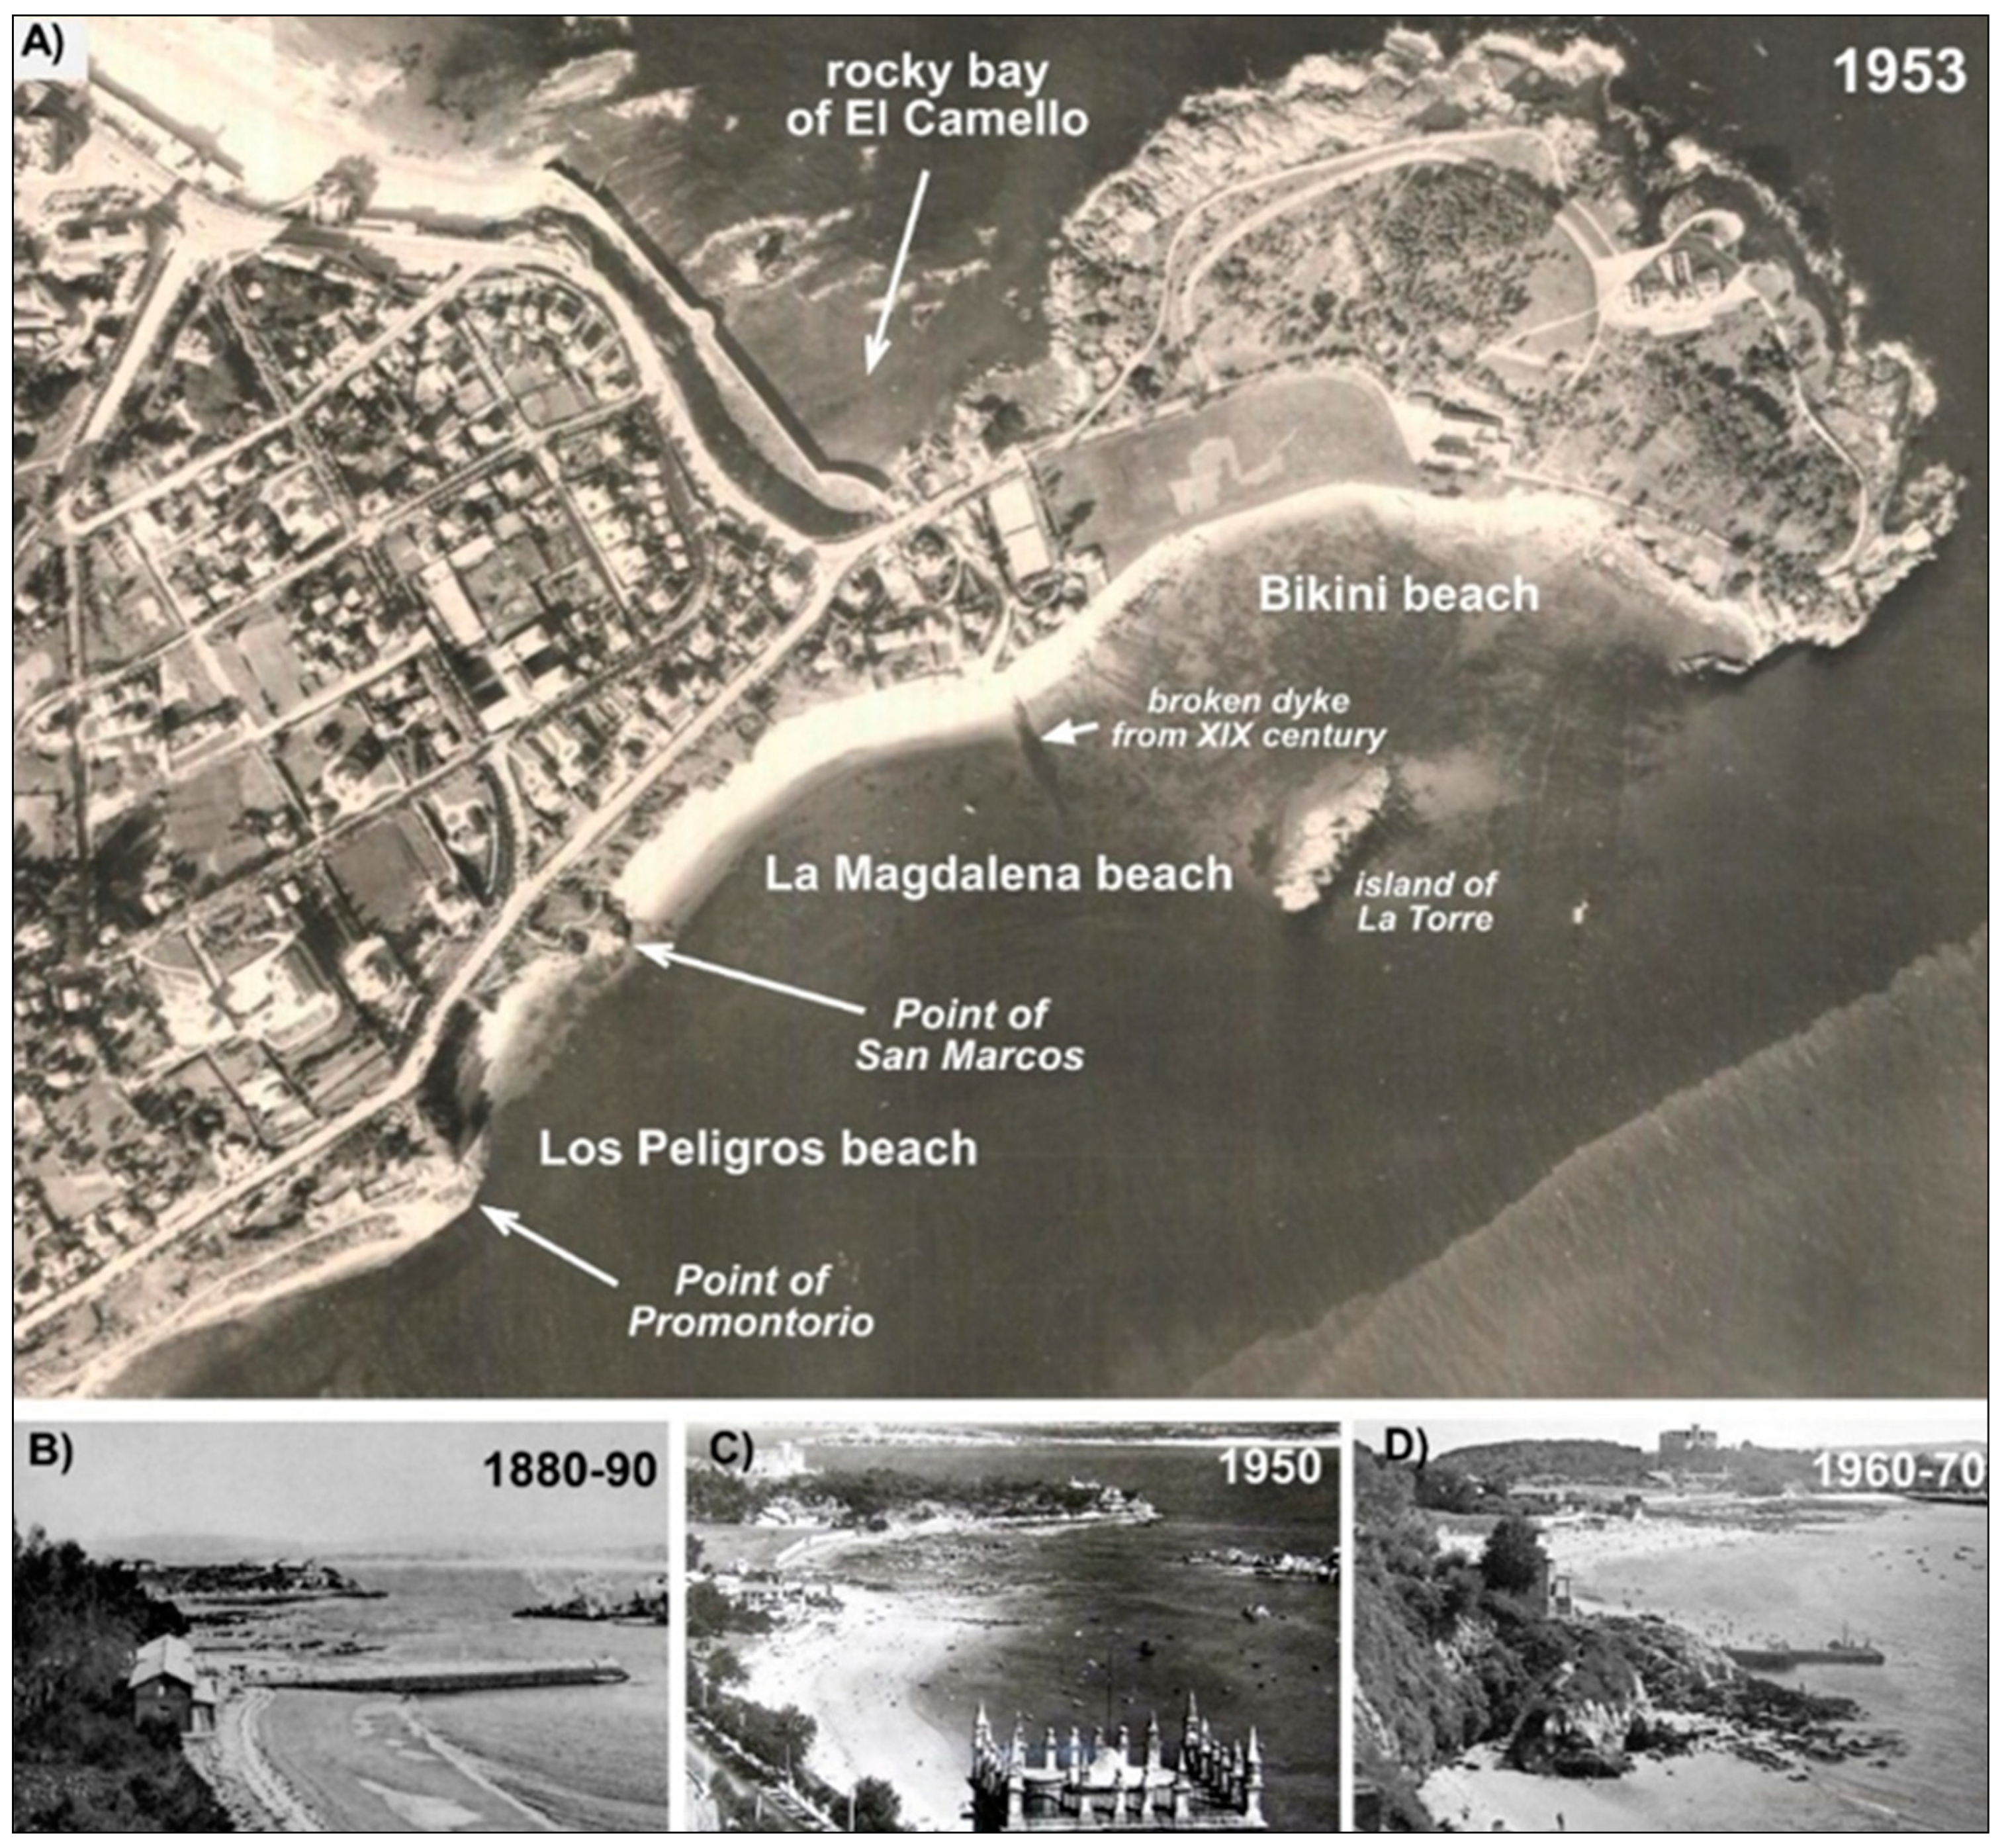
4.1. Background
4.2. The Breakwaters Project
4.3. Measurements and Volume Controls
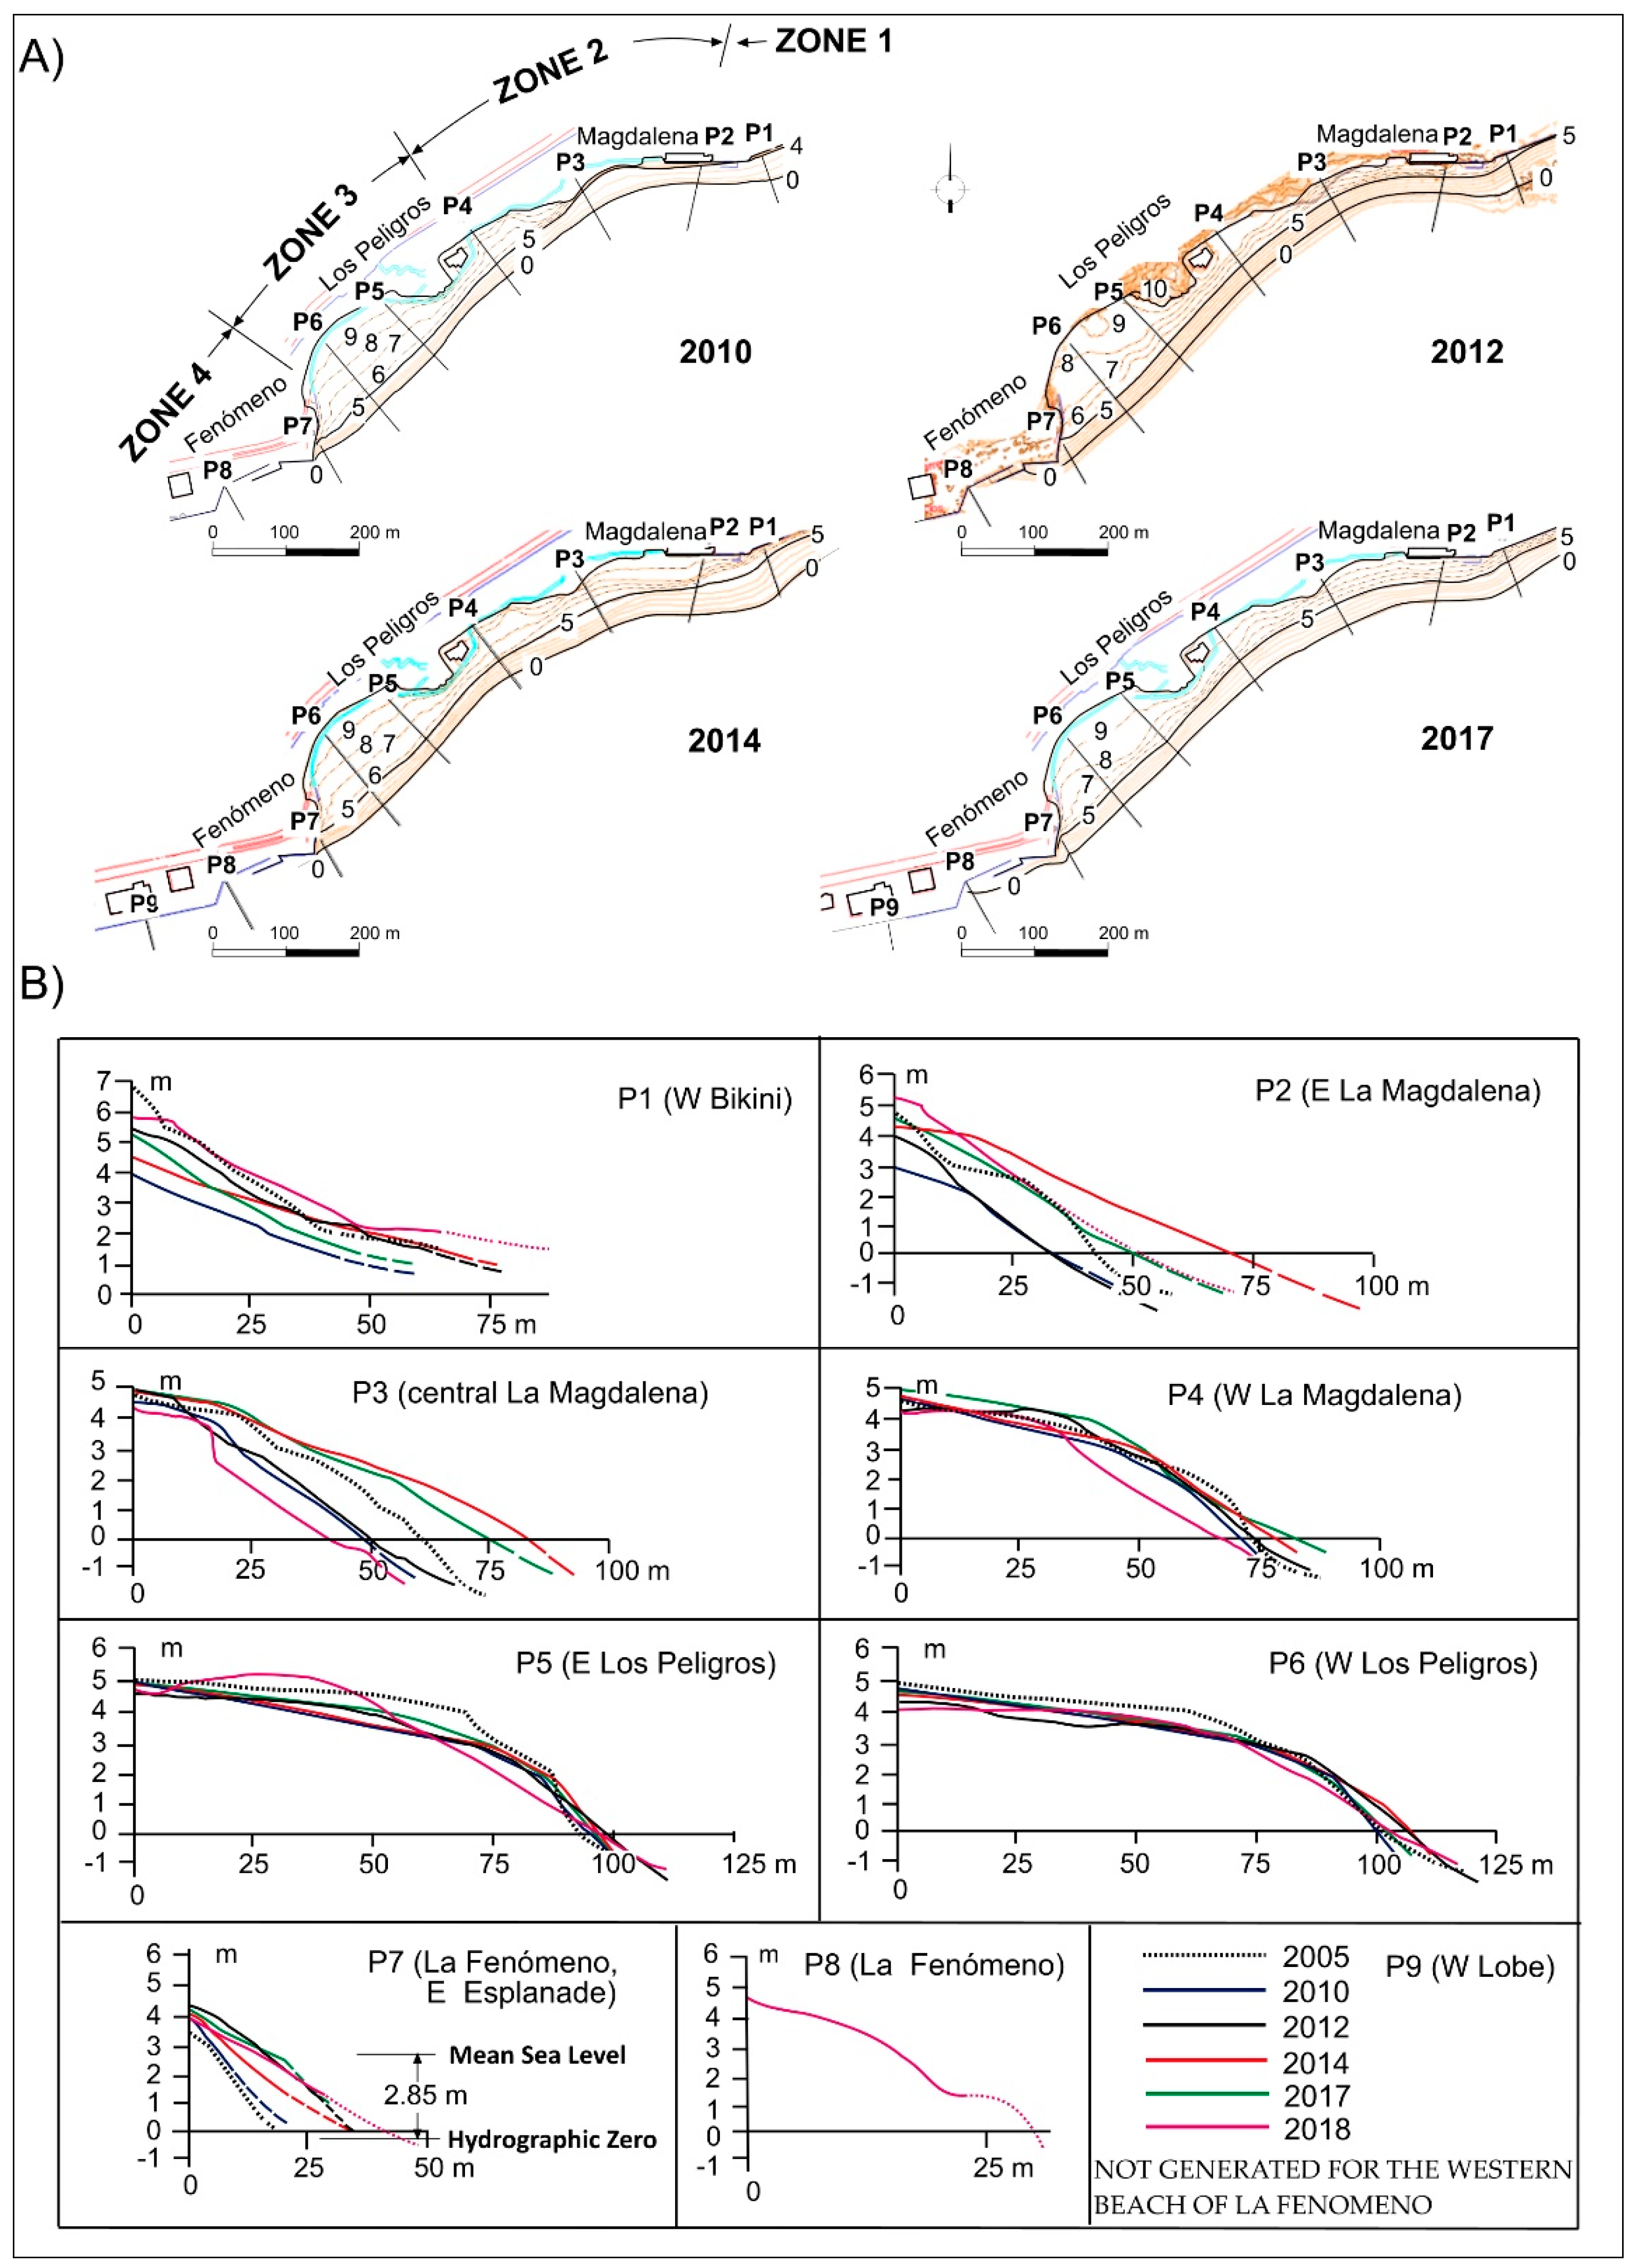
4.3.1. Previous Records (2005–2017)
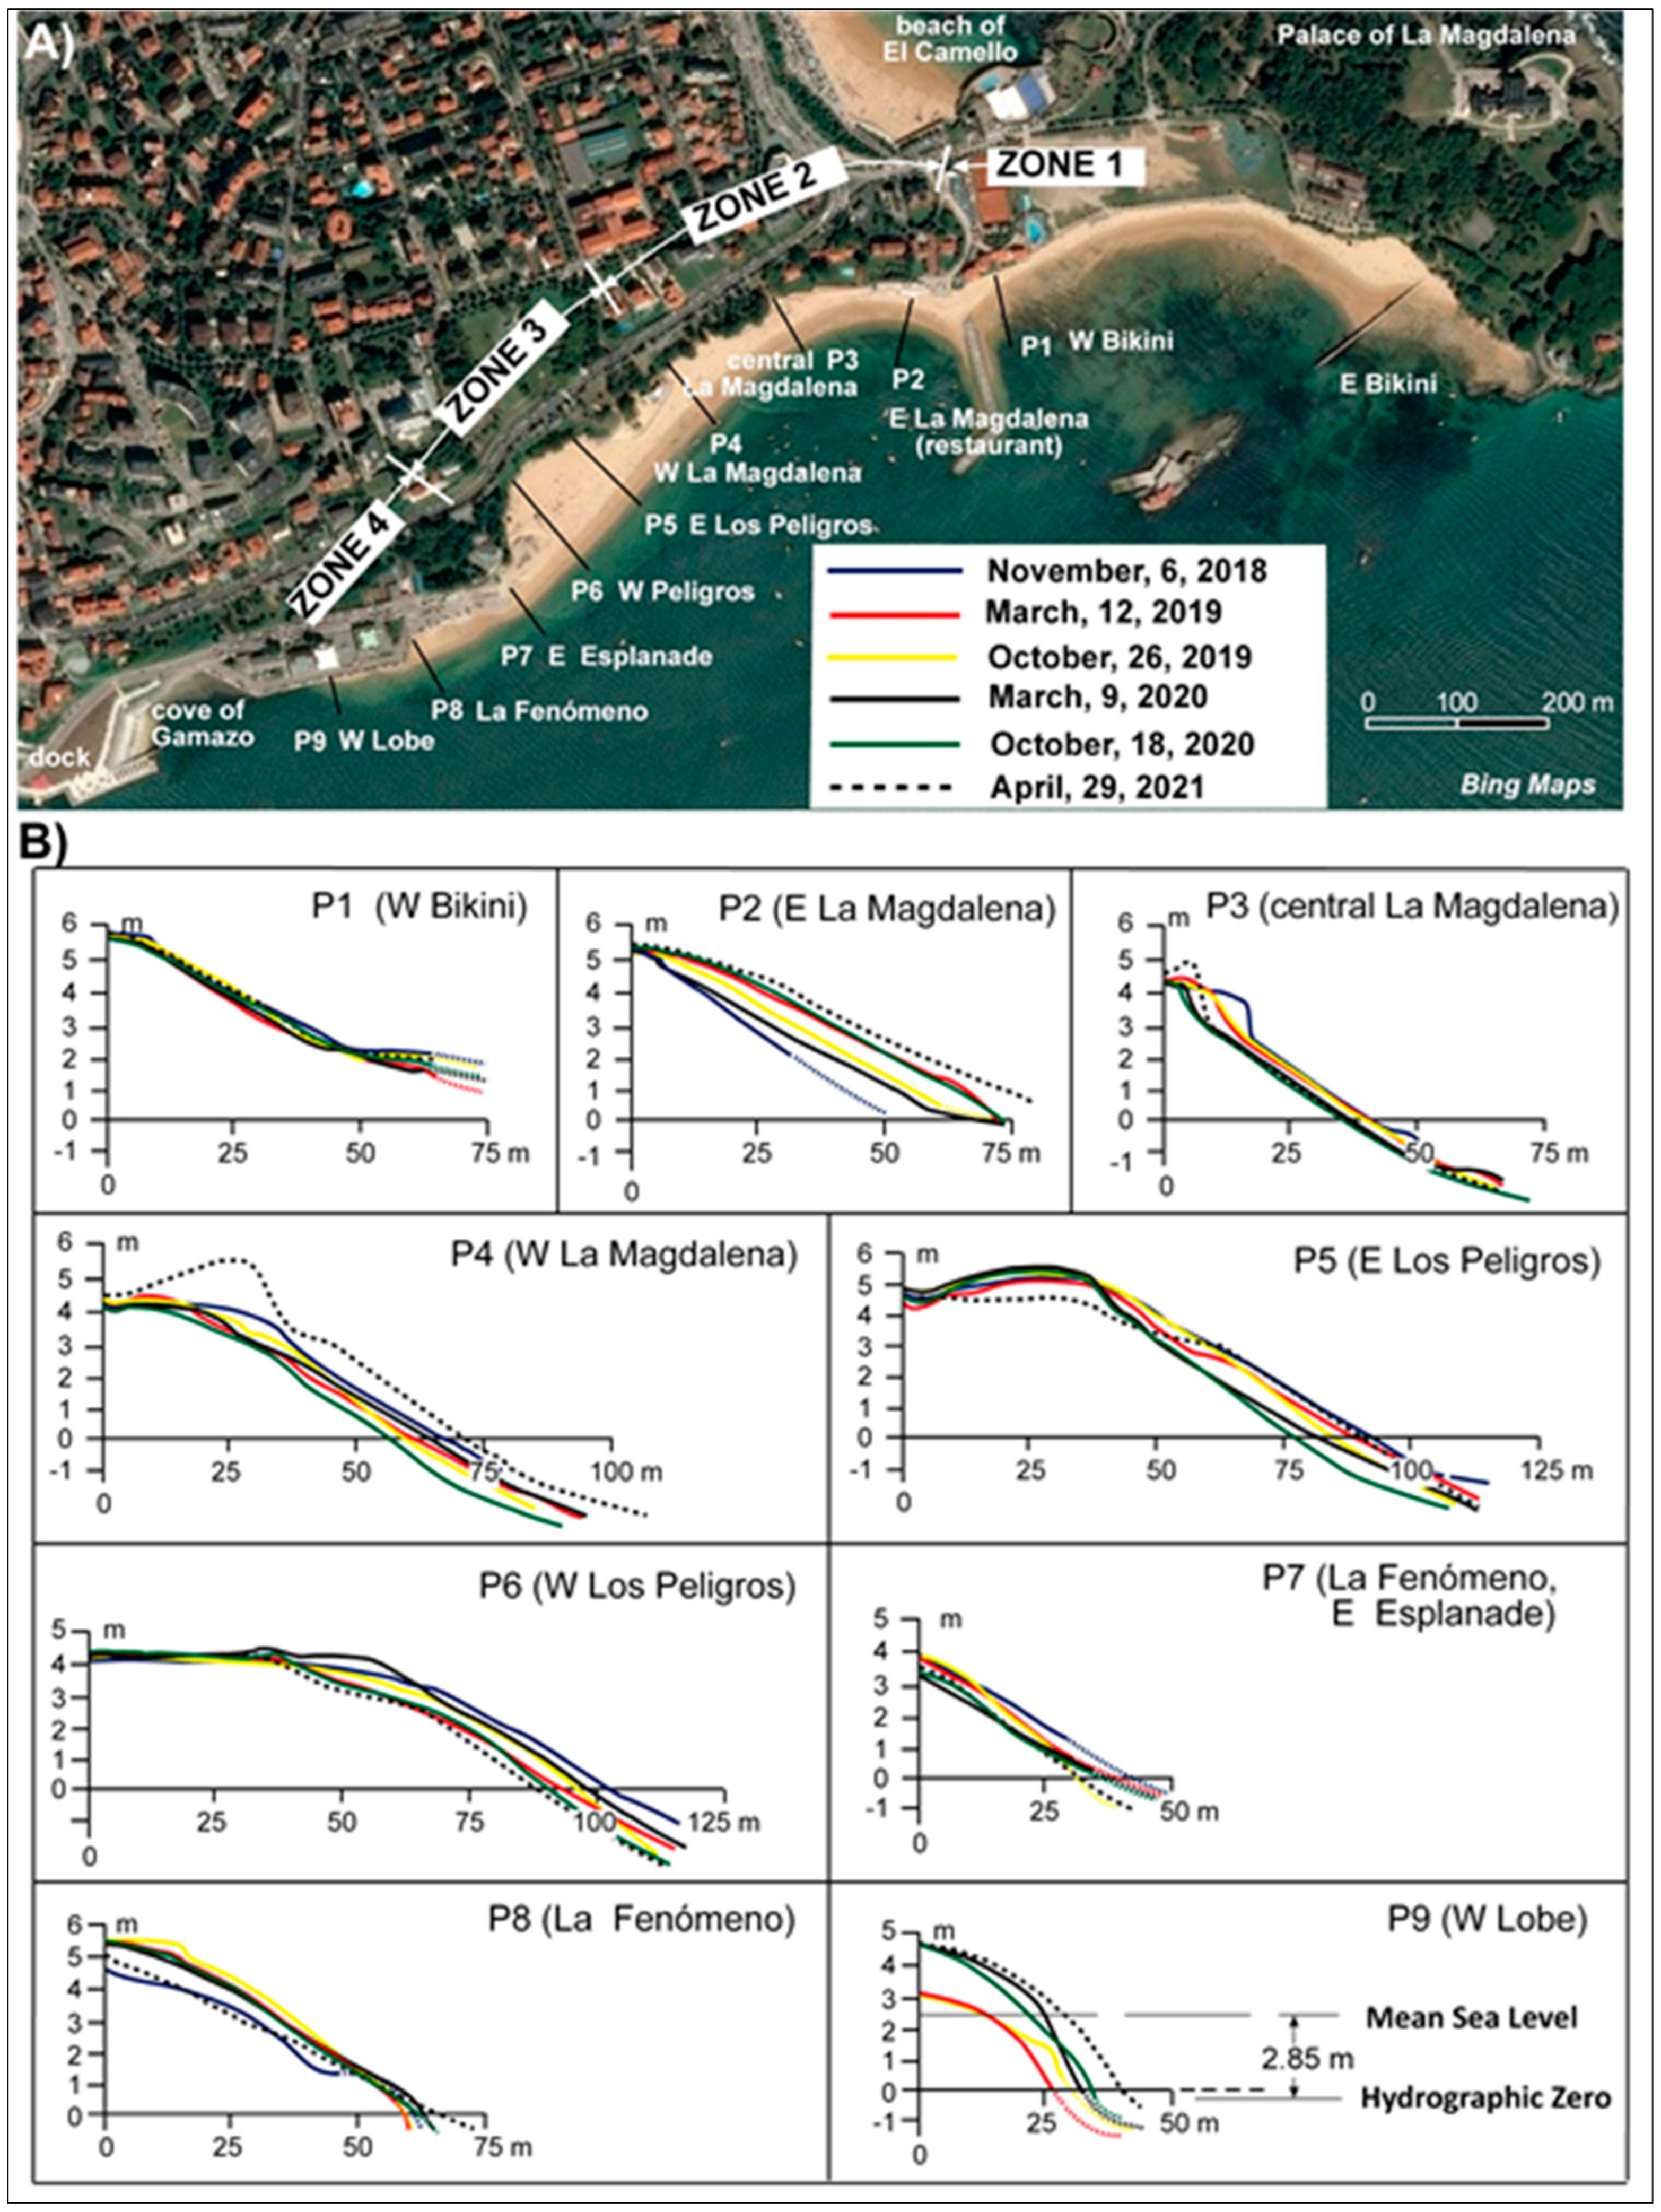
4.3.2. Evolution Following Breakwater Construction (2018–2021)
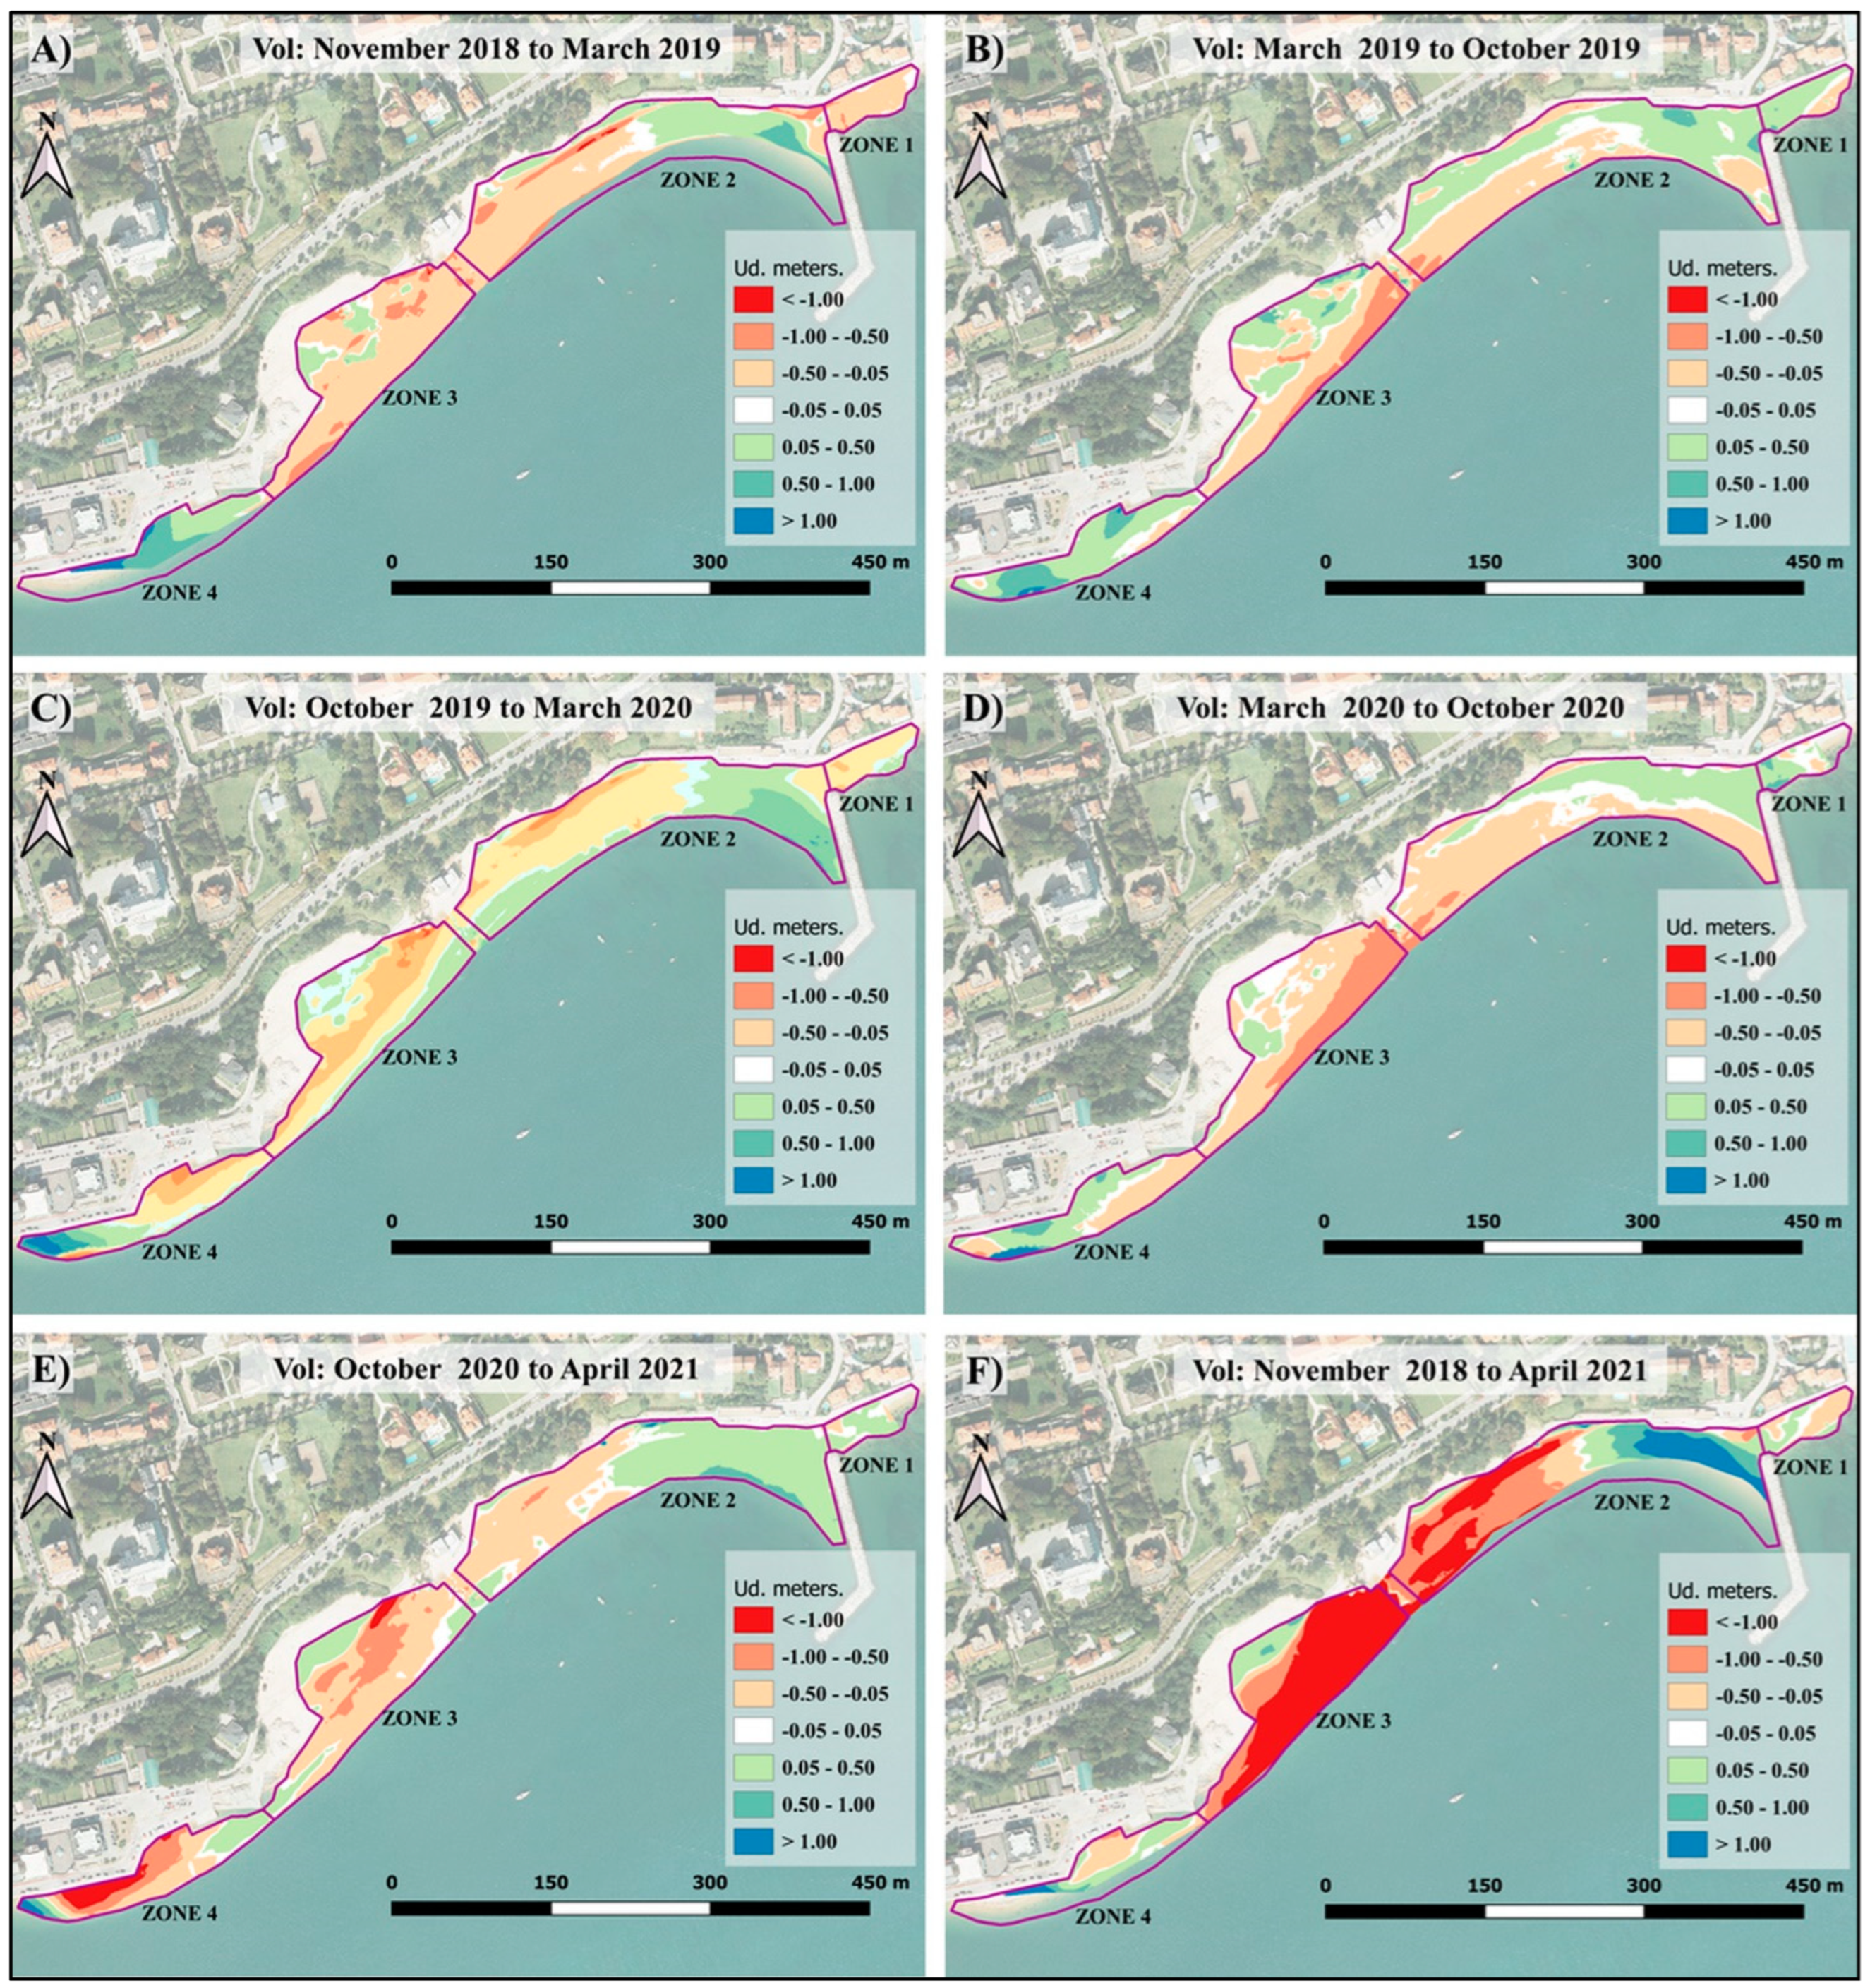
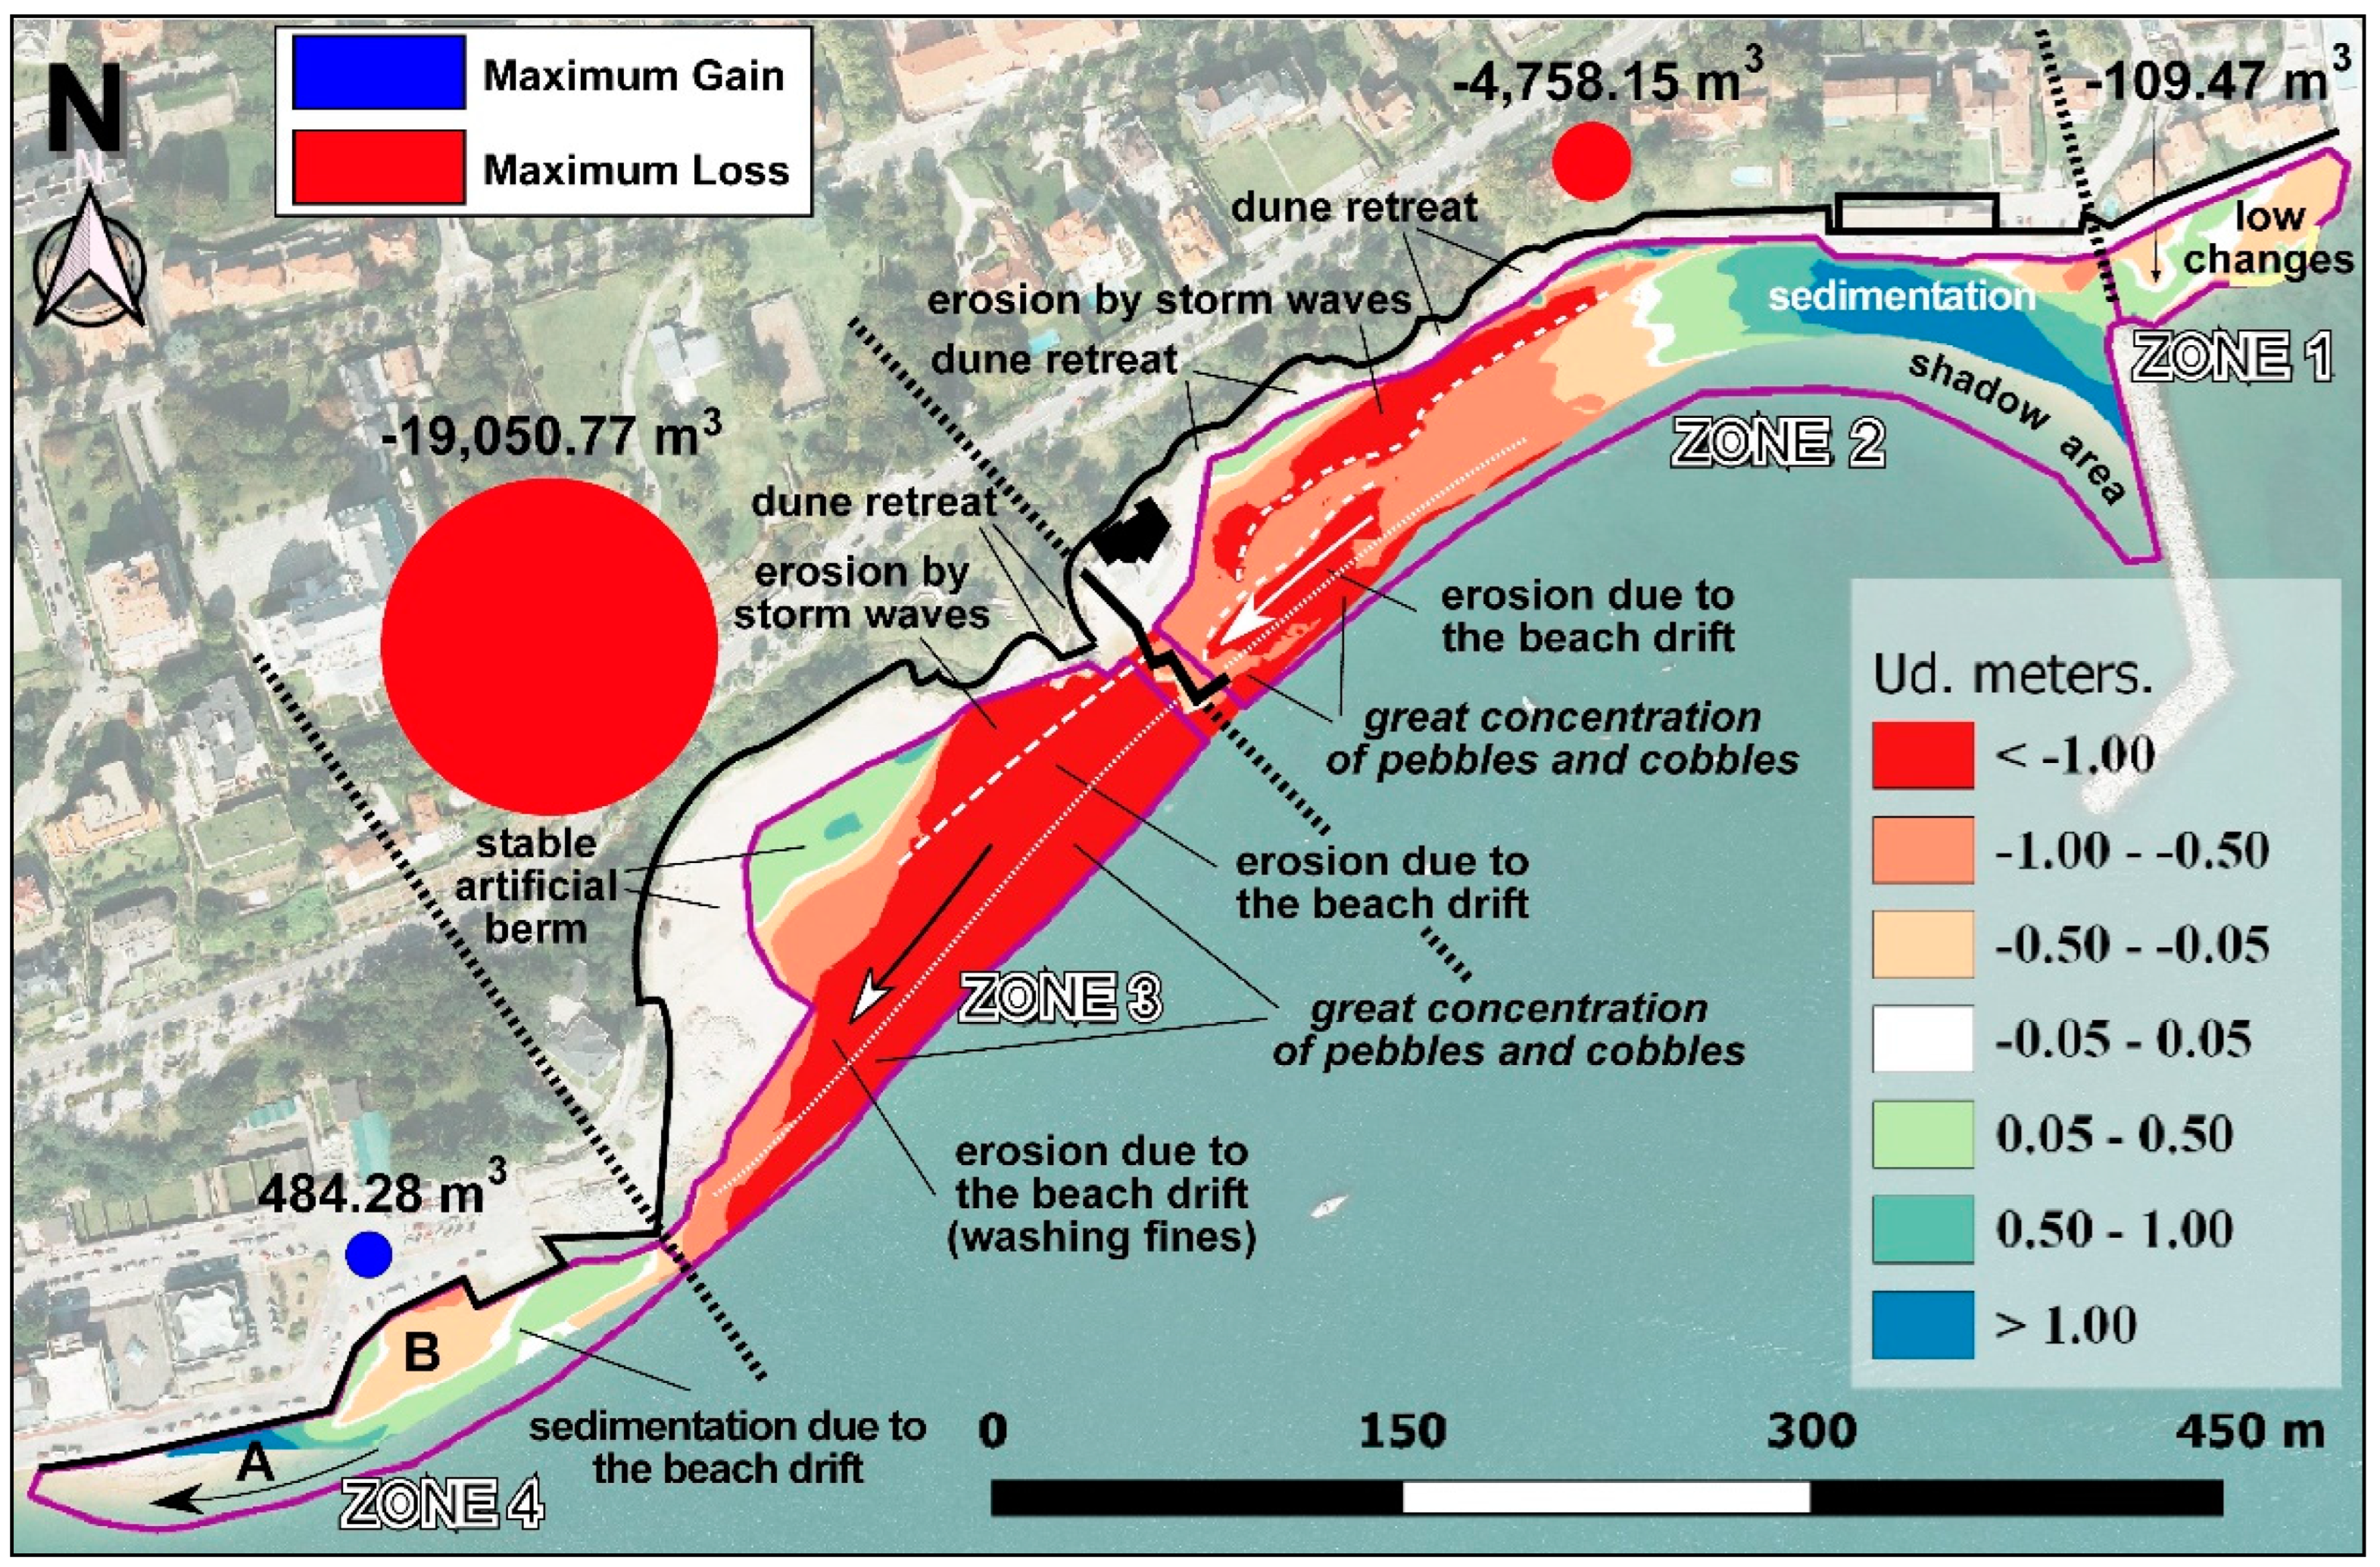
4.3.3. Quantitative Gains and Losses
5. Discussion
5.1. General Features
5.2. Sustainable Solutions
5.3. Suplementary Performances
6. Conclusions
Author Contributions
Funding
Acknowledgments
Conflicts of Interest
References
- Nordstrom, K.F. Beaches and dunes of human-altered coasts. Prog. Phys. Geogr. Earth Environ. 1994, 18, 497–516. [Google Scholar] [CrossRef]
- Yuhi, M. Impact of anthropogenic modifications of a river basin on neighboring coasts: Case study. J. Waterw. Port Coastal Ocean Eng. 2008, 134, 336–344. [Google Scholar] [CrossRef]
- Flor-Blanco, G.; Flor, G.; Pando, L.; Abanades, J. Morphodynamics, sedimentary and anthropogenic influences in the San Vicente de la Barquera estuary (North coast of Spain). Geol. Acta 2015, 13, 279–295. [Google Scholar]
- Flor-Blanco, G.; Flor, G.; Pando, L. Evolution of the Salinas-El Espartal and Xagó beach/dune systems in north-western Spain over recent decades: Evidence for responses to natural processes and anthropogenic interventions. Geo-Marine Lett. 2013, 33, 143–157. [Google Scholar] [CrossRef]
- James, R.J. From beaches to beach environments: Linking the ecology, human-use and management of beaches in Australia. Ocean Coast. Manag. 2000, 43, 495–514. [Google Scholar] [CrossRef]
- Cooper, J.A.G.; Pilkey, O.H. Pitfalls of Shoreline Stabilization: Selected Case Studies; Coastal Research Library 3 Series; Springer Science & Business Media: Berlin/Heidelberg, Germany, 2012; Volume 3, ISBN 9400741235. [Google Scholar]
- Cooke, B.C.; Jones, A.R.; Goodwin, I.D.; Bishop, M.J. Nourishment practices on Australian sandy beaches: A review. J. Environ. Manag. 2012, 113, 319–327. [Google Scholar] [CrossRef]
- De Schipper, M.A.; de Vries, S.; Ruessink, G.; de Zeeuw, R.C.; Rutten, J.; van Gelder-Maas, C.; Stive, M.J.F. Initial spreading of a mega feeder nourishment: Observations of the Sand Engine pilot project. Coast. Eng. 2016, 111, 23–38. [Google Scholar] [CrossRef]
- Dean, R.G. Theory and Practice; World Scientific Press: Hackensack, NJ, USA, 2002. [Google Scholar]
- Holmes, C.W.; Beverstock, P. The beach management plan for Lancing and Shoreham. In Partnership in Coastal Zone Management; Samara Publishing: Cardigan, UK, 1996. [Google Scholar]
- Grottoli, E.; Bertoni, D.; Ciavola, P. Short- and medium-term response to storms on three Mediterranean coarse-grained beaches. Geomorphology 2017, 295, 738–748. [Google Scholar] [CrossRef]
- Hanson, H.; Brampton, A.; Capobianco, M.; Dette, H.H.; Hamm, L.; Laustrup, C.; Lechuga, A.; Spanhoff, R. Beach nourishment projects, practices, and objectives—A European overview. Coast. Eng. 2002, 47, 81–111. [Google Scholar] [CrossRef]
- González, M.; Medina, R.; Losada, M. On the design of beach nourishment projects using static equilibrium concepts: Application to the Spanish coast. Coast. Eng. 2010, 57, 227–240. [Google Scholar] [CrossRef]
- Cabezas-Rabadán, C.; Pardo-Pascual, J.E.; Palomar-Vázquez, J.; Fernández-Sarría, A. Characterizing beach changes using high-frequency Sentinel-2 derived shorelines on the Valencian coast (Spanish Mediterranean). Sci. Total Environ. 2019, 691, 216–231. [Google Scholar] [CrossRef] [PubMed]
- Finkl, C.W.; Jesse Walker, H. Beach nourishment. In Encyclopedia of Coastal Science; Finkl, C.W., Makowski, C., Eds.; Springer International Publishing: Cham, Switzerland, 2018; ISBN 978-3-319-48657-4. [Google Scholar]
- Aragonés, L.; García-Barba, J.; García-Bleda, E.; López, I.; Serra, J.C. Beach nourishment impact on Posidonia oceanica: Case study of Poniente Beach (Benidorm, Spain). Ocean Eng. 2015, 107, 1–12. [Google Scholar] [CrossRef]
- Bitan, M.; Zviely, D. Sand Beach Nourishment: Experience from the Mediterranean Coast of Israel. J. Mar. Sci. Eng. 2020, 8, 273. [Google Scholar] [CrossRef]
- Hamm, L.; Capobianco, M.; Dette, H.H.; Lechuga, A.; Spanhoff, R.; Stive, M.J.F. A summary of European experience with shore nourishment. Coast. Eng. 2002, 47, 237–264. [Google Scholar] [CrossRef]
- M.O.P.T.M.A. Recuperando la Costa; M.O.P.T.M.A.: Madrid, Spain, 1995; p. 61. [Google Scholar]
- Anfuso, G.; Benavente, J.; Gracia, F.J. Morphodynamic responses of nourished beaches in SW Spain. J. Coast. Conserv. 2001, 7, 71–80. [Google Scholar] [CrossRef]
- Benavente, J.; Anfuso, G.; Río, L.D.; Gracia, F.J.; Reyes, J.L. Evolutive Trends of Nourished Beaches in SW Spain. J. Coast. Res. 2006, 2, 765–769. [Google Scholar]
- Ojeda, E.; Guillén, J. Monitoring beach nourishment based on detailed observations with video measurements. J. Coast. Res. 2006, 100–106. [Google Scholar]
- Gracia, V.; Sánchez-Arcilla, A.; Anfuso, G. Coastal Erosion and Protection in Europe; Pranzini, E., Williams, A.T., Eds.; Routledge: London, UK, 2013; ISBN 1849713391. [Google Scholar]
- Staudt, F.; Gijsman, R.; Ganal, C.; Mielck, F.; Wolbring, J.; Hass, H.C.; Goseberg, N.; Schüttrumpf, H.; Schlurmann, T.; Schimmels, S. The sustainability of beach nourishments: A review of nourishment and environmental monitoring practice. J. Coast. Conserv. 2021, 25, 34. [Google Scholar] [CrossRef]
- Verhagen, H.J. Method for artificial beach nourishment. Coast. Eng. Proc. 1992, 1. [Google Scholar] [CrossRef]
- Tortella, G.; García-Ruiz, J.L. A century of the Spanish economy. In The Spanish Financial System; Malo de Molina, J.L., Martín-Aceña, P., Eds.; Springer: Cham, Switzerland, 2012; pp. 45–70. [Google Scholar]
- Flor, G.; Flor-Blanco, G. An introduction to the erosion and sedimentation problems in the coastal regions of Asturias and Cantabria (NW Spain) and its implications on environmental management. J. Coast. Res. 2005, 58–63. [Google Scholar]
- Flor, G.; Flor-Blanco, G. Transformaciones morfosedimentarias de la bahía estuarina de Santander relacionadas con el desarrollo portuario y urbano (Cantabria, NO de España) Morphosedimentary transformations of the Santander estuarine bay related to port and urban development. Trab. Geol. 2018, 36, 139–162. [Google Scholar] [CrossRef]
- Izaguirre, C.; Losada, Í.; Méndez-Incera, F.; Díaz-Simal, P.; Lara, J.L.; Ondiviela, B.; Jiménez Toribio, M. Flooding and erosion risk analysis in santander bay, spain. In Coastal Riks Management in a Changing Climate; Zanuttigh, B., Nicholls, R., Vanderlinden, J.P., Burcharth, H.F., Thompson, R.C., Eds.; Elsevier: Amsterdam, The Netherlands, 2015; pp. 559–591. [Google Scholar]
- Cendrero, U.; Diaz-de-Terrain, J.R. Caracterización cuantitativa del desarrollo histórico del relleno de la bahía de Santander; un proceso natural activado por el hombre. Rev. Obras Publicas 1977, 3150. [Google Scholar]
- Klemas, V. Beach profiling and LIDAR bathymetry: An overview with case studies. J. Coast. Res. 2011, 27, 1019–1028. [Google Scholar] [CrossRef]
- Sherman, D.J.; Hales, B.U.; Potts, M.K.; Ellis, J.T.; Liu, H.; Houser, C. Impacts of Hurricane Ike on the beaches of the Bolivar Peninsula, TX, USA. Geomorphology 2013, 199, 62–81. [Google Scholar] [CrossRef]
- Pye, K.; Blott, S.J. Assessment of beach and dune erosion and accretion using LiDAR: Impact of the stormy 2013–14 winter and longer term trends on the Sefton Coast, UK. Geomorphology 2016, 266, 146–167. [Google Scholar] [CrossRef]
- Vos, S.E.; Lindenbergh, R.C.; de Vries, S. Coastscan: Continuous monitoring of coastal change using terrestrial laser scanning. In Proceedings of the 8th International Conference on Coastal Dynamics, Helsingør, Denmark, 12–16 June 2017. [Google Scholar]
- Jaud, M.; Delacourt, C.; Le Dantec, N.; Allemand, P.; Ammann, J.; Grandjean, P.; Nouaille, H.; Prunier, C.; Cuq, V.; Augereau, E. Diachronic UAV photogrammetry of a sandy beach in Brittany (France) for a long-term coastal observatory. ISPRS Int. J. Geo-Inf. 2019, 8, 267. [Google Scholar] [CrossRef]
- Lee, H.S.; Lim, S.S.; Park, D.W. Application of Terrestrial Laser Scanner and Raster operations to Change Detection of Beach. J. Coast. Res. 2011, 1692–1696. [Google Scholar]
- Schubert, J.E.; Gallien, T.W.; Majd, M.S.; Sanders, B.F. Terrestrial laser scanning of anthropogenic beach berm erosion and overtopping. J. Coast. Res. 2015, 31, 47–60. [Google Scholar] [CrossRef]
- Flor, G.; Flor-Blanco, G.; Cedrún, P.M.; Flores-Soriano, C.; Borghero, C. Aeolian Dune fields in the coasts of Asturias and Cantabria (Spain, Nw Iberian Peninsula). In The Spanish Coastal Systems; Springer: Cham, Switzerland, 2019; pp. 585–609. [Google Scholar]
- Flor-Blanco, G.; Flor, G. Cantabrian estuaries. In The Spanish Coastal Systems; Springer: Cham, Switzerland, 2019; pp. 415–436. [Google Scholar]
- Abellán García, A.I.; Cruz Pérez, N.; Santamarta, J.C. Sustainable Urban Drainage Systems in Spain: Analysis of the Research on SUDS Based on Climatology. Sustainability 2021, 13, 7258. [Google Scholar] [CrossRef]
- Global Climate Data. Available online: https://es.climate-data.org/ (accessed on 15 March 2022).
- Aranda, M.; Gracia, F.J.; Peralta, G.; Flor-Blanco, G. Towards a Comprehensive Functionality Assessment of Estuaries: First Approaches in San Vicente de la Barquera Estuary (Cantabria, Spain). In Estuaries and Coastal Zones in Times of Global Change; Nguyen, K.D., Guillou, S., Gourbesville, P., Thiébot, J., Eds.; Springer: Singapore, 2020; pp. 301–319. [Google Scholar]
- Spanish State Meteorological Agency. Available online: http://www.aemet.es/es/portada (accessed on 15 March 2022).
- Aupi, V. Guía del Clima de España; Ediciones Omega: Barcelona, Spain, 2004; ISBN 9788428213707. [Google Scholar]
- Autoridad Portuaria de Santander. Informe de Sostenibilidad Ambiental del Plan Director de Infraestructuras del Puerto de Santander 2012–2022, Autoridad Portuaria de Santander: Santander, Spain, 2012.
- Spanish State Ports. Available online: https://www.puertos.es/es-es/oceanografia (accessed on 15 March 2022).
- Pellón, E.; Garnier, R.; Medina, R. Intertidal finger bars at El Puntal, Bay of Santander, Spain: Observation and forcing analysis. Earth Surf. Dyn. 2014, 2, 349–361. [Google Scholar] [CrossRef]
- Martínez Cedrún, P. Caracterización Morfológica y Sedimentológica de los Campos Dunares Costeros de Cantabria. Evolución Ambiental. Ph.D. Thesis, Universidad de Oviedo, Oviedo, Spain, 2009. [Google Scholar]
- Hellín Medina, J. Análisis climatológico del Mar Cantábrico y su influencia en la navegación. Master’s Thesis, 2009. [Google Scholar]
- Losada, M.A.; Medinaa, R.; Desire, J.M. The Orio Inlet: A case study from the North coast of Spain. J. Coast. Res. 1989, 5, 137–145. [Google Scholar]
- Dolan, R.; Davis, R.E. An intensity scale for Atlantic coast northeast storms. J. Coast. Res. 1992, 8, 840–853. [Google Scholar]
- Díaz Giménez, N. Los Temporales Costeros en Cantabria: Caracterización e Impactos Sobre el Territorio; University of Cantabria: Santander, Spain, 2016. [Google Scholar]
- Rivas, V.; Garmendia, C.; Rasilla, D. Analysis of Ocean Parameters as Sources of Coastal Storm Damage: Regional Empirical Thresholds in Northern Spain. Climate 2022, 10, 88. [Google Scholar] [CrossRef]
- Cano, D.; Arteche, J.L.; Lavín, A.; Rodríguez, C.; Somavilla, R.; García, M.J. Oceano-meteorological conditions observed during severe storms in the southern bay of biscay. In Proceedings of the Oceans 2011 IEEE-Spain, Santander, Spain, 6–9 June 2011; pp. 1–7. [Google Scholar]
- Díaz Sánchez, R. Predicción del Remonte Extremo en Playas: Aplicación a los Sectores Litorales de la Costa Española. Ph.D. Thesis, Polytechnical University of Madrid, Madrid, Spain, 2014. [Google Scholar]
- CEDEX. Análisis de la Situación del Sistema de Playas Magdalena-Peligros Tras la Paralización de las Obras Para su Estabilización (E.S.T. 2017-2020/31); Ministerio para la Transicion Ecologica: Madrid, Spain, 2018; p. 27. [Google Scholar]
- Autoridad Portuaria de Santander. Derrotero del Puerto de Santander; Autoridad Portuaria de Santander: Santander, Spain, 2012; p. 25. [Google Scholar]
- Territorio de Cantabria. Available online: https://www.territoriodecantabria.es/ (accessed on 15 March 2022).
- IBERPIX, Cartographic Viewer of the Spanish National Geographic Institute. Available online: https://www.ign.es/iberpix/visor (accessed on 15 March 2022).
- Photo library of the National Geographic Institute of Spain. Available online: https://fototeca.cnig.es/fototeca/ (accessed on 15 March 2022).
- Hoffmeister, D.; Tilly, N.; Curdt, C.; Aasen, H.; Ntageretzis, K.; Hadler, H.; Willershäuser, T.; Vött, A.; Bareth, G. Terrestrial laser scanning for coastal geomorphologic research in western Greece. Int. Arch. Photogramm. Remote Sens. Spat. Inf. Sci. 2012, 39, 511–516. [Google Scholar] [CrossRef]
- Kühn, S.; Fernyhough, C.; Alderson-Day, B.; Hurlburt, R.T. Inner experience in the scanner: Can high fidelity apprehensions of inner experience be integrated with fMRI? Front. Psychol. 2014, 5, 1393. [Google Scholar]
- Bremer, M.; Sass, O. Combining airborne and terrestrial laser scanning for quantifying erosion and deposition by a debris flow event. Geomorphology 2012, 138, 49–60. [Google Scholar] [CrossRef]
- Jaboyedoff, M.; Oppikofer, T.; Abellán, A.; Derron, M.-H.; Loye, A.; Metzger, R.; Pedrazzini, A. Use of LIDAR in landslide investigations: A review. Nat. Hazards 2012, 61, 5–28. [Google Scholar] [CrossRef]
- Losada, M.A.; Medina, R.; Vidal, C.; Roldan, A. Historical evolution and morphological analysis of "El Puntal" spit, Santander (Spain). J. Coast. Res. 1991, 7, 711–722. [Google Scholar]
- Vidal Martin, R. El dragado en el Puerto de Santander en los últimos setenta años. Rev. Digit. Cedex 2018, 159, 75–88. [Google Scholar]
- Palazuelo, Y. Las Arenas de La Magdalena 2007. Available online: http://lasarenasdelamagdalena.blogspot.com (accessed on 15 March 2022).
- Komar, P.D. Beach Processes and Sedimentation, 2nd ed.; Prentice Hall: Hoboken, NJ, USA, 1998; ISBN 9780137549382. [Google Scholar]
- Flor-Blanco, G.; Alcántara-Carrió, J.; Jackson, D.W.T.; Flor, G.; Flores-Soriano, C. Coastal erosion in NW Spain: Recent patterns under extreme storm wave events. Geomorphology 2021, 387, 107767. [Google Scholar] [CrossRef]
- De Sanjosé Blasco, J.J.; Gómez-Lende, M.; Sánchez-Fernández, M.; Serrano-Cañadas, E. Monitoring Retreat of Coastal Sandy Systems Using Geomatics Techniques: Somo Beach (Cantabrian Coast, Spain, 1875–2017). Remote Sens. 2018, 10, 1500. [Google Scholar] [CrossRef]
- Castelle, B.; Marieu, V.; Bujan, S.; Splinter, K.D.; Robinet, A.; Sénéchal, N.; Ferreira, S. Impact of the winter 2013–2014 series of severe Western Europe storms on a double-barred sandy coast: Beach and dune erosion and megacusp embayments. Geomorphology 2015, 238, 135–148. [Google Scholar] [CrossRef]
- Remoundou, K.; Diaz-Simal, P.; Koundouri, P.; Rulleau, B. Valuing climate change mitigation: A choice experiment on a coastal and marine ecosystem. Ecosyst. Serv. 2015, 11, 87–94. [Google Scholar] [CrossRef]
- Ismail, N.; Williams, J. Sea-Level Rise Implications for Coastal Protection from Southern Mediterranean to the U.S.A. Atlantic Coast. In Proceedings of the EGU General Assembly Conference, Vienna, Austria, 7–12 April 2013; p. EGU2013-13464. [Google Scholar]
- Villatoro, M.; Silva, R.; Méndez, F.J.; Zanuttigh, B.; Pan, S.; Trifonova, E.; Losada, I.J.; Izaguirre, C.; Simmonds, D.; Reeve, D.E.; et al. An approach to assess flooding and erosion risk for open beaches in a changing climate. Coast. Eng. 2014, 87, 50–76. [Google Scholar] [CrossRef]
- Flor Rodríguez, G.S.; Flor Blanco, G.; Flores Soriano, C. Cambios ambientales por los temporales de invierno de 2014 en la costa asturiana (NO de España). Trab. Geol. 2015, 34, 97–123. [Google Scholar] [CrossRef]
- Masselink, G.; Castelle, B.; Scott, T.; Dodet, G.; Suanez, S.; Jackson, D.; Floc’h, F. Extreme wave activity during 2013/2014 winter and morphological impacts along the Atlantic coast of Europe. Geophys. Res. Lett. 2016, 43, 2135–2143. [Google Scholar] [CrossRef]
- Castelle, B.; Guillot, B.; Marieu, V.; Chaumillon, E.; Hanquiez, V.; Bujan, S.; Poppeschi, C. Spatial and temporal patterns of shoreline change of a 280-km high-energy disrupted sandy coast from 1950 to 2014: SW France. Estuar. Coast. Shelf Sci. 2018, 200, 212–223. [Google Scholar] [CrossRef]
- Van Rijn, L. Erosion of Coastal Dunes Due to Storms. 2013. Available online: www.leovanrijn-sediment.com (accessed on 15 March 2022).
- Dean, R.G. Equilibrium Beach Profiles: Characteristics and Applications. J. Coast. Res. 1991, 7, 53–84. [Google Scholar]
- Finkl, C.W. Beach Nourishment. In Engineered Coasts; Chen, J., Eisma, D., Hota, K., Walker, J.H., Eds.; Kluwer Academic Pub: Dordrecht, The Netherlands, 2002; pp. 1–22. [Google Scholar]
- Van Noortwijk, J.M.; Peerbolte, E.B. Optimal sand nourishment decisions. J. Waterw. Port Coast. Ocean Eng. 2000, 126, 30–38. [Google Scholar] [CrossRef]
- Moretti, M.; Tropeano, M.; van Loon, A.J.; Acquafredda, P.; Baldacconi, R.; Festa, V.; Lisco, S.; Mastronuzzi, G.; Moretti, V.; Scotti, R. Texture and composition of the Rosa Marina beach sands (Adriatic coast, southern Italy): A sedimentological/ecological approach. Geologos 2016, 22, 87–103. [Google Scholar] [CrossRef]
- Sabatier, F. US Army Corps of Engineers, Coastal Engineering Manual (CEM), Engineer Manual 1110-2-1100; US Army Corps of Engineers: Washington DC, USA, 2002.
- Herrera, A.; Gomez-Pina, G.; Fages, L.; Casa, A.; Muñoz-Perez, J.J. Environmental impact of beach nourishment: A case study of the Rio San Pedro Beach (SW Spain). Open Oceanogr. J. 2010, 4, 32–41. [Google Scholar] [CrossRef]
- Escudero-Castillo, M.; Felix-Delgado, A.; Silva, R.; Mariño-Tapia, I.; Mendoza, E. Beach erosion and loss of protection environmental services in Cancun, Mexico. Ocean Coast. Manag. 2018, 156, 183–197. [Google Scholar] [CrossRef]
- De Schipper, M.A.; Ludka, B.C.; Raubenheimer, B.; Luijendijk, A.P.; Schlacher, T.A. Beach nourishment has complex implications for the future of sandy shores. Nat. Rev. Earth Environ. 2021, 2, 70–84. [Google Scholar] [CrossRef]
- Campbell, T.J.; Benedet, L. Beach nourishment magnitudes and trends in the US. J. Coast. Res. 2006, 39, 57–64. [Google Scholar]
- González, M.; Medina, R.; Gonzalez-Ondina, J.; Osorio, A.; Méndez, F.J.; García, E. An integrated coastal modeling system for analyzing beach processes and beach restoration projects, SMC. Comput. Geosci. 2007, 33, 916–931. [Google Scholar] [CrossRef]
- Miralles García, J.L.; García-Ayllon Veintimilla, S. The economic sustainability in urban planning: The case of La Manga. WIT Trans. Ecol. Environ. 2013, 173, 279–290. [Google Scholar]
- Contreras, A.; Muñoz-Perez, J.J.; Contreras, F.; Gomez-Pina, G.; Ruiz-Ortiz, V.; Chamorro, G.; Cabrera, P. A Design Parameter for Reef Beach Profiles—A Methodology Applied to Cadiz, Spain. J. Mar. Sci. Eng. 2020, 8, 323. [Google Scholar] [CrossRef]
- Pagán, J.I.; López, I.; Tenza-Abril, A.J.; Aragonés, L.; Villacampa, Y. Urban growth and beach nourishment: Experiences on the coast of Alicante, Spain. WIT Trans. Built Environ. 2018, 179, 93–102. [Google Scholar]
- Gómez Pina, G.; Díez, G. Regeneración de la playa de la zurriola San Sebastian (Guipuzcoa). Ing. Agua 1995, 2, 201–208. [Google Scholar] [CrossRef]
- Cárdenes van den Eynde, V.; Rubio Ordóñez, Á. Measure of the color of beach nourishment sands: A case study from the Belgium coast. Trab. Geol. 2015, 35, 7–18. [Google Scholar] [CrossRef][Green Version]
- Pranzini, E.; Simonetti, D.; Vitale, G. Sand colour rating and chromatic compatibility of borrow sediments. J. Coast. Res. 2010, 26, 798–808. [Google Scholar] [CrossRef]


| Maximum Storm Date | Significant Wave Heights (Hs, m) | Peak Wave Periods (Ts, s) | Duration (Hours) | Storm Power Index (m2 h) |
|---|---|---|---|---|
| 6 November 2018 | 3.79 | 11.01 | -- | -- |
| 9 December 2018 | 6.47 | 17.32 | 23 | 962.80 |
| 23 January 2019 | 6.57 | 16.12 | 28 | 1208.62 |
| 27 January 2019 | 7.15 | 11.01 | 68 | 3476.33 |
| 4 March 2019 | 6.13 | 14.66 | 21 | 789.11 |
| 12 March 2019 | 3.63 | 9.10 | -- | -- |
| 26 October 2019 | 1.05 | 12.01 | -- | -- |
| 3 November 2019 | 10.38 | 12.03 | 79 | 8511.81 |
| 8 November 2019 | 7.57 | 13.32 | 25 | 1432.62 |
| 23 November 2019 | 7.52 | 10.85 | 18 | 1017.91 |
| 9 December 2019 | 7.62 | 10.01 | 7 | 406.45 |
| 13 December 2019 | 8.50 | 13.32 | 76 | 5491.00 |
| 22 December 2019 | 10.69 | 11.01 | 32 | 3656.84 |
| 10 January 2020 | 6.81 | 13.32 | 18 | 834.77 |
| 10 February 2020 | 6.09 | 14.66 | 63 | 2336.55 |
| 3 March 2020 | 7.03 | 11.01 | 24 | 1186.10 |
| 6 March 2020 | 6.29 | 10.01 | 31 | 1226.49 |
| 9 March 2020 | 3.58 | 11.11 | -- | -- |
| 25 September 2020 | 6.29 | 13.32 | 46 | 1819.95 |
| 3 October 2020 | 7.73 | 13.32 | 68 | 4063.20 |
| 18 October 2020 | 0.93 | 10.01 | -- | -- |
| 29 October 2020 | 6.84 | 12.11 | 40 | 1871.42 |
| 4 December 2020 | 7.16 | 13.32 | 65 | 3332.26 |
| 7 December 2020 | 9.26 | 10.01 | 45 | 3858.64 |
| 12 December 2020 | 6.67 | 12.11 | 29 | 1290.18 |
| 28 December 2020 | 8.99 | 11.01 | 93 | 7516.27 |
| 30 January 2021 | 8.32 | 12.11 | 33 | 2284.34 |
| 11 March 2021 | 6.23 | 17.74 | 11 | 426.94 |
| 29 March 2021 | 1.03 | 12.11 | -- | -- |
| Beach | La Fenómeno | Los Peligros and La Magdalena | Breakwater of La Magdalena-Bikini | Bikini | Total |
|---|---|---|---|---|---|
| Gain (m3) | 3242.8 | 3097.5 | 11,452.7 | 8039.5 | 25,805.5 |
| Loss (m3) | −688.1 | −22,729.0 | −215.2 | −5267.9 | −28,900.2 |
| Balance (m3) | 2554.7 | −19,631.5 | 11,210.5 | 2771.6 | −3094.7 |
| Zone | Since | To | Erosion (m3) | Sedimentation (m3) | Balance (m3) |
|---|---|---|---|---|---|
| Zone 01 Bikini | 2018/11 | 2019/03 | 21.96 | 2318.97 | 2297.01 |
| 2019/03 | 2019/10 | 84.44 | 2744.51 | 2660.07 | |
| 2019/10 | 2020/03 | 2103.31 | 1971.48 | −131.83 | |
| 2020/03 | 2020/10 | 665.38 | 1714.38 | 1049.00 | |
| 2020/10 | 2021/04 | 3476.05 | 740.67 | −2735.38 | |
| beginning to end | 2018/11 | 2021/04 | 424.03 | 908.31 | 484.28 |
| Zone 02 Breakwater of La Magdalena-Bikini | 2018/11 | 2019/03 | 4619.00 | 343.20 | −4275.80 |
| 2019/03 | 2019/10 | 3284.59 | 12,23.53 | −2061.06 | |
| 2019/10 | 2020/03 | 5056.26 | 708.01 | −4348.25 | |
| 2020/03 | 2020/10 | 4840.48 | 269.03 | −4571.45 | |
| 2020/10 | 2021/04 | 4378.72 | 492.48 | −3886.24 | |
| beginning to end | 2018/11 | 2021/04 | 19,604.86 | 554.09 | −19,050.77 |
| Zone 3 Los Peligros and La Magdalena | 2018/11 | 2019/03 | 3369.90 | 1758.92 | −1610.98 |
| 2019/03 | 2019/10 | 2224.06 | 2643.95 | 419.89 | |
| 2019/10 | 2020/03 | 4147.84 | 4300.60 | 152.76 | |
| 2020/03 | 2020/10 | 2913.37 | 1101.08 | −1812.29 | |
| 2020/10 | 2021/04 | 1957.30 | 3803.78 | 1846.48 | |
| beginning to end | 2018/11 | 2021/04 | 10,152.03 | 5393.87 | −4758.16 |
| Zone 4 La Fenómeno | 2018/11 | 2019/03 | 493.90 | 7.05 | −486.85 |
| 2019/03 | 2019/10 | 71.99 | 485.11 | 413.12 | |
| 2019/10 | 2020/03 | 557.97 | 33.73 | −524.24 | |
| 2020/03 | 2020/10 | 35.39 | 417.92 | 382.53 | |
| 2020/10 | 2021/04 | 50.83 | 177.80 | 126.97 | |
| beginning to end | 2018/11 | 2021/04 | 250.83 | 141.36 | −109.47 |
Disclaimer/Publisher’s Note: The statements, opinions and data contained in all publications are solely those of the individual author(s) and contributor(s) and not of MDPI and/or the editor(s). MDPI and/or the editor(s) disclaim responsibility for any injury to people or property resulting from any ideas, methods, instructions or products referred to in the content. |
© 2023 by the authors. Licensee MDPI, Basel, Switzerland. This article is an open access article distributed under the terms and conditions of the Creative Commons Attribution (CC BY) license (https://creativecommons.org/licenses/by/4.0/).
Share and Cite
Flor, G.; Sánchez-Fernández, M.; Flor-Blanco, G.; de Sanjosé Blasco, J.J. Application of Geomatic Techniques for the Assessment of Anthropogenic Changes in the Urban Beaches of “La Magdalena” (Santander, Spain). Remote Sens. 2023, 15, 256. https://doi.org/10.3390/rs15010256
Flor G, Sánchez-Fernández M, Flor-Blanco G, de Sanjosé Blasco JJ. Application of Geomatic Techniques for the Assessment of Anthropogenic Changes in the Urban Beaches of “La Magdalena” (Santander, Spain). Remote Sensing. 2023; 15(1):256. https://doi.org/10.3390/rs15010256
Chicago/Turabian StyleFlor, Germán, Manuel Sánchez-Fernández, Germán Flor-Blanco, and José Juan de Sanjosé Blasco. 2023. "Application of Geomatic Techniques for the Assessment of Anthropogenic Changes in the Urban Beaches of “La Magdalena” (Santander, Spain)" Remote Sensing 15, no. 1: 256. https://doi.org/10.3390/rs15010256
APA StyleFlor, G., Sánchez-Fernández, M., Flor-Blanco, G., & de Sanjosé Blasco, J. J. (2023). Application of Geomatic Techniques for the Assessment of Anthropogenic Changes in the Urban Beaches of “La Magdalena” (Santander, Spain). Remote Sensing, 15(1), 256. https://doi.org/10.3390/rs15010256