
Using UAV and Structure-From-Motion Photogrammetry for the Detection of Boulder Movement by Storms on a Rocky Shore Platform in Laghdira, Northwest Morocco

 ,
,  ,
,  , ,
, ,
Abstract
:1. Introduction
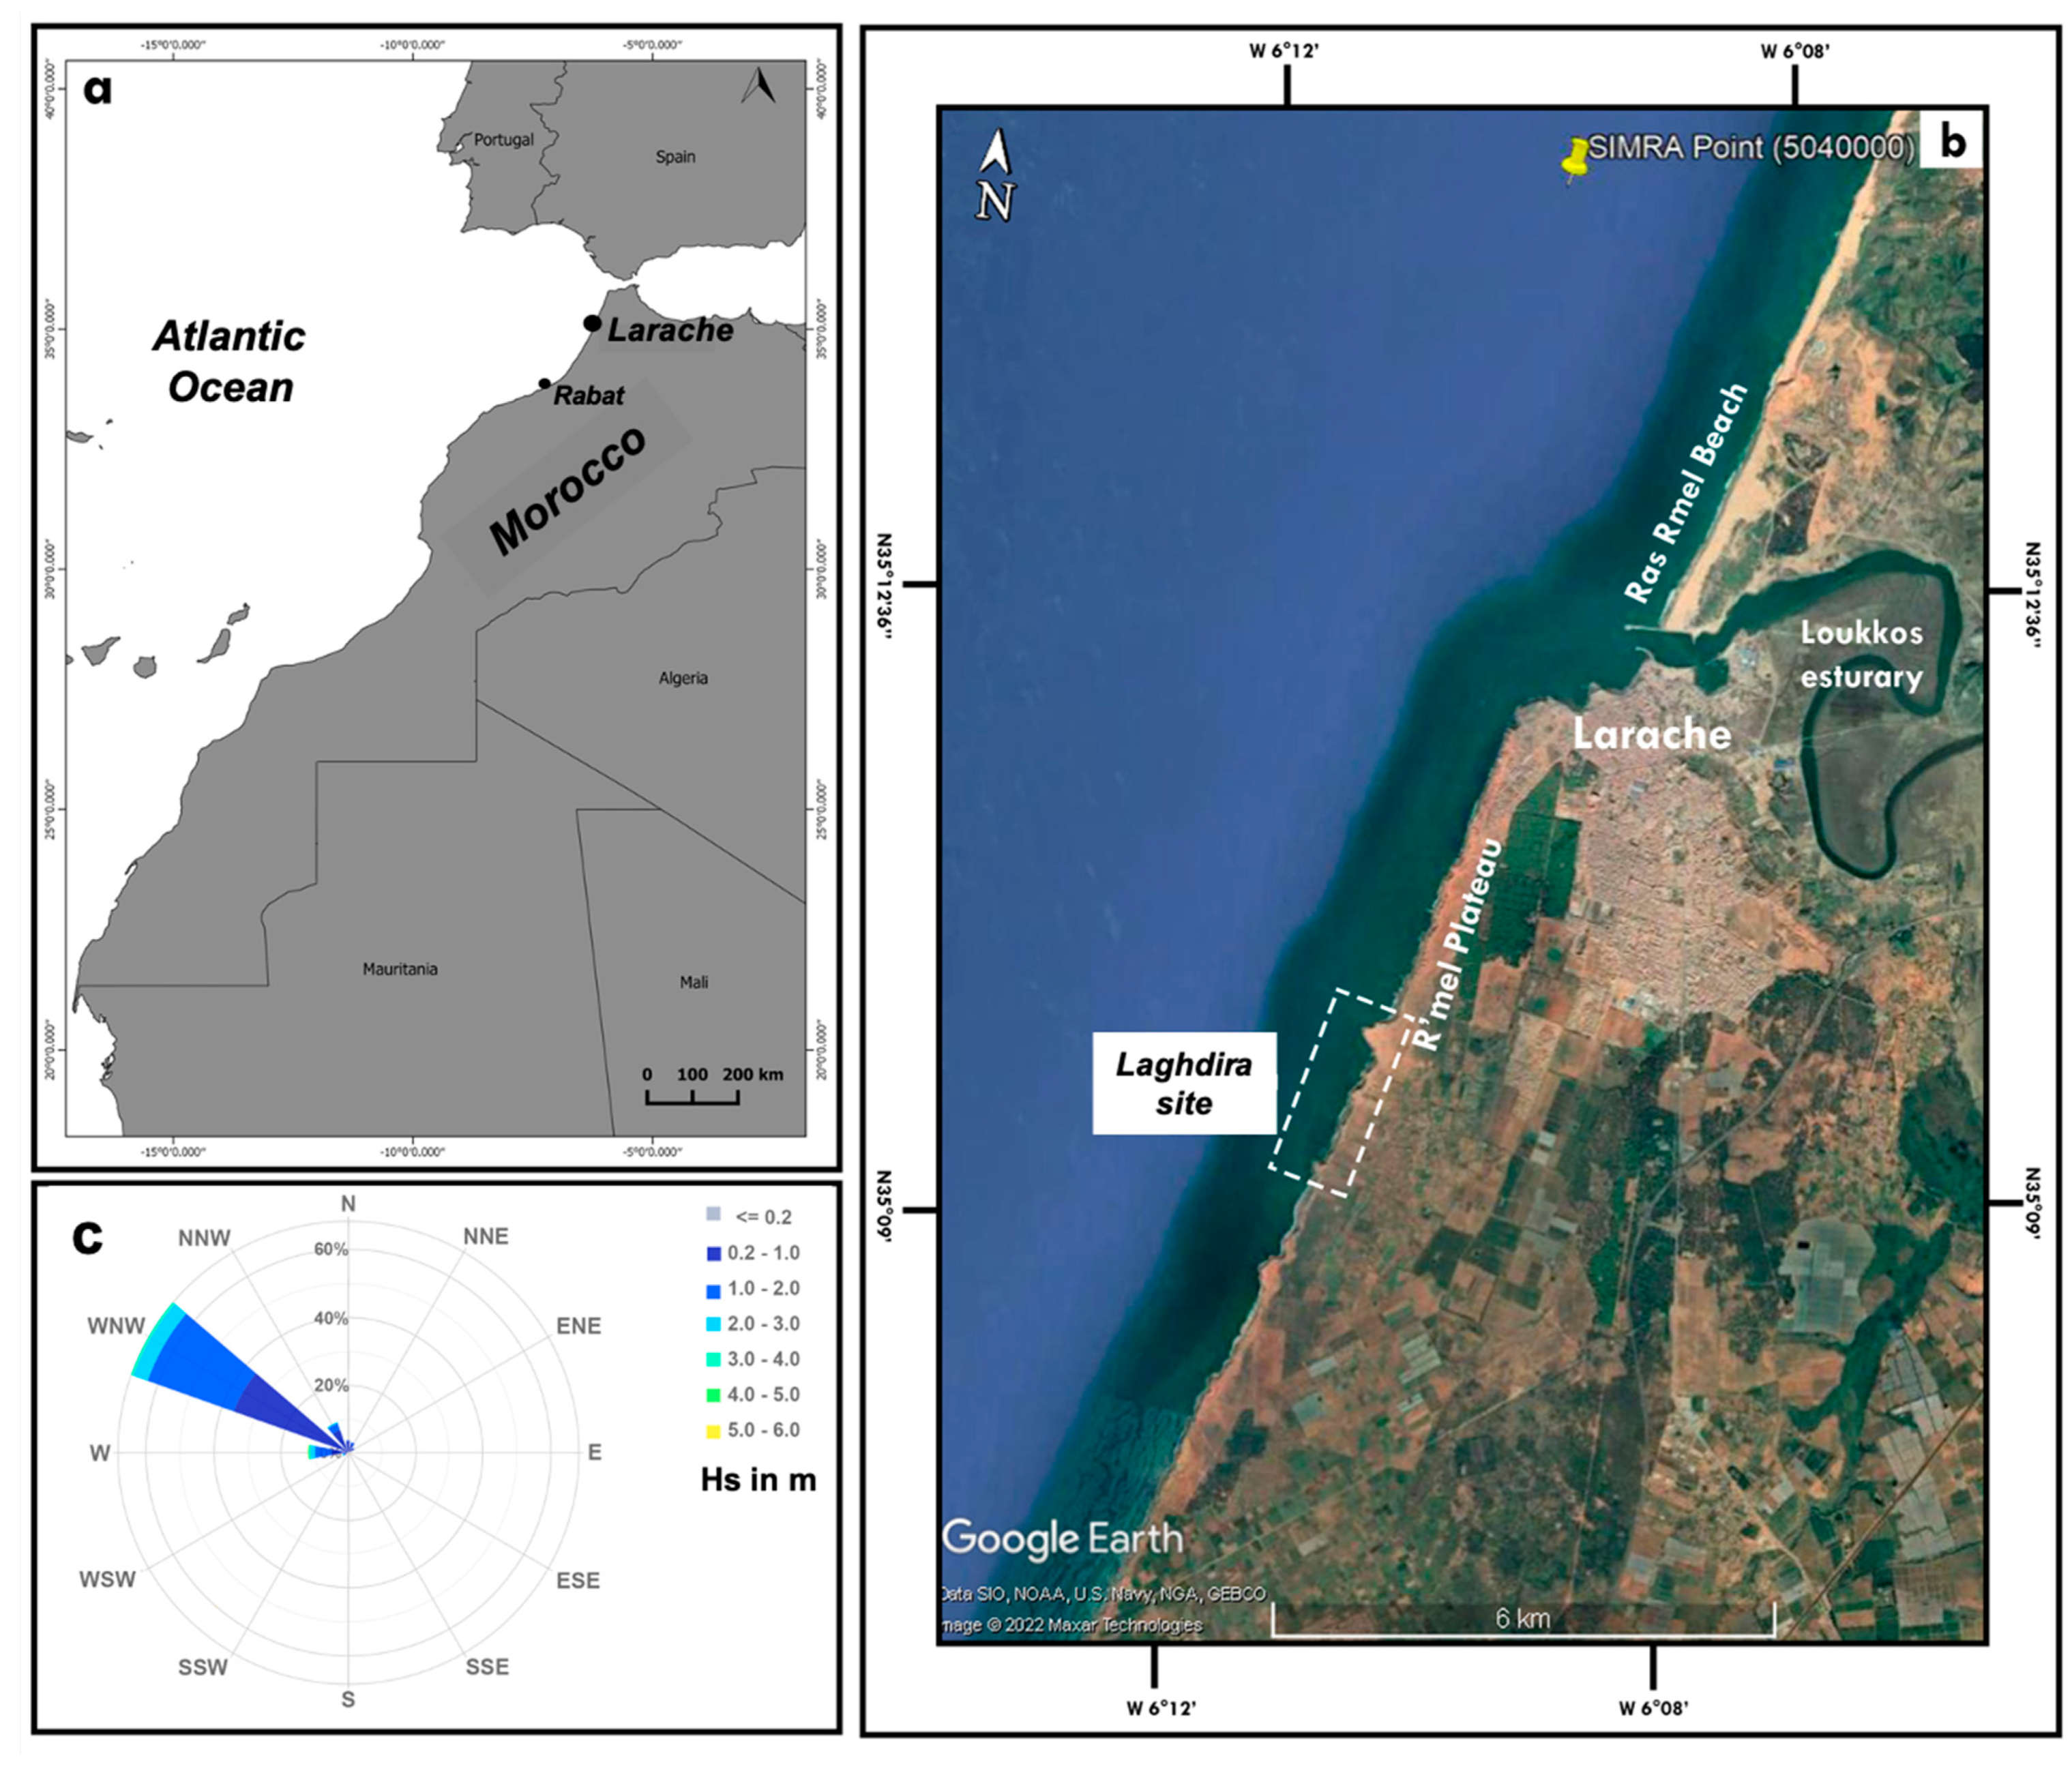
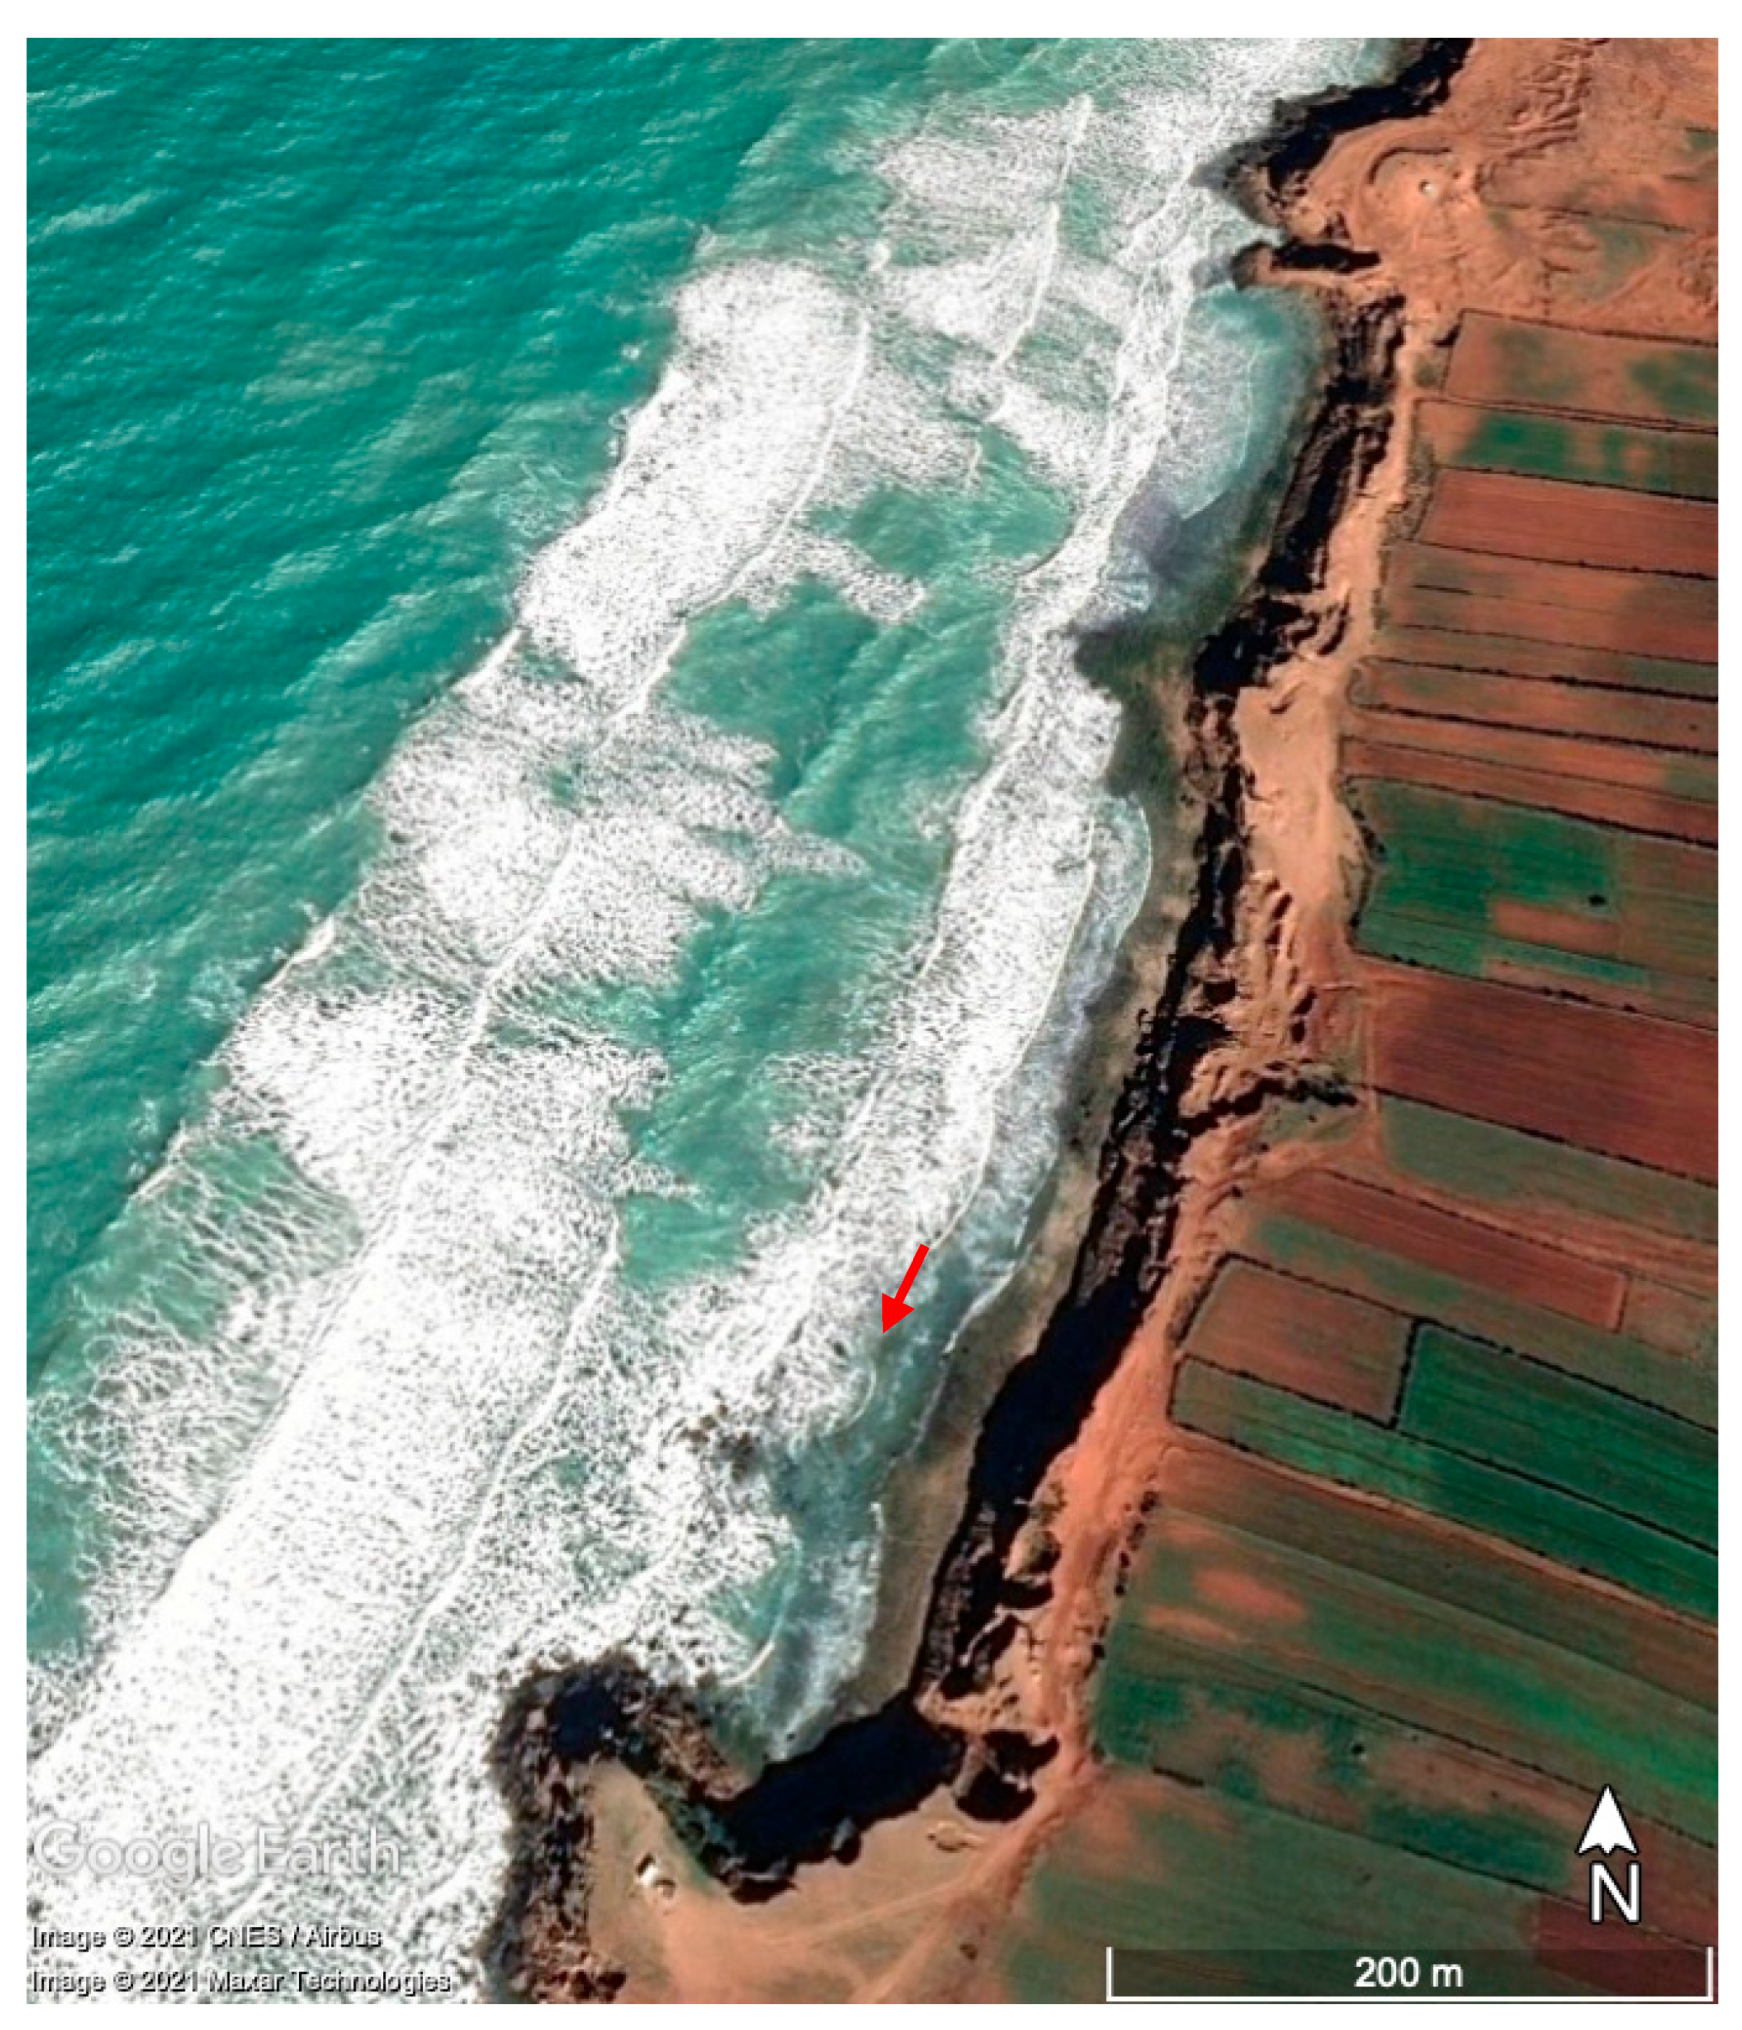
2. Study Area
3. Materials and Methods
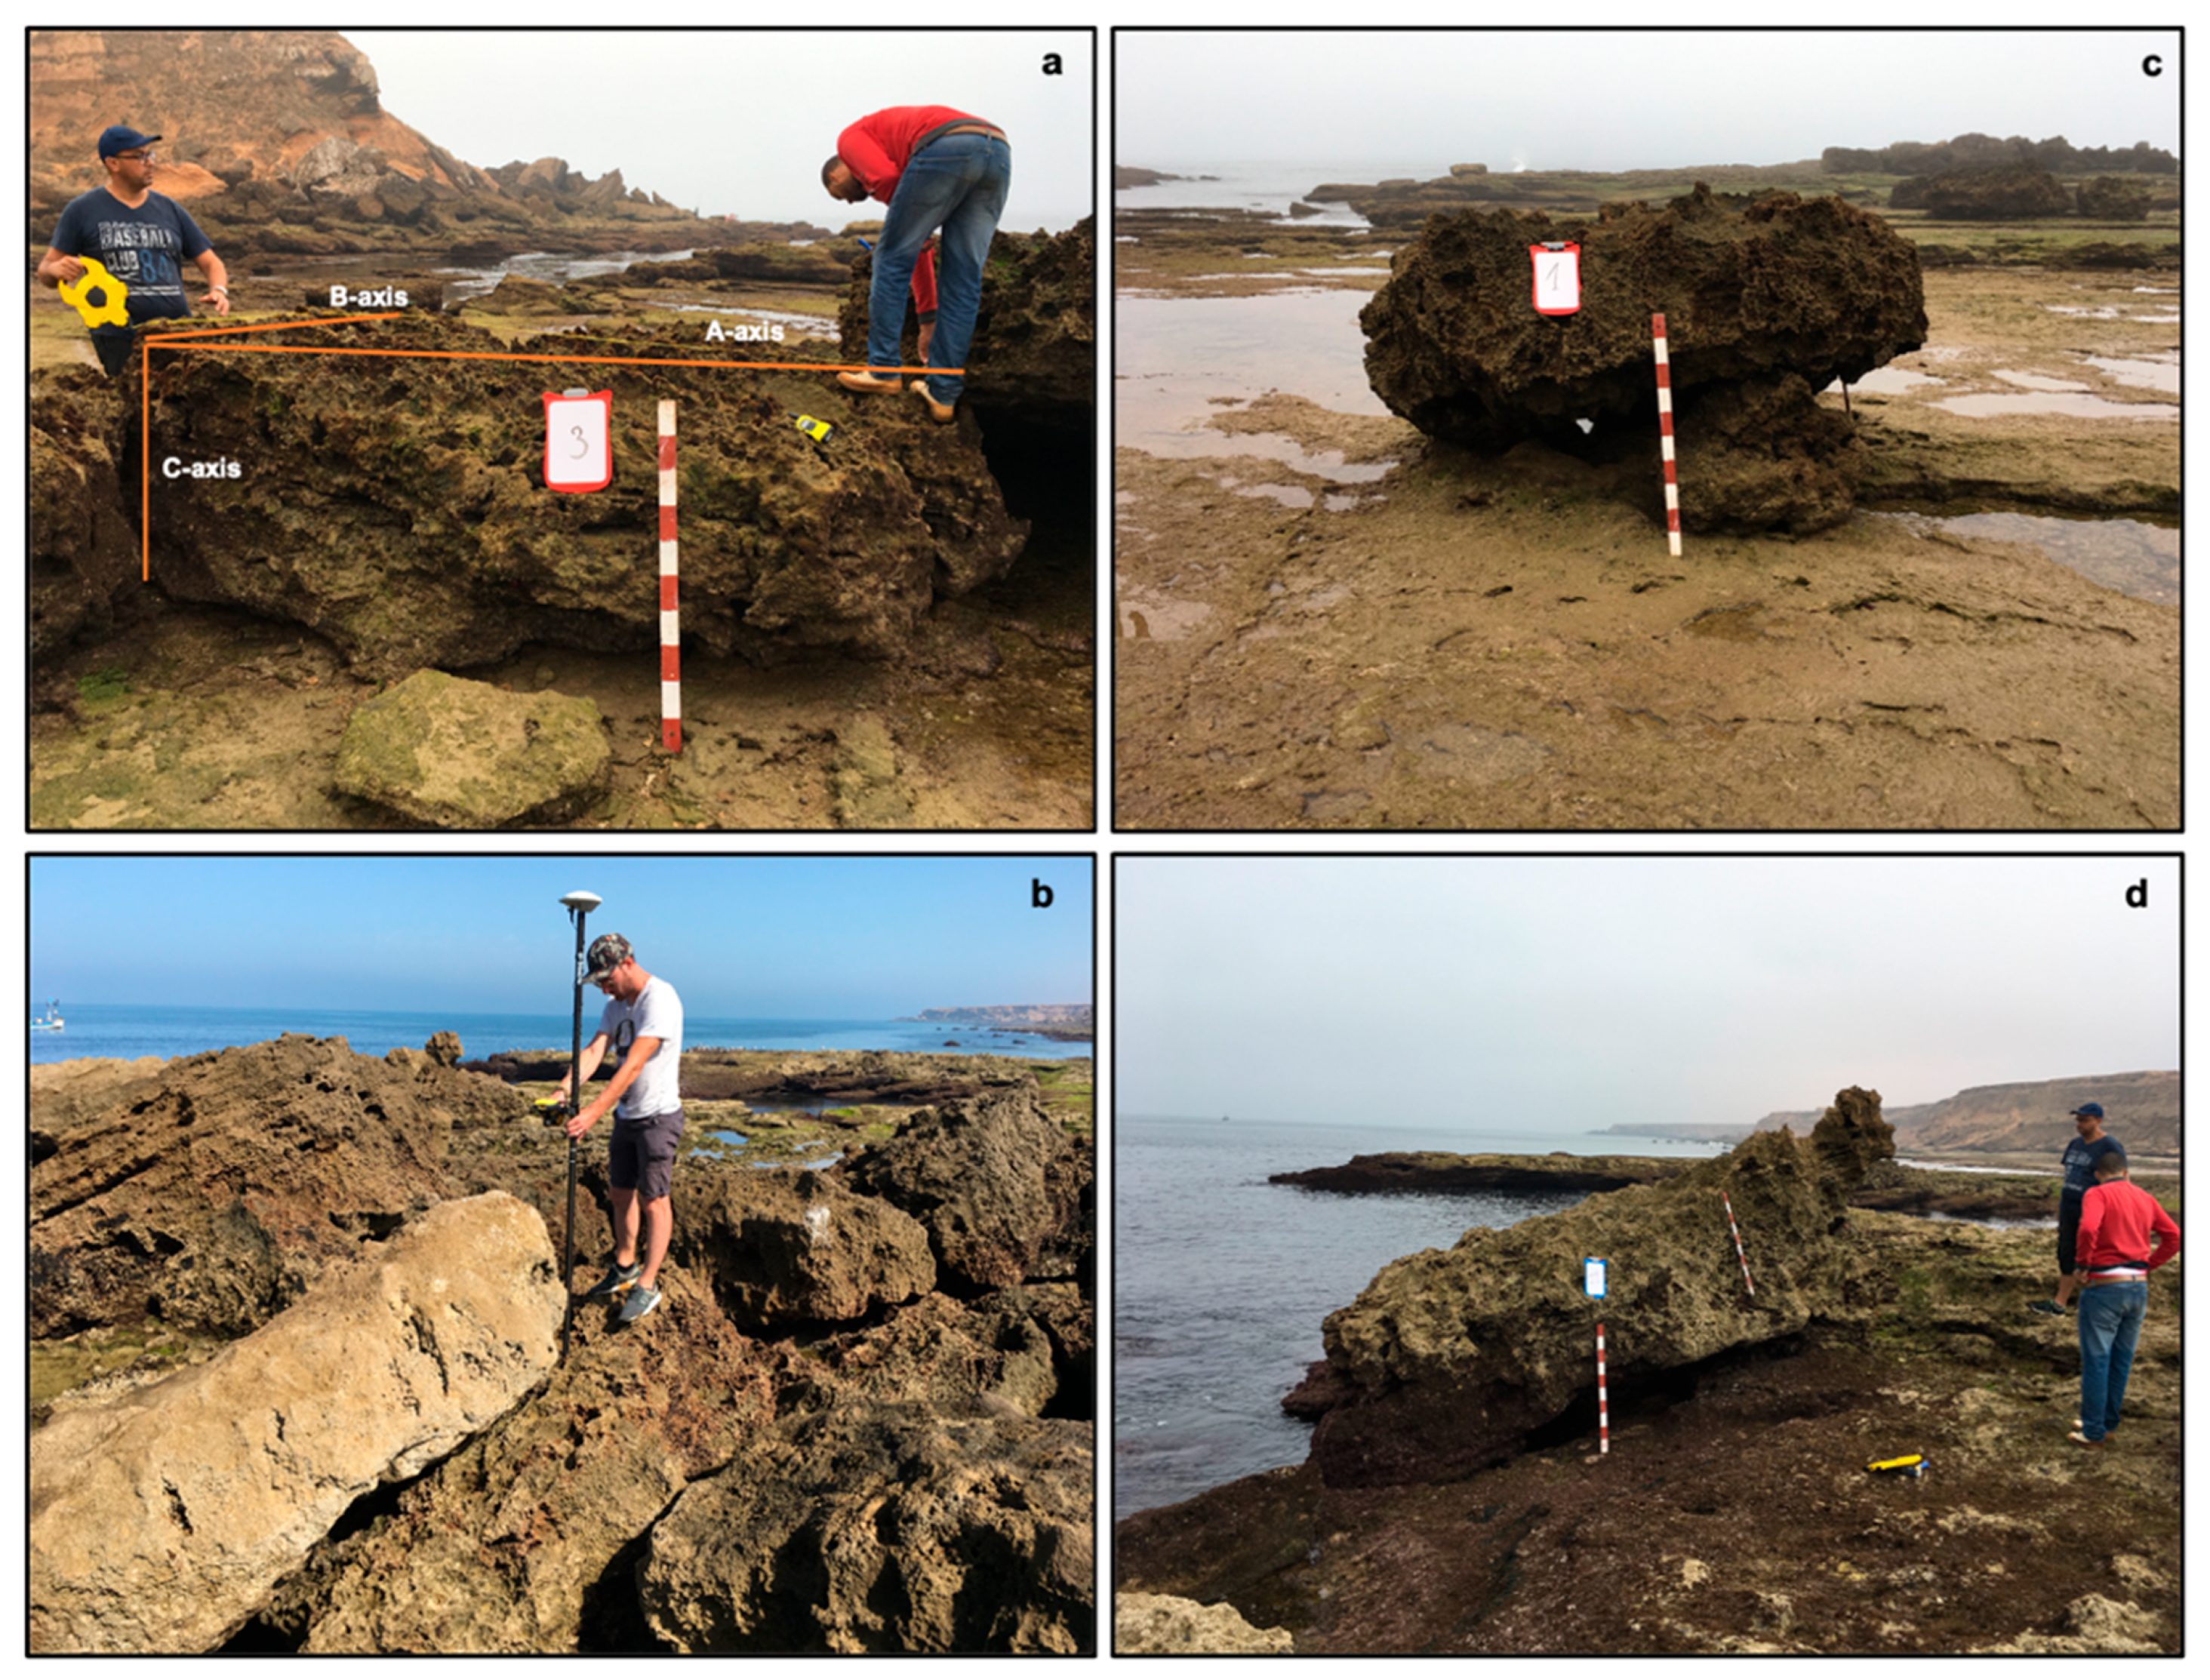
3.1. Field Surveys
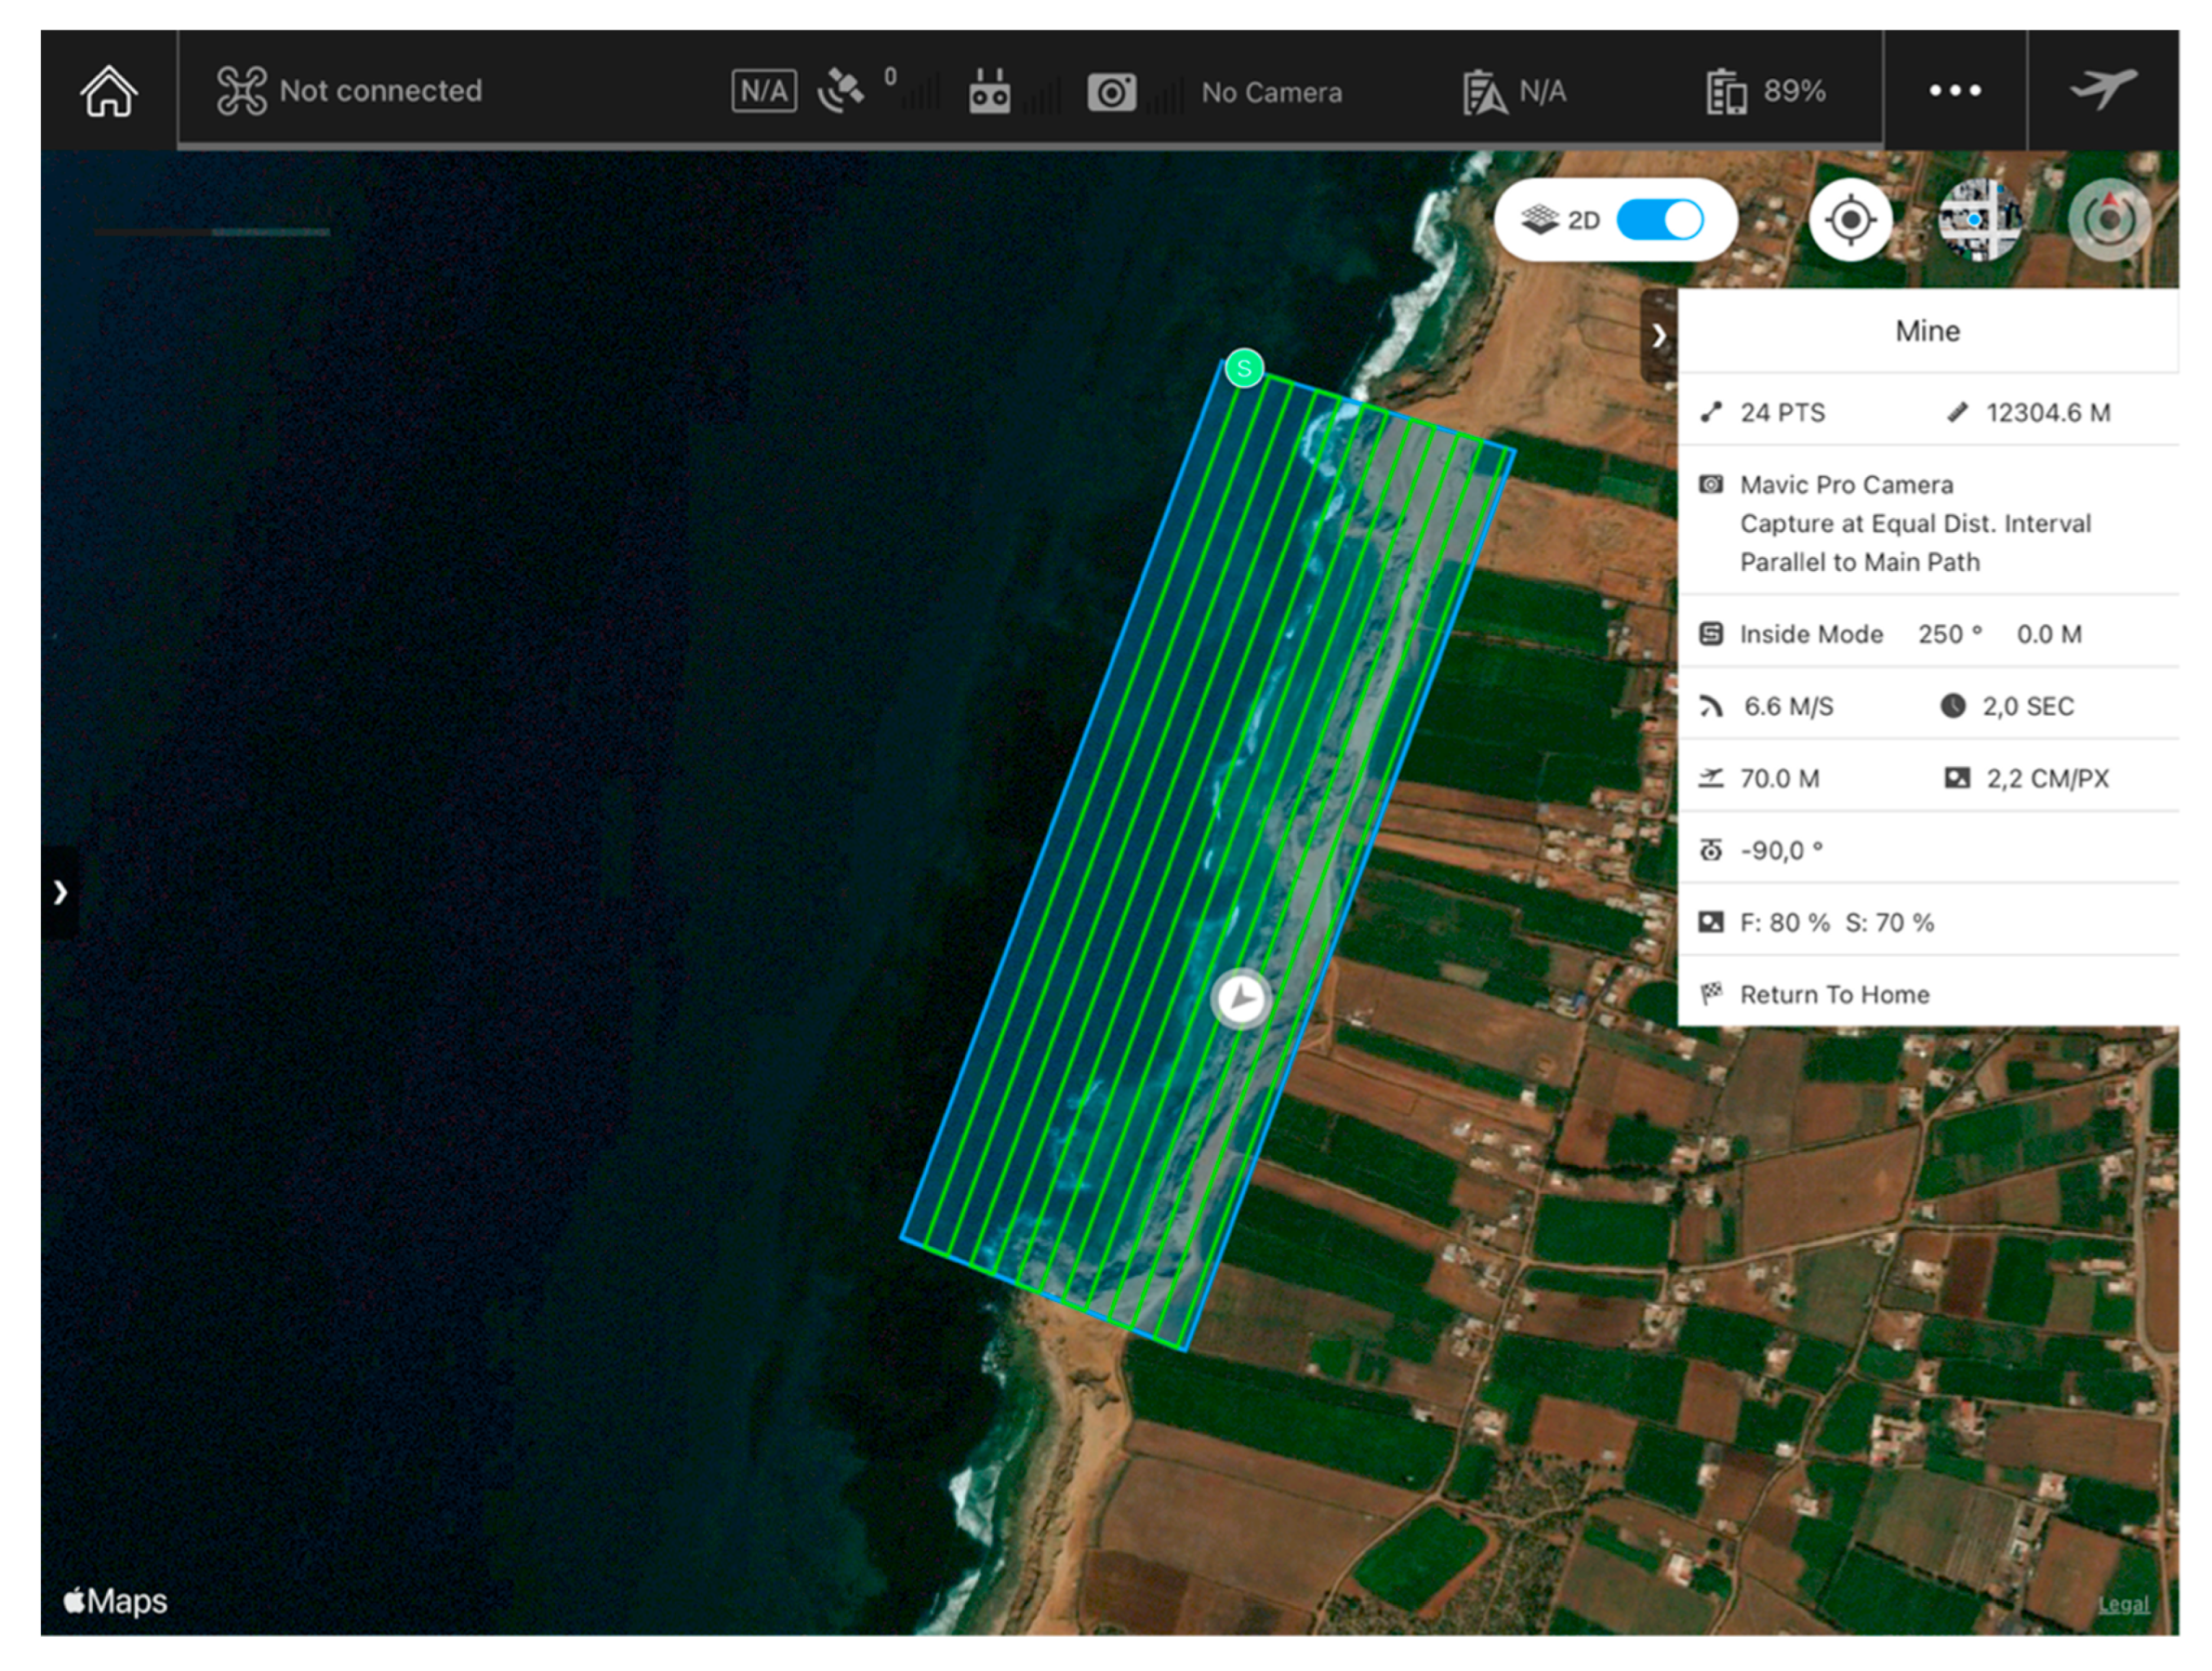
3.2. UAV on-Site Surveys and Image Acquisition
3.3. Aerial Image Analysis and Model Generation
4. Results
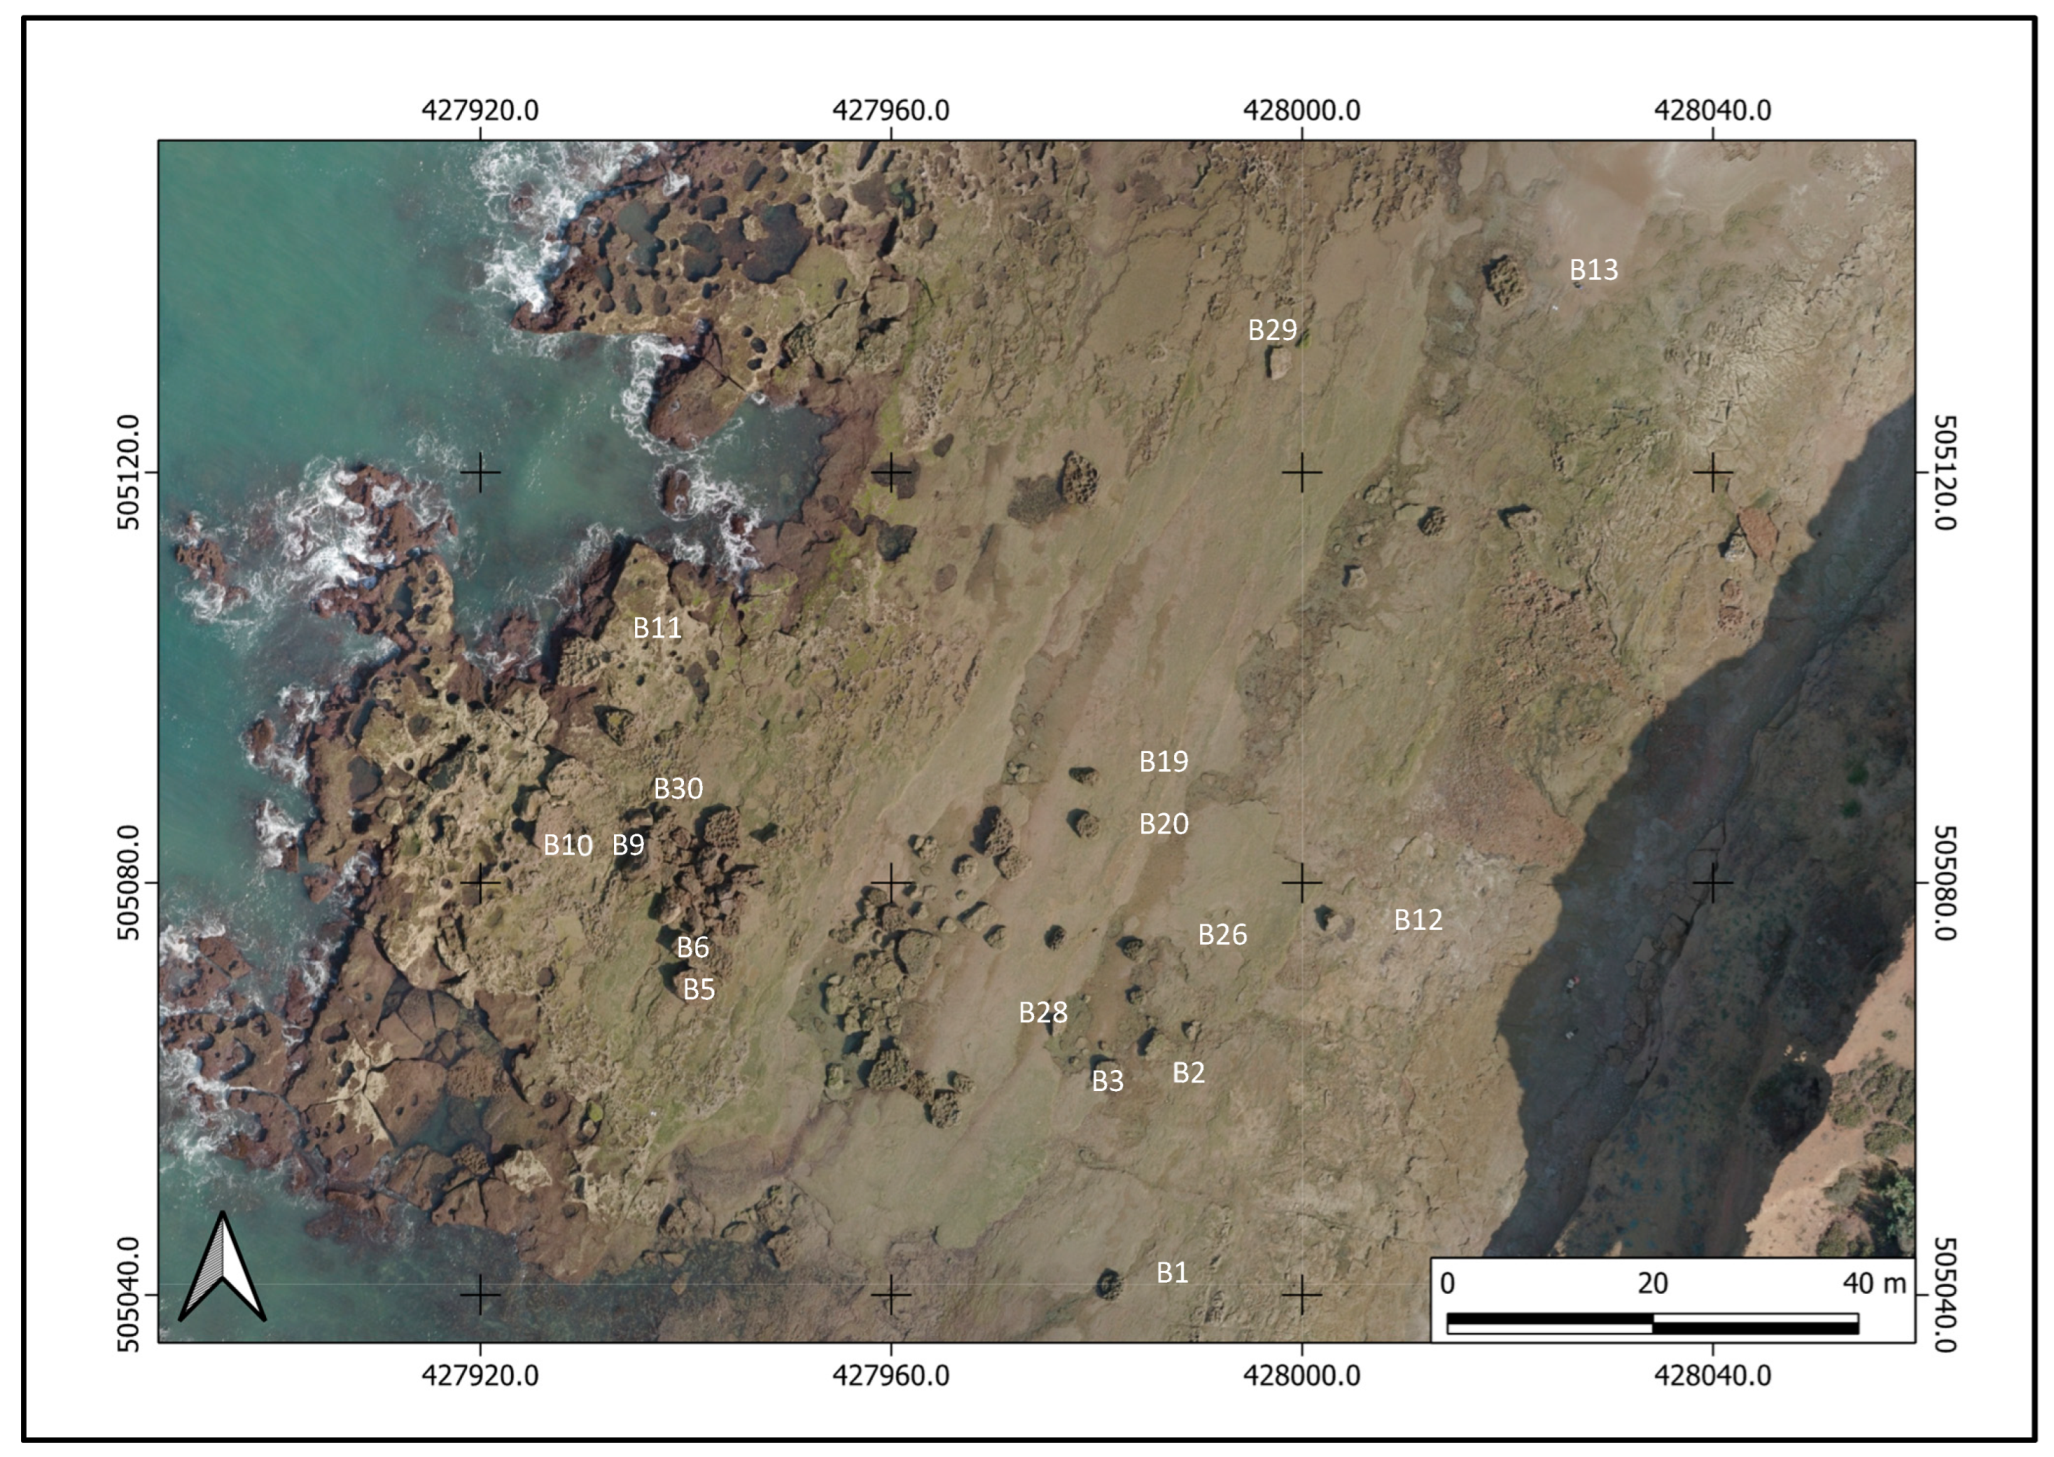
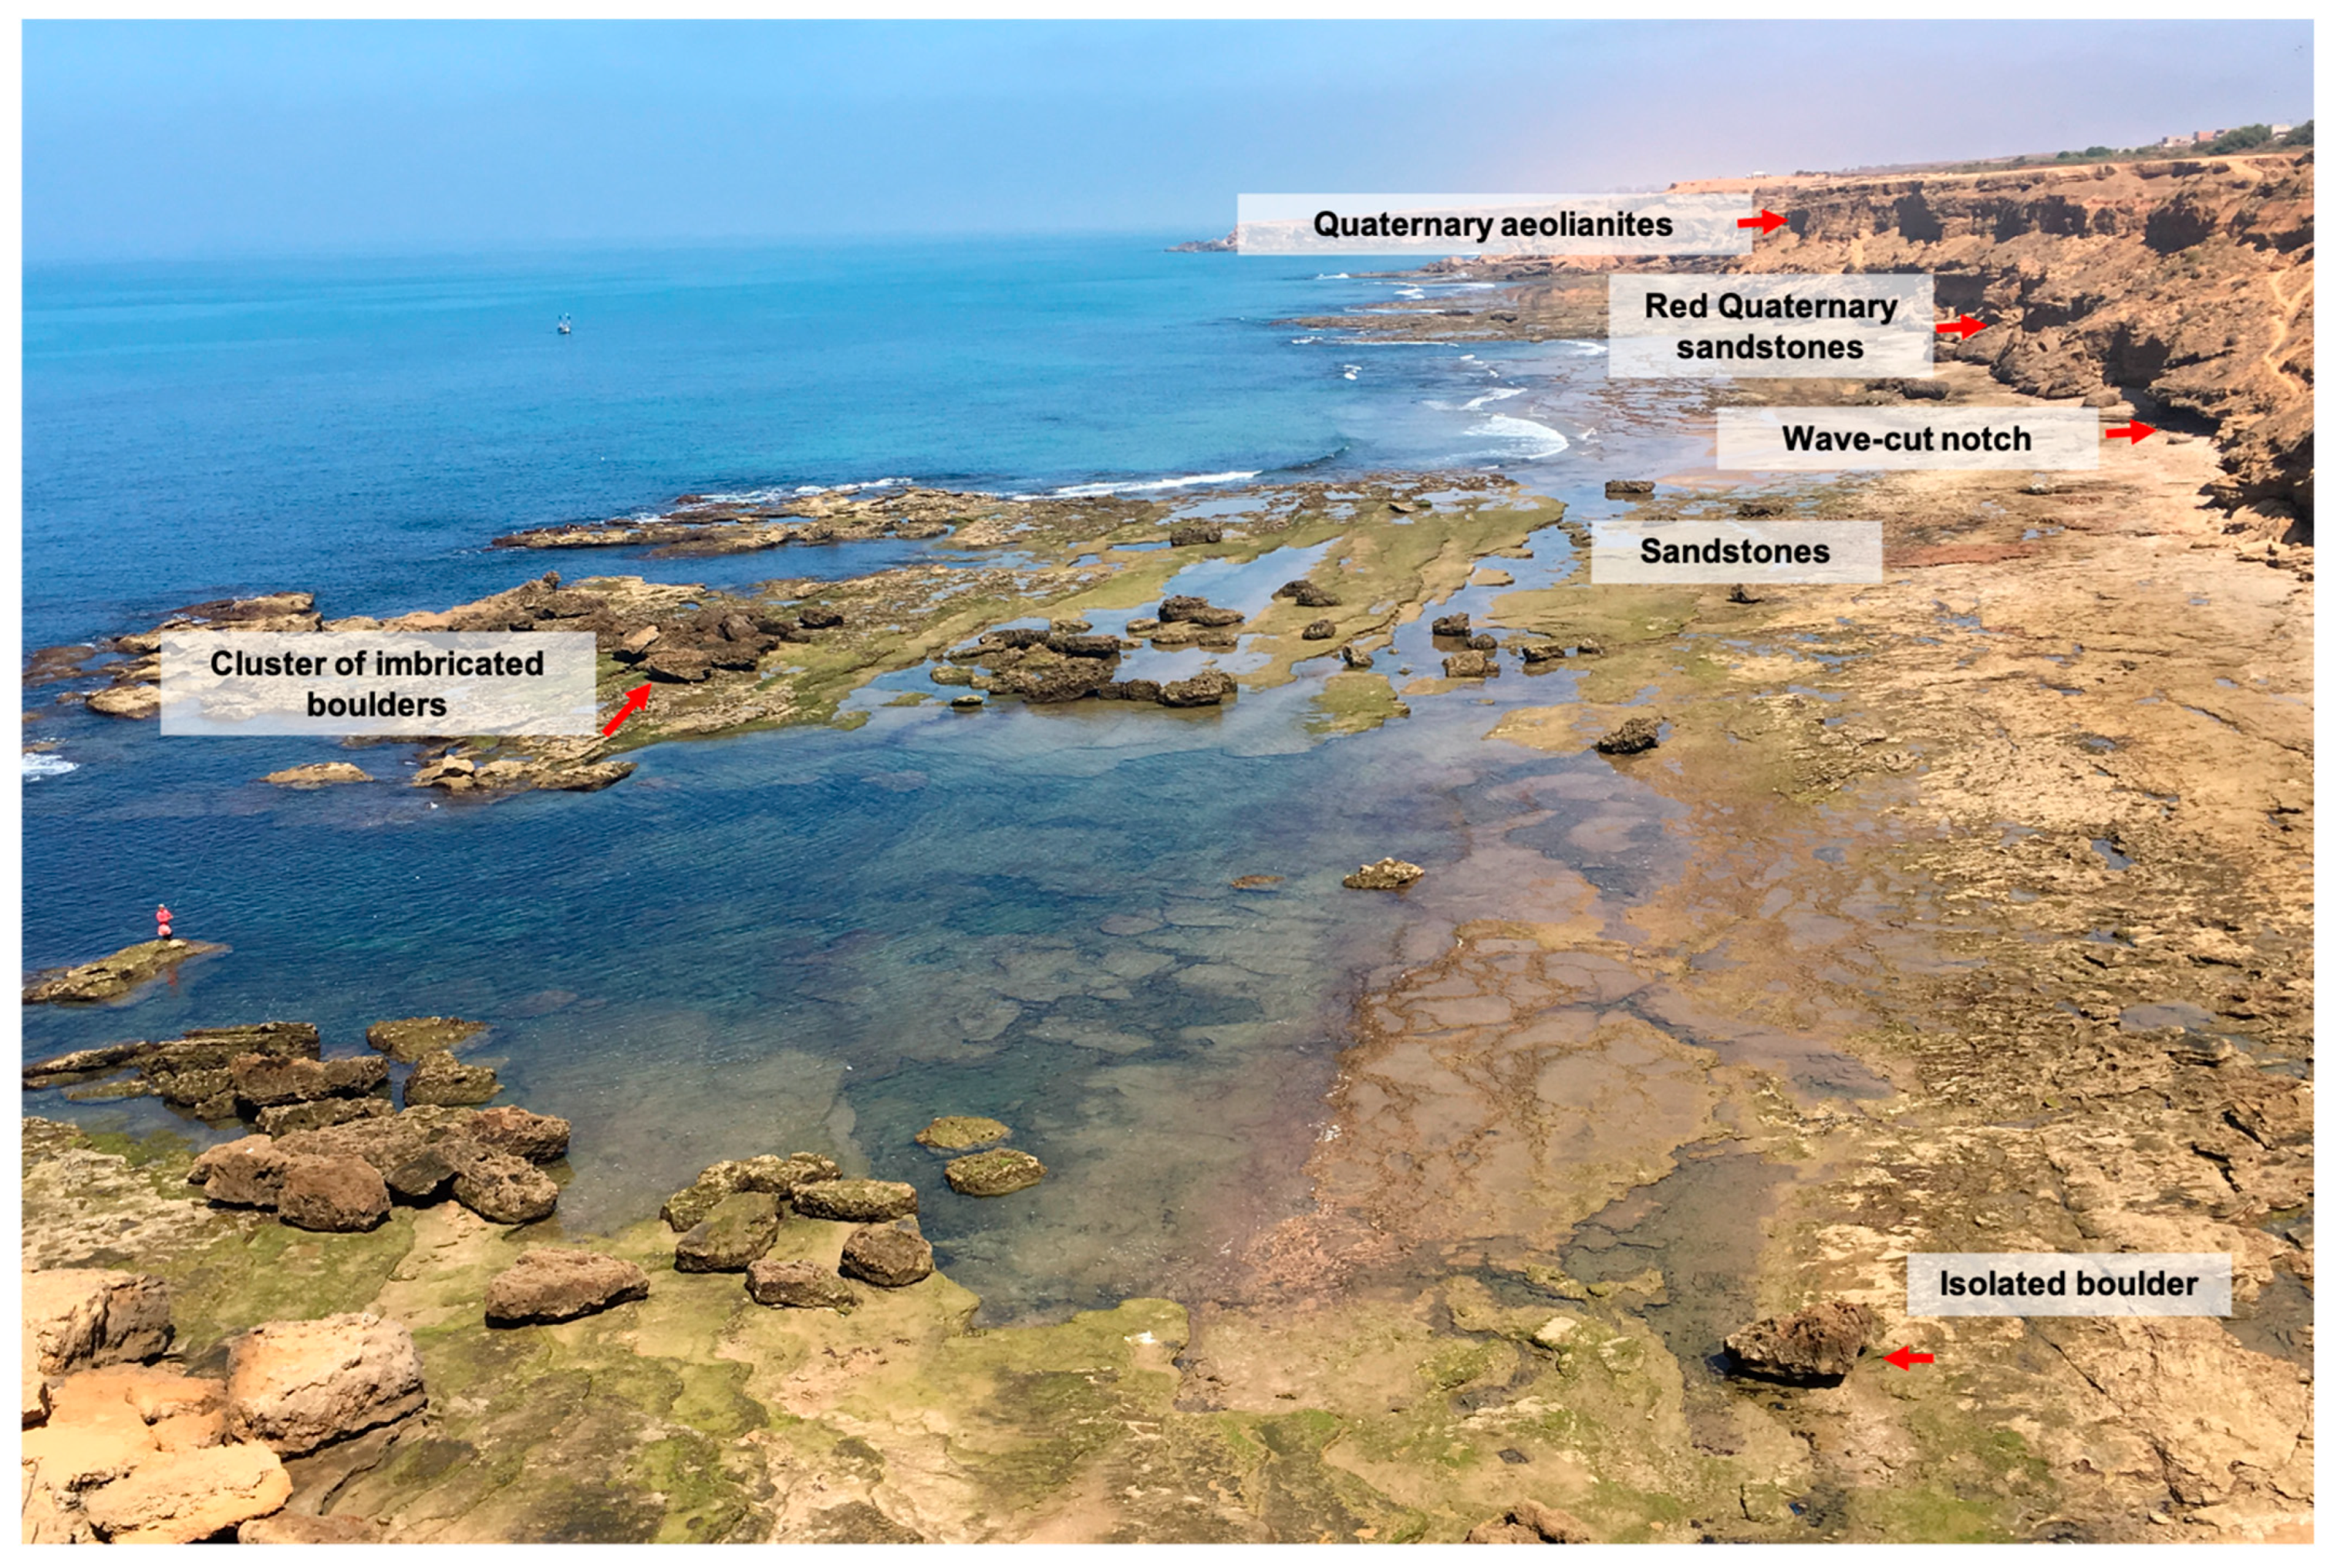
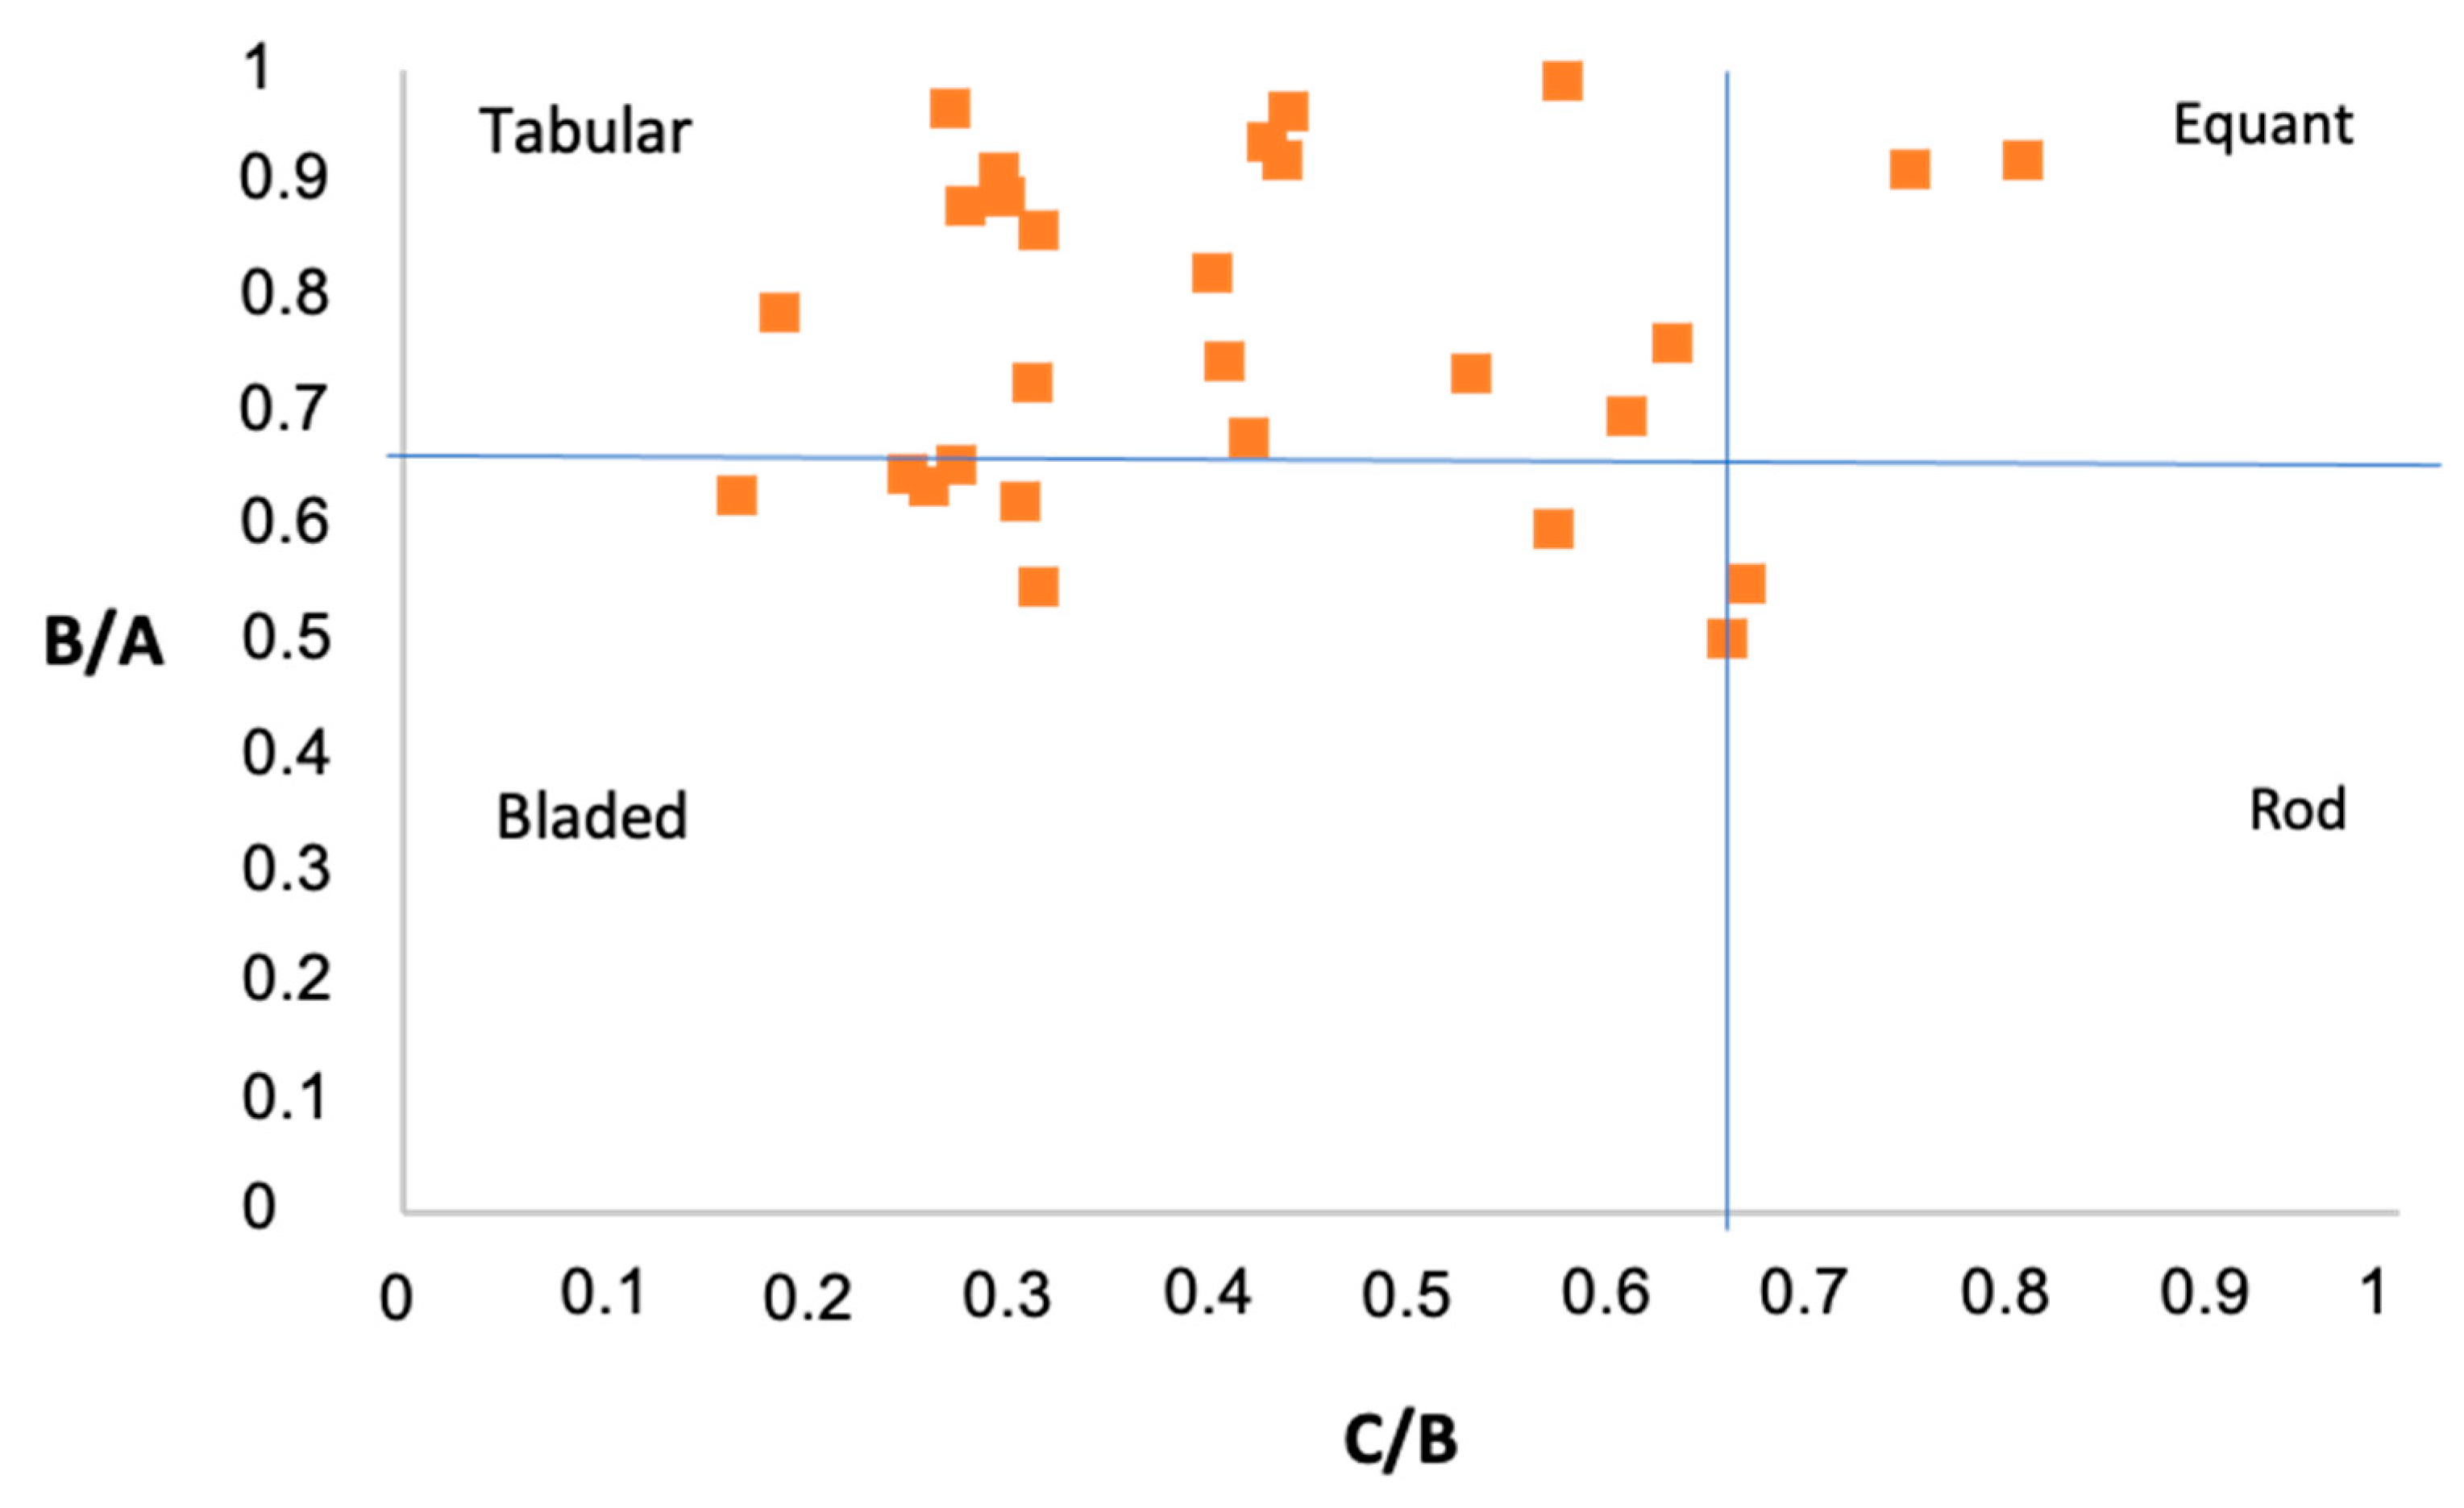
4.1. Boulder Settings and Measurements
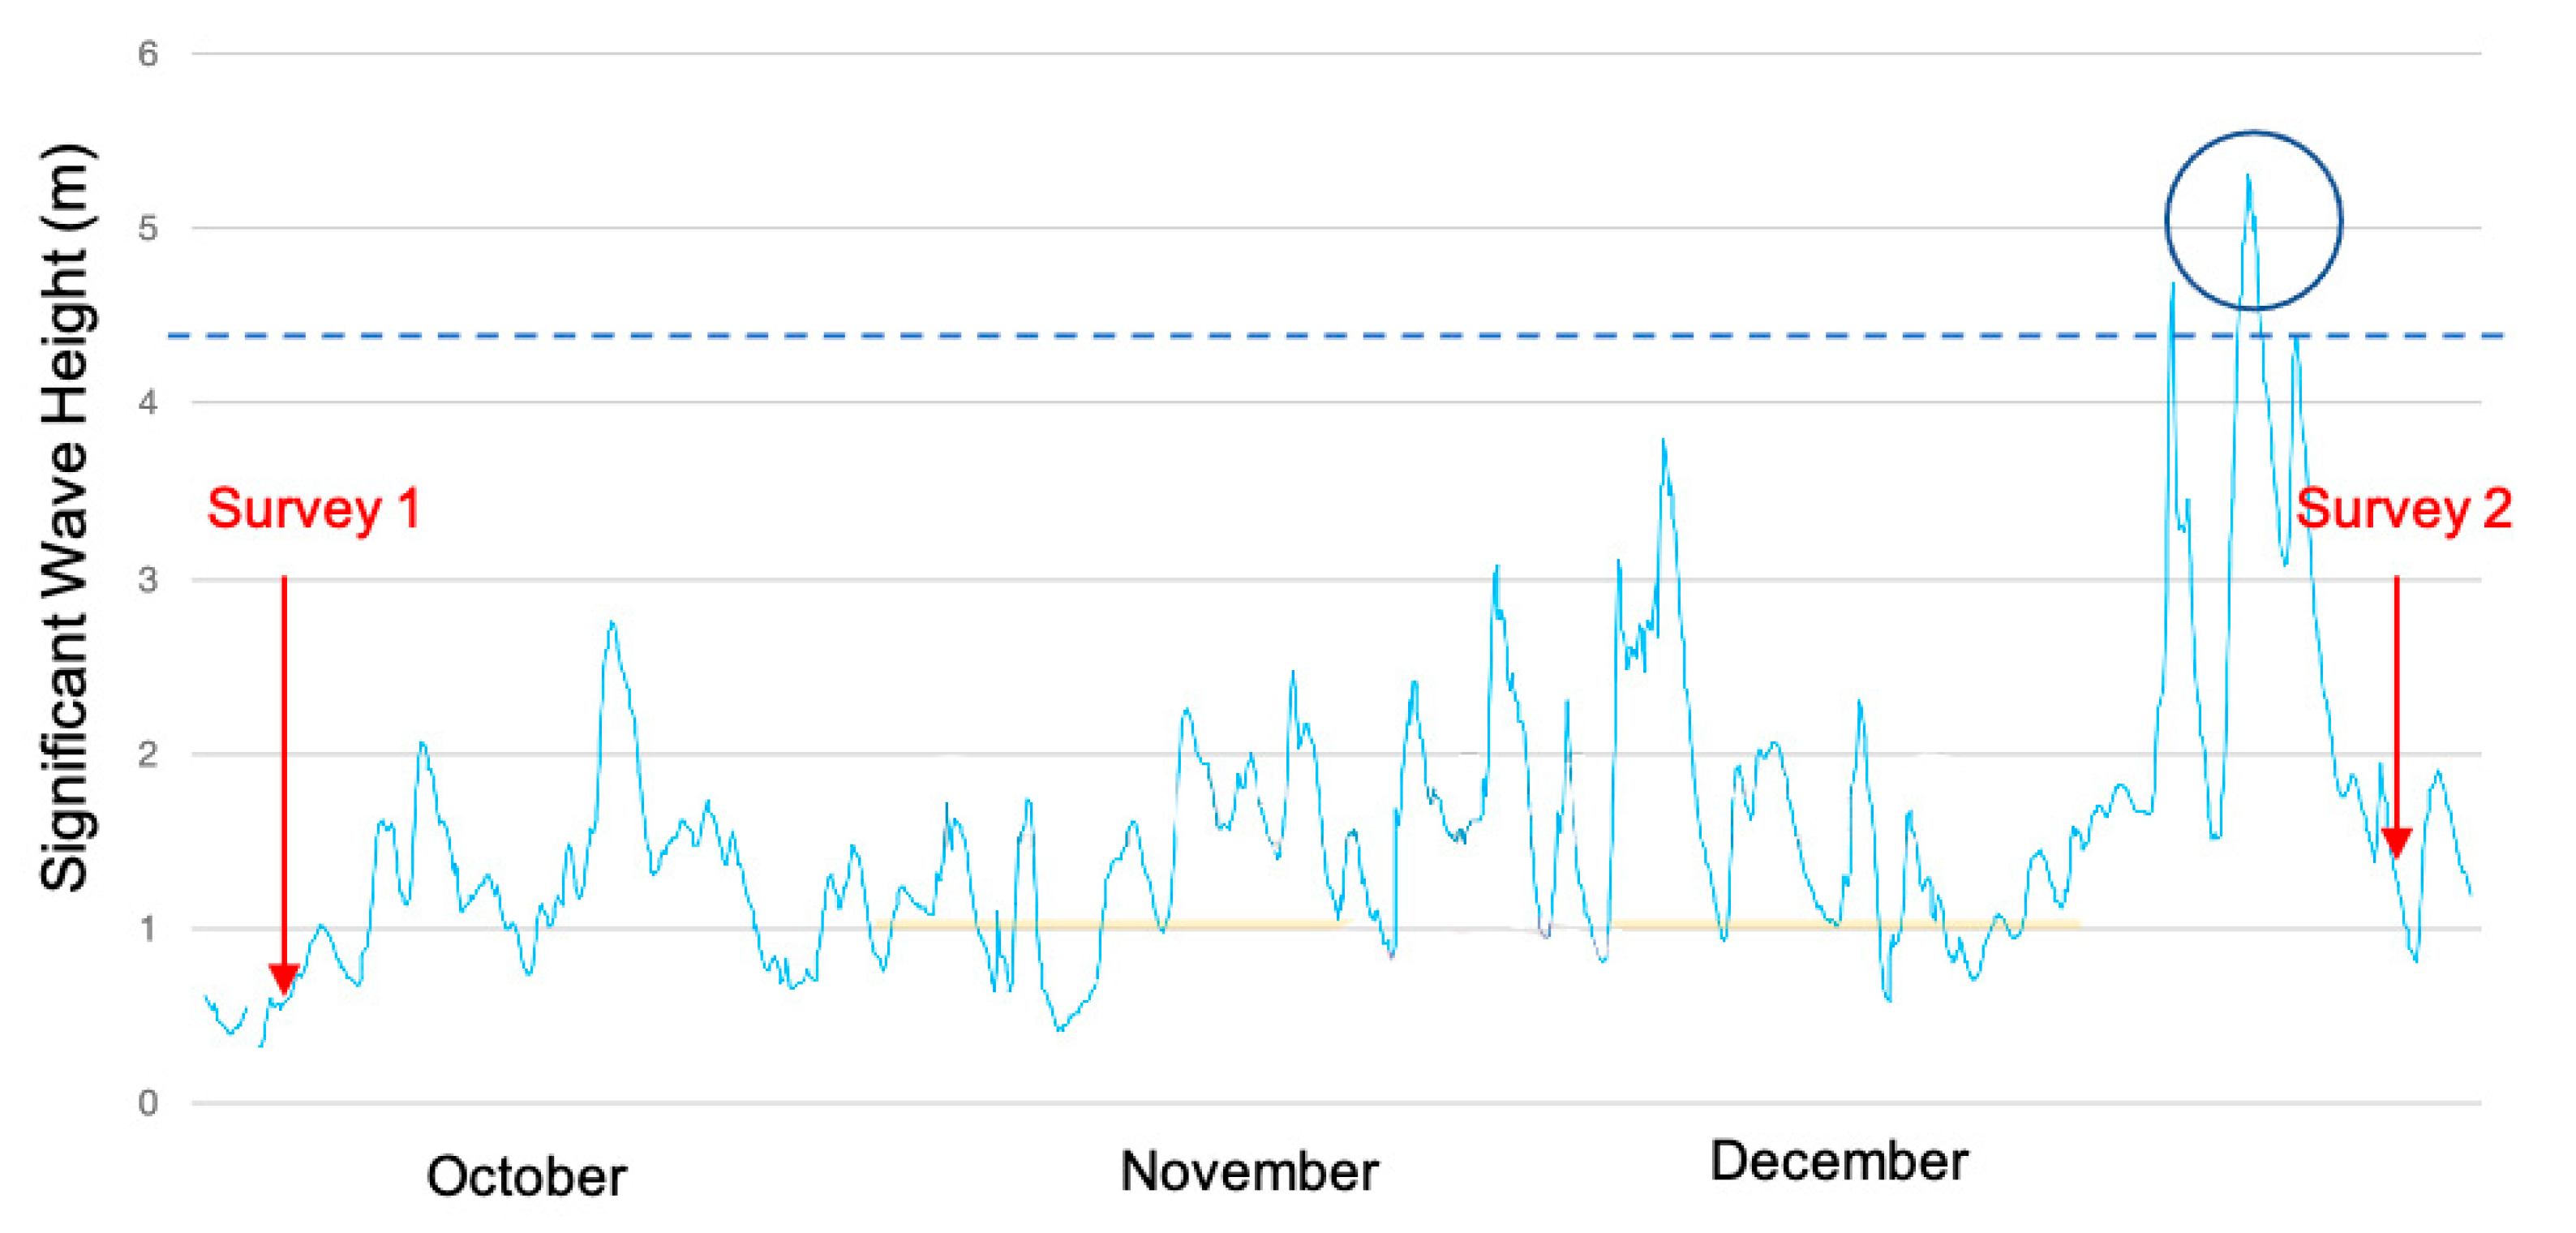
4.2. Wave Conditions and Storms between UAV Surveys
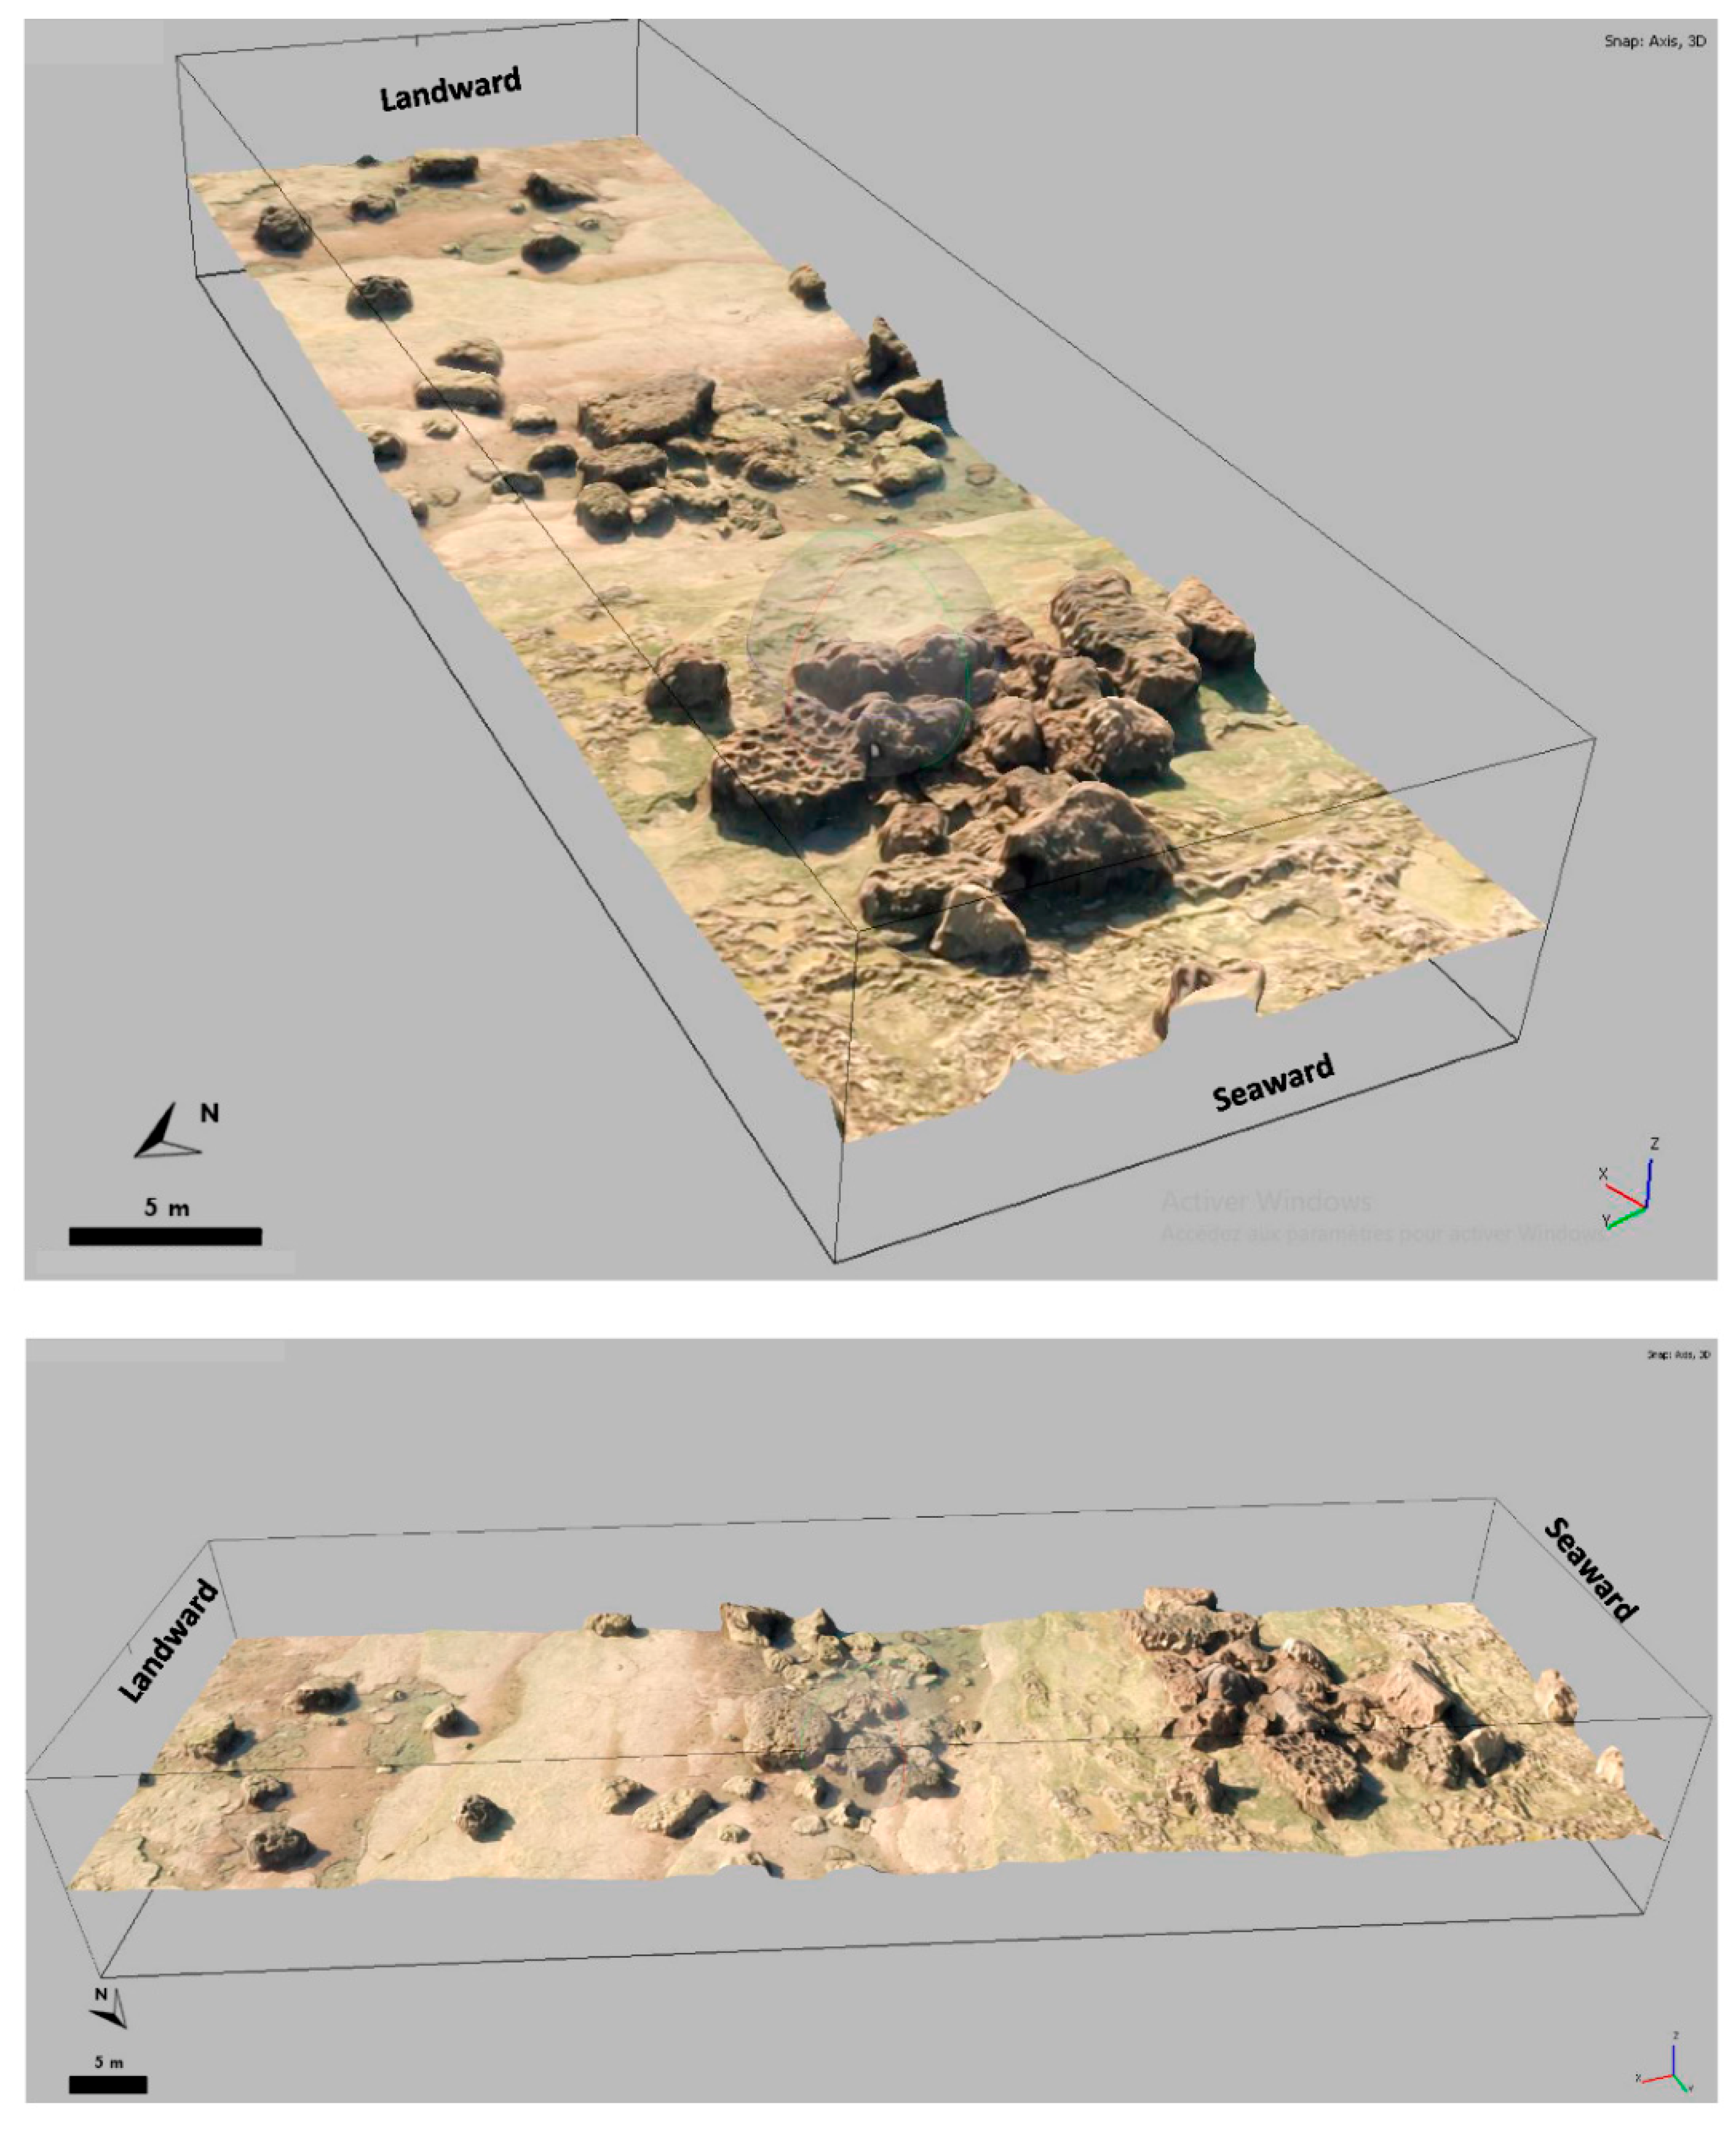
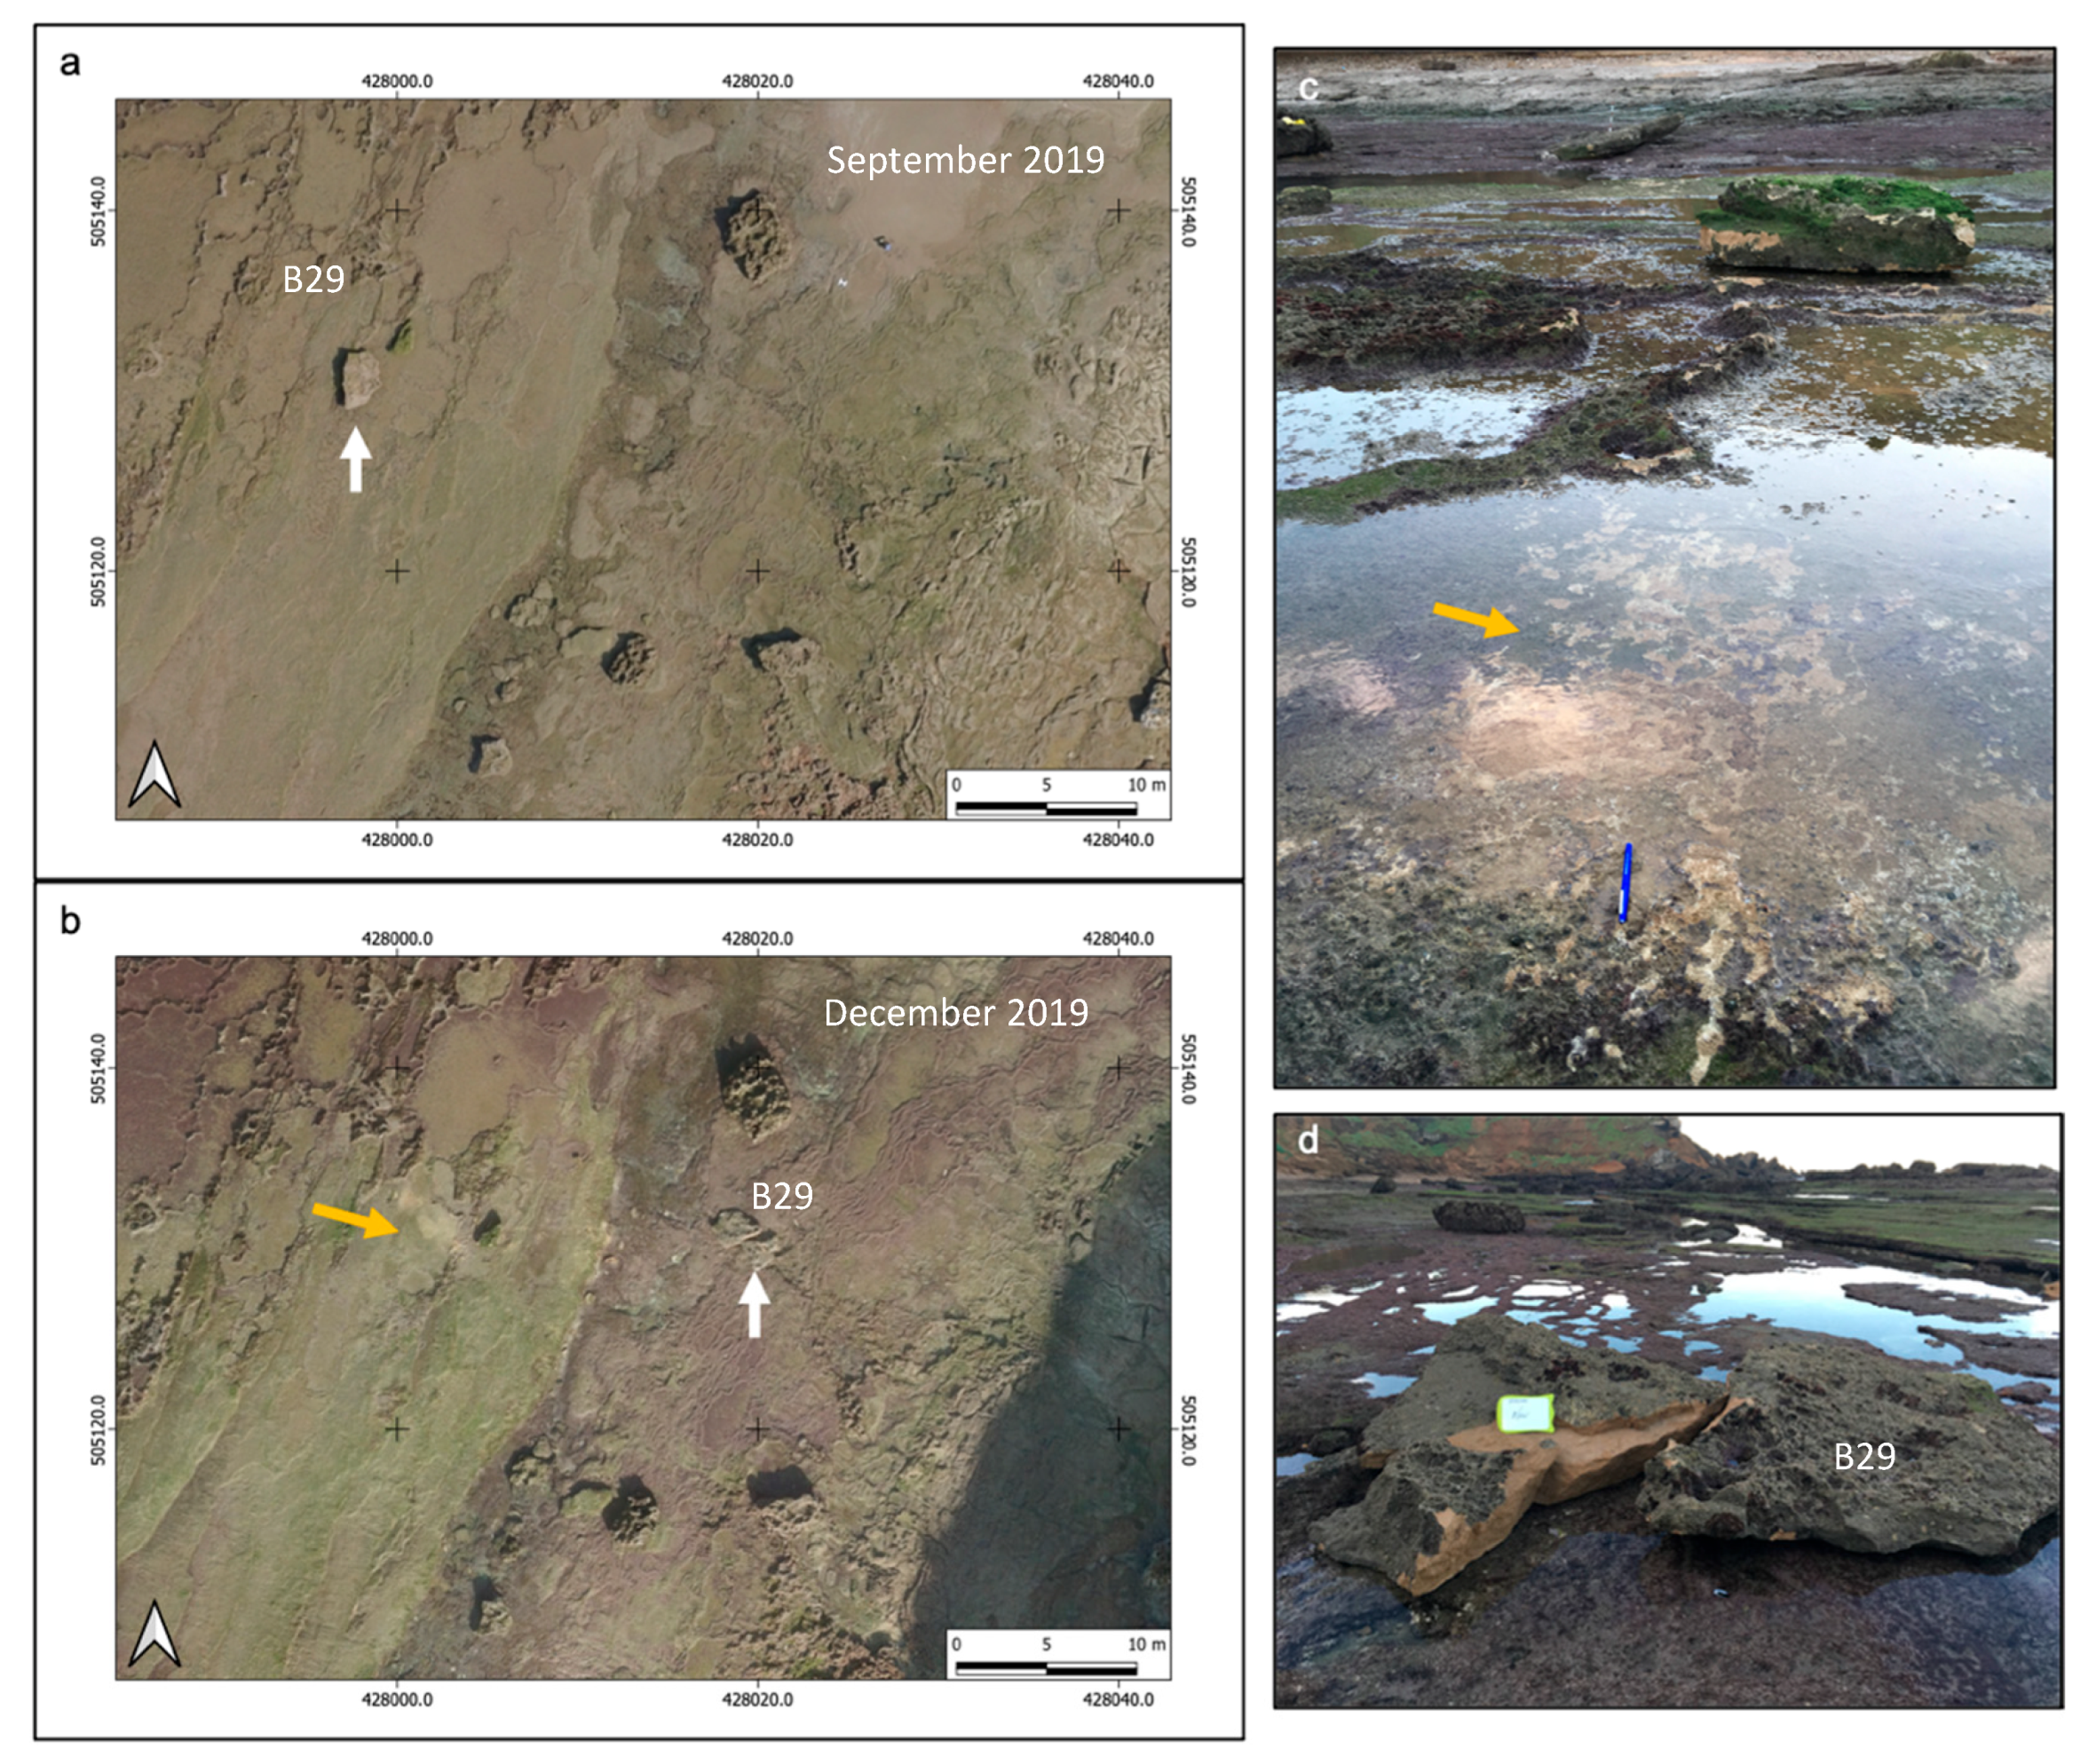
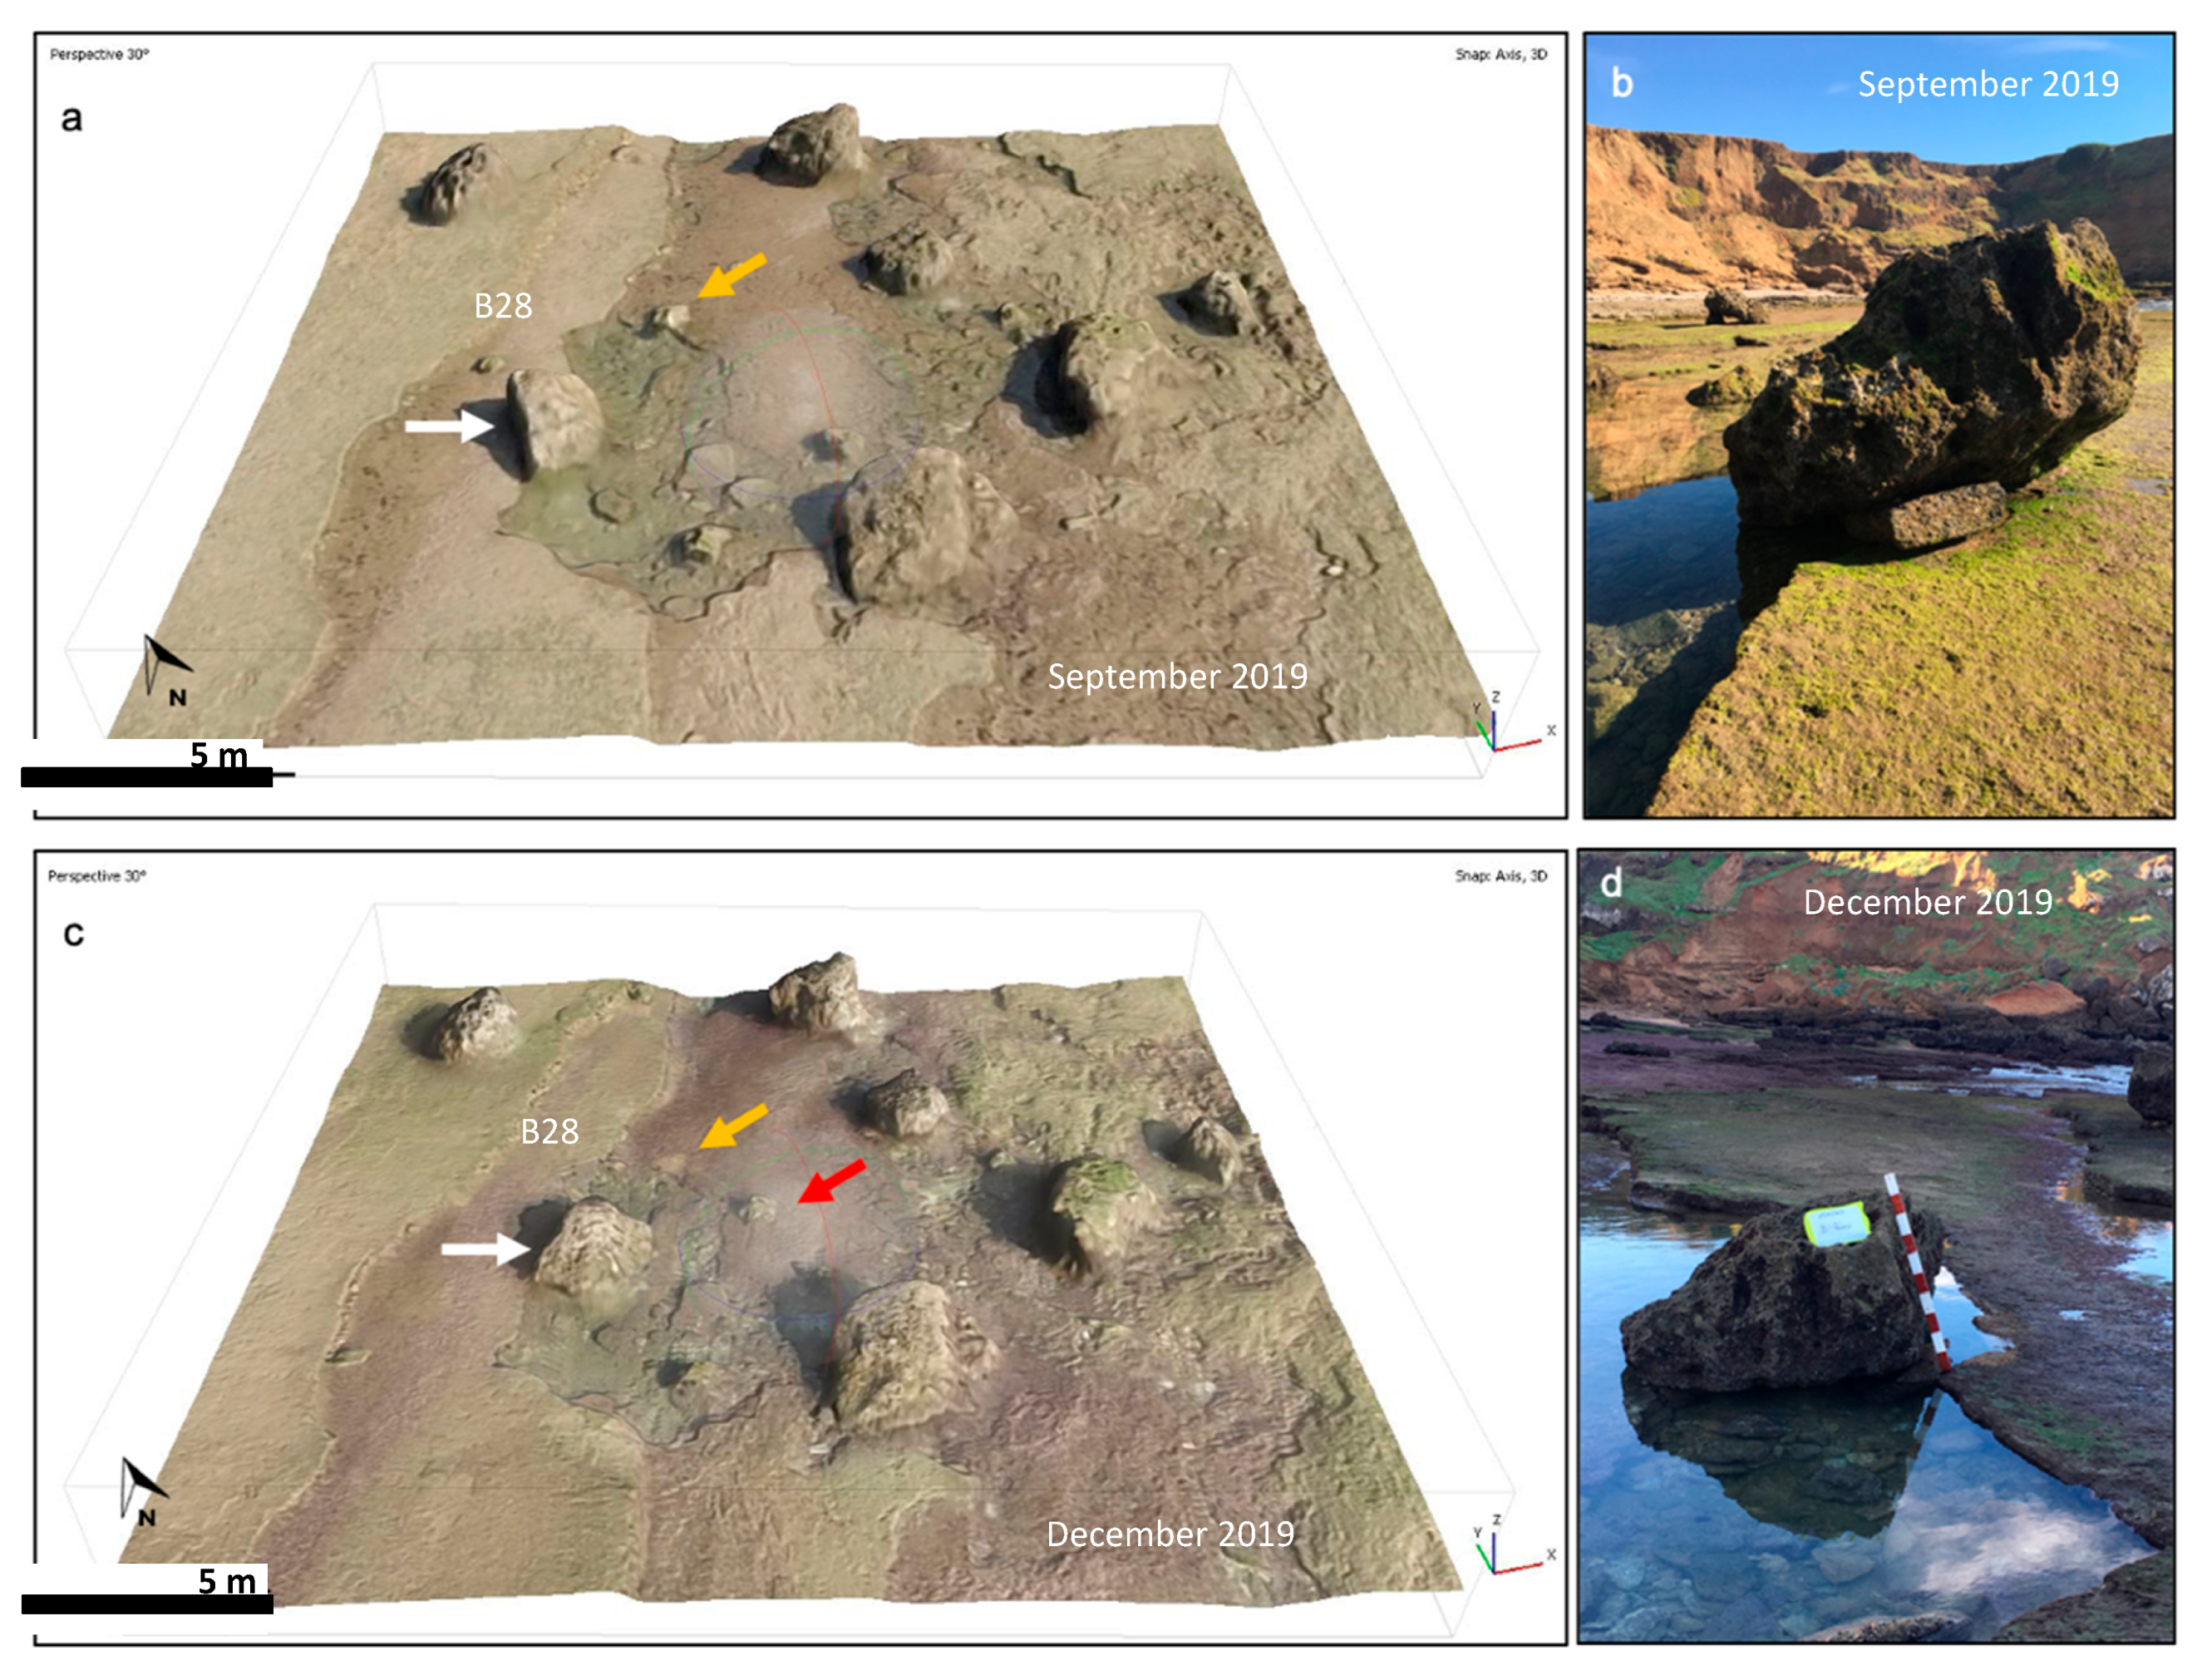
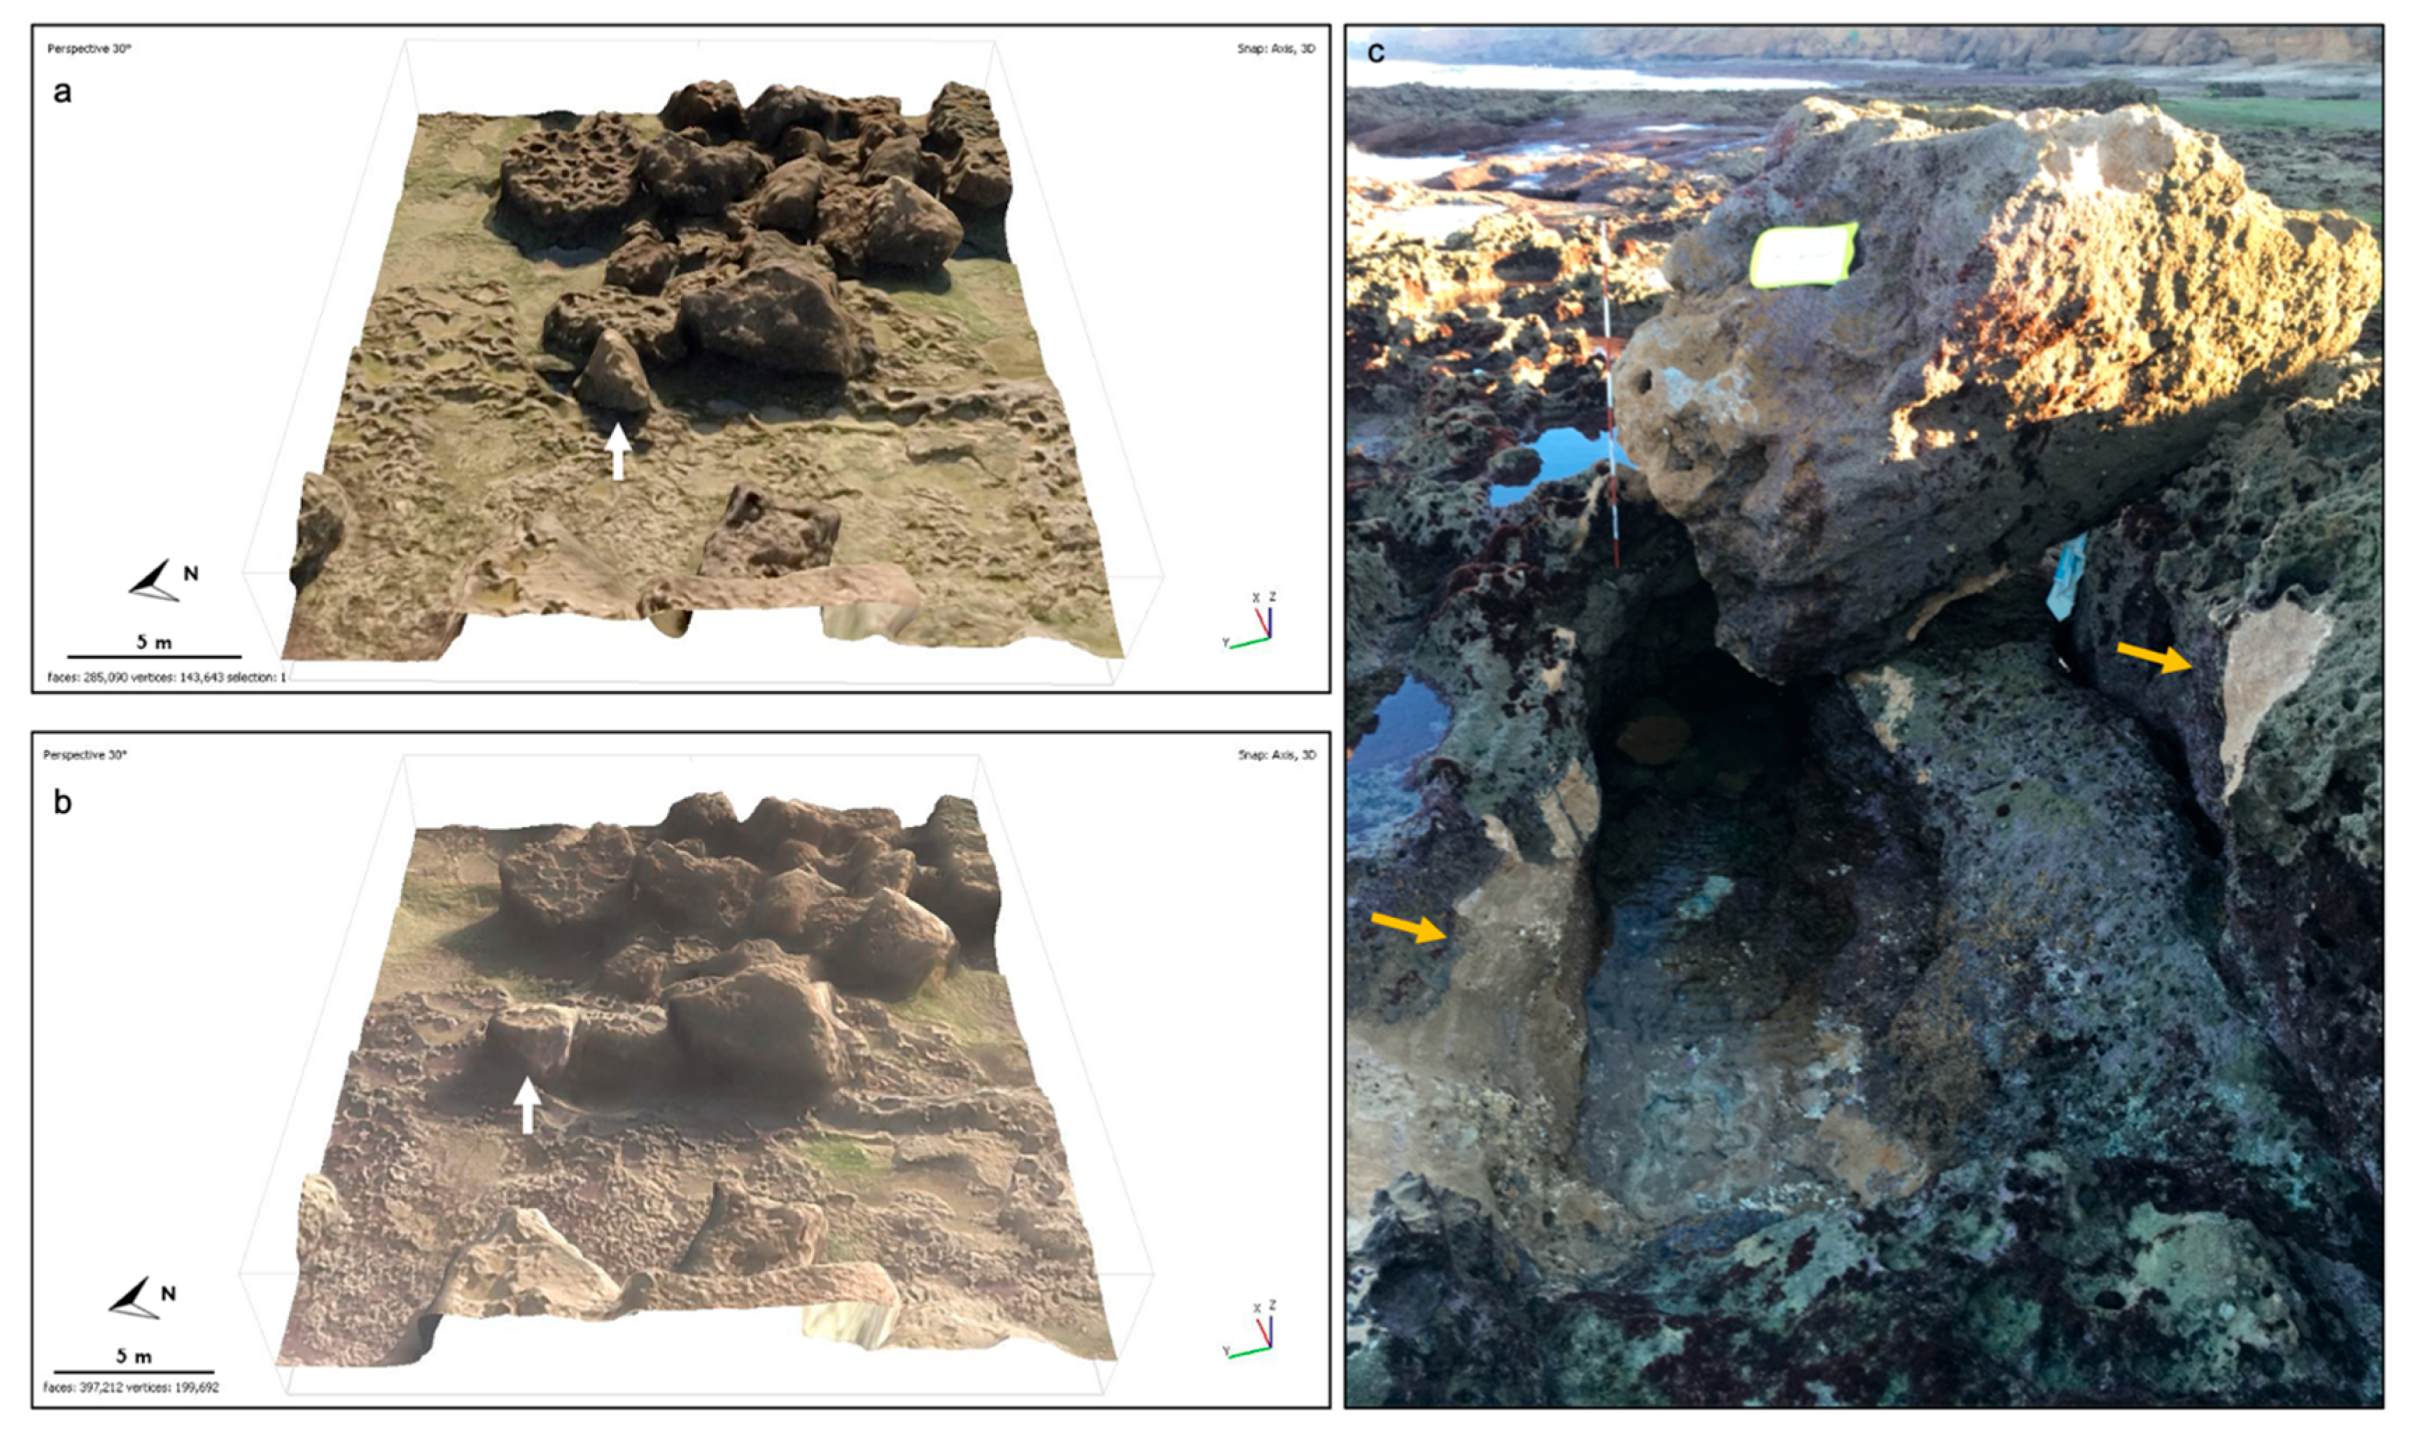
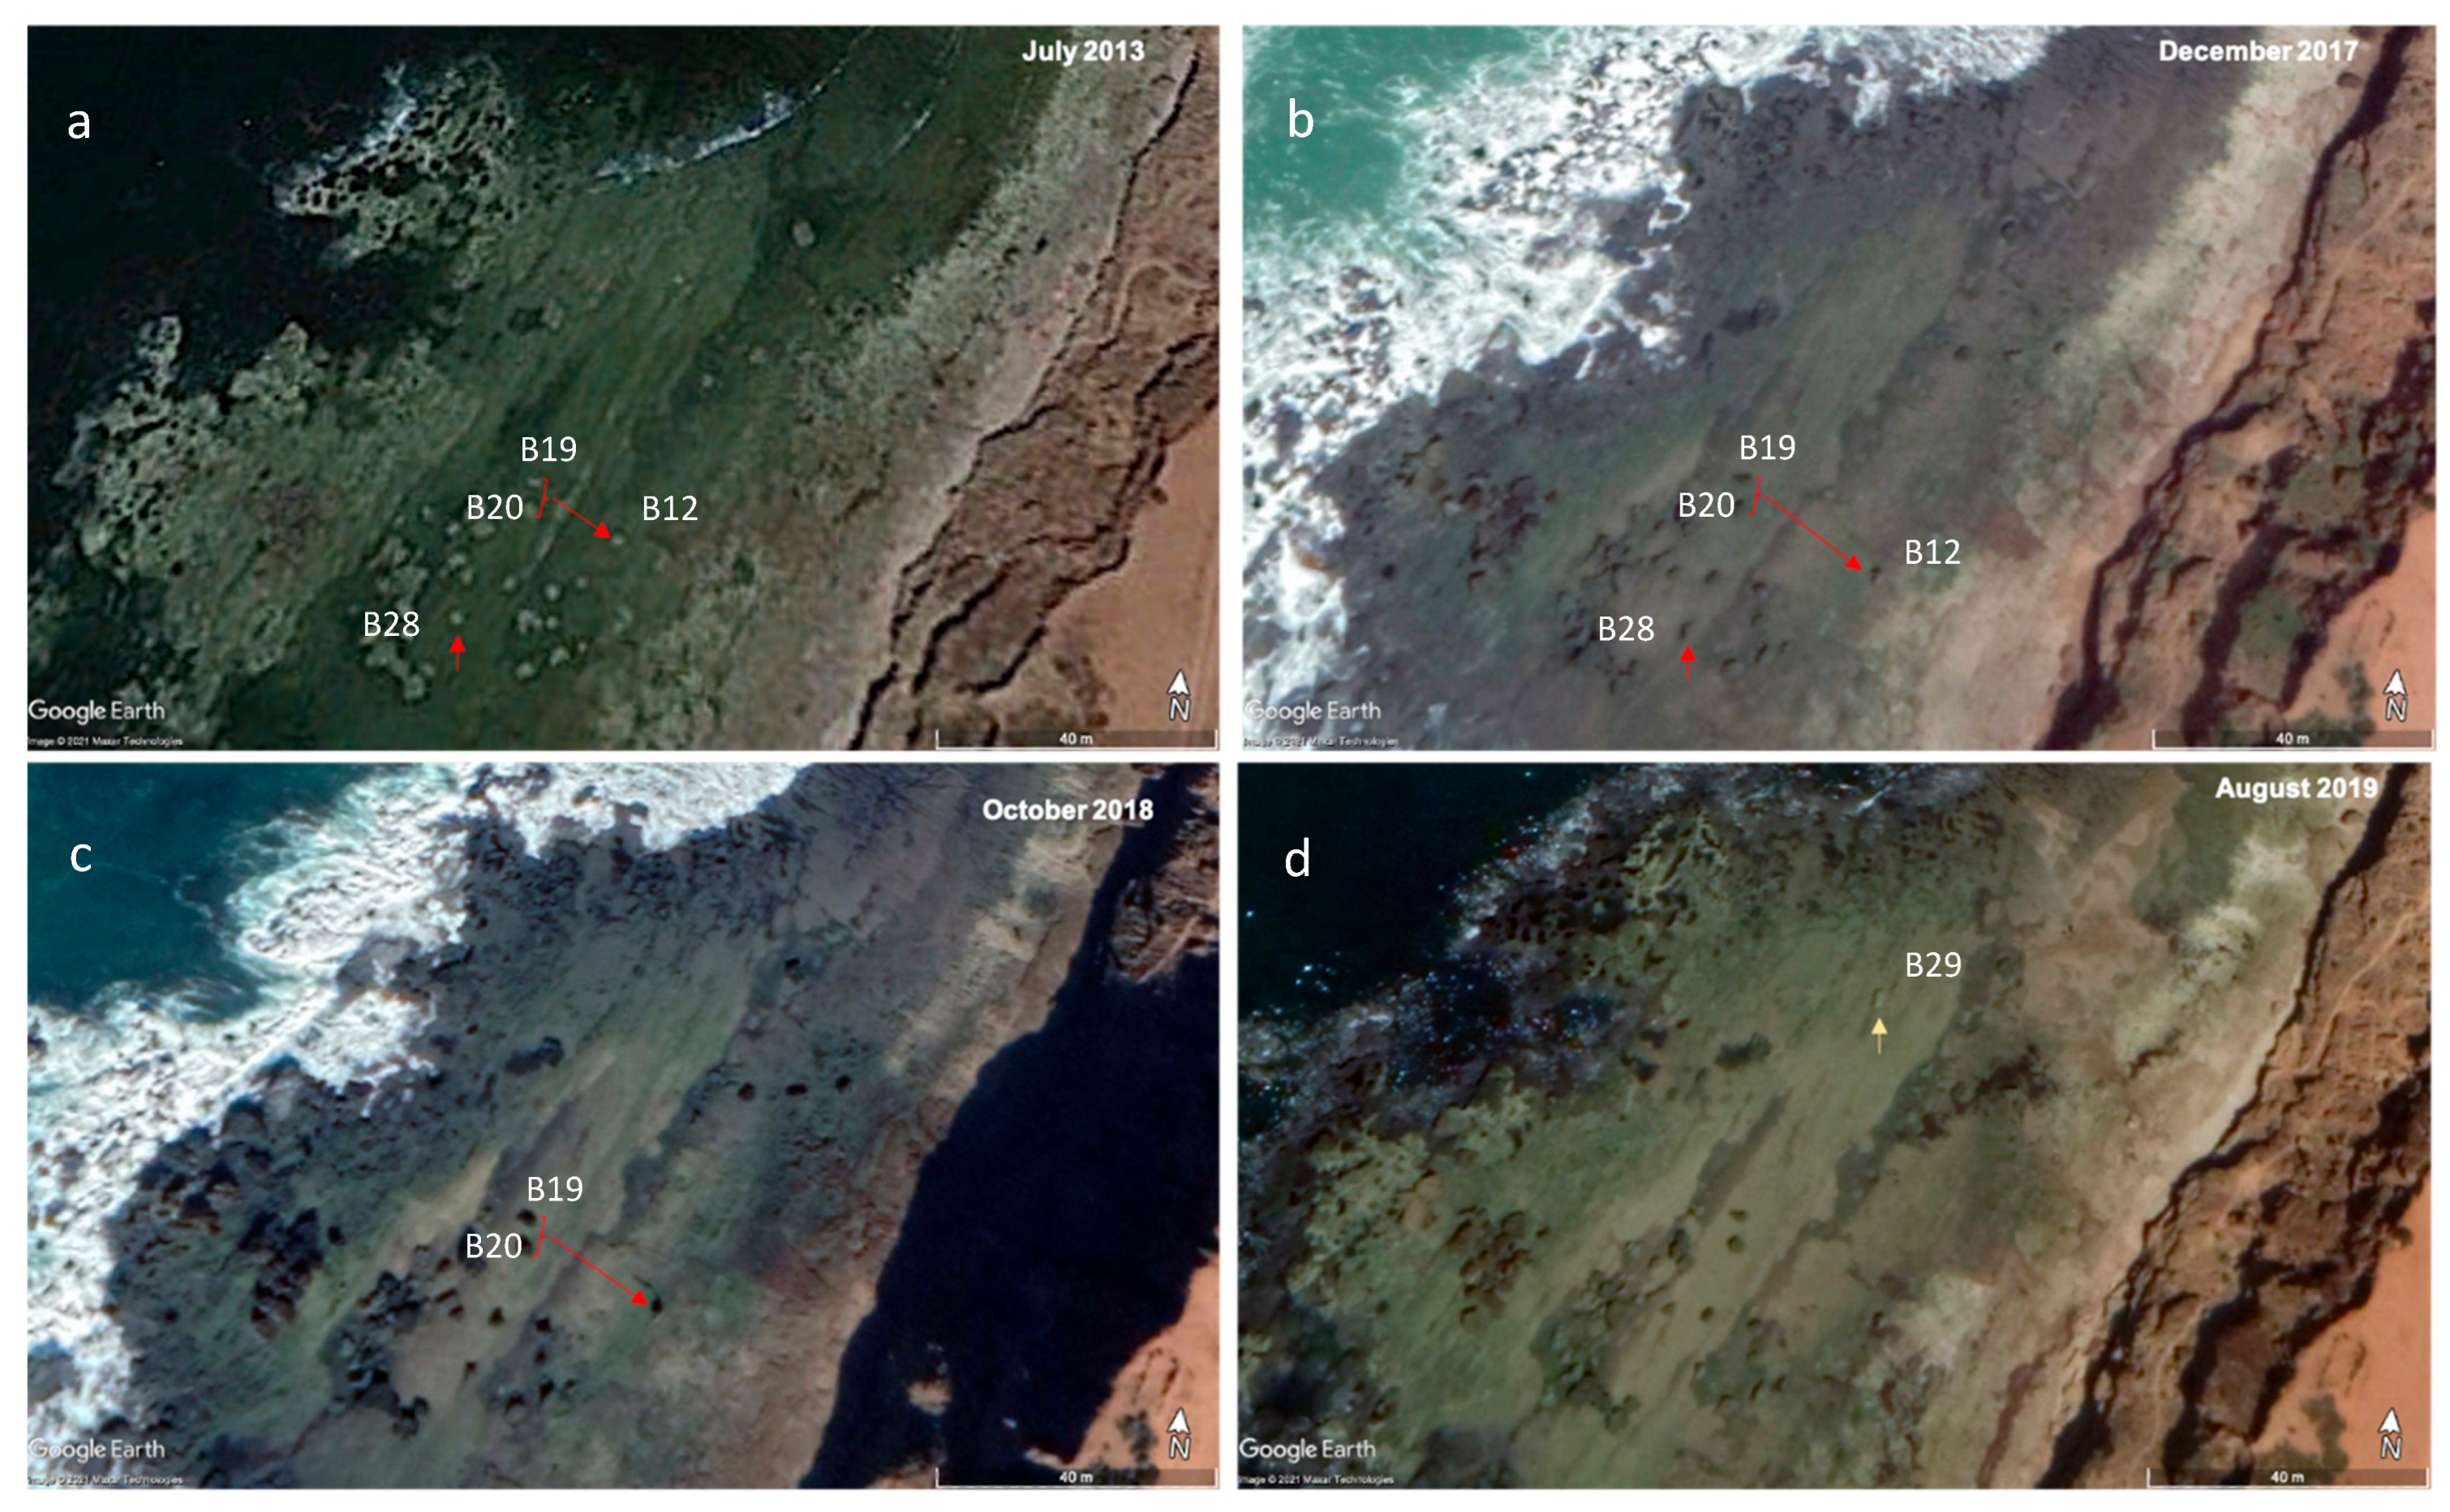
4.3. UAV Images and SFM Photogrammetry Analysis
5. Discussion
6. Conclusions
Author Contributions
Funding
Institutional Review Board Statement
Informed Consent Statement
Data Availability Statement
Acknowledgments
Conflicts of Interest
References
- Trenhaile, A.S. Rock coasts, with particular emphasis on shore platforms. Geomorphology 2002, 48, 7–22. [Google Scholar] [CrossRef]
- Blanco-Chao, R.; Pérez-Alberti, A.; Trenhaile, A.S.; Coasta-Casais, M.; Valcàrcel-Diaz, M. Shore platform abrasion in a para-periglacial environment, Galicia, northwestern Spain. Geomorphology 2007, 83, 136–151. [Google Scholar] [CrossRef]
- Hall, A.M.; Hansom, J.D.; Jarvis, J. Patterns and rates of erosion produced by high energy wave processes on hard rock headlands: The Grind of the Navir, Shetland, Scotland. Mar. Geol. 2008, 248, 28–46. [Google Scholar] [CrossRef]
- Cox, R.; Jahn, K.L.; Watkins, O.G.; Cox, P. Extraordinary boulder transport by storm waves (west of Ireland, winter 2013–2014), and criteria for analysing coastal boulder deposits. Earth-Sci. Rev. 2018, 177, 623–636. [Google Scholar] [CrossRef]
- Nott, J. Extremely high-energy wave deposits inside the Great Barrier Reef, Australia: Determining the cause—Tsunami or tropical cyclone. Mar. Geol. 1997, 141, 193–207. [Google Scholar] [CrossRef]
- Kennedy, A.B.; Mori, N.; Zhang, Y.; Yasuda, T.; Chen, S.-E.; Tajima, Y.; Pecor, W.; Toride, K. Observations and modeling of coastal boulder transport and loading during Super Typhoon Haiyan. Coast. Eng. J. 2016, 58, 1640004. [Google Scholar] [CrossRef]
- Kennedy, A.B.; Mori, N.; Yasuda, T.; Shimozono, T.; Tomiczek, T.; Donahue, A.; Shimura, T.; Imai, Y. Extreme block and boulder transport along a cliffed coastline (Calicoan Island, Philippines) during Super Typhoon Haiyan. Mar. Geol. 2017, 383, 65–77. [Google Scholar] [CrossRef]
- Hall, A.M.; Hansom, J.D.; Williams, D.M.; Jarvis, J. Distribution, geomorphology and lithofacies of cliff-top storm deposits: Examples from the high-energy coasts of Scotland and Ireland. Mar. Geol. 2006, 232, 131–155. [Google Scholar] [CrossRef]
- Williams, D.M.; Hall, A.M. Cliff-top megaclast deposits of Ireland, a record of extreme waves in the North Atlantic—Storms or tsunamis? Mar. Geol. 2004, 206, 101–117. [Google Scholar] [CrossRef]
- Miller, S.; Rowe, D.-A.; Brown, L.; Mandal, A. Wave-emplaced boulders: Implications for development of prime real estate seafront, North Coast Jamaica. Bull. Eng. Geol. Environ. 2014, 73, 109–122. [Google Scholar] [CrossRef]
- Barbano, M.S.; Pirrotta, C.; Gerardi, F. Large boulders along the south-eastern Ionian coast of Sicily: Storm or tsunami deposits? Mar. Geol. 2010, 275, 140–154. [Google Scholar] [CrossRef]
- Biolchi, S.; Furlani, S.; Antonioli, F.; Baldassini, N.; Deguara, J.C.; Devoto, S.; Stefano, A.D.; Evans, J.; Gambin, T.; Gauci, R. Boulder accumulations related to extreme wave events on the eastern coast of Malta. Nat. Hazards Earth Syst. 2016, 16, 737–756. [Google Scholar] [CrossRef]
- Mastronuzzi, G.; Sansò, P. Boulders transport by catastrophic waves along the Ionian coast of Apulia (southern Italy). Mar. Geol. 2000, 170, 93–103. [Google Scholar] [CrossRef]
- Mastronuzzi, G.; Pignatelli, C.; Sansò, P.; Selleri, G. Boulder accumulations produced by the 20th of February, 1743 tsunami along the coast of southeastern Salento (Apulia region, Italy). Mar. Geol. 2007, 242, 191–205. [Google Scholar] [CrossRef]
- Cox, R.; Zentner, D.B.; Kirchner, B.J.; Cook, M.S. Boulder ridges on the Aran Islands (Ireland): Recent movements caused by storm waves, not tsunamis. J. Geol. 2012, 120, 249–272. [Google Scholar] [CrossRef]
- Autret, R.; Dodet, G.; Fichaut, B.; Suanez, S.; David, L.; Leckler, F.; Ardhuin, F.; Ammann, J.; Grandjean, P.; Allemand, P. A comprehensive hydro-geomorphic study of cliff-top storm deposits on Banneg Island during winter 2013–2014. Mar. Geol. 2016, 382, 37–55. [Google Scholar] [CrossRef]
- Knight, J.; Burningham, H. Boulder dynamics on an Atlantic-facing rock coastline, northwest Ireland. Mar. Geol. 2011, 283, 56–65. [Google Scholar] [CrossRef]
- Hansom, J.D.; Barltrop, N.D.P.; Hall, A.M. Modelling the processes of cliff-top erosion and deposition under extreme storm waves. Mar. Geol. 2008, 253, 36–50. [Google Scholar] [CrossRef]
- Hansom, J.D.; Hall, A.M. Magnitude and frequency of extra-tropical North Atlantic cyclones: A chronology from cliff-top storm deposits. Quat. Int. 2009, 195, 42–52. [Google Scholar] [CrossRef]
- Costa, P.J.; Dawson, S.; Ramalho, R.S.; Engel, M.; Dourado, F.; Bosnic, I.; Andrade, C. A review on onshore tsunami deposits along the Atlantic coasts. Earth-Sci. Rev. 2021, 212, 103441. [Google Scholar] [CrossRef]
- Pignatelli, C.; Scheffers, A.; Scheffers, S.; Mastronuzzi, G. Assessment of extreme wave flooding from geomorphologic evidence in Bonaire (Netherlands Antilles). Z. Geomorphol. 2010, 54 (Suppl. 3), 219–245. [Google Scholar] [CrossRef]
- Suanez, S.; Fichaut, B.; Magne, R. Cliff-top storm deposits on Banneg Island, Brittany, France: Effects of giant waves in the Eastern Atlantic Ocean. Sediment. Geol. 2009, 220, 12–28. [Google Scholar] [CrossRef]
- Medina, F.; Mhammdi, N.; Chiguer, A.; Akil, M.; Jaaidi, E.B. The Rabat and Larache boulder fields; new examples of high-energy deposits related to extreme waves in north-western Morocco. Nat. Hazards. 2011, 59, 725–747. [Google Scholar] [CrossRef]
- Roig-Munar, F.X.; Rodríguez-Perea, A.; Martín-Prieto, J.A.; Gelabert, B.; Vilaplana, J.M. Tsunami Boulders on the Rocky Coasts of Ibiza and Formentera (Balearic Islands). J. Mar. Sci. Eng. 2019, 7, 327. [Google Scholar] [CrossRef]
- Hisamatsu, A.; Goto, K.; Rojas-Consuegra, R.; Acosta, E.; Rodríguez, A.; Mori, N.; Imamura, F. Potential Risk of extreme wave in Trinidad of Cuba inferred from coastal Boulders. II Simposio Sobre Riesgos de Desastres y Riesgos Climáticos. XI Convención Internacional Sobre Medio Ambiente y Desarrollo, La Habana, Cuba. 2017. Available online: https://www.researchgate.net/profile/Reinaldo-Consuegra/publication/318350648_POTENTIAL_RISK_OF_EXTREME_WAVE_IN_TRINIDAD_OF_CUBA_INFFERED_FROM_COASTAL_BOULDERS/links/59650fb1a6fdcc69f148b90d/POTENTIAL-RISK-OF-EXTREME-WAVE-IN-TRINIDAD-OF-CUBA-INFFERED-FROM-COASTAL-BOULDERS.pdf (accessed on 18 July 2022).
- Whelan, F.; Kelletat, D. Boulder deposits on the southern Spanish Atlantic coast: Possible evidence for the 1755 AD Lisbon tsunami. Sci. Tsunami Hazards 2005, 23, 25–38. [Google Scholar]
- Rojas-Consuegra, R.; Isaac-Mengana, J.; Pupo, F.M.; Peros, M.C. Coarse Detrital Deposits from Hurricane Wilma on the Western Coast of Cojimar, Havana, Cuba. In Proceedings of the International Conference on BioGeoSciences; Varadero, Cuba, 23–27 October 2017, Springer: Berlin/Heidelberg, Germany, 2017; pp. 111–125. [Google Scholar]
- Etienne, S.; Paris, R. Boulder accumulations related to storms on the south coast of the Reykjanes Peninsula (Iceland). Geomorphology 2010, 114, 55–70. [Google Scholar] [CrossRef]
- Goto, K.; Okada, K.; Imamura, F. Characteristics and hydrodynamics of boulders transported by storm waves at Kudaka Island, Japan. Mar. Geol. 2009, 262, 14–24. [Google Scholar] [CrossRef]
- Cox, R. Megagravel deposits on the west coast of Ireland show the impacts of severe storms. Weather 2020, 75, 72–77. [Google Scholar] [CrossRef]
- Cox, R. Very large boulders were moved by storm waves on the west coast of Ireland in winter 2013–2014. Mar. Geol. 2019, 412, 217–219. [Google Scholar] [CrossRef]
- Biolchi, S.; Furlani, S.; Devoto, S.; Scicchitano, G.; Korbar, T.; Vilibic, I.; Sepic, J. The origin and dynamics of coastal boulders in a semi-enclosed shallow basin: A northern Adriatic case study. Mar. Geol. 2019, 411, 62–77. [Google Scholar] [CrossRef]
- Biolchi, S.; Denamiel, C.; Devoto, S.; Korbar, T.; Macovaz, V.; Scicchitano, G.; Vilibic, I.; Furlani, S. Impact of the October 2018 storm Vaia on coastal boulders in the northern Adriatic Sea. Water 2019, 11, 2229. [Google Scholar] [CrossRef]
- Naylor, L.A.; Stephenson, W.J.; Smith, H.C.; Way, O.; Mendelssohn, J.; Cowley, A. Geomorphological control on boulder transport and coastal erosion before, during and after an extreme extra-tropical cyclone. Earth Surf. Process. Landf. 2016, 41, 685–700. [Google Scholar] [CrossRef]
- Nagle-McNaughton, T.; Cox, R. Measuring Change Using Quantitative Differencing of Repeat Structure-From-Motion Photogrammetry: The Effect of Storms on Coastal Boulder Deposits. Remote Sens. 2020, 12, 42. [Google Scholar] [CrossRef]
- Chen, B.; Chen, Z.; Stephenson, W.; Finlayson, B. Morphodynamics of a boulder beach, Putuo Island, SE China coast: The role of storms and typhoon. Mar. Geol. 2011, 283, 106–115. [Google Scholar] [CrossRef]
- Peréz-Alberti, A.; Trenhaile, A.S. An initial evaluation of drone-based monitoring of boulder beaches in Galicia, north-western Spain. Earth Surf. Process. Landf. 2015, 40, 105–111. [Google Scholar] [CrossRef]
- Noormets, R.; Crook, K.W.; Felton, E.A. Sedimentology of rocky shorelines: 3. Hydrodynamics of megaclast emplacement and transport on a shore platform, Oahu, Hawaii. Sediment. Geol. 2004, 172, 41–65. [Google Scholar] [CrossRef]
- Imamura, F.; Goto, K.; Ohkubo, S. A numerical model for the transport of a boulder by tsunami. J. Geophys. Res. Oceans. 2008, 113, C01008. [Google Scholar] [CrossRef]
- Brunier, G.; Fleury, J.; Anthony, E.J.; Gardel, A.; Dussouillez, P. Close-range airborne Structure-from-Motion Photogrammetry for high-resolution beach morphometric surveys: Examples from an embayed rotating beach. Geomorphology 2016, 261, 76–88. [Google Scholar] [CrossRef]
- Casella, E.; Rovere, A.; Pedroncini, A.; Stark, C.P.; Casella, M.; Ferrari, M.; Firpo, M. Drones as tools for monitoring beach topography changes in the Ligurian Sea (NW Mediterranean). Geo-Mar. Lett. 2016, 36, 151–163. [Google Scholar] [CrossRef]
- Marteau, B.; Vericat, D.; Gibbins, C.; Batalla, R.J.; Green, D.R. Application of Structure-from-Motion photogrammetry to river restoration. Earth Surf. Process. Landf. 2017, 42, 503–515. [Google Scholar] [CrossRef]
- Woodget, A.S.; Austrums, R.; Maddock, I.P.; Habit, E. Drones and digital photogrammetry: From classifications to continuums for monitoring river habitat and hydromorphology. Wiley Interdiscip. Rev. Water 2017, 4, e1222. [Google Scholar] [CrossRef]
- Tamminga, A.D.; Eaton, B.C.; Hugenholtz, C.H. UAS-based remote sensing of fluvial change following an extreme flood event. Earth Surf. Process. Landf. 2015, 40, 1464–1476. [Google Scholar] [CrossRef]
- Cabanás, R. Notas Para el Conocimiento de la Geografía Física y Urbana de Alcazarquivir. Consejo Superior de Insvestigaciones Científicas; Instituto de Estudios Africanos: Madrid, Spain, 1951. [Google Scholar]
- Fillali, L.; Garzon, G.; Arribas, J. Petrografía de los depósitos arenosos fluviales y costeros en la península de Tanger: Implicaciones sobre la dinámica fluvial y litoral. Rev. De La Soc. Geológica De España. 2005, 18, 207–211. [Google Scholar]
- Adil, S. Les Formations Quaternaires de Larache: Sédimentologie, Paléoenvironnement, Datation Radiochimique et Problème D’aménagement. 3rd. Cycle Thesis, Université Mohammed V Faculté des Sciences, Rabat, Morocco, 1996. [Google Scholar]
- El Gharbaoui, A. La Terre et l’homme Dans la péninsule Tingitaine; étude sur l’homme et le Milieu Naturel Dans le Rif Occidental; Institut Scientifique: Rabat, Morocco, 1981. [Google Scholar]
- Bouhmadi, B.; Benavente, J.; Cruz-Sanjulián, J. Geometría, piezometría y parámetros hidráulicos de los acuíferosde la cuenca baja del río Loukkos (Marruecos). Geogaceta 1994, 16, 11–14. [Google Scholar]
- Bouhmadi, B.; Benavente, J.; Cruz-Sanjulián, J.; Sanromá, A. Caracterización hidrodinámica e hidroquímica de los acuíferos de la Cuenca Baja del río Loukkos (Marruecos). Bol. Geoologico. Y Min. 1995, 106, 161–177. [Google Scholar]
- El Moutchou, B.; Benali, H.; Mamouni, A. Evolution diachronique de la ligne du rivage le long des littoraux méditerranéens occidentaux marocains: Cas des sites côtiers de Ksar Esghir. Bou Ahmed et Jebha (Maroc). J. Natl. Génie Côtier-Génie Civil 2014, 317–324. [Google Scholar] [CrossRef]
- El Mekadem, N.; El Moutchou, B. Study of the structural continuity from hinterlands to continental shelf in Larache area (NW Morocco): Morphostructural approach. J. Mater. Environ. Sci. 2016, 7, 2114–2120. [Google Scholar]
- Taaouati, M.; Nachite, D.; Benavente, J.; Elmrini, A. Seasonal Changes and Morphodynamic Behavior of a High-Energy Mesotidal Beach: Case Study of Charf el Akab Beach on the North Atlantic Coast of Morocco. Environ. Earth Sci. 2011, 64, 1225–1236. [Google Scholar] [CrossRef]
- Jaaidi, E.B.; Cirac, P. La Couverture Sédimentaire Meuble du Plateau Continental Atlantique Marocain Entre Larache et Agadir. Bull Inst Géol Bassin D’aquitaine Bordx. 1987, 42, 3–51. [Google Scholar]
- Agisoft Metashape User Manual: Professional Edition. 2019. Available online: https://www.agisoft.com/pdf/metashape-pro_1_5_en.pdf (accessed on 1 October 2019).
- Grenzdörffer, G.J.; Engel, A.; Teichert, B. The photogrammetric potential of low-cost UAVs in forestry and agriculture. Int. Arch. Photogramm. Remote Sens. Spat. Inf. Sci. 2008, 31, 1207–1214. [Google Scholar]
- Henry, J.; Malet, J.; Maquaire, O.; Grussenmeyer, P. The use of small-format and low-altitude aerial photos for the realization of high-resolution DEMs in mountainous areas: Application to the Super-Sauze earthflow (Alpes-de-Haute-Provence, France). Earth Surf. Process. Landf. J. Br. Geomorphol. Res. Gr. 2002, 27, 1339–1350. [Google Scholar] [CrossRef]
- Torres-Sánchez, J.; López-Granados, F.; Borra-Serrano, I.; Peña, J.M. Assessing UAV-collected image overlap influence on computation time and digital surface model accuracy in olive orchards. Precis. Agric. 2018, 19, 115–133. [Google Scholar] [CrossRef]
- Mesas-Carrascosa, F.-J.; Notario García, M.; Meroño de Larriva, J.; García-Ferrer, A. An analysis of the influence of flight parameters in the generation of unmanned aerial vehicle (UAV) orthomosaicks to survey archaeological areas. Sensors 2016, 16, 1838. [Google Scholar] [CrossRef] [PubMed]
- Rangel-Buitrago, N.; Anfuso, G. Winter wave climate, storms and regional cycles: The SW Spanish Atlantic coast. Int. J. Climatol. 2013, 33, 2142–2156. [Google Scholar] [CrossRef]
- Oliveira, T.C.A.; Graça Neves, M.; Fidalgo, R.; Esteves, R. Variability of wave parameters and Hmax/Hs relationship under storm conditions offshore the Portuguese continental coast. Ocean. Eng. 2018, 153, 10–22. [Google Scholar] [CrossRef]
- Mhammdi, N.; Medina, F.; Belkhayat, Z.; El Aoula, R.; Geawahri, M.A.; Chiguer, A. Marine storms along the Moroccan Atlantic coast: An underrated natural hazard? J. Afr. Earth Sci. 2020, 163, 103730. [Google Scholar] [CrossRef]
- Boesl, F.; Engel, M.; Eco, R.C.; Galang, J.B.; Gonzalo, L.A.; Llanes, F.; Quix, E.; Brückner, H. Digital mapping of coastal boulders—High-resolution data acquisition to infer past and recent transport dynamics. Sedimentology 2019, 67, 1393–1410. [Google Scholar] [CrossRef]
- Nott, J. Tsunami or storm waves? determining the origin of a spectacular field of wave emplaced boulders using numerical storm surge and wave models and hydrodynamic transport equations. J. Coast. Res. 2003, 19, 348–356. [Google Scholar]
- Pignatelli, C.; Sansò, P.; Mastronuzzi, G. Evaluation of tsunami flooding using geomorphologic evidence. Mar. Geol. 2009, 260, 6–18. [Google Scholar] [CrossRef]
- Nandasena, N.A.K.; Paris, R.; Tanaka, N. Reassessment of hydrodynamic equations: Minimum flow velocity to initiate boulder transport by high energy events (storms, tsunamis). Mar. Geol. 2011, 281, 70–84. [Google Scholar] [CrossRef]
- Kennedy, A.B.; Cox, R.; Dias, F. Storm waves may be the source of some “tsunami” coastal boulder deposits. Geophys. Res. Lett. 2021, 48, e2020GL090775. [Google Scholar] [CrossRef] [PubMed]
- Flor-Blanco, G.; Alcántara-Carrió, J.; Jackson, D.W.T.; Flor, G.; Flores-Soriano, C. Coastal erosion in NW Spain: Recent patterns under extreme storm wave events. Geomorphology 2021, 387, 107767. [Google Scholar] [CrossRef]
- Ruban, D.A. Finding Coastal Megaclast Deposits: A Virtual Perspective. J. Mar. Sci. Eng. 2020, 8, 164. [Google Scholar] [CrossRef]
- Shah Hosseini, M.; Morhange, C.; De Marco, A.; Wante, J.; Anthony, E.J.; Sabatier, F.; Mastronuzzi, G.; Pignatelli, C.; Piscitelli, A. Coastal boulders in Mar-tigues, French Mediterranean: Evidence for extreme storm waves during the Little Ice Age. Z. Geomorphol. 2013, 57 (Suppl. 4), 181–199. [Google Scholar] [CrossRef]
- Causon Deguara, J.; Gauci, R. Evidence of extreme wave events from boulder deposits on the south-east coast of Malta (Central Mediterranean). Nat. Hazards 2017, 86, 543–568. [Google Scholar] [CrossRef]
- Nandasena, N.A.K.; Tanaka, N.; Sasaki, Y.; Osada, M. Boulder transport by the 2011 great East Japan tsunami: Comprehensive field observations and whither model predictions? Mar. Geol. 2013, 346, 292–309. [Google Scholar] [CrossRef]
- Kasmi, S.; Snoussi, M.; Khalfaoui, O.; Aitali, R.; Flayou, L. Increasing pressures, eroding beaches and climate change in Morocco. J. Afr. Earth Sci. 2021, 164, 103796. [Google Scholar] [CrossRef]


| 1980–2020 | Wave Period (s) | Total | |||||||||||
|---|---|---|---|---|---|---|---|---|---|---|---|---|---|
| 10> | 10 | 9 | 8 | 7 | 6 | 5 | 4 | 3 | 2 | <=1 | |||
| Significant wave height (m) | 10> | - | - | - | - | - | - | - | - | - | - | - | - |
| 10 | - | - | - | - | - | - | - | - | - | - | - | - | |
| 9 | - | - | - | - | - | - | - | - | - | - | - | - | |
| 8 | - | - | - | - | - | - | - | - | - | - | - | - | |
| 7 | - | - | - | - | - | - | - | - | - | - | - | - | |
| 6 | 0.030 | - | - | - | - | - | - | - | - | - | - | 0.030 | |
| 5 | 0.185 | 0.005 | - | - | - | - | - | - | - | - | - | 0.191 | |
| 4 | 0.936 | 0.112 | - | - | - | - | - | - | - | - | - | 1.090 | |
| 3 | 5.162 | 0.439 | - | - | - | - | - | - | - | - | - | 6.382 | |
| 2 | 27.872 | 2.197 | - | - | - | - | - | - | - | - | - | 36.211 | |
| <=1 | 22.809 | 7.393 | - | - | - | - | - | - | - | - | - | 56.096 | |
| Total | 56.994 | 10.146 | 9.369 | 7.129 | 6.766 | 5.418 | 3.243 | 0.895 | 0.041 | - | - | 100% | |
| Drone Model | DJI MAVIC PRO PLATINUM |
|---|---|
| Camera model | 1/2.3″ (CMOS) |
| Sensor focal length | 26 mm (35 mm format equivalent) |
| Field of view | 78.8° |
| Resolution (megapixels) | 12.35 |
| Flight altitude | 70 m |
| Number of orthogonal photos | 1017 |
| Number of oblique photos | 94 |
| Number of GCPs | 22 |
| Boulder Number | A Axis (m) | B Axis (m) | C Axis (m) | Volume (m3) | Mass (t) |
|---|---|---|---|---|---|
| B1 | 2.95 | 2.85 | 0.78 | 6.56 | 14.43 |
| B2 | 3.74 | 3.41 | 1.02 | 13.01 | 28.62 |
| B3 | 3.36 | 2.5 | 1.03 | 8.65 | 19.03 |
| B4 | 4.84 | 3.52 | 1.11 | 18.91 | 41.60 |
| B4/5 | 3.1 | 1.97 | 0.52 | 3.18 | 6.99 |
| B5 | 5.45 | 3.39 | 1.05 | 19.40 | 42.68 |
| B6 | 3.22 | 3.02 | 1.31 | 12.74 | 28.03 |
| B7 | 3.06 | 2.72 | 0.82 | 6.83 | 15.02 |
| B8 | 5.46 | 2.74 | 1.82 | 27.23 | 59.90 |
| B9 | 4.62 | 2.54 | 1.71 | 20.07 | 44.15 |
| B10 | 5.34 | 2.92 | 0.93 | 14.50 | 31.90 |
| B11 | 6.27 | 5.53 | 1.56 | 54.09 | 119.00 |
| B12 | 2.2 | 2.01 | 1.52 | 6.72 | 14.79 |
| B13 | 5.12 | 4.03 | 0.76 | 15.68 | 34.50 |
| B17 | 3.42 | 2.21 | 0.56 | 4.23 | 9.31 |
| B18 | 3.15 | 2.59 | 1.05 | 8.57 | 18.85 |
| B19 | 3.08 | 1.84 | 1.06 | 6.01 | 13.22 |
| B20 | 2.52 | 2.43 | 1.08 | 6.61 | 14.55 |
| B21 | 2.21 | 1.68 | 1.07 | 3.97 | 8.74 |
| B22 | 1.79 | 1.54 | 0.49 | 1.35 | 2.97 |
| B23 | 2.98 | 1.95 | 0.54 | 3.14 | 6.90 |
| B24 | 2.99 | 2.03 | 0.86 | 5.22 | 11.48 |
| B25 | 1.92 | 1.77 | 0.78 | 2.65 | 5.83 |
| B26 | 2.15 | 2.13 | 1.24 | 5.68 | 12.49 |
| B27 | 1.45 | 1.01 | 0.62 | 0.91 | 2.00 |
| B28 | 2.14 | 1.57 | 0.84 | 2.82 | 6.21 |
| B29 | 3.72 | 2.33 | 0.39 | 3.38 | 7.44 |
| B30 | 2.43 | 2.24 | 1.82 | 9.91 | 21.79 |
Publisher’s Note: MDPI stays neutral with regard to jurisdictional claims in published maps and institutional affiliations. |
© 2022 by the authors. Licensee MDPI, Basel, Switzerland. This article is an open access article distributed under the terms and conditions of the Creative Commons Attribution (CC BY) license (https://creativecommons.org/licenses/by/4.0/).
Share and Cite
Sedrati, M.; Morales, J.A.; El M’rini, A.; Anthony, E.J.; Bulot, G.; Le Gall, R.; Tadibaght, A. Using UAV and Structure-From-Motion Photogrammetry for the Detection of Boulder Movement by Storms on a Rocky Shore Platform in Laghdira, Northwest Morocco. Remote Sens. 2022, 14, 4102. https://doi.org/10.3390/rs14164102
Sedrati M, Morales JA, El M’rini A, Anthony EJ, Bulot G, Le Gall R, Tadibaght A. Using UAV and Structure-From-Motion Photogrammetry for the Detection of Boulder Movement by Storms on a Rocky Shore Platform in Laghdira, Northwest Morocco. Remote Sensing. 2022; 14(16):4102. https://doi.org/10.3390/rs14164102
Chicago/Turabian StyleSedrati, Mouncef, Juan A. Morales, Abdelmounim El M’rini, Edward J. Anthony, Glen Bulot, Romain Le Gall, and Abdelkarim Tadibaght. 2022. "Using UAV and Structure-From-Motion Photogrammetry for the Detection of Boulder Movement by Storms on a Rocky Shore Platform in Laghdira, Northwest Morocco" Remote Sensing 14, no. 16: 4102. https://doi.org/10.3390/rs14164102
APA StyleSedrati, M., Morales, J. A., El M’rini, A., Anthony, E. J., Bulot, G., Le Gall, R., & Tadibaght, A. (2022). Using UAV and Structure-From-Motion Photogrammetry for the Detection of Boulder Movement by Storms on a Rocky Shore Platform in Laghdira, Northwest Morocco. Remote Sensing, 14(16), 4102. https://doi.org/10.3390/rs14164102