Article

Effects of Charged Martian Dust on Martian Atmosphere Remote Sensing

1
Key Laboratory of Mechanics on Disaster and Environments in Western China, Attached to Ministry of Education, Lanzhou University, Lanzhou 730000, China
2
College of Civil Engineering and Mechanics, Lanzhou University, Lanzhou 730000, China
*
Author to whom correspondence should be addressed.
Remote Sens. 2022, 14(9), 2072; https://doi.org/10.3390/rs14092072
Submission received: 18 February 2022 / Revised: 31 March 2022 / Accepted: 2 April 2022 / Published: 26 April 2022
(This article belongs to the Special Issue Mars Remote Sensing)

Abstract

:
In this paper, the extinction property and optical depth of charged Martian dust at infrared band 3 THz–300 THz are studied using the Mie scattering theory. It is found that the extinction coefficients of Martian atmospheric dust and the dust optical depth (DOD) of the Martian atmosphere can be amplified significantly as the dust particles are charged. This extinction amplification has a peak, called amplification resonance, which shifts toward the upper left of the r-q parameter plane with increasing frequency. Here, r denotes the particle radius and q denotes the particle’s total net charge. The amplification of the Martian DOD is more significant at high altitudes than at low altitudes because the particles at high altitudes are smaller. For example, at an altitude of 30–50 km, the dust optical depth at 30 THz can be increased by 60–200%. However, at 3 THz–10 THz, the DOD at the near surface altitude (0–10 km) can still be enhanced by ~80%. This implies that by treating the Martian dust as uncharged particles, the dust density constructed from the Martian DOD data might be overestimated. The estimation error of the dust density of the Martin atmosphere may be reduced by counting the enhancement of the DOD that is caused by charged dust.

1. Introduction

The Martian dust optical depth (DOD) is key data used in Mars climate simulations [1]. Many exploration missions have been launched to establish Mars global DOD data using the infrared channels onboard the Mars orbiter, such as the Thermal Emission Spectrometer (TES) of the Mars Odyssey Mission [2], the Emirates Mars Infrared Spectrometer (EMIRS) of the Emirates Mars Mission (EMM) [3], and the Mars Climate Sounder (MCS) [4]. From the DOD data, the vertical dust profiles of Martian atmosphere can be constructed [5,6] and fed into Mars climate models to predict the weather conditions on Mars, including temperature, wind speed, and dust density distribution [1]. These predictions are useful for future Mars missions (e.g., future long-term human missions to the surface of Mars). The dust density can also have impact on the opacity of the Martian atmosphere, which is important for the power management (e.g., the battery and solar panel management) of Mars landers and rovers [1,7,8,9,10].
The dust optical depth is related to the extinction properties of dust particles; therefore, the extinction property of Martian dust particles at a visible band (e.g., 488 nm and 647 nm [11]) and an infrared band (e.g., 5–50 μm [12,13]) has been studied. To the best of our knowledge, most current studies on the extinction and optical depth of the particles treat the Martian dust as neutral particles (e.g., the work of refs. [14,15]). However, similarly to dust particles on Earth [16,17], dust particles in the Martian atmosphere can also be charged for many reasons, such as ultraviolet radiation from the Sun, or the collisions or friction between particles [18,19,20]. It is thought that the breakdown surface potential is about 20–25 kV for a particle in the Martian atmosphere [21]. For this order of breakdown potential, the total net charge of a micro-sized dust particle can reach the order of 106e [21,22,23], where e denotes the elementary charge, namely, e = 1.602 × 10⁻¹⁹ (unit in C, Coulomb). An experimental study on Mars analogue dust showed that the total net charge of a particle of radius 1.0 μm could reach 2 × 10⁵e [24]. On the other hand, it has been found that the optical property of a charged particle, such as the extinction, absorption, and scattering of cross sections, can be changed [25,26,27]; therefore, the Mars DOD can also be changed if the dust particles are charged. That means the construction of dust density from the Mars DOD data (e.g., the TES data) might result in errors if one treats the atmospheric dust as neutral particles. In fact, this overestimation of dust density was already encountered. A model simulation of the Martian atmospheric dust distribution was performed using the vertical dust profile constructed from the TES DOD data [1]; it was found that the model prediction of dust density at altitudes above 15 km were overestimated, as compared with the vertical dust density distribution observed by NASA’s Mars rover Phoenix. The Martian DOD data are often retrieved from infrared channels. For example, the TES, EMIRS, and MCS channels’ wavelengths are 5 μm–150 μm, 6–40μm, and ~22 μm, respectively.
In this paper, the extinction coefficient and the dust optical depth of charged Martian dust at different altitudes are studied theoretically for the infrared band 3 THz–300 THz, which covers the channels of TES, EMIRS, and MCS. The extinction coefficient of the charged Martian dust particle is calculated using the Mie scattering theory, where two different models of charged particles (the surface conductivity model and the Core-shell model [25,28]) are employed for the description of charged Martian dust. The calculated results indicate that the extinction of Martian dust particles and the Martian DOD can be amplified as the dust particles are charged, especially at high altitudes (e.g., above 20 km). The amplification of extinction and the DOD, as well as their dependence on altitude and frequency, are discussed. A preliminary attempt is made to correct the overestimated Martian dust profile, by counting in the enhancement of the DOD caused by charged Martian dust particles.

2. Model Description

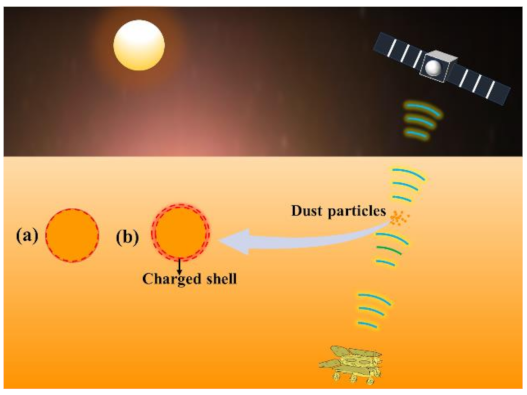
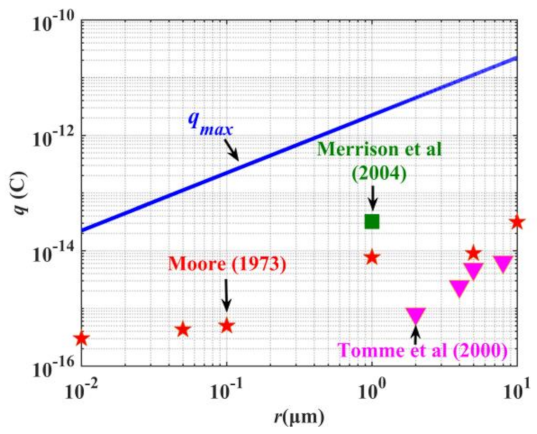
2.1. Charged Martian Dust Particles

The wind on Mars can attain a velocity as high as 30 m/s [20]. As a result, the Martian surface is covered by regolith [20], and a huge amount of fine dust can be lifted from the surface and lofted to high altitudes within the Martian atmosphere. The low atmospheric pressure (about 5–10 mbar) and low humidity on Mars could make it easier for the dust to be charged due to rubbing or collisions [21]. The Martian dust can also get charged from exposure to cosmic radiations (e.g., ultraviolet (UV) rays [20]), as shown in Figure 1.
According to the theory of electrostatics, the surface potential VS on a spherical particle’s surface is given by Equation (1),
V S = q 4 π r ε 0
where q (unit in Coulomb, [C]) denotes the total net charge of the charged particle, r, the particle radius, and ε 0 , the vacuum permittivity. The total charge q of the particle is limited by the breakdown potential ( V b r e a k d o w n ) of the particle. Some studies have pointed out that the breakdown potential V b r e a k d o w n is about 20 kV [21,30]. Thus, the saturation charge of the charged particle is q m a x = 4 π ε 0 V b r e a k d o w n , which is compared with the reported experimental results from refs. [22,24,31], as shown in Figure 2. Here, one can find that the experimental results are mostly lower than the saturation charge qmax predicted by (1).
A study on the shapes of dust particles conducted by Ilan Koren et al. [32] showed that most aerosol particles were spherical. On the other hand, using the Lorenz–Mie theory and the T-matrix method, Yang et al. (2007) compared the optical properties of spherical and spheroidal dust particles. It was found that the effect of non-spherical shapes was large at visible wavelengths, but essentially negligible at infrared wavelengths [33]; therefore, the Martian atmospheric dust particles are assumed to be spherical in this paper.
It is well known that net charges of a solid are bound to a very small region in the vicinity of the solid surface, which can be treated as a charged shell of the solid. The thickness of the charged shell, denoted as ts, is usually several nanometers (e.g., 1–3 nanometers) [34]. To study the extinction properties of charged Martian dust particles, there are two available theoretical models.

2.2. Surface Conductivity Model

The thickness of the charged shell is several orders of magnitude less than the particle radius, as shown by case (a) in Figure 1; therefore, when the particle is illuminated by a plane electromagnetic wave (EMW), it can be assumed that the net charges generate a surface current on the particle surface, the thickness of which is regarded as zero. This is the well-known Mie scattering theory for charged spheres in refs. [25,28] by Bohren and Huffman, which uses a phenomenological parameter, surface conductivity σs, to describe the contribution of net charges to the extinction coefficient. This theory is widely used in many studies (e.g., the scattering of charged interstellar dust particles) [26]. Here, we call it the surface conductivity model in the rest of this paper.
The surface conductivity σs can be calculated using σ s = i e 2 n s / m e ( ω + i γ ) , which is a model that is widely used for research purposes [25]. Here, it is assumed the net charge carriers are electrons. me stands for the mass of electron (me = 9.109 × 10⁻³¹ kg), e is the elementary charge (i.e., 1.602 × 10⁻¹⁹ C), and γ is a constant defined as γ = γ c k B T / , where γ c is a material-dependent constant [35], kB = 1.38 × 10⁻²³ JK−1 is Boltzmann’s constant, = 1.046 × 1 0 34 Js is Planck’s constant (divided by the factor 2π), and T stands for the ambient temperature (in K).
Let n s denote the number density (in 1/m2) of net charge carriers on the particle’s surface; therefore, n s = q / 4 π r 2 e , where q denotes the total net charge of the charged particle. The refractive index of the particle’s material is m = ε r , where εr denotes the dielectric constant of the particle’s material. As the particle is charged, an equivalent dielectric function of the charged particle can be obtained, which is ε s = ε r + i 2 σ s / r ε 0 ω [25], where r denotes the particle radius and ε0 denotes the vacuum permittivity. For a charged particle, an excitation frequency, ωs, can be defined as ω s = ω p / ε r e a l + 2 for γ << ω (see ref. [36]), where ωp is the surface plasma frequency [25], defined by ω p = n s e 2 / m e ε 0 and εreal is the real part of the dielectric constant, the εr of the particle. Here, ω is the circular frequency of the incident electromagnetic wave (namely, ω = 2πf), in which f stands for the frequency (in Hz) of the incident wave.

2.3. Core-Shell Model

To calculate the scattering of a particle that consisted of two different materials, Bohren and Huffman [28] also proposed a model of two concentric spheres, a large hollow sphere enclosing a small solid sphere, shown using case (b) in Figure 1. This model can also be employed to calculate the scattering of charged Martian atmospheric dust particles, by treating the hollow outer sphere as the charged region, and the inner sphere as the one free of net charge. Moreover, it is assumed that the particle has a charged shell with a finite thickness. We call it Core-shell model in this paper.
The refractive index of the core, free of net charges, is m 1 = ε r . The dielectric constant of the outer sphere, denoted as ε 2 , can be calculated by ε 2 = ε r + i σ c o n d ω ε 0 . Here, σ c o n d is the electric conductivity of the charged shell, which can be calculated by σ c o n d = i e 2 n c o n d m e ( ω + i γ ) [37]. Here, ncond denotes the number density (in 1/m3) of net charges in the outer sphere, which can be calculated by n c o n d = 3 q / 4 π ( r 3 t s 3 ) e . The permittivity of the charged shell can be reorganized as ε 2 = ε r ω p 2 / ( ω 2 + i ω γ ) , where ωp is the plasma frequency associated with the collective oscillation of the net charges, defined by ω p = n c o n d e 2 / ( m e ε 0 ) . According to the Drude model of dielectric function, the excitation frequency of the net charges, denoted as ωc, can be expressed as ω c = ω c / Re ( ε 2 ) + ε r e a l [38].
For the Core-shell model of the charged particle, an equivalent dielectric function, denoted as εcs, can also be defined, which is
ε c s = v c v c + v s ε r + v s v c + v s ε 2 ,
in which vc and vs stand for the volume of the core and the charged shell, respectively.
By employing the two models, the scattering problem of a charged spherical particle can be solved using Mie’s scattering theory, and the extinction coefficient of a charged sphere, denoted as Qext, can be expressed as the following form,
Q e x t = 2 x 2 n = 1 ( 2 n + 1 ) Re ( a n + b n )
where an and bn are Mie scattering coefficients. One can find the expressions of Mie scattering coefficients an and bn for both uncharged and charged spheres in ref. [28] by Bohren and Huffman. Let and denote the extinction coefficients of the charged and the uncharged particle, respectively. Thus, Q e x t c / Q e x t 0 is called the extinction amplification factor of a charged particle.

3. Results and Discussions

The commonly reported sizes of dust particles in Martian atmosphere are in the range (0.01 μm, 10 μm) [6,23,38,39]. Under low and moderate dust loading conditions, which were observed by Viking, MPF, MGS/TES, MER/Mini-TES, and MER/Pancam, the effective particle radius lies in the range of 1.4–1.7 µm [8]. Under high dust loading conditions (e.g., the 2001 global storm), the observed effective dust particle radius is 1.8–2.5 µm [8]. For more diffuse conditions, the effective particle radius decreases from ~1.4–1.8 µm at the near-surface (<10 km), to ~1.0µm at an altitude near 20 km, to 0.85 μm at an altitude of 20 km–30 km, and to ~0.5 µm at an altitude of 30 km–40 km, and it becomes less than 0.3 µm at an altitude above 40 km [8,40,41,42,43,44]. The infrared band is frequently used for Mars exploration missions, such as the Thermal Emission Spectrometer (TES, 5~150 μm) of the Mars Odyssey Mission [2], the Emirates Mars Infrared Spectrometer (EMIRS, 6–40μm) of the Emirates Mars Mission (EMM), and Mars Climate Sounder (MCS, ~22 μm). In the following sections, the extinction coefficients of charged Martian atmospheric dust particles at these infrared bands and at different altitude levels, are calculated using the surface conductivity model and the Core-shell model.

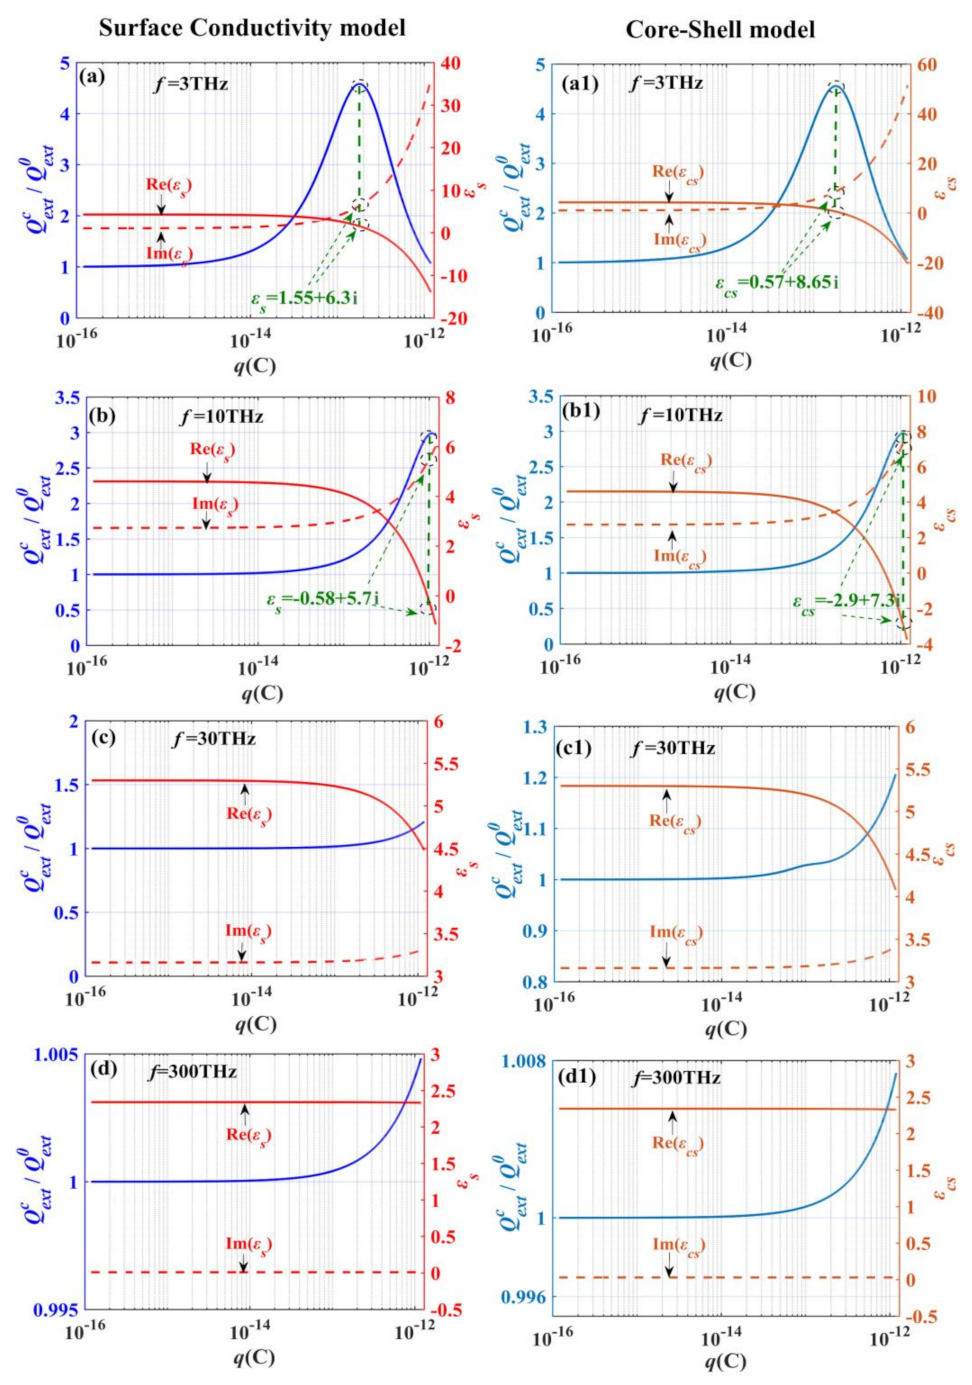
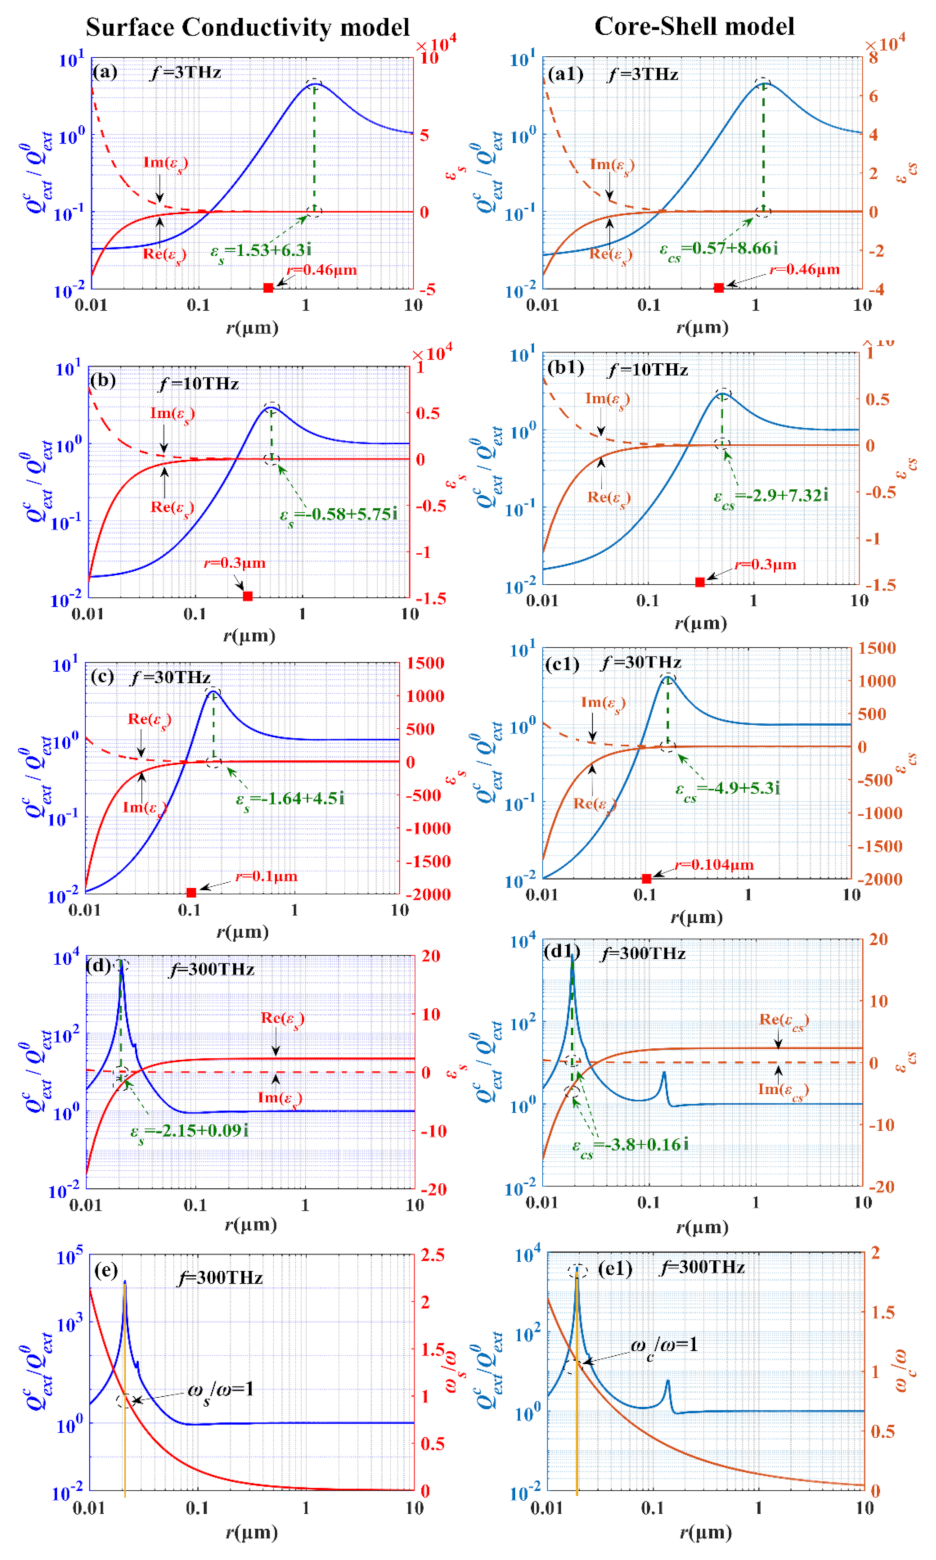
3.1. Extinction Properties of Charged Martian Dust

Figure 3 shows the extinction amplification factors of charged Martian dust particles, denoted as Q e x t c / Q e x t 0 , which are plotted as functions of the total net charge of the particle (denoted as q, unit in [C]). Here, four particle radii are selected for study (i.e., 0.5 μm, 1 μm, 1.5 μm and 2 μm [8,38,39]) which correspond to different altitude levels (i.e., altitude 30–40 km, near ~20 km and altitude near surface (<10 km), respectively). Considering the abovementioned sensors onboard Mars orbiters (i.e., TES, EMIRS, and MCS), four infrared frequencies/wavelengths of interest are considered, which are 3 THz/100 um, 10 THz/30 μm, 30 THz/10 μm, and 300 THz/1 μm. The dielectric constants of particle materials for the four frequencies are εr = 4.3 + 1.05i, εr = 4.6 + 2.73i, εr = 5.3 + 3.16i, and εr = 2.34 + 0.03i, respectively, which are the experimental data from refs. [12,13,45].
As shown in Figure 3, for the considered frequencies and particle sizes, the surface conductivity model (Figure 3a,c,e,g) and Core-shell model (Figure 3b,d,f,h) give consistent results, and the amplification factors are basically greater than 1, which means the extinction coefficient of the Martian atmospheric dust particles will be enhanced when they are electrostatically charged. Particularly for the Martian dust particles at an altitude of 30 km–40 km and near 20 km, where the effective particle radii are 0.5 μm and 1 μm, respectively, the amplification factors at 3 THz have maximums with increasing q, which is called amplification resonance (as shown in Figure 3a–d). The peak value of the factor Q e x t c / Q e x t 0 is over 4. The positions of amplification resonance on the q-axis only have a small difference between the two models. The amplification resonance peaks imply that at an altitude of 20–30 km, the extinction of Martian dust particles at the infrared frequency/wavelength 3 THz/100 μm could have a chance to be amplified by more than 400% when the particles are charged. The extinction factors at the infrared frequency/wavelength 10 THz/30 μm increase monotonously with increasing q and they reach their maximum as q gets saturated. The maximum of the factor Q e x t c / Q e x t 0 is ~3 and ~1.6 for r = 0.5 μm and 1.0 μm, respectively, as shown by the dashed lines in Figure 3a–d. With increasing frequency or particle size, the extinction amplification factor Q e x t c / Q e x t 0 decreases. For example, the factor Q e x t c / Q e x t 0 decreases to ~1.25 for r = 0.5 μm and f = 30 THz, even as q approaches qmax, as shown in Figure 3a,c.
One can get some implications from the results in Figure 3: the extinction amplifications of the charged Martian dust are not negligible at an altitude of 30–40 km for infrared frequencies/wavelengths 3–30 THz/10–100μm, near an altitude of ~20 km for frequencies/wavelengths 3–10 THz/30–100 μm and at altitude < 10 km for the infrared frequency/wavelength near 3 THz/100 μm. One should notice that TES’s and EIMRS’s channels lie in these infrared bands. Theoretically, this implies the Martian dust particle density constructed from TES or EIMERS dust optical depth might be overestimated, especially at altitudes above 20 km, if one treats the dust as neutral particles.
To study the relationship between the extinction amplification factor of charged Martian dust particle (i.e., Q e x t c / Q e x t 0 ) and the equivalent dielectric functions (i.e., εs and εcs), Figure 4 shows Q e x t c / Q e x t 0 , εs and εcs as functions of the total net charge q of the particle for different infrared frequencies f = 3 THz, 10 THz, 30 THz, and 300 THz. Here, the particle radius is r = 0.5 μm. The left column, Figure 4a–d, are the results given by the surface conductivity model, whereas the right column, Figure 4a1–d1, are the results given by the Core-shell model. The right y-axis shows the values of the real and imaginary parts of εs and εcs. On the other hand, Q e x t c / Q e x t 0 , εs and εcs are shown as functions of the particle radius r in Figure 5, in which the particle’s net charge is assumed to be saturated, namely, q = qmax(r).
One can find from Figure 4 and Figure 5 that the variation of the amplification factor, as a function of q and r, is accompanied by the variation of the equivalent dielectric functions εs(q, r) and εcs(q, r). By comparing Figure 4a with Figure 5a, one sees that at the positions of amplification resonance on the q-axis and r-axis, where Q e x t c / Q e x t 0 takes the peak values, the equivalent dielectric function εs takes the same value for f = 3 THz. That is, at the infrared frequency f = 3 THz, the amplification resonance occurs as the dielectric function εs, as a function of q and r, which is equal to a particular value 1.55 + 6.3i (see Figure 4a and Figure 5a). Similarly, the extinction amplification resonance for the frequency f = 10 THz occurs at εs(q,r) = −0.58 + 5.7i, as shown in Figure 4b and Figure 5b. It is the same for the Core-shell model’s results, as shown in Figure 4a1,b1 and Figure 5a1,b1. Table 1 lists the values of the equivalent dielectric functions εs and εcs, which produce the extinction amplification resonance of charged Martian dust particles at different infrared frequencies f = 3 THz, 10 THz, 30 THz and 300 THz.
As reflected by Figure 4 and Figure 5, the extinction amplification factors given by the two models, including the positions of extinction amplification on both the q-axis and r-axis, are consistent with each other at the infrared band 3 THz–300 THz. For larger Martian dust particles (e.g., r = ~10 μm), the extinction amplification factors are equal to 1, which means the charged particles’ extinction coefficients are equal to the extinction coefficient of the uncharged particle, because the absorption of radiant flux by the surface net charges becomes much less than the absorption by the particle’s bulk, with decreasing surface-to-bulk ratio. The extinction amplification resonance occurs on particles that are much smaller than the wavelength, as indicated by Figure 5a–d. For example, the position of amplification resonance is at r = ~1.2 μm for an infrared frequency/wavelength of 3 THz/100 μm, as displayed in Figure 5a,a1. Figure 5b,b1 indicates that the amplification peaks shift to r = ~0.5 μm for an infrared frequency/wavelength of 10 THz/30 μm. With the increase in frequency, the extinction amplification peak shifts toward the low end of r-axis, as indicated by Figure 5a–d,a1–d1. For f = 300 THz, a strong extinction amplification resonance occurs on small particles whose radii are about 20 nm. This strong extinction amplification of charged particles has been found in previous studies (e.g., refs. [46,47,48,49,50]).
It is well known that for particles much smaller than the wavelength of an incident wave, the particles’ scattering fields can be approximated well by the Rayleigh scattering theory (i.e., dipole approximation) [28]; therefore, for a given fixed q of a particle much smaller than the wavelength, the results of the two models should approach the same limit case, the dipole approximation at the infrared band 3–300 THz. In conclusion, for the charged Martian dust particles at an altitude from the near-surface level to over 40 km, where r = 0.3 μm–2 μm, either the surface conductivity model or the Core-shell model can be employed to calculate their extinction coefficients at the infrared band 3 THz–300 THz, without resulting in significant difference. Figure 6 shows the difference between the two models for f = 30 THz and 300 THz, where A = Q e x t c , S D Q e x t c , C S Q e x t c , S D × 100 % . Here, Q e x t c , S D and Q e x t c , C S stand for the extinction coefficients given by the surface conductivity model and the Core-shell model, respectively.
For a given fixed frequency, the excitation frequencies of the surface conductivity model and the Core-shell model (i.e., ωs and ωc) are functions of particle radius r and the particle’s total net charge q. ωs and ωc for f = 300 THz are shown in Figure 5e,e1, which indicate that the extinction amplification resonances occur as the frequency of the incident wave (i.e., ω) approaches the extinction frequency ωs or ωc. That means the excitation frequency, ωs or ωc, can be considered as a characteristic of a charged particle.
As reflected in Figure 5a–d, to the left side of the extinction amplification resonance peak, the amplification factor Q e x t c / Q e x t 0 can become less than 1 with the decrease of the particle radius. For example, Figure 5a,a1 shows that Q e x t c / Q e x t 0 is less than 1 for r < ~0.46 μm at frequency 3 THz. That means the extinction of the charged particle is reduced, compared with the uncharged particle, which is called extinction reduction here. With increasing frequency, the location of extinction reduction shifts toward the left end of the r-axis, as indicated by Figure 5 a–c. The location of extinction reduction shifts to r < ~0.3 μm for f = 10 THz and to r < ~0.1 μm for f = 30 THz.
Figure 7 shows the shift of the amplification resonance lines of charged particles on the r-q parameter plane. The thick solid lines, labelled as resonance lines, indicate the extinction amplification resonance positions for infrared frequencies 3 THz, 10 THz, 30 THz, and 300 THz. The dashed green line represents the saturation charge qmax(r) of a particle of radius r. As already found in Figure 4 and Figure 5, the resonance line shifts toward the upper-left of the r-q parameter plane as the frequency f gets higher. The intersection points of the resonance lines and the qmax-line correspond to the values of the particle radii listed in Table 1 (i.e., 1.22 μm, 0.47 μm, 0.16 μm, and 0.02 μm). These are the locations of extinction amplification peaks for f = 3 THz, 10 THz, 30 THz, and 300 THz, respectively, as shown in Figure 5a–d or Figure 5a1–d1. Taking the case of f = 3 THz as an example, one can see from Figure 7 that for a particle with r ≤ 1.22 μm, the extinction amplification resonance can occur as the particle is charged. For r > 1.22 μm, however, the extinction amplification resonance cannot be reached, even if the particle’s net charge gets saturated.
A shaded region is shown in Figure 7, which is between the qmax-line and the thin solid line. On the thin solid line, Q e x t c / Q e x t 0 equals 1.0 for f = 30 THz, whereas for (r, q), which lies in the shaded region, the factor Q e x t c / Q e x t 0 is less than 1. One can call this region the extinction reduction region of 30 THz. For a given fixed frequency, one can obtain its extinction reduction region. With the increase of frequency, the lower boundary of the extinction reduction region also shifts toward the upper-left of the r-q parameter plane.
The scatters shown in Figure 7 (i.e., the solid stars and triangles) are the experimental data of the radii r and the total net charge q of charged Martian dust particles [22,24,31]. Some of them lie close to the extinction amplification resonance lines. One data point even lies in the shaded region, the extinction reduction region of 30 THz. On the other hand, the effective particle radii of Martian atmospheric dust particles is 0.3 μm–1.8 μm at an altitude from near surface to over 40 km [8,40,41,42,43]; they cover the particle radii labelled by the vertical dashed lines in Figure 7, which are the locations of extinction amplification resonance.

3.2. Effect of the Net Charge on the Martian Dust Optical Depth

The dust optical depth (DOD) of Martian atmosphere is used to construct the dust distributions on Mars. The dust distributions are used in the simulation of Mars’ climate, to predict the conditions for the entry, descent, and landing of Mars exploration landers [1]. As mentioned above, the extinction of charged Martian dust particles can be changed. Figure 8 shows that the Martian DOD at the infrared band 3 THz–300 THz can also be changed as the dust particles are charged. Here, τ0 and τc denote the calculated DOD of uncharged and charged Martian atmospheric dust, respectively. The DOD at a given altitude is calculated for the vertical path from the atmosphere top to the given altitude. The vertical profile of Martian dust particle number density used for the calculation of DOD is N ~ N b τ s e z / H (see ref. [44]), where Nb is the number density at the surface. H stands for the scale height of the Martian atmosphere, which has an average value of 11.1 km and τs is the DOD of Martian atmosphere, which is the observed data of NASA’s Mars rovers Spirit and Opportunity. For τs = 6, the particle density near the ground (z = 0) is ~140 (unit in 1/cm3) [44].
Compared with uncharged dust particles, charged Martian dust particles can produce larger dust optical depth. For infrared channels at 3 THz–10 THz, the observed DOD at the near surface (0–10 km) can be enhanced by ~80% (Figure 8b), as the dust particles are charged. At higher altitudes (e.g., 40–50 km), the enhancement of the DOD can increase to ~200% (Figure 8b), because the dust particles at high altitudes have smaller radii. With the increase in frequency (e.g., at 30–300 THz), the enhancement of the DOD caused by charged dust particle drops to <5% at an altitude of 0–10 km (Figure 8c,d).
Theoretically, by treating Martian dust as neutral particles, the dust particle density constructed from the observed DOD might be overestimated, due to the enhancement of the DOD by charged Martian dust particles. In fact, this overestimation of Martian dust particle density was encountered in research of the Martian atmosphere. A model simulation of Martian atmospheric dust distribution was performed using the vertical dust profile constructed from the TES dust optical depth data; it was found that the model prediction of dust density at altitudes above 15 km are higher than the dust density observed by NASA’s Mars rover Phoenix [1]. The reason might be that the construction of dust distribution from the TES dust optical depth did not consider the enhancement of the DOD by charged particles. Here, by counting the enhancement of the DOD by charged dust particles, the model prediction of the vertical dust density profile of the Martian atmosphere, denoted as N0 (the line in blue, Figure 9), is corrected and compared with the observation data of Phoenix (i.e., the line in black), as shown in Figure 9. The corrected dust density, denoted as Nc (the line in red), is in better agreement with the observation data of Phoenix, especially at altitudes above 20 km. In our calculation, it is assumed that the dust optical depth was obtained by the TES channel of 10 THz/30 μm. The Martian dust surface potential is Vs = 5 kV [21], which is used to estimate the total net charge of the Martian dust particles. Given a fixed known DOD at an altitude, the correction factor can be determined, namely, Nc/N0 = Q e x t 0 / Q e x t c . At higher altitudes, the overestimation is more significant. For example, N0/Nc increases from 1.08 at an altitude of 20 km to ~1.4 at 34 km. Of course, further research is needed to understand how charged Martian dust particles affect the DOD.

4. Conclusions

The extinction properties of charged Martian dust particles at different altitudes are studied by the Mie scattering theory, in which two models, the surface conductivity model and the Core-shell model, are adopted for the description of charged dust particles. It is found that the two models give consistent extinction data of charged Martian dust particles at an altitude from near surface (0–10 km) to above 40 km, for the infrared band 3 THz–300 THz, which covers the infrared channels of Mars orbiters (e.g., TES and MERIS); therefore, one can use either of the two models to study the extinction properties of charged Martian dust particles.
The extinction coefficients of Martian dust particles and the dust optical depth (DOD) data of infrared channels onboard Mars orbiters can be amplified as the dust particles are charged. The calculated results indicate that the extinction amplification usually occurs on particles that are much smaller than the infrared wavelength. With the increase in infrared frequency from 3 THz to 300 THz, the positions of the extinction amplification resonance of charged Martian dust particles shift toward the upper left of the rq parameter plane. Here, r is the particle radius and q the particle’s total net charge; therefore, the amplification of extinction and the DOD is more significant at high altitudes than at low altitudes. However, at 3 THz–10 THz, the amplification of the DOD at the near surface altitude (0–10 km) can still be significant.
That means the amplification of the DOD, which is caused by charged Martian dust, should be concerned when constructing the vertical dust profile from observed DOD data. By considering the enhancement of the DOD, the overestimated vertical dust profile constructed from DOD data (e.g., the TES data), can be corrected; however, the correction of vertical dust profiles constructed from DOD data needs further study, which should be of benefit to the model predictions of entry, descent, and landing conditions for future Mars missions.

Author Contributions

X.G.: Conceptualization, Investigation, Methodology, Software, Writing—original draft, Visualization. X.D.: Methodology, Software. L.X.: Conceptualization, Methodology, Supervision, Writing—Review and Editing, Funding acquisition. J.Z.: Conceptualization, Investigation, Methodology, Supervision. All authors have read and agreed to the published version of the manuscript.

Funding

This research is supported by grants from the National Natural Science Foundations of China (No.11472122) and the Fundamental Research Funds for the Central Universities (No. lzujbky-2018-121).

Institutional Review Board Statement

Not applicable.

Informed Consent Statement

Not applicable.

Data Availability Statement

The data that support the findings of this study are available from the corresponding author upon reasonable request.

Acknowledgments

The authors would like to sincerely thank the reviewers for their valuable comments on this work.

Conflicts of Interest

The authors declare no conflict of interest.

References

  1. Fonseca, R.M.; Zorzano, M.P.; Martín-Torres, J. MARSWRF prediction of entry descent landing profiles: Applications to Mars exploration. Earth Space Sci. 2019, 6, 1440–1459. [Google Scholar] [CrossRef]
  2. Fenton, L.; Reiss, D.; Lemmon, M.; Marticorena, B.; Cantor, B. Orbital Observations of Dust Lofted by Daytime Convective Turbulence. Space Sci. Rev. 2016, 203, 89–142. [Google Scholar] [CrossRef] [Green Version]
  3. McCleese, D.; Schofield, J.; Taylor, F.; Calcutt, S.; Foote, M.; Kass, D.; Leovy, C.; Paige, D.; Read, P.; Zurek, R. Mars Climate Sounder: An investigation of thermal and water vapor structure, dust and condensate distributions in the atmosphere, and energy balance of the polar regions. J. Geophys. Res. Planets 2007, 112, E05S06. [Google Scholar] [CrossRef] [Green Version]
  4. Altunaiji, E.; Edwards, C.; Smith, M.; Christensen, P.; AlMheiri, S.; Reed, H. Emirates Mars Infrared Spectrometer (EMIRS) Overview from the Emirates Mars Mission. In Proceedings of the EGU General Assembly Conference Abstracts, Vienna, Austria, 23–28 April 2017; p. 15037. [Google Scholar]
  5. Wolff, M.J.; Clancy, R.T. Constraints on the size of Martian aerosols from Thermal Emission Spectrometer observations. J. Geophys. Res. Planets 2003, 108, 5097. [Google Scholar] [CrossRef]
  6. Fedorova, A.A.; Montmessin, F.; Rodin, A.V.; Korablev, O.I.; Bertaux, J.L. Evidence for a bimodal size distribution for the suspended aerosol particles on Mars. Icarus 2014, 231, 239–260. [Google Scholar] [CrossRef]
  7. Montabone, L.; Lewis, S.R.; Read, P.L.; Withers, P. Reconstructing the weather on Mars at the time of the MERs and Beagle 2 landings. Geophys. Res. Lett. 2006, 33, 692. [Google Scholar] [CrossRef] [Green Version]
  8. Haberle, R.M.; Clancy, R.T.; Forget, F.; Smith, M.D.; Zurek, R.W. The Atmosphere and Climate of Mars; Cambridge University Press: Cambridge, UK, 2017. [Google Scholar]
  9. Cantor, B.A.; Pickett, N.B.; Malin, M.C.; Lee, S.W.; Wolff, M.J.; Caplinger, M.A. Martian Dust Storm Activity near the Mars 2020 Candidate Landing Sites: MRO-MARCI Observations from Mars Years 28–34. Icarus 2018, 321, 161–170. [Google Scholar] [CrossRef]
  10. Tang, Z.; Liu, J.; Wang, X.; Ren, X.; Yan, W.; Chen, W. The Temporal Variation of Optical Depth in the Candidate Landing Area of China’s Mars Mission (Tianwen-1). Remote Sens. 2021, 13, 1029. [Google Scholar] [CrossRef]
  11. Dabrowska, D.D.; Muñoz, O.; Moreno, F.; Ramos, J.L.; Martínez-Frías, J.; Wurm, G. Scattering matrices of martian dust analogs at 488nm and 647nm. Icarus 2015, 250, 83–94. [Google Scholar] [CrossRef]
  12. Marra, A.C.; Blanco, A.; Fonti, S.; Jurewicz, A.; Orofino, V. Fine hematite particles of Martian interest: Absorption spectra and optical constants. J. Phys. Conf. 2005, 6, 132–138. [Google Scholar] [CrossRef]
  13. Glotch, T.D.; Rossman, G.R.; Aharonson, O. Mid-infrared (5–100 μm) reflectance spectra and optical constants of ten phyllosilicate minerals. Icarus 2007, 192, 605–622. [Google Scholar] [CrossRef]
  14. Montabone, L.; Forget, F.; Millour, E.; Wilson, R.; Lewis, S.; Cantor, B.; Kass, D.; Kleinböhl, A.; Lemmon, M.; Smith, M. Eight-year climatology of dust optical depth on Mars. Icarus 2015, 251, 65–95. [Google Scholar] [CrossRef] [Green Version]
  15. Draine, B.T. Interstellar dust grains. Annu. Rev. Astron. Astrophys. 2003, 41, 241–289. [Google Scholar] [CrossRef] [Green Version]
  16. Rudge, W.D. Atmospheric electrification during South African dust storms. Nature 1913, 91, 31–32. [Google Scholar] [CrossRef] [Green Version]
  17. Kok, J.F.; Renno, N.O. Electrostatics in wind-blown sand. Phys. Rev. Lett. 2008, 100, 014501. [Google Scholar] [CrossRef] [Green Version]
  18. Mazumder, M.K.; Calle, C.I.; Pruessner, K.; Sharma, R.; Srirama, P.K.; Ali, M.; Immer, C.; Trigwell, S.; Clements, J.S.; Biris, A.S.; et al. Research needs in electrostatics for Lunar and Mars space missions. In Proceedings of the Fourtieth IAS Annual Meeting. Conference Record of the 2005 Industry Applications Conference, Hong Kong, China, 2–6 October 2005; Volume 321, pp. 327–333. [Google Scholar]
  19. Eden, H.F.; Vonnegut, B. Electrical Breakdown Caused by Dust Motion in Low-Pressure Atmospheres: Considerations for Mars. Science 1973, 180, 962–963. [Google Scholar] [CrossRef]
  20. Mazumder, M.K.; Srirama, P.; Sharma, R.; Biris, A.; Hidetaka, I.; Trigwell, S.; Horenstein, M. Lunar and Martian dust dynamics. IEEE Ind. Appl. Mag. 2010, 16, 14–21. [Google Scholar] [CrossRef]
  21. Melnik, O.; Parrot, M. Electrostatic discharge in Martian dust storms. J. Geophys. Res. Atmos. 1998, 103, 29107–29118. [Google Scholar] [CrossRef]
  22. Moore, A.D. Electrostatics and Its Applications; John Wiley & Sons: Hoboken, NJ, USA, 1973. [Google Scholar]
  23. Farrell, W.; Kaiser, M.; Desch, M.; Houser, J.; Cummer, S.; Wilt, D.; Landis, G. Detecting electrical activity from Martian dust storms. J. Geophys. Res. Planets 1999, 104, 3795–3801. [Google Scholar] [CrossRef]
  24. Merrison, J.; Jensen, J.; Kinch, K.; Mugford, R.; Nørnberg, P. The electrical properties of Mars analogue dust. Planet. Space Sci. 2004, 52, 279–290. [Google Scholar] [CrossRef]
  25. Bohren, C.F.; Hunt, A.J. Scattering of electromagnetic waves by a charged sphere. Can. J. Phys. 1977, 55, 1930–1936. [Google Scholar] [CrossRef]
  26. Klačka, J.; Kocifaj, M. Scattering of electromagnetic waves by charged spheres and some physical consequences. J. Quant. Spectrosc. Radiat. Transf. 2007, 106, 170–183. [Google Scholar] [CrossRef]
  27. Heinisch, R.L.; Bronold, F.X.; Fehske, H. Mie scattering by a charged dielectric particle. Phys. Rev. Lett. 2012, 109, 243903. [Google Scholar] [CrossRef] [PubMed] [Green Version]
  28. Bohren, C.F.; Huffman, D.R. Absorption and Scattering of Light by Small Particles; John Wiley & Sons Inc: Hoboken, NJ, USA, 1983. [Google Scholar]
  29. Aden, A.L.; Kerker, M. Scattering of electromagnetic waves from two concentric spheres. J. Appl. Phys. 1951, 22, 1242–1246. [Google Scholar] [CrossRef]
  30. Franzese, G.; Esposito, F.; Lorenz, R.; Silvestro, S.; Popa, C.I.; Molinaro, R.; Cozzolino, F.; Molfese, C.; Marty, L.; Deniskina, N. Electric properties of dust devils. Earth Planet. Sci. Lett. 2018, 493, 71–81. [Google Scholar] [CrossRef]
  31. Tomme, E.B.; Law, D.A.; Annaratone, B.M.; Allen, J.E. Parabolic plasma sheath potentials and their implications for the charge on levitated dust particles. Phys. Rev. Lett. 2000, 85, 2518–2521. [Google Scholar] [CrossRef] [Green Version]
  32. Koren, I.; Ganor, E.; Joseph, J.H. On the relation between size and shape of desert dust aerosol. J. Geophys. Res. Atmos. 2001, 106, 18047–18054. [Google Scholar] [CrossRef]
  33. Yang, P.; Feng, Q.; Hong, G.; Kattawar, G.W.; Wiscombe, W.J.; Mishchenko, M.I.; Dubovik, O.; Laszlo, I.; Sokolik, I.N. Modeling of the scattering and radiative properties of nonspherical dust-like aerosols. J. Aerosol Sci. 2007, 38, 995–1014. [Google Scholar] [CrossRef]
  34. Brown, A.M.; Sheldon, M.T.; Atwater, H.A. Electrochemical tuning of the dielectric function of Au nanoparticles. ACS Photonics 2015, 2, 459–464. [Google Scholar] [CrossRef] [Green Version]
  35. Klacka, J.; Kocifaj, M. On the Scattering of Electromagnetic Waves by a Charged Sphere. Prog. Electromagn. Res. 2010, 109, 17–35. [Google Scholar] [CrossRef] [Green Version]
  36. Fan, X.; Zheng, W.; Singh, D.J. Light scattering and surface plasmons on small spherical particles. Light Sci. Appl. 2014, 3, e179. [Google Scholar] [CrossRef] [Green Version]
  37. Klačka, J.; Kocifaj, M.; Kundracik, F.; Videen, G.; Kohút, I. Generalization of electromagnetic scattering by charged grains through incorporation of interband and intraband effects. Opt. Lett. 2015, 40, 5070–5073. [Google Scholar] [CrossRef] [PubMed]
  38. Gierasch, P.J.; Goody, R.M. A Model of a Martian Great Dust Storm. J. Atmos. Sci. 1973, 30, 169–179. [Google Scholar] [CrossRef] [Green Version]
  39. Gierasch, P.J. Martian dust storms. Rev. Geophys. 1974, 12, 730. [Google Scholar] [CrossRef]
  40. Montmessin, F.; Quémerais, E.; Bertaux, J.-L.; Korablev, O.; Rannou, P.; Lebonnois, S. Stellar occultations at UV wavelengths by the SPICAM instrument: Retrieval and analysis of Martian haze profiles. J. Geophys. Res. Planets 2006, 111, E09S09. [Google Scholar] [CrossRef] [Green Version]
  41. Rannou, P.; Perrier, S.; Bertaux, J.L.; Montmessin, F.; Korablev, O.; Reberac, A. Dust and cloud detection at the Mars limb with UV scattered sunlight with SPICAM. J. Geophys. Res. Planets 2006, 111, E09S10. [Google Scholar] [CrossRef]
  42. Fedorova, A.; Korablev, O.; Bertaux, J.; Rodin, A.; Montmessin, F.; Belyaev, D.; Reberac, A. Solar infrared occultations by the SPICAM experiment on Mars-Express: Simultaneous observations of H2O, CO2 and aerosol vertical distribution. In Proceedings of the AAS/Division for Planetary Sciences Meeting Abstracts #39, id.31.03, Orlando, FL, USA, 7–12 October 2007. [Google Scholar]
  43. Clancy, R.T.; Wolff, M.J.; Whitney, B.A.; Cantor, B.A.; Smith, M.D.; McConnochie, T.H. Extension of atmospheric dust loading to high altitudes during the 2001 Mars dust storm: MGS TES limb observations. Icarus 2010, 207, 98–109. [Google Scholar] [CrossRef]
  44. Calle, C.I. Electrostatic Phenomena on Planetary Surfaces; Morgan & Claypool Publishers: San Rafael, CA, USA, 2017. [Google Scholar]
  45. Toon, O.B.; Pollack, J.B.; Sagan, C. Physical properties of the particles composing the Martian dust storm of 1971–1972. Icarus 1977, 30, 663–696. [Google Scholar] [CrossRef]
  46. Juluri, B.K.; Zheng, Y.B.; Ahmed, D.; Jensen, L.; Huang, T.J. Effects of Geometry and Composition on Charge-Induced Plasmonic Shifts in Gold Nanoparticles. J. Phys. Chem. C 2008, 112, 7309–7317. [Google Scholar] [CrossRef]
  47. Rosenkrantz, E.; Arnon, S. Enhanced absorption of light by charged nanoparticles. Opt. Lett. 2010, 35, 1178–1180. [Google Scholar] [CrossRef]
  48. Byers, C.P.; Zhang, H.; Swearer, D.F.; Yorulmaz, M.; Hoener, B.S.; Huang, D.; Hoggard, A.; Chang, W.-S.; Mulvaney, P.; Ringe, E. From tunable core-shell nanoparticles to plasmonic drawbridges: Active control of nanoparticle optical properties. Sci. Adv. 2015, 1, e1500988. [Google Scholar] [CrossRef] [PubMed] [Green Version]
  49. Zapata Herrera, M.; Aizpurua, J.; Kazansky, A.K.; Borisov, A.G. Plasmon response and electron dynamics in charged metallic nanoparticles. Langmuir 2016, 32, 2829–2840. [Google Scholar] [CrossRef] [PubMed]
  50. Zhou, Z.; Zhang, S.; Qi, J.; Yang, X. Extension of complex refractive index model and analysis of scattering properties of charged submicron spheres. J. Quant. Spectrosc. Radiat. Transf. 2020, 242, 106735. [Google Scholar] [CrossRef]
Figure 1. Schematic of the remote sensing of Martian atmospheric dust. (a) A dust particle with a charged shell that is much thinner than the particle size, which is assumed to form a surface current of zero-thickness [28]. (b) A dust particle with a charged shell that has a thickness comparable to the particle size, which can be described by a Core-Shell model [29].
Remotesensing 14 02072 g001
Figure 2. The dependence of the particle’s saturation charge qmax on the particle radius. Here, it is assumed that the breakdown surface potential is 20 kV. The scatters are reported experimental data from refs. [22,24,31].
Remotesensing 14 02072 g002
Figure 3. The extinction amplification factor (i.e., Q e x t c / Q e x t 0 ) of charged Martian dust at infrared frequencies 3 THz, 10 THz, 30 THz, and 300 THz, and its dependence on q, the total net charge of the Martian dust particle. (a,c,e,g) are given by the surface conductivity model, while (b,d,f,h) are given by the Core-shell model for r = 0.5 μm, 1.0 μm, 1.5 μm and 2.0 μm, respectively.
Remotesensing 14 02072 g003
Figure 4. The extinction amplification factor Q e x t c / Q e x t 0 and the equivalent dielectric functions (i.e., εs and εcs) given by the surface conductivity model (ad) and the Core-shell model (a1d1), respectively, which are plotted as functions of q, the total net charge of the particle. Here, the particle radius is 0.5 μm.
Remotesensing 14 02072 g004
Figure 5. Extinction amplification factors Q e x t c / Q e x t 0 and equivalent dielectric functions (i.e., εs and εcs), which are given by the surface conductivity model (ad) and the Core-shell model (a1d1), respectively, for frequencies f = 3 THz, 10 THz, 30 THz and 300 THz. (e,e1) shows the normalized excitation frequencies (i.e., ωs/ω and ωc/ω) for f = 300 THz given by the two models, respectively. Here, for each fixed r, it is assumed that the particle’s net charge gets saturated, namely by q = qmax(r).
Remotesensing 14 02072 g005
Figure 6. Difference between the surface conductivity model (dashed line) and the core-shell model (solid line) for (a) f = 30 THz and (b) f = 300 THz.
Remotesensing 14 02072 g006
Figure 7. The shifts of the extinction amplification resonance and extinction reduction on the rq parameter plane, as the frequency varies from 3 THz to 300 THz. Here, r denotes the radius of particle and q the particle’s total net charge. The thick solid lines (labelled with “resonance”) represent the positions of extinction amplification resonance. The shaded triangle region indicates positions, where the extinction reduction ( Q e x t c / Q e x t 0 < 1) occurs for f = 30 THz. The dashed line denotes the saturation charge qmax(r) of a particle of radius r.
Remotesensing 14 02072 g007
Figure 8. Difference between the DOD of charged Martian dust particles and uncharged dust particles for frequencies (a) f = 3 THz, (b) 10 THz, (c) 30 THz, and (d) 300 THz. Here, q is the total net charge of the charged Martian dust particle. The effective particle radii adopted in the calculation of DOD are ~1.8 µm at an altitude of 0–10 km, ~1 µm at an altitude of 10–20 km, ~0.85 µm at an altitude of 20–30 km, ~0.5 µm at an altitude of 30–40 km, and ≤0.3 µm at an altitude above 40 km (see ref. [8]).
Remotesensing 14 02072 g008
Figure 9. Vertical dust density profile of Martian atmosphere. Here, N0 is the model prediction based on TES dust optical depth, given by ref. [1]. Nc denotes the corrected vertical profile of dust particle density, by counting in the contribution of the particles’ net charges. The line in black is the observed data of Phoenix (see ref. [1]).
Remotesensing 14 02072 g009
Table 1. The values of the equivalent dielectric functions, εs and εcs, that produce the extinction amplification resonance of charged Martian dust particles for f = 3 THz, 10 THz, 30 THz, and 300 THz.
FrequencySurface Conductivity ModelCore-Shell Model
RadiusεsRadiusεcs
f = 3 THz1.2 μm1.55 + 6.3i1.2 μm0.57 + 8.66i
f = 10 THz0.5 μm−0.58 + 5.75i0.5 μm−2.9 + 7.32i
f = 30 THz0.17 μm−1.64 + 4.5i0.165 μm−4.9 + 5.3i
f = 300 THz0.02 μm−2.15 + 0.09i0.019 μm−3.8 + 0.16i
Publisher’s Note: MDPI stays neutral with regard to jurisdictional claims in published maps and institutional affiliations.

