Article

Analyzing the Error Pattern of InSAR-Based Mining Subsidence Estimation Caused by Neglecting Horizontal Movements

1
School of Geosciences and Info-Physics, Central South University, Changsha 410083, China
2
Laboratory of Radar Remote Sensing Applications, Changsha University of Science & Technology, Changsha 410114, China
*
Author to whom correspondence should be addressed.
Remote Sens. 2022, 14(9), 1963; https://doi.org/10.3390/rs14091963
Submission received: 14 March 2022 / Revised: 7 April 2022 / Accepted: 14 April 2022 / Published: 19 April 2022

Abstract

:
It is common to estimate underground mining-induced subsidence from interferometric synthetic aperture radar (InSAR) displacement observations by Neglecting hOrizontal moVements (NOV). Such a strategy would cause large errors in the NOV-estimated subsidence. This issue was proven and the theoretical equation of the resulting errors has been deduced before. However, the systematic analysis of the error pattern (e.g., spatial distribution) and its relationship between some critical influence factors (e.g., lithology of overlying rock strata) is lacking to date. To circumvent this, a method was first presented to assess the errors of the NOV-estimated mining subsidence in this study. Then, the error pattern and the influence factors of the NOV-estimated mining subsidence were discussed. The results suggest that the errors of the NOV-estimated mining subsidence spatially follow a “peak-to-valley” shape, with an absolute “peak-to-valley angle” of 5–15°. In addition, for the same underground mining geometry, the error magnitudes of the NOV-estimated mining subsidence under hard lithology of overlying rock strata are smaller than those under soft lithology, and vice versa. These results would be beneficial to guide the scientific use of the NOV method for understanding the deformation mechanism and controlling the geohazards associated with underground mining and other similar anthropogenic activities.

Graphical Abstract

1. Introduction

Reasonably using coal mine subsidence zones (e.g., install photovoltaic station) becomes emerging demand for improving mining environment. Since mining subsidence possibly impose damage to infrastructures located in subsidence zones, it is essential to monitoring surface subsidence for assessing the potential mining-induced damage. Interferometric synthetic aperture radar (InSAR) is a useful remote sensing technique to monitor ground surface displacements associated with underground mining activities [1,2,3,4,5,6]. However, InSAR observation is a projection of the real mining-induced deformation vector onto the radar line-of-sight (LOS) direction [7]. Hence, it is challenging to reveal the complex spatio-temporal evolution of mining-induced displacements from InSAR one-dimensional observations of LOS displacements. In the past two decades, some algorithms have been proposed to reconstruct the complete three-dimensional (3D) components of the real deformation vector in the vertical, west–east, and north–south directions from InSAR observations [8,9,10,11,12,13,14,15]. These algorithms, to some extent, can overcome the limitation of InSAR LOS displacements in practical uses. Nevertheless, some of the prerequisites required by these algorithms (e.g., requiring three or more independent InSAR observations, or knowledge of the constraint parameters) usually hinder their practical applications (see [16] for more details). As a consequence, only a few cases of successfully estimating 3D mining displacements from InSAR observations have been reported to date.
When the complete 3D components of mining deformation are hard to be estimated from InSAR, it is a common strategy to resolve the vertical component from InSAR 1D observations by Neglecting hOrizontal moVements (NOV) in both the east–west and north–south directions. For simplification, we referred to the strategy as NOV (see a brief overview of it in Section 2.1). The NOV-estimated mining subsidence is practically used in mining engineering, e.g., to delimitate subsidence boundary [17,18], assess mining-related building damage [19,20], and analyze the spatial-temporal evolution analysis of mining subsidence [21,22] or mining-induced shocks [23]. Theoretically, the NOV method holds well under the assumption that mining-induced horizontal movements are negligible. In fact, besides subsidence, considerable horizontal movements are also induced due to underground mining, and the magnitude of the induced horizontal movements can reach up to 40~50% of the vertical component [24,25]. This implies that large errors can possibly result from NOV-estimated subsidence, due to neglecting the considerable horizontal movements.
The issue that neglecting horizontal movements would cause errors in the estimated subsidence from InSAR observations was recognized, and some attempts were made to analyze the resulting errors. For instance, Samieie-Esfahany et al. [26] deduced the theoretical error equation of the subsidence due to neglecting horizontal movements in the year 2009. Based on the deduced theoretical equation, Fuhrmann and Garthwaite [27] found that the errors due to neglecting horizontal movements primarily depend on the incidence angle of the SAR sensors and the magnitudes of horizontal movements. In addition, the case study in the Sydney Region, Australia, showed that the resulting error can reach up to 67% of the maximum subsidence [27]. These studies primarily focused on the deduction analysis of theoretical errors of the estimated subsidence, but, to the best of our knowledge, rarely focused on assessing the resulting errors and further analyzing the error pattern in specific deformation cases (e.g., associated with underground mining characterized by considerable horizontal movements).
In this paper, we first presented a pixel-wise method for assessing the error of the NOV-estimated mining subsidence in Section 2. The presented method was then tested with real datasets in Section 3. In Section 4 the pattern and some influence factors (e.g., SAR imaging view, interferometric coherence, and the lithology of overlying rock strata) of the NOV-estimated subsidence errors were discussed. Finally, a conclusion was drawn in Section 5.

2. Methods

2.1. Overview of the NOV Method and Its Theoretical Errors

InSAR-measured LOS displacement, namely d los , is a projection of the real deformation vector onto the radar LOS direction by [28]
d los = cos θ d u sin α d e + sin θ sin α d n
where [ d u , d e , d n ] are the vertical, west–east, and north–south components of the real deformation vector; θ stands for the incidence angle of the resolution cell; α denotes the flight angle of the selected SAR sensor. The NOV method estimates subsidence (vertical component of mining displacements) from InSAR observations based on two steps. Firstly, it assumes that mining-induced 2D horizontal movements are both equal to zeros (i.e., d e 0 and d n 0 ), and yields
sin θ cos α d e + sin θ sin α d n = 0
Then, it estimates the subsidence (namely d ^ u ) by substituting Equation (2) into (1), i.e.,
d ^ u = d ^ los / cos θ
where d ^ los = d los + δ los denotes InSAR observation of LOS displacement, with δ los being the observation error (caused by noise, orbital error, atmospheric delay, unwrapping error, etc.).
According to Equation (1), subsidence can be rigorously expressed in math as
d u = d los / cos θ + tan θ [ sin α d n cos α d e ]
By comparing Equations (3) and (4), the theoretical error of the NOV-estimated subsidence (denoted by δu) can be written as
δ u = δ L + δ H
with
δ L = δ los / cos θ
δ H = tan θ cos α d e + tan θ sin α d n
Equation (5) suggests that the theoretical error structure of the NOV-estimated mining subsidence consists of two parts: (i) the error term due to the InSAR observation uncertainties of LOS displacements, namely δ L , and (ii) the error term caused by neglecting horizontal movement components, namely δ H .
It can be observed from Equation (5) that the error of the NOV-estimated mining subsidence theoretically depends on three factors: (i) uncertainty of InSAR observations ( δ los ), (ii) SAR imaging view ( θ and α ), and (iii) mining-induced 2D horizontal movements ( d e and d n ) [27], in which, except for the parameters of SAR imaging view (that can readily be obtained from SAR head files), the remaining two factors are difficult to be accurately determined from a single InSAR observation. Therefore, it is challenging to assess the errors of the NOV-estimated mining subsidence in a pixel-wise manner based on Equation (5). Considering the error assessment is an indispensable step for the error analyses of the NOV-estimated mining subsidence, especially for real datasets, we presented a pixel-wise method for assessing the errors in Section 2.2.

2.2. Pixel-Wise Method for Assessing the Errors of the NOV-Estimated Mining Subsidence

2.2.1. Generating a Reference Subsidence Assisted by a Prior Constraint

The core idea of the presented pixel-wise method is firstly offering a reference subsidence field based on a method named SIP (single InSAR pair). The SIP method, which was originally developed by Li et al. [29], can decompose subsidence from a single InSAR pair assisted by a prior deformation model with an acceptable accuracy level. More specifically, the prior deformation model is described as that there exists a linearly proportional relationship between surface horizontal movement components and the corresponding gradients of vertical subsidence components for extracting underground horizontal or nearly horizontal mineral seams [30]. Based on this prior model, horizontal movements in the east and north directions (namely d e and d n ) at a pixel ( i , j ) can be expressed as two formulas relating to vertical subsidence, i.e.,
{ d e ( i , j ) = C e G e ( i , j ) d n ( i , j ) = C n G n ( i , j )
where C e denotes the proportional coefficient between the horizontal movement component and the gradient of vertical subsidence in the east direction (namely G e ); C n and G n represent the same things as the C e and G e but in the north direction, in which, the parameters C e and C n can be determined by three in situ parameters, i.e., mining depth, the tangent of major influence angle, and the constant of horizontal movement.
By substituting Equation (8) into Equation (1), reference subsidence (denoted by d ^ u_ref can then be solved on the basis of pixel-by-pixel using
d ^ u_ref ( i , j ) = d ^ los ( i , j ) / cos θ + tan θ [ sin α · C n · G n ( i , j ) cos α · C e · G e ( i , j ) ]
In Equation (9) the gradients of subsidence at pixel (i,j) in the east and north directions have involved the subsidence at the pixels ( i + 1 , j ) and ( i , j + 1 ) . Therefore, the reference subsidence of the whole subsidence basin will be solved with a back-substitution strategy. Please refer to [29] for more details.

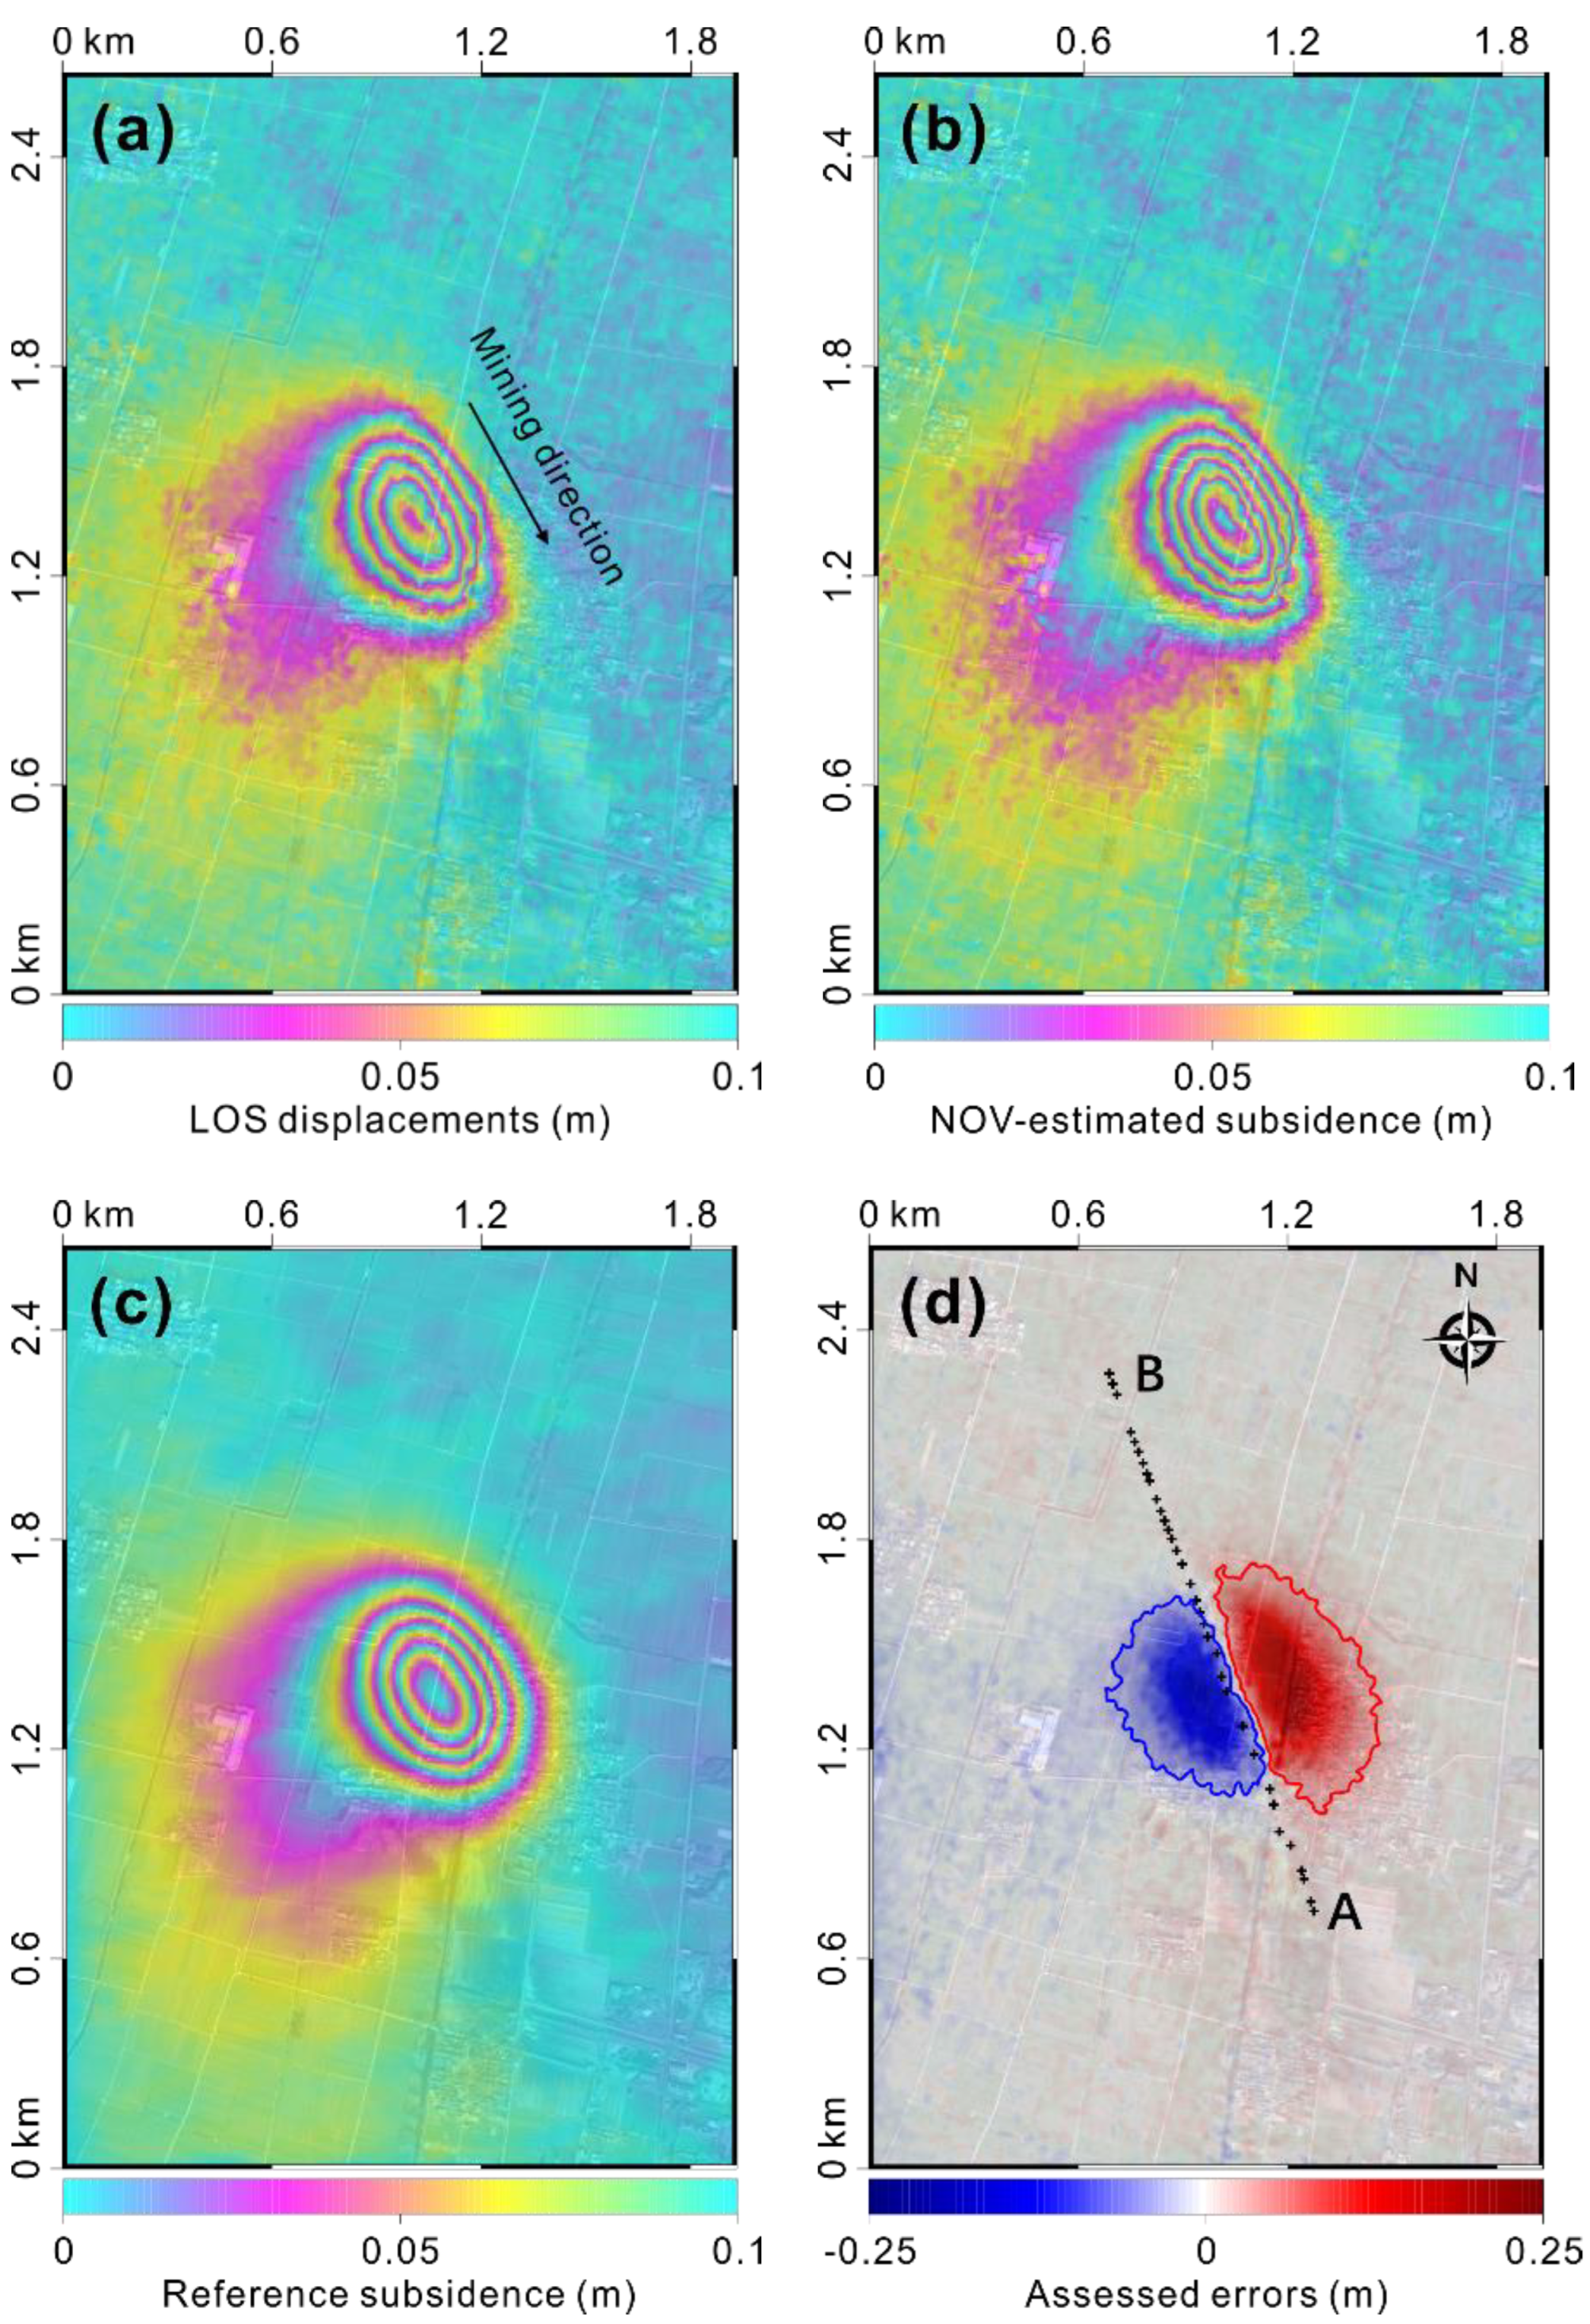
2.2.2. Assessing the Errors of NOV-Estimated Mining Subsidence

Having obtained the reference subsidence, the error of the NOV-estimated mining subsidence d ^ u ( i , j ) at a pixel ( i , j ) (namely δ u ( i , j ) ) can then be estimated by
δ u ( i , j ) = d ^ u ( i , j ) d ^ u _ ref ( i , j )
where d ^ u _ ref ( i , j ) denotes the SIP-retrieved subsidence at the pixel ( i , j ) . The relative error of the NOV-estimated subsidence d ^ u ( i , j ) to the maximum subsidence (a very common error indicator in mining engineering) can be calculated by
δ u ( i , j ) max ( d ^ u _ ref ) × 100 %
where d ^ u _ ref is a vector of the SIP-retrieved reference subsidence in the concerned mining area.
It should be pointed out that three model parameters involved in the SIP method are needed to be in situ collected for solving the reference subsidence in this study. Once these three model parameters are unknown in practice, the SIP-assisted method for the error assessment cannot be performed (see Li, et al. [29] for more details). Since the main aim of this paper is to analyze the errors of the NOV-estimated subsidence, however, we tested the presented pixel-wise method and analyzed the error patterns of the NOV-estimated mining subsidence over those areas where the involved model parameters are known in the following sections.

3. Results

The presented method for error assessment was tested over the Huaibei coalfield, China, in which, two Phased Array type L-band Synthetic Aperture Radar (PALSAR) images, acquired on 13 January and 28 February 2010, respectively, were firstly collected to form a single InSAR pair. Figure 1a presents the InSAR-measured LOS displacements caused by an active working panel over the Huaibei coalfield. Note that it is challenging to obtain the LOS displacements over low-coherent areas [31], thus we interpolated them by inverse distance weighting interpolation for the sake of the following SIP-based subsidence estimation. Figure 1b–d show the NOV-estimated mining subsidence from the InSAR-measured LOS displacements, the SIP-solved reference subsidence, and the assessed errors using the SIP-assisted method, respectively, in which, three model parameters involved in the SIP method, i.e., mining depth, the tangent of major influence angle, and the constant of horizontal movements, were given by 620 m, 1.7, and 0.32. As is seen in Figure 1, significant errors ranging from −0.18 m to 0.23 m were contained in the NOV-estimated mining subsidence, indicating the relative errors to the solved maximum subsidence (about 0.5 m) from −35% to 45%. This result further proves that neglecting horizontal movements in the NOV method could cause large errors in the mining subsidence estimation.
The right panel in Figure 2 shows a scatter plot between the “real” and the assessed errors of the NOV-estimated mining subsidence at 34 field points (i.e., along the profile AB, marked by black crosses in Figure 1d). The “real” errors were obtained by comparing the precise levelling observations of mining subsidence at these 34 field points with the NOV-estimated subsidence there (see the left panel in Figure 2). As is shown, the assessed errors nearly well agree with the “real” ones, with a standard deviation (STD) of the differences between them of about 0.011 m. This result indicates that the assessed errors of the NOV-estimated mining subsidence are reliable.

4. Discussions

4.1. Error Pattern Analyses of the NOV-Estimated Mining Subsidence

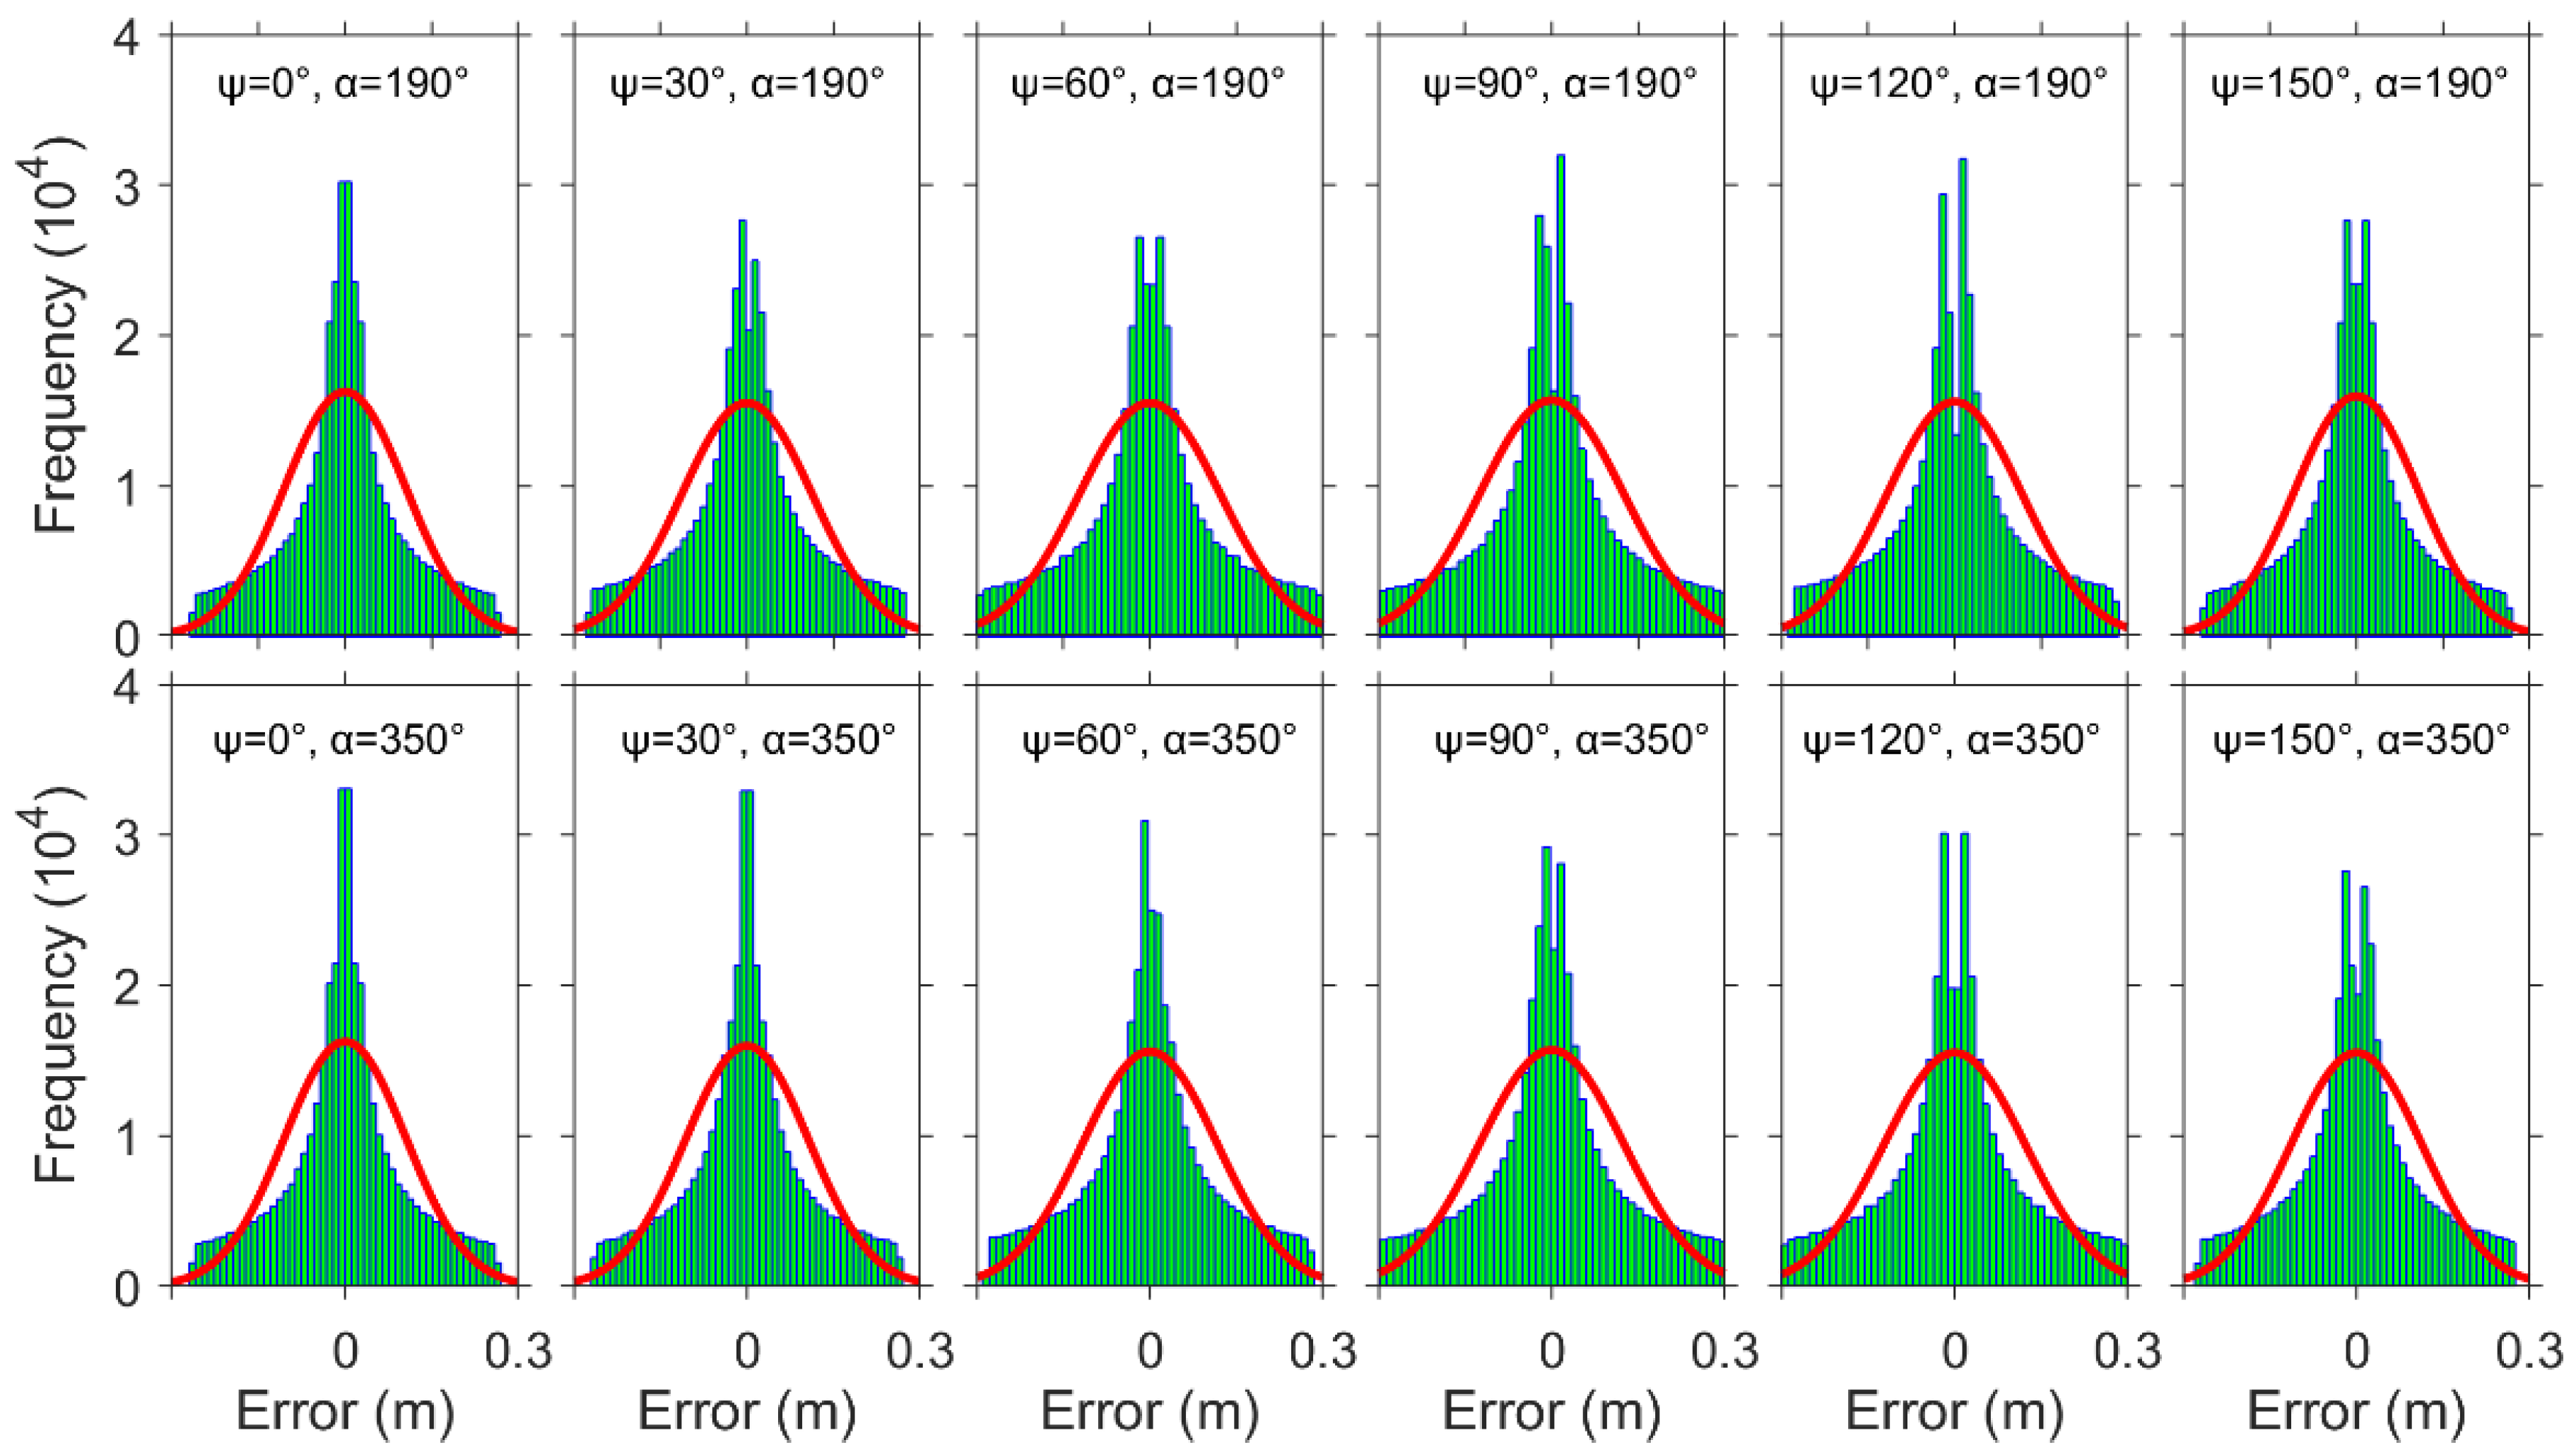
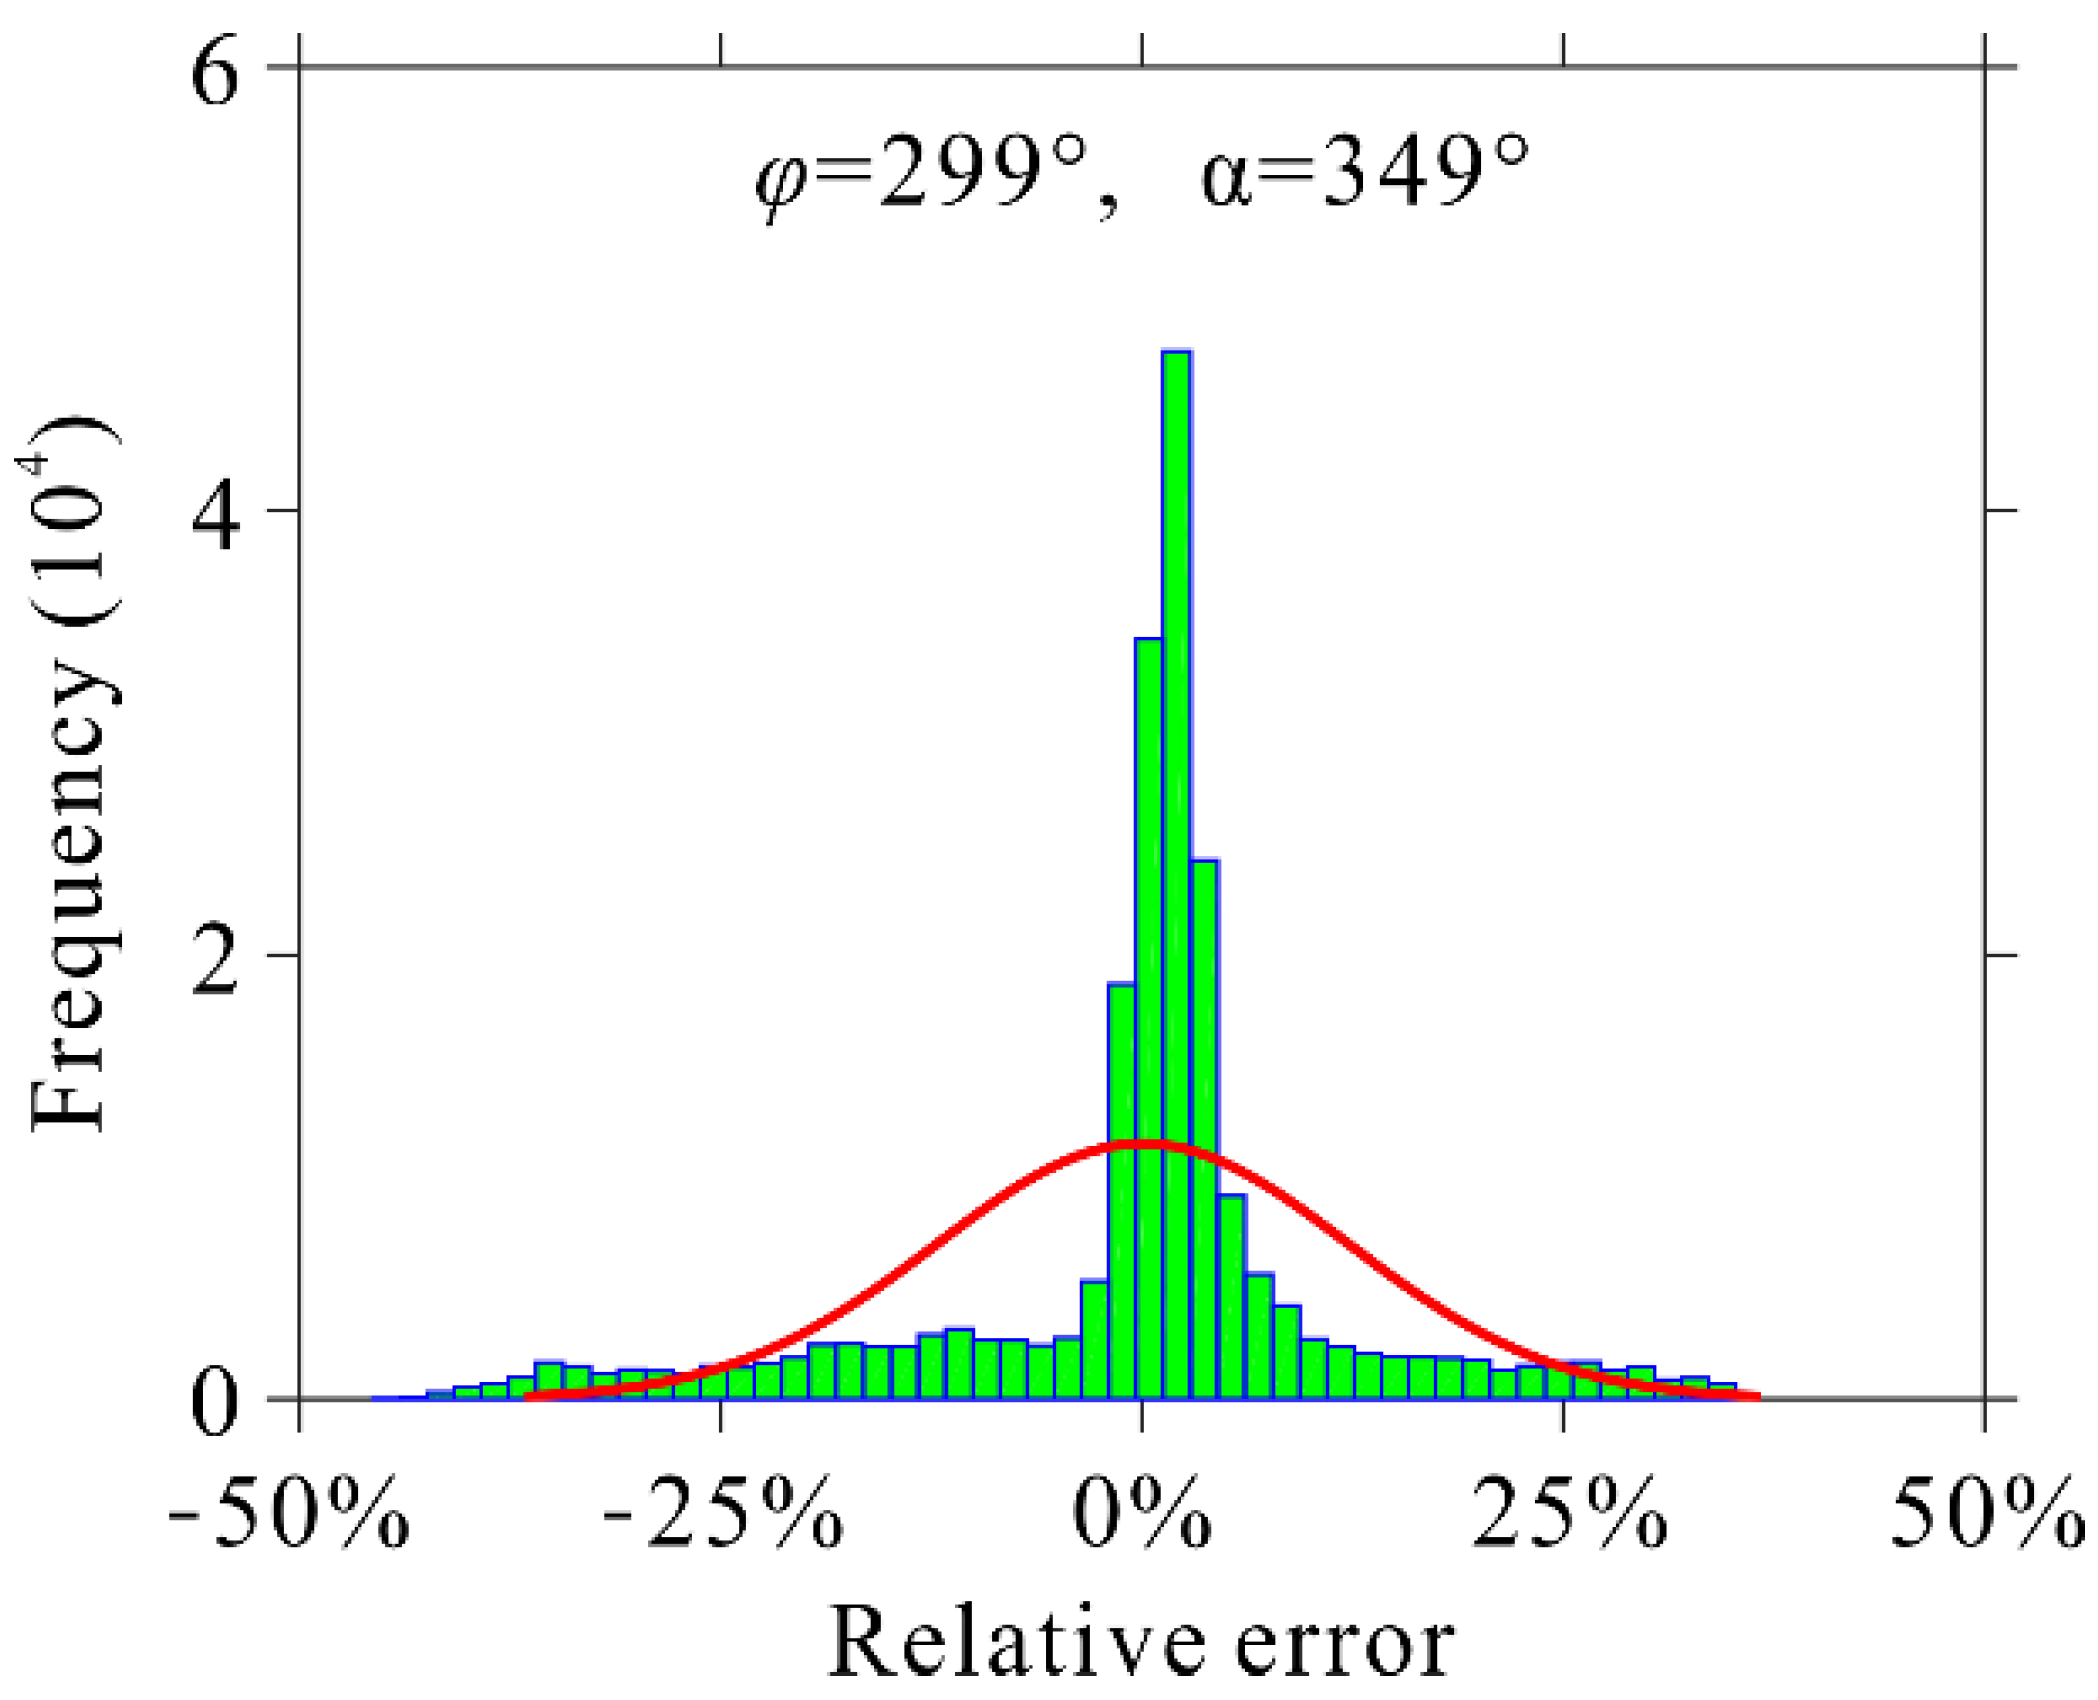
4.1.1. Histogram Analysis of the Errors

The error pattern of the NOV-estimated mining subsidence was firstly analyzed using histogram statistics with simulated datasets. Specifically, we first simulated the 3D displacements (see Figure 3) caused by six simulated working panels using the probability integral method (PIM, a widely-used mathematical model in mining subsidence engineering) [32,33]. The mining width, length, thickness, and depth of the six simulated working panels are the same (i.e., 200 m, 300 m, 2 m, and 500 m, respectively). However, the mining directions (the angle between the mining direction and the north direction, which is denoted by φ ) of the six simulated working panels were 0°, 30°, 60°, 90°, 120°, and 150°, respectively (marked by black arrows in Figure 3). Then, the simulated 3D displacements were projected onto the ascending (i.e., θ = 38 ° and α = 190 ° ) and descending (i.e., θ = 38 ° and α = 350 ° ) LOS directions of the PALSAR-1 sensor (in StripMap mode). Finally, the NOV method was utilized to estimate mining subsidence from the simulated LOS displacements and the presented pixel-wise method was applied to assess the errors of the NOV-estimated mining subsidence (see Figure 4).
Figure 5 plots the histograms of the errors of the NOV-estimated mining subsidence, with respect to the varied mining directions and the flight angles (ascending or descending). As is observed from Figure 5, the errors of the NOV-estimated mining subsidence approximately follow a normal distribution with a mean of zero (marked by the red solid lines) and the STDs from 0.10 m to 0.12 m, with respect to the varied mining directions or flight angles. This fact was validated using the Z-test, which is a statistical test for the null hypothesis that the tested samples come from a normal distribution [34]. This result indicates that the errors of the NOV-estimated mining subsidence are not spatially heterogeneous; that is, nearly half of the NOV-estimated subsidence in the subsidence region would be under-estimated and the remaining half would be over-estimated.
Figure 6 shows the histogram of the assessed relative errors of the NOV-estimated mining subsidence (using Equation (11)) over the region of interest over the Huaibei coalfield. The areas where the subsidence was less than 0.03 m (i.e., three times the STD of the differences between the “real” and assessed errors) were masked out before the histogram statistics were performed. The red curve in Figure 6 shows the fitted frequency of a normal distribution, which does not show a good agreement with the real frequency. The possible reason for this is likely due to the more complex error components (e.g., uncertainties of LOS displacements and the error assessment method) and displacement patterns in the real cases compared to the simulated ones.

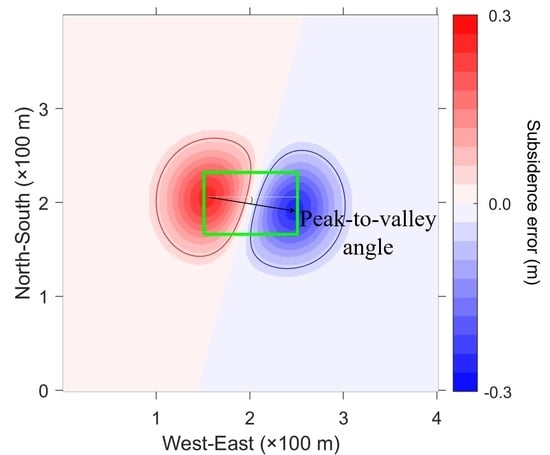
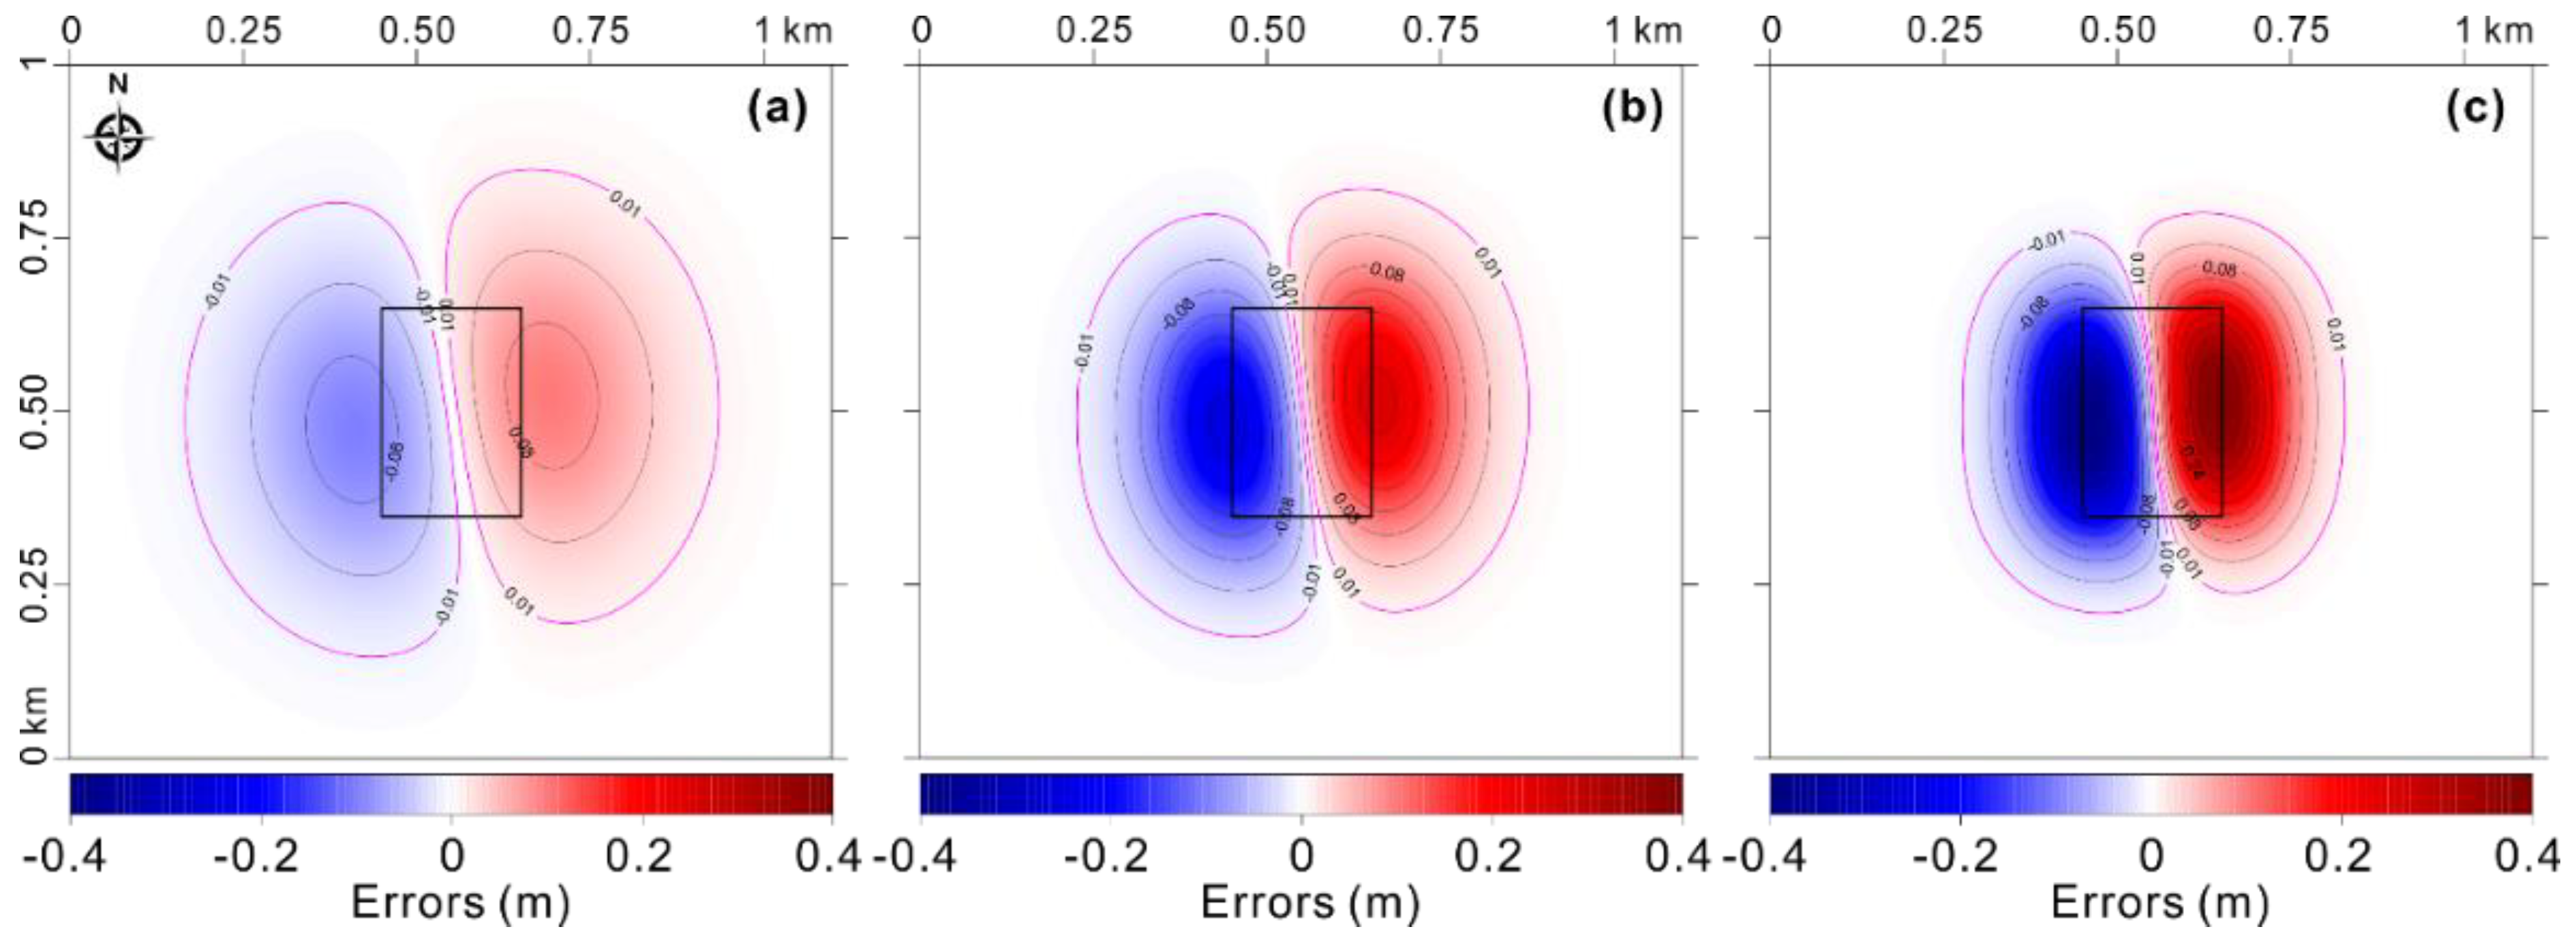
4.1.2. Spatial Pattern of the Errors

As can be visually observed from the error maps of NOV-estimated mining subsidence (e.g., see Figure 1d and Figure 4), the errors are spatially auto-correlated. This is expected due to the following factors. As stated in Section 2.2, the errors of NOV-estimated mining subsidence depend on the geometry of SAR imaging, uncertainties of InSAR LOS displacements, and 3D mining displacements. Consequently, for a certain mining area where SAR image series and InSAR processing methods are selected, the errors of NOV-estimated mining subsidence should theoretically be auto-correlated in space because of the spatial correlation of 3D mining displacements.
As is shown in Figure 1d and Figure 4, there were two areas where mining subsidence is under-estimated (positive values) and over-estimated (negative values) by the NOV method, respectively. For an LEO descending SAR imaging view ( α 190 ° ), the under-estimated and over-estimated errors of the NOV-estimated subsidence are primarily distributed in the northwest “peak” (positive values) and the southeast “valley” (negative values), respectively. On the other hand, for an LEO ascending SAR imaging view ( α 350 ° ), the under-estimated and over-estimated errors of the NOV-estimated subsidence are primarily distributed in the northeast “peak” and the southwest “valley”, respectively. In summary, the errors of the NOV-estimated mining subsidence approximately follow a “peak-to-valley” shape.
It is also can be found in Figure 4 that there exist two extrema (i.e., the highest and lowest errors), and their geolocations were changed with respect to underground mining directions. For the sake of the following analysis, we refer to the angle between the line of the peak summit to the valley bottom and the east direction (positive clockwise, and vice versa) as the “peak-to-valley angle”. Figure 7 plots the peak-to-valley angles of the NOV-estimated subsidence errors with respect to the changes in underground mining directions from 0° to 180° (i.e., φ = 0 180 ° ). As is seen, the absolute values of the peak-to-valley angles varied in the ranges of 5° to 15° for the LEO ascending (clockwise from the east) and descending (anti-clockwise from the east) SAR orbits, when the underground mining direction changes from 0° to 180°. In summary, the errors of the NOV-estimated mining subsidence spatially follow a “peak-to-valley” shape with peak-to-valley angles from 5° to 15° (for LEO ascending view) and −5° to −15° (for LEO descending view).

4.2. Impact Factors on the NOV-Estimated Subsidence Errors

In this section, the factors on the error magnitudes of the NOV-estimated mining subsidence were qualitatively discussed. As analyzed in Section 2.2, the errors of the NOV-estimated subsidence theoretically depend on the InSAR parameters (i.e., SAR imaging view and the uncertainty of InSAR-measured LOS displacements) and the 2D horizontal movements d e and d n from which, the parameters of SAR imaging views (i.e., θ and α ) can be readily obtained from the head files of SAR images. Meanwhile, the uncertainties of InSAR LOS displacements can be empirically assessed by interferometric coherence [7]. According to Peng [35], for the same underground mining geometry, surface 2D horizontal movements in the west–east and north–south directions are mainly related to the lithology of rock strata overlying underground mining. Hence, we discussed the influence of SAR imaging views, interferometric coherence, and the lithology of overlying rock strata on the errors of the NOV-estimated mining subsidence.

4.2.1. Influence of Interferometric Coherence

The standard deviation of InSAR LOS displacement (namely δ los ) can be empirically expressed as [36,37]
δ los λ 4 π γ 1 | γ | 2 2 N
if other error components of InSAR (e.g., due to orbital inaccuracy, atmospheric phase screen, and phase unwrapping) were reasonably mitigated, where γ denotes interferometric coherence, N is the number of independent pixels, and λ represents the wavelength of the SAR sensor. Figure 8 shows the relationship of the error of the NOV-estimated subsidence with respect to interferometric coherence (i.e., using δ l o s sec θ based on Equation (12)), where the involved parameters were designated as γ = 0.1 1.0 , θ = 20 55 , λ = 0.056   m (C band) and N = 6 . Note that, the 2D horizontal movements were assumed to be zeros (i.e., d e = 0   m and d n = 0   m ) for the analysis of the influence of interferometric coherence only.
As can be observed from Figure 8, for a fixed incidence angle, the error of the NOV-estimated subsidence exponentially climbs to the peak of about 2.3 cm, with a linear decrease of interferometric coherence from 1 to 0.1. This is expected because of the fact that the relationship between the uncertainties of InSAR LOS displacements and interferometric coherence is a monotone decreasing function (see Equation (12)); that is, the larger the coherence is, the smaller the uncertainty is, and vice versa.

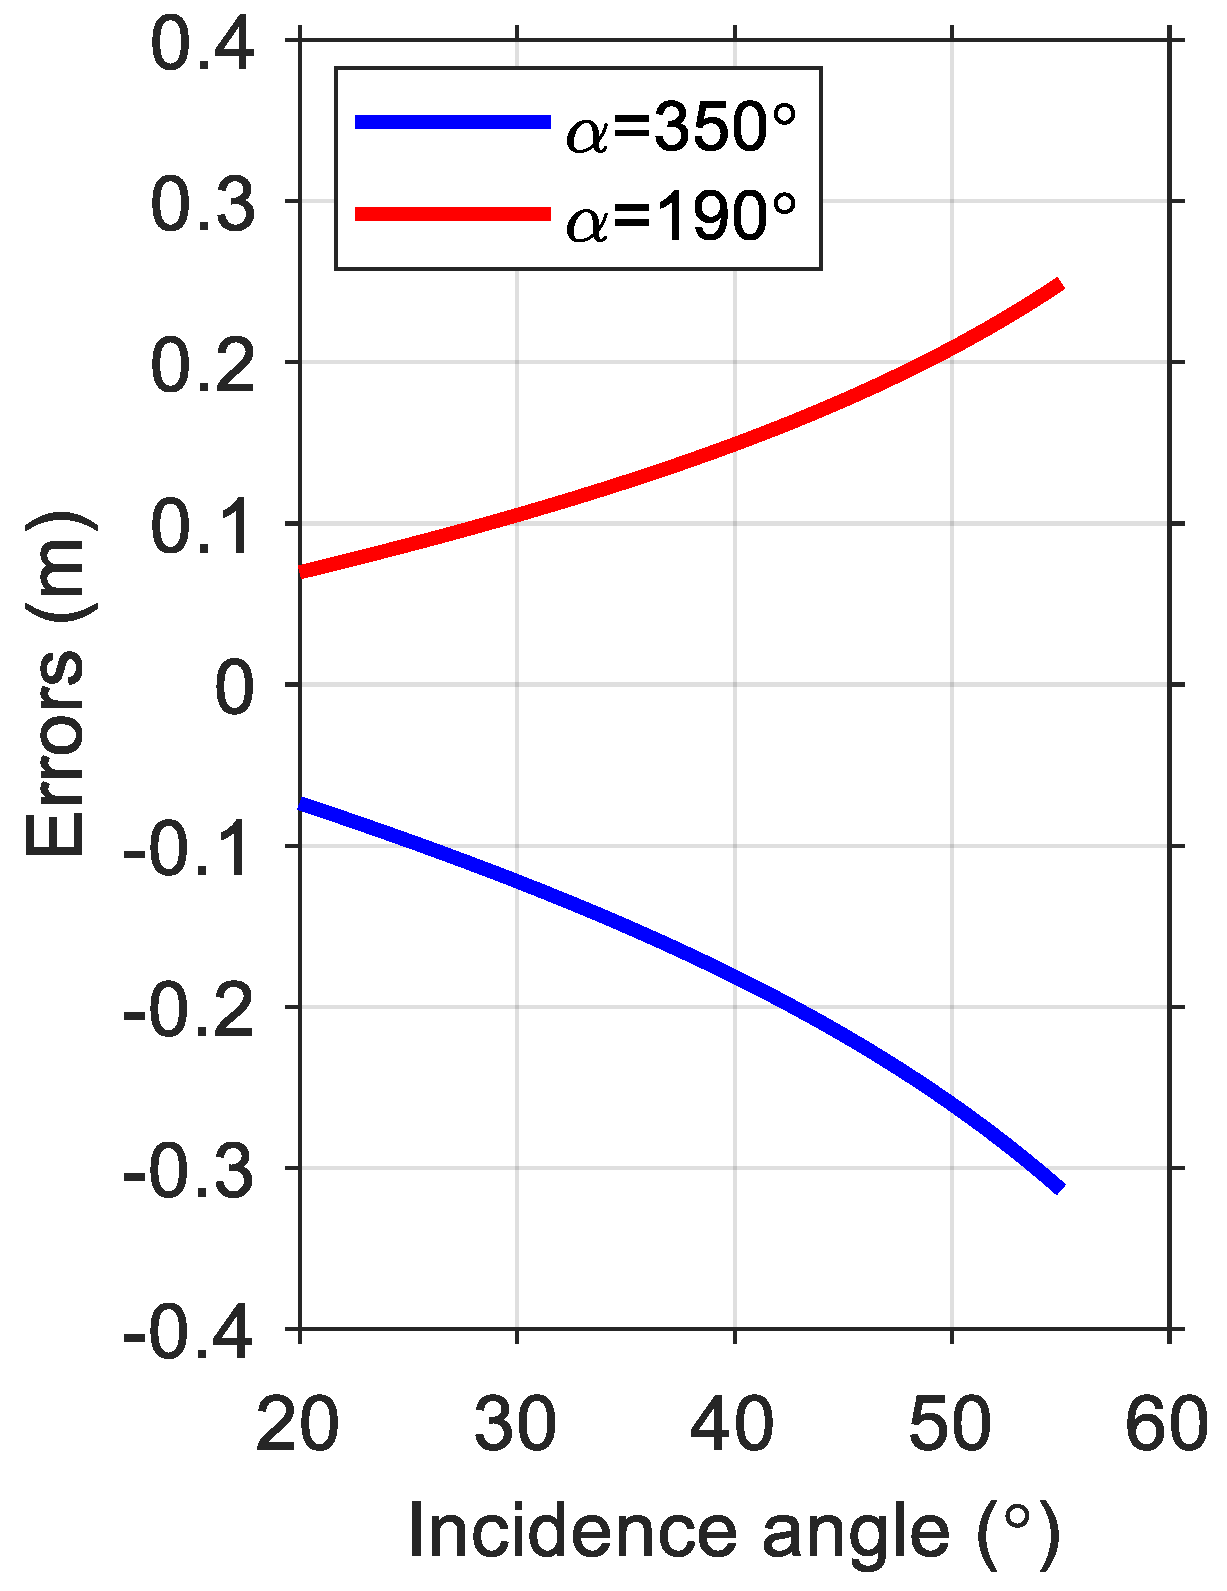
4.2.2. Influence of SAR Imaging Views

The current LEO SAR satellites usually fly along near-polar orbits with a fixed flight angle of α 350 ° for ascending and α 190 ° for descending configurations. In addition, the incidence angles of the current LEO SAR sensors are usually variable in the range of θ = 20 ~ 55 ° . Figure 9 plots an example of the errors of the NOV-estimated subsidence with respect to the imaging view configuration of the current SAR sensors (i.e., α 350 ° or 190 ° and θ = 20 ~ 55 ° ) using Equation (5). In which, the error of InSAR LOS displacements was given by δ los = 0.01   m , and the 2D horizontal movements were designated as d e = 0.2   m and d n = 0.2   m , respectively.
As is seen in Figure 9, the absolute error of the NOV-estimated subsidence nonlinearly increases from 0.07 m to the maximum of 0.31 m, with the increase of the incidence angles from 20° to 55°. This is expected because of the following reason. As can be seen from Equations (5)–(7), the two error sources of the NOV-estimated mining subsidence, i.e., δ L = δ los sec θ and δ H = tan θ ( cos α d e + sin α d n ) , are all related to the incidence angle, in which, the incidence angle-related propagation coefficients of these two error sources (i.e., sec θ and tan θ ) are all monotonically increasing in the common range of the incidence angles from 20° to 55°. This result suggests that, for the same error level of InSAR LOS displacements and the same 2D horizontal movements, the larger the incidence angles of SAR sensors are, the larger the error of the NOV-estimated subsidence is, and vice versa.

4.2.3. Influence of the Lithology of Overlying Rock Strata

Besides the uncertainties of InSAR LOS displacements and SAR imaging views, 2D horizontal movements have a significant influence on the error of the NOV-estimated mining subsidence. In theory, ground surface displacements caused by underground mining primarily depend on the mining geometry (e.g., mining size, depth, width, thickness) and the lithology of overlying rock strata [38]. Since the mining geometry has a significant difference, even in the same mining area, we did not discuss its influence on the error of the NOV-estimated mining subsidence in this paper. Although the lithology of overlying rock strata is also different in different mining areas, it can be roughly classified into three categories, i.e., soft, medium, and hard. The composites of the classified three categories of overlying rock strata can be found in the State Bureau of Coal Industry of China [39]. In addition, the main parameter ranges of the PIM relating to these three categories of overlying rock strata (i.e., subsidence factor q and tangent of major influence angle tanβ) are listed in Table 1 [39]. This allows us to analyze the influence of the lithology of overlying rock strata on the error of the NOV-estimated mining subsidence.
More specifically, we first took the means of the subsidence factor q and tangent of major influence angle tanβ from their common ranges under the three categories of overlying rock strata; that is, q = 0.4 and tanβ = 1.5 for the hard rock, q = 0.7 and tanβ = 2.2 for the medium rock, and q = 0.9 and tanβ = 2.9 for the soft rock, respectively. The error simulation and assessment procedure, described in Section 4.1.1, was performed to assess the errors of the NOV-estimated mining subsidence under the different lithology of overlying rock strata. Figure 10 shows an example of the assessed errors associated with an underground working panel with an advancing direction of φ = 90 ° (the same as the one described in Section 4.1.1). Table 2 lists two indicators that are used to qualitatively analyze the influence of the lithology of overlying rock strata on the errors of the NOV-estimated mining subsidence in this case, in which, the influence area is defined as the area where the errors of the NOV-estimated mining subsidence are larger than 0.01 m (the common level of InSAR displacement uncertainties). The STDs denote the standard deviations of the errors over the influence area.
It can be seen from Table 2 and Figure 10 that the influence areas of the errors of the NOV-estimated mining subsidence gradually decrease when the lithology of overlying rock strata changes from hard to soft (e.g., from 0.40 km2 to 0.26 km2 in this case). On the other hand, the STDs of the NOV-estimated subsidence errors dramatically increase with the changes from hard to soft (e.g., 0.05 m to 0.17 m in this case). This result implies that, for the same mining geometry, larger errors distributed in a smaller area would result in the NOV-estimated mining subsidence for the soft overlying rock strata, compared with those under the hard overlying rock strata. Consequently, more attention should be paid to scientifically using the NOV-estimated mining subsidence, especially in a mining area with soft overlying rock strata, due to the resulting large errors.

4.3. Influence of the Error of the NOV-Estimated Mining Subsidence on Its Typical Uses

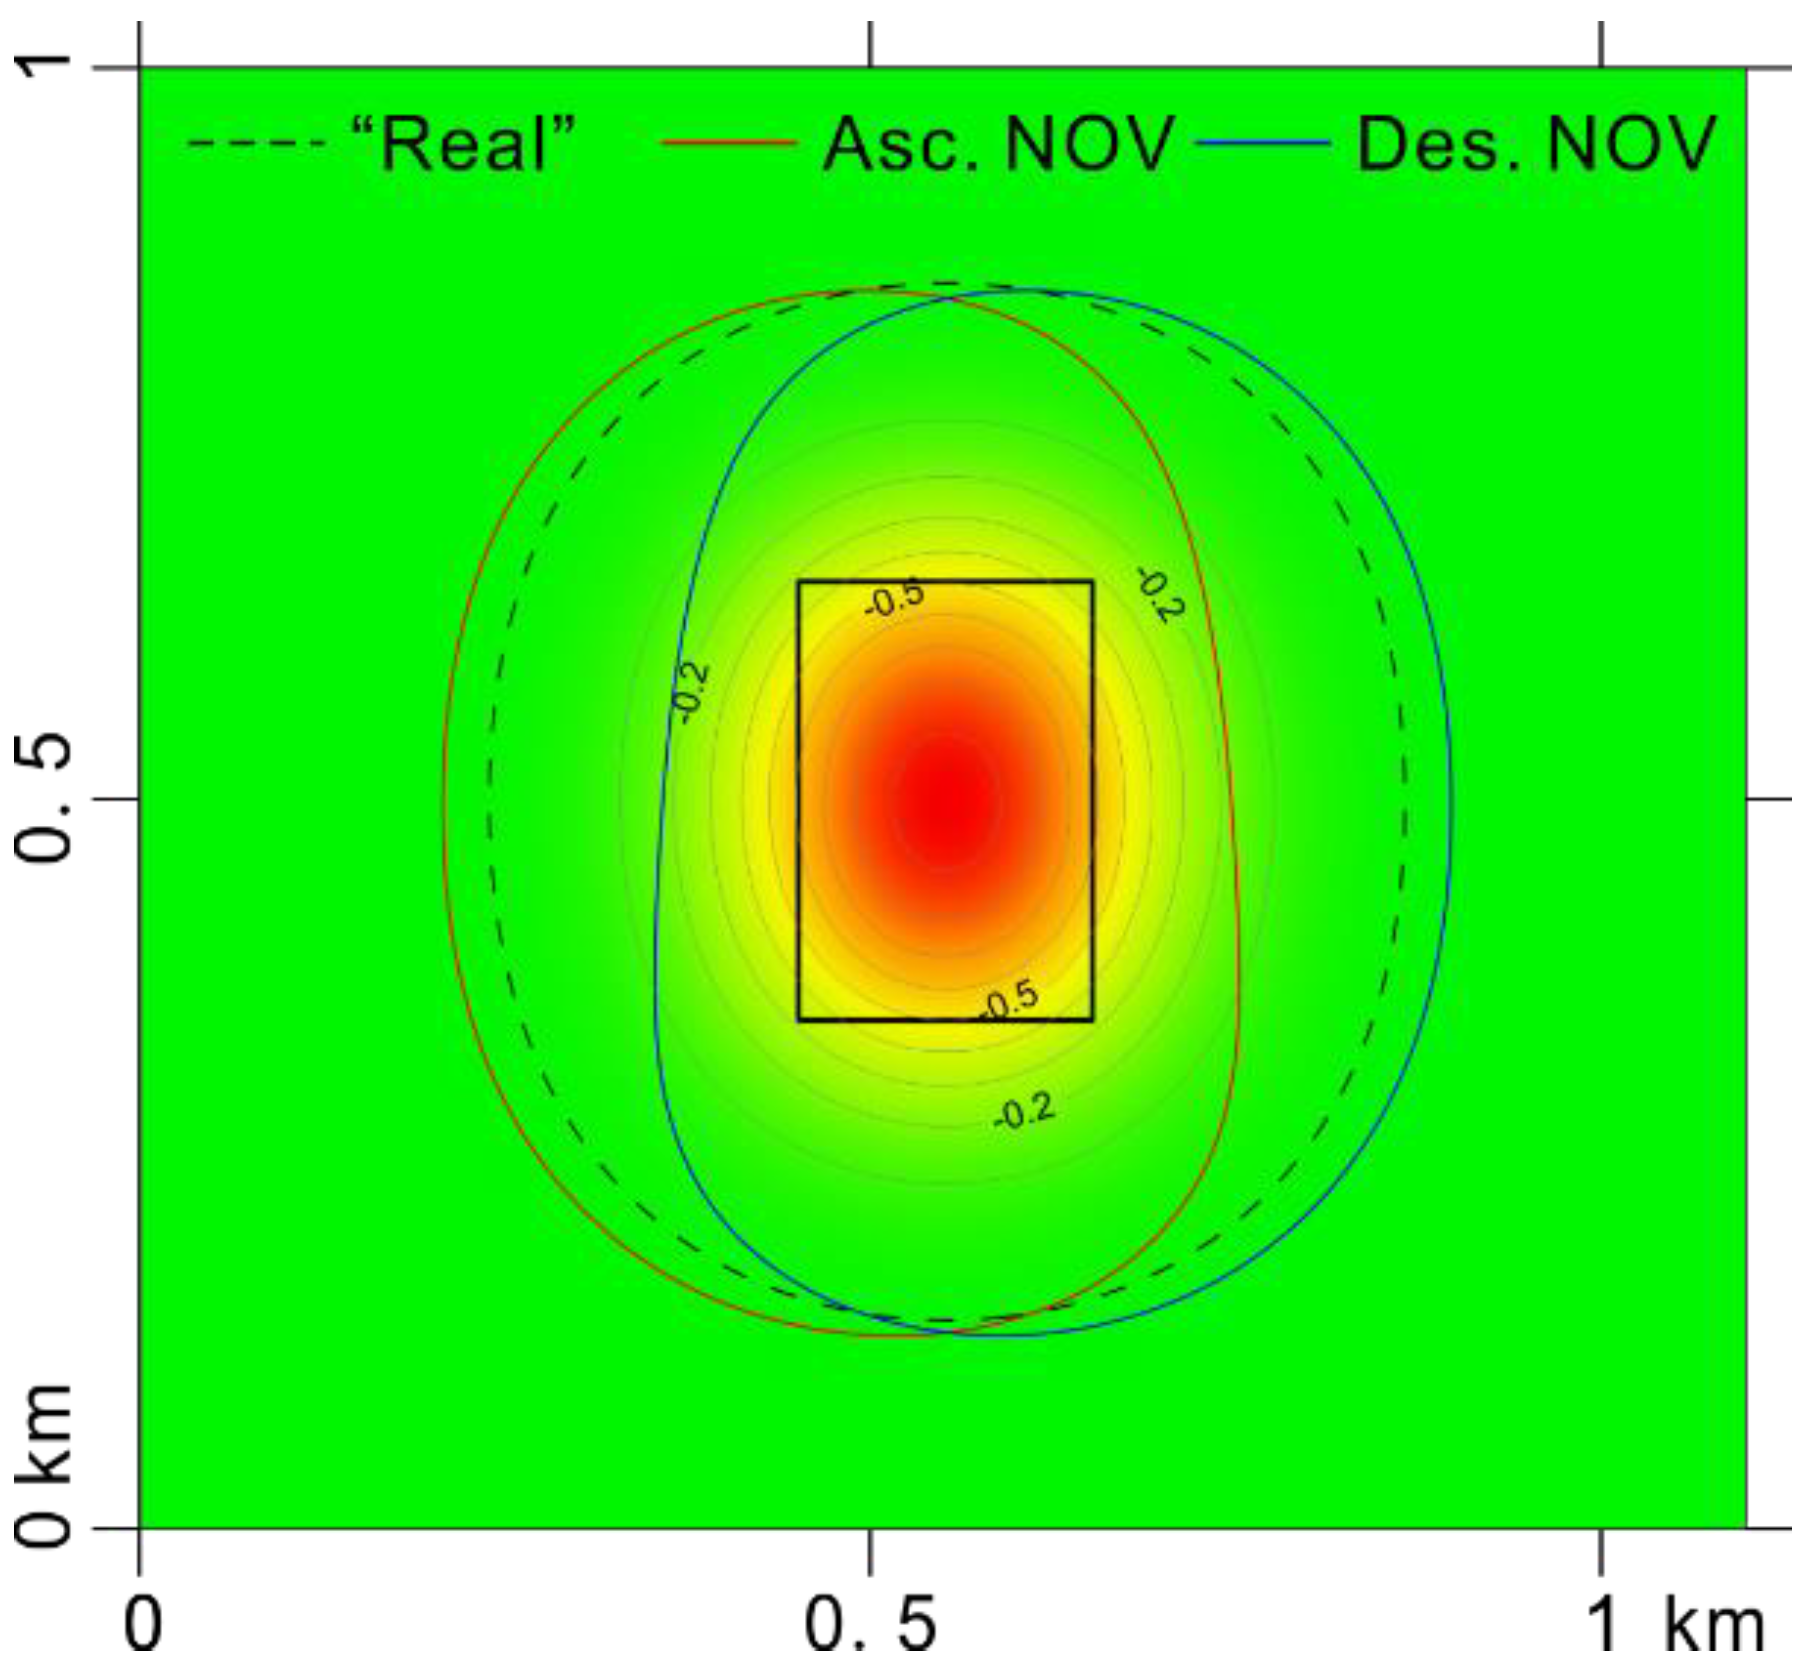
4.3.1. Influence on the Boundary Delimitation of Mining Subsidence

Delimitating the boundary of ground surface subsidence is a typical use of subsidence observations [35]. To intuitively demonstrate the influence of the error of the NOV-estimated mining subsidence on the boundary delimitation, we projected the simulated 3D displacements caused by an underground working panel with φ = 90° (see Figure 3) onto the descending (i.e., α = 190°) and ascending (i.e., α = 350°) SAR LOS directions (θ = 38°), respectively. The NOV method was then applied to estimate mining subsidence from the projected ascending and descending LOS displacements, respectively. Finally, the subsidence boundary (generally defined as the area where surface subsidence is larger than 0.01 m [30]) was delimitated from the ascending and descending NOV-estimated mining subsidence estimates (see Figure 11).
As is shown in Figure 11, compared with the “real” boundary (black dashed line), all of the delimitated boundaries that are based on the ascending (red line) and descending (blue line) NOV-estimated mining subsidence shrank (e.g., about 8% in this case). More specifically, for the ascending SAR imaging view, the delimitated boundary shifted to the west–south direction and insignificantly shrank in the east–north region, with respect to the “real” boundary. This is mainly due to the “peak-to-valley” error pattern of the NOV-estimated mining subsidence; that is, for the ascending SAR imaging view, the NOV-retrieved subsidence is under- and over-estimated in the regions of the north–east and south–west peaks, respectively. A similar shift and shrink phenomenon of the delimitated boundary (but in different regions and different directions) can be observed for the descending NOV-estimated mining subsidence.

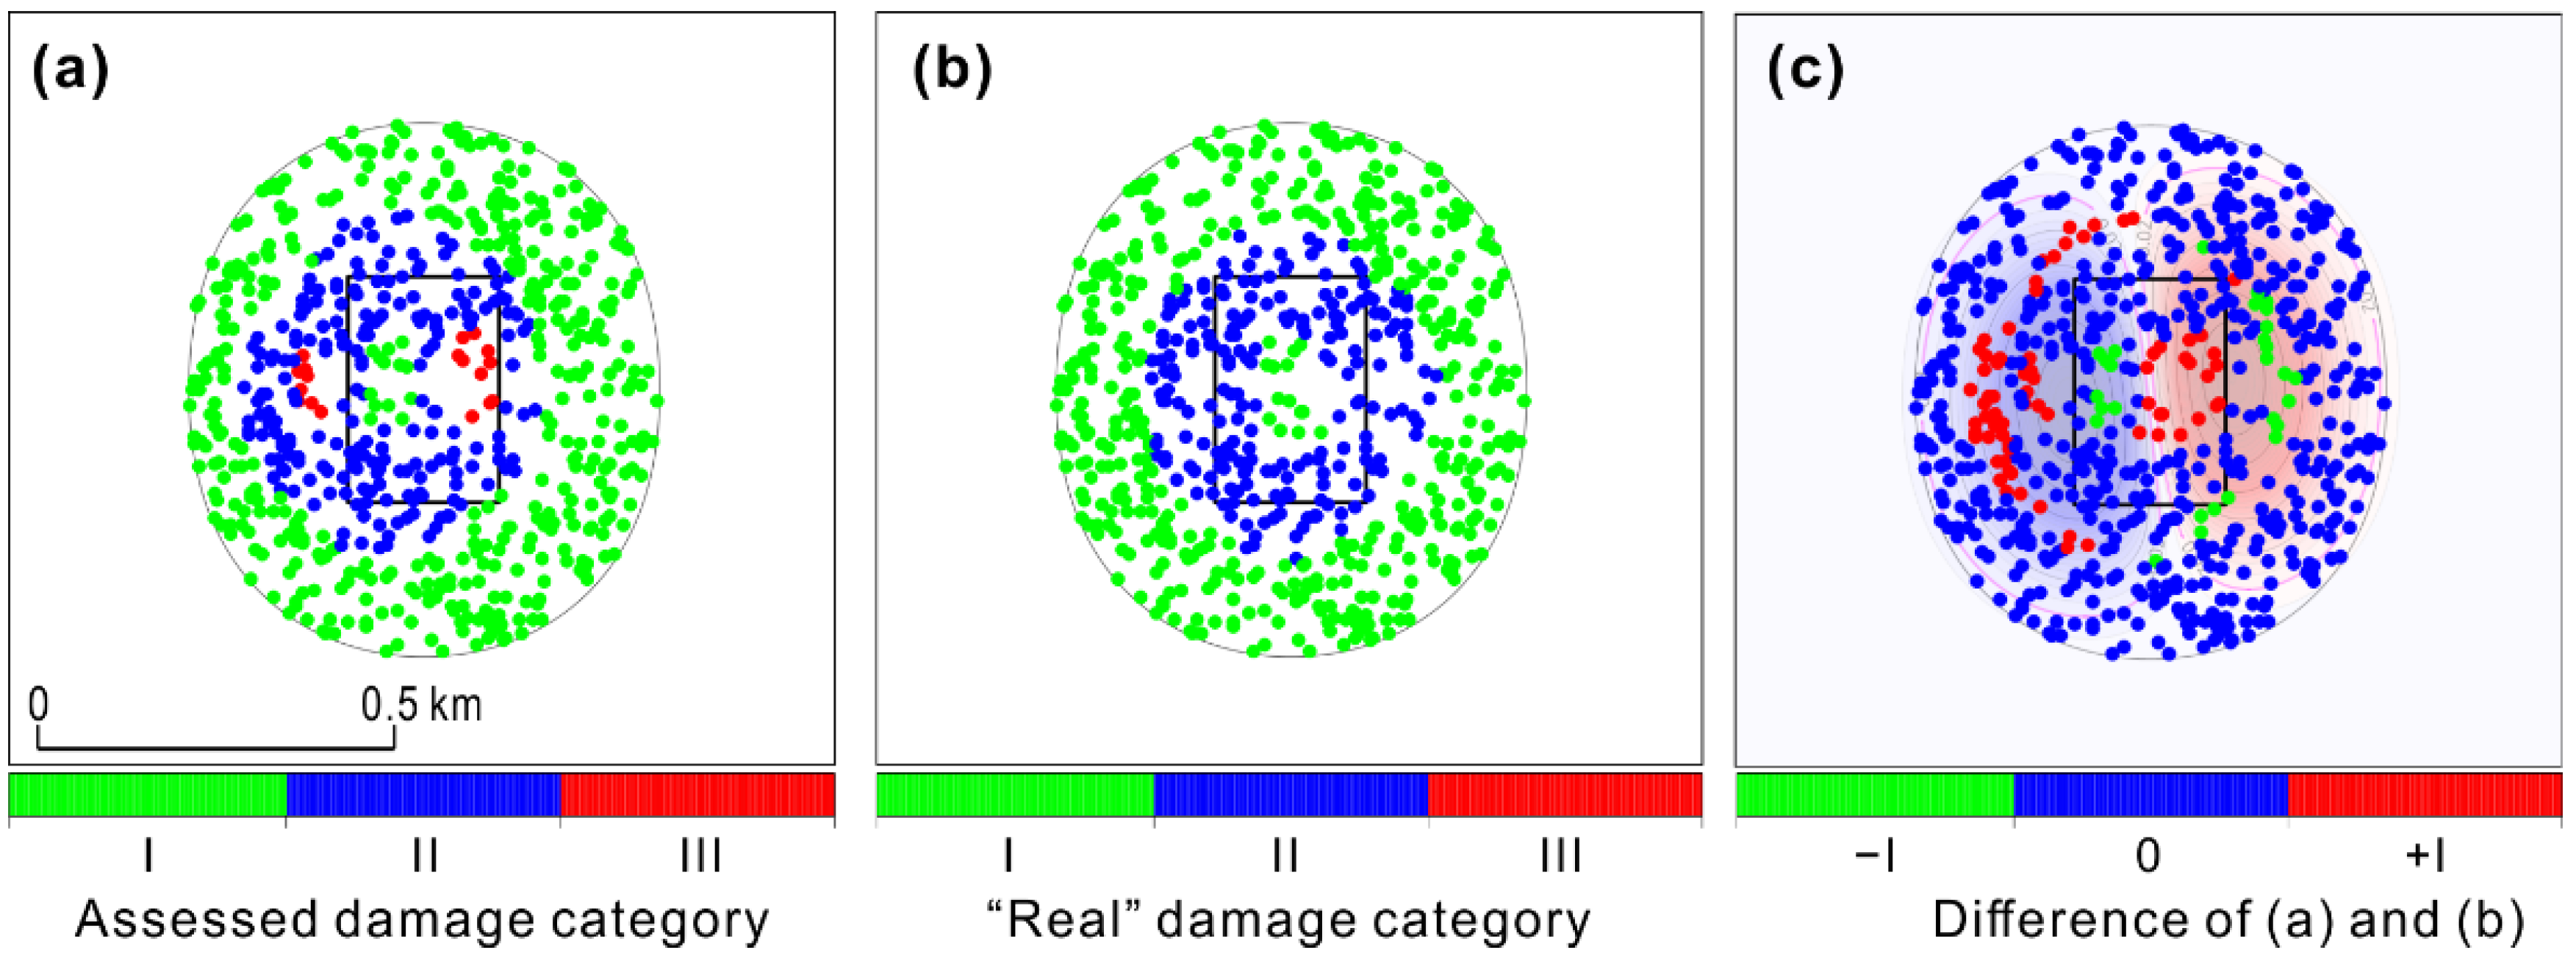
4.3.2. Influence on the Assessment of Mining-Induced Building Damage Risk

Another typical application of mining subsidence observations is used to assess the categories of mining-induced damage to buildings [40]. In this section, a simulation analysis was conducted to intuitively show the influence of the error of the NOV-estimated mining subsidence on the assessment of building damage risk, in which, the simulated 3D mining displacements and the ascending NOV-estimated subsidence were the same as those in Section 4.1.1. Then, we assumed that 660 buildings (marked by the circles in Figure 12a) were randomly located in the simulated mining subsidence basin (the boundary is denoted by a gray line in Figure 12). Finally, the damage categories of the assumed 660 buildings caused by the simulated underground extraction (see black solid rectangle) were then assessed on the basis of the ascending NOV-estimated mining subsidence. Readers can refer to He, et al. [32] for more details about the assessment procedure. For the sake of comparison, the “real” damage categories assessed by the simulated subsidence are presented in Figure 12b. Figure 12c plots the differences between the assessed and “real” building damage categories.
The results show that the damage categories of 72 and 28 buildings are overestimated (i.e., +I in Figure 12a) and underestimated (i.e., −I in Figure 12a), respectively. In other words, the damage risks of 100 buildings, representing 15.2% of all 660 buildings, are inaccurately assessed due to the errors of the NOV-estimated subsidence. In fact, one can observe from Figure 12c that those buildings with inaccurately assessed damage risks are located in the error clustering peak and valley of the NOV-estimated mining subsidence (marked by the blue and red ellipses in the base map in Figure 12c), respectively. This result suggests that the NOV-estimated subsidence located in the error peak and valley should be used prudently in practice.

5. Conclusions

In this paper, we systematically analyzed the error of NOV-estimated mining subsidence from InSAR observations due to neglecting 2D horizontal movements with simulated and real datasets. The results indicate that the errors can reach up to 45.1% of the maximum subsidence in this study. In addition, two areas where mining subsidence was under-estimated (“peak” errors) and over-estimated (“valley” errors), respectively, were observed in the mining subsidence basin, and the absolute angles between the summit-to-bottom line and the east direction usually vary from 5° to 15°. For the same InSAR datasets and underground mining geometry, the errors of the NOV-estimated subsidence primarily depend on the lithology of overlying rock strata; that is, the harder the lithology is, the smaller the error magnitude is but the wider the error area is, and vice versa. Therefore, prior to the use of NOV-estimated mining subsidence, it is preferable to approximately assess the errors due to neglecting 2D horizontal movements (e.g., using the presented method in this study if possible), in order to scientifically guide the use of subsidence observations.
Note that the presented pixel-wise method for assessing the errors of the NOV-estimated mining subsidence relies on three in situ parameters (e.g., mining depth, angle of major influence, and constant of horizontal movement) [29]. This may limit the use of the presented method if these three parameters are unavailable. In addition, the above-analyzed patterns of the NOV-estimated mining subsidence generally hold well over those mining areas where nearly horizontal mineral seams are extracted (very common currently), since the assisted SIP and PIM methods work well in this scenario. Nevertheless, as suggested by Dai et al. [41] and Franks et al. [42], several special mining situations (e.g., extracting steep inclined mineral seams) or geological conditions (rugged surface terrain) would cause significant discrepancies with the error pattern analyzed based on the SIP and PIM. Future research efforts should be devoted to address this issue.

Author Contributions

All authors participated in editing and reviewing the manuscript. Conceptualization, data curation, investigation, methodology, and original draft, Z.M. and Z.Y.; formal analysis, validation, and visualization, Z.M.; methodology, funding acquisition, and writing—review and editing, Z.Y. and X.X. All authors have read and agreed to the published version of the manuscript.

Funding

This work was partly supported by the National Natural Science Foundation of China (No. 41904005), the Natural Science Foundation of Hunan Province, China (Grant No. 2020JJ4699), the Research Foundation of Education Bureau of Hunan Province, China (Grant No. 20K134), the Science and Technology Plan of Department of Natural Resources of Hunan Province, China (2021-17), the innovation leading program of Central South University (506030101), and The Research Project of Geological Bureau of Hunan Province (HNGSTP202106).

Institutional Review Board Statement

Not applicable.

Informed Consent Statement

Not applicable.

Data Availability Statement

Not applicable.

Acknowledgments

The authors would like to thank the Japanese Aerospace Exploration Agency (JAXA) for providing the PALSAR images over study areas (Nos. 582 and 1390).

Conflicts of Interest

The authors declare that they have no known competing financial interests or personal relationships that could have appeared to influence the work reported in this paper.

References

  1. Carnec, C.; Delacourt, C. Three years of mining subsidence monitored by SAR interferometry, near Gardanne, France. J. Appl. Geophys. 2000, 43, 43–54. [Google Scholar] [CrossRef]
  2. Gueguen, Y.; Deffontaines, B.; Fruneau, B.; Al Heib, M.; de Michele, M.; Raucoules, D.; Guise, Y.; Planchenault, J. Monitoring residual mining subsidence of Nord/Pas-de-Calais coal basin from differential and Persistent Scatterer Interferometry (Northern France). J. Appl. Geophys. 2009, 69, 24–34. [Google Scholar] [CrossRef]
  3. Ng, A.H.M.; Ge, L.; Du, Z.; Wang, S.; Ma, C. Satellite radar interferometry for monitoring subsidence induced by longwall mining activity using Radarsat-2, Sentinel-1 and ALOS-2 data. Int. J. Appl. Earth Obs. Geoinf. 2017, 61, 92–103. [Google Scholar] [CrossRef]
  4. Paradella, W.R.; Ferretti, A.; Mura, J.C.; Colombo, D.; Gama, F.F.; Tamburini, A.; Santos, A.R.; Novali, F.; Galo, M.; Camargo, P.O. Mapping surface deformation in open pit iron mines of Carajás Province (Amazon Region) using an integrated SAR analysis. Eng. Geol. 2015, 193, 61–78. [Google Scholar] [CrossRef] [Green Version]
  5. Yang, Z.; Li, Z.; Zhu, J.; Yi, H.; Hu, J.; Feng, G. Deriving dynamic subsidence of coal mining areas using InSAR and logistic model. Remote Sens. 2017, 9, 125. [Google Scholar] [CrossRef] [Green Version]
  6. Ilieva, M.; Polanin, P.; Borkowski, A.; Gruchlik, P.; Smolak, K.; Kowalski, A.; Rohm, W. Mining deformation life cycle in the light of InSAR and deformation models. Remote Sens. 2019, 11, 745. [Google Scholar] [CrossRef] [Green Version]
  7. Hanssen, R.F. Radar Interferometry: Data Interpretation and Error Analysis; Springer Science & Business Media: New York, NY, USA, 2001. [Google Scholar]
  8. Dong, L.; Wang, C.; Tang, Y.; Tang, F.; Zhang, H.; Wang, J.; Duan, W. Time series InSAR three-dimensional displacement inversion model of coal mining areas based on symmetrical features of mining subsidence. Remote Sens. 2021, 13, 2143. [Google Scholar] [CrossRef]
  9. Fialko, Y.; Sandwell, D.; Simons, M.; Rosen, P. Three-dimensional deformation caused by the Bam, Iran, earthquake and the origin of shallow slip deficit. Nature 2005, 435, 295–299. [Google Scholar] [CrossRef]
  10. Samsonov, S.; Dille, A.; Dewitte, O.; Kervyn, F.; d’Oreye, N. Satellite interferometry for mapping surface deformation time series in one, two and three dimensions: A new method illustrated on a slow-moving landslide. Eng. Geol. 2020, 266, 105471. [Google Scholar] [CrossRef]
  11. Wang, Z.; Yu, S.; Tao, Q.; Liu, G.; Hao, H.; Wang, K.; Zhou, C. A method of monitoring three-dimensional ground displacement in mining areas by integrating multiple InSAR methods. Int. J. Remote Sens. 2018, 39, 1199–1219. [Google Scholar] [CrossRef]
  12. Chen, B.; Li, Z.; Yu, C.; Fairbairn, D.; Kang, J.; Hu, J.; Liang, L. Three-dimensional time-varying large surface displacements in coal exploiting areas revealed through integration of SAR pixel offset measurements and mining subsidence model. Remote Sens. Environ. 2020, 240, 111663. [Google Scholar] [CrossRef]
  13. Alex, H.-M.N.; Ge, L.L.; Zhang, K.; Li, X.J. Estimating horizontal and vertical movements due to underground mining using ALOS PALSAR. Eng. Geol. 2012, 143, 18–27. [Google Scholar] [CrossRef]
  14. Yang, Z.; Li, Z.; Zhu, J.; Feng, G.; Wang, Q.; Hu, J.; Wang, C. Deriving time-series three-dimensional displacements of mining areas from a single-geometry InSAR dataset. J. Geod. 2018, 92, 15. [Google Scholar] [CrossRef]
  15. Yang, Z.; Zhu, J.; Xie, J.; Li, Z.; Wu, L.; Ma, Z. Resolving 3-D Mining Displacements From Multi-Track InSAR by Incorporating With a Prior Model: The Dynamic Changes and Adaptive Estimation of the Model Parameters. IEEE Trans. Geosci. Remote Sens. 2021, 60, 4504610. [Google Scholar] [CrossRef]
  16. Yang, Z.; Li, Z.; Zhu, J.; Wang, Y.; Wu, L. Use of SAR/InSAR in mining deformation monitoring, parameter inversion, and forward prediction: A review. IEEE Geosci. Remote Sens. Mag. 2020, 8, 71–90. [Google Scholar] [CrossRef]
  17. Liu, D.; Shao, Y.; Liu, Z.; Riedel, B.; Sowter, A.; Niemeier, W.; Bian, Z. Evaluation of InSAR and TomoSAR for monitoring deformations caused by mining in a mountainous area with high resolution satellite-based SAR. Remote Sens. 2014, 6, 1476–1495. [Google Scholar] [CrossRef] [Green Version]
  18. Yuan, M.; Li, M.; Liu, H.; Lv, P.; Li, B.; Zheng, W. Subsidence Monitoring Base on SBAS-InSAR and Slope Stability Analysis Method for Damage Analysis in Mountainous Mining Subsidence Regions. Remote Sens. 2021, 13, 3107. [Google Scholar] [CrossRef]
  19. Diao, X.; Bai, Z.; Wu, K.; Zhou, D.; Li, Z. Assessment of mining-induced damage to structures using InSAR time series analysis: A case study of Jiulong Mine, China. Environ. Earth Sci. 2018, 77, 166. [Google Scholar] [CrossRef]
  20. Li, J.; Gao, F.; Lu, J. An application of InSAR time-series analysis for the assessment of mining-induced structural damage in Panji Mine, China. Nat. Hazards 2019, 97, 243–258. [Google Scholar] [CrossRef]
  21. Chen, D.; Chen, H.; Zhang, W.; Cao, C.; Zhu, K.; Yuan, X.; Du, Y. Characteristics of the residual surface deformation of multiple abandoned mined-out areas based on a field investigation and SBAS-InSAR: A case study in Jilin, China. Remote Sens. 2020, 12, 3752. [Google Scholar] [CrossRef]
  22. Modeste, G.; Doubre, C.; Masson, F. Time evolution of mining-related residual subsidence monitored over a 24-year period using InSAR in southern Alsace, France. Int. J. Appl. Earth Obs. Geoinf. 2021, 102, 102392. [Google Scholar] [CrossRef]
  23. Owczarz, K.; Blachowski, J.J.A.S. Application of DInSAR and Spatial Statistics Methods in Analysis of Surface Displacements Caused by Induced Tremors. Appl. Sci. 2020, 10, 7660. [Google Scholar] [CrossRef]
  24. Holla, L. Ground movement due to longwall mining in high relief areas in New South Wales, Australia. Int. J. Rock Mech. Min. Sci. 1997, 34, 775–787. [Google Scholar] [CrossRef]
  25. Seedsman, R.; Watson, G. Sensitive infrastructure and horizontal ground movements at Newstan Colliery. In Proceedings of the 5th Triennial Conference on Coal Mine Subsidence 2001 Current Practice and Issues, Maitland, NSW, Australia, 26–28 August 2001; pp. 171–179. [Google Scholar]
  26. Samieie-Esfahany, S.; Hanssen, R.; van Thienen-Visser, K.; Muntendam-Bos, A. On the effect of horizontal deformation on InSAR subsidence estimates. In Proceedings of the Fringe 2009 Workshop, Frascati, Italy, 30 November–4 December 2009. [Google Scholar]
  27. Fuhrmann, T.; Garthwaite, M.C. Resolving three-dimensional surface motion with InSAR: Constraints from multi-geometry data fusion. Remote Sens. 2019, 11, 241. [Google Scholar] [CrossRef] [Green Version]
  28. Fialko, Y.; Simons, M.; Agnew, D. The complete (3-D) surface displacement field in the epicentral area of the 1999 Mw7. 1 Hector Mine earthquake, California, from space geodetic observations. Geophys. Res. Lett. 2001, 28, 3063–3066. [Google Scholar] [CrossRef] [Green Version]
  29. Li, Z.; Yang, Z.; Zhu, J.; Hu, J.; Wang, Y.; Li, P.; Chen, G. Retrieving three-dimensional displacement fields of mining areas from a single InSAR pair. J. Geod. 2015, 89, 17–32. [Google Scholar] [CrossRef]
  30. Peng, S.S.; Ma, W.; Zhong, W. Surface Subsidence Engineering; Society for Mining, Metallurgy, and Exploration: Littleton, CO, USA, 1992. [Google Scholar]
  31. Blanco-Sanchez, P.; Mallorquí, J.J.; Duque, S.; Monells, D. The coherent pixels technique (CPT): An advanced DInSAR technique for nonlinear deformation monitoring. In Earth Sciences and Mathematics; Springer: Cham, Switzerland, 2008; pp. 1167–1193. [Google Scholar]
  32. He, G.; Yang, L.; Lin, G. Mining Subsidence Engineering; Press of China University of Mining and Technology: Xuzhou, China, 1991. [Google Scholar]
  33. Yang, Z.; Li, Z.; Zhu, J.; Hu, J.; Wang, Y.; Chen, G. InSAR-based model parameter estimation of probability integral method and its application for predicting mining-induced horizontal and vertical displacements. IEEE Trans. Geosci. Remote Sens. 2016, 54, 4818–4832. [Google Scholar] [CrossRef]
  34. Casella, G.; Berger, R.L. Statistical Inference; Duxbury: Pacific Grove, CA, USA, 2002; Volume 2. [Google Scholar]
  35. Peng, S. Surface Subsidence Engineering: Theory and Practice; CSIRO Publishing: Melbourne, VIC, Australia, 2020. [Google Scholar]
  36. Pepe, A.; Calò, F. A review of interferometric synthetic aperture RADAR (InSAR) multi-track approaches for the retrieval of Earth’s surface displacements. Appl. Sci. 2017, 7, 1264. [Google Scholar] [CrossRef] [Green Version]
  37. Lopez-Martinez, C.; Pottier, E.J.I.T.o.G.; Sensing, R. On the extension of multidimensional speckle noise model from single-look to multilook SAR imagery. IEEE Trans. Geosci. Remote Sens. 2007, 45, 305–320. [Google Scholar] [CrossRef]
  38. Reddish, D.; Whittaker, B. Subsidence: Occurrence, Prediction and Control; Elsevier: Amsterdam, The Netherlands, 2012. [Google Scholar]
  39. State Bureau of Coal Industry of China. Regulations on Mining and Coal Pillar Design under Building, Water Body, Railway and Main Shaft; China National Coal Group: Beijing, China, 2000. [Google Scholar]
  40. Boone, S.J. Ground-movement-related building damage. J. Geotech. Eng. 1996, 122, 886–896. [Google Scholar] [CrossRef]
  41. Dai, H.; Wang, J.; Cai, M.; Wu, L.; Guo, Z. Seam dip angle based mining subsidence model and its application. Int. J. Rock Mech. Min. Sci. 2002, 39, 115–123. [Google Scholar] [CrossRef]
  42. Franks, C.; Geddes, J. Subsidence on steep slopes due to longwall mining. Int. J. Mining Geolog. Eng. 1986, 4, 291–301. [Google Scholar] [CrossRef]
Figure 1. (a) InSAR-derived LOS displacements over the Qianyingzi coal-mining area after interpolation over low-coherent areas; (b) NOV-estimated mining subsidence; (c) Reference subsidence solved by the SIP method; (d) Assessed errors of the NOV-estimated mining subsidence using the presented pixel-wise method. The black crosses in (d) denote the geographic locations of in situ observation points for the following accuracy validation. The background map is the optical image over the region of interest.
Remotesensing 14 01963 g001
Figure 2. Left: Comparison between the SIP- and NOV-estimated subsidence with precise leveling observations of subsidence along the profile AB (34 points, marked by black crosses in Figure 1d). Right: Scatter plot between the “real” (x-axis) and the assessed errors (y-axis) of the NOV-estimated mining subsidence at 34 field points. The black dash line implies the perfect scenario in which both errors are equal. The magenta dashed lines denote two times the STD of the assessed errors with respect to the “real” ones.
Remotesensing 14 01963 g002
Figure 3. The PIM-simulated 3D displacements in the vertical (top row), east (middle row), and north (bottom row) directions caused by underground ground working panels whose advancing directions were given by φ = 0 ° , 30 ° , 60 ° , 90 ° , 120 ° , 150 ° . The negative values denote ground surface subsidence or horizontal movement along the west or south directions.
Remotesensing 14 01963 g003
Figure 4. Assessed errors of the NOV-estimated mining subsidence for descending (i.e., α = 190 ° ) and as-cending (i.e., α = 350 ° ) flight angles with respect to varied advancing directions (i.e., φ = 0 ° , 30 ° , 60 ° , 90 ° , 120 ° , 150 ° ).
Remotesensing 14 01963 g004
Figure 5. Histograms of the errors of the NOV-estimated mining subsidence (see Figure 4) for descending (i.e., α = 190 ° ) and ascending (i.e., α = 350 ° ) flight angles. In which, varied advancing directions (i.e., φ = 0 ° , 30 ° , 60 ° , 90 ° , 120 ° , 150 ° ) were set in the simulated analysis. The red lines denote the fitted frequency of the normal distribution.
Remotesensing 14 01963 g005
Figure 6. Histogram of the assessed relative errors of the NOV-estimated mining subsidence in the Qianyingzi coal mining area (see Figure 1d). The red line denotes the fitted frequency of the normal distribution.
Remotesensing 14 01963 g006
Figure 7. Peak-to-valley angles of the NOV-estimated subsidence errors with respect to the changes of underground mining directions from 0° to 180° for the LEO ascending and descending imaging views, respectively.
Remotesensing 14 01963 g007
Figure 8. Relationship of the errors of the NOV-estimated subsidence with respect to coherence ( γ = 0.1 ~ 1.0 ) and incidence angles of the current LEO SAR systems (i.e., θ = 25 ° ~ 55 ° ).
Remotesensing 14 01963 g008
Figure 9. An example of the resulting errors of the NOV-estimated subsidence with respect to the varied incidence angles (i.e., θ = 20 55 ° )under the current LEO SAR flight angles ( α 350 ° or α 190 ° . The error of InSAR LOS displacements was given by δ los = 0.01   m . The 2D horizontal movements were designated as d e = 0.2   m and d n = 0.2   m , respectively.
Remotesensing 14 01963 g009
Figure 10. Examples of the errors of the NOV-estimated mining subsidence under hard (q = 0.4 and tanβ = 1.5), medium (q = 0.7 and tanβ = 2.2), and soft (q = 0.9 and tanβ = 2.9) overlying rock strata, respectively. In which, the ascending SAR imaging geometry was used (i.e., α = 350 ° and θ = 38 ° ). Hard is (a), medium is (b), soft is (c).
Remotesensing 14 01963 g010
Figure 11. Subsidence boundaries delimitated with the ascending (red line) and descending (blue line) NOV-estimated subsidence. The black dashed line denotes the “real” subsidence boundary. The base map is the contour of the simulated mining subsidence.
Remotesensing 14 01963 g011
Figure 12. (a,b): Assessed and “real” damage categories of buildings (marked by circles) on the basis of the NOV-estimated and the simulated subsidence, respectively. (c) Differences between (a,b). The black ellipses in (ac) denote the simulated subsidence boundary. The black rectangle denotes the simulated working panel. The base map in (c) shows the errors of the NOV-estimated subsidence.
Remotesensing 14 01963 g012
Table 1. The common ranges of the subsidence factor (q) and tangent of major influence angle (tanβ) for the hard, medium, and soft overlying rock strata.
Parameters of the PIMLithology of Overlying Rock Strata
HardMediumSoft
q0.27~0.540.55~0.850.86~1.0
tanβ1.2~1.911.92~2.42.41~3.54
Table 2. Standard deviations (STD) and the influence areas of the errors of the NOV-estimated mining subsidence under different overlying rock strata.
IndicatorsLithology of Overlying Rock Strata
HardMediumSoft
STD0.05 m0.11 m0.17 m
Influence area0.40 m20.33 m20.26 m2
Publisher’s Note: MDPI stays neutral with regard to jurisdictional claims in published maps and institutional affiliations.

