Building extraction plays an important role in several applications, such as in urban planning, illegal building supervision, and geographical information surveying, mapping, and updating [
1,
2,
3,
4], and these applications are significant to societal development and daily human life. With the rapid development of VHR optical remote sensing imaging, a lot of optical remote sensing data are available and can be used for building investigations. Yet, when facing amounts of optical remote sensing data, the manual investigation of buildings is arduous. It is necessary to develop an automatic and powerful building extraction algorithm to eliminate this time-consuming labor. However, referring to several published building extraction datasets [
5,
6,
7], several statistical and visual results are shown in
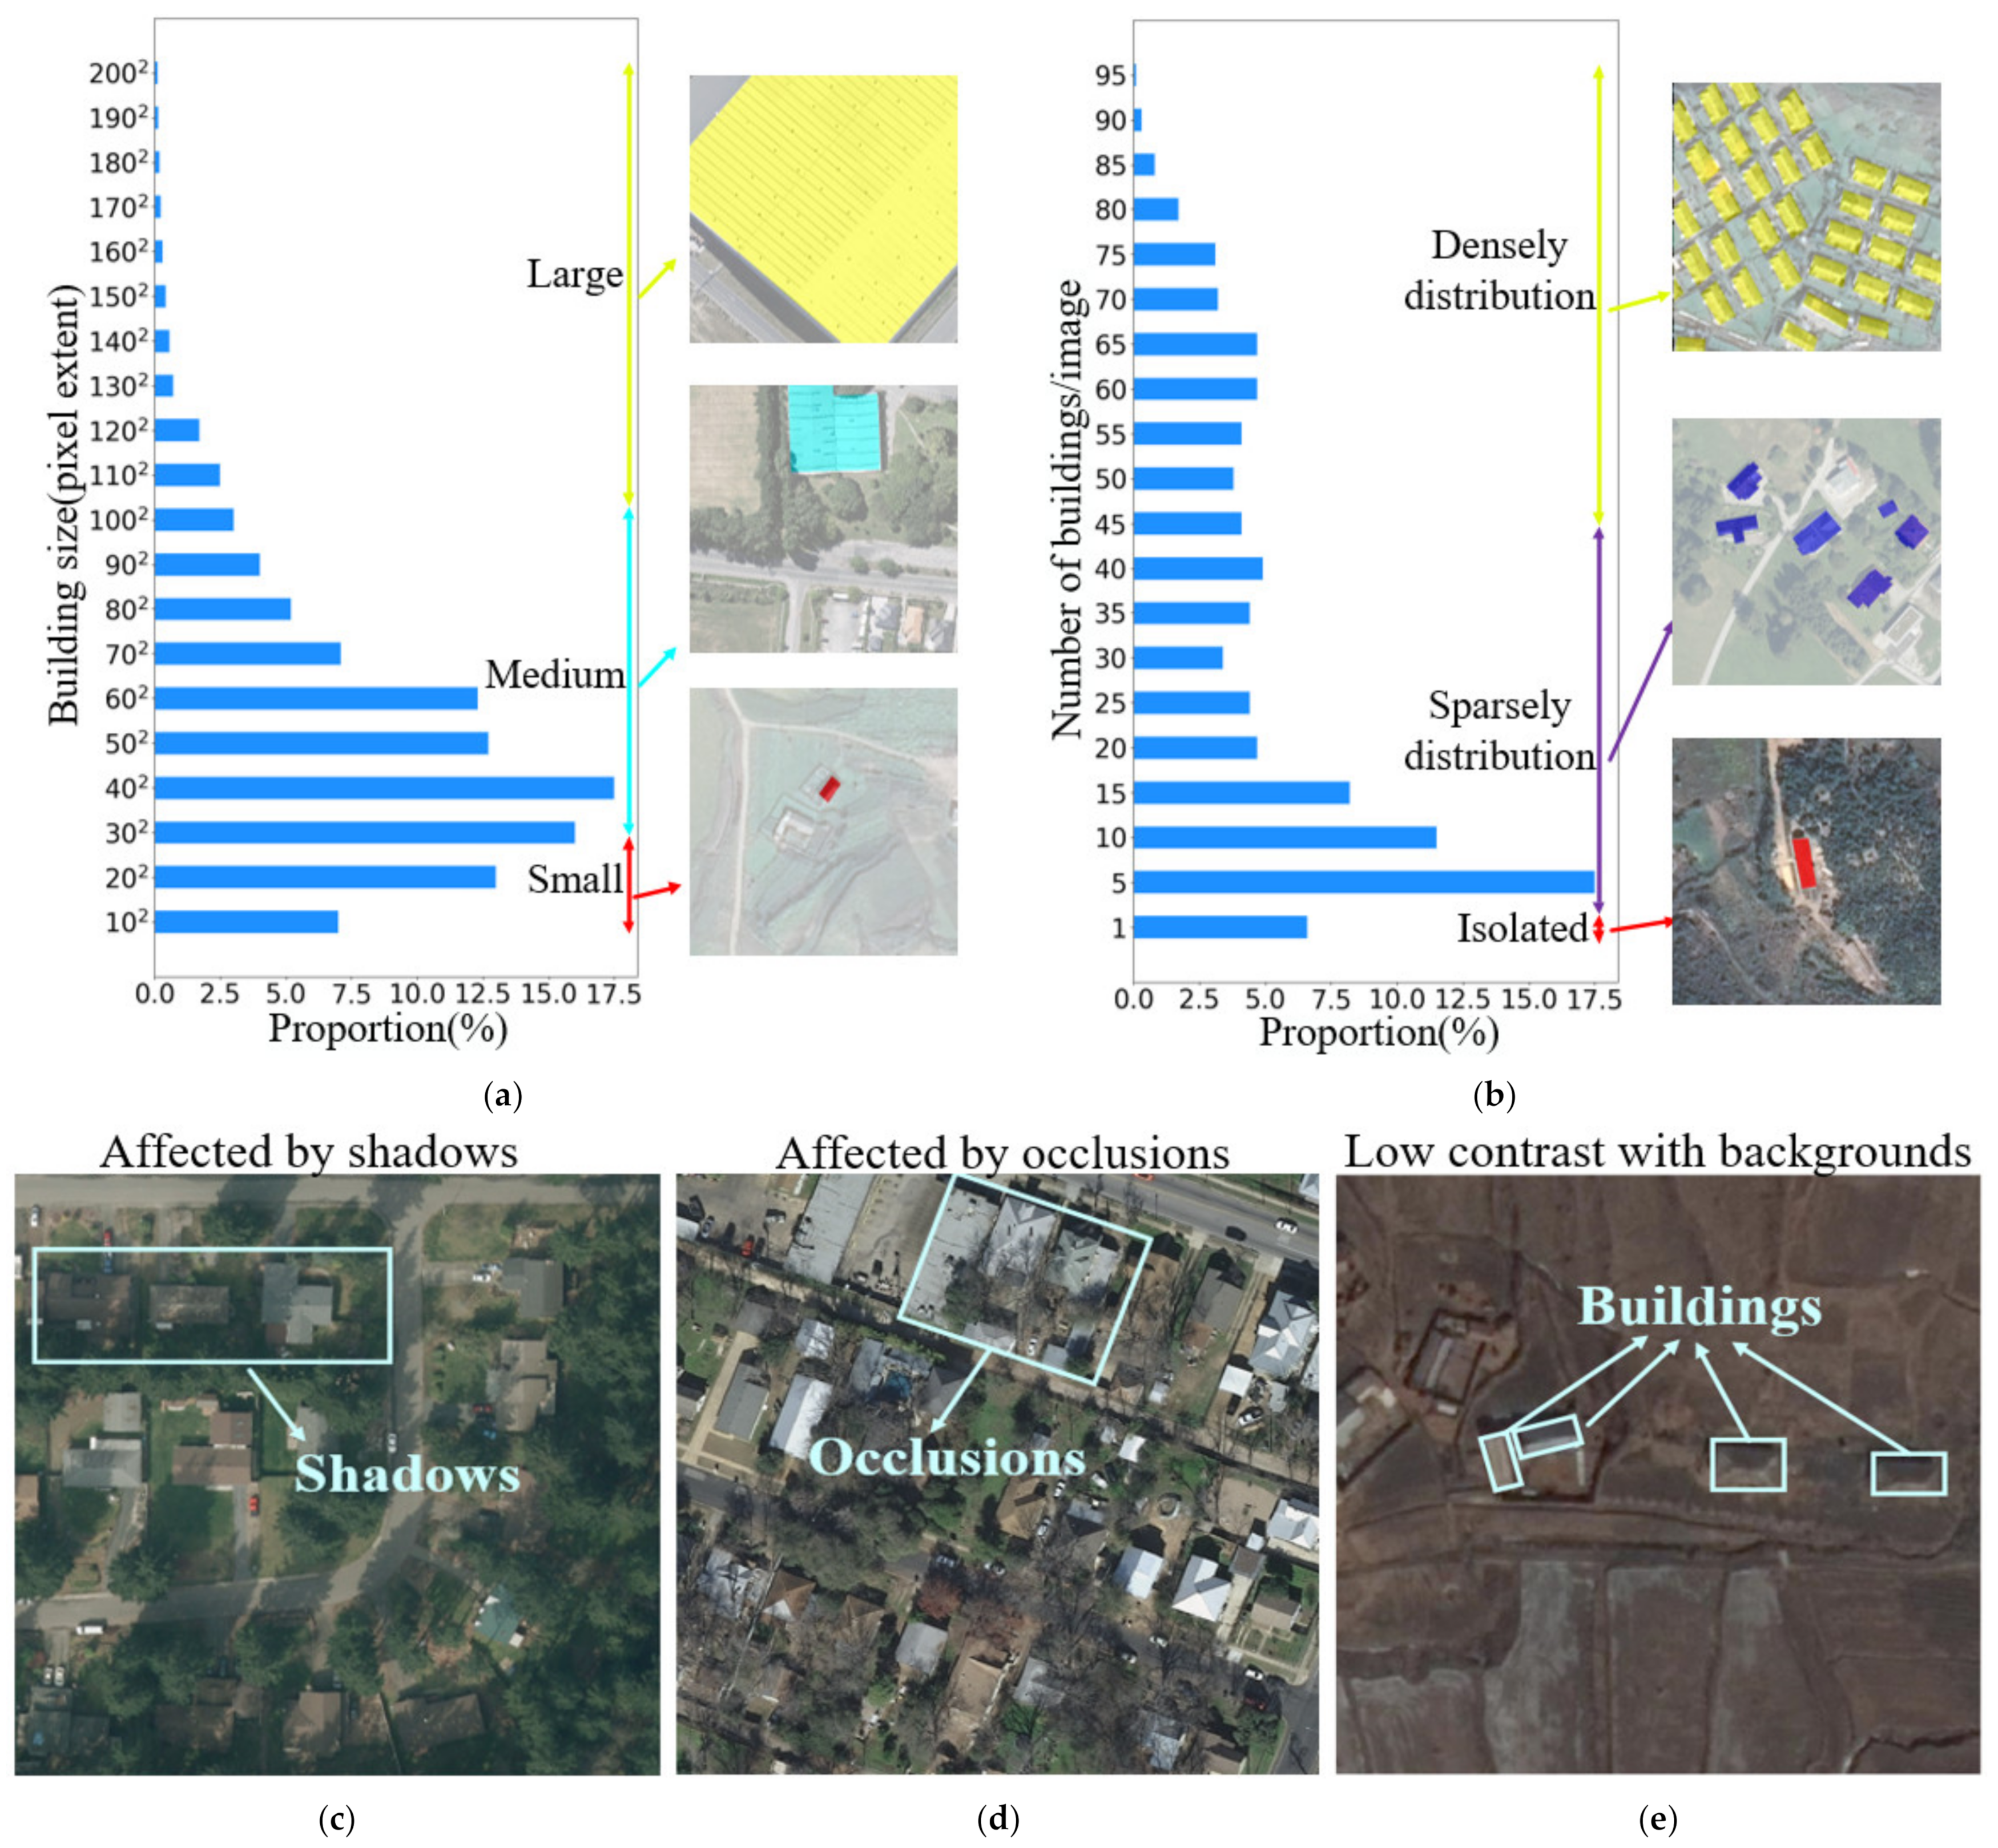
Figure 1, and there are three main aspects (e.g., buildings in various environments showing great differences in scale, spatial distribution, and imaging conditions) affecting the refined building extraction results. First, in
Figure 1a, the horizontal axis represents the proportion of different-scale buildings from datasets, and the vertical axis indicates the scale distribution of each counted building. From the statistical and visual results in
Figure 1a, we can see that a large-scale spanning of buildings would create challenges when setting up a robustness feature description to carefully extract the full scale of the buildings. Therefore, these circumstances often result in the incomplete extraction of large-scale buildings and missing extraction for small-scale buildings. Next, in addition to large-scale spanning, the arbitrary spatial distribution of buildings is also a challenging situation that impacts building extraction performance, which is shown in
Figure 1b. Here, the horizontal axis represents the different spatial distributions of buildings according to the initial datasets, and the vertical axis represents the number of buildings per image. Subsequently, for densely distributed buildings, despite each building being able to provide strong spatial relevance to support each other during building extraction, this makes it hard to provide satisfactory results with precise boundary information due to the smaller intervals of the densely distributed buildings. Then, when buildings have a sparse and isolated spatial distribution, the redundant background context information emerges in large quantities, and there is a big risk of missing extraction or false alarms due to the uncertain semantic feature description for building extraction. Moreover, as presented in
Figure 1c–e, there are three typical cases of shadows, occlusions and low contrast ratio to make a challenge for effective semantic feature description and refined building extraction. Moreover, in VHR optical remote sensing imagery, the interior details of buildings and the redundant context of the surrounding background become clearer, which can further enlarge the intra-class variance and worsen inter-class discrimination for building extraction from complex scenes. Thus, when jointly considering these mentioned challenges, traditional hand-crafted feature-based methods [
8,
9,
10,
11,
12,
13,
14,
15,
16] (e.g., spectrum [
8], shape [
9], color [
10], texture [
11], polygon [
12,
13], and shadow [
14,
15]) demonstrate poor building description and extraction results. In recent years, because of the booming development of deep learning techniques, a lot of convolution neural networks (CNNs) based encoder–decoder architectures have been designed in the computer vision field, such as FCN [
17], SegNet [
18], GCN [
19], PSPnet [
20], Unet series [
21,
22,
23], and Deeplab series [
24,
25,
26,
27]. Since these networks can provide more competitive results than traditional methods [
8,
9,
10,
11,
12,
13,
14,
15,
16], they are widely used and studied for automatic building extraction tasks in optical remote sensing scenes.
For example, for environmental riverbank protection in Chongqing, China, W. Boonpook et al. [
28] utilized SegNet to achieve automatic building extraction from unmanned aerial vehicle (UAV)-based images. J. Liu et al. [
29] referred to Unet and combined the residual block into a simplified U-shape encoder–decoder to achieve building extraction for urban planning. G. Wu et al. [
30] utilized a designed multi-scale supervision strategy for FCN training and set up a multi-constraint fully convolutional network (MC-FCN) to generate good results for varying scales of building extraction. Tremendous efforts have demonstrated that CNN-based encoder–decoder methods can generate a stable pixel-level semantic feature description for building extraction. However, when encountering the challenge cases in
Figure 1, there are no good enough results that can be generated from VHR optical remote sensing imagery. Consequently, a lot of studies have been dedicated to improving the semantic feature description ability of these methods to enhance building extraction performance. Y. Liu et al. [
31] and W. Kang et al. [
32] introduced the spatial pyramid pooling (SPP) module into the encoder–decoder of Unet that was able to further enlarge the receptive fields (RFs) and aggregate multi-scale contextual information for building description. Then, L. Hao et al. [
33] employed inception downsampling modules in the encoding procedure, and the dense upsampling convolution (DUC) was adopted instead of bilinear interpolation or de-convolution to strengthen both information preservation and discrimination for refined building extraction. Next, Y. Liu et al. [
34] took the irregular shapes of buildings into account and adopted the U-shape encoder–decoder method combined with asymmetric convolutions, providing more appropriate feature extraction. Moreover, atrous convolutions with different dilation rates were also employed during deep layer feature extraction, enhancing the generalization ability of semantic description. Furthermore, referring to the Deeplab series [
24,
25,
26,
27], J. Cai et al. [
35] adopted DUC for a decoder and designed multipath hybrid-dilated convolution to aggregate multiscale context features in the encoder, obtaining acceptable building extraction results. Subsequently, in view of a powerful encoder–decoder architecture-based semantic description method and to alleviate losses in the shape or boundary information caused by stacked convolutions and to achieve refined building delineation, Y. Yu et al. [
36] designed the capsule feature pyramid network (CapFPN), in which capsule layers are used as the encoder to preserve the information that may be lost by downsampling consecutive convolutions. Then, multi-scale capsule feature fusing is used as the decoder to generate more refined building delineation results. Q. Hu et al. [
37] followed the Unet architecture and utilized an attention mechanism to set up an attention gate to facilitate feature fusion for the skip connection in the encoder–decoder, and then the squeeze-and-extraction operation was adopted to leverage the semantic feature generalization procedure for refined building delineation using a residual recurrent convolutional neural network. A. Abdollahi et al. [
38] proposed a Multi-Res-Unet to optimize the skip connections in the Unet architecture and to assimilate the features learned from the same scale level of the encoder and decoder. Moreover, they also integrated semantic edge information with semantic polygons to retain the irregular shape and refined boundary information. H. Ye et al. [
39] also focused on the feature fusion of the skip connections in U-shaped encoder–decoders, and they utilized the feature reuse mechanism to refine the fused features by introducing more reasonable low-level spatial information to alleviate fuzzy building boundary prediction to some extent. Furthermore, in addition to studies [
36,
37,
38,
39] achieving building extraction from data with a more refined shape or boundary, some research has considered building extraction tasks in which there is a great amount of variation in the building size. R. Hamaguchi et al. [
40] designed size-specific prediction branches for small-, medium-, and large-scale building extraction tasks followed by an Unet structure, and then they proposed a post-processing technique for integrating the output probability maps from each scale of branches. Similar to [
40], H. Guo et al. [
41] proposed a scale-robust deep-supervision network for building extraction by designing a scale attention module combined with multi-scale deep supervision to facilitate multi-scale decision fusion at the decoder. Then, S. Ji et al. [
5] and Y. Liao et al. [
42] both utilized the dual-stream of a Siamese U-net architecture to individually model the global and local information and finally fused them for building extraction tasks at different scales. Next, E. Maggiori et al. [
6], P. Liu et al. [
43], S. Wei et al. [
44], Q. Zhu et al. [
45], and F. Chen et al. [
46] all designed specific multi-scale feature extraction and fusion networks for building extraction, and [
44,
45] also incorporated polygon regularization post-processing or spatial and channel attention mechanisms to refine the building extraction results at a wide range of scales. In general, although substantial efforts [
5,
6,
28,
29,
30,
31,
32,
33,
34,
35,
36,
37,
38,
39,
40,
41,
42,
43,
44,
45,
46] have been made to refine building extraction, almost all of these methods focus on trading off the classification and localization performance by individually optimizing and fusing deep- and shallow-layer features. Unfortunately, there is antinomy in the feature fusion of the deep and shallow layers. As the receptive field continues to increase due to stacked convolutions, it inevitably introduces optimized deep layer features that can improve classification ability while worsening the localization ability. On the other hand, it also inevitably introduces optimized shallow layer features to improve the localization ability while degenerating classification ability. According to this antinomy in the deep- and shallow-layer feature fusion, the above-mentioned methods often result in limitations and uncertain predictions during building extraction. Therefore, there is still much room for improvement in refined building extraction using VHR optical remote sensing imagery.
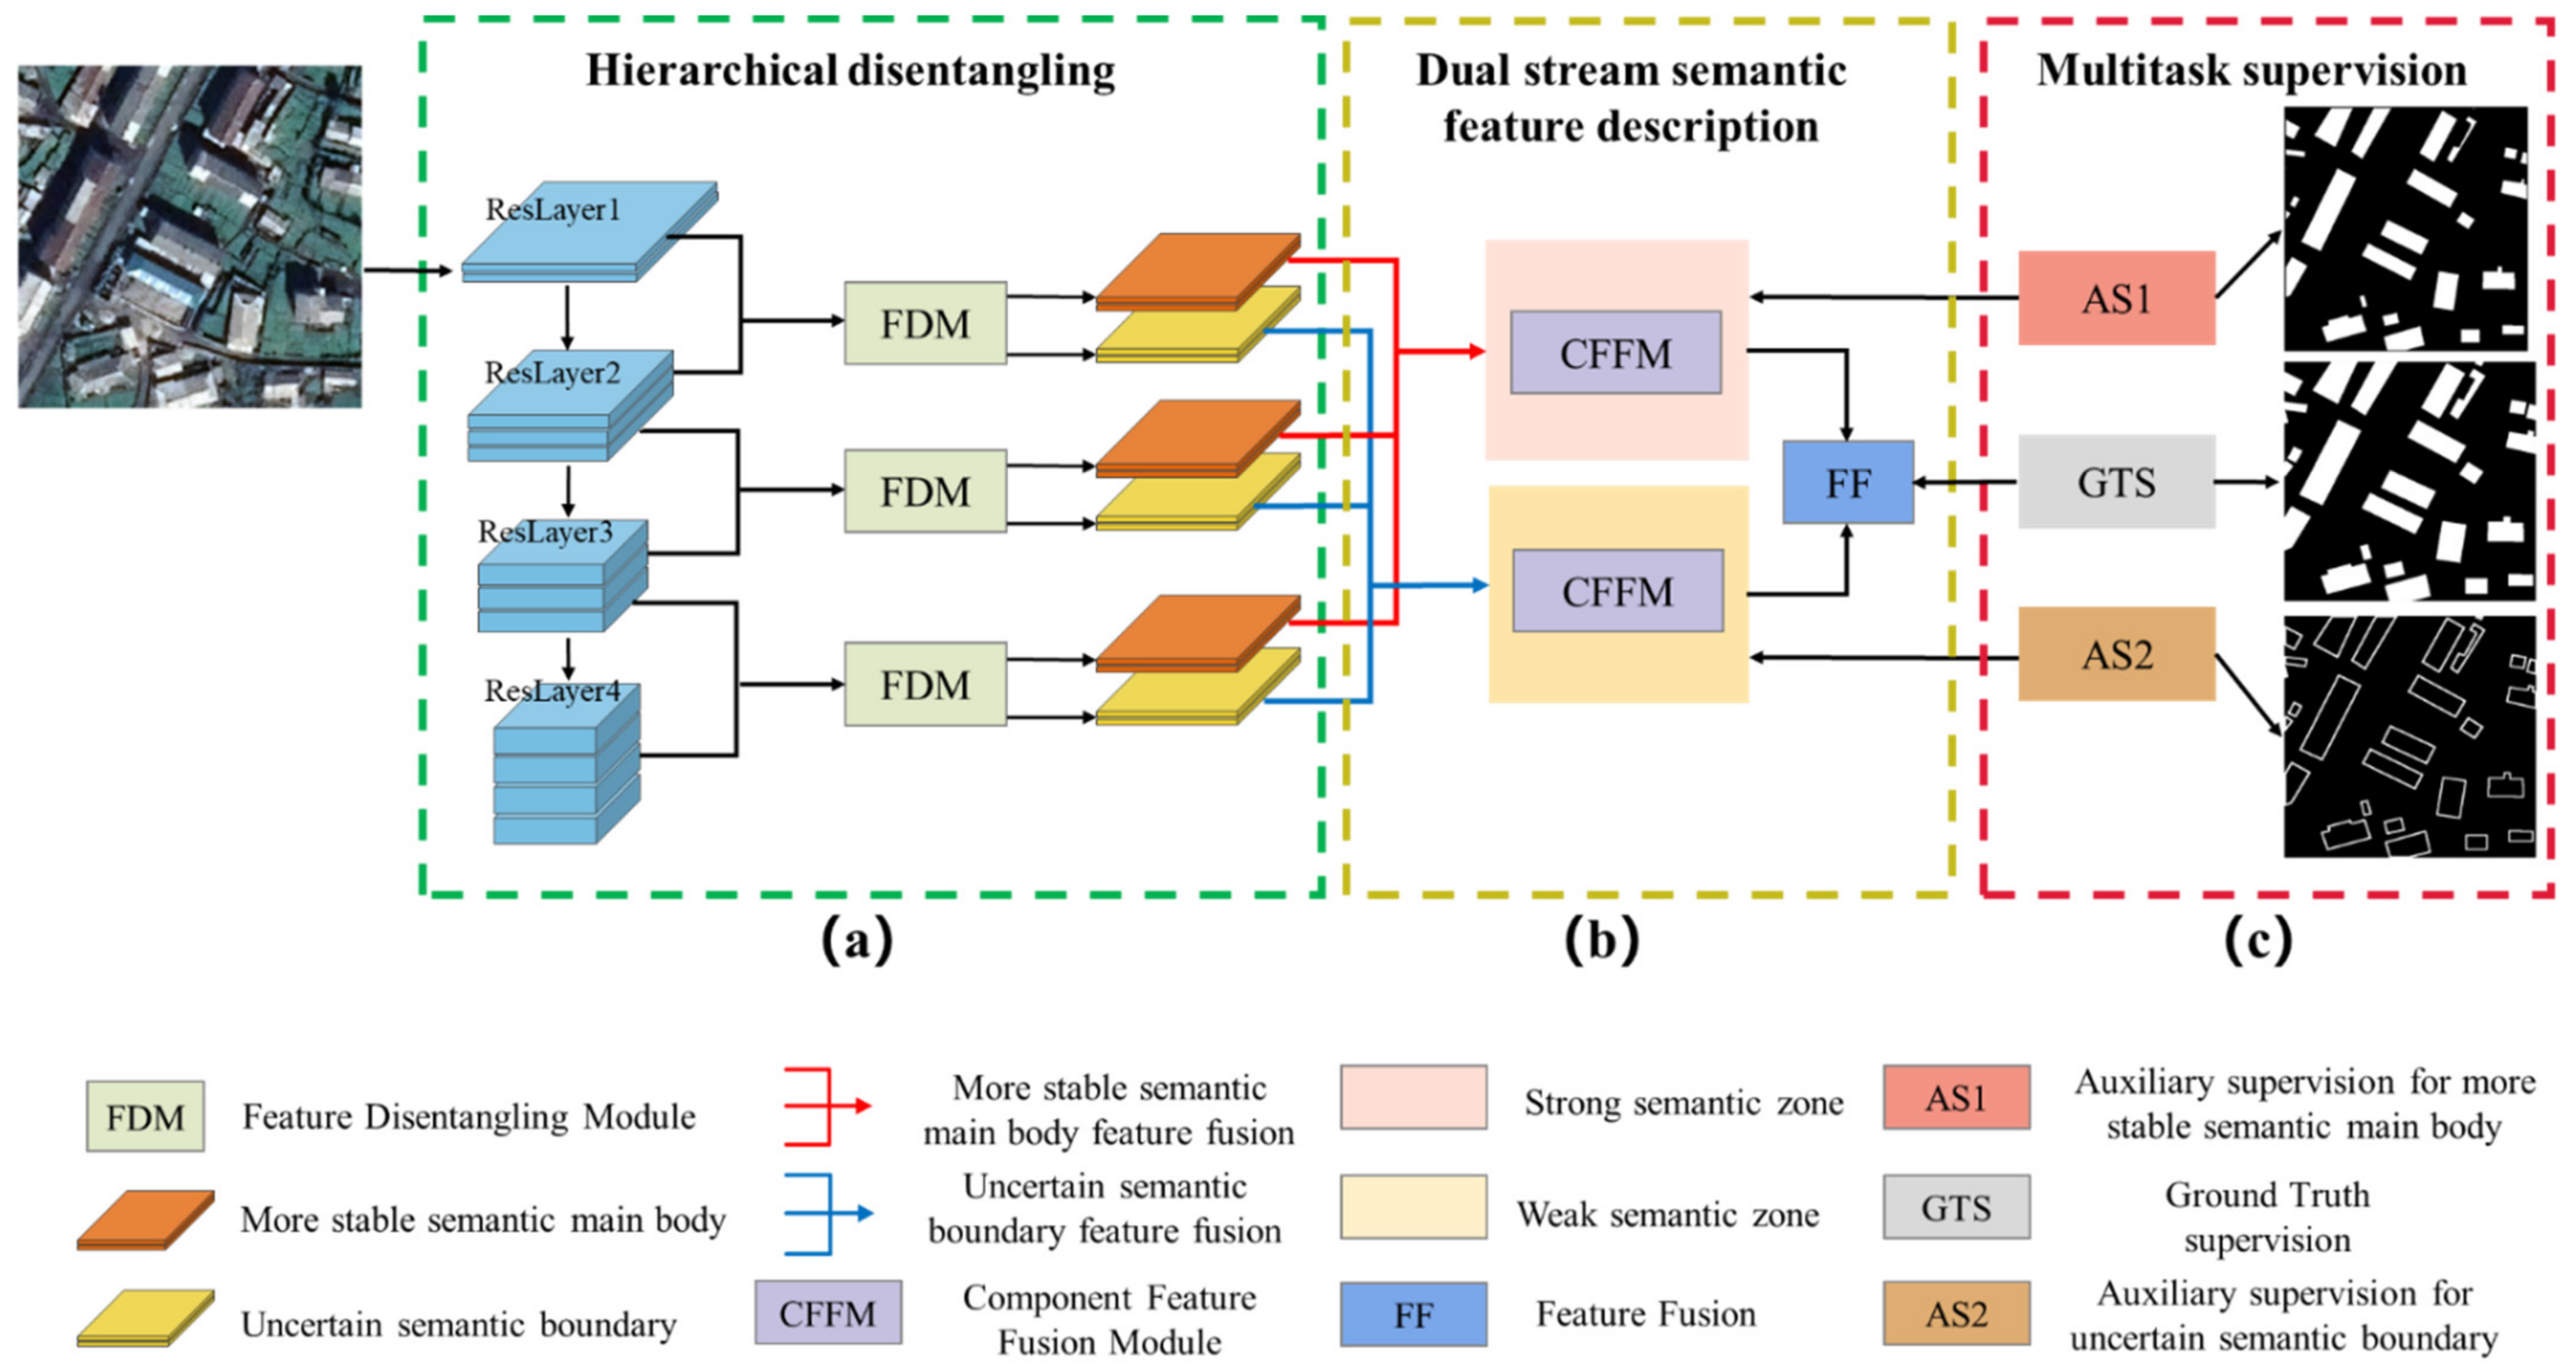
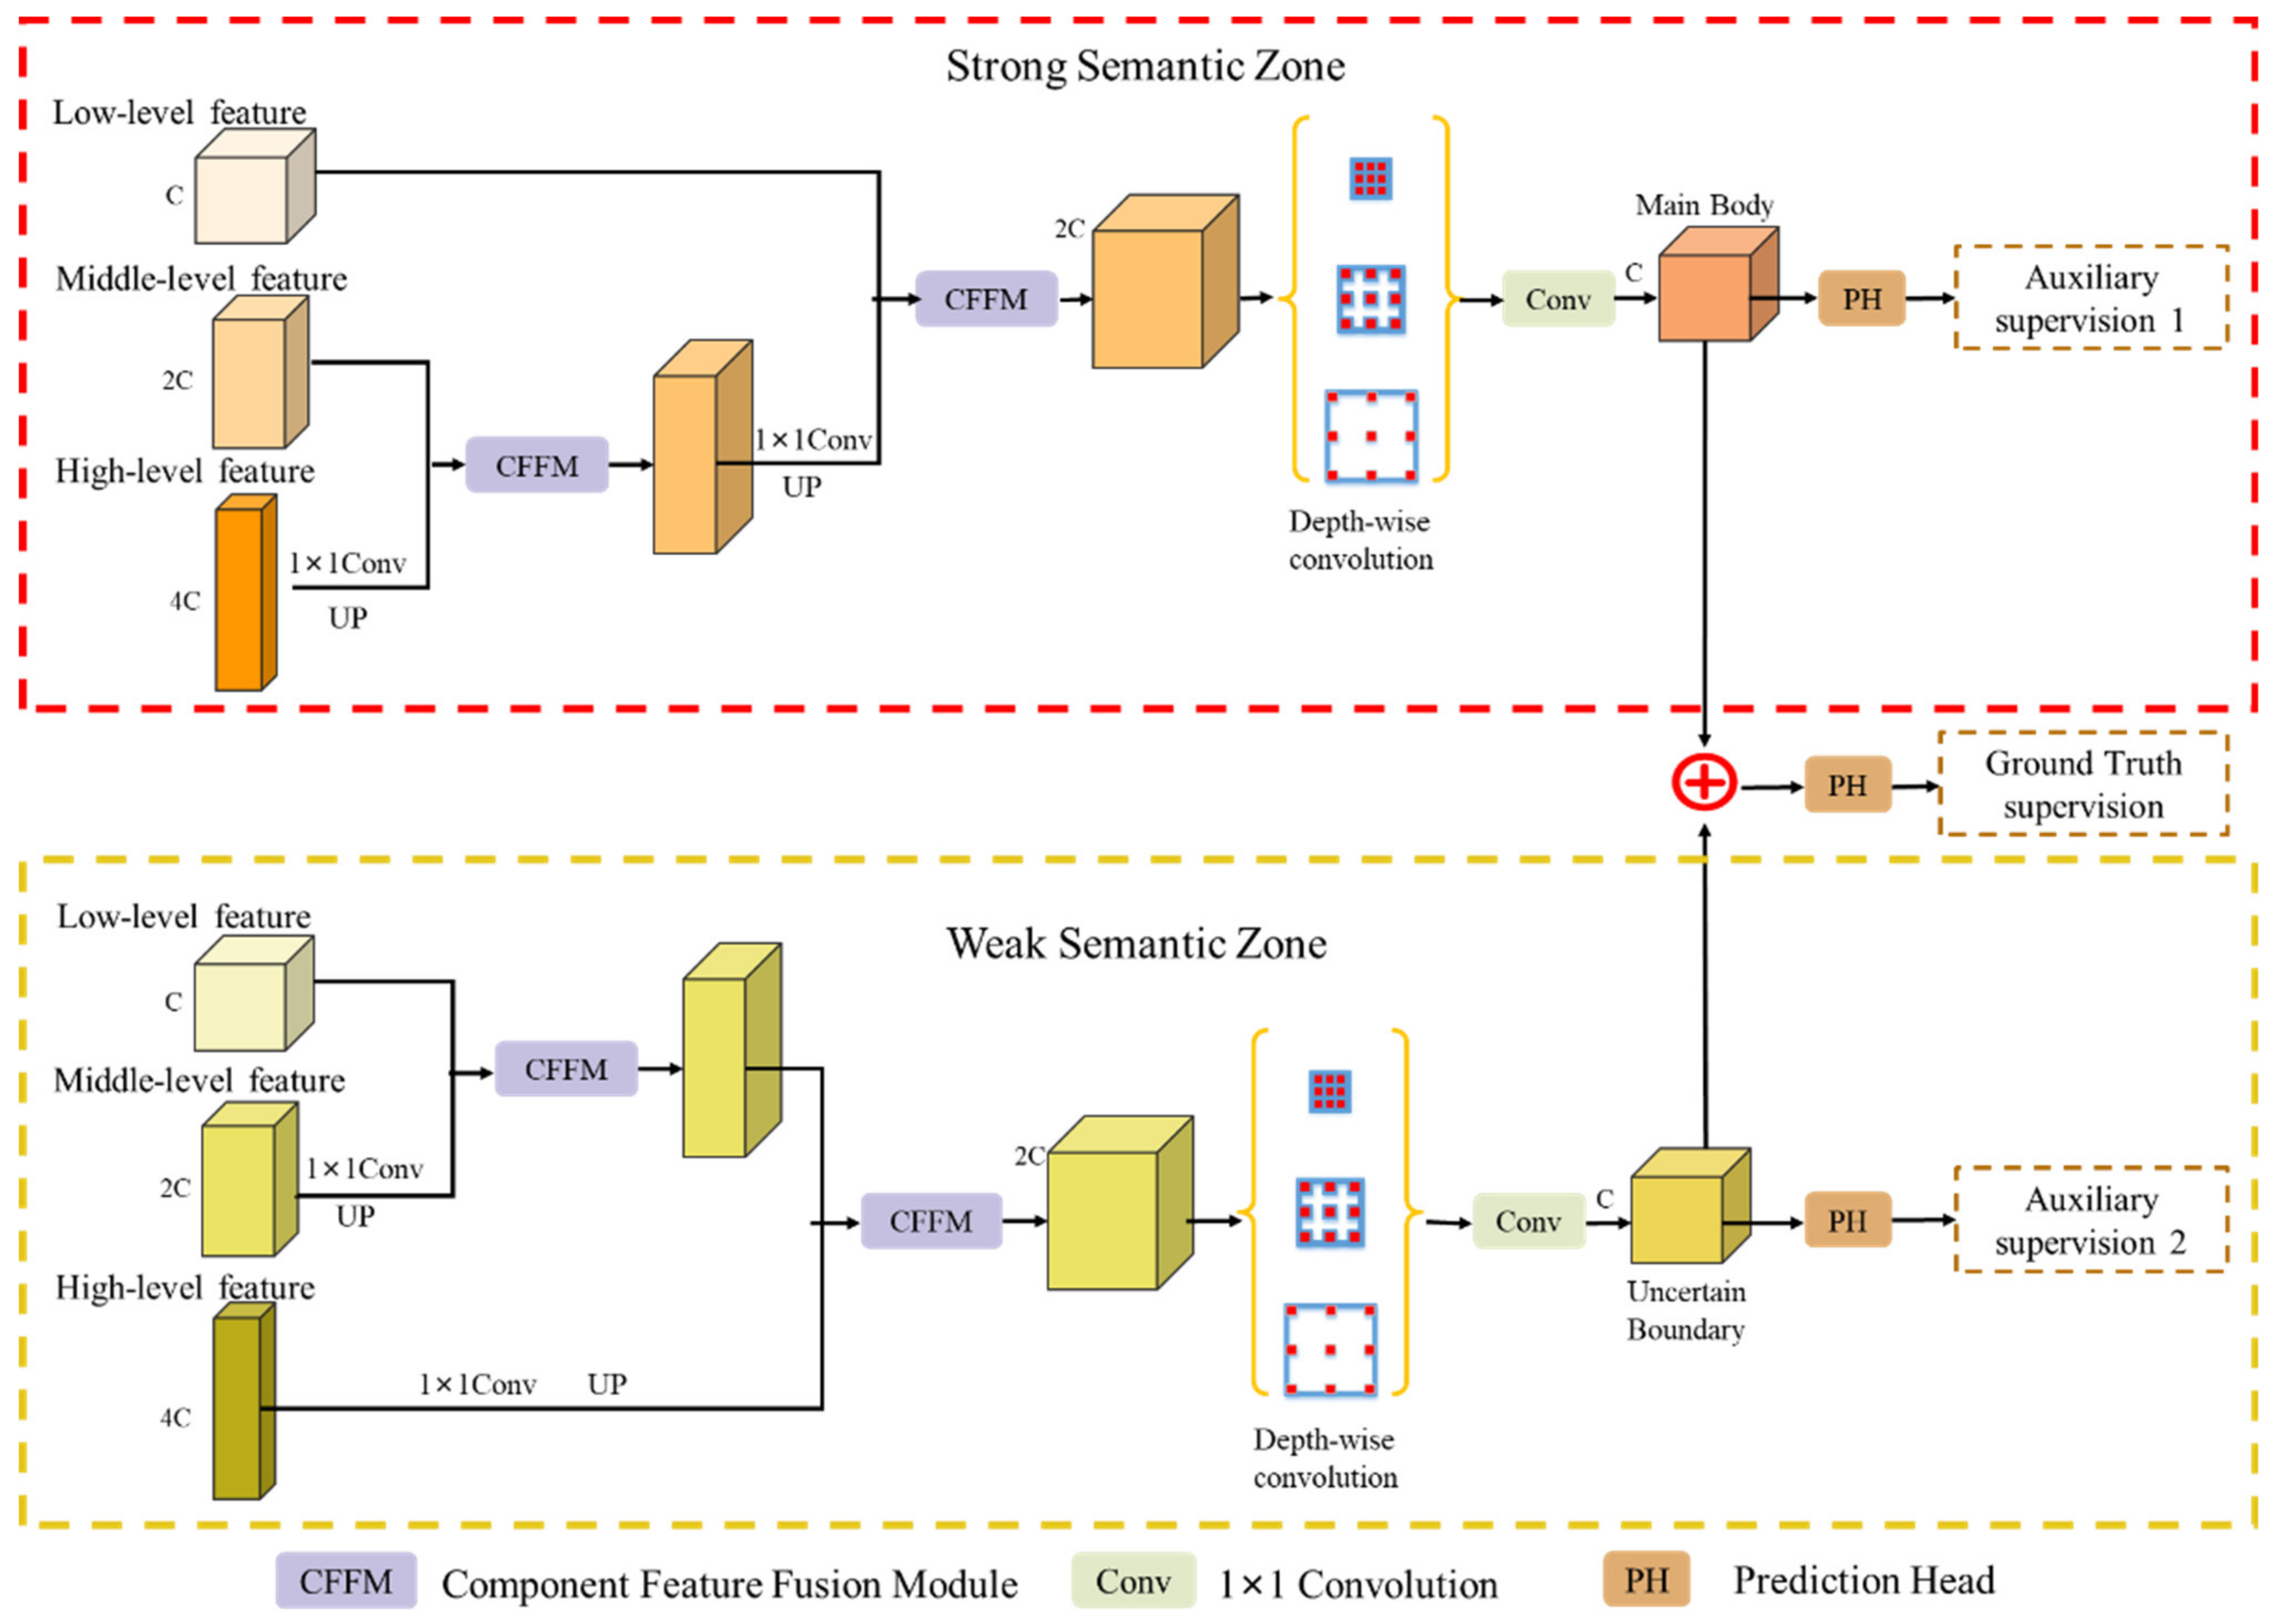
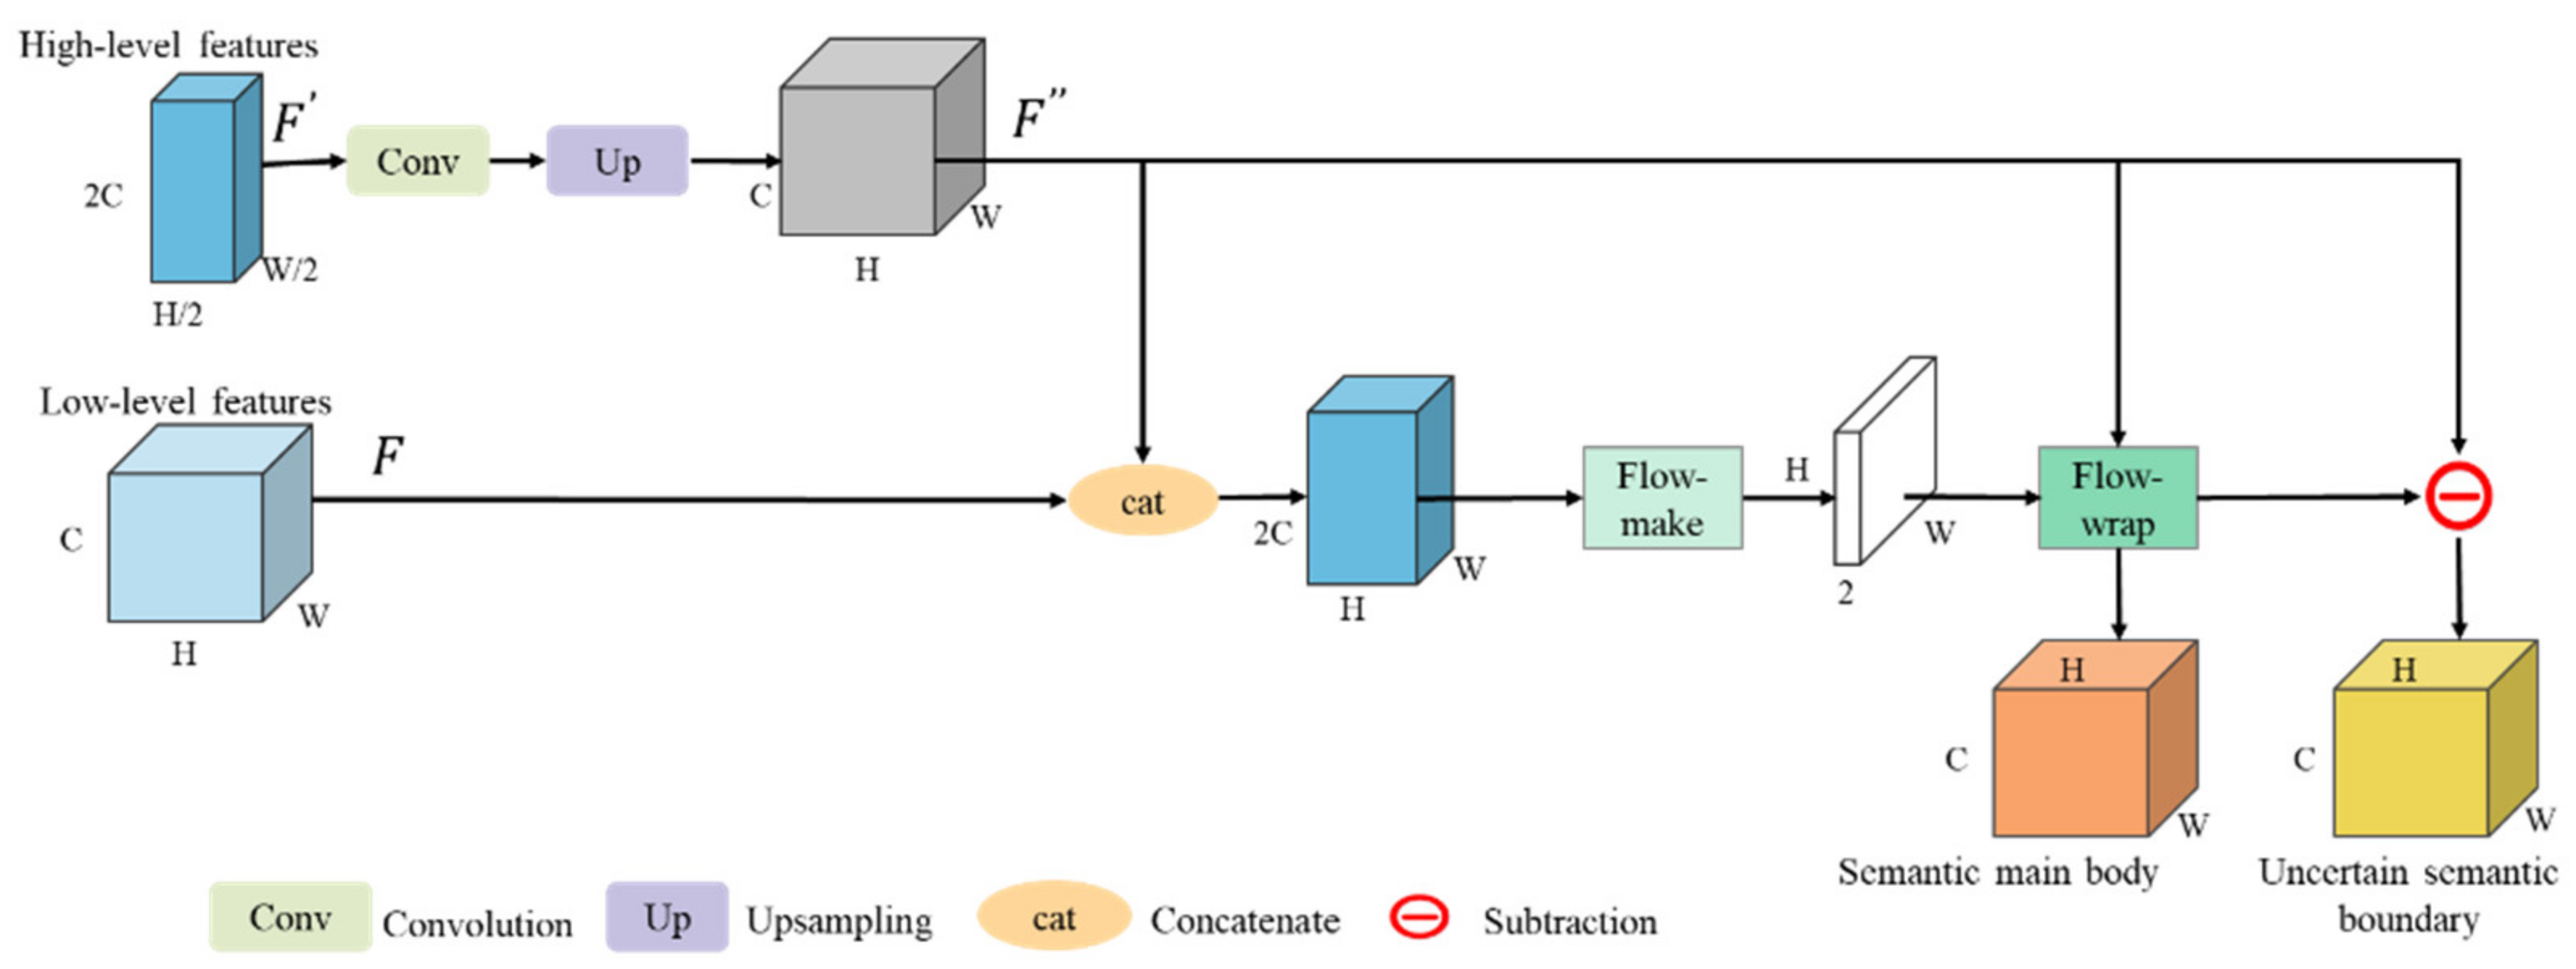
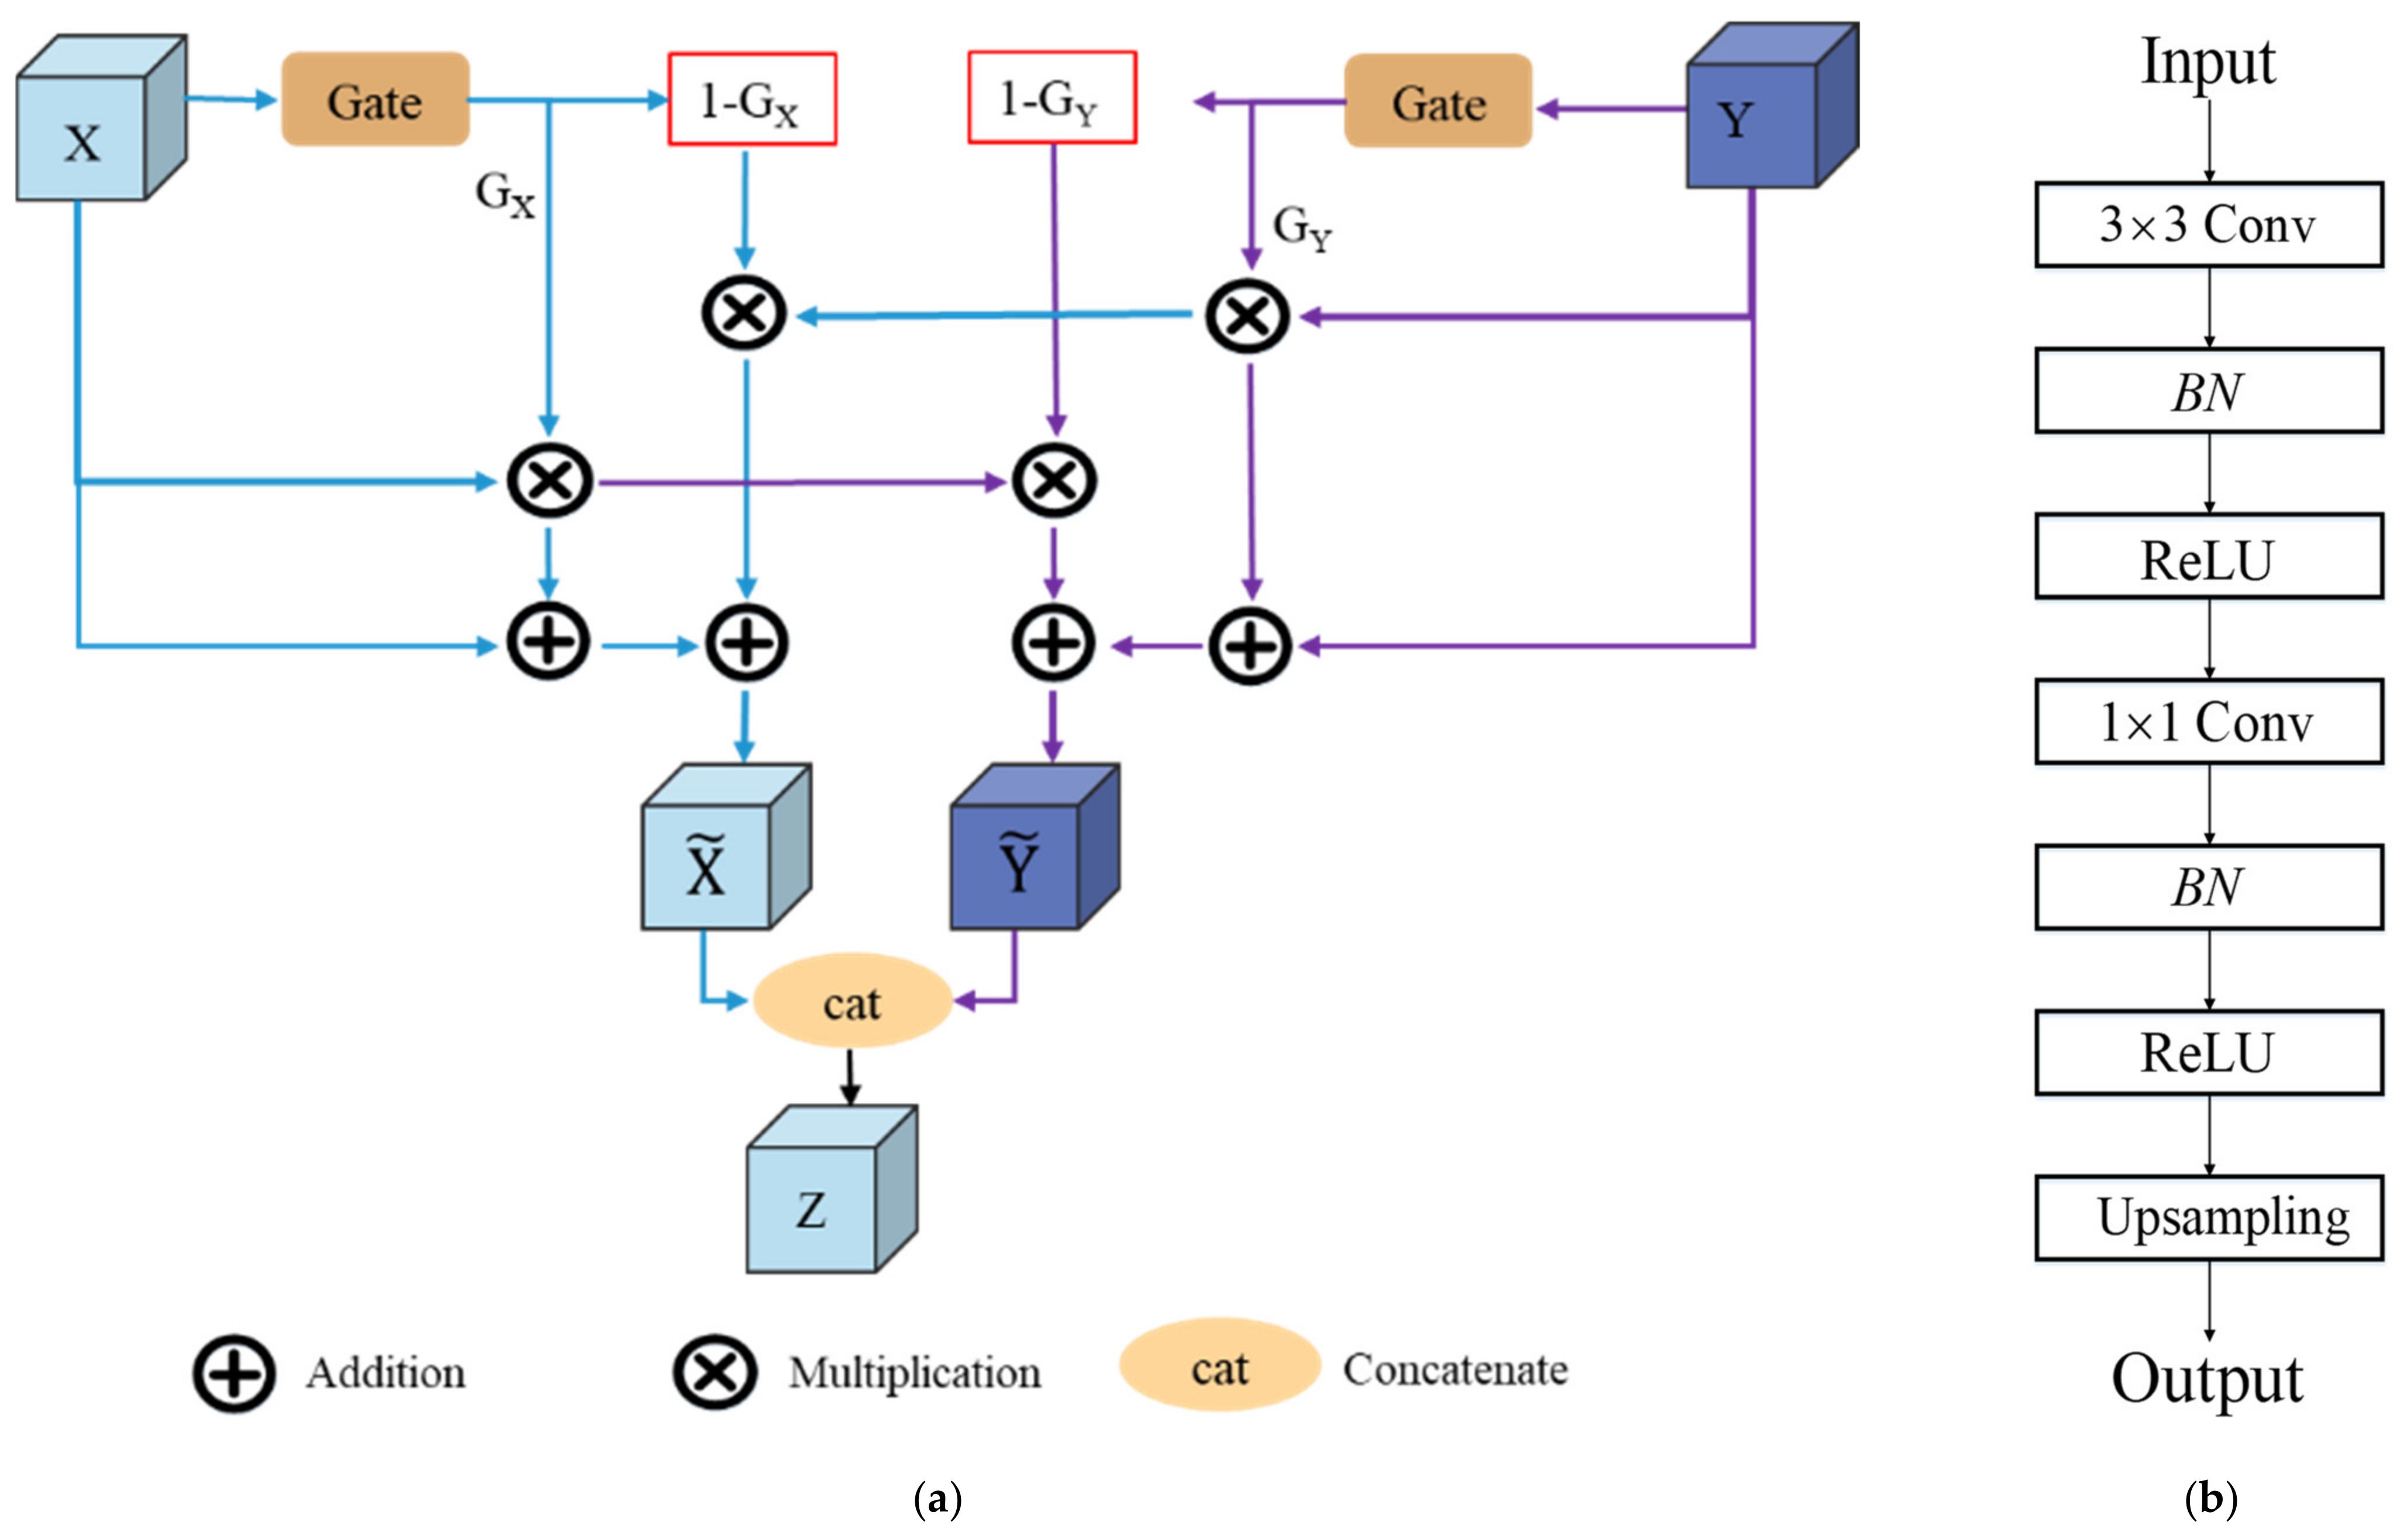
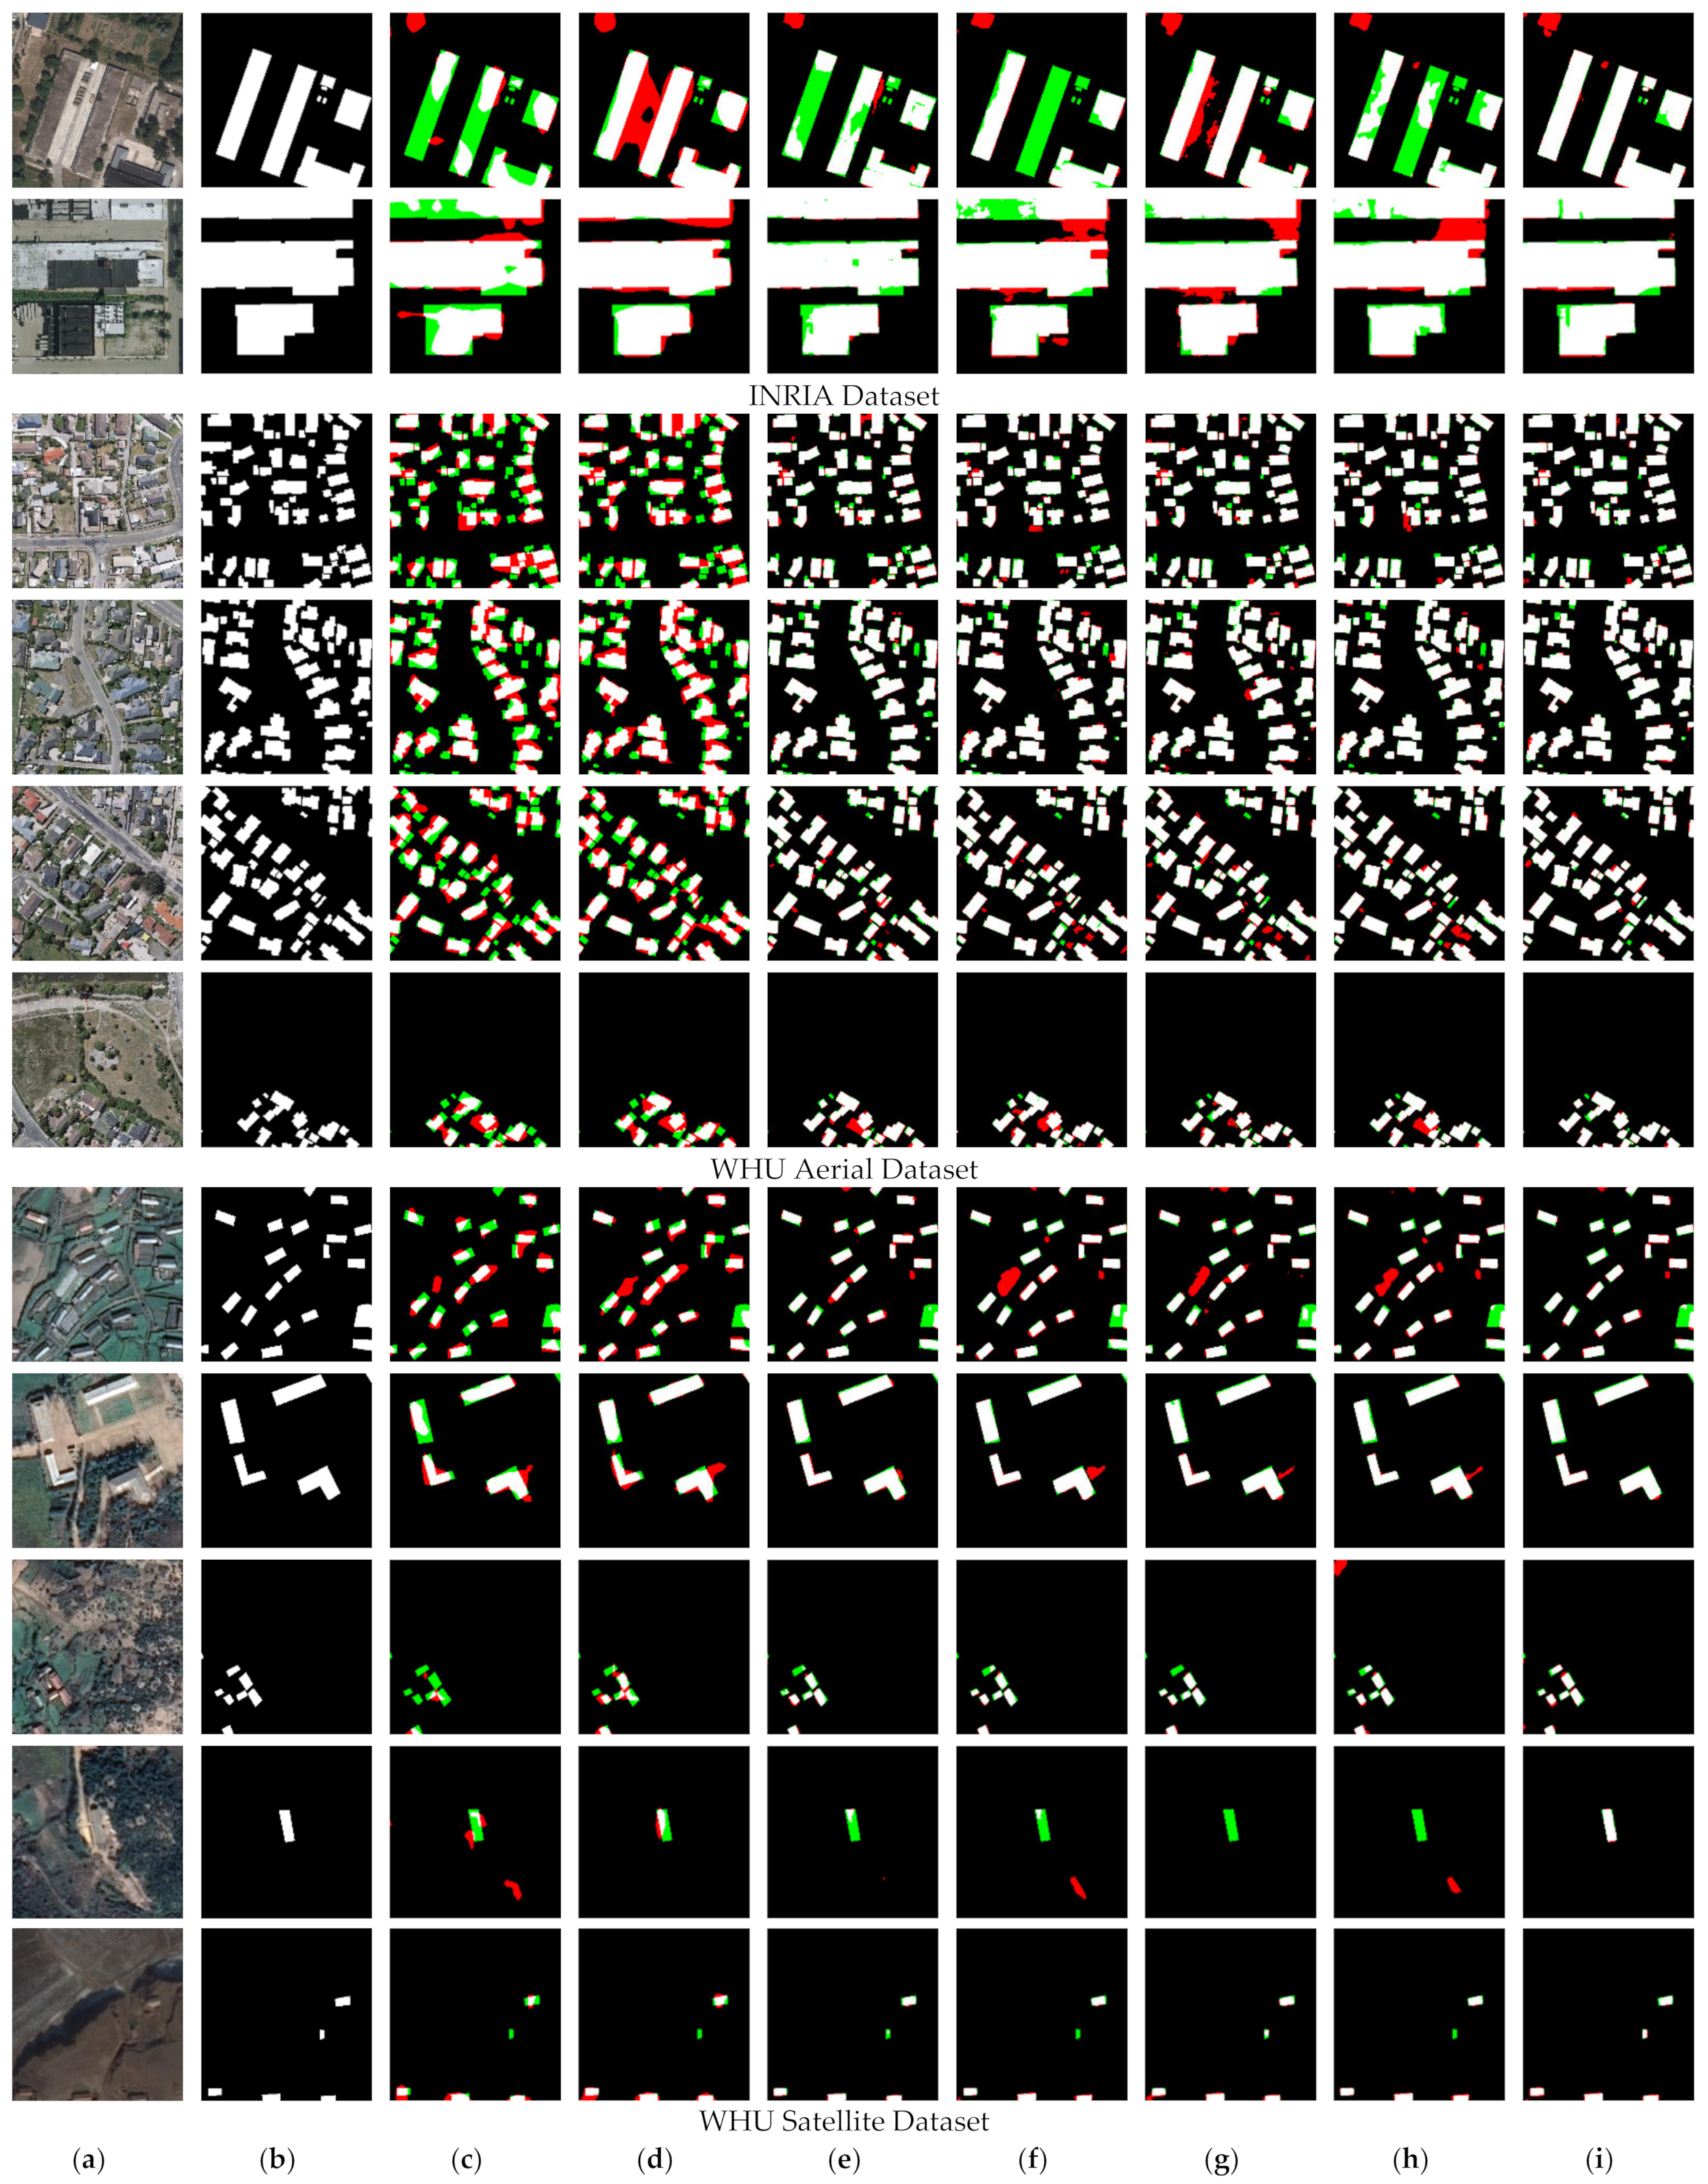
In this article, we consider the existing challenges in refined building extraction and rethink the current semantic description paradigm. A novel hierarchical disentangling network called HDNet is proposed for refined building extraction. Different from previous encoder–decoder architectures that trade off the classification and localization performance by fusing specific deep and shallow layer features, the proposed HDNet sets up semantic description using a hierarchical disentangling strategy and dual-stream semantic feature description that focuses on individually describing the strong and weak semantic zones and achieving effective feature fusion. Then, the newly designed feature disentangling module (FDM) is used for the hierarchical disentangling strategy to decompose the hierarchical features into strong semantic zones with a more stable semantic main body and weak semantic zone with uncertain semantic boundaries among the stacked convolution layers. Here, the more stable semantic main body and uncertain semantic boundary can be considered to be more effective feature descriptions for the main body and boundary information of buildings. Next, after the hierarchical feature disentangling strategy, the newly designed component feature fusion module (CFFM) is used to gradually integrate a more stable semantic main body and uncertain semantic boundary followed by a dual-stream semantic feature description. After dual-stream semantic feature description, the strong and weak semantic zones can be elegantly fused to generate powerful semantic descriptions for refined building extraction. Finally, extensive experiments are carried out on three published datasets (i.e., WHU satellite [
5], WHU aerial [
5], and INRIA [
6]) and the comparison results show that when using an effective and new semantic description paradigm for building extraction, the proposed HDNet not only outperforms the baseline of Deeplabv3 [
26], but also has more superior performance than Deeplabv3+ [
27] regardless of whether satellite or aerial data are used. Meanwhile, the proposed HDNet can provide more competitive building extraction results than the other state-of-the-art (SOTA) building extraction methods. In general, the main contributions of our study can be summarized as follows:


