Article

Capsule–Encoder–Decoder: A Method for Generalizable Building Extraction from Remote Sensing Images

1
School of Civil and Hydraulic Engineering, Huazhong University of Science and Technology, Wuhan 430074, China
2
School of Intelligent Systems Engineering, Sun Yat-sen University, Shenzhen 518107, China
3
Center of Geographic Information, Yellow River Engineering Consulting Co., Ltd., Zhengzhou 450003, China
4
School of Water Science and Engineering, Zhengzhou University, Zhengzhou 450001, China
5
School of Remote Sensing and Information Engineering, Wuhan University, Wuhan 430079, China
*
Author to whom correspondence should be addressed.
These authors contributed equally to this work.
Remote Sens. 2022, 14(5), 1235; https://doi.org/10.3390/rs14051235
Submission received: 30 January 2022 / Revised: 21 February 2022 / Accepted: 1 March 2022 / Published: 2 March 2022
(This article belongs to the Special Issue Deep Learning for Very-High Resolution Land-Cover Mapping)

Abstract

:
Due to the inconsistent spatiotemporal spectral scales, a remote sensing dataset over a large-scale area and over long-term time series will have large variations and large statistical distribution features, which will lead to a performance drop of the deep learning model that is only trained on the source domain. For building an extraction task, deep learning methods perform weak generalization from the source domain to the other domain. To solve the problem, we propose a Capsule–Encoder–Decoder model. We use a vector named capsule to store the characteristics of the building and its parts. In our work, the encoder extracts capsules from remote sensing images. Capsules contain the information of the buildings’ parts. Additionally, the decoder calculates the relationship between the target building and its parts. The decoder corrects the buildings’ distribution and up-samples them to extract target buildings. Using remote sensing images in the lower Yellow River as the source dataset, building extraction experiments were trained on both our method and the mainstream methods. Compared with the mainstream methods on the source dataset, our method achieves convergence faster, and our method shows higher accuracy. Significantly, without fine tuning, our method can reduce the error rates of building extraction results on an almost unfamiliar dataset. The building parts’ distribution in capsules has high-level semantic information, and capsules can describe the characteristics of buildings more comprehensively, which are more explanatory. The results prove that our method can not only effectively extract buildings but also perform great generalization from the source remote sensing dataset to another.

Graphical Abstract

1. Introduction

Building extraction from remote sensing images is a spatially intensive task, which refers to the automatic process of identifying building and non-building pixels in remote sensing images [1]. Building extraction plays an important role in many applications, such as urban planning, population estimation, economic distribution, disaster reporting [2,3,4,5], and so forth. In recent years, with the explosive growth of remote sensing image data, deep learning methods have become a research hotspot. Although the recent advancement of deep learning methods has greatly promoted the research in this area [6,7,8,9], there are still many challenges. Due to the different acquisition conditions, a remote sensing dataset over a large-scale area and over a long-term time series will have large variations and large statistical distribution features, which will lead to a performance drop of the deep learning model that is only trained on the source domain. In other words, deep learning methods lack generalizability [10]. Specifically, on the remote sensing images with inconsistent spatiotemporal spectral scales, the deep convolutional neural network-based target extraction models perform weak generalization with high error rates of target extraction; most of the current deep learning methods are only well coupled with the remote sensing images on the same spatiotemporal spectral scales [3].
The convolutional neural network (CNN) output results can only reflect the probability of the existence of features in the local area, lacking a more detailed description of the features. When local features are transformed by translation, rotation, and scaling, a convolutional neural network can not easily perceive local features [11]. In remote sensing images, the complexity and diversity of statistical features further increase the difficulty of using a convolutional neural network to detect characteristics in images [12]. Therefore, the diverse and complex statistical features between different remote sensing images will limit the generalization performance of a convolutional neural network. Specifically, Lunga et al. trained the mainstream convolutional neural network models on different datasets and found that the model can only achieve good performance on the corresponding dataset [13]. Due to the widely different statistical features and pixel distributions of remote sensing images in different geographic regions, it is difficult for convolutional neural network models to generalize from source domain datasets to other datasets. In recent related work, Sheng et al. additionally added a high-level semantic template defined by experts to improve the generalization of the model in vegetation extraction [14]. However, this approach introduces the subjectivity of experts and is not convenient to combine with deep learning models. Yang et al. propose a novel deep network with adaptive graph structure integration, whcih can dynamically enhance robust representations of graphs [15]. The goal of this model is to learn the topological information of the target objects. Therefore, we should describe the features in more detail and deal with the spatial relationship between the features, which can improve the generalization of the model.
In this study, we use a vector named capsule to store richer information, and we use capsules to describe local features. The output of the convolutional neural network is just a response value at each pixel, representing the probability that the feature exists. In other words, convolutional neural networks can not perceive spatial associations between different features. When we use capsules to represent each feature in an image, a vector data structure can store information about the feature itself and its associations with other features. The extra information in the capsule can improve the accuracy of the feature representation compared to the single-valued response at each pixel output by the convolutional neural network. Therefore, the capsule can accurately represent the complex features in the image and can describe the transformation of the features through the extra information stored in it. We can improve the generalization of building extraction through capsules.

1.1. CNN-Based Method for Building Extraction

In recent years, with the development of deep learning, AlexNet [16] has obtained good results of RGB image classification on ImageNet [17], which indicates that the convolutional neural network has become an effective feature automatic extraction tool. In 2015, Long et al. proposed a fully convolutional network (FCN) that implemented an end-to-end deep learning architecture for semantic segmentation [18]. Fu and Qu used FCN for the semantic segmentation of remote sensing images and used matrix expansion technology to optimize the convolution operation. The experimental results show that the fully trained and fine-tuned FCN can effectively perform automatic semantic segmentation of high-resolution remote sensing images, and the segmentation accuracy is higher than 85%, which improves the convolution operation efficiency [19]. Based on the full convolutional network architecture, convolutional network models for semantic segmentation have continuously emerged. Ronneberger et al. proposed UNet, and the U-shaped structure of UNet can fuse different information scales [20]. Badrinarayanan et al. proposed SegNet, which records down-sampling locations and uses them as up-sampling indices, which to some extent weakens the loss of spatial contextual information [21]. Zheng and Chen applied UNet to remote sensing image segmentation and realized the end-to-end pixel-level semantic segmentation of remote sensing images. Through the training and learning of GaoFen-2 remote sensing images, the results showed that the proposed method achieved high segmentation accuracy and generalization ability [22]. Ye et al. proposed RFA-UNet that adopts attention based on re-weighting to extract buildings from aerial imagery [23]. RFA-UNet achieves improved performance for building extraction. Zuo et al. fused deformable convolution [24] extraction features based on SegNet, used a conditional random field [25] to repair segmentation results, and obtained the best semantic segmentation results on the ISPRS dataset [26]. Additional improvements have been made by fusing multiscale features and enlarging the receptive field. Yu et al. proposed an improved PSPNet [27] by incorporating network building blocks [28] for building extraction. Lin et al. proposed a method based on Deeplab-v3 [29] for road extraction. It incorporates the squeeze-and-excitation module to apply weights to different feature channels and performs multiscale up-sampling to preserve and fuse shallow and deep information [30].
These methods have made significant advancements in terms of building extraction. However, the challenge lies in the sufficient generalization of the methods from the source domain to the other domain. Although recent CNN-based methods can obtain abstract representations of features by deepening the model, their output single-valued responses can not reflect the spatial associations between different features.The diverse and complex statistical features between different remote sensing images will limit the generalization performance of these CNN-based methods. Therefore, recent CNN-based methods only fit in the source domain. To make the model generalizable to other domains about building extraction, we introduce additional information to describe the features, including the features themselves and the spatial relationship between different features. Our solution aims to reduce the error rates of building extraction results on an almost unfamiliar dataset.

1.2. Capsule Networks for Building Extraction

Sabour et al. proposed a vector capsule network that stores the feature description information in a vector called the vector capsule. The capsule network fuses the low-level capsule information by dynamic routing and obtains a capsule with high-level semantic information [31]. Hinton et al. proposed a matrix capsule [32], which was improved based on a vector capsule network. A matrix capsule was used to replace the vector capsule, and the matrix capsule enhanced the pose recognition ability of the model. The routing mechanism in capsule networks limits the speed of forward computations. Kosiorek et al. proposed stacked capsule autoencoders (SCAEs) [33], which are a new capsule network architecture. SCAEs use the set transformer [34] instead of the routing mechanism to learn the relationship between low-level and high-level capsules, and the set transformer significantly improves the inferencing speed.
In recent years, due to the advantages of capsules in feature representation, researchers began to add capsule modules to the solution of building extraction. Yu et al. proposed a capsule feature pyramid network (CapFPN) for building footprint extraction from aerial images [35]. Taking advantage of the properties of capsules and fusing different levels of capsule features, the CapFPN can extract high-resolution, intrinsic, and semantically strong features, which perform effectively in improving the pixel-wise building footprint extraction accuracy. Yu et al. proposed a high-resolution capsule network (HR-CapsNet) to conduct building extraction [36]. First, designed with an HR-CapsNet architecture assisted by multiresolution feature propagation and fusion, the HR-CapsNet can provide semantically strong and spatially accurate feature representations to promote the pixel-wise building extraction accuracy. In addition, integrated with an efficient capsule feature attention module, the HR-CapsNet can attend to channel-wise informative and class-specific spatial features to boost the feature encoding quality.
CapFPN and HR-CapsNet successfully applied the capsule network to the building extraction, and the effect was improved compared with the CNN-based methods, but the performance of the two methods was still limited to the source dataset, and they lacked generalization. We need to design an explainable model based on capsules. We utilize capsules to make the model to automatically construct explainable building parts’ information.

1.3. Research Objectives

This paper attempts to propose a a novel building extraction method, which can not only effectively extract buildings but also perform great generalization from the source remote sensing dataset to another. The objectives of this paper can be summarized as follows:
  • We propose a novel building extraction method: Capsule–Encoder–Decoder. The encoder extracts capsules from remote sensing images. Capsules contain the information of buildings’ parts. Additionally, the decoder calculates the relationship between the target building and its parts. The decoder corrects the buildings’ distribution and up-samples them to extract target buildings.
  • Compared with the mainstream deep learning methods on the source dataset, our method will achieve convergence faster and show higher accuracy.
  • Capsules in our method have high-level semantic information, which are more explanatory.
  • Without fine tuning, our method will reduce the error rates of building extraction results on an almost unfamiliar dataset.

2. Materials and Methods

In this section, we introduce the proposed Capsule–Encoder–Decoder in detail. We first introduce the overall network architecture in Section 2.1. Secondly, we introduce the encoder in Section 2.2. Thirdly, we introduce the decoder in Section 2.3. Then, the loss function and training strategy are presented in Section 2.4. Finally, we describe the datasets used in this paper in Section 2.5.

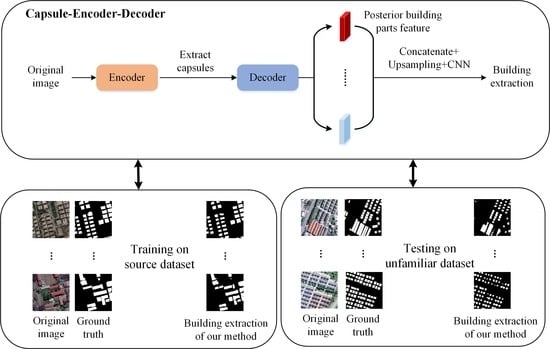
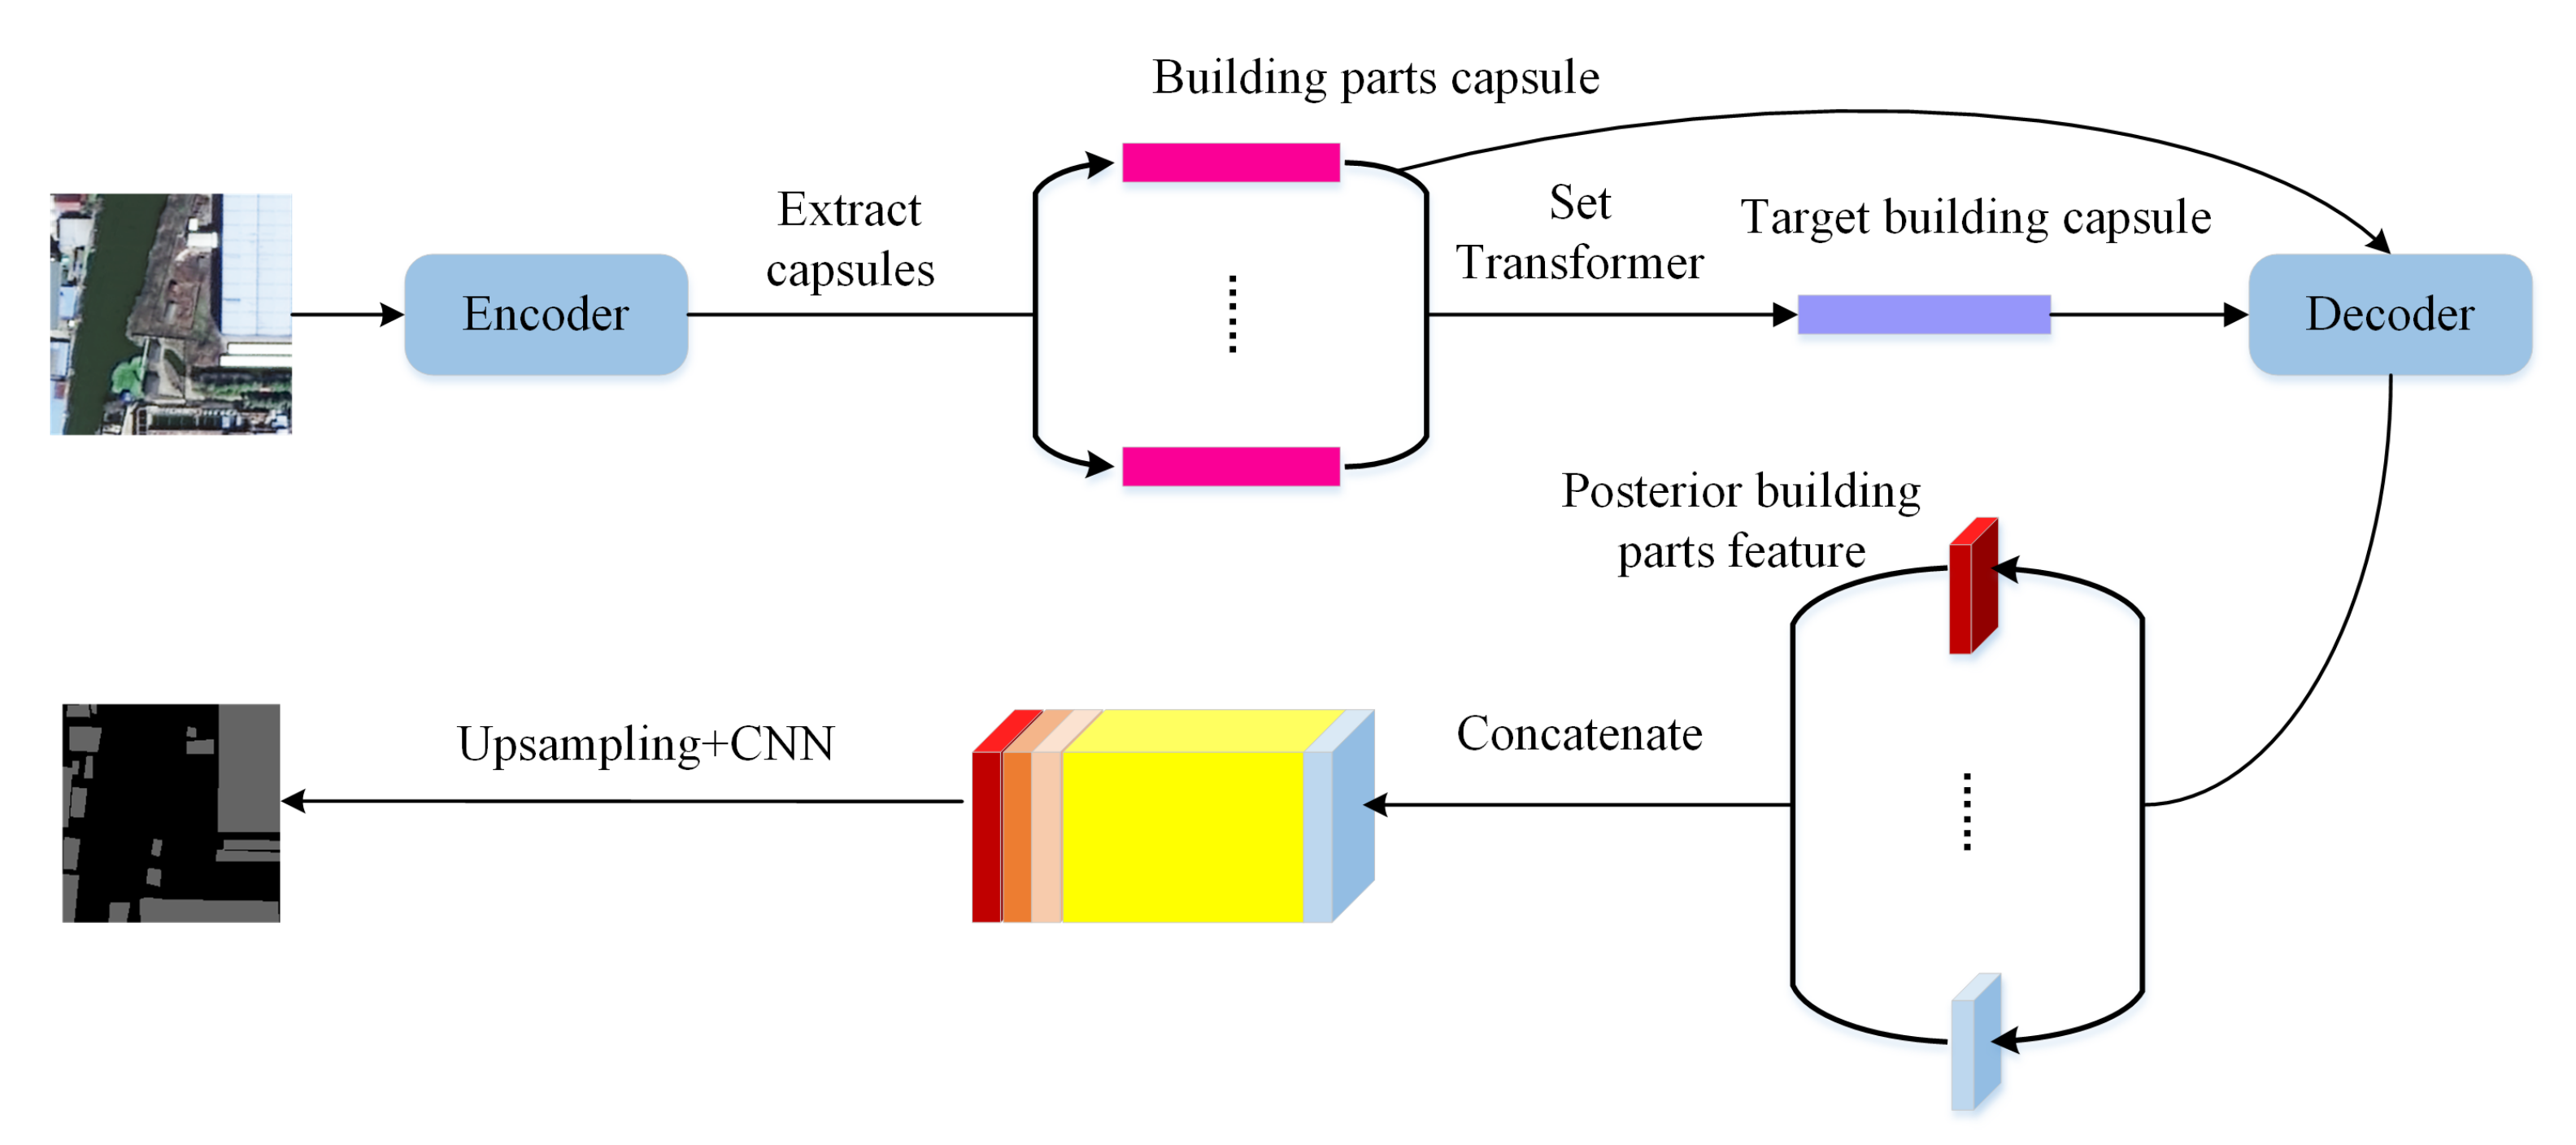
2.1. An Overview of Capsule–Encoder–Decoder

In our work, capsules are used to store feature information, and a Capsule–Encoder–Decoder architecture is proposed for the building extraction of remote sensing images. The Capsule–Encoder–Decoder includes two main structures: an encoder and a decoder. The encoder extracts the building part capsules and then uses the set transformer to fuse the building part capsules to obtain the capsule of the target buildings. The decoder calculates the relationship between the building part capsules and the target building’s capsule. Then, the decoder fuses the relationship information into the building parts’ feature distribution to obtain the posterior building parts’ feature distribution. The deconvolution operation is used to up-sample the posterior building parts’ feature distribution. Finally, we extract the target buildings from remote sensing images. The overall framework of our method is shown in Figure 1.
A capsule is a vector that stores detailed descriptions of features. For the feature representation vector output by the neural network, the value in the vector represents the activation degree of the feature, and only one vector contains the information of all features, which causes the feature representation vector to lose rich descriptive information. We use a certain number of capsules to represent the features (parts) of the target object, respectively. Each feature (part) can be described in detail by the corresponding capsule, including the activation degree, posture, color, and texture of the feature (part). The feature representation vector only stores the activation information of target objects’ feature (part) and lacks explainability, while the capsule allows the model to perceive explainable features, thereby improving the generalization.
We design a general loss function for the Capsule–Encoder–Decoder. This loss function guides the model to implicitly learn to perceive explainable building parts’ features. In our method, the posterior building parts’ feature distributions by the decoder is feature maps with explainable semantic information. Then, we can use these explainable feature maps to achieve information aggregation. Current semantic segmentation models usually up-sample low-resolution feature maps and then restore detailed information through convolutional network operation. This process is also called deconvolution network operation. CNN-based methods, CapFPN, and HR-CapsNet are not considered to achieve explainable low-resolution feature maps. In fact, explainable feature maps are important for the generalization of building extraction. From a human perspective, we are able to recognize buildings from images because we can pinpoint the various parts of the building, such as the central area of the building, the edge areas of the building, and some objects around it. Although the building in the image changes due to factors such as shooting angle and brightness, humans are already familiar with the various parts of the building, so humans can still recognize it. From the perspective of computer vision, the feature maps output by the model actually represent the various parts of the building, but the feature maps obtained by the past methods are not explainable, which leads to the transformation of the image and causes the intermediate feature maps to be extremely complex. So, it is easy to get wrong perception results. All in all, Capsule–Encoder–Decoder can perceive explainable feature maps and improve the generalization of the model on different datasets without fine tuning.

2.2. Architecture of Our Encoder

The encoder extracts building part capsules from shallow feature maps and uses the set transformer to fuse building part capsules. The architecture of encoder is shown in Figure 2. For an original remote sensing image, the encoder first uses a convolutional neural network to extract shallow feature maps that contain textures and other details. The parallel convolutional neural networks module is used to extract building parts’ feature maps from shallow feature maps. We use the backbone of UPerNet [37] to initialize the encoder; the first layer of modules is used to extract common features, and the remaining three layers of modules are arranged in parallel to extract information such as pose and texture. The feature map of the building part capsule m is divided into three objects:
  • Posture information p o s e m m a p , which stores posture information such as rotation, translation, scaling, and shearing.
  • Texture details c m m a p , which reflects the color and texture properties of the building parts.
  • Attention distribution A t t n m m a p , which reflects the possible position distribution of the building parts in the original image.
Attention pooling is used to compress feature maps of building parts into building part capsules. For building part capsule m, the corresponding capsule vector is u m . Assuming that the size of the parallel convolutional neural network output is h e × w e , attention pooling is:
u m = i h e j w e c o n c a t ( p o s e m m a p , c m m a p ) i , j · s i g m o i d ( ( A t t n m m a p ) i , j )
where c o n c a t ( · ) is concatenate operation.
We use the building part capsules’ set U as the set transformer input to output the target capsule set V. Here, U = u m | m = 1 , 2 , , M . Since the semantic segmentation objects of the task in this paper are only buildings, the target capsule set is denoted as V = v . The building capsule is calculated as:
V = S e t T r a n s f o r m e r ( U )
where U is the set of the most representative building part capsules in the image. V is the building capsule composed of these parts. S e t T r a n s f o r m e r ( · ) is the set transformer [34], which is an improved version of Transformer [38].
The parallel convolutional network module of the encoder can be used to extract different parts in the building. For the output of the ith convolution branch, the part’s attention distribution in the feature maps represents the distribution information of the ith building part in the remote sensing image, and the rest of the feature maps represent the pose and color texture information of the building part, where i = 1 , , M . We take the part’s attention distribution as the prior distribution for this part of building. We use attention pooling operation to compress the output of each convolutional branch into capsules. Intuitively, the capsule is actually the most representative building part in the remote sensing image. There are too many buildings in the image, and all the buildings in the same image will change synchronously with the change of shooting angle and brightness. Therefore, we can use the most representative ith building part capsule to represent the pose and other information of the ith part of all buildings in the image. We use a vector capsule to represent a certain part of all buildings, which can reduce the computational storage cost and add additional descriptive information to the representation of features.

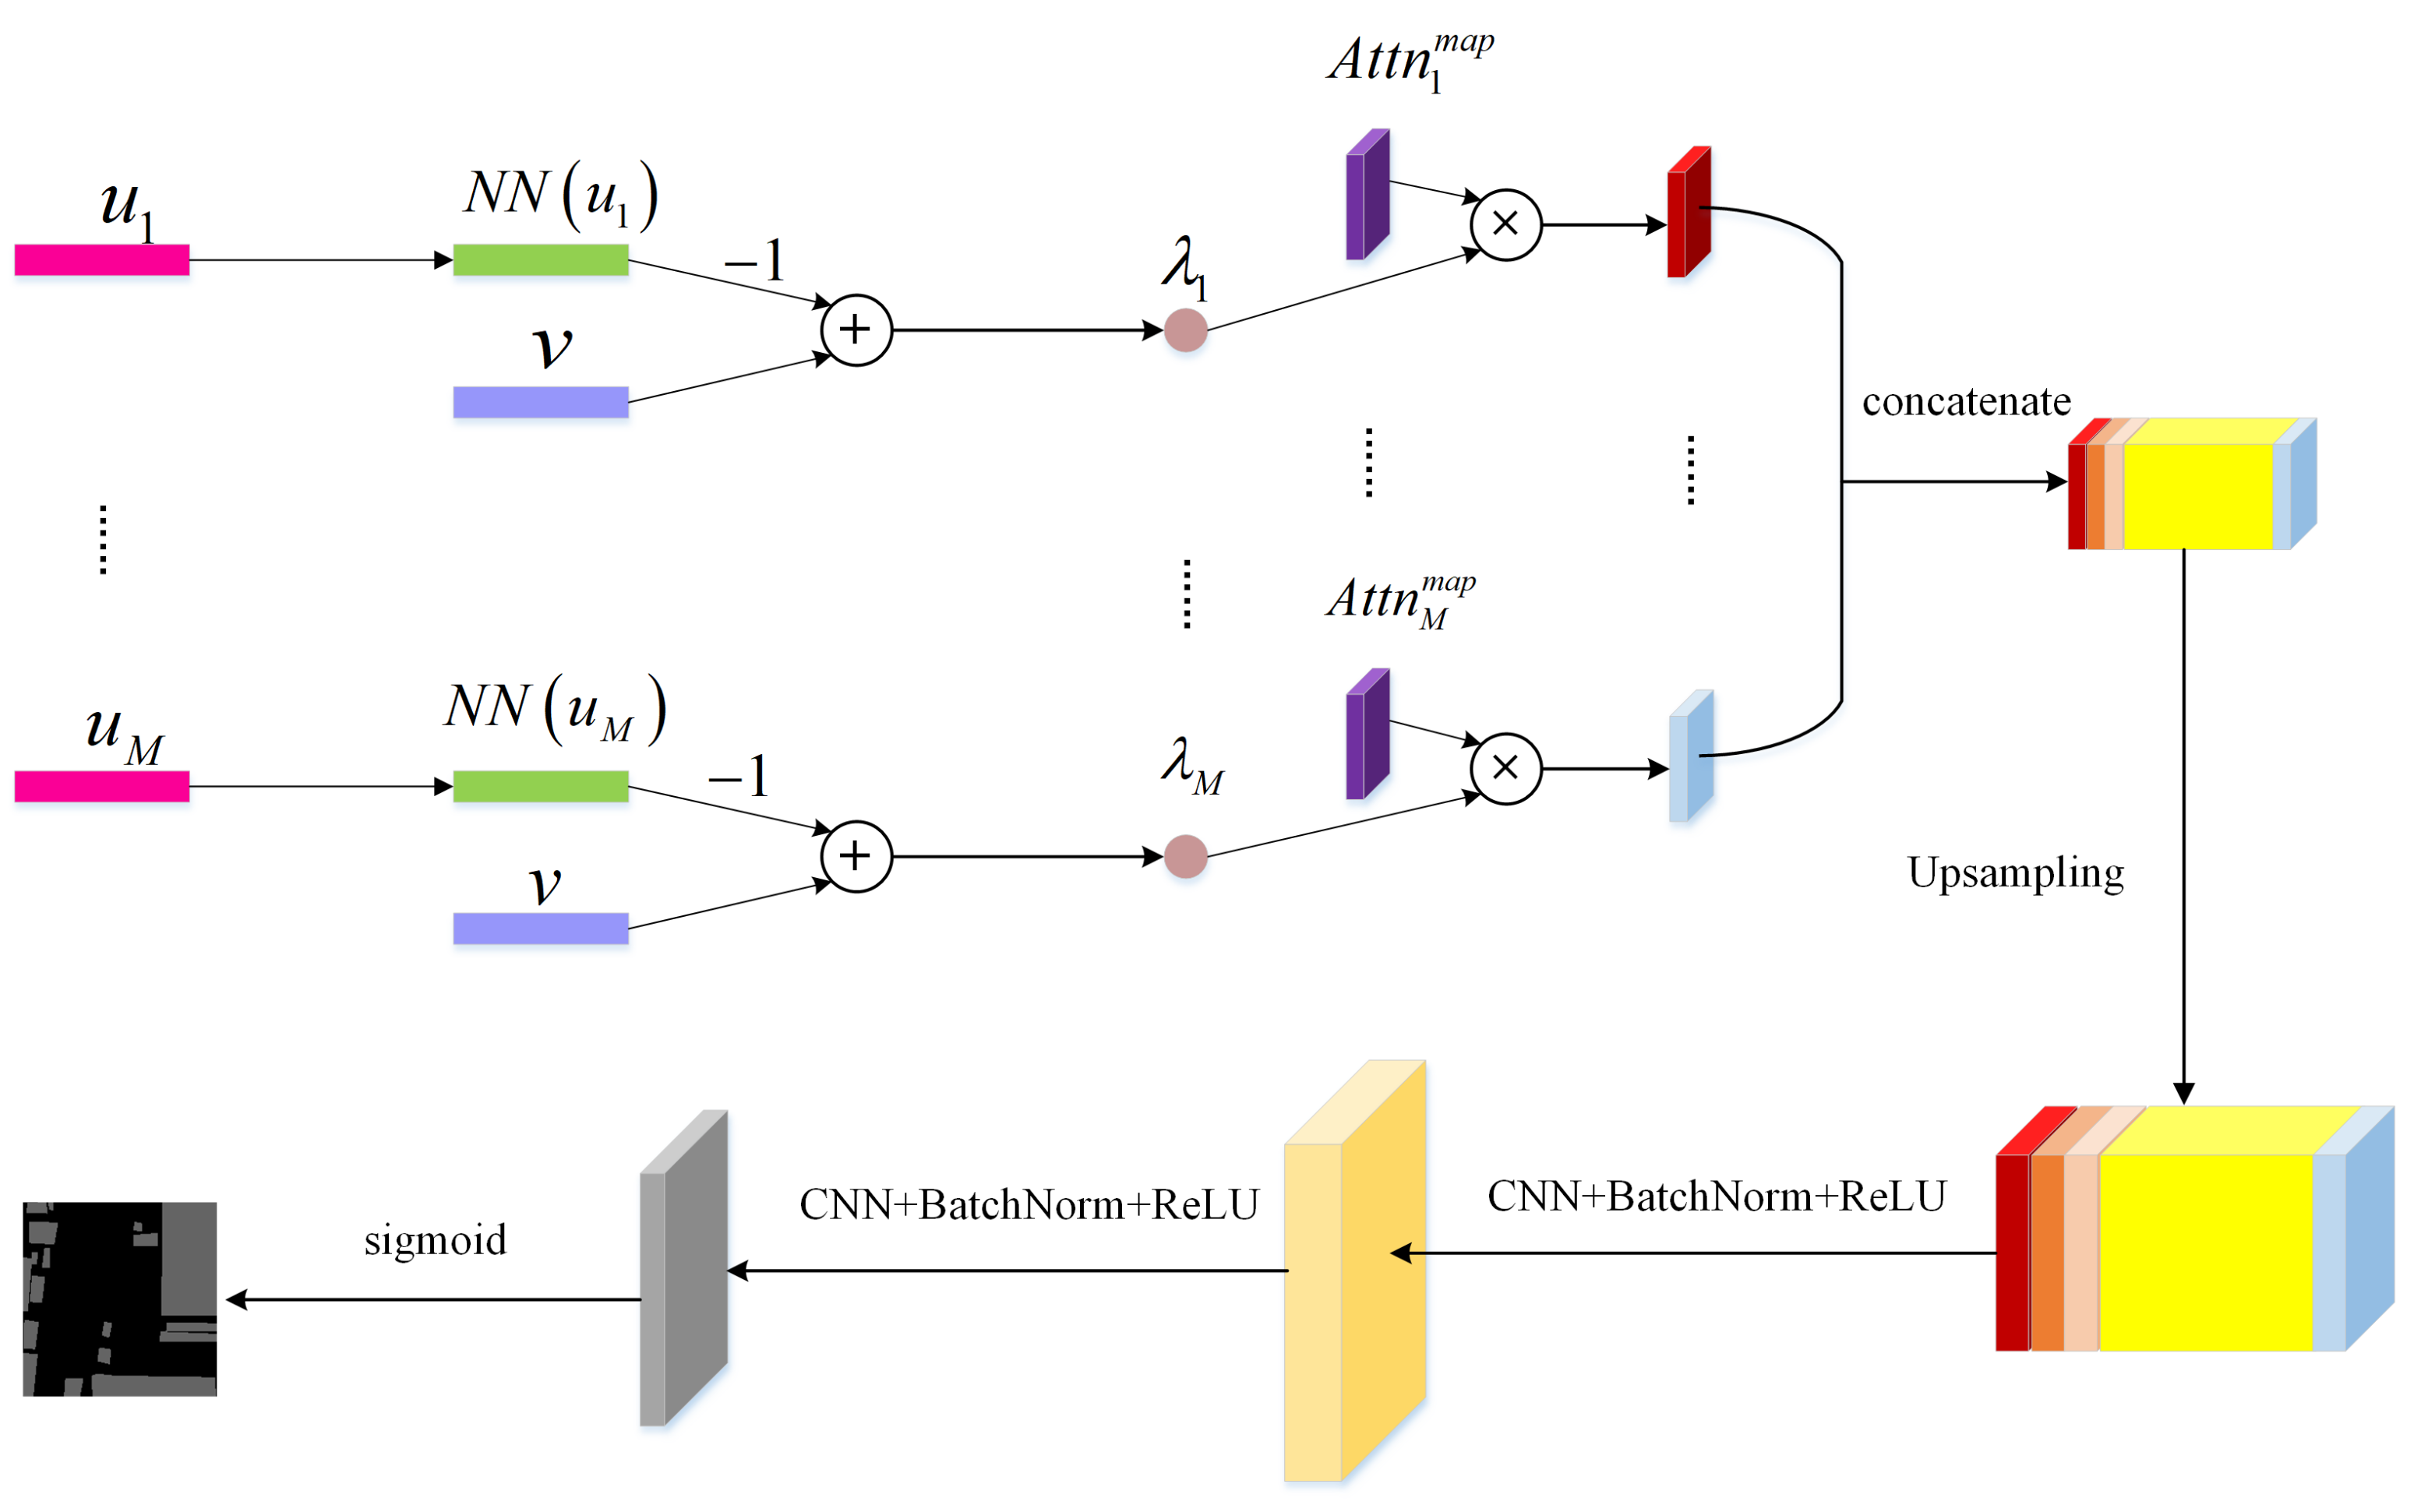
2.3. Architecture of Our Decoder

The decoder used in this paper reflects the idea of a prototype network [39]. In this paper, a linear network is used to transform the residual between the building capsule and the building part capsule to obtain the connection probability between the building and the building part, namely, the degree of membership. The decoder uses the degree of membership to correct the part attention distribution, and we can obtain the semantic segmentation results by up-sampling this posterior attention distribution. The decoder is shown in Figure 3. In the degree of membership calculation, two linear modules are established. One module denoted as N N is used to transform the expression of the part capsules. Another module denoted as F N is used to process the residual information between part capsules and the building capsule. The degree of membership λ i between part i and the building is calculated as:
λ i = F N ( N N ( u i ) v )
where i 1 , 2 , , M .
The decoder fuses the degree of membership with the prior part attention distribution to obtain a more accurate posterior part attention distribution. For convolutional networks, each channel represents a feature. From the perspective of high-level semantics, these features correspond to building parts. Therefore, we can concatenate posterior part attention distributions to obtain a more explanatory feature map p a r t m a p . The above process can be described as:
p a r t m a p = c o n c a t [ ( λ 1 · A t t n 1 m a p ) , , ( λ M · A t t n M m a p ) ]
p a r t m a p takes advantage of capsule information and considers the potential spatial relationships between parts and building, which can more accurately reflect the extent to which parts are activated. In addition, because the channel of p a r t m a p corresponds to the individual part, it has stronger explainability. We use deconvolution operation to decode the feature maps to obtain semantic segmentation results o b j e c t .
A t t n m a p is the encoder’s rough judgment on the distribution of building parts, and we call it parts prior distribution. We can not have high confidence that parts prior distribution is representative of building parts distribution in space. Therefore, we refer to the idea of the prototype network [39]: the representation of the whole object is obtained according to the fusion of parts, and then the similarity λ between the whole object and parts is calculated. λ is used to correct parts prior distribution (the more similar the part is to the whole object, the better the part is likely to belong to this object), which results in a more accurate parts posterior distribution.

2.4. Loss Function

The loss function of this method includes two items:
  • The cross entropy between the semantic segmentation results and ground truth.
  • The cross entropy between the posterior part distribution accumulation results and the ground truth.
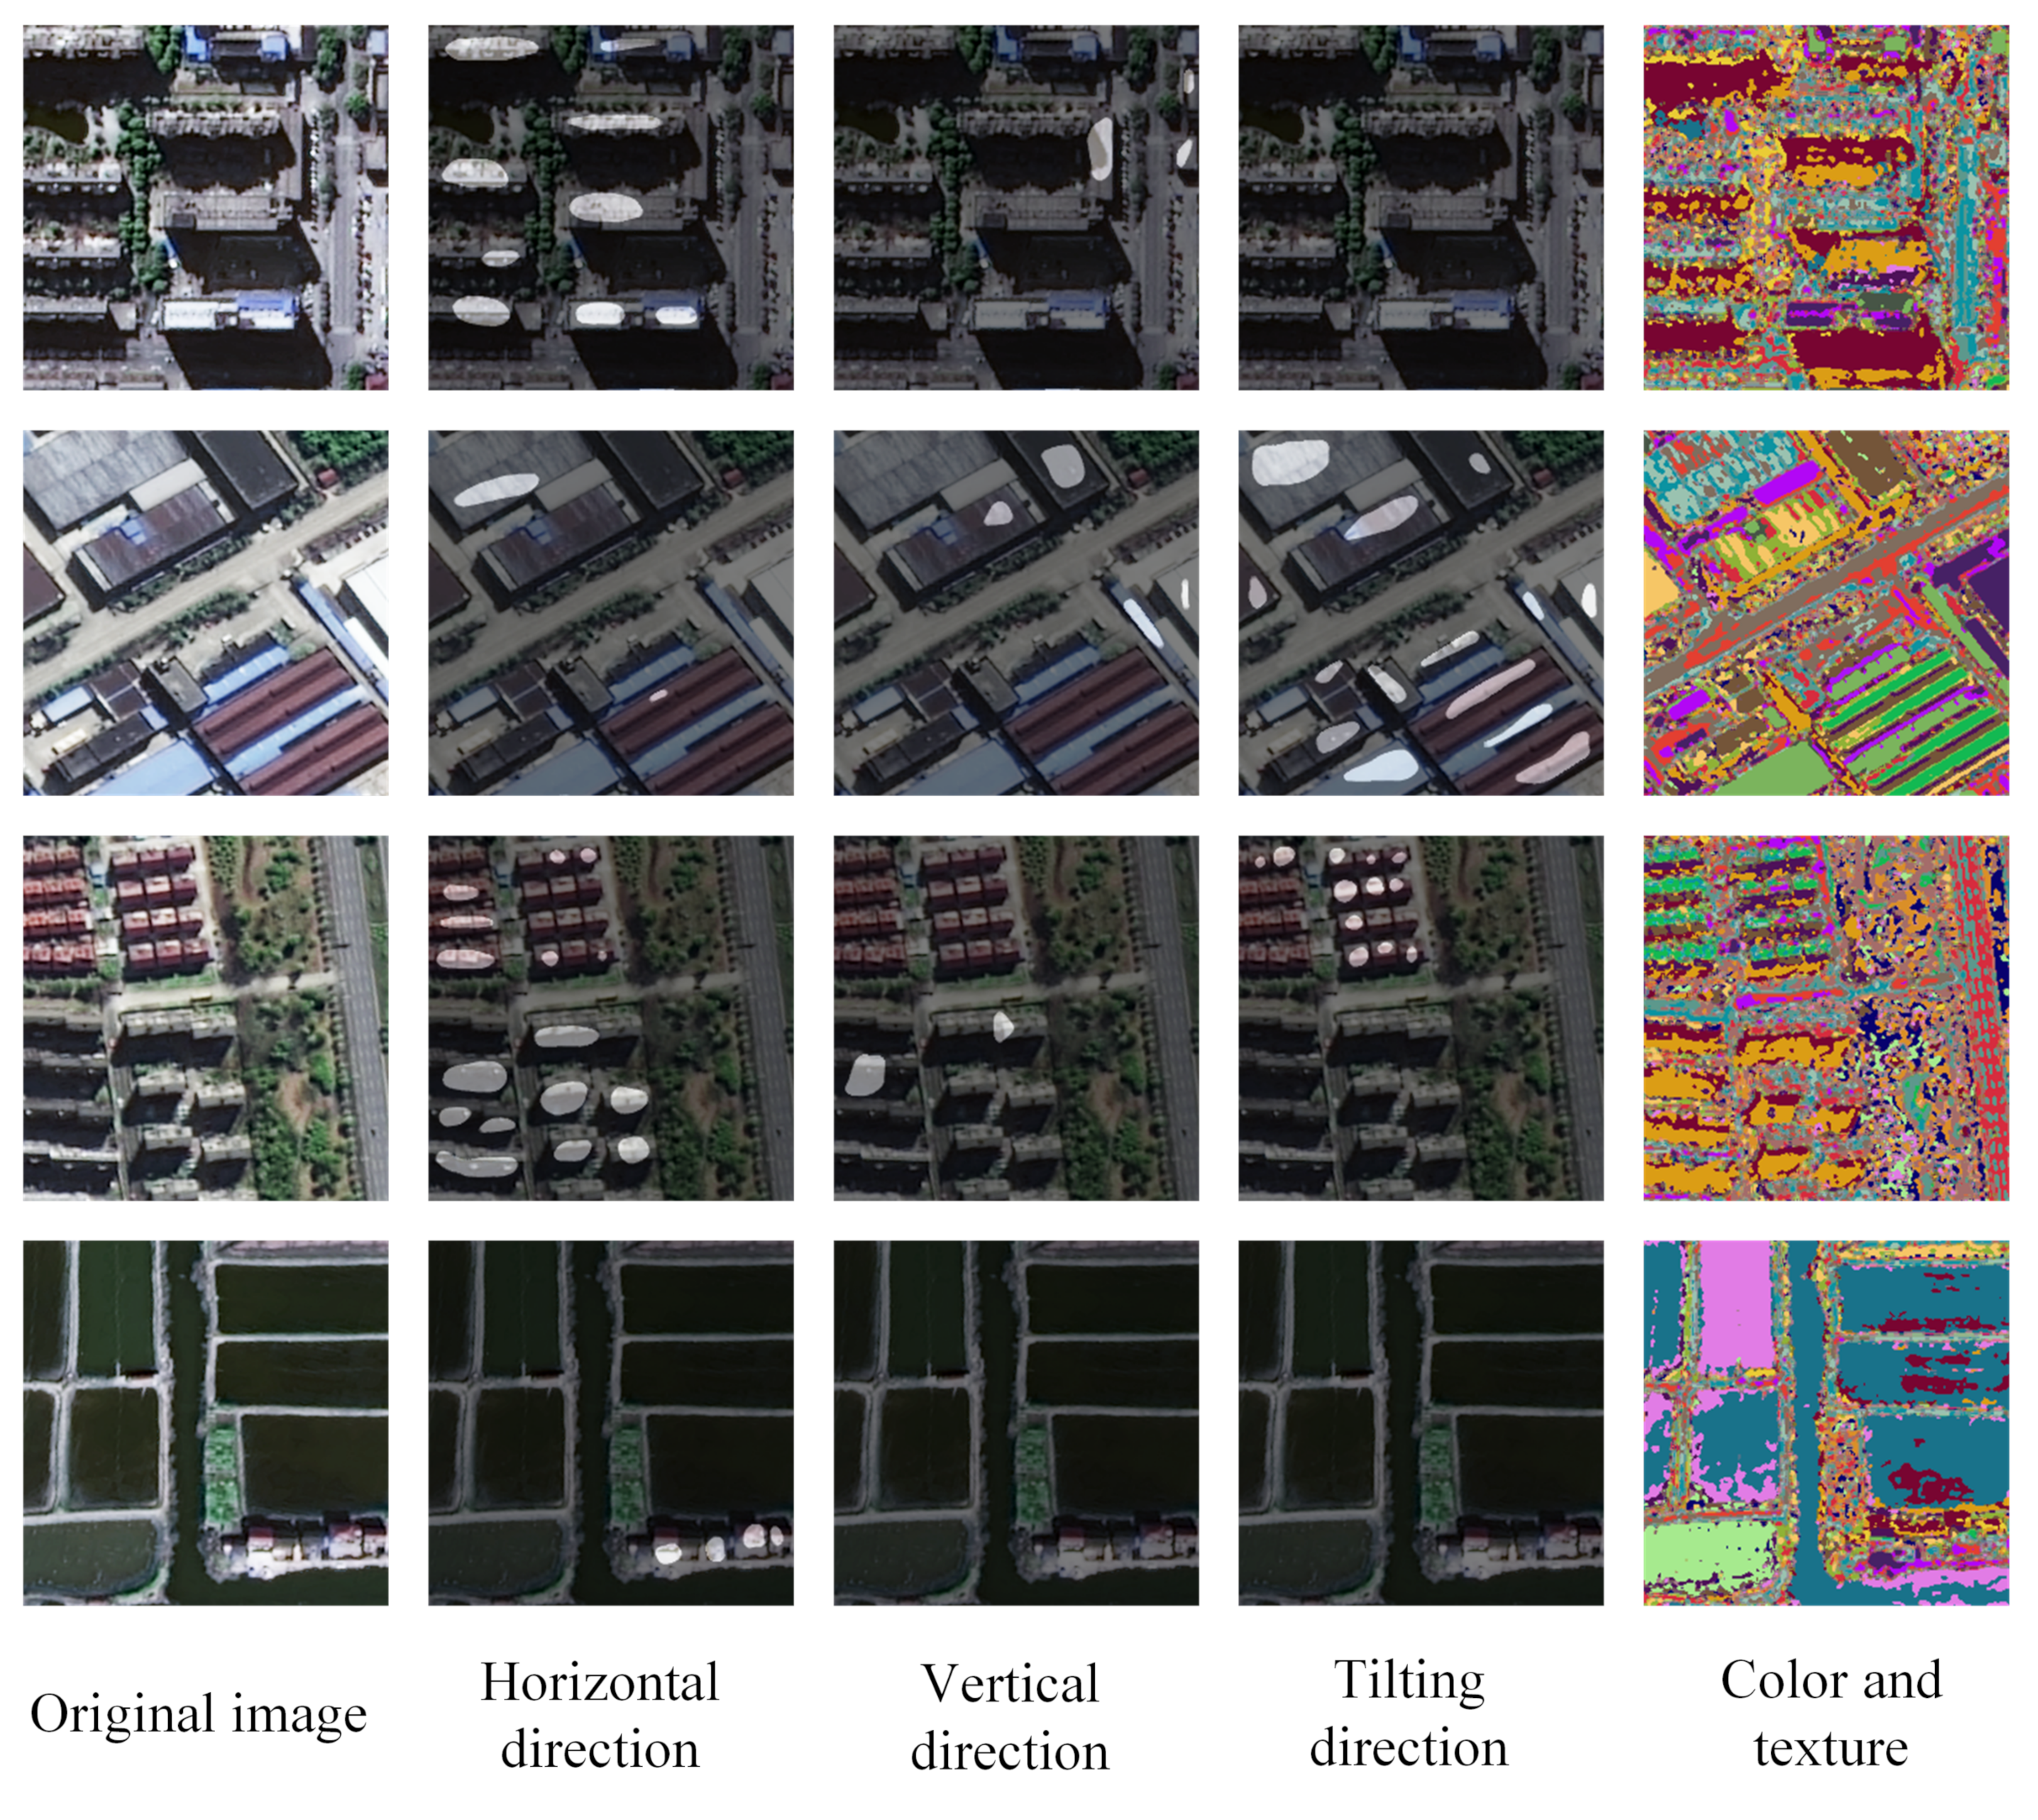
For the first item of the loss function, the goal is to make the model learn intuitively and make the semantic segmentation results close to the ground truth. For a single sample, assuming the number of pixels is N, for pixel i, the probability of its classification as buildings is o b j e c t i . If the pixel is building, the pixel is labeled y i = 1 ; otherwise, the pixel is labeled y i = 0 . The first item of the loss function is defined as:
l o s s 1 = i = 1 N y i l o g ( o b j e c t i )
For the second item of the loss function, we accumulate the posterior part distributions, directly classify the results after up-sampling, and then calculate the cross-entropy loss pixel by pixel with the ground truth. The second part of the loss can force the model to learn to perceive building parts, thereby strengthening the explainability of the model so that the parts extracted by the encoder are a part of a building. The second item of the loss function is defined as:
l o s s 2 = i = 1 N y i l o g ( u p s a m p l e ( m = 1 M λ m · A t t n m m a p ) i )
Loss function is:
l o s s = a · l o s s 1 + b · l o s s 2
where a and b are two weights of the loss.

2.5. Data

In this study, we test our method on three building extraction datasets, Yellow River, Massachusetts [40] and WHU dataset [3]. Yellower River is the dataset manually annotated by ourselves, and the following is a description of Yellow River.
The dataset consists of 23 scenes from the GF-2 satellite multitemporal remote sensing images in the lower reaches of the Yellow River. The closed polygon labeling method is used to visually interpret the target buildings, and the labeling objects are the buildings located along the Yellow River bank. The dataset preprocessing includes the following steps:
  • Extract the ground truth from the labeled information, which is a binary gray image.
  • Cut the high-resolution remote sensing image from size of 3000 × 3000 to the slices with size of 256 × 256.
  • Randomly flip and shift the slice images.
  • Standardize images along RGB channels.

3. Results

This section includes the experimental setup and results. We analyze the internal modules of the model through ablation experiments. We compare this method with the recent excellent methods to verify the effectiveness of this method on building extraction. Then, we performed an analysis of the explainability of the model output feature maps. For the last and most important goal of this paper, we use unfamiliar datasets to verify the generalization of each method without fine tuning. The results prove that our method can not only effectively extract buildings but also perform great generalization from the source remote sensing dataset to another.

3.1. Experimental Setup

3.1.1. Evaluation Metrics

The metric of this paper is the IoU (Intersection over Union). The calculation of the IoU is as follows:
I o U = 1 k + 1 i = 0 k p i i j = 0 k p i j + j = 0 k p j i p i i
where k is the number of categories, p i j represents the number of pixels whose real category is i and the predicted category is j.
In addition, we also use the PA (Pixel Accuracy) as the metric. The PA refers to the proportion of pixels with correct classification in the total number of pixels. The calculation of the PA is defined as:
P A = i = 0 k p i i i = 0 k j = 0 k p i j
We just set the number of categories equal to 1, and we denote the performance on the source dataset as IoU and PA, and denote the performance on another dataset as IoU’ and PA’. Therefore, we use δ IoU and δ PA as the metrics of generalizability. δ IoU and δ PA are defined as:
δ I o U = I o U I o U , δ P A = P A P A

3.1.2. Experimental Details
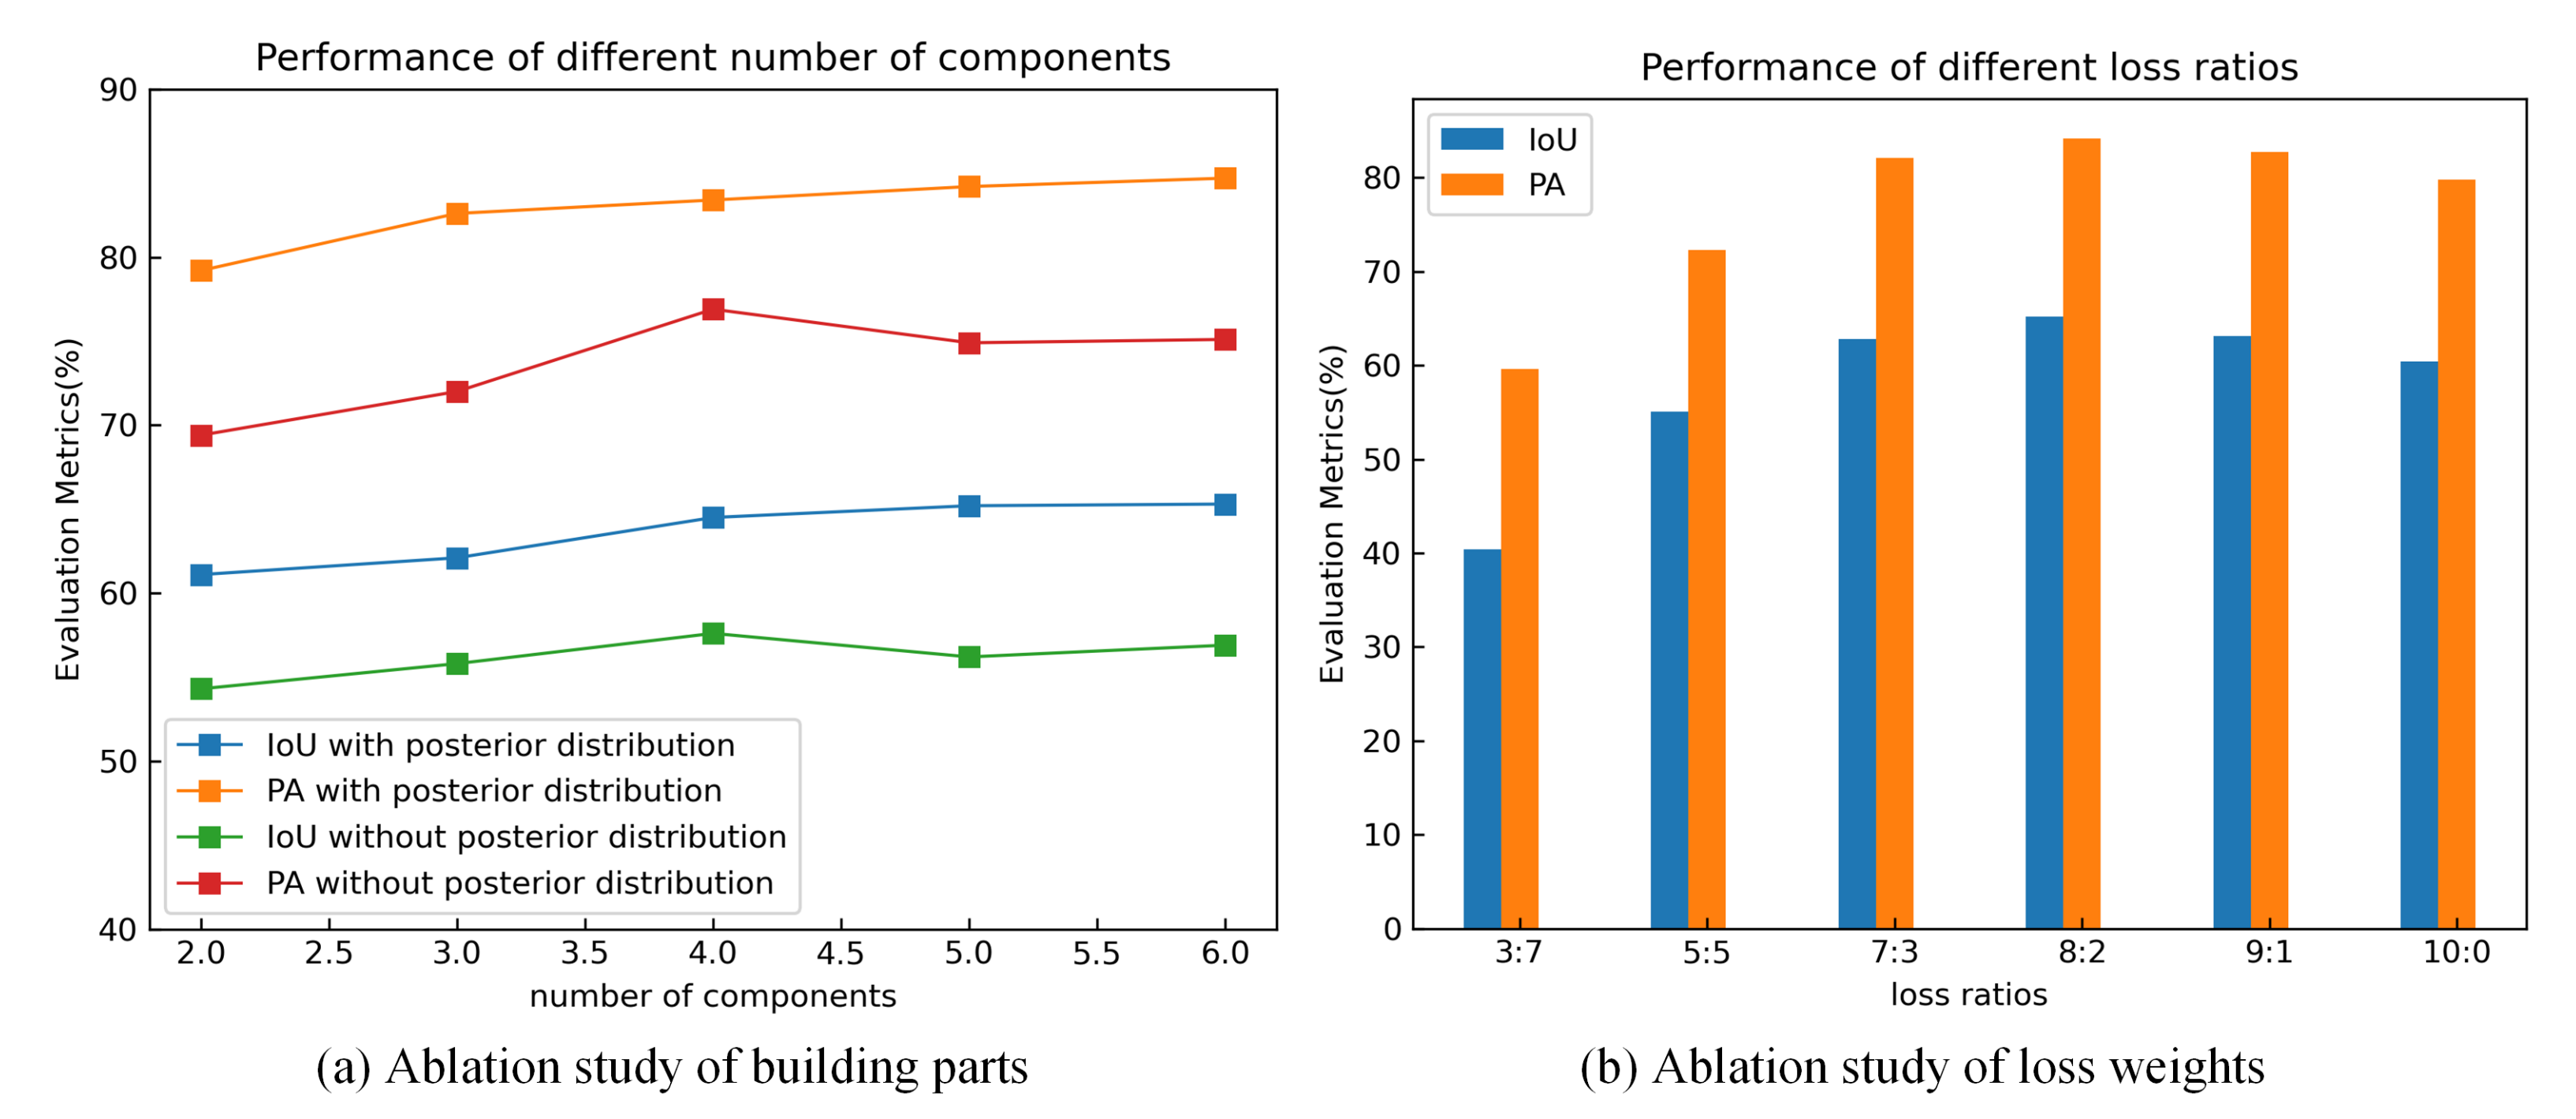
In the ablation study, we set the number of building parts equal to an integer; that is, parallel convolution consists of five convolution branches, and each convolution branch is set to a network module with the same structure. We set the integer from 2 to 6. For each integer, we compare the results of using parts posterior distribution and using parts prior distribution as p a r t m a p , respectively. In addition, we set different loss weights, including {3:7, 5:5, 7:3, 8:2, 9:1, and 10:0}. In these different situations, we train our model and analyze the results.
To compare our method, we reimplement seven mainstream CNN-based models: FCN-8s, SegNet, SegNet+DeformableConv, UNet, RFA-UNet, PSPNet, and Deeplab-v3, and two capsule-based models: CapFPN and HR-CapsNet. The loss function of the mainstream convolutional network uses binary cross entropy loss. The same optimization method, Adam [41], is used in training our method, the seven mainstream convolutional networks, and two capsule-based methods. The learning rate of Adam is set to 0.0001, and the beta parameters are set to (0.5, 0.99). The other parameters are the default values of Adam. To divide the dataset, we shuffle the slice samples in the dataset. According to the rules of dataset division [42], 70% of the samples are taken from the dataset as the training set, and the remaining 30% of the samples are taken as the test set. Finally, we set the number of epochs to 100 and the batch size to 4.
We use Yellow River as the source dataset and test the generalization of building extraction on Massachusetts. Specifically, we train our method, CNN-based methods, and capsule-based methods on the training set of Yellow River, and we use the test set of Yellow River to compare the performance of each method. We will not use the Massachusetts dataset to train either method, we directly make all methods inference on the Massachusetts dataset to compare the generalization of all methods.
To further confirm the generalization of our method, we report more results on the WHU dataset. We train methods on the Yellow River training set and test on the WHU test set. We train methods on the WHU training set, test on the WHU test set, and test on the Yellow River test set.

3.2. Ablation Study

The setting of the number of building parts will have a greater impact on the performance of the model. To verify this point, we set the number of building parts from 2 to 6. We train these models and record the IoU and the PA of each model on the test dataset and the number of iterations required for each model to converge.
It can be seen from Table 1 that as the number of building parts increases, the model will perform better. When the number of building parts reaches a certain value, the changes in the IoU and the PA will no longer be obvious. If the number of building parts is small, the model’s ability to perceive features will decrease, resulting in a decrease in the IoU and the PA. If the number of building parts is large, the model will have stronger feature perception, but it will also prolong the learning process.
In Table 1, we can find that the test performance of the model drops significantly if we use parts prior distribution as p a r t m a p . This phenomenon shows that the correction of parts prior distribution by the decoder has a positive effect. Likewise, the results in Table 1 demonstrate that it is necessary to compute parts posterior distributions.
We set the number of building parts equal to 5. Such a setting can ensure that the model maintains a good performance on the test set, and the model can converge in a small number of iterations.
Additionally, we set different loss weights a and b, including {3:7, 5:5, 7:3, 8:2, 9:1, and 10:0}. In these different situations, we train our model and analyze the results. We record the IoU and the PA of each model on the test dataset.
Table 2 shows that if we set the loss weights to 8:2, the model will perform well. When the weights are 3:7, the learning process of the model will pay more attention to the second item of the loss function while weakening the contribution of the first item of the loss function. The first item is used to optimize the pixel classification task of the model, and the second item can give the building part capsule the ability to express high-level semantic information. If the contribution of the first item is excessively weakened, the semantic segmentation performance of the model will be significantly reduced, and the effect of the model in achieving building extraction will inevitably be reduced. When we overly weaken the contribution of the second item, the ability of the building part capsule to perceive high-level semantic features will decrease, which will affect the performance of the model when the building is extracted.
We can also find a balance of loss weights. When we set the loss weights to 8:2, Capsule–Encoder–Decoder can perceive high-level semantic features in the capsules while maintaining the good performance of building extraction.
Through the ablation study, we can set up Capsule–Encoder–Decoder more clearly (Figure 4). We set the number of building parts from equal to 5. In addition, we set the loss weights to 8:2.

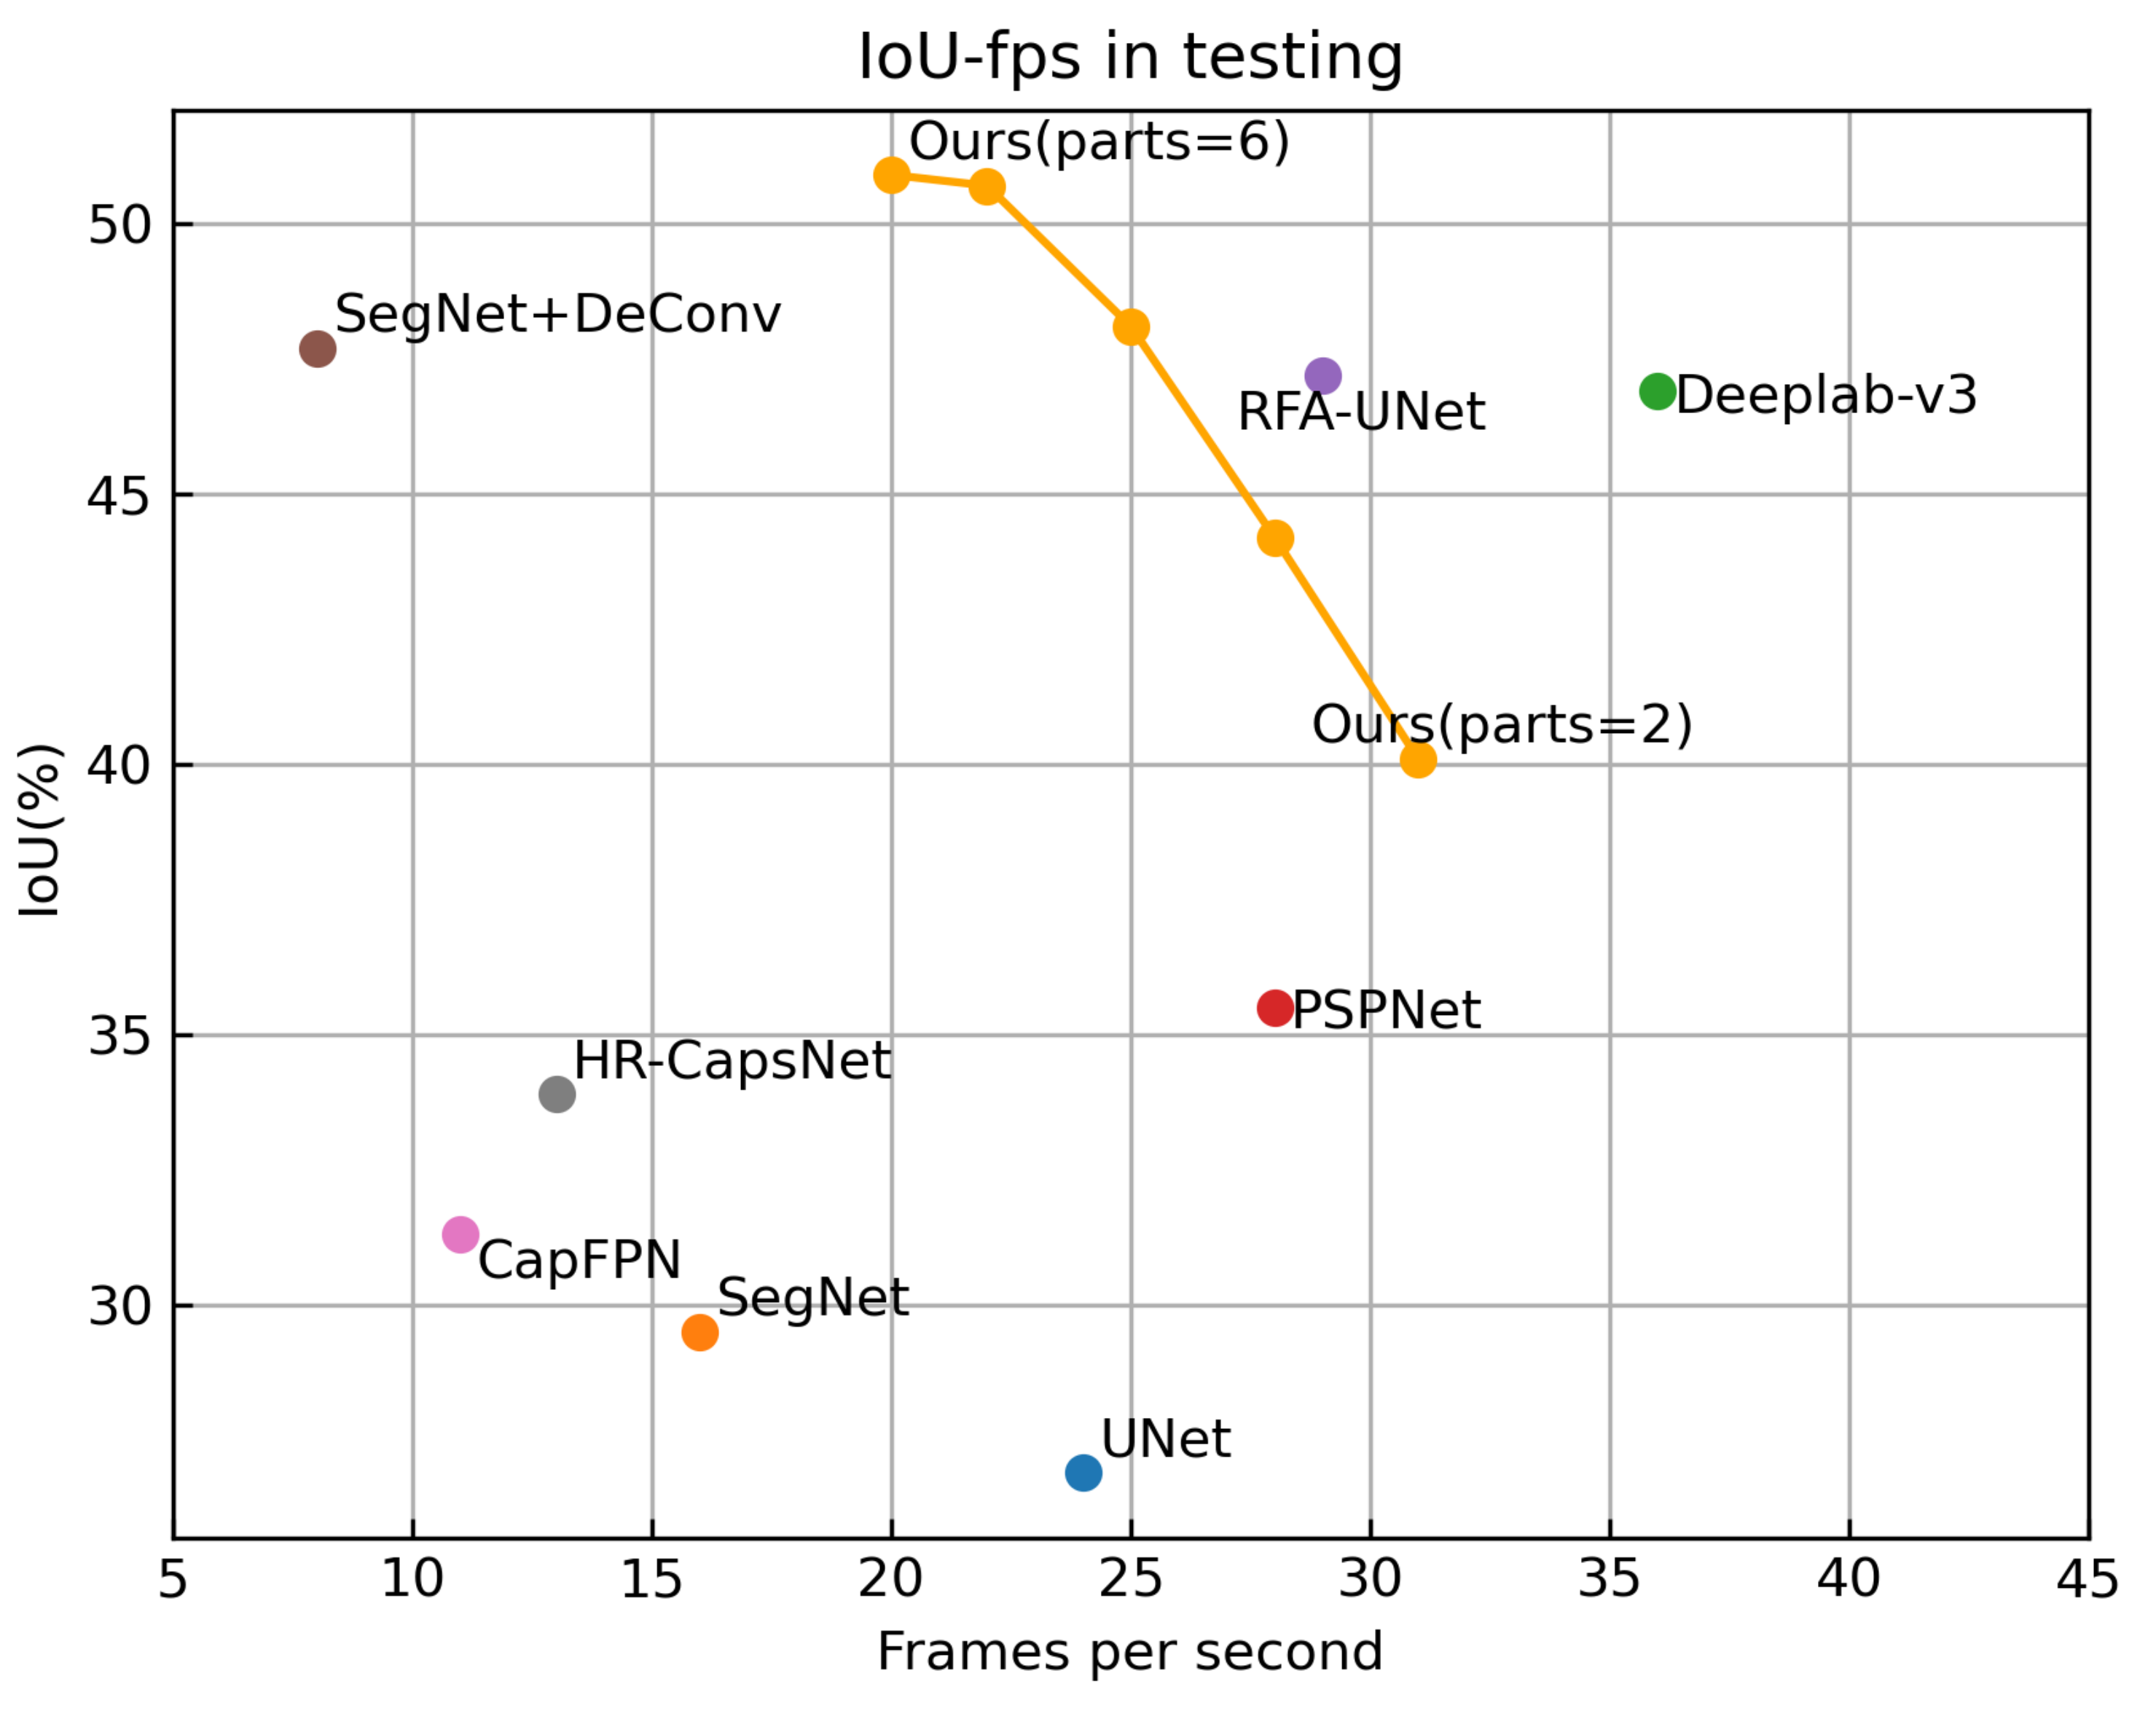
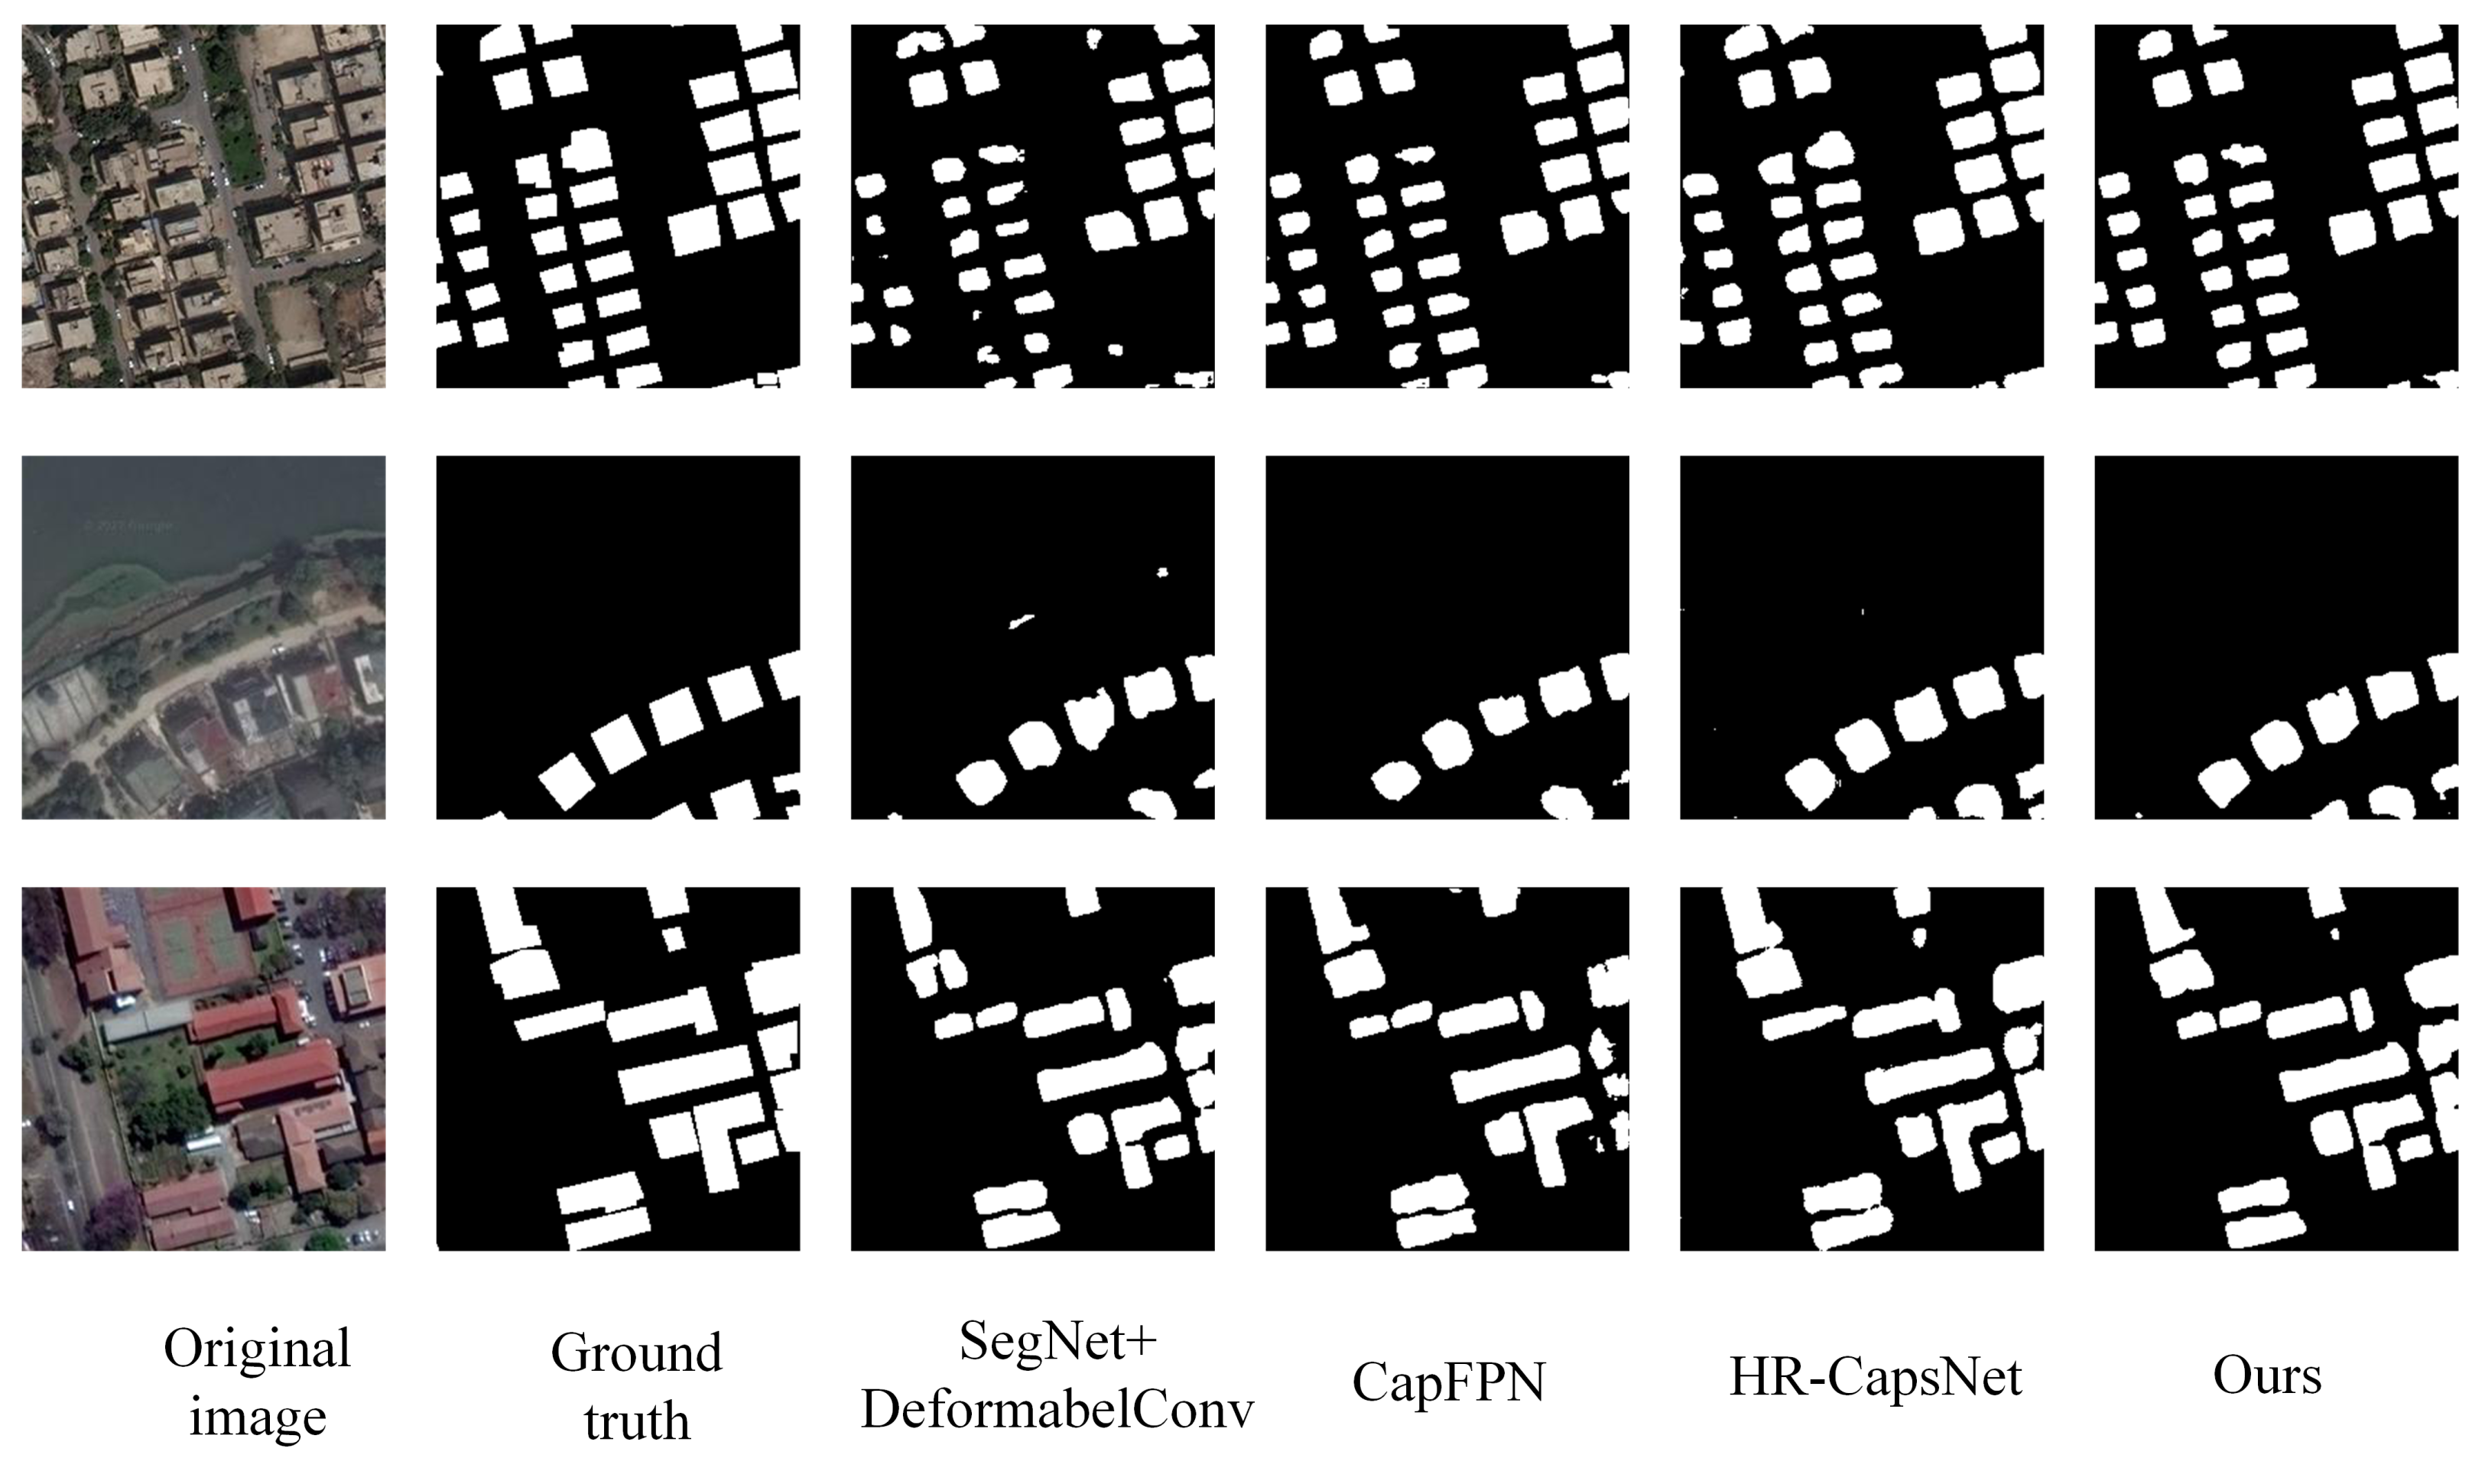
3.3. Compared with CNN-Based Methods and Capsule-Based Methods
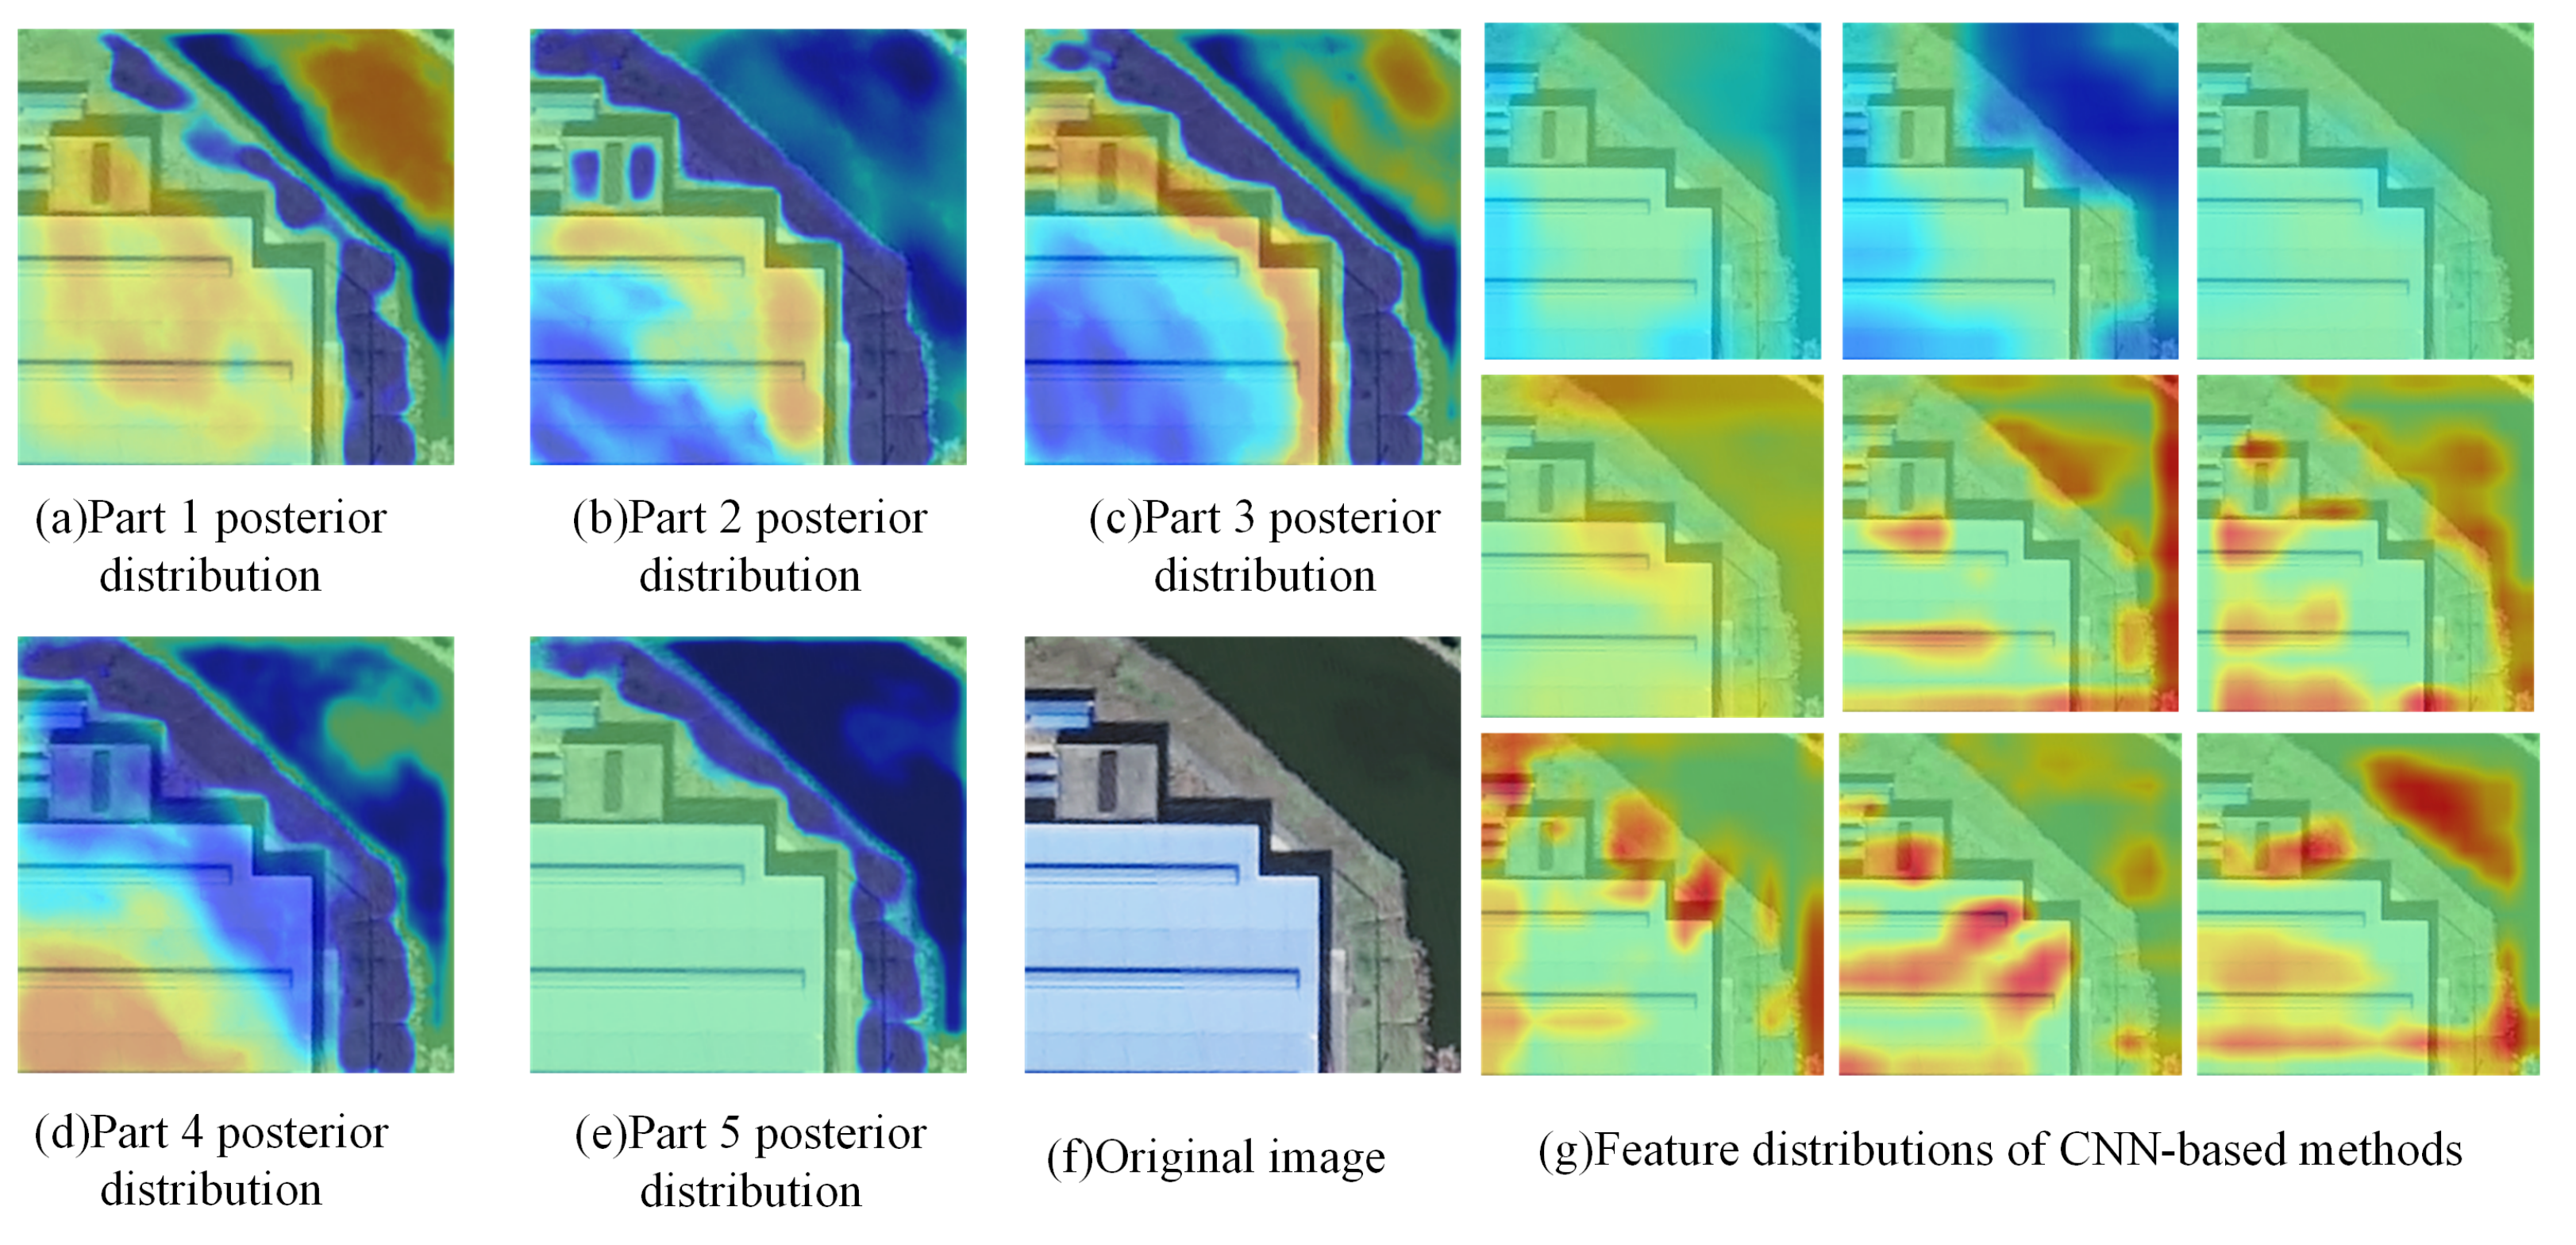
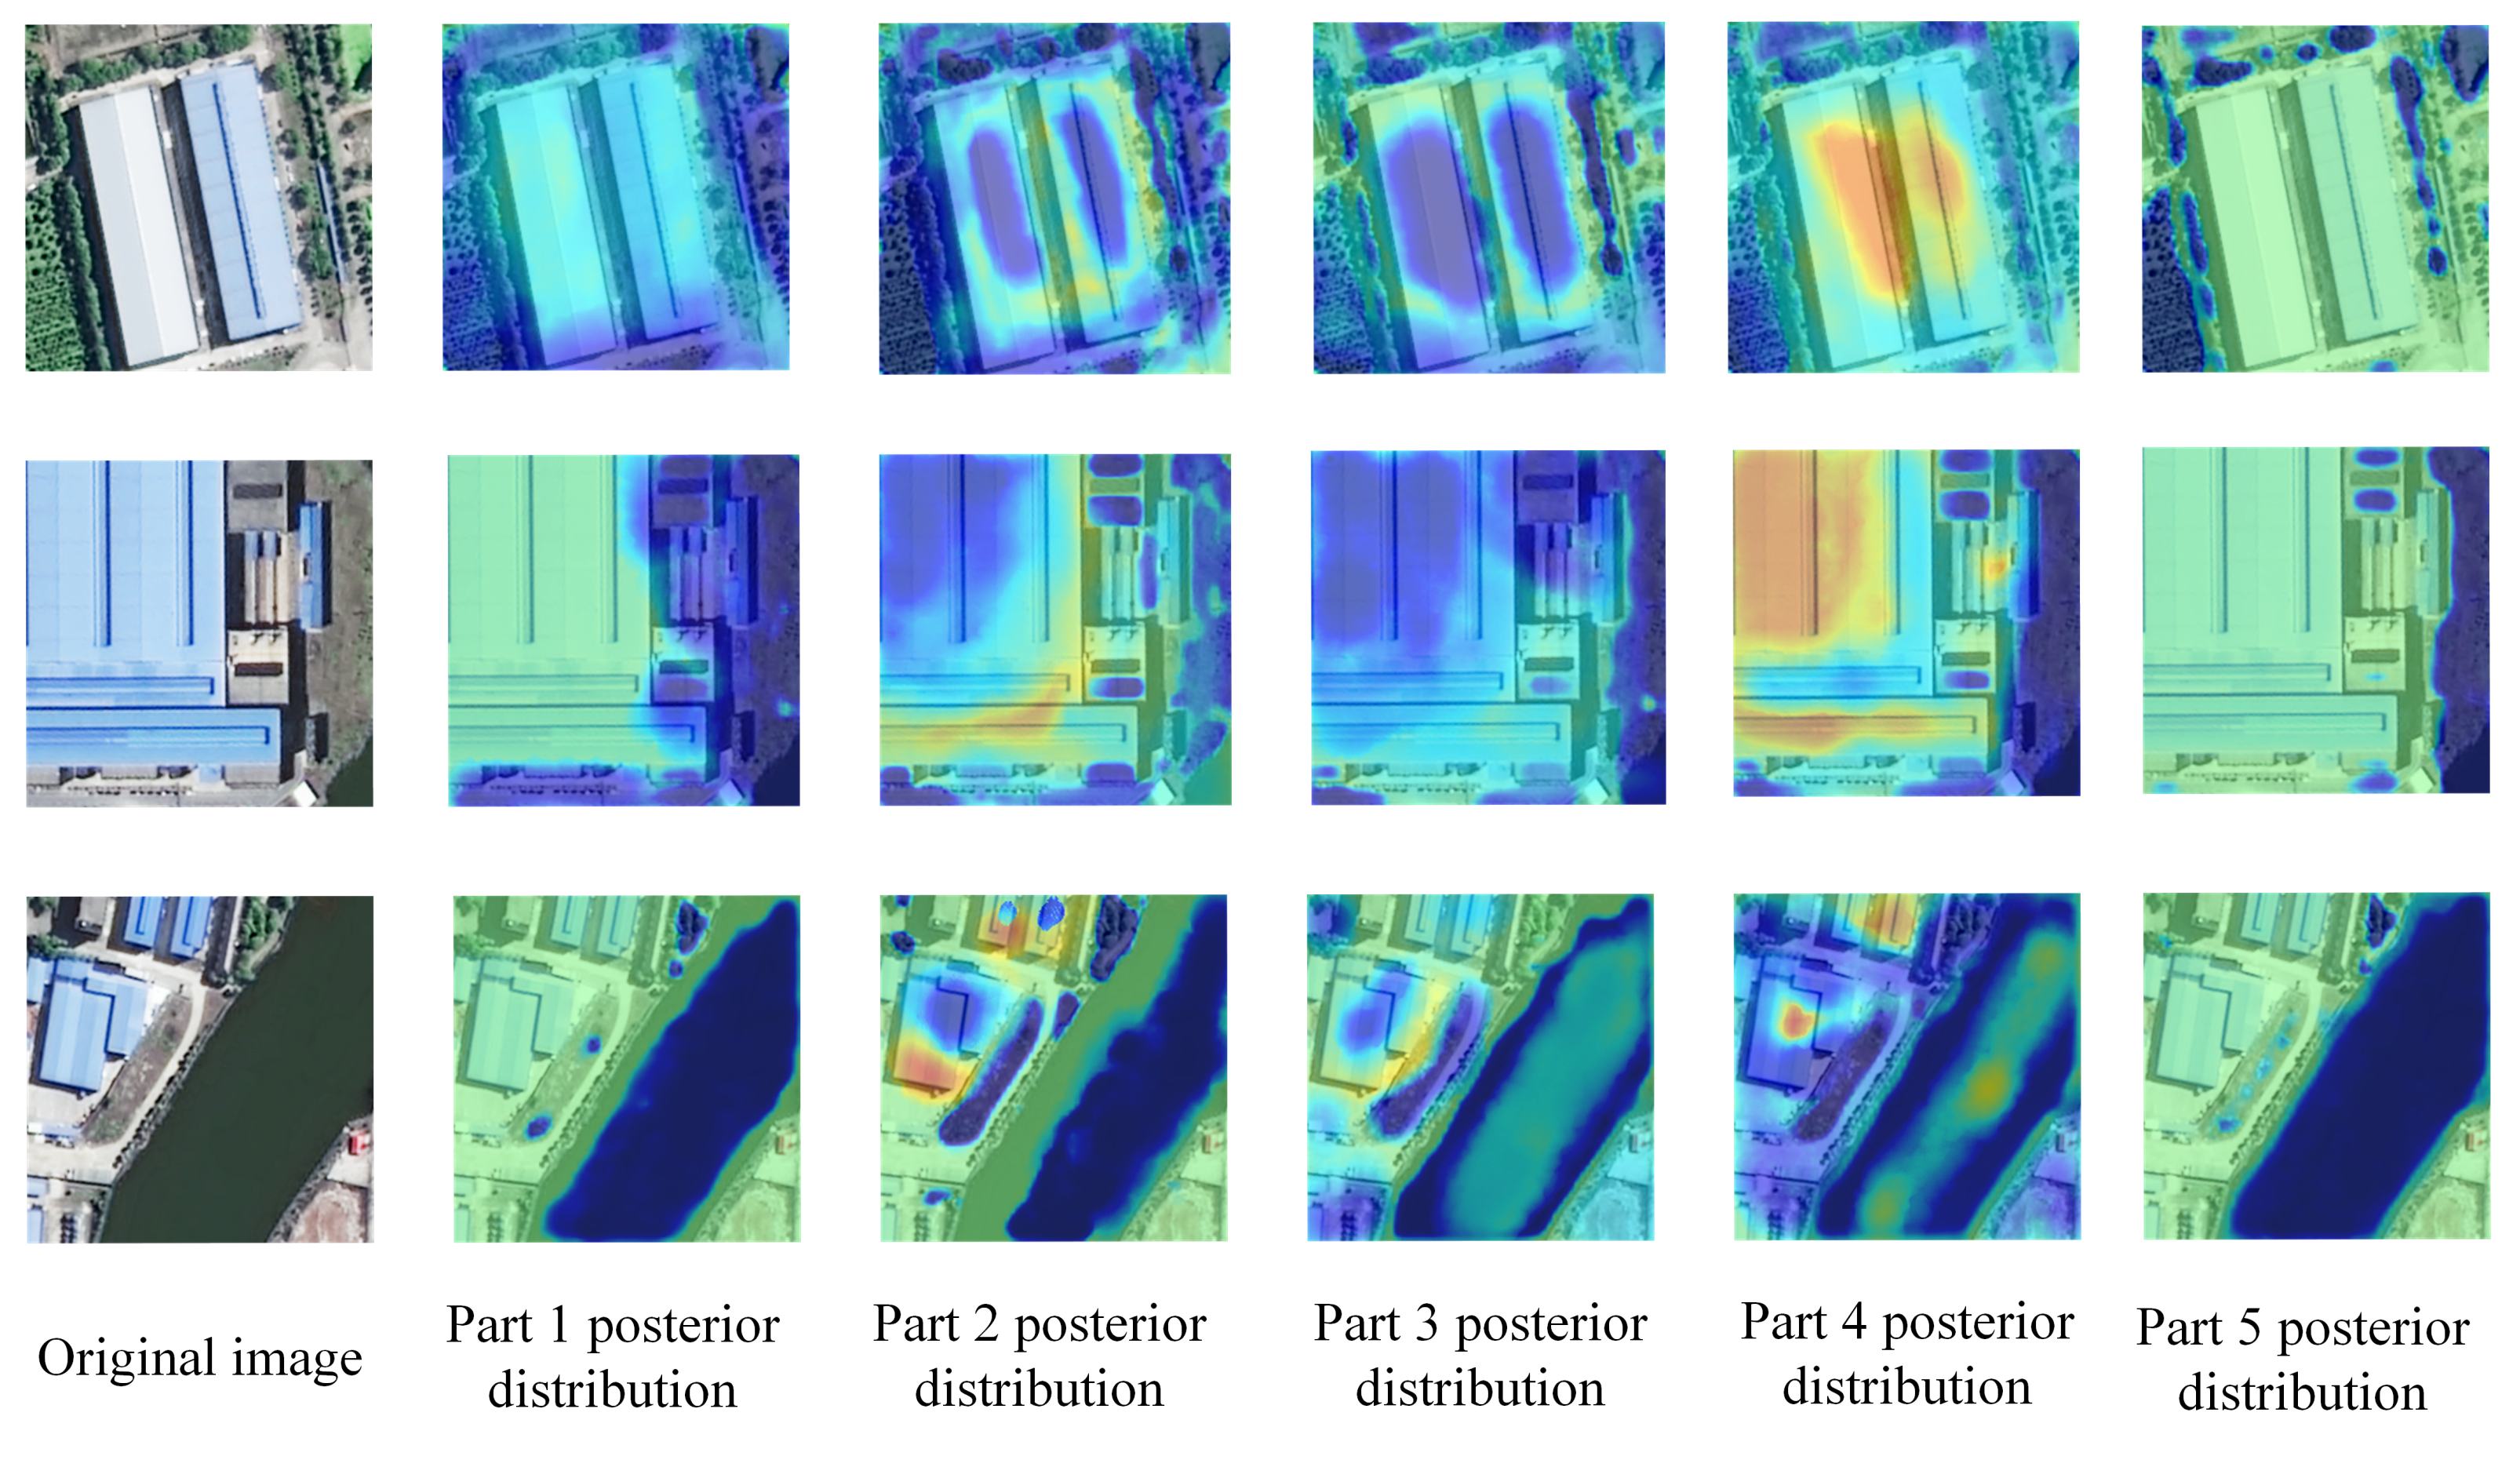
We reimplement seven mainstream CNN-based models: FCN-8s, SegNet, SegNet with DeformableConv (SegNet+DeConv), UNet, RFA-UNet, PSPNet, and Deeplab-v3, and two capsule-based models. We compared the performance between our method and CNN-based, capsule-based models, as shown in Table 3. In Table 3, we record the IoU and the PA of the ten methods on our test dataset. In addition, we denote the number of iterations that the model trains to converge as iterations.
Table 3 shows that FCN-8s performs far worse than the other methods, and our method performs the best. We also compared the number of iterations for convergence, and it is obvious that our method converges earlier than other models, which shows that our method requires fewer iterations in training. In other words, our method achieves a state of convergence fastest.
The original image of a slice is randomly sampled, and the building extraction results of these methods are visualized, as shown in Figure 5. In Figure 5, the FCN-8s uses a stacked full convolution architecture model. Multiscale information fusion is completed by the sum of tensors, which makes the feature expression ability of the model weak along the channel direction, thus limiting the perception ability of the model for semantically segmented objects. Therefore, the segmentation results are relatively rough, and the IoU and the PA are also low. Based on FCN, UNet splices the encoder and each layer feature in the decoder and presents a symmetrical U structure, which helps the model consider the multiscale context information more fully. The model can perceive different scales of semantic segmentation objects, so the UNet segmentation results are much more refined than those of FCN-8s. SegNet also inherits the full convolution architecture, but it improves in the decoder pooling operation. SegNet records the location index of the pooling operation in the encoder down-sampling process and restores it to the decoder up-sampling results according to these indices. SegNet weakens the loss of spatial information without increasing the number of calculations.
As a result of the fixed convolution kernel geometry, standard convolution neural networks have been limited in the ability to simulate geometric transformations. Therefore, the deformable convolution is introduced to enhance the adaptability of convolutional networks to spatial transformation. SegNet+DeConv uses the deformable convolution instead of standard convolution. The performance of SegNet+DeConv is improved compared to SegNet. RFA-UNet considers the semantic gap between features from different stages and leverage the attention mechanism to bridge the gap prior to the fusion of features. The inferred attention weights along spatial and channel-wise dimensions make the low-level feature maps adaptive to high-level feature maps in a target-oriented manner. Therefore, the performance of RFA-UNet is improved compared to UNet. Based on the spatial pyramid pooling [43], PSPNet exploits the capability of global context information by different-region-based context aggregation. It can be seen from Table 3 that PSPNet outperforms RFA-UNet. Deeplab-v3 proposes to augment the Atrous Spatial Pyramid Pooling module, which probes convolutional features at multiple scales, with image-level features encoding global context and further boosting performance. The atrous convolution [44] used in Deeplab-v3 helps the model increase the receptive field and obtain more contextual information.
For capsule-based methods, both CapFPN and HR-CapsNet achieve performance over CNN-based methods on the test dataset. Both methods use capsules to store feature information. Taking advantage of the properties of capsules and fusing different levels of capsule features, the CapFPN can extract high-resolution, intrinsic, and semantically strong features, which perform effectively in improving the pixel-wise building footprint extraction accuracy. The HR-CapsNet can provide semantically strong and spatially accurate feature representations to promote the pixel-wise building extraction accuracy. In addition, integrated with an efficient capsule feature attention module, the HR-CapsNet can attend to channel-wise informative and class-specific spatial features to boost the feature encoding quality.
In this study, the encoder is used to capture the parts of the target building, and the building parts are expressed by the vector capsules. The set transformer fuses the building parts’ capsules and obtains the capsule of the target buildings. The decoder reconsiders the correlation from the target buildings to the parts and integrates the correlation information with the parts’ distribution to correct the parts’ distribution in space. We connect the posterior parts’ distribution to obtain the more explainable feature maps. We up-sample these low-resolution feature maps to obtain the segmentation results of the target buildings. In Figure 5f, most of the target buildings are detected by our method. The performance of our method on the test dataset is best, which proves the feasibility of our method.
For some samples, our method extracts some non-buildings. Most of these areas are gaps between closely spaced groups of buildings. These areas have a small proportion of all pixels. Therefore, these non-buildings do not seriously affect the experimental results. This phenomenon occurs because our method’s ability to segment edges is not strong enough. Our goal is to improve generalization, and we should focus on detecting the main features of the building as much as possible. If the model pays too much attention to edge details, the model will get stuck in the distribution of the source domain, making it difficult to generalize to other domains.
In this paper, three slice images are randomly selected, and the segmentation results are shown in Figure 6. The first column is the three original images, and the second column is the ground truth. Each of the remaining columns is the building extraction result of a method.
In addition, we record the number of iterations required for each model to converge. Deeplab-v3 and PSPNet have good performance on the test dataset, but the two models are more complicated and require long-term training to achieve convergence. FCN-8s, SegNet, and UNet have a simple structure, but they cannot effectively perceive the characteristics of the target object. Although the three models can converge under short-term training, the performance is not the best. For the attention mechanism of RFA-UNet and the deformable convolution of SegNet+DeformableConv, they need to learn repeatedly to achieve good results. In our method, capsules can effectively perceive the characteristics of the target object, help the model achieve convergence after short-term training, and achieve good performance on the validation dataset. As can be seen from Table 3, the capsule-based methods all share the same characteristic: they can reach a convergence state with fewer iterations. However, the structure of stacked capsules in CapFPN and HR-CapsNet can realize the role of layer-by-layer abstract features, but it also increases the complexity of the learning process. Our method uses a set transformer to abstract low-level capsules to high-level capsules, reducing the complexity in computation. Therefore, for capsule-based methods, our method can converge faster in training.

3.4. Explainability

Using sliced small-scale remote sensing images, the posterior building part distributions obtained by our method are up-sampled by bilinear interpolation and superimposed on the original image and visualized, as shown in Figure 7. Figure 7a–e denote the probability distribution of the existence of each building part in space. The color represents the probability of the existence of the building part. The brighter the color of a region, the greater the activation degree of the building part in that region, that is, the more likely the building part exists. The parts of the target building can be clearly observed in Figure 7b–d. Figure 7b reflects that in the second channel, the parts of the target building near the edge and center are more easily detected. Figure 7c reflects that in the third channel, the edge parts of the target building are more easily detected. Similarly, Figure 7d corresponds to the detection of the central parts of the target building. Figure 7g denotes the feature distribution of CNN-based methods, the first row, the second row, and the third row correspond to FCN, SegNet, and UNet in turn. We randomly select three channels from the feature maps output by the convolutional network for visualization, and we can find that these feature distributions are not explainable.
In Figure 7a,e, the results show that the target object is detected as a whole, which can be considered a larger-scale building part detection result. A further comparison of Figure 7a,e shows that Figure 7a is not only activated in the area of the target building but also activated in some local areas of the river, and this result appears reasonable. The target we detect includes buildings along the river shoreline. Therefore, the river can also be broadly considered a part of such buildings. The above results prove the rationality of our method in remote sensing images feature detection.

3.5. Generalization

To verify the generalization performance of our method, we directly apply CNN-based and capsule-based methods to an unfamiliar dataset for inferencing. The performances of these methods are shown in Table 4. In addition, we randomly sample slice images from this unfamiliar dataset and visualize the building extraction results of these methods, as shown in Figure 8.
The performance of the CNN-based models on the unfamiliar dataset significantly decreases. For the unfamiliar dataset, the information distribution in images varies greatly, which makes it difficult for convolutional network templates to correctly detect parts of the target object. For Figure 8c–f, the segmentation results of the mainstream convolutional network models for target buildings are poor. Especially, FCN-8s can hardly detect the existence of buildings.
For Deeplab-v3, multiscale atrous convolution helps the model to obtain more context information. Therefore, Deeplab-v3 can better perceive the target object. The attention mechanism helps RFA-UNet capture the distributions of target objects in remote sensing images, but the performance is not as good as Deeplab-v3. In addition, SegNet+DeformableConv uses deformable convolution, which can adapt to the spatial transformation of target objects’ parts. Therefore, SegNet+DeformableConv performs better than other mainstream convolutional network models. It can be seen from Table 4 that the δ IoU and δ PA of SegNet+DeformableConv are relatively small.
Compared to other mainstream convolutional network models, our method can detect the approximate areas of buildings. The above results show that our method has a good generalization ability.
For capsule-based methods, both CapFPN and HR-CapsNet show a significant drop in performance. Although CapFPN and HR-CapsNet both introduce capsule models, both methods only use capsules to store features. Although CapFPN and HR-CapsNet increase the descriptive information of features, these features are not explainable. When we use these methods to reason on unfamiliar datasets, the different statistical distributions cause the process of feature abstraction to deviate from the explainable route; in other words, the final features extracted are completely wrong. Our approach adds out explainability constraints to the capsule model, which allows the model to infer features that are consistent with human visual behavior. Therefore, our method can achieve better generalization.
Furthermore, when we set up a larger number of building parts, our method can better perceive the potential feature information of the target object. Since the capsule can also perceive the spatial relationship of the parts, when we obtain more part features, our method can effectively combine the part features and their spatial relationship to inference about the target object. It can be seen from Table 4 that when we set the number of parts to 6, the the δ IoU and δ PA will be further reduced.
Finally, we tested the testing speed of different methods, and the efficiency comparison of different methods is shown in Figure 9. The results show that our method can achieve good generalization performance with less testing time. The smaller the network size, the faster the testing speed, but the corresponding generalization performance will be reduced.

3.6. Further Experimental Support

To further confirm the generalization of our method, we report the results on the WHU dataset. We experiment with two settings separately. We train methods on the Yellow River training set and test on the WHU test set. In addition, we train methods on the WHU training set, test on the WHU test set, and test on the Yellow River test set.
For the first setting, we treat the WHU dataset as an unfamiliar dataset. We apply three CNN-based methods, two capsule-based methods, and our method to WHU for inferencing. The test performance of various methods is shown in Table 5. In addition, we randomly sample slice images from the WHU dataset and visualize the building extraction results of these methods, as shown in Figure 10.
For the second setting, we take the WHU dataset as the source domain. We train one CNN-based method (SegNet+DeConv), two capsule-based methods, and our method on the WHU dataset. We apply these methods to the WHU dataset for inferencing. The test performance of various methods is shown in Table 6. In addition, we randomly sample slice images from the WHU dataset and visualize the building extraction results of these methods, as shown in Figure 11.
For generalization of the second setting, we apply these methods to the Yellow River dataset for inferencing. The test performance of various methods is shown in Table 6. In addition, we randomly sample slice images from the Yellow River dataset and visualize the building extraction results of these methods, as shown in Figure 12. In our work, extensive experiments show that our method has good generalization.

4. Discussion

In this section, we first discuss the explainability of our method; then, we discuss the reasons for the generalizability of the method and analyze the generalization performance. Additionally, we analyze the limitations of our method and future work.

4.1. Discussion of Explainability

Regarding the reason why we can get the explainable posterior distribution of building parts, before extracting capsules, we already have some explainable feature description information, such as p o s e m m a p and c m m a p . In our method, the convolution branch is used to extract the posture and texture of different building parts. In order to uniformly observe the posture and texture features corresponding to buildings, we sum the feature maps output by all branches and select the feature distribution in some channels to visualize. We visualize the feature distributions. For each layer feature distribution, we set: when the response value of each pixel is greater than the average value of the layer, we activate the pixel, and highlight the pixel; for color and texture information, we set a different color to represent activation among different layers. The visualization is shown in Figure 13.
As can be seen from Figure 13, the model can perceive different postures of buildings from explainable perspectives, such as the horizontal direction, vertical direction, and tilting direction. For color and texture, we found that similar colors and texture are marked with the same color, indicating that the model is indeed able to detect posture and texture information.
It should be noted that posture and texture information belong to low-level features, and what we ultimately need is explainable building parts feature distribution, that is, parts posterior distribution. We get the feature distributions in the parallel convolution modules, which we call parts prior distribution. It is rough to directly use the parts prior distribution as parts distribution, because parts prior distribution lacks description information such as posture and texture. We should compress posture and texture information into part capsules, fuse part capsules to get the buildings capsule; then, we calculate the relationship between parts and buildings, correct parts prior distribution, and obtain more accurate parts posterior distribution. In other words, parts posterior distribution can accurately represent the spatial distribution of building parts.

4.2. Discussion of Generalization

The convolutional network can only match a building part according to a fixed template, namely, a local feature, which is the reason why the convolutional network model cannot express the correlation of building parts in space. Regarding the generalization ability of the model, it is important to learn the expression of building parts more accurately because parts are the common characteristics of buildings. Learning building parts can easily make a model better perceive a target object in different fields of vision.
A convolutional network loses the spatial pose information of a part. For example, for the same object, when we transform the angle to observe it, the part will also be subject to the corresponding affine transformation, and the convolutional network does not have the template under this perspective. Therefore, the model cannot detect the part. However, if we use capsules to express parts, the model can correctly perceive parts with different postures. Therefore, the generalization of the model is improved.
For recent capsule-based methods, they still lack generalizability. Recent capsule-based methods only use the capsule model to abstract features. They do not focus on how to use capsules to learn explainable feature representations. In fact, not only do we need capsules to store additional descriptive information, we also need the representation of features to be explainable. Looking at images from a human perspective, we can accurately describe the target object in images in different scenarios, because the features we obtain are not totally based on statistical distribution, and we can abstract the target object through its parts. This explainable way allows us to achieve generalization, so we let our model learn explainable part features and then further abstract to get the target object, which is a method that imitates human vision, and experiments show that our method has generalizability.
Regarding explainability, we randomly selected three slice images to visualize the results, as shown in Figure 14. We randomly selected three slice images from the unfamiliar dataset, and the building extraction results are shown in Figure 15.

4.3. Limitations and Future Work

Our method uses parallel convolutional neural network modules, and we use the set transformer to aggregate the capsule information. When we increase the number of building parts, the number of parameters of the model will increase significantly, which will cause a relatively large burden on the computational cost. In addition, in our method, the process of obtaining the target object capsule by using building part capsule fusion is relatively simple, and the number of target object capsules in our method is only one.
From the limitations mentioned above, in future work, we plan to try to use knowledge distillation to compress the model to reduce the burden of computational overhead. We are ready to consider new capsule fusion methods instead of set transformers. In addition, we intend to explore a simple and effective way to scale the number of part capsules easily.

5. Conclusions

In this study, the proposed Capsule–Encoder–Decoder method contains a capsule, encoder, and decoder. The encoder captures the capsule of the parts of each target building and then obtains the capsule of the target object based on set transformer fusion. The decoder learns the relationship between the target object and its parts, modifies the spatial distribution of the parts, and then obtains the building extraction results of the target object using the full convolution decoding method.
Compared with the CNN-based and capsule-based methods, our method can achieve the best results for building extraction, and convergence is faster in training, which proves the feasibility of our method in the task of building extraction from remote sensing images. Moreover, our method can capture the building parts’ distribution with high-level semantic information, such as the edge and center of buildings. Taking the detection of buildings along the river as the background, our method can also sense the parts related to the segmentation task, such as the river bank, which shows that the method has good explainability. Additionally, our method, the CNN-based method, and the capsule-based method were applied to an unfamiliar dataset for inferencing. The results show that our method performs significantly better than the CNN-based and capsule-based methods, which proves that our method performs potential good generalization performance from one source remote sensing dataset to another.

Author Contributions

Conceptualization, Z.T. and D.Z.; methodology, Z.T.; software, Z.T.; validation, Z.T., C.J. and W.L.; formal analysis, Z.H.; investigation, H.S.; resources, D.Z. and C.Y.-C.C.; data curation, D.Z.; writing—original draft preparation, Z.T.; writing—review and editing, D.Z.; visualization, Z.T.; supervision, D.Z.; project administration, D.Z.; funding acquisition, H.S. All authors have read and agreed to the published version of the manuscript.

Funding

National Natural Science Foundation of China, under Grant “A modeling study of Evapotranspiration and Water saving for Oasis” 52079055; Yellow River Engineering Consulting Co., Ltd., under Grant “Ecological Environment Monitoring Applications on Typical Areas of The Yellow River in China” 80-H30G03- 9001-20/22.

Institutional Review Board Statement

Not applicable.

Informed Consent Statement

Not applicable.

Data Availability Statement

Our code and dataset is Available on https://github.com/ZhenchaoTang/Capsule–Encoder–Decoder, accessed on 15 January 2022.

Acknowledgments

Thanks go to all the editors and commenters.

Conflicts of Interest

The authors declare no conflict of interest.

References

  1. Xu, Y.; Wu, L.; Xie, Z.; Chen, Z. Building extraction in very high resolution remote sensing imagery using deep learning and guided filters. Remote Sens. 2018, 10, 144. [Google Scholar] [CrossRef] [Green Version]
  2. Guo, M.; Liu, H.; Xu, Y.; Huang, Y. Building extraction based on U-Net with an attention block and multiple losses. Remote Sens. 2020, 12, 1400. [Google Scholar] [CrossRef]
  3. Ji, S.; Wei, S.; Lu, M. Fully convolutional networks for multisource building extraction from an open aerial and satellite imagery data set. IEEE Trans. Geosci. Remote Sens. 2018, 57, 574–586. [Google Scholar] [CrossRef]
  4. Chen, K.; Fu, K.; Gao, X.; Yan, M.; Sun, X.; Zhang, H. Building extraction from remote sensing images with deep learning in a supervised manner. In Proceedings of the 2017 IEEE International Geoscience and Remote Sensing Symposium (IGARSS), Fort Worth, TX, USA, 23–28 July 2017; pp. 1672–1675. [Google Scholar]
  5. Chen, M.; Wu, J.; Liu, L.; Zhao, W.; Tian, F.; Shen, Q.; Zhao, B.; Du, R. DR-Net: An improved network for building extraction from high resolution remote sensing image. Remote Sens. 2021, 13, 294. [Google Scholar] [CrossRef]
  6. Zhang, H.; Liao, Y.; Yang, H.; Yang, G.; Zhang, L. A Local-Global Dual-Stream Network for Building Extraction From Very-High-Resolution Remote Sensing Images. IEEE Trans. Neural Netw. Learn. Syst. 2020, 33, 1269–1283. [Google Scholar] [CrossRef] [PubMed]
  7. Deng, W.; Shi, Q.; Li, J. Attention-Gate-Based Encoder–Decoder Network for Automatical Building Extraction. IEEE J. Sel. Top. Appl. Earth Obs. Remote Sens. 2021, 14, 2611–2620. [Google Scholar] [CrossRef]
  8. Zhu, Y.; Liang, Z.; Yan, J.; Chen, G.; Wang, X. ED-Net: Automatic Building Extraction From High-Resolution Aerial Images With Boundary Information. IEEE J. Sel. Top. Appl. Earth Obs. Remote Sens. 2021, 14, 4595–4606. [Google Scholar] [CrossRef]
  9. Shao, Z.; Tang, P.; Wang, Z.; Saleem, N.; Yam, S.; Sommai, C. BRRNet: A fully convolutional neural network for automatic building extraction from high-resolution remote sensing images. Remote Sens. 2020, 12, 1050. [Google Scholar] [CrossRef] [Green Version]
  10. Zou, Z.; Shi, T.; Li, W.; Zhang, Z.; Shi, Z. Do game data generalize well for remote sensing image segmentation? Remote Sens. 2020, 12, 275. [Google Scholar] [CrossRef] [Green Version]
  11. Zhang, R. Making convolutional networks shift-invariant again. In Proceedings of the International Conference on Machine Learning, PMLR, Long Beach, CA, USA, 10–15 June 2019; pp. 7324–7334. [Google Scholar]
  12. Yuan, J. Learning building extraction in aerial scenes with convolutional networks. IEEE Trans. Pattern Anal. Mach. Intell. 2017, 40, 2793–2798. [Google Scholar] [CrossRef]
  13. Lunga, D.; Arndt, J.; Gerrand, J.; Stewart, R. ReSFlow: A Remote Sensing Imagery Data-Flow for Improved Model Generalization. IEEE J. Sel. Top. Appl. Earth Obs. Remote Sens. 2021, 14, 10468–10483. [Google Scholar] [CrossRef]
  14. Sheng, H.; Chen, X.; Su, J.; Rajagopal, R.; Ng, A. Effective data fusion with generalized vegetation index: Evidence from land cover segmentation in agriculture. In Proceedings of the IEEE/CVF Conference on Computer Vision and Pattern Recognition Workshops, Seattle, WA, USA, 14–19 June 2020; pp. 60–61. [Google Scholar]
  15. Yang, B.; Cao, F.; Ye, H. A Novel Method for Hyperspectral Image Classification: Deep Network with Adaptive Graph Structure Integration. IEEE Trans. Geosci. Remote Sens. 2022. [Google Scholar] [CrossRef]
  16. Krizhevsky, A.; Sutskever, I.; Hinton, G.E. Imagenet classification with deep convolutional neural networks. Adv. Neural Inf. Process. Syst. 2012, 25, 1097–1105. [Google Scholar] [CrossRef]
  17. Russakovsky, O.; Deng, J.; Su, H.; Krause, J.; Satheesh, S.; Ma, S.; Huang, Z.; Karpathy, A.; Khosla, A.; Bernstein, M.; et al. Imagenet large scale visual recognition challenge. Int. J. Comput. Vis. 2015, 115, 211–252. [Google Scholar] [CrossRef] [Green Version]
  18. Long, J.; Shelhamer, E.; Darrell, T. Fully convolutional networks for semantic segmentation. In Proceedings of the IEEE Conference on Computer Vision and Pattern Recognition, Boston, MA, USA, 7–12 June 2015; pp. 3431–3440. [Google Scholar]
  19. Fu, X.; Qu, H. Research on semantic segmentation of high-resolution remote sensing image based on full convolutional neural network. In Proceedings of the 2018 12th International Symposium on Antennas, Propagation and EM Theory (ISAPE), Hangzhou, China, 3–6 December 2018; pp. 1–4. [Google Scholar]
  20. Ronneberger, O.; Fischer, P.; Brox, T. U-net: Convolutional networks for biomedical image segmentation. In Proceedings of the International Conference on Medical Image Computing and Computer-Assisted Intervention, Munich, Germany, 5–9 October 2015; pp. 234–241. [Google Scholar]
  21. Badrinarayanan, V.; Kendall, A.; Cipolla, R. Segnet: A deep convolutional encoder-decoder architecture for image segmentation. IEEE Trans. Pattern Anal. Mach. Intell. 2017, 39, 2481–2495. [Google Scholar] [CrossRef]
  22. Zheng, X.; Chen, T. Segmentation of High Spatial Resolution Remote Sensing Image based On U-Net Convolutional Networks. In Proceedings of the IGARSS 2020—2020 IEEE International Geoscience and Remote Sensing Symposium, Waikoloa, HI, USA, 26 September–2 October 2020; pp. 2571–2574. [Google Scholar]
  23. Ye, Z.; Fu, Y.; Gan, M.; Deng, J.; Comber, A.; Wang, K. Building extraction from very high resolution aerial imagery using joint attention deep neural network. Remote Sens. 2019, 11, 2970. [Google Scholar] [CrossRef] [Green Version]
  24. Dai, J.; Qi, H.; Xiong, Y.; Li, Y.; Zhang, G.; Hu, H.; Wei, Y. Deformable convolutional networks. In Proceedings of the IEEE International Conference on Computer Vision, Venice, Italy, 22–29 October 2017; pp. 764–773. [Google Scholar]
  25. Chen, L.C.; Papandreou, G.; Kokkinos, I.; Murphy, K.; Yuille, A.L. Deeplab: Semantic image segmentation with deep convolutional nets, atrous convolution, and fully connected crfs. IEEE Trans. Pattern Anal. Mach. Intell. 2017, 40, 834–848. [Google Scholar] [CrossRef] [PubMed] [Green Version]
  26. Zuo, Z.; Zhang, W.; Zhang, D. A remote sensing image semantic segmentation method by combining deformable convolution with conditional random fields. Acta Geod. Cartogr. Sin 2019, 48, 718–726. [Google Scholar]
  27. Zhao, H.; Shi, J.; Qi, X.; Wang, X.; Jia, J. Pyramid scene parsing network. In Proceedings of the IEEE Conference on Computer Vision and Pattern Recognition, Honolulu, HI, USA, 21–26 July 2017; pp. 2881–2890. [Google Scholar]
  28. Yu, B.; Yang, L.; Chen, F. Semantic segmentation for high spatial resolution remote sensing images based on convolution neural network and pyramid pooling module. IEEE J. Sel. Top. Appl. Earth Obs. Remote Sens. 2018, 11, 3252–3261. [Google Scholar] [CrossRef]
  29. Chen, L.C.; Papandreou, G.; Schroff, F.; Adam, H. Rethinking atrous convolution for semantic image segmentation. arXiv 2017, arXiv:1706.05587. [Google Scholar]
  30. Lin, Y.; Xu, D.; Wang, N.; Shi, Z.; Chen, Q. Road extraction from very-high-resolution remote sensing images via a nested SE-Deeplab model. Remote Sens. 2020, 12, 2985. [Google Scholar] [CrossRef]
  31. Sabour, S.; Frosst, N.; Hinton, G.E. Dynamic routing between capsules. arXiv 2017, arXiv:1710.09829. [Google Scholar]
  32. Hinton, G.E.; Sabour, S.; Frosst, N. Matrix capsules with EM routing. In International Conference on Learning Representations; 2018; Available online: https://openreview.net/forum?id=HJWLfGWRb&noteId=rk5MadsMf&noteId=rk5MadsMf (accessed on 15 January 2022).
  33. Kosiorek, A.R.; Sabour, S.; Teh, Y.W.; Hinton, G.E. Stacked capsule autoencoders. arXiv 2019, arXiv:1906.06818. [Google Scholar]
  34. Lee, J.; Lee, Y.; Kim, J.; Kosiorek, A.; Choi, S.; Teh, Y.W. Set transformer: A framework for attention-based permutation-invariant neural networks. In Proceedings of the International Conference on Machine Learning, PMLR, Nagoya, Japan, 17–19 November 2019; pp. 3744–3753. [Google Scholar]
  35. Yu, Y.; Ren, Y.; Guan, H.; Li, D.; Yu, C.; Jin, S.; Wang, L. Capsule feature pyramid network for building footprint extraction from high-resolution aerial imagery. IEEE Geosci. Remote Sens. Lett. 2020, 18, 895–899. [Google Scholar] [CrossRef]
  36. Yu, Y.; Liu, C.; Gao, J.; Jin, S.; Jiang, X.; Jiang, M.; Zhang, H.; Zhang, Y. Building Extraction From Remote Sensing Imagery With a High-Resolution Capsule Network. IEEE Geosci. Remote Sens. Lett. 2021, 19, 1–5. [Google Scholar] [CrossRef]
  37. Xiao, T.; Liu, Y.; Zhou, B.; Jiang, Y.; Sun, J. Unified perceptual parsing for scene understanding. In Proceedings of the European Conference on Computer Vision (ECCV), Munich, Germany, 8–14 September 2018; pp. 418–434. [Google Scholar]
  38. Vaswani, A.; Shazeer, N.; Parmar, N.; Uszkoreit, J.; Jones, L.; Gomez, A.N.; Kaiser, Ł.; Polosukhin, I. Attention is all you need. Adv. Neural Inf. Process. Syst. 2017, 30, 5998–6008. [Google Scholar]
  39. Chen, C.; Li, O.; Tao, C.; Barnett, A.J.; Su, J.; Rudin, C. This looks like that: Deep learning for interpretable image recognition. arXiv 2018, arXiv:1806.10574. [Google Scholar]
  40. Mnih, V. Machine Learning for Aerial Image Labeling. Ph.D. Thesis, University of Toronto (Canada), Toronto, ON, Canada, 2013. [Google Scholar]
  41. Kingma, D.P.; Ba, J. Adam: A method for stochastic optimization. arXiv 2014, arXiv:1412.6980. [Google Scholar]
  42. Lee, S.; Kim, J. Land cover classification using sematic image segmentation with deep learning. Korean J. Remote Sens. 2019, 35, 279–288. [Google Scholar]
  43. He, K.; Zhang, X.; Ren, S.; Sun, J. Spatial pyramid pooling in deep convolutional networks for visual recognition. IEEE Trans. Pattern Anal. Mach. Intell. 2015, 37, 1904–1916. [Google Scholar] [CrossRef] [PubMed] [Green Version]
  44. Wu, Z.; Shen, C.; Hengel, A.v.d. Bridging category-level and instance-level semantic image segmentation. arXiv 2016, arXiv:1605.06885. [Google Scholar]
Figure 1. The overall framework of our method.
Remotesensing 14 01235 g001
Figure 2. The architecture of our encoder.
Remotesensing 14 01235 g002
Figure 3. The architecture of our decoder.
Remotesensing 14 01235 g003
Figure 4. Ablation study of Capsule–Encoder–Decoder. (a) Ablation study about different numbers of building parts, (b) Ablation study about different loss weights.
Remotesensing 14 01235 g004
Figure 5. Comparison of different building extraction methods on source dataset. (a) is the original image, (b) is the ground truth, (f,k,l) are capsule-based methods, and the rest are CNN-based methods.
Remotesensing 14 01235 g005
Figure 6. More visual results of different building extraction methods on the source dataset.
Remotesensing 14 01235 g006
Figure 7. Visualization of the posterior building parts distribution.
Remotesensing 14 01235 g007
Figure 8. Comparison of the building extraction of different methods on unfamiliar data.
Remotesensing 14 01235 g008
Figure 9. The efficiency comparison of different methods.
Remotesensing 14 01235 g009
Figure 10. Comparison of the building extraction of different methods on the WHU dataset (Yellow River dataset as source domain).
Remotesensing 14 01235 g010
Figure 11. Comparison of the building extraction of different methods on the WHU dataset (WHU dataset as the source domain).
Remotesensing 14 01235 g011
Figure 12. Comparison of the building extraction of different methods on the Yellow River dataset (WHU dataset as the source domain).
Remotesensing 14 01235 g012
Figure 13. Visualization of posture and texture information.
Remotesensing 14 01235 g013
Figure 14. More visualization results about explainability.
Remotesensing 14 01235 g014
Figure 15. More visualization results about generalization.
Remotesensing 14 01235 g015
Table 1. Performance of different number of building parts on the test set.
Building PartsPosterior23456
IoU(%)61.162.164.565.265.3
PA(%)79.282.683.484.284.7
IoU(%)54.355.857.656.256.9
PA(%)69.472.076.974.975.1
Iterations29952708231721062212
Table 2. Performance of different loss weights on the test set.
Loss Weights3:75:57:38:29:110:0
IoU(%)40.455.162.865.263.160.4
PA(%)59.672.382.184.282.779.8
Table 3. Performance of different building extraction methods on the test set.
MethodCapsule-BasedIoU(%)PA(%)Iterations
CapFPN [35]65.084.13015
HR-CapsNet [36]65.184.12914
FCN-8s [18]46.976.84369
SegNet [21]61.681.73647
SegNet+DeConv [26]63.482.15219
UNet [20]64.783.63985
RFA-UNet [23]64.983.54011
PSPNet [27]64.984.14285
Deeplab-v3 [29]65.184.26013
Ours (parts = 5)65.284.22106
Ours (parts = 6)65.384.72212
Table 4. Performance of different building extraction methods on the unfamiliar dataset.
MethodIoU’ (%)PA’ (%) δ IoU (%) δ PA (%)
CapFPN31.350.633.733.4
HR-CapsNet33.954.231.229.9
FCN-8s13.234.133.742.7
SegNet29.548.832.132.9
SegNet+DeConv47.767.316.314.8
UNet26.944.237.839.4
RFA-UNet47.267.417.816.1
PSPNet35.554.229.429.9
Deeplab-v346.965.819.218.4
Ours (parts = 5)50.770.414.513.8
Ours (parts = 6)50.970.814.413.9
Table 5. Performance of different building extraction methods on the WHU dataset (Yellow River dataset as source domain).
MethodIoU’ (%)PA’ (%) δ IoU (%) δ PA (%)
CapFPN26.444.738.639.3
HR-CapsNet22.541.342.142.8
SegNet+DeConv38.157.825.324.3
RFA-UNet24.643.940.139.6
Deeplab-v331.950.433.233.8
Ours51.970.913.513.7
Table 6. Performance of different building extraction methods on the WHU dataset and Yellow River dataset (WHU dataset as source domain).
MethodIoU (%)PA (%)IoU’ (%)PA’ (%) δ IoU (%) δ PA (%)
CapFPN67.885.936.955.730.930.2
HR-CapsNet68.486.637.353.231.133.4
SegNet+ DeConv63.681.440.654.923.026.5
Ours68.186.259.276.18.910.1
Publisher’s Note: MDPI stays neutral with regard to jurisdictional claims in published maps and institutional affiliations.

