Article

Satellite-Based Evidences to Improve Cropland Productivity on the High-Standard Farmland Project Regions in Henan Province, China

1
Institute of Geographic Sciences and Natural Resources Research, Chinese Academy of Sciences, Beijing 100101, China
2
University of Chinese Academy of Sciences, Beijing 100049, China
3
The Center for Eco-Environmental Accounting, Chinese Academy of Environmental Planning, Beijing 100012, China
4
Beijing SpaceWill Info. Co., Ltd., Beijing 100089, China
5
School of Resources and Environmental Engineering, Ludong University, Yantai 264025, China
*
Author to whom correspondence should be addressed.
Remote Sens. 2022, 14(7), 1724; https://doi.org/10.3390/rs14071724
Submission received: 31 December 2021 / Revised: 22 March 2022 / Accepted: 31 March 2022 / Published: 2 April 2022
(This article belongs to the Special Issue Remote Sensing Applications in Agricultural Ecosystems)

Abstract

:
Under the pressure of limited arable land and increasing demand for food, improving the quality of existing arable land has become a priority to ensure food security. The Chinese government gives great importance to improving cropland productivity by focusing on the construction of high-standard farmland (HSF). The government puts forward the goal of constructing 1.2 billion mu (100 mu ≈ 6.67 hectares) of HSF by 2030. Therefore, how to apply remote sensing to monitor the ability to increase and stabilize yields in HSF project regions has become an essential task for proving the efficiency of HSF construction. Based on HSF project distribution data, Moderate Resolution Imaging Spectroradiometer (MODIS) data and Landsat-8 Operational Land Imager (Landsat8-OLI) data, this study develops a method to monitor cropland productivity improvement by measuring cropland productivity level (CPL), disaster resistance ability (DRA) and homogeneous yield degree (HYD) in the HSF project region. Taking China’s largest grain production province (Henan Province) as a case study area, research shows that a light use efficiency model that includes multiple cropping data can effectively detect changes in cropland productivity before and after HSF construction. Furthermore, integrated Landsat8-OLI and MODIS data can detect changes in DRA and HYD before and after HSF construction with higher temporal and spatial resolution. In 109 HSF project regions concentrated and distributed in contiguous regions in Henan Province, the average cropland productivity increased by 145 kg/mu; among the eight sample project regions, DRA was improved in seven sample project regions; and the HYD in all eight sample project regions was greatly improved (the degree of increase is more than 75%). This evidence from satellites proves that the Chinese HSF project has significantly improved the CPL, DRA and HYD of cropland, while this study also verifies the practicability of the three indices to monitor the efficiency of HSF construction.

1. Introduction

In recent years, the increase in global grain production has reduced the proportion of hungry people in the world, which has increased the overall level of global food security. However, with the continued growth of global population and future consumption, global food security continues to face major challenges [1,2]. The expansion of cultivated land has become one of the main human activities to surpass the planetary boundary [3,4]. The yield growth rate per unit of major global cereals (wheat, corn, rice and soybean) is still lower than those required to achieve the food security goal [5,6]. Therefore, it is considered that the first priority is to produce more food on the existing cultivated land by increasing the cropland productivity [7] and narrowing the gap in agricultural production, rather than expanding the scale of cultivated land [8,9].
According to the China Economic Bulletin (2014) published by the World Bank, China’s demand for grain is expected to be 700 million tons by 2030, when the population reaches its peak. According to the level of grain production in 2019 (668 million tons), grain output should increase by about 32 million tons in 2030. To ensure food security, China has set a red line of 1.8 billion mu (100 mu ≈ 6.67 hectares) of cultivated land and ensured stability of the total area of cultivated land in the process of urbanization through a policy of balance between occupation and compensation of cultivated land [10,11]. However, due to the lack of reserve cultivated land resources in China, it is difficult to supplement the good quality cultivated land in urbanization. In areas with unfavorable natural conditions, the cropland productivity occupied by urban expansion is 80% higher than that of newly added cultivated land [12]. Recent research shows that from 1990 to 2015, the redistribution of cultivated land “occupying the good quality cultivated land and compensating the low quality cultivated land” stabilized the total cultivated land area in China to 2–2.1 billion mu. However, the main area of cultivated land shifted by about 70 km to the northwest region, resulting in a 4.5% reduction in total grain production capacity [13]. The middle–low productive cultivated land in China makes up about 80% of the total cultivated land area [14]. Improving cropland productivity, rather than expanding marginal land, is key to ensuring food security and an important way to achieve the sustainable development of China’s agriculture.
Since 2008, the Chinese government has attached great importance to improving the cropland productivity with the transformation of middle–low productive farmland (MLPF) and the construction of high-standard farmland (HSF) as the main activities. The construction goal is to form basic farmland with supporting facilities, high and stable yields and strong disaster resistance through land regulation and construction, improving or eliminating the main limiting factors of grain production and breaking the bottleneck in grain production. According to the National High-Standard Farmland Construction Plan (2021–2030), China will build a total of 1.2 billion mu of high-standard farmland by 2030 [15]. China’s MLPF transformation and HSF construction projects were officially implemented in 2010, and from 2011 to 2014, 2,330 project regions were built. However, it is not yet known whether the MLPF and HSF project regions have reached the expected grain production capacity and whether the construction of HSF has effectively achieved a stable and balanced yield increase. Therefore, the application of remote sensing technology for comprehensive monitoring and the assessment of capacity improvements of each project region has become a necessary measure to master food security.
With the development of remote sensing technology, remote sensing images are widely used in the estimation and monitoring of cultivated land productivity. Using MODIS NDVI data to estimate wheat yields in Canada and corn and soybean yields in the United States, the results showed that there was a good correlation between estimated yield and statistical yield, which provided support for the establishment of empirical prediction models and dynamic monitoring systems for main crop yields [16,17,18]. In the past five years, the Google Earth Engine (GEE), a remote sensing cloud computing platform, has provided the possibility for agricultural remote sensing monitoring using high temporal and spatial resolution remote sensing images [19]. For cultivated land productivity, the distribution and yield of small-scale farmland have been mapped by using high-precision data, such as Sentinel-1 on the GEE platform, which provided the possibility for estimating cultivated land productivity in complex terrain areas and small-scale farmland [20,21]. Meanwhile, some related studies have begun to focus on how to dynamically monitor cultivated land productivity by using remote sensing data under frequent extreme climates [22,23].
Over the past 20 years, the Vegetation Photosynthesis Model (VPM) has been validated in studies of farmland ecosystems around the world. This includes winter wheat and summer maize rotation farmland at the Yucheng flux station, Yingke farmland (maize) station and other typical farmland ecosystems in China, and the simulated Gross Primary Production (GPP) data show good agreement with the site observation data [24,25,26]. By considering the type of cropland vegetation and multi-cropping, the Net Primary Production (NPP) data generated by VPM can effectively improve the apparent underestimation of C4 crops and the productivity of multi-cropping agricultural areas [27,28,29]. However, the current light-use efficiency (LUE) model is mainly driven by Moderate-Resolution Imaging Spectroradiometer (MODIS) data, and its field application is limited by low spatial resolution. With the development of multi-source remote sensing fusion technology, the integration of remote sensing data with high spatial and temporal resolution has become an important method for obtaining detailed farmland data, such as farmland productivity [30,31].
In this study, the VPM that can accurately simulate farmland productivity in multiple cropping regions and high spatiotemporal resolution based on multi-source remote sensing fusion technology were applied to construct the remote sensing monitoring index of MLPF transformation and HSF construction effectiveness. Henan Province, China’s greatest grain-producing province, was selected as a typical area, and the MLPF and HSF project regions were selected for remote sensing monitoring and the evaluation of construction effectiveness to evaluate the improvement of cropland productivity level (CPL), disaster resistance ability (DRA) and homogeneous yield degree (HYD).

2. Materials and Methods
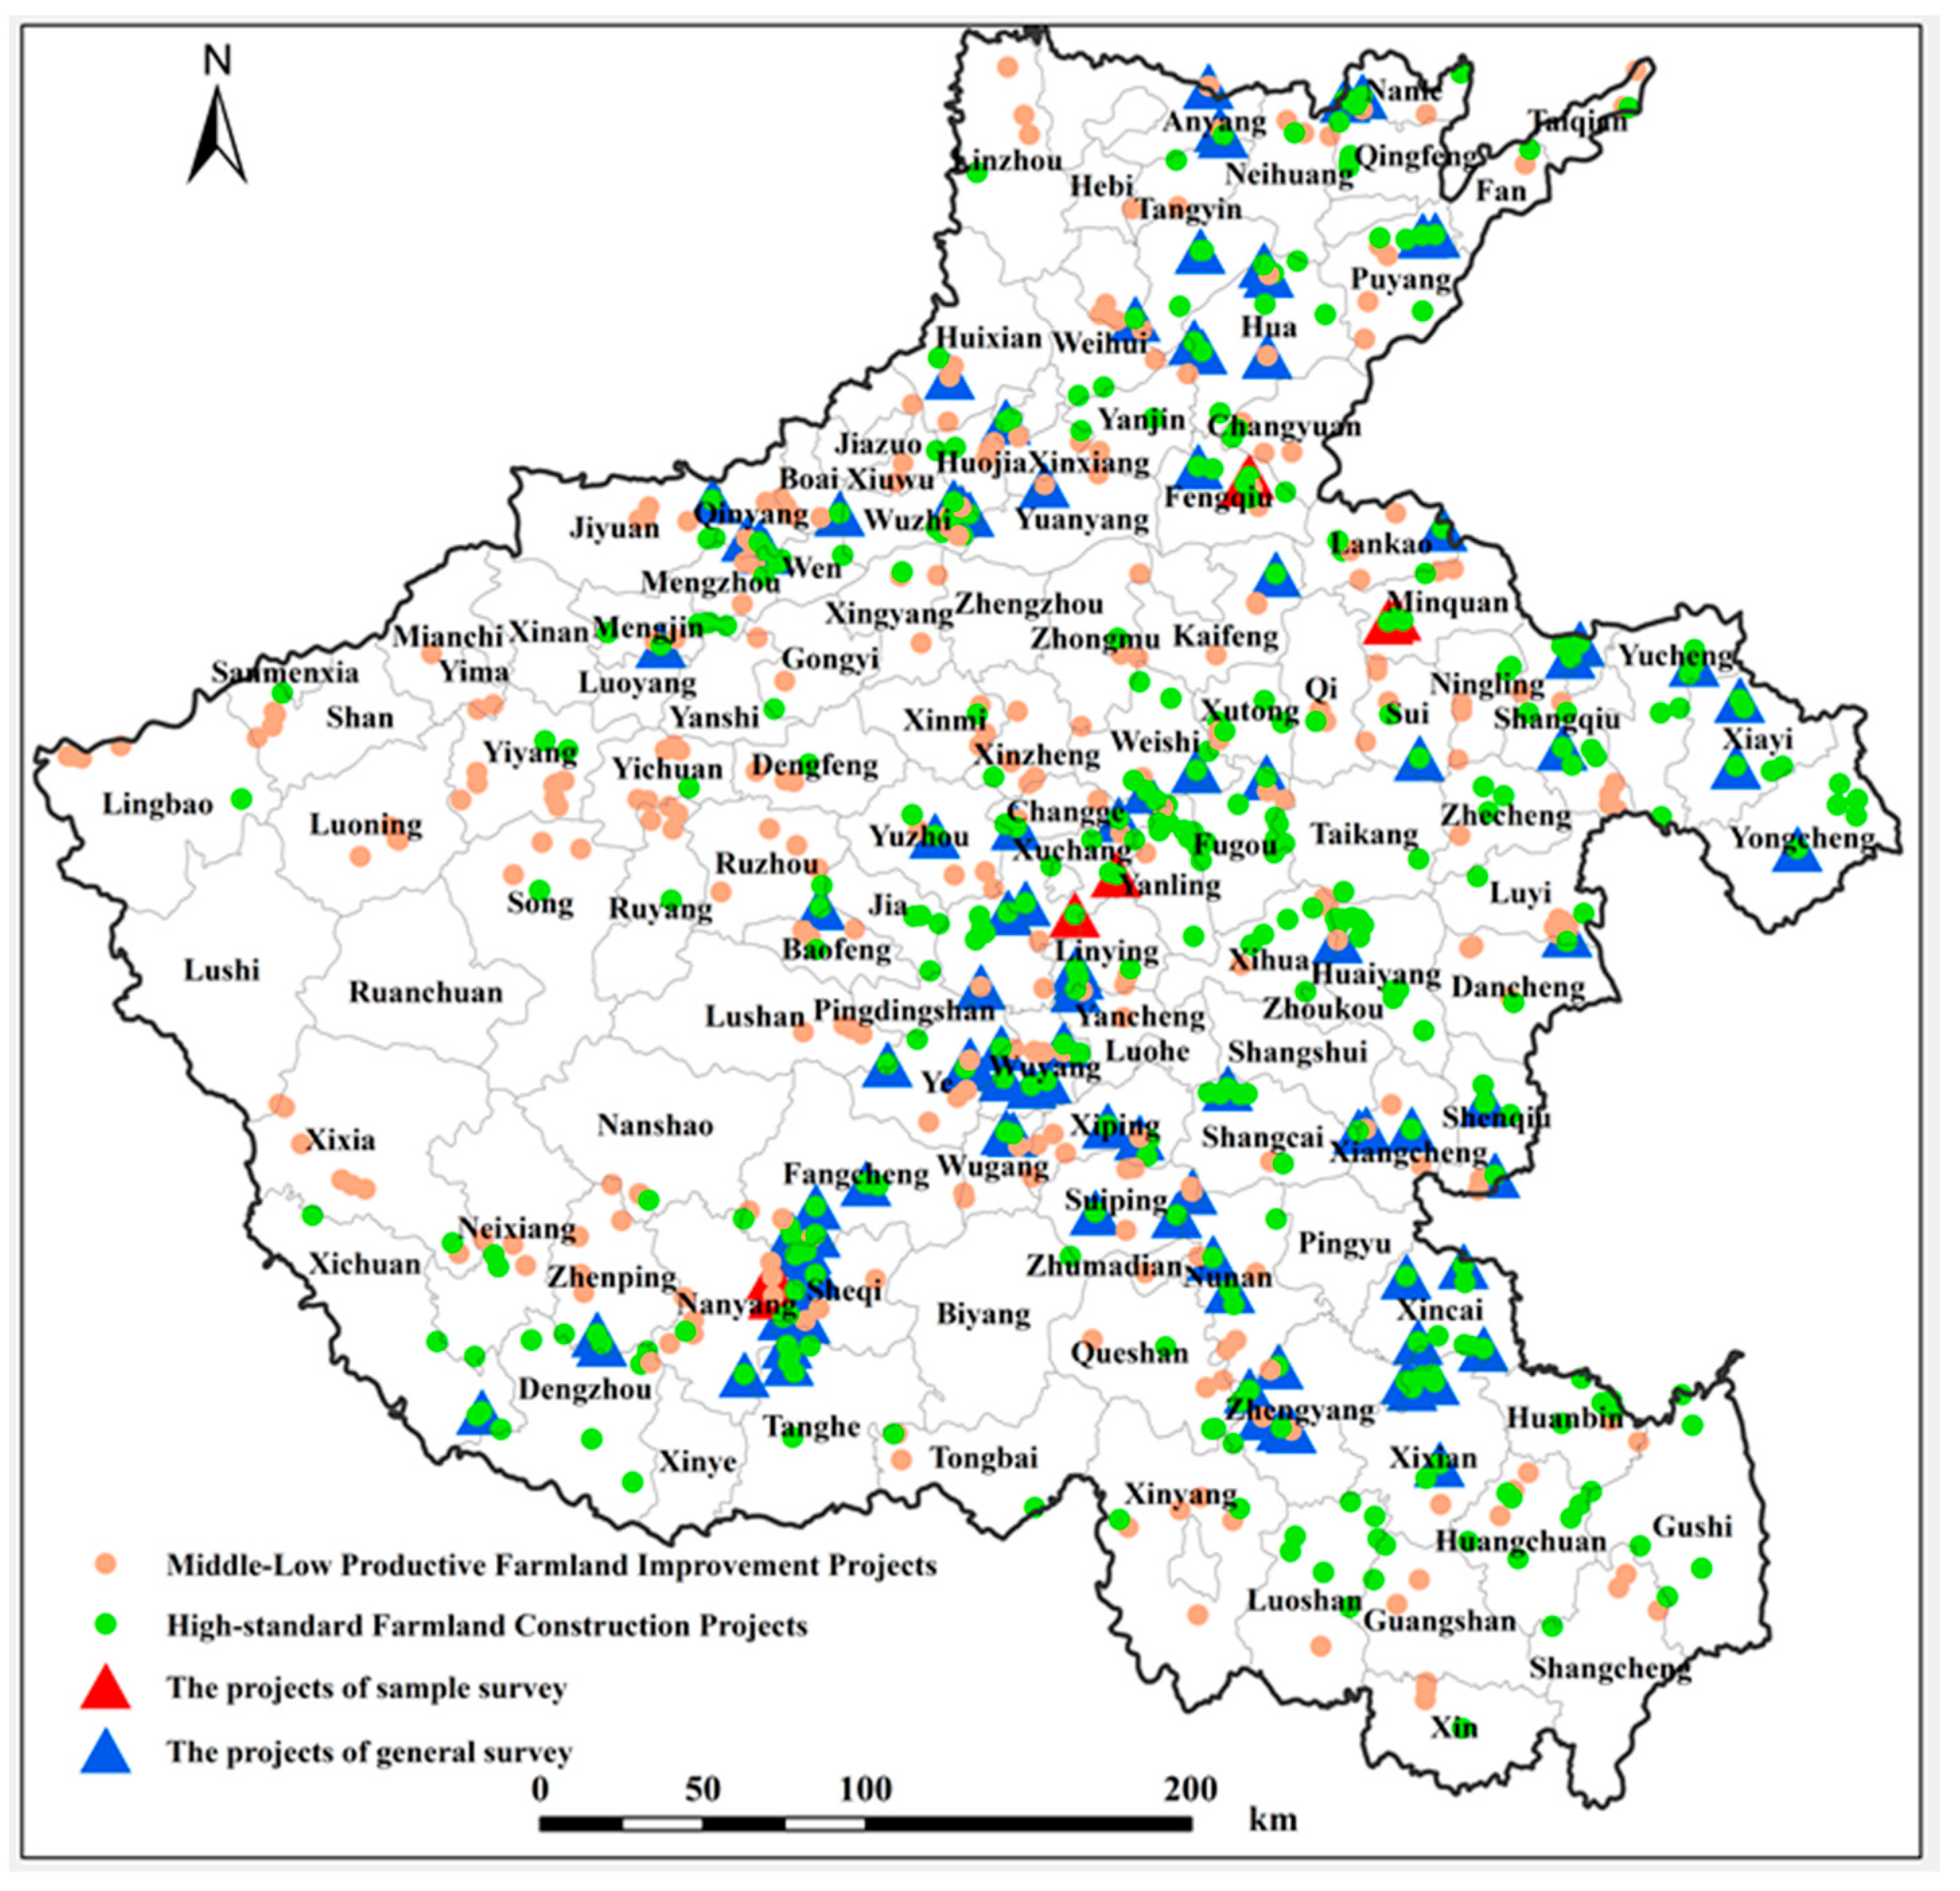
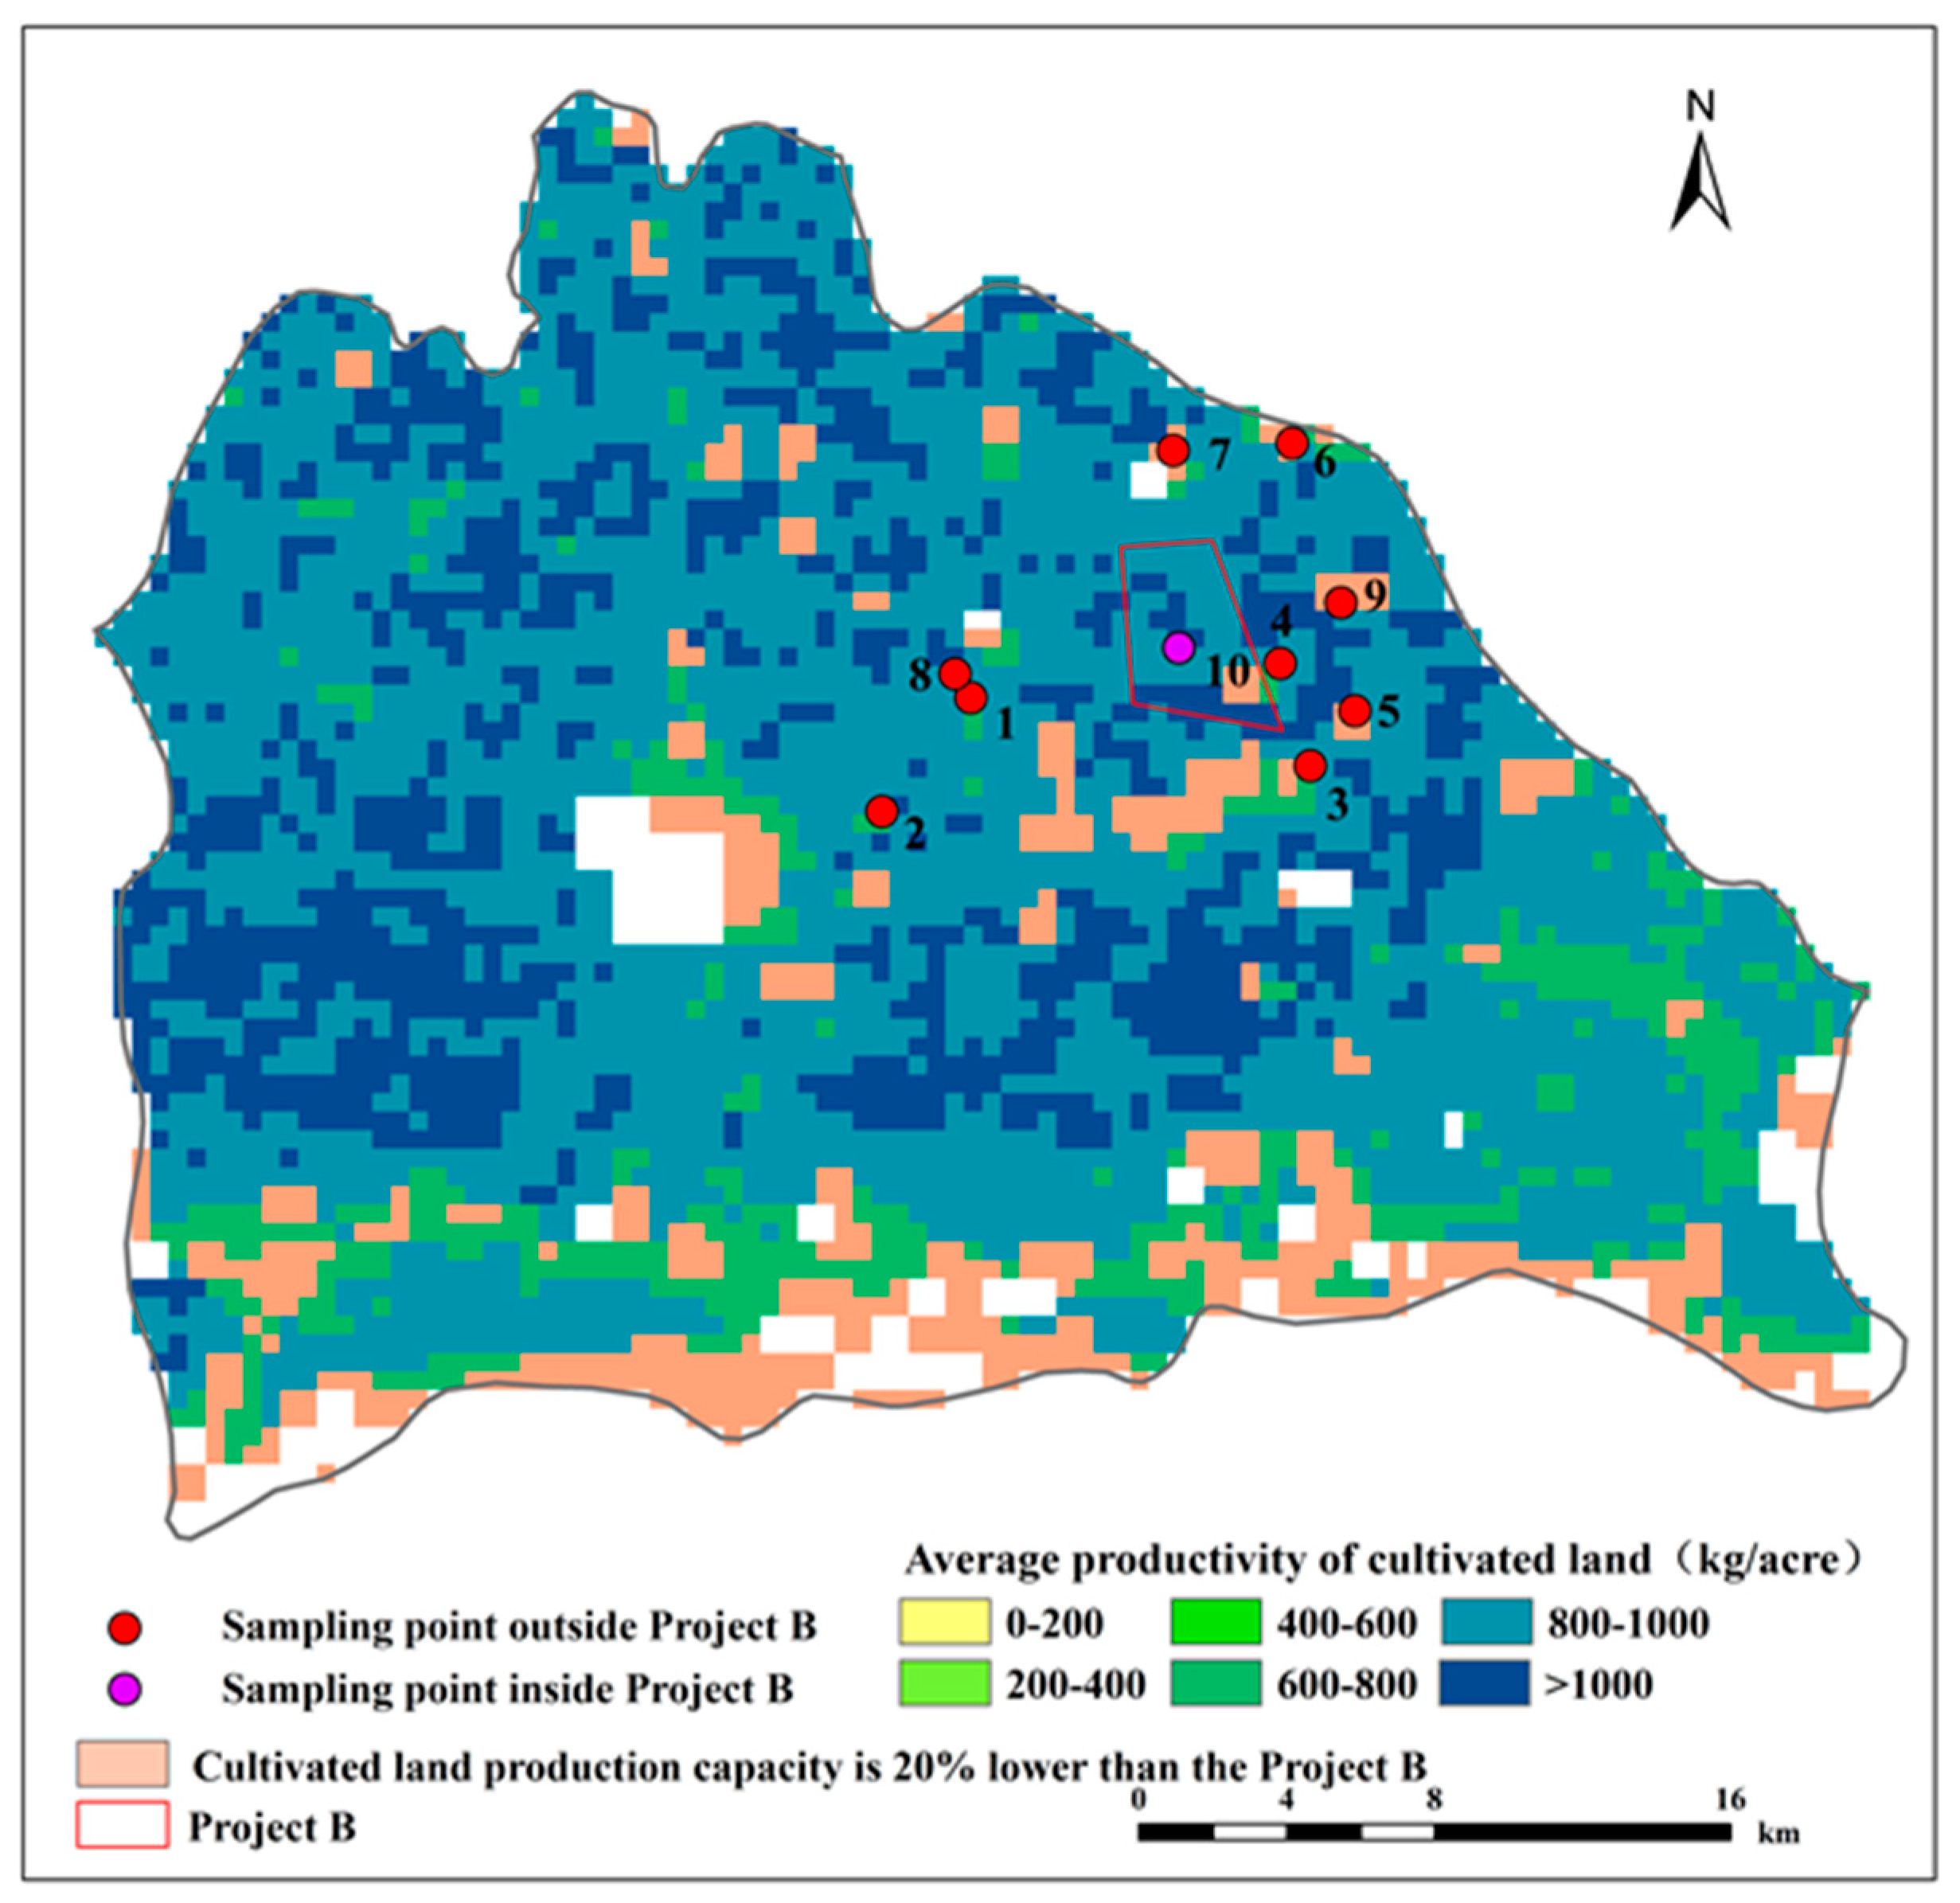
2.1. Study Area

Henan Province ranks first in China’s grain output. According to the China Statistical Yearbook, grain output in Henan Province was about 66.49 million tons in 2018, accounting for 10.1% of the country’s total grain output; wheat and corn are the main food crops in the province, accounting for 54% and 35% of total food crops output, respectively. Based on data on the distribution of cultivated land [27], 58.8% of its cultivated land is distributed in plain areas and 41.2% in hills and mountains; the cultivated land is mainly a double-cropping system of winter wheat and summer maize, and the double-cropping area accounts for about 60.35% of the total cultivated land. From 2011 to 2013, 630 project regions are located in Henan Province, including 288 MLPF transformation project regions and 342 HSF construction project regions (Figure 1). The number of project regions in the province accounts for 27.04% of the total number of project regions in China, making it the province with the greatest number of project regions. It is, therefore, of great significance to evaluate the effectiveness of MLPF transformation and HSF construction in Henan Province.

2.2. Data

This study evaluated the effectiveness of HSF in Henan Province constructed during 2011–2014 mainly based on the MODIS and Landsat data.
MODIS products. Vegetation indices, such as the Enhanced Vegetation Index (EVI) and Land surface water index (LSWI), were calculated using MODIS 8-day surface reflectance products (MOD09A1) at a 500-m resolution. These two vegetation indices were important inputs for Net Primary Production estimation using the Vegetation Photosynthesis Model (VPM). Considering the averaged 3-year farmland productivity of the project area was used to present the productivity before or after HSF project, the MODIS data during 2008–2016 were used for evaluating the effectiveness of HSF.
Landsat images. Landsat images from March to June during 2011–2016 in the 1 × 1 km around the center point of 630 projects were used in our study for identifying the continuous grain crops project area. Moreover, all the available Landsat images of the growing season in the 8 sampled HSF projects area during 2011–2016 were used for producing NPP with 30 m resolution. These data were accessed from United States Geological Survey (USGS) archives (http://glovis.usgs.gov/, accessed on 23 December 2021). The standard false-color composite of these images was applied for the visual interpretation of continuous grain crops in the targeted areas.
In addition, HSF project distribution, meteorological disasters, grain yield and meteorological data were used in this study. The details of all data used in this study are listed in Table 1.

2.3. Methodology

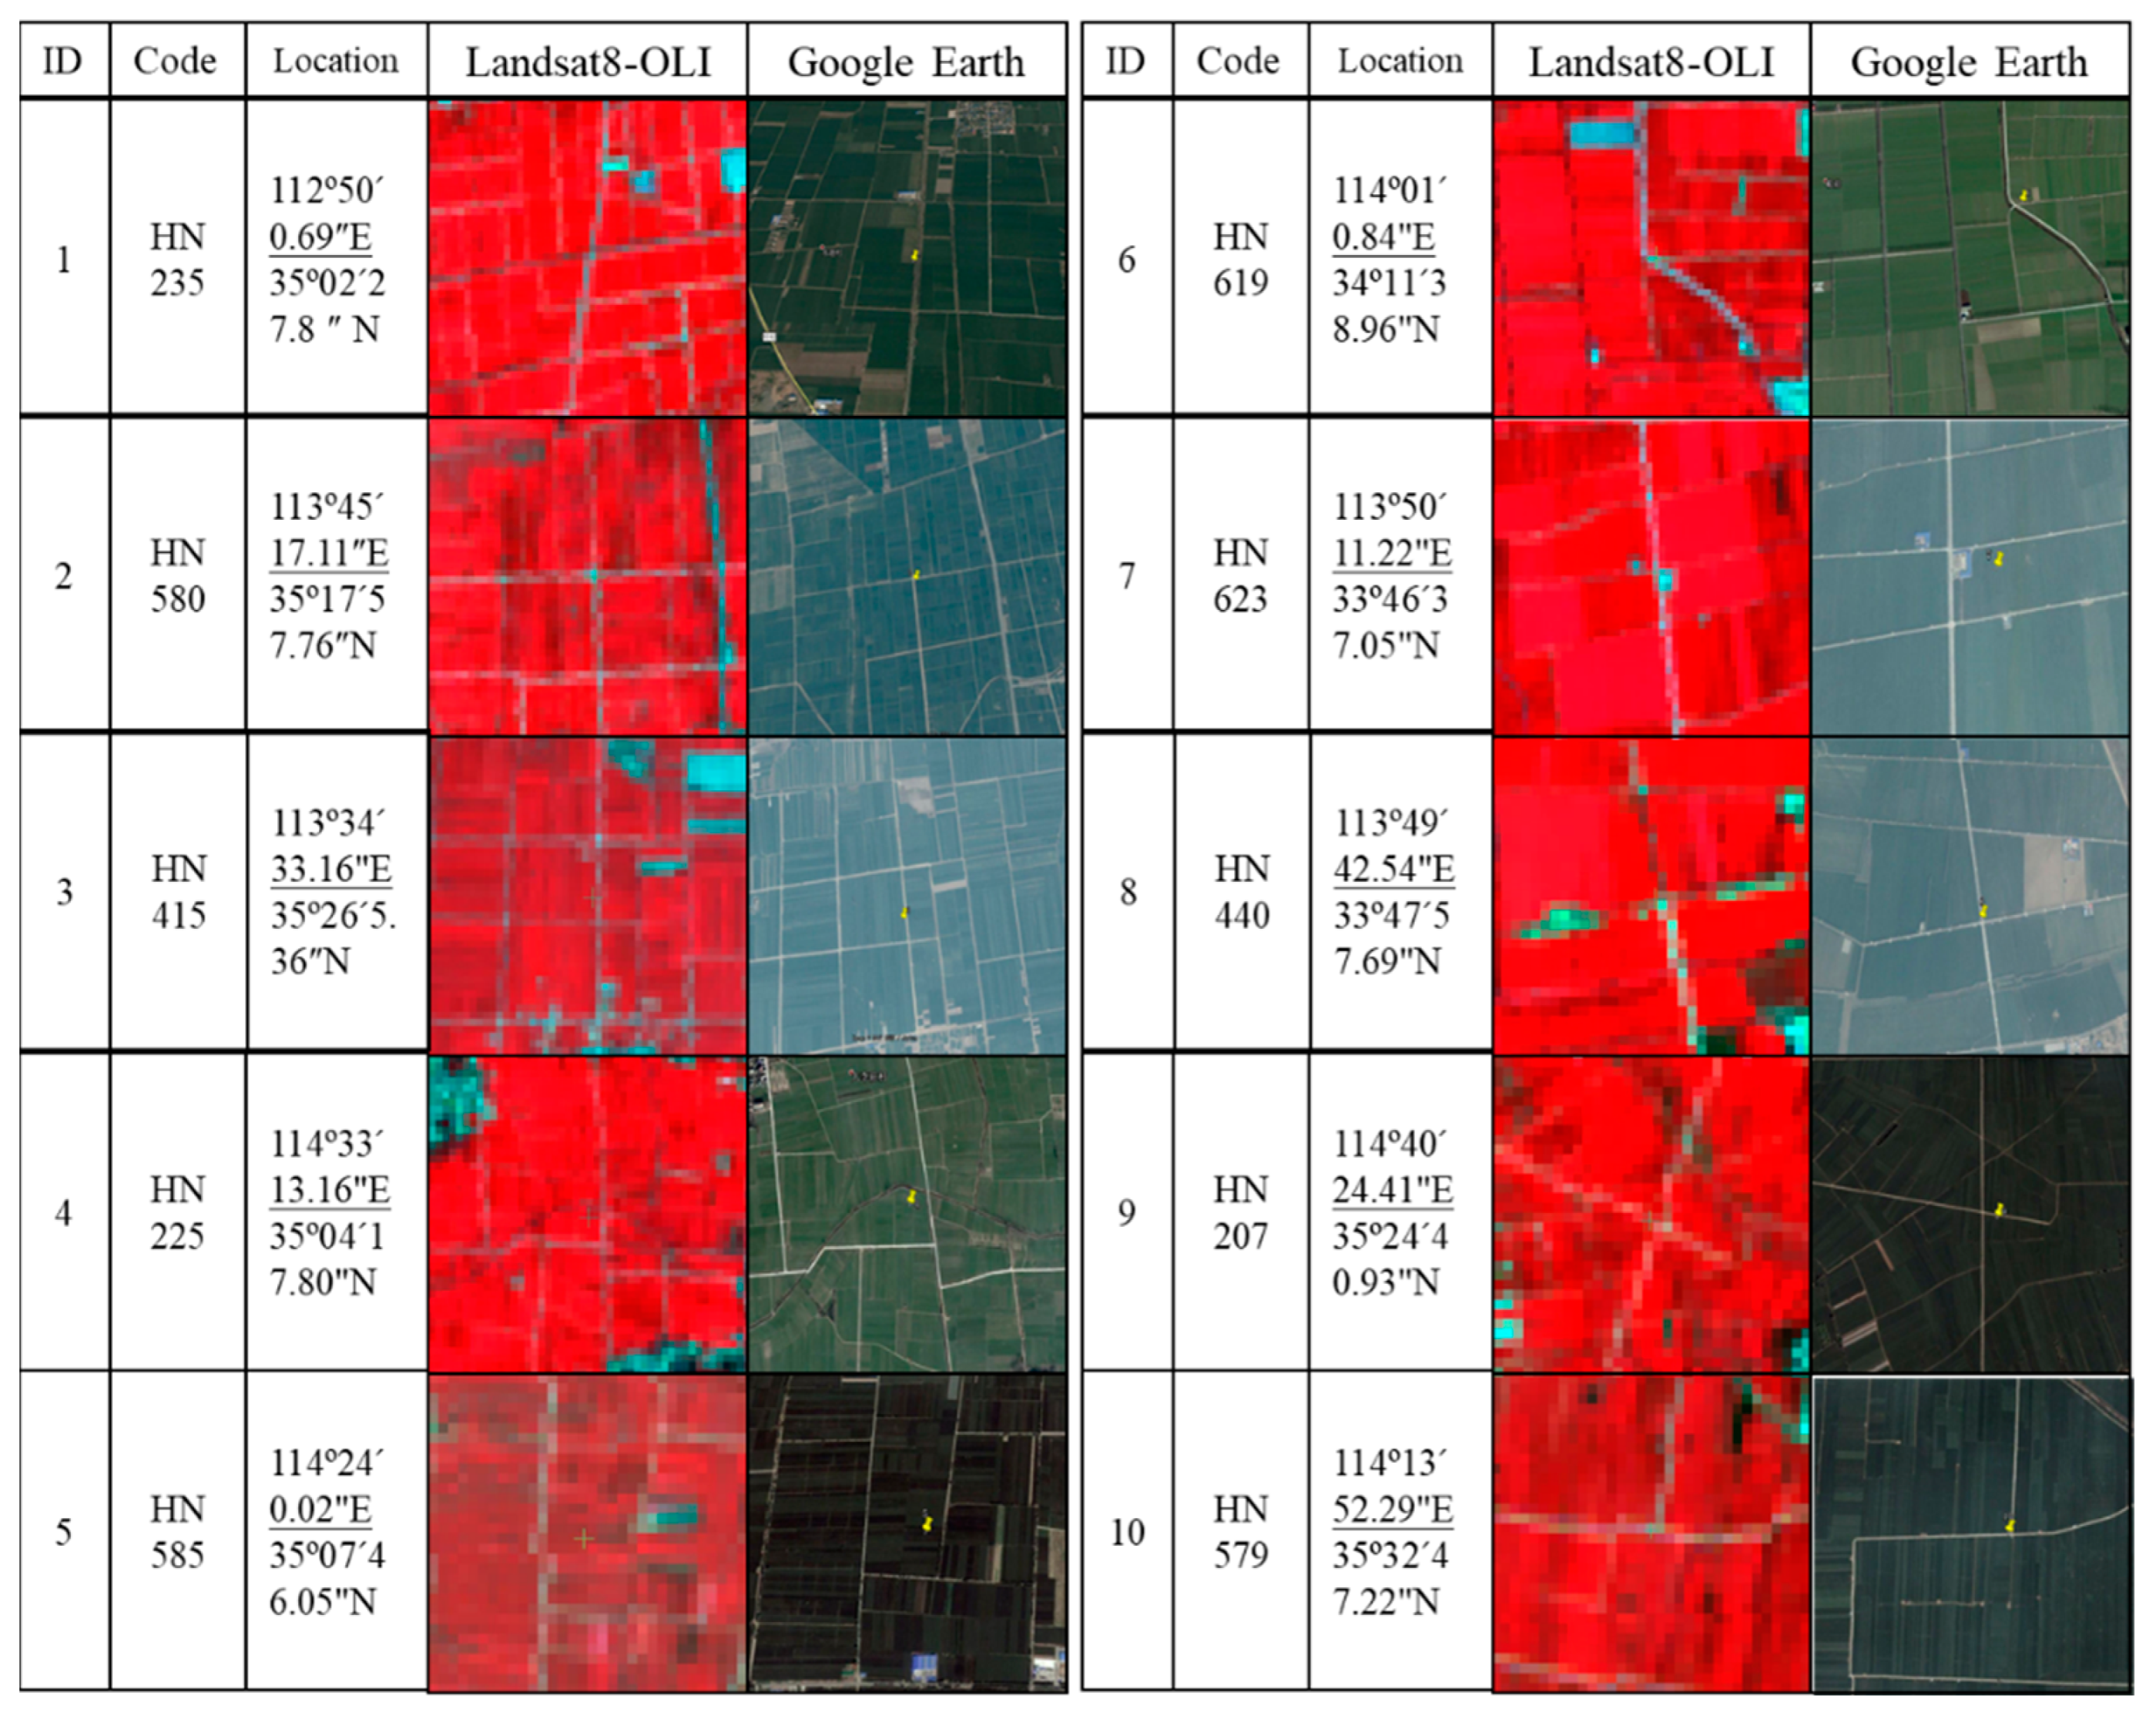
2.3.1. Satellite Monitoring Method of General Survey and Sampling Survey to Evaluate the Effectiveness of HSF Construction

Satellite monitoring of the effectiveness of HSF construction projects (including the MLPF transformation project regions) is carried out by a combination of a general survey and a sampling survey. The general survey can evaluate all projects, fully understand the overall improvement in cropland productivity after the construction of HSF and master regional differences in the improvement level. The sampling survey helps to deeply analyze the construction effectiveness of the project, not only to identify improvements in cropland productivity levels in each typical agri-ecological region but also to measure disaster resistance ability and homogeneous yield degree.
(1)
General survey
With the reform of agricultural supply, the planting structure in the HSF project region is changing. Part of it is changing from traditional planting of grain crops to economic crops, such as vegetables, and facility agriculture, such as greenhouses. In addition, part of it is changing from continuous agricultural planting to fallow rotation farming. To accurately understand the improvement capacity of HSF construction, it is necessary to select a project region with a stable planting structure for comparative analysis before and after project construction. In order to avoid the impact of mixed pixels obtained from remote sensing on the evaluation results, the project region participating in the evaluation should have a concentrated and contiguous distribution of cultivated land.
Based on the above considerations, our team screened 630 project regions in Henan Province using Landsat8-OLI data with a spatial resolution of 30 m and a Google Earth High-Definition image. A project region where cultivated land is intensively and continuously distributed and maintained as a grain crop planting was taken as the project region of general survey (the standard of maintained as grain crop planting is the image pixel is uniform and the proportion of the non-farmland area is less than 10% within 1 × 1 km, refer to Figure 2). Finally, 109 project regions in Henan Province were determined as the general survey project regions (Figure 1).
(2)
Sampling survey
To evaluate the effectiveness of HSF construction in disaster resistance and homogeneous yield, the sampling method is used for remote sensing with a spatial resolution of 30 m in a typical general survey project region. The project region is selected according to the following principles:
(1)
Taking into account different agri-ecological conditions;
(2)
Belonging to the general sample project region;
(3)
Taking into account HSF construction projects and MLPF transformation projects;
(4)
Taking into account the availability of remote sensing images;
(5)
Taking into account the balanced distribution of sampling project regions, with the number of sampling project regions in each county not exceeding two.
Based on the above sampling principles, a total of eight project regions were selected in four counties in Henan Province (Table 2, Figure 1). Our team conducted field research in these eight project regions.

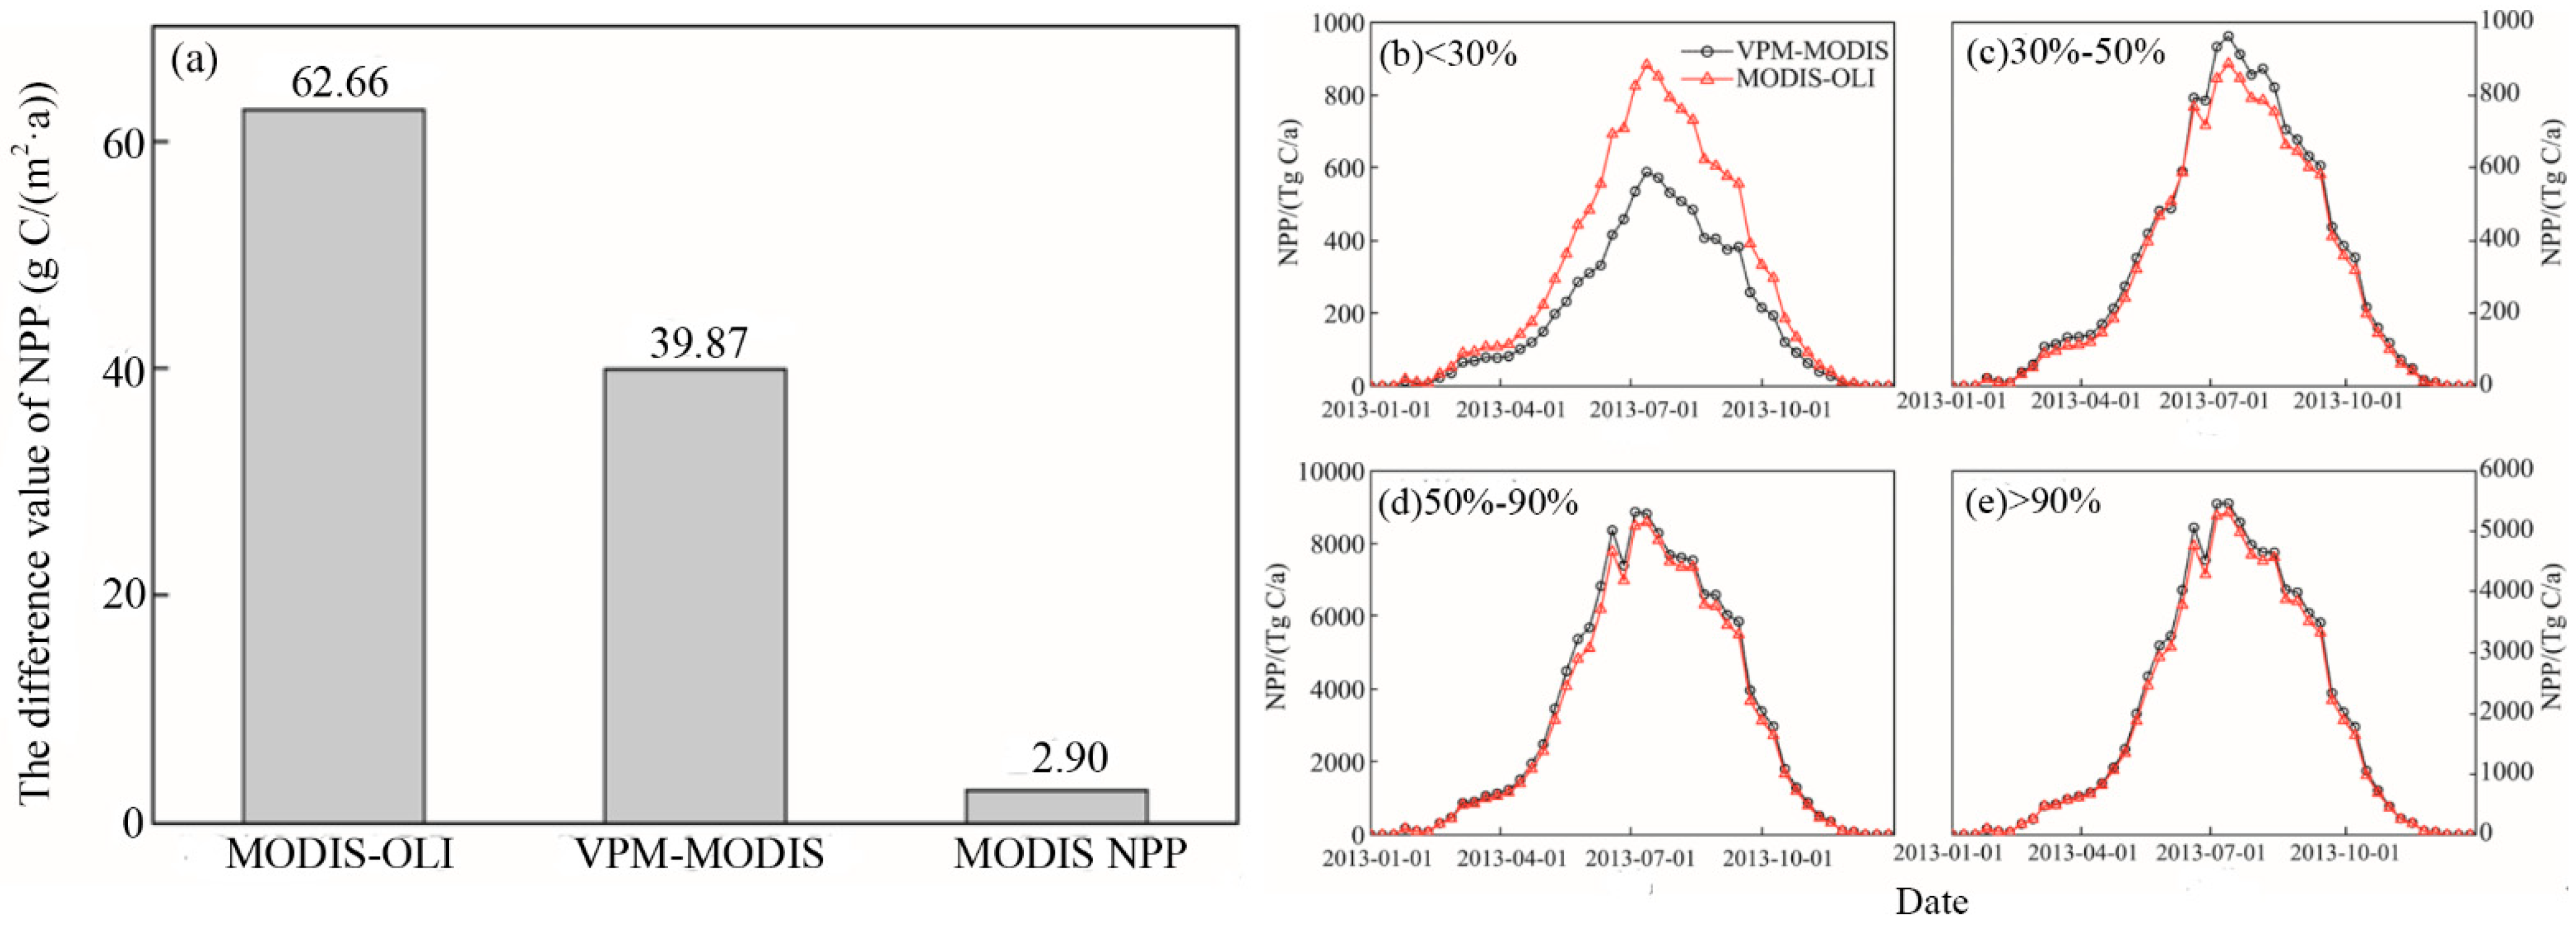
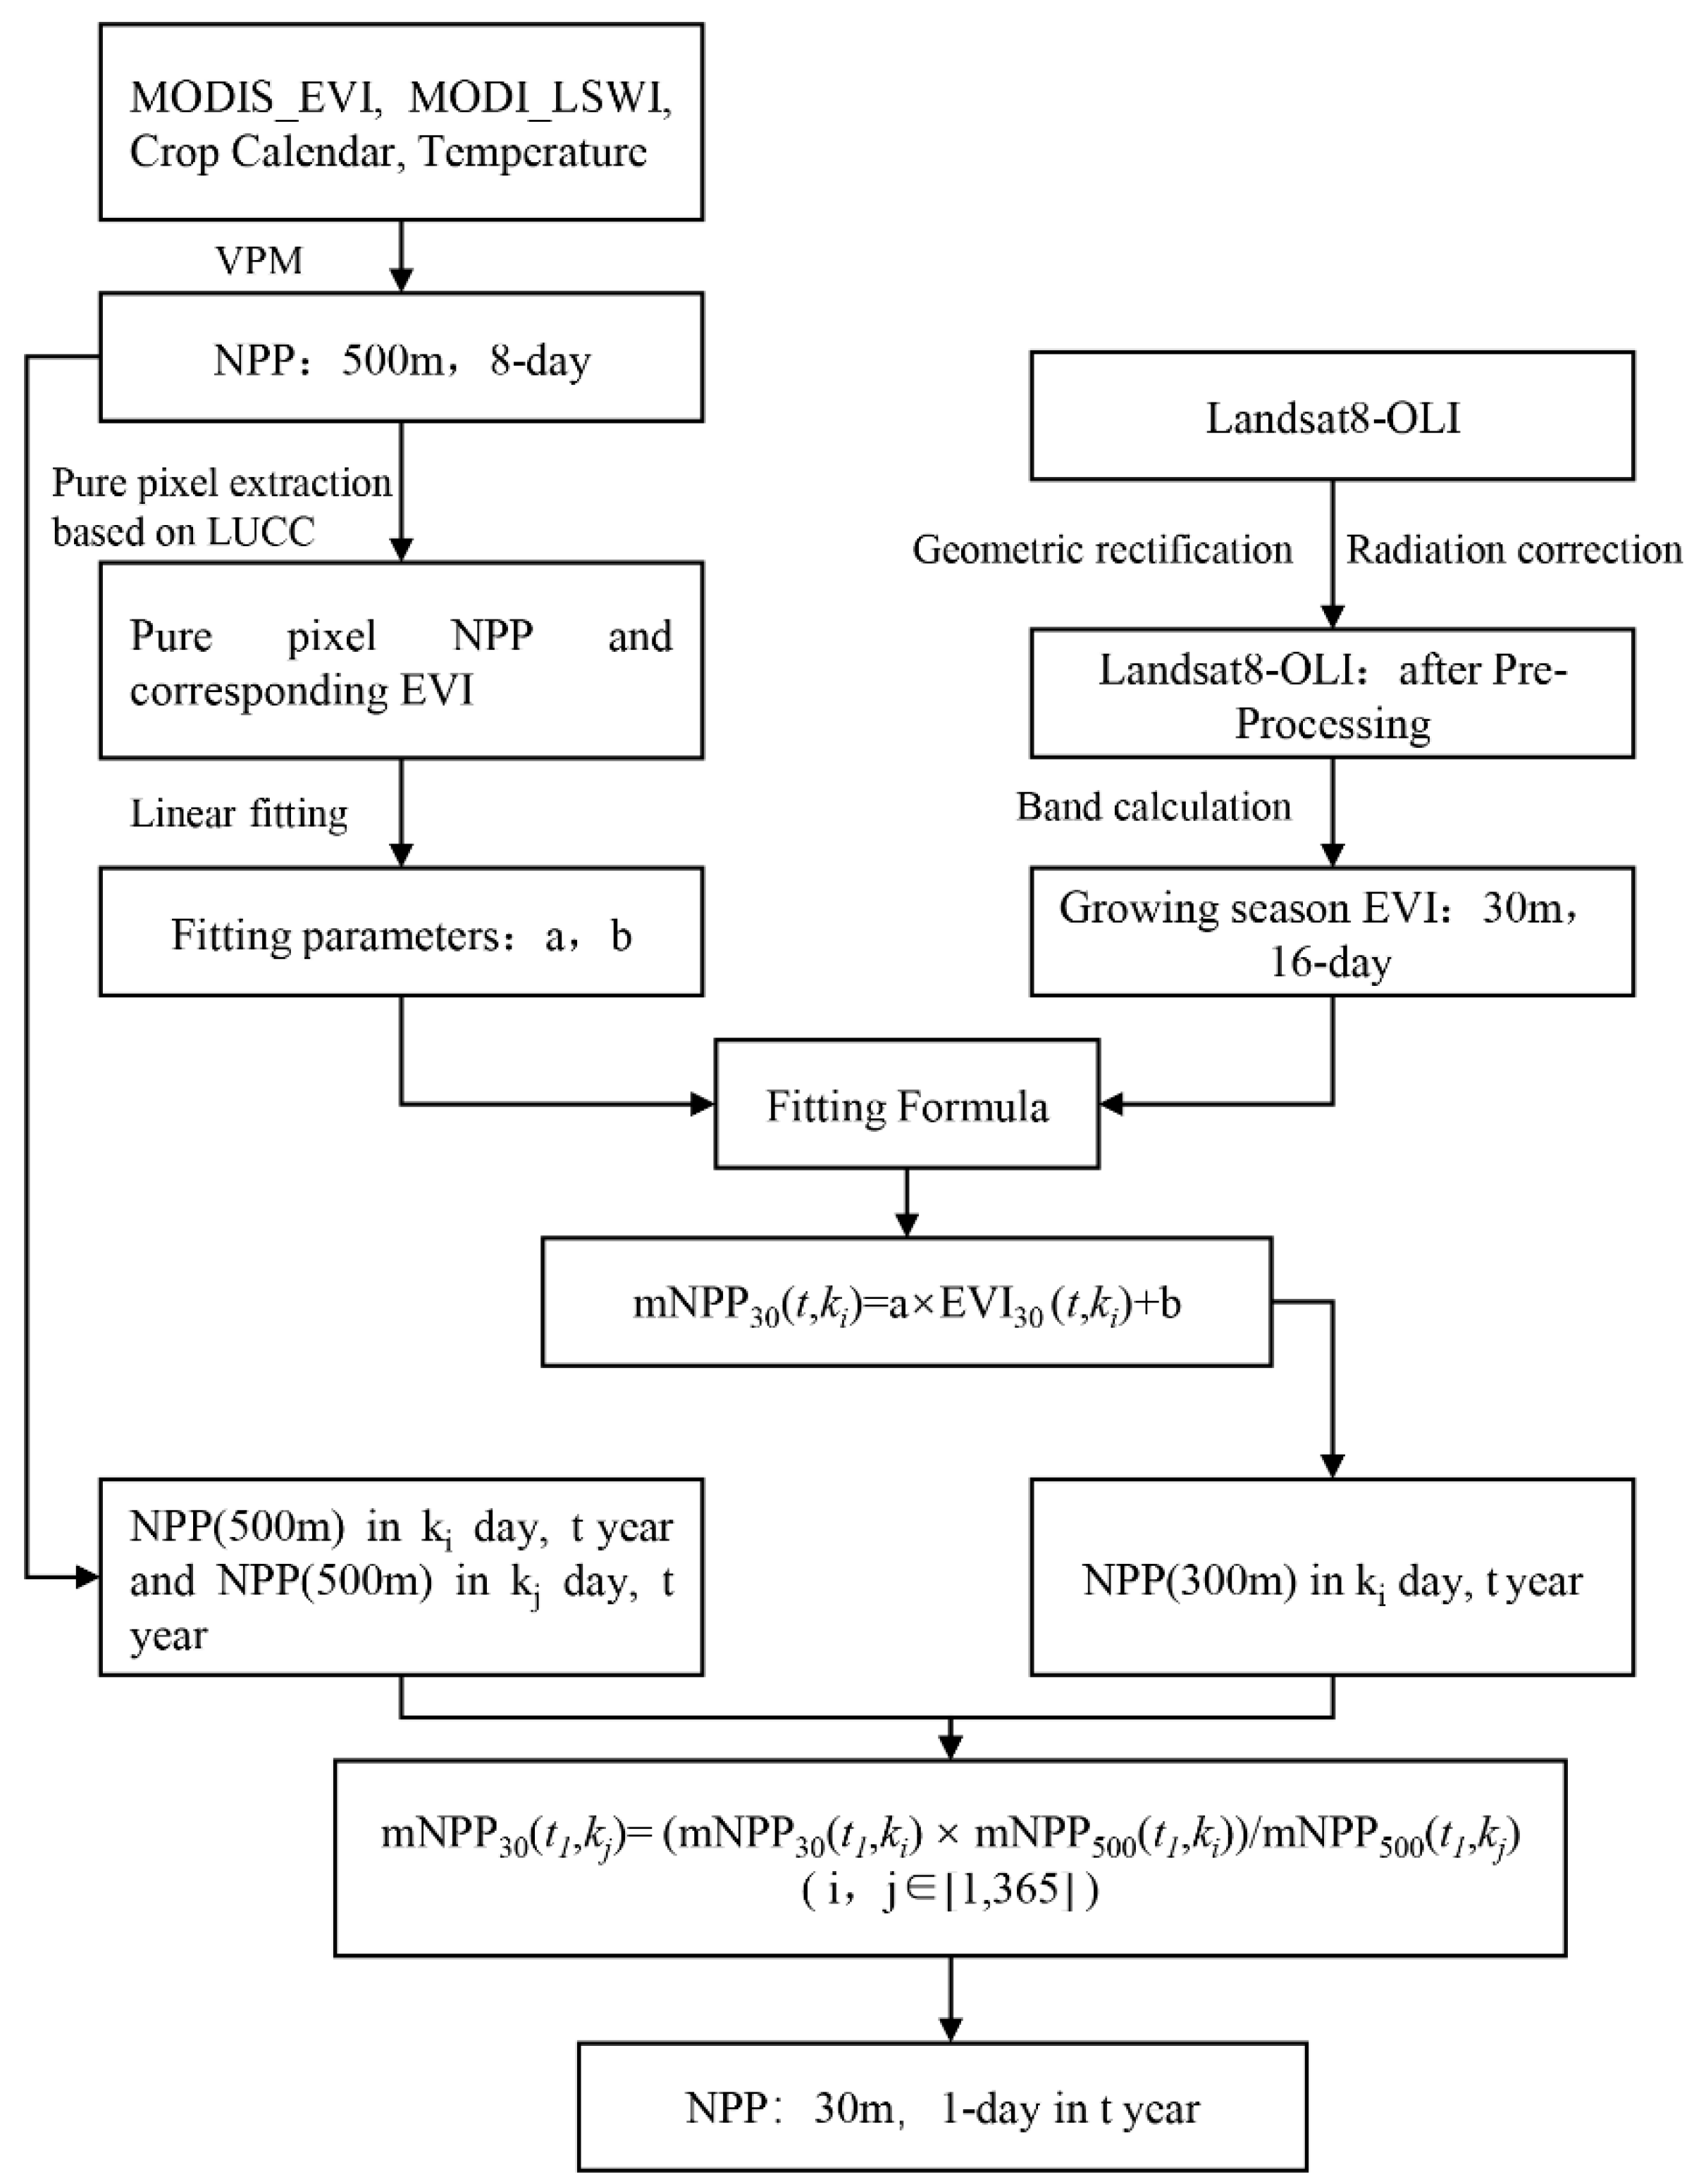
2.3.2. Remote Sensing Monitoring and Detection of Cropland Productivity

(1)
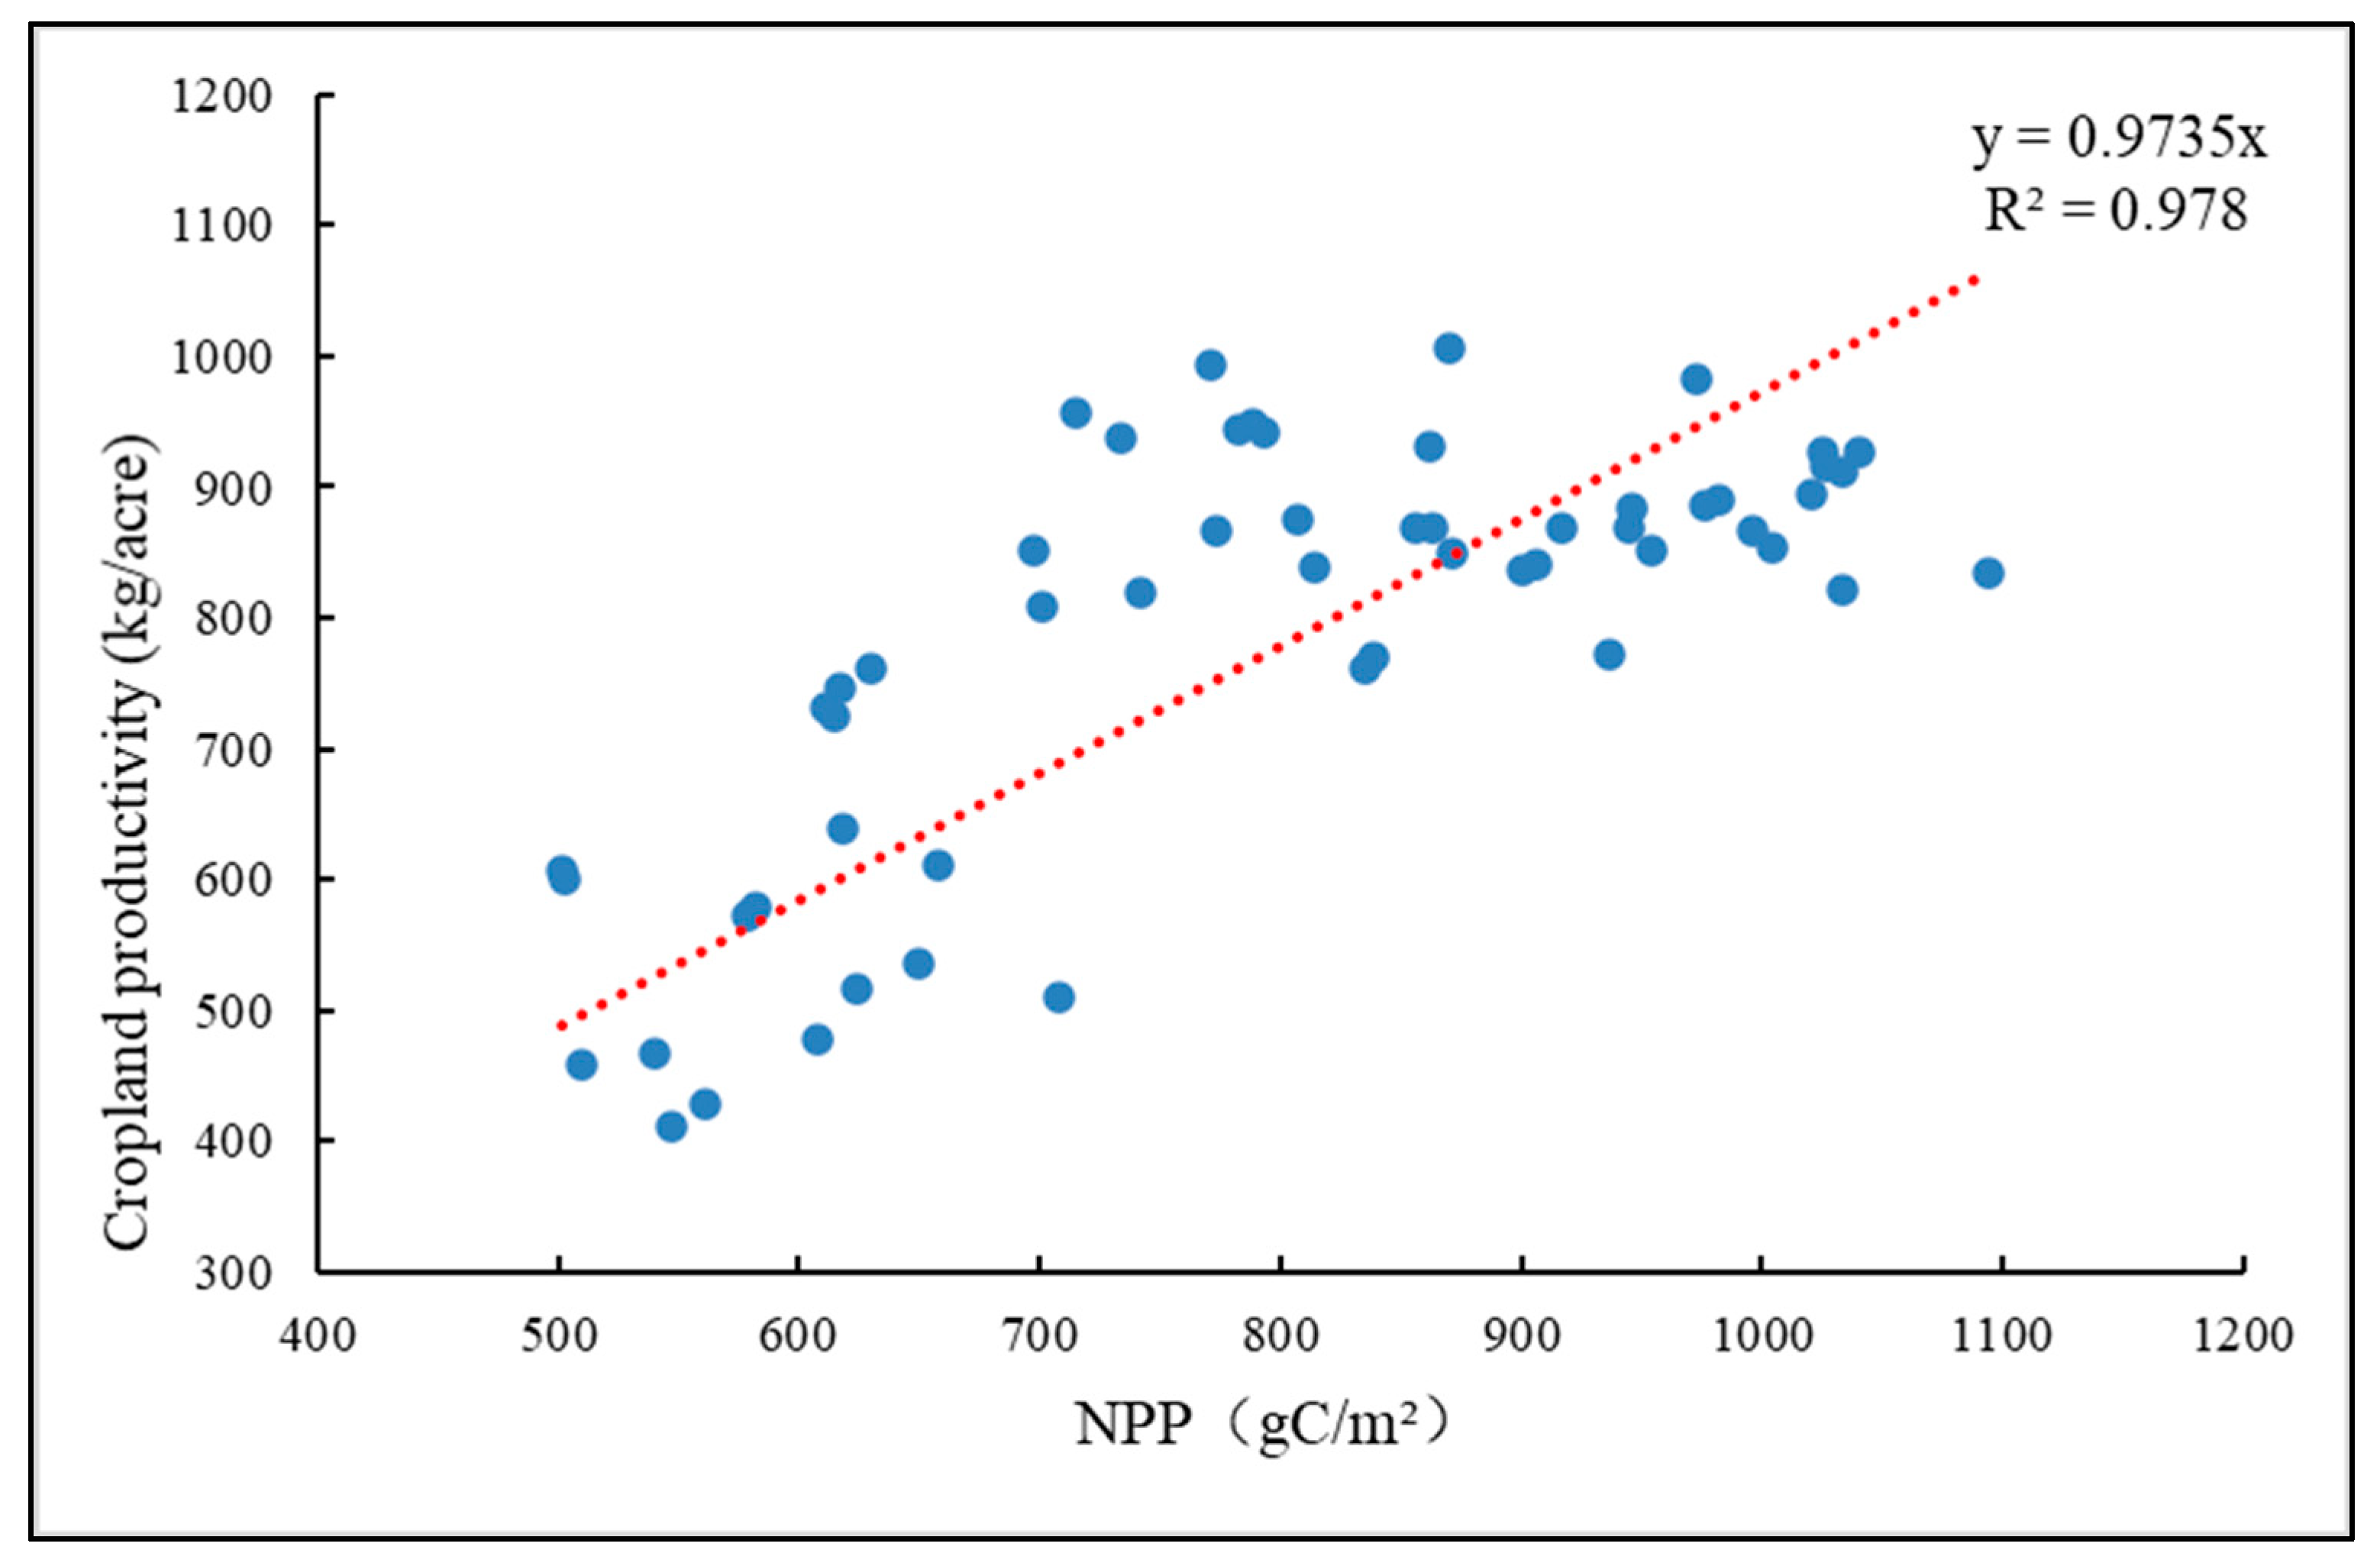
Remote sensing estimation of cropland productivity based on VPM
The Vegetation Photosynthesis Model (VPM) is a light use efficiency model for estimating GPP based on satellite remote sensing data [34,35]. Its theoretical basis is the light use efficiency theory proposed by Monteith, which divides the vegetation canopy into photosynthetic and non-photosynthetic parts. NPP is part of GPP, and its formula is as follows:
N P P = G P P × C U E
G P P = ε g × F P A R c h l × P A R
ε g = ε m a x × T s c a l a r × W s c a l a r × P s c a l a r
T s c a l a r = ( T T m i n ) × ( T T m a x ) ( T T m i n ) × ( T T m a x ) ( T T o p t ) 2
W s c a l a r = ( 1 + L S W I ) ( 1 + L S W I m a x )
P s c a l a r = 1 + L S W I 2
where Carbon Use Efficiency (CUE) represents a strictly linear relationship between daytime cumulative photosynthesis and cumulative nighttime respiration based on observation data [36], ε g is the light use efficiency, FPARchl is the fraction of photosynthetically active radiation (PAR) absorbed by leaf chlorophyll in the canopy, ε m a x is the maximum light use efficiency and Tscalar, Wscalar and Pscalar are scalars for the effects of temperature, water and leaf phenology on the efficiency of light use in vegetation, respectively [34,35,37]. T is the air temperature, Topt is the optimal temperature for photosynthesis, Tmax is the maximum temperature for photosynthesis and Tmin is the minimum temperature for photosynthesis. LSWI is the land surface water index, while LSWImax is the maximum LSWI during the growing season [34,35,37]. The temporal resolution of the model outputs was 8 days, and the spatial resolution was 500 × 500 m.
The NPP data simulated by the VPM were applied as a basic index that reflects the cropland productivity level. Based on the statistical data on the main crop sowing areas in counties of Henan Province, the main grain-producing counties with grain sowing areas larger than 80% of the total sowing area were selected as the sample counties. According to the statistics on main crop productivity and NPP data of each sample county, the regression relationship between the cropland productivity and the NPP per unit cropland area was established in order to calculate the cropland productivity (Figure 3) as follows (Cropland productivity = 0.9735 × NPP).
(2)
Time series linear fitting model
For the project region of the sampling survey, the time series fitting method is used to integrate spatial accuracy information of Landsat8-OLI data with a spatial resolution of 30 m and the high temporal information of MODIS data with a spatial resolution of 500 m and a time step of 8 days. Accordingly, the cropland productivity data with a spatial resolution of 30 m and a time step of 8 days were produced [30,31,38].
The input data include one pair of coarse resolution (500 × 500 m) NPP and fine resolution vegetation index (30 × 30 m) calculated from Landsat at time k1 and one coarse resolution NPP at time k2. The output data are predicted as fine resolution NPP at time k2. The time series linear fitting model includes three main steps: (1) Extraction of pure pixels based on a vegetation type map with a resolution of 30 m at time k1; (2) based on pure pixels, the fitting relationship between NPP and EVI at time k1 was obtained; and (3) based on the constructed fitting relationship, we used Landsat EVI to calculate the fine resolution NPP at times k1 and k2. Based on the assumption that the temporal trends of vegetation productivity are similar in the same period for the same type of vegetation and with the same spatial resolution, the formula can be obtained:
m N P P 30 ( k 2 ) = m N P P 30 ( k 1 ) × m N P P 500 ( k 1 ) m N P P 500 ( k 2 )
where m N P P 30 ( k 2 ) and m N P P 30 ( k 1 ) represent fine resolution NPP at times k1 and k2, while m N P P 500 ( t 2 ) and m N P P 500 ( t 1 ) represent coarse resolution NPPs at times k1 and k2. For more details, see Luo et al. (2018) [31] and Figure 4.

2.3.3. Indicators and Algorithms for Remote Sensing and Evaluation of HSF Construction Effectiveness

(1)
Improvement of cropland productivity level (CPL)
Increasing the productivity of cropland refers to improving the output capacity of grain or cash crops in the region. It is a direct indicator for measuring the effectiveness of HSF projects. In this study, the change in cropland productivity before and after the construction of the HSF project was selected as an index to measure the level of cropland productivity improvement. The formula for changing cropland productivity is as follows:
Δ P = P 2 P 1
where ΔP represents the change in farmland productivity, P2 refers to the averaged multi-year farmland productivity of the project area after the HSF project (3 years, not counting the year of project construction) and P1 refers to the averaged multi-year farmland productivity of the project area before the HSF project (3 years, not counting the year of project construction). A positive value of ΔP indicates an increase in cropland productivity in the project region, and a negative value indicates a decrease in cropland productivity in the project region.
(2)
Improvement of disaster resistance ability (DRA)
The stability of cropland production can reflect the range of cropland productivity fluctuations between years and seasons. It is an index to evaluate the ability of cropland to resist disasters and achieve a stable and high yield after the HSF construction. In this study, the difference in improvement level of cropland production stability between normal years and disaster years after the HSF construction is selected as an index to evaluate the improvement level of DRA of cropland after construction. The formula for the difference in the improvement level of cropland production stability (Sp) is as follows:
S p = R n R h
R n = ( N P n o r m a l N P d r o u g h t ) 100 / N P n o r m a l
R h = ( H P n o r m a l H P d r o u g h t ) 100 / H P n o r m a l
where R n is the change in productivity rate of drought-affected cropland in the non-project region, R h is the change in productivity rate of drought-affected cropland in the project region, N P n o r m a l is the productivity of the non-project region in normal years, N P d r o u g h t is the productivity of the non-project region in disaster years, H P n o r m a l is the productivity of the project region in normal years and H P d r o u g h t is the productivity of the project region in disaster years.
Improving the stability of cropland productivity is an index for evaluating the ability of the cropland to resist disaster and achieve stable and high yields after HSF construction. The higher the value of S p , the more stable cropland productivity due to HSF construction in the project region in dry years.
(3)
Improvement of homogenous yield degree (HYD)
Homogenous yield degree refers to the degree of uniformity and dispersion of high-yield fields after HSF construction, which can be used to measure the balanced yield increase capacity of HSF projects. If the cropland area of medium–low productivity decreases in the project region and the cropland area of high productivity increases, the effectiveness of the HSF project construction will be reflected in improved productivity. Based on this, the proportion index of cropland of medium–low productivity before and after the construction is selected to measure the balanced yield increasing the capacity of HSF construction projects. The formula for the proportion index change of medium–low productivity cropland is as follows:
L P = ( L a S a L b S b ) 100
where L P is the change in the percentage of medium–low productivity cropland before and after the project construction, S a is the total cropland area in the project region before the project construction, L a is the total area of medium–low productivity cropland in the project region before the project construction, S b is the total cropland area in the project region after the project and L b is the total area of medium–low productivity cropland in the project region after the project construction. The greater of LP, the higher the homogenous yield degree of HSF construction.

3. Results

3.1. Improvement of Cropland Productivity Level after HSF Construction

Among the 109 project regions of the general survey in Henan Province, there is no region with reduced productivity. Increased cropland productivity is from 77 to 552 kg/mu, while average cropland productivity increases by 145.0 kg/mu after HSF construction (Table 3, Figure 5). Among them are 86 project regions with a level of productivity increase of more than 100 kg/mu, which is 78.9% of all project regions with an average productivity increase of 160.7 kg/mu. Among these 86 project regions, there are 75 HSF construction projects (82.4% of all HSF construction projects) and 11 MLPF transformation projects (61.1% of all MLPF transformation projects). There are 23 project regions with a level of productivity increase from 50 to 100 kg/mu, accounting for 21.1% of all project regions, and the average productivity increase is 86.2 kg/mu.
The improvement level of cropland productivity in eight project regions of the sample survey is from 120 to 263 kg/mu, and the maximum productivity reaches 907 kg/mu (Project A). The productivity of six HSF project regions increased from less than 750 kg/mu to more than 850 kg/mu, and the increase was from 120 to 185 kg/mu. The two MLPF transformation project regions have a higher increase in cropland productivity than the six HSF project regions, which have increased by 261 and 263 kg/mu, respectively. However, although the transformation of middle–low productive farmland has achieved remarkable results, the cropland productivity of MLPF is still lower than that of cropland in HSF (Table 4).

3.2. The Improvement of Disaster Resistance Ability of Cropland after HSF Construction

According to the Henan Province disaster information statistical yearbooks (2011–2015) (Table 5), the province experienced different degrees of drought in 2013 and severe drought in 2014. To evaluate the drought resistance of the project construction, nine croplands were selected around each sampling project region and compared with the productivity stability of the project region. To exclude the HSF project regions for water conservancy, land and other relevant departments, we selected cropland located around the project region with a productivity of less than 20% of the project region as a non-project region (Figure 6). In addition, we compared and analyzed the difference in stability of crop productivity inside and outside the HSF project region under the drought stress in 2014.
According to the time series curve of crop growth during the drought in 2014 (March–early April, June–mid-August) (Figure 7), the growth of spring and summer crops in the project region is significantly better than in the non-project region. Furthermore, the time series of crop growth in the project region in 2013 and 2014 are basically the same, which indicates that the severe drought in 2014 does not have a significant impact on the project region. However, crop growth was significantly worse on five plots (sample points 2, 5, 6, 7 and 8) in the non-project region compared to that in the project region during the spring drought of 2014 (March–early April); the crop growth on five plots (sample points 3, 4, 5, 6 and 8) was also significantly worse than that in the project region during the summer drought in 2014 (June–mid-August) (Figure 7). From the above results, it can be seen that the crop growth in the disaster year (2014) in the project region is equivalent to that in the normal year (2013), while in the region surrounding the project region, the crop growth in disaster years (2014) is worse than that in the normal year (2013). This indicates that the HSF construction makes the cropland productivity more stable, i.e., the HSF construction not only improves cropland productivity but also enhances DRA.
Among the eight sample project regions, seven project regions showed higher stability of cropland productivity than the non-project regions in case of severe drought. Among them, Project F had the highest level of productivity stability, which increased by 23.87% compared to the surrounding non-project regions. This is followed by Projects D and G, where the productivity stability improvement level increased by 18.46% and 17.87%, respectively, compared to the surrounding non-project regions. Only Project H (constructed in 2013) had slightly lower productivity stability (−1.25%) compared to the surrounding non-project regions during the 2014 drought (Table 6), indicating that the benefits of water and soil coordination and management measures in the newly built project region have not been fully brought into play and DRA has not been improved.

3.3. The Improvement of Homogenous Yield Degree of Cropland after HSF Construction

The HSF construction enables the irrigation facilities to completely cover all crops in the project region. Furthermore, the conditions and levels of crop irrigation are evenly distributed. Concentrated and contiguous cropland in the project region has been promoted to highly productive land, and the construction of homogeneous and highly productive land has achieved remarkable results. Regarding the proportion of middle–low productive cropland, seven of the eight project regions had more than 95% of middle–low productive cropland before the HSF construction. After the implementation of the project, the HYD increase in the eight project regions is more than 75%; among them, the proportion of middle–low productive cropland decreased from more than 80% to less than 10% in three project regions, and the proportion of middle–low productive cropland decreased from more than 95% to less than 20% in five project regions (Table 7). Taking Projects A and B as examples, the proportion of middle–low productive cropland decreased from 95.9% and 84.9% to 1.8% and 3.2%, respectively. Furthermore, the proportion of middle–low productive cropland decreased by 94.1% and 81.7%, respectively (Figure 8).

4. Discussion

With the development of remote sensing, multi-source data provide an opportunity to directly reflect the real situation of cropland productivity, especially for the continuous grain crop planting region. The light use efficiency (LUE) models have been widely used to estimate regional vegetation productivity due to their simple form and the relatively long period of data availability [39]. At present, the VPM model is widely used to estimate the productivity of farmland ecosystem and shows good simulation ability [39], such as for the winter wheat and summer maize rotation farmland at Yucheng flux station [37] and the VPM simulated productivity of Tongyu farmland (corn) station [40]. In addition, the Yingke farmland (corn) station [41] can capture more than 80% of the observed interannual variation in productivity, and the accuracy can be improved by about 50% compared to MODIS17 products [42] (Figure 9).
In this study, we use VPM NPP data that combines MODIS and Landsat8-OLI data to evaluate the effectiveness of HSF construction in Henan Province. The NPP calculated using MODIS-OLI fusion data more accurately detects differences in cropland productivity due to the improvement in the spatial resolution of the data. Simple MODIS data are limited by low spatial resolution and cannot express spatial details, while high spatial resolution NPP data calculated using MODIS-OLI fusion data can clearly reflect the difference between high, medium and low productivity within the field. In addition, the MODIS-OLI fusion data achieves dynamic and high temporal resolution monitoring in 8-day steps, which can more accurately describe the impact of drought and floods on vegetation growth during the crop growth period, thus reflecting changes in DRA of HSF. The obtained results show that the changes in cropland productivity can be effectively detected, as well as disaster resistance ability and homogeneous yield degree before and after the construction of HSF.
To confirm the ability of the above methods to detect changes in cropland productivity, we analyzed the difference in cropland productivity of the three NPP products before and after the completion of the HSF project region. This was performed by comparing the NPP with a spatial resolution of 30 m calculated by the VPM after the integration of MODIS-OLI, the NPP with a spatial resolution of 500 m (VPM-MODIS) calculated by the VPM and the MODIS NPP standard products. The results of the analysis show that the ability to detect NPP products obtained by MODIS-OLI fusion is 50% higher than before the fusion, while MODIS NPP products can hardly detect changes in cropland productivity before and after HSF construction (Figure 10a). Comparing the 8-day time steps of MODIS-OLI NPP and VPM-MODIS NPP, it is shown that in the region where the cropland area accounts for more than 30% of the grid area, two sets of NPP data products maintain good consistency. However, in the region where the cropland area accounts for less than 30% of the grid area, the NPP calculated by MODIS-OLI fusion data is significantly higher than that calculated directly using MODIS data. It reflects the advantages of MODIS-OLI fusion data NPP products in detecting an HYD of cropland due to its high spatial resolution (Figure 10b–e). At the same time, the MODIS-OLI fusion data NPP products have a high temporal resolution (8 days) and can detect the DRA of cropland [38].
The accuracy of NPP estimation from LUE-based models significantly relies on the parameter of εmax [43,44]. In most of the current LUE models, the εmax is determined by land cover types and is considered as a constant. In our previous study, we developed a spatial dataset of εmax by integrating eddy covariance flux measurement, this dynamic modeling method recognizes the spatial and temporal heterogeneity of εmax, so as to reduce the uncertainties by vegetation spatial heterogeneity [27] and crop rotation [37]. Nevertheless, the fragmentation of cultivated land and the frequent adjustment of agricultural planting structure still limits the accurate estimation of cropland productivity.
In recent years, the structural reform on the agricultural supply side in China is powerfully promoting the planting structure change [45,46]. Some cropland has changed from traditional grain crops to cash crops, such as vegetables, and facility agriculture, such as greenhouses [47]. This study selects high-quality grain fields for continuous grain crop planting through fine interpretation using Landsat data and Google Earth High-Definition images, which can help avoid the uncertainty of the evaluation results caused by differences in crop types before and after project construction due to adjustment of the planting structure. The result of this study showed that only 109 project regions are continuous grain planting regions within the 630 HSF construction project regions in Henan Province. Although we tried to ensure the reliability by filtering the project’s area without continuous grain crops through visual interpretation from higher resolution satellite data, the methodology is still worth improving because it is a time-consuming and laborious process. The newly developed cropland variation detection technology based on the Google Earth Engine could improve the efficiency of identifying the continuous grain crops plots [48].
For Henan Province, located in the central part of China, there are about five to seven Landsat images for each year that could be used for data fusion with 8-day MODIS data, which can support the data fusion at each crop rotation season and, therefore, effectively improve the spatial accuracy of NPP estimation. However, for southern regions with more cloudy and rainy weather, where only one or two qualified images in the whole growing season can be used for data fusion [49,50]. Persistent clouds over agricultural fields can mask key stages of crop growth; the fusional NPP cannot capture the heterology information in different crop rotation seasons, leading to unreliable yield predictions. Therefore, it is necessary to incorporate optical and radar remote sensing to develop new data fusion methods for high tempo-spatial resolution cropland productivity monitoring [51,52]. Synthetic Aperture Radar (SAR) provides all-weather imagery that can potentially overcome this limitation, but given its high and distinct sensitivity to different surface properties, the fusion of SAR and optical data still remains an open challenge [53,54].

5. Conclusions

Based on data from MODIS and Landsat, this study constructs evaluation indicators to characterize improvements in cropland productivity, disaster resistance ability and homogenous yield degree. Henan Province, a major grain-producing province in China, is taken as the research area. By combining the general survey and sampling survey in typical grain planting project regions, the effectiveness of HSF projects is evaluated. The results show that there are 109 project regions with continuous grain planting within the 630 HSF construction project regions in Henan Province. The cropland productivity in all 109 project regions of the general survey has improved. Among the eight sampling regions, seven regions show that the level of cropland productivity stability is higher than that of the non-project region in the case of severe drought. All regions show that the homogenous yield degree of cropland productivity is also effectively improved.
These results suggest that in order to achieve the goal of the HSF plan in China, in addition to the effectiveness of improving cropland productivity, it is necessary to pay close attention to the spatial layout and structural adjustment of agricultural planting in order to recover cropland, store grain and effectively ensure lasting food security.

Author Contributions

H.Y.: Conceptualization, Methodology, Writing—Review and Editing, Funding acquisition. W.D.: Writing—Review and Editing, Visualization. Y.Z.: Writing—Review and Editing, Funding acquisition. L.L.: Writing—Original Draft, Visualization. Z.N.: Methodology. All authors have read and agreed to the published version of the manuscript.

Funding

This work was financially supported by the Strategic Priority Research Program of the Chinese Academy of Sciences (XDA28060300), National Natural Science Foundation of China (42130508), and Establishment of National Ecological Environmental Accounting System (Project No: 2110105).

Data Availability Statement

Not applicable.

Acknowledgments

The authors sincerely thank anonymous reviewers and members of the editorial team for their comments.

Conflicts of Interest

The authors declare no conflict of interest.

References

  1. Godfray, H.C.J.; Beddington, J.R.; Crute, I.R.; Haddad, L.; Lawrence, D.; Muir, J.F.; Pretty, J.; Robinson, S.; Thomas, S.M.; Toulmin, C. Food security: The challenge of feeding 9 billion people. Science 2010, 327, 812–818. [Google Scholar] [CrossRef] [Green Version]
  2. Pradhan, P.; Fischer, G.; van Velthuizen, H.; Reusser, D.E.; Kropp, J.P. Closing yield gaps: How sustainable can we be? PLoS ONE 2015, 10, e0129487. [Google Scholar] [CrossRef] [PubMed] [Green Version]
  3. Campbell, B.M.; Beare, D.J.; Bennett, E.M.; Hall-Spencer, J.M.; Ingram, J.S.; Jaramillo, F.; Ortiz, R.; Ramankutty, N.; Sayer, J.A.; Shindell, D. Agriculture production as a major driver of the Earth system exceeding planetary boundaries. Ecol. Soc. 2017, 22, 8. [Google Scholar] [CrossRef]
  4. Gerten, D.; Heck, V.; Jägermeyr, J.; Bodirsky, B.L.; Fetzer, I.; Jalava, M.; Kummu, M.; Lucht, W.; Rockstrom, J.; Schaphoff, S.; et al. Feeding ten billion people is possible within four terrestrial planetary boundaries. Nat. Sustain. 2020, 3, 200–208. [Google Scholar] [CrossRef]
  5. Neumann, K.; Verburg, P.H.; Stehfest, E.; Müller, C. The yield gap of global grain production: A spatial analysis. Agric. Syst. 2010, 103, 316–326. [Google Scholar] [CrossRef]
  6. Ray, D.K.; Mueller, N.D.; West, P.C.; Foley, J.A. Yield trends are insufficient to double global crop production by 2050. PLoS ONE 2013, 8, e66428. [Google Scholar]
  7. Ray, D.K.; Foley, J.A. Increasing global crop harvest frequency: Recent trends and future directions. Environ. Res. Lett. 2013, 8, 044041. [Google Scholar] [CrossRef]
  8. Tilman, D.; Balzer, C.; Hill, J.; Befort, B.L. Global food demand and the sustainable intensification of agriculture. Proc. Natl. Acad. Sci. USA 2011, 108, 20260–20264. [Google Scholar] [CrossRef] [Green Version]
  9. Wu, W.; Yu, Q.; You, L.; Chen, K.; Tang, H.; Liu, J. Global cropping intensity gaps: Increasing food production without cropland expansion. Land Use Pol. 2018, 76, 515–525. [Google Scholar] [CrossRef]
  10. Chen, W.; Ye, X.; Li, J.; Fan, X.; Liu, Q.; Dong, W. Analyzing requisition–compensation balance of farmland policy in China through telecoupling: A case study in the middle reaches of Yangtze River Urban Agglomerations. Land Use Pol. 2019, 83, 134–146. [Google Scholar] [CrossRef]
  11. Song, W.; Pijanowski, B.C. The effects of China’s cultivated land balance program on potential land productivity at a national scale. Appl. Geogr. 2014, 46, 158–170. [Google Scholar] [CrossRef]
  12. Yan, H.; Liu, J.; Huang, H.Q.; Tao, B.; Cao, M. Assessing the consequence of land use change on agricultural productivity in China. Glob. Planet. Chang. 2009, 67, 13–19. [Google Scholar] [CrossRef]
  13. Kuang, W.; Liu, J.; Tian, H.; Shi, H.; Dong, J.; Song, C.; Li, X.; Du, G.; Hou, Y.; Lu, D.; et al. Cropland redistribution to marginal lands undermines environmental sustainability. Natl. Sci. Rev. 2022, 9, nwab091. [Google Scholar] [CrossRef] [PubMed]
  14. Yan, H.; Ji, Y.; Liu, J.; Liu, F.; Hu, Y.; Kuang, W. Potential promoted productivity and spatial patterns of medium-and low-yield cropland land in China. J. Geogr. Sci. 2016, 26, 259–271. [Google Scholar] [CrossRef] [Green Version]
  15. Ministry of Agriculture and Rural Affairs of the People’s Republic of China. Notice of the General Office of the Ministry of Agriculture and Rural Affairs on Accelerating the Construction of a High-Standard Farmland Construction Planning System; Gazette of the Ministry of Agriculture and Affairs of the People’s Republic of China: Beijing, China, 2021; Volume 11, pp. 92–93.
  16. Maselli, F.; Moriondo, M.; Angeli, L.; Fibbi, L.; Bindi, M. Estimation of wheat production by the integration of MODIS and ground data. Int. J. Remote Sens. 2011, 32, 1105–1123. [Google Scholar] [CrossRef]
  17. Becker-Reshef, I.; Vermote, E.; Lindeman, M.; Justice, C. A generalized regression-based model for forecasting winter wheat yields in Kansas and Ukraine using MODIS data. Remote Sens. Environ. 2010, 114, 1312–1323. [Google Scholar] [CrossRef]
  18. Johnson, D.M. An assessment of pre-and within-season remotely sensed variables for forecasting corn and soybean yields in the United States. Remote Sens. Environ. 2014, 141, 116–128. [Google Scholar] [CrossRef]
  19. Azzari, G.; Lobell, D.B. Landsat-based classification in the cloud: An opportunity for a paradigm shift in land cover monitoring. Remote Sens. Environ. 2017, 202, 64–74. [Google Scholar] [CrossRef]
  20. Jin, Z.; Azzari, G.; You, C.; Di Tommaso, S.; Aston, S.; Burke, M.; Lobell, D.B. Smallholder maize area and yield mapping at national scales with Google Earth Engine. Remote Sens. Environ. 2019, 228, 115–128. [Google Scholar] [CrossRef]
  21. Xiong, J.; Thenkabail, P.S.; Tilton, J.C.; Gumma, M.K.; Teluguntla, P.; Oliphant, A.; Congalton, R.G.; Yadav, K.; Gorelick, N. Nominal 30-m cropland extent map of continental Africa by integrating pixel-based and object-based algorithms using Sentinel-2 and Landsat-8 data on Google Earth Engine. Remote Sens. 2017, 9, 1065. [Google Scholar] [CrossRef] [Green Version]
  22. Qader, S.H.; Dash, J.; Alegana, V.A.; Khwarahm, N.R.; Tatem, A.J.; Atkinson, P.M. The role of earth observation in achieving sustainable agricultural production in arid and semi-arid regions of the world. Remote Sens. 2021, 13, 3382. [Google Scholar] [CrossRef]
  23. Ghazaryan, G.; König, S.; Rezaei, E.E.; Siebert, S.; Dubovyk, O. Analysis of drought impact on croplands from global to regional scale: A remote sensing approach. Remote Sens. 2020, 12, 4030. [Google Scholar] [CrossRef]
  24. Peng, Y.; Gitelson, A.A.; Keydan, G.; Rundquist, D.C.; Moses, W. Remote estimation of gross primary production in maize and support for a new paradigm based on total crop chlorophyll content. Remote Sens. Environ. 2011, 115, 978–989. [Google Scholar] [CrossRef]
  25. Peng, Y.; Gitelson, A.A. Remote estimation of gross primary productivity in soybean and maize based on total crop chlorophyll content. Remote Sens. Environ. 2012, 117, 440–448. [Google Scholar] [CrossRef]
  26. Wu, C.; Niu, Z.; Gao, S. Gross primary production estimation from MODIS data with vegetation index and photosynthetically active radiation in maize. J. Geophys. Res.-Atmos. 2010, 115, D12. [Google Scholar] [CrossRef] [Green Version]
  27. Chen, J.; Yan, H.; Wang, S.; Gao, Y.; Huang, M.; Wang, J.; Xiao, X. Estimation of Gross Primary Productivity in Chinese Terrestrial Ecosystems by Using VPM Model. Quat. Sci. 2014, 34, 732–742. (In Chinese) [Google Scholar]
  28. Yan, H.; Xiao, X.; Huang, H. Satellite observed crop calendar and its spatio-temporal characteristics in multiple cropping area of Huang-Huai-Hai Plain. Acta Ecol. Sin. 2010, 30, 2416–2423. (In Chinese) [Google Scholar]
  29. Zhang, Y.; Yu, Q.; Jiang, J.I.E.; Tang, Y. Calibration of Terra/MODIS gross primary production over an irrigated cropland on the North China Plain and an alpine meadow on the Tibetan Plateau. Glob. Chang. Biol. 2008, 14, 757–767. [Google Scholar] [CrossRef]
  30. Niu, Z.; Yan, H.; Huang, M.; Hu, Y.; Chen, J. Agricultural Productivity Estimation with MODIS-OLI Fusion Data. Nat. Resour. 2016, 31, 875–885. (In Chinese) [Google Scholar]
  31. Luo, L.; Yan, H.; Niu, Z. Comparative Analysis on Three Multi-Source Remote Sensing Data Fusion Models in Monitoring Farmland Productivity. ISPRS Int. J. Geoinf. 2018, 20, 268–279. (In Chinese) [Google Scholar]
  32. Wang, J.; Wang, J.; Ye, H.; Liu, Y.; He, H. An interpolated temperature and precipitation dataset at 1-km grid resolution in China (2000–2012). China Sci. Data 2017, 2, 88–95. [Google Scholar]
  33. Ren, X.; He, H.; Zhang, L.; Yu, G. Global radiation, photosynthetically active radiation, and the diffuse component dataset of China, 1981–2010. Earth Syst. Sci. Data Discuss. 2018, 10, 1217–1226. [Google Scholar] [CrossRef] [Green Version]
  34. Xiao, X.; Hollinger, D.; Aber, J.; Goltz, M.; Davidson, E.A.; Zhang, Q.; Moore III, B. Satellite-based modeling of gross primary production in an evergreen needleleaf forest. Remote Sens. Environ. 2004, 89, 519–534. [Google Scholar] [CrossRef]
  35. Xiao, X.; Zhang, Q.; Braswell, B.; Urbanski, S.; Boles, S.; Wofsy, S.; Berrien, M.; Ojima, D. Modeling gross primary production of temperate deciduous broadleaf forest using satellite images and climate data. Remote Sens. Environ. 2004, 91, 256–270. [Google Scholar] [CrossRef]
  36. Albrizio, R.; Steduto, P. Photosynthesis, respiration and conservative carbon use efficiency of four field grown crops. Agric. For. Meteorol. 2003, 116, 19–36. [Google Scholar] [CrossRef]
  37. Yan, H.; Fu, Y.; Xiao, X.; Huang, H.Q.; He, H.; Ediger, L. Modeling gross primary productivity for winter wheat–maize double cropping system using MODIS time series and CO2 eddy flux tower data. Agric. Ecosyst. Environ. 2009, 129, 391–400. [Google Scholar] [CrossRef]
  38. Zhu, X.; Chen, J.; Gao, F.; Chen, X.; Masek, J.G. An enhanced spatial and temporal adaptive reflectance fusion model for complex heterogeneous regions. Remote Sens. Environ. 2010, 114, 2610–2623. [Google Scholar] [CrossRef]
  39. Zhang, Y.; Xiao, X.; Wu, X.; Zhou, S.; Zhang, G.; Qin, Y.; Dong, J. A global moderate resolution dataset of gross primary production of vegetation for 2000–2016. Sci. Data 2017, 4, 170165. [Google Scholar] [CrossRef] [Green Version]
  40. Wang, Z.; Xiao, X.; Yan, X. Modeling gross primary production of maize cropland and degraded grassland in northeastern China. Agric. For. Meteorol. 2010, 150, 1160–1167. [Google Scholar] [CrossRef]
  41. Niu, Z.; Yan, H.; Chen, J.; Huang, M.; Hu, Y.; Wang, S. Comparison of crop gross primary productivity estimated with VPM model and MOD17 product in field ecosystem of China. Trans. Chin. Soc. Agric. Eng. 2016, 32, 191–198. (In Chinese) [Google Scholar]
  42. Running, S.W.; Zhao, M. Daily GPP and Annual NPP (MOD17A2/A3) Products NASA Earth Observing System MODIS Land Algorithm; MOD17 User’s Guide; LP DAAC: Sioux Falls, SD, USA, 2015; Volume 2015, pp. 1–28. [Google Scholar]
  43. Wang, H.; Jia, G.; Fu, C.; Feng, J.; Zhao, T.; Ma, Z. Deriving maximal light use efficiency from coordinated flux measurements and satellite data for regional gross primary production modeling. Remote Sens. Environ. 2010, 114, 2248–2258. [Google Scholar] [CrossRef]
  44. Wellington, M.J.; Kuhnert, P.; Renzullo, L.J.; Lawes, R. Modelling Within-Season Variation in Light Use Efficiency Enhances Productivity Estimates for Cropland. Remote Sens. 2022, 14, 1495. [Google Scholar] [CrossRef]
  45. Liu, H.; Yang, P.; Wu, W.; Li, G.; You, L. Spatio-temporal changes in Chinese crop patterns over the past three decades. J. Geogr. Sci. 2016, 71, 840–851. (In Chinese) [Google Scholar]
  46. Liu, Z.; Yang, P.; Wu, W.; You, L. Spatiotemporal changes of cropping structure in China during 1980–2011. J. Geogr. Sci. 2018, 28, 1659–1671. [Google Scholar] [CrossRef] [Green Version]
  47. Wang, X.; Liu, B.; Wu, G.; Sun, Y.; Guo, X.; Jin, Z.; Xu, W.; Zhao, Y.; Zhang, F.; Zou, C.; et al. Environmental costs and mitigation potential in plastic-greenhouse pepper production system in China: A life cycle assessment. Agric. Syst. 2018, 167, 186–194. [Google Scholar] [CrossRef]
  48. You, N.; Dong, J. Examining earliest identifiable timing of crops using all available Sentinel 1/2 imagery and Google Earth Engine. ISPRS J. Photogramm. Remote Sens. 2020, 161, 109–123. [Google Scholar] [CrossRef]
  49. Li, P.; Jiang, L.; Feng, Z.; Sheldon, S.; Xiao, X. Mapping rice cropping systems using Landsat-derived renormalized index of normalized difference vegetation index (RNDVI) in the Poyang Lake region, China. Front. Earth Sci. 2016, 10, 303–314. [Google Scholar] [CrossRef]
  50. MacAlister, C.; Mahaxay, M. Mapping wetlands in the Lower Mekong Basin for wetland resource and conservation management using Landsat ETM images and field survey data. J. Environ. Manag. 2009, 90, 2130–2137. [Google Scholar] [CrossRef]
  51. Joshi, N.; Baumann, M.; Ehammer, A.; Fensholt, R.; Grogan, K.; Hostert, P.; Jepsen, M.R.; Kuemmerle, T.; Meyfroidt, P.; Mitchard, E.T.A.; et al. A review of the application of optical and radar remote sensing data fusion to land use mapping and monitoring. Remote Sens. 2016, 8, 70. [Google Scholar] [CrossRef] [Green Version]
  52. Liu, N.; Dai, W.; Santerre, R.; Hu, J.; Shi, Q.; Yang, C. High spatio-temporal resolution deformation time series with the fusion of InSAR and GNSS data using spatio-temporal random effect model. IEEE Trans. Geosci. Remote Sens. 2018, 57, 364–380. [Google Scholar] [CrossRef]
  53. Shao, Z.; Wu, W.; Guo, S. IHS-GTF: A fusion method for optical and synthetic aperture radar data. Remote Sens. 2020, 12, 2796. [Google Scholar] [CrossRef]
  54. Pipia, L.; Muñoz-Marí, J.; Amin, E.; Belda, S.; Camps-Valls, G.; Verrelst, J. Fusing optical and SAR time series for LAI gap filling with multioutput Gaussian processes. Remote Sens. Environ. 2019, 235, 111452. [Google Scholar] [CrossRef]
Figure 1. Spatial distribution of the MLPF transformation project regions and HSF construction project regions in Henan Province, and general survey projects and sample survey projects in this study. NOTE: For the definition of the general survey projects and the sample survey projects refers to Section 2.3.1.
Remotesensing 14 01724 g001
Figure 2. Satellite image of the representative project region of the general survey in HSF construction.
Remotesensing 14 01724 g002
Figure 3. Relationship between NPP of farmland ecosystems and cropland productivity in Henan Province.
Remotesensing 14 01724 g003
Figure 4. The process diagram of estimate 30 m NPP using time series fitting method.
Remotesensing 14 01724 g004
Figure 5. The improvement of cropland productivity level in the HSF construction project regions and the MLPF transformation project regions.
Remotesensing 14 01724 g005
Figure 6. Distribution of sample points within and outside the HSF project region in the evaluation of productivity stability improvement (Project B as an example).
Remotesensing 14 01724 g006
Figure 7. Dynamic change in the cropland productivity of HSF construction in drought and normal years.
Remotesensing 14 01724 g007
Figure 8. Distribution of middle–low productive cropland before and after the HSF construction (Projects A and B are examples).
Remotesensing 14 01724 g008
Figure 9. Relationship between simulation results of different GPP models and observed values (drawing refers to [33]).
Remotesensing 14 01724 g009
Figure 10. Comparison of the ability to simulate different NPP products on the change of cropland productivity: (a) Difference in cropland productivity inside and outside the high-standard farmland area, and (be) temporal changes in cropland productivity with different cropland coverage (drawing refers to [38]).
Remotesensing 14 01724 g010
Table 1. Types and sources of data in this study.
Data NameSourceTime RangeResolutionUsage
Location of the central point of HSF project regionThe national HSF construction effectiveness evaluation project team2011–2014-Used for HSF construction effectiveness evaluation
Vector boundary of typical HSF project regionGlobal Positioning System (GPS) in field research2011–2014-Used for sampling survey
Landsat imagesUnited States Geological Survey (USGS)2011–201630 m, in crop growth seasonUsed for selecting the general survey project region and estimating the NPP with high spatio-temporal resolution
Google Earth High-Definition imageGoogle Earth Engine2011–2016per quarter year, 0.5 mUsed for selecting the general survey project region
Enhanced Vegetation Index (EVI)Calculated using MODIS 8-day surface reflectance products (MOD09A1)2008–20168-day, 500 mUsed for running VPM and production of NPP data
Land Surface Water Index (LSWI)Calculated using MODIS 8-day surface reflectance products (MOD09A1)2008–20168-day, 500 mUsed for running VPM and production of NPP data
Meteorological data 1Meteorological stations2008–2016dailyUsed for running VPM and production of NPP data
Radiation data 2Food and Agriculture Organization of the United Nations (FAO) Penman model2008–2016dailyUsed for running VPM and production of NPP data
Grain yieldChina Statistical Yearbook2008–2016yearly, countyUse for estimate cropland productivity from NPP
Agrometeorological disasters dataProvincial Agrometeorological Disaster Bulletin2008–2016yearly, countyUsed for analyzing the disaster resistance ability
1 Based on 1098 ground meteorological stations, the gridded temperature data was generated by using ANUSPLIN interpolation computer software [32]. The gridded temperature data have a spatial resolution of 500 m and a time step of one day. 2 To optimize the model parameters, net radiation data from 53 sites were used, and then the net radiation data from 699 weather sites were calculated. The gridded net radiation data were obtained using ANUSPLIN interpolation computer software [33]. The gridded net radiation data have a spatial resolution of 500 m and a time step of one day.
Table 2. The project regions of sampling survey in Henan Province.
Project No.Project NameConstruction YearConstruction Area
(10,000 mu)
Project AHSF construction project in Fengcun Township, Fengqiu County20121.00
Project BHSF construction project in Liuguang Town, Fengqiu County20122.00
Project CHSF construction project in Longtang town (Yegang township), Minquan County20122.00
Project DMLPF transformation project in Hongniwan Town, Wancheng District20111.00
Project EHFS transformation project in Hongniwan Town (South), Wancheng District20121.00
Project FHSF construction project in Jiangliji Town, Xuchang County20112.00
Project GHSF construction project in Wunvdian Town, Xuchang County20121.00
Project HHSF construction project in Yegang Township, Minquan County20131.00
Table 3. Statistics of the improvement level of cropland productivity in the HSF construction project regions and the MLPF transformation project regions.
Productivity Improvement (kg/mu)High-Standard Farmland Construction ProjectsMiddle–Low Productive Farmland Reconstruction ProjectsTotalProportion (%)Average Productivity Increase (kg/mu)
2011201220132014SubtotalProportion 2011201220132014SubtotalProportion
<0000000%000000%000
0–50000000%000000%000
50–10015371617.6%2140738.9%2321.186.2
>1000710587582.4%13701161.1%8678.9160.7
Total112136591100%3411018100%109100145.0
Table 4. Statistics of the improvement level of cropland productivity before and after the construction of sampling project regions.
Sampling Area Construction YearBefore (kg/mu)After (kg/mu)Productivity Improvement (kg/mu)
Project A2012722907185
Project B2012704867163
Project C2012742 862120
Project D2011508769261
Project E2012506 769263
Project F2011733866133
Project G2012729 851122
Project H2013737 857120
Table 5. Summary of the drought disasters in Henan Province in the period 2011–2014.
YearRegionTimeDisaster Situation
2011Northern Henan, east of middle Henan (Sanmenxia, Luoyang, Zhengzhou, Puyang, Pingdingshan, Zhumadian, Nanyang)Oct–FebWinter drought was more serious
2012Some areas are dry, Xinyang was seriously dryMay–JuneDrought in early summer
2013Different degrees of drought with Xinyang affected by the most serious droughtMarch–mid-April, late-July–late August, OctDrought
2014Different degrees of droughtMarch–early April, June–mid-AugSevere drought
Table 6. Statistics of productivity stability improvement in sampling project region.
ProjectCropland Productivity in Project Region (kg/mu)Change Rate of Cropland Productivity under Drought Stress in Project Region (%)Cropland Productivity in Non-Project Region (kg/mu)Change Rate of Cropland Productivity under Drought Stress in Non-Project Region (%)Productivity Stability Improvement Level (%)
Drought
Year
Normal YearDrought YearNormal
Year
Project A9508896.42 741753−1.62 8.04
Project B9839315.29784865−10.3315.62
Project C880897−1.93 663758−14.33 12.40
Project D92880313.47 702737−4.99 18.46
Project E8678076.92 685727−6.13 13.05
Project F97479418.48 687724−5.39 23.87
Project G88879310.70 711762−7.17 17.87
Project H871917−5.28 694722−4.03 −1.25
Table 7. Statistical data on the proportion of middle–low productive cropland before and after the sampling project regions.
Sampling RegionConstruction YearBefore (kg/mu)After (kg/mu)
Project A95.91.894.1
Project B84.93.281.7
Project C10010.289.8
Project D97.616.281.4
Project E96.115.480.7
Project F1008.991.1
Project G10023.176.9
Project H10020.579.5
Publisher’s Note: MDPI stays neutral with regard to jurisdictional claims in published maps and institutional affiliations.

