Article

Desert Locust Cropland Damage Differentiated from Drought, with Multi-Source Remote Sensing in Ethiopia

by
Woubet G. Alemu
1,2,* and
Christopher S. R. Neigh
1
1
Biospheric Sciences Laboratory, NASA Goddard Space Flight Center, Greenbelt, MD 20771, USA
2
Universities Space Research Association, Columbia, MD 21046, USA
*
Author to whom correspondence should be addressed.
Remote Sens. 2022, 14(7), 1723; https://doi.org/10.3390/rs14071723
Submission received: 22 February 2022 / Revised: 25 March 2022 / Accepted: 29 March 2022 / Published: 2 April 2022
(This article belongs to the Special Issue Progresses in Agro-Geoinformatics)

Abstract

:
In 2020, Ethiopia had the worst desert locust outbreak in 25 years, leading to food insecurity. Locust research has typically focused on predicting the paths and breeding grounds based on ground surveys and remote sensing of outbreak factors. In this study, we hypothesized that it is possible to detect desert locust cropland damage through the analysis of fine-scale (5–10 m) resolution satellite remote sensing datasets. We performed our analysis on 121 swarm point locations on croplands derived from the Food and Agriculture Organization (FAO) of the United Nations, and 94 ‘non-affected’ random cropland sample points generated for this study that are distributed within 20–25 km from the ‘center’ of swarm affected sample locations. Integrated Drought Condition Indices (IDCIs) and Vegetation Health Indices (VHIs) calculated for the affected sample locations for 2000–2020 were strongly correlated (R2 > 0.90) with that of the corresponding non-affected group of sample sites. Drought indices were strongly correlated with the evaluation Standardized Precipitation Evapotranspiration Indices (SPEIs), and showed that 2020 was the wettest year since 2000. In 2020, the NDVI and backscatter coefficient of cropland phenologies from the affected versus non-affected cropland sample sites showed a slightly wider, but significant gap in March (short growing season) and August-October (long growing season). Thus, slightly wider gaps in cropland phenologies between the affected and non-affected sites were likely induced from the locust damage, not drought, with fine scale data representing a larger gap.

1. Introduction

The Ethiopian economy is heavily dependent on smallholder rain-fed agriculture, which is vulnerable to natural and anthropogenic catastrophes that in turn leads to food insecurity [1]. The desert locust, Schistocerca gregaria (Förskal), is the most destructive herbivory migratory pest in the world [2]. It is highly mobile and feeds on large quantities of any kind of green vegetation, such as crops, pasture, and fodder. The desert locust has been a threat to agricultural production, causing starvation in Africa and western Asia for thousands of years [3,4]. The desert locust is normally a solitary insect that occurs in deserts and scrubs in northern Africa, the Sahel, the Arabian Peninsula, and parts of Asia to western India [3]. During this solitary phase, the desert locust has low occurrence and poses no threat to croplands. The 2019–2021 desert locust upsurge in East Africa and the Arabian Peninsula followed a series of heavy rainfall events beginning with Cyclone Mekunu in May 2018 that produced heavy rains in the Rub’al Khali of the Arabian Peninsula, ending in a drought and creating patches of vegetation [5], followed by Cyclone Luban in October 2018, leading to swarms being reported in early 2019. These conditions are conducive for the egg_laying, hatching, development and gregarious formation (swarms) of desert locusts [3,4,5]. In the gregarious phase, they can induce extensive agricultural production damage. Desert locusts may have a life cycle of two to three months, resulting in three to five generations in a year [3,4,5], and swarms can fly up to 100 km per day [3]. These factors of locust swarm development and mobility have made identifying their impact on smallholder croplands difficult with remote sensing.
Ethiopian vegetation has been disturbed by locust swarms since the end of 2019 (first swarm appearance on 25 June 2019) [6] and this round of outbreak has been the worst in the country for the past 25 years [7,8]. Locusts have invaded more than 200 Woredas (districts) which occupy over 200,000 hectares of land along the Rift Valley Escarpments, eastern and southern parts of the country [2]. The FAO has estimated the 2020 desert locust agricultural production damage in Ethiopia led to acute food insecurity for 8.6 million people between January and March 2021 [9]. The control effort of the outbreak was limited to merely minimal human power due to the complexities of war, bad politics, perilous terrain, and poor proactive institutional preparedness.
Desert locust research has typically focused on predicting their paths and breeding grounds based on ground surveys and satellite remote sensing of outbreak climate factors. Through a review of the literature, we observed a knowledge gap for detecting locust damage on croplands using satellite remote sensing datasets. Characterization of desert locust cropland damage could help efficient rehabilitation and mitigation efforts of food insecurity. Since higher rainfall and good vegetation growth favors locust infestation, we evaluated if fine spatial resolution satellite data (5–10 m), such as Planetscope, and Sentinel-1 and -2, would be able to detect damaged vegetation from locusts.
Drought is a common recurrent phenomenon in Ethiopia that has brought agriculture production shortfalls which leads to food insecurity and famine [10,11,12]. The most badly hit countries were Kenya, Ethiopia, Somalia, and Uganda [10,11] and it forced the worst humanitarian crisis to occur in the past 10 years. About 13.7 million people were at risk of hunger in Ethiopia [11]. Due to the 2015/2016 drought, about 18 million people in Ethiopia were in need of food aid (18 M ≈ 20%, i.e., 1 in 5 people needed food aid) [11,12,13,14]. In order to separate cropland damage from desert locust and drought impacts, we have also analyzed drought conditions in the region. Remote sensing-based integrated drought indices have the potential to describe drought conditions comprehensively. Analysis of multiple drought-related factors, such as precipitation, temperature, soil moisture, and vegetation health enables the effective characterization of the occurrence, spatial extent and intensity of drought in a given area [15,16,17].

2. Data, Study Region, and Methodology

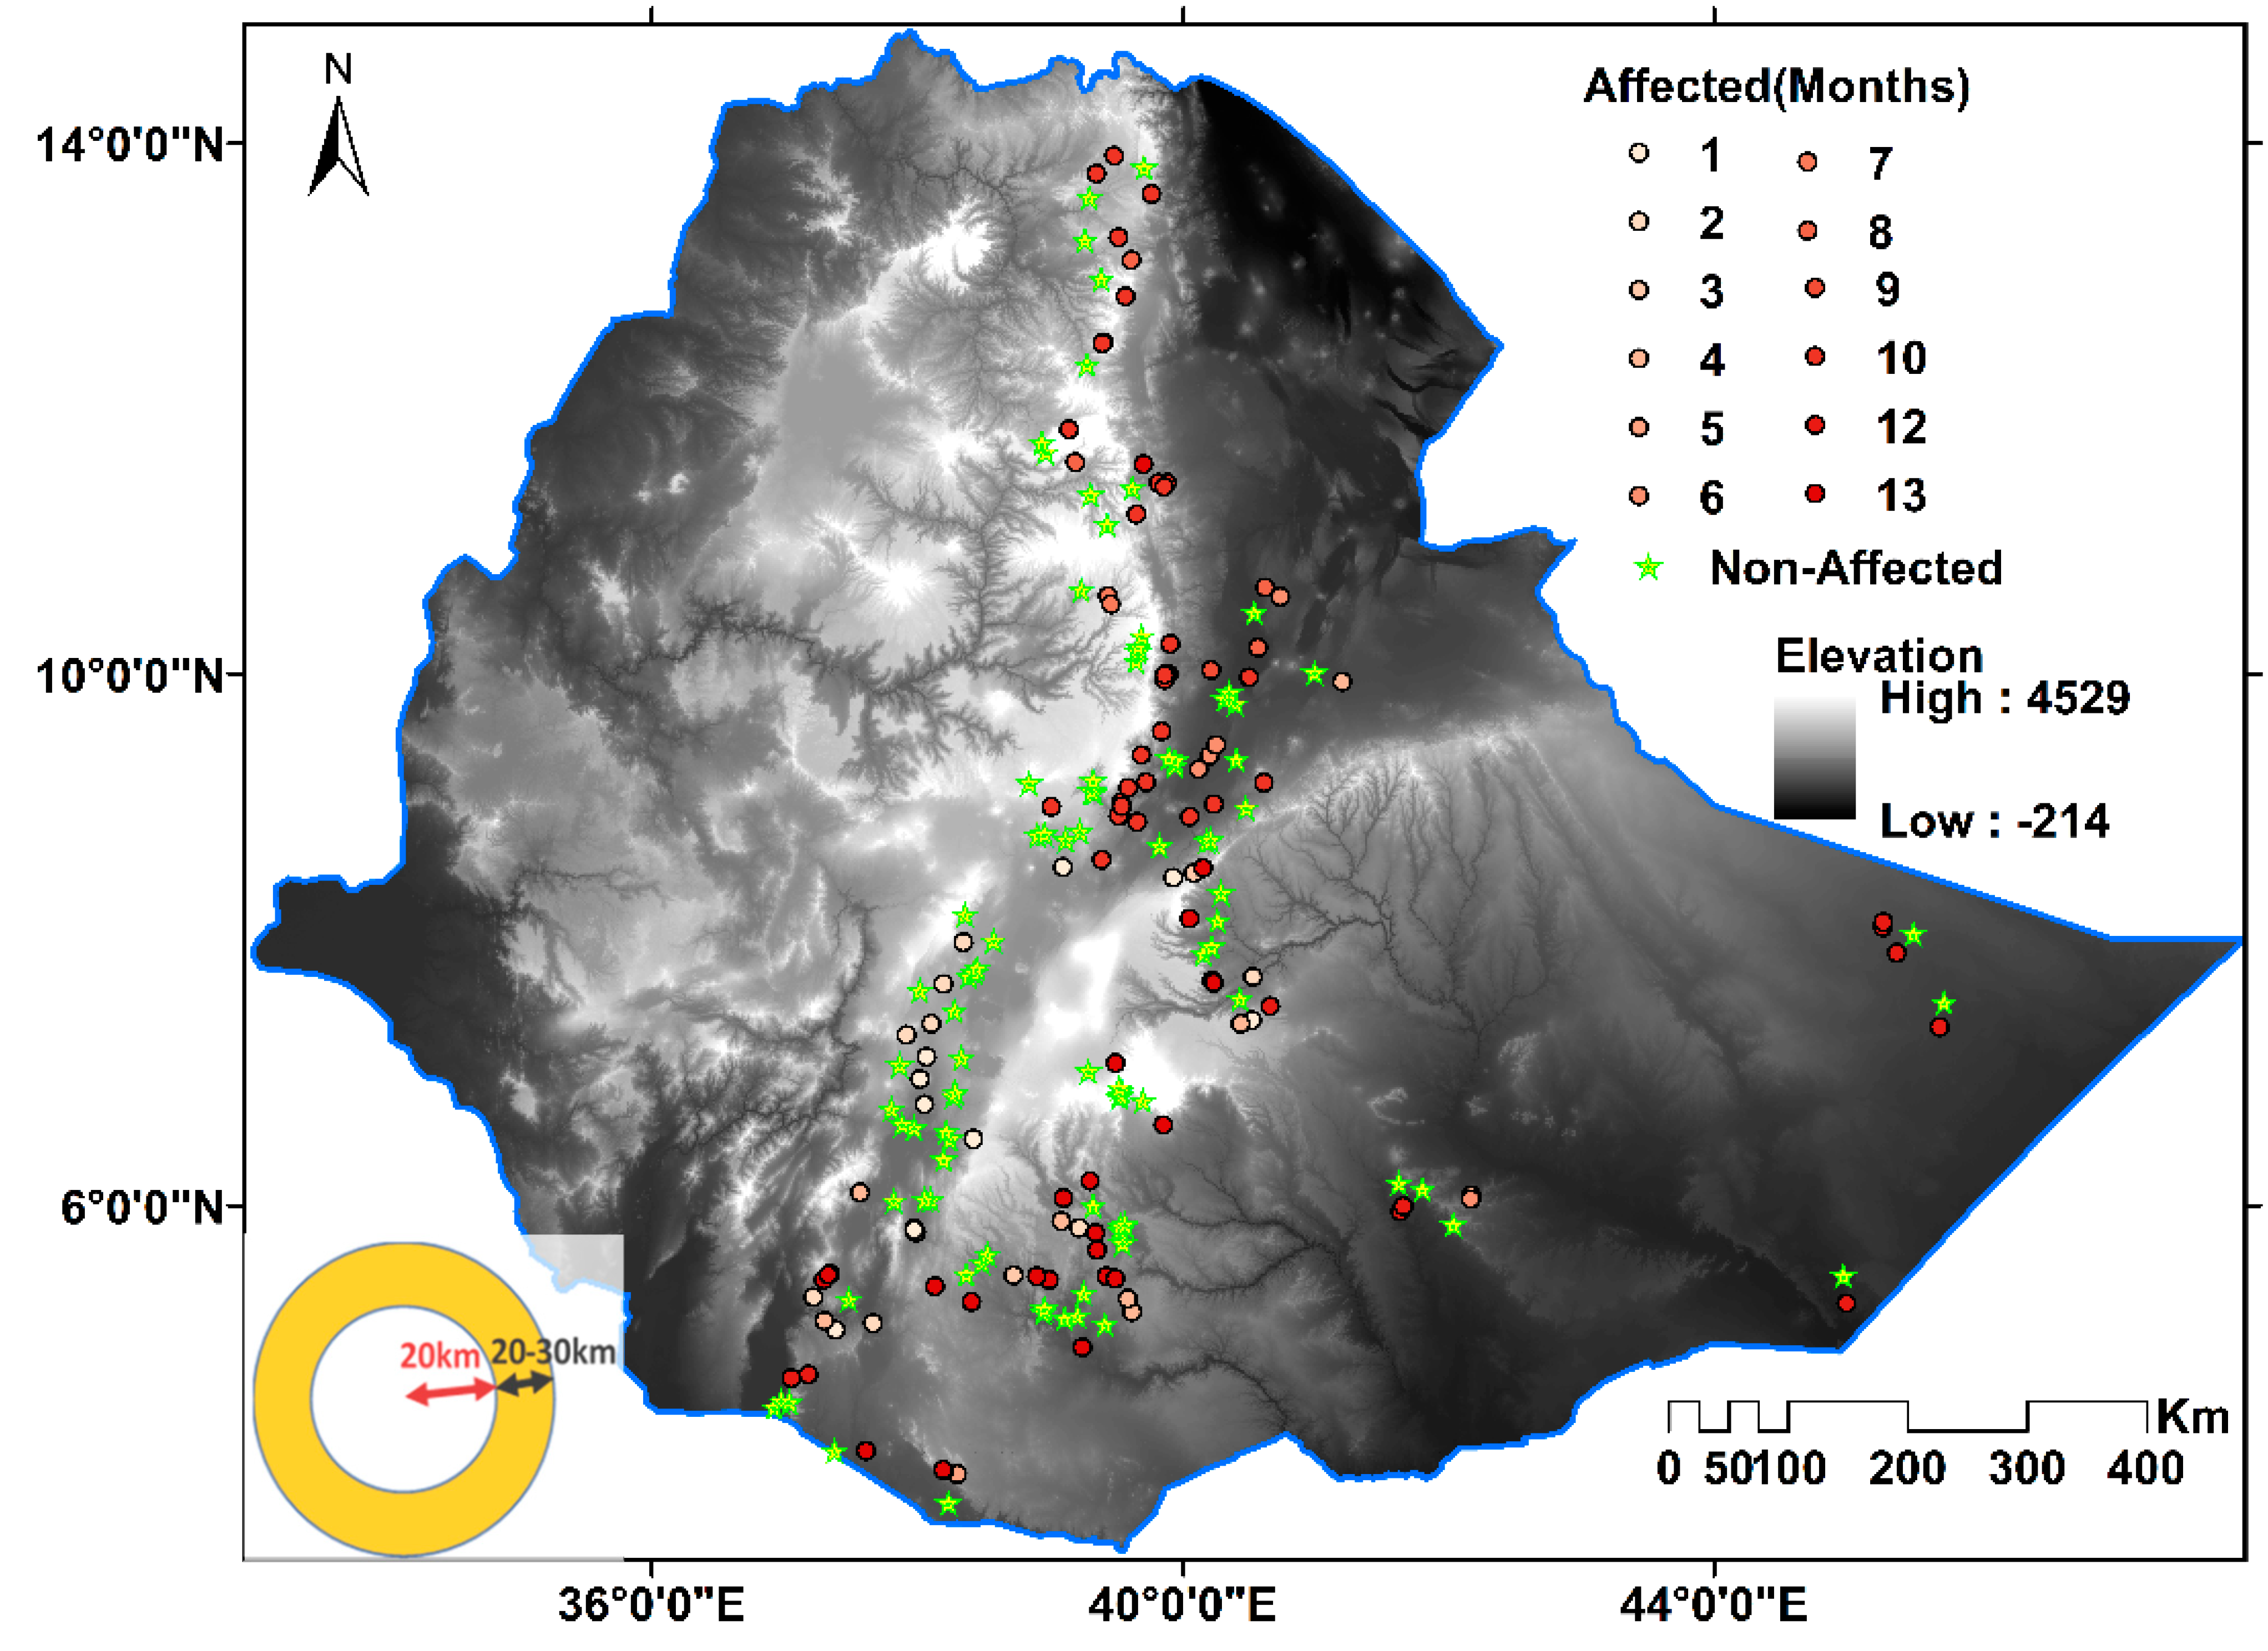
2.1. Datasets and Study Region

The datasets used in this study, their descriptions, and sources, are presented in Table 1. We have used in situ and reanalysis data, as well as optical, active and passive microwave satellite datasets to distinguish locust and/or climate impacts on croplands.
Desert Locust swarm site datasets were downloaded from the Food and Agriculture Organization (FAO) of the United Nations website [6]. These data have observation date, geographic coordinates, areal extent affected by each recorded swarm, and other similar information. The FAO website has desert locust data in their various developmental stages and group formation, namely, bands, hoppers, adult, and swarms. We used the swarm stage dataset, since Desert Locust crop damage impact is the highest in their gregarious (swarm) stage. The graduated orange to red-colored sites in Figure 1, are 121 sample desert locust swarm sites used in this study, while the light green-colored sites correspond to cropland sample sites from the USGS Global Food Security-Support Analysis Data at 30 m (GFSAD30 [18]; totals 94; assumed non-affected by locust) used for comparative analysis. The graduated swarm sample sites are presented by month of locust occurrence from light orange (1 January 2020) to darker red (13 January 2021). Note that the graduated colors may not necessarily show swarm occurrence pattern in time. The first locust appearance in Ethiopia was the 25th of June 2019. The January 2020–January 2021 swarm locations presented here are selected samples, not all occurrences are presented here; hence, this sample may not show the distribution pattern through time. We only show when the swarms that were analyzed with remote sensing data, and most of the swarms in this sample occurred in October 2020.
We assume the temporal and spatial detail on 5–6 day intervals at 10–50 m resolution provided by Sentinel-1, and Sentinel-2, and monthly Planet Scope base maps at 5 m resolution will enable the detection of locust swarm damage.
Planet Scope Base maps of red, green, blue and near-infrared wavelengths at 5 m spatial resolution were provided free of charge by the Norway’s International Climate and Forests Initiative (NICFI) [20]. These data are available at monthly temporal resolution since September 2020, while it stretches back to December 2015 with a quarterly temporal resolution. The PlanetScope constellation of 3U CubeSats is comprised of Dove, Dove-R and SuperDove satellites in a 98° sun synchronous orbit with crossing times between 9:30–11:30 am [21,22].
The full Sentinel-2 mission comprises twin polar-orbiting satellites with a combined 5-day revisit time [23]. These satellites provide a global dataset since December 2018 and products are systematically generated at the ground segment. We used these level-2A product assets from the Google Earth Engine (GEE) Data Catalog to calculate NDVI. The assets contain 12 spectral bands representing surface reflectance (SR).
The Sentinel-1 mission provides a continuous all-weather, day-and-night imagery from a dual-polarization C-band Synthetic Aperture Radar (SAR) instrument at 5.405 GHz (C band) [24]. We have used data from the GEE collection that includes the S1 Ground Range Detected (GRD) scenes, processed using the Sentinel-1 Toolbox to generate a calibrated, ortho-corrected product. We processed the VV (single co-polarization, vertical transmit/vertical receive) and the HH (single co-polarization, horizontal transmit/horizontal receive) combination bands scenes.
The Moderate Resolution Imaging Spectroradiometer (MODIS) aboard the Terra and Aqua satellites was launched by NASA in 1999 and 2002, respectively, has 36 spectral bands from which different groups of data products are processed at different spatial and temporal resolutions tuned for specific applications. For this study, we used MODIS collection 6 level 3 Normalized Difference Vegetation Index (MODIS/006/MOD13Q1) data product from Google Earth Engine Data Catalog (Table 1). The MODIS NDVI product is computed from atmospherically corrected bi-directional surface reflectance that has been masked for water, clouds, heavy aerosols, and cloud shadows. Nadir bidirectional reflectance distributions functions (BRDF)-Adjusted Reflectance (NBAR) provides improved retrievals of surface reflectance through consistent normalization of multiple views of the surface to a nadir view using BRDF to model surface anisotropies [25,26].
The Climate Hazards Group InfraRed Precipitation with Stations (CHIRPS) dataset combines satellite precipitation estimates with in situ station rainfall data and has a spatial resolution of 0.05° [27]. An evaluation of CHIRPS, FLDAS, GPM/TRMM rainfall datasets with station rainfall dataset in the Ethiopian highlands showed that CHIRPS rainfall had the least bias and error (ME ≈ −0.2–0.2 mm, MAE ≈ 0.5–2 mm), and the best agreement (COR ≈ 0.8) [27].
Data from the Famine Early Warning Systems Network (FEWS-Net) Land Data Assimilation System (FLDAS) included gridded meteorological forcing fields and modeled hydrological variables [28]. The FLDAS air temperature field is derived from the National Oceanic and Atmospheric Administration (NOAA) Global Data Assimilation System (GDAS) and NASA Modern Era Reanalysis for Research and Applications version 2 (MERRA-2) datasets. The FLDAS soil moisture distribution data was derived from a combination of the Modern Era Retrospective-analysis for Research and Applications Version 2 (MERRA-2) and daily Climate Hazards Center InfraRed Precipitation with Stations (CHIRPS) data. We used the National Centers for Environmental Prediction/Oregon State University/Air Force/Hydrologic Research Lab (NOAH) model derived 0.1° × 0.1° daily Eastern Africa Region data product.

2.2. Methods

2.2.1. Desert Locust Swarm Data

For this study, generally, data variables were extracted for 2020 locust and cropland sample points using Google Earth Engine (GEE), and further processed using R. R is a programming language originally designed for statistical computing and graphics. Currently, R programming is widely used for processing remote sensing and GIS datasets. In addition, ArcGIS was used for buffer analysis around points, for zone preparation and sample selection. We generated corresponding sample points on neighboring croplands from the United States Geological Survey (USGS) Global Food Security-Support Analysis Data at 30 m (GFSAD30) using GEE. The locust datasets have swarm areal coverages between about 1 ha–35,500 ha. The following assumptions were made for this analysis: (1) locust swarm location points were taken at the geographic center of the respective swarms; and (2) cropland area is uniform within these study swarm points. Thus, (1) swarm-cover linear radius in meters:
( r ) = A r e a   ( h a ) 50 ,   i . e . ,   r ~ 50   m 10 , 000   m   ( 10   km )
A double-ring buffer of 20 km (inner-ring) and 20–30 km (outer-ring) was created for all swarm points (Figure 1). Cropland sample points were clipped by the swarm outer-ring buffer (94 samples). To get a comparable number of swarm location sample points, we selected back swarm point samples that were within 25 km from selected cropland pixels. In such a process, we have selected 121 swarm sample points that are located between 20 km and 25 km from selected cropland sample points. Swarm points that were more than 25 km away from cropland sample points were discarded, which highly reduced the available swarm sample points. This was performed to be in line with the 25 km similar climatic influence zone assumption.
Assuming the swarm sites as center is the easier assumption that we propose, so that we are able to do a buffer analysis and select corresponding “non-affected” sites in reference to the swarm points. Fortunately, assuming the swarm sites as locust swarm edges will not affect our analysis, since we generate the corresponding “non-affected” sites 20 km away from swarm sites (between 20–25 km). Note that the reported larger locust swarm diameter is 20 km.

2.2.2. Approach for Analyzing Satellite Land Surface Remote Sensing Products

We applied Normalized Difference Vegetation Index (NDVI) [33] on both the aggregate swarm “affected” and aggregate “undisturbed” (non-affected) sample points for 2020 to estimate locust swarm damage to croplands at observational scales from 5 m to 250 m and spatially resampled these data to 50 m to 500 m to reduce atmospheric contamination. Cloud and cloud shadow masking, and speckle removal were applied to the optical and microwave products used in this study. The 250 m native spatial resolution 16-day MODIS surface reflectance data were resampled using a 2 × 2 square kernels mean value of the sample. We calculated Sentinel-2 L2A NDVI weekly data as per-pixel maximum value monthly composites. Our intent was to determine if each satellite time-series at moderate and coarse resolution had a significant departure from “normal” in swarm locations as compared to non-affected sites. We also calculated NDVI from Planet Scope Monthly Base maps for September 2020 through February 2021 and resampled to 50 m for both aggregated sites.
Sentinel-1 backscattering coefficient data from the Ground Range Detected (GRD) scenes Interferometric wide swath mode (IW) for the single co-polarization vertical transmit/vertical receive (VV) and dual-band cross-polarization vertical transmit/horizontal receive (VH) descending path was used in this study. Sentinel-1 may resolve differences in radar time series backscatter coefficients (σ°) from locust damage, as others have found utility in these data for assessing crop damage from other types of disturbance [34,35,36]. Both Sentinel-2 surface reflectance and Sentinel-1 SAR backscattering coefficients were resampled using 5 × 5 square kernels resulting in 50 m spatial resolution datasets.

2.2.3. Approach for Analyzing Climate Data

For drought analysis, we calculated soil moisture condition index (SMCI), vegetation condition index (VCI), temperature condition index (TCI), and precipitation condition index (PCI). Using these multi-indices will help us to detect the effects of all types of droughts (meteorological, hydrological, agricultural, and ecological). These indices were combined using optimal weights with respect to the corresponding Standardized Precipitation Evapotranspiration Index (SPEI) to get an Integrated Drought Condition Index (IDCI) and Vegetation Health Index (VHI) as in Table 2. Such drought analysis methods have been well developed over several years [11,37,38,39]. Initial values for the weights were determined based on multiple linear regression of the factors with the SPEI time-series datasets. Then, other possible combinations closer to the initial combinations were made and a temporal analysis was conducted on a 5 km grid for all datasets. Note that the individual datasets used for the drought analysis have different native spatial resolution (Table 1). A 1-month, 3-month, 6-month, and 12-month seasonal accumulation of the CHIRPS precipitation data resulted in a similar temporal aggregation of the PCI and the corresponding derived SPEI. The drought condition indices were correlated with the corresponding SPEI, and thus we determined the best coefficients of the individual drought condition indices that yielded the more accurate IDCI and VCI. We calculated the SPEI from CHIRPS rainfall and the Global Land Evaporation Amsterdam Model (GLEAM) potential evapotranspiration (PET) that was mainly developed from in situ datasets [32,40,41]. In a previous study conducted in the same study area as our study, CHIRPS rainfall showed the least bias and error (ME ≈ −0.2–2 mm, MAE ≈ 1.5–2 mm), and the best agreement (COR ≈ 0.8), with station rainfall data [27]. Therefore, we are comfortable with using the CHIRPS rainfall data to drive SPEI, in combination with the PET data that in turn was derived mostly from in situ datasets, for evaluating the corresponding Integrated Drought Condition Index and Vegetation Health Index.

3. Results

In this research, we first assessed droughts in the region as it is prone to drought impacts. This was performed to determine whether vegetation damage in the region (if any) came from the impacts of locust, drought, or both.

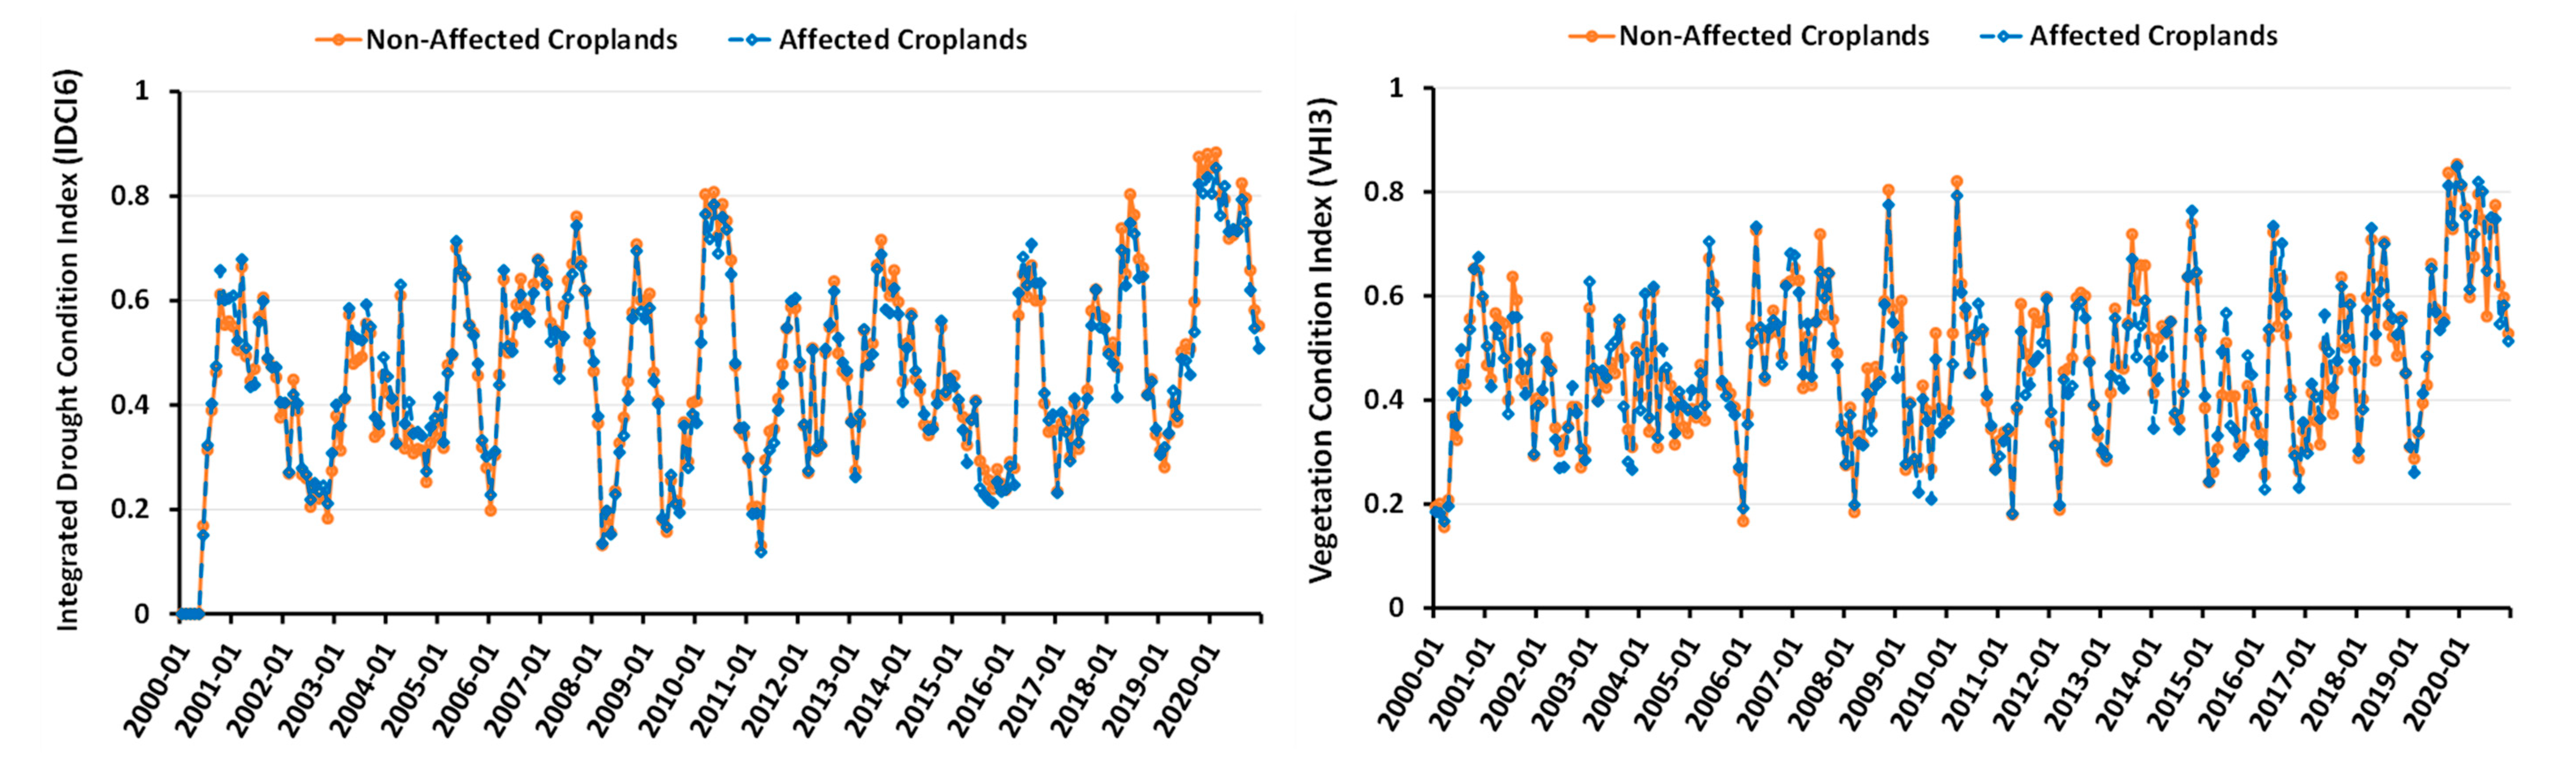
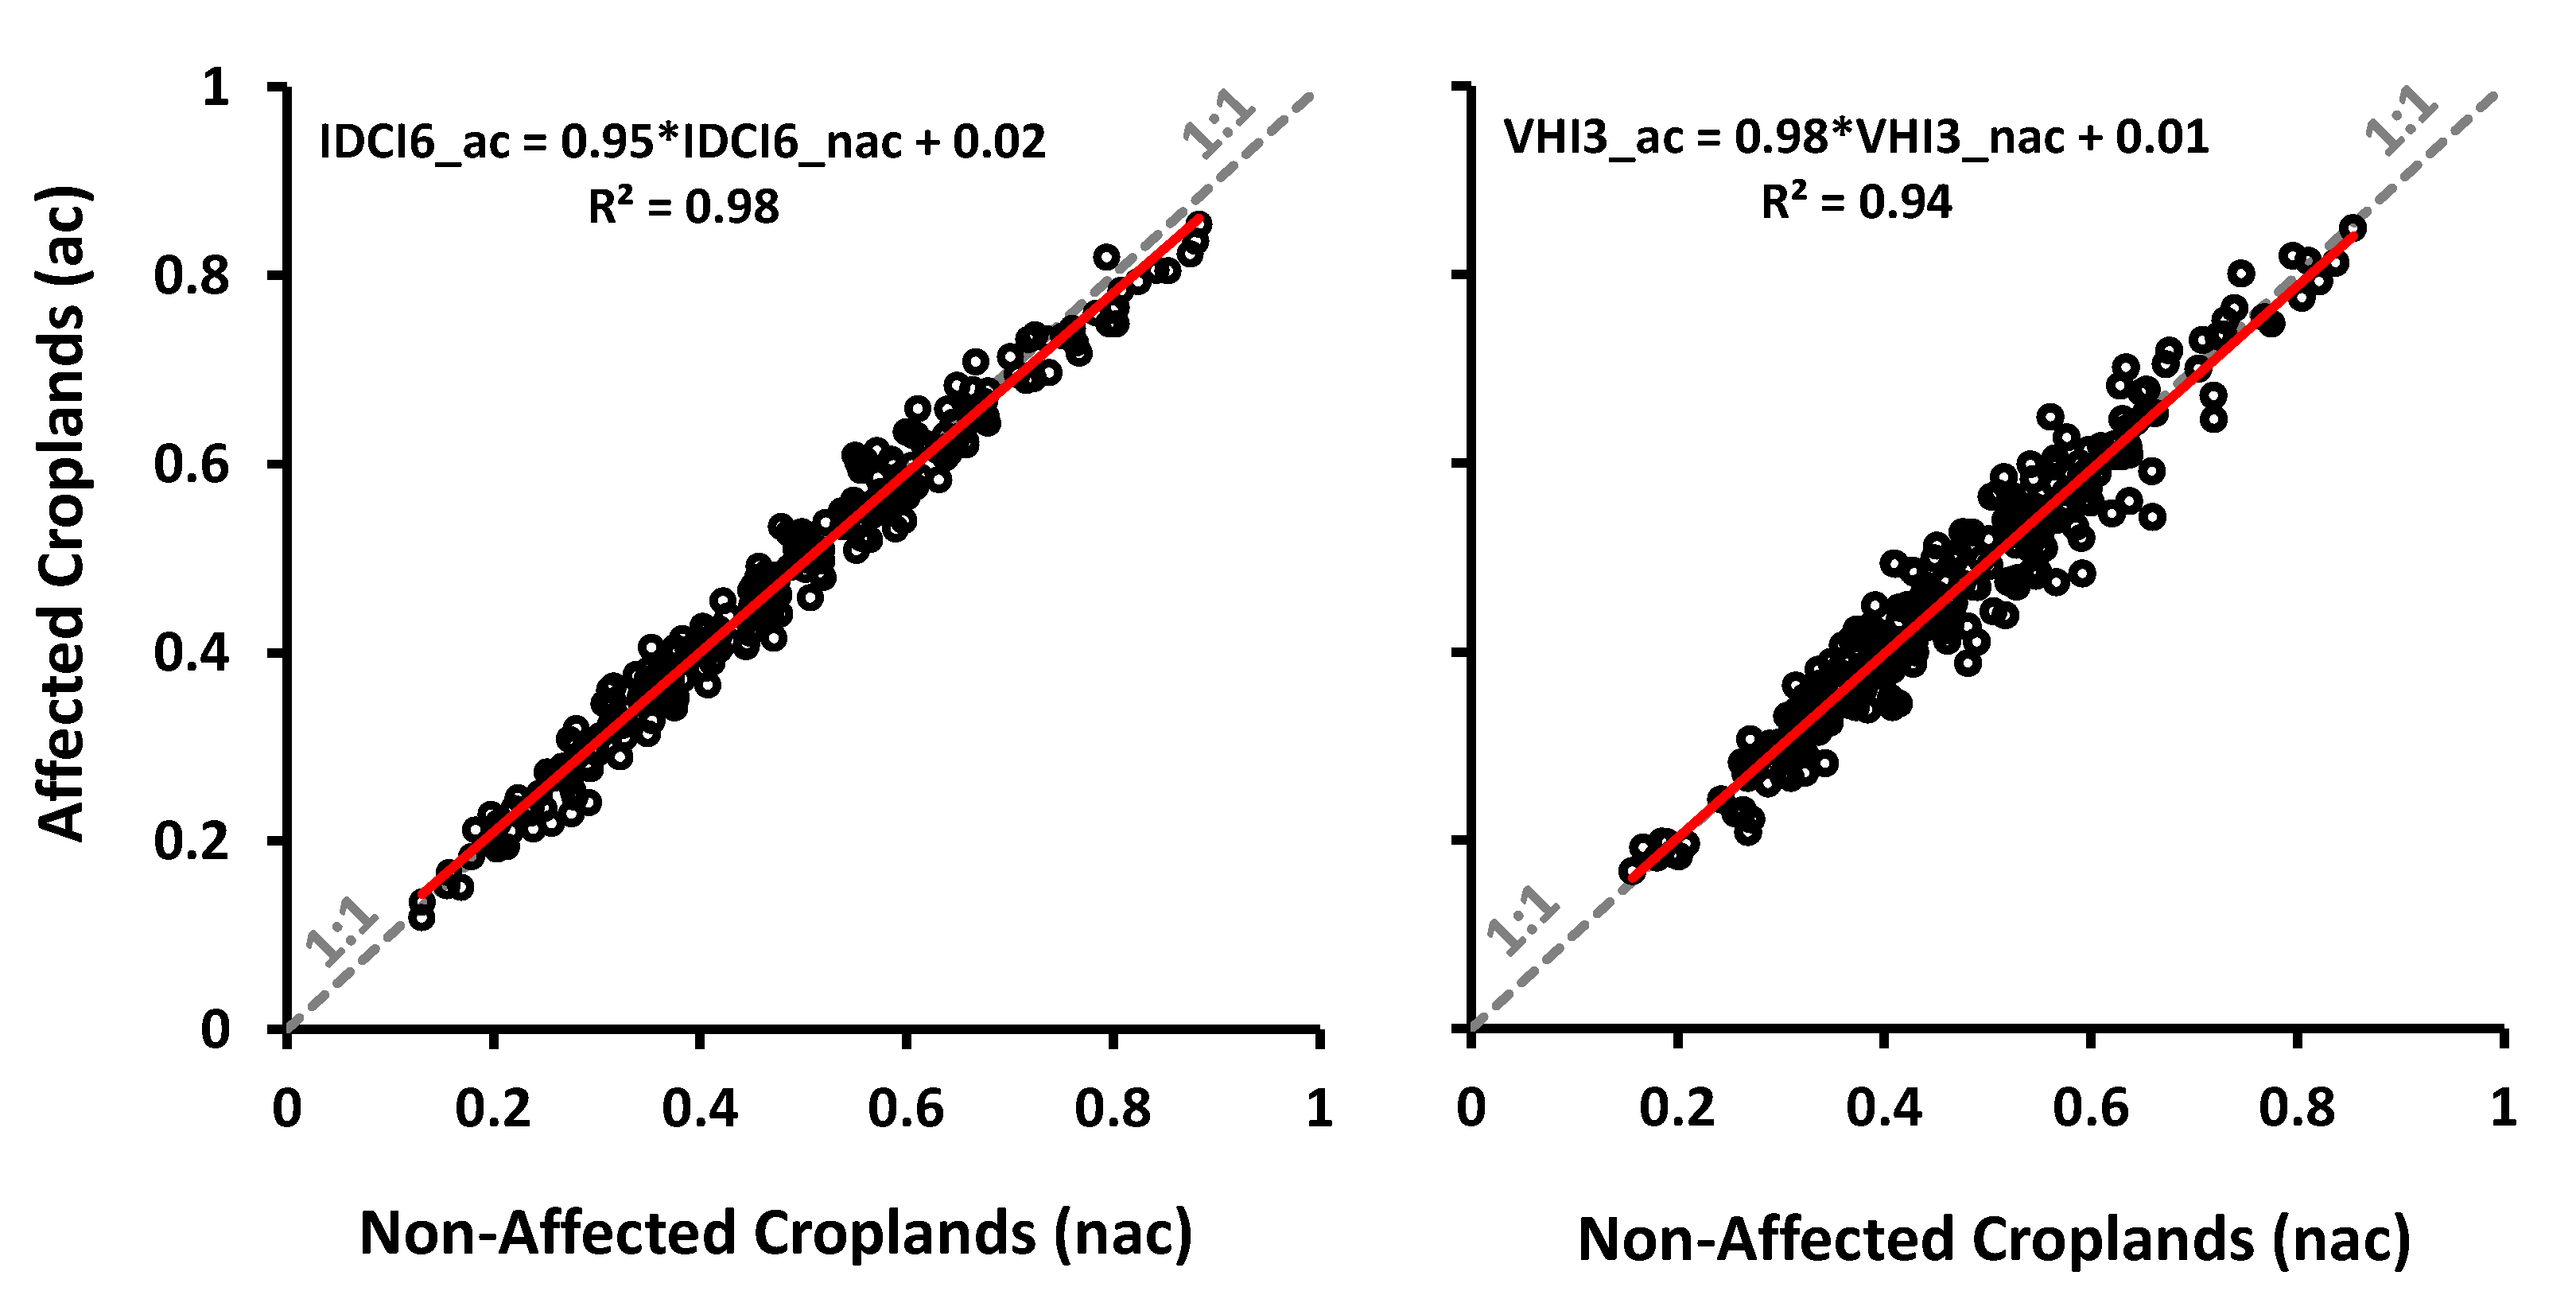
3.1. Temporally Integrated Drought Condition and Vegetation Health Indices, and Evaluation

The highest correlation coefficient was obtained with a 6-month Integrated Drought Condition Index (IDCI6) calculated using a coefficient of 0.7 for the Precipitation Condition Index (PCI) and coefficients of 0.1 for the Condition Indices of Temperature (TCI), Soil Moisture (SMCI) and Vegetation (VCI). A high correlation value of r = 0.95 was obtained when the resulting 6-month IDCI (IDCI6) drought index was correlated with the corresponding 6-month Standardized Precipitation Evapotranspiration Index (SPEI6; Table 3, Figure 2-left). In contrast, the highest correlation coefficient was obtained with the 3-month Vegetation Health Index (VHI3) calculated using coefficients of 0.2 and 0.8 for the Condition Indices of Temperature (TCI) and Vegetation (VCI) respectively (Figure 2-right; Table 3). Scatterplots of these best-correlated seasonal indices (IDCI6 and VHI3) for the affected and non-affected sites is presented in Figure 3. The fitted trendline on this scatterplot yielded an R2 of 0.98 and 0.94 for the IDCI6 (Figure 3-right) and VHI3 (Figure 3-left) respectively.
The two groups of study sample sites track a very similar IDCI and VHI seasonality with an r > 0.90 (Figure 2 and Figure 3). Time series of IDCIs, VHIs, and SPEIs revealed distinct drought and non-drought years in the study region. Drought years that showed growing season drought condition index values below 0.4 [37] include 2002, 2004, 2009, 2015, and 2017 (Figure 2 and Figure 4), while 2001, 2006, 2007, 2010, 2013, 2016, and 2018–2020 were non-drought years. The monthly and 3-months seasonal average SPEI displayed the shorter-time fluctuations of meteorological drought, while the 6- and 12-months seasonal average SPEIs displayed more aggregated drought conditions (Figure 4). Both the integrated drought indices (IDCI and VHI) and the evaluation drought index (SPEI) in Figure 2 and Figure 4 clearly revealed that 2020 was the wettest year since 2000 for both groups of sites.

3.2. Cropland Phenology Time Series

The Sentinel-2 site-average NDVI for 2020 for both the affected and non-affected sites tracked a similar seasonal pattern (Figure 5 top-center). Both NDVI time series showed a dual growing season (short Belg, and long Kiremt growing seasons). The affected sites NDVI time-series is lower (– 0.04 NDVI October 2020) than the corresponding non-affected sites NDVI in July, August, and September (Figure 5 center). The site-to-site standard error (SE) was slightly higher during the main growing season.
The MODIS NDVI also displayed the dual growing season (Figure 5 top-right). However, even though the affected sites NDVI was slightly lower than that of the non-affected sites during September and October, the difference was not significant (Figure 5 right).
Planetscope monthly mosaics did not display seasonality in affected sites, and only displayed a very slight seasonality in non-affected sites relative to MODIS and Sentinel-2 NDVI. Nonetheless, the gap is present between the affected and non-affected sites in the long growing (Kiremt) season and comparable to Sentniel-2.
The Sentinel-1 vertical-transmit and vertical-receive (VV; Figure 6 left) and vertical-transmit and horizontal-receive (VH; Figure 6 right) radar time series backscatter coefficients (σ°) also tracked similar cropland phenology for the two groups of sample sites. The backscatter coefficient timeseries showed a consistent distinct difference between the affected and non-affected sample sites throughout the year, in contrast to MODIS NDVI observations. The difference in σ° between the two groups of sites was higher and significant in April–May, July, and September–October (Figure 6). However, the non-affected sites σ° was consistently higher than that of the affected sites for the entire 2015–2021 data record (Supplementary Figure S1).

4. Discussion

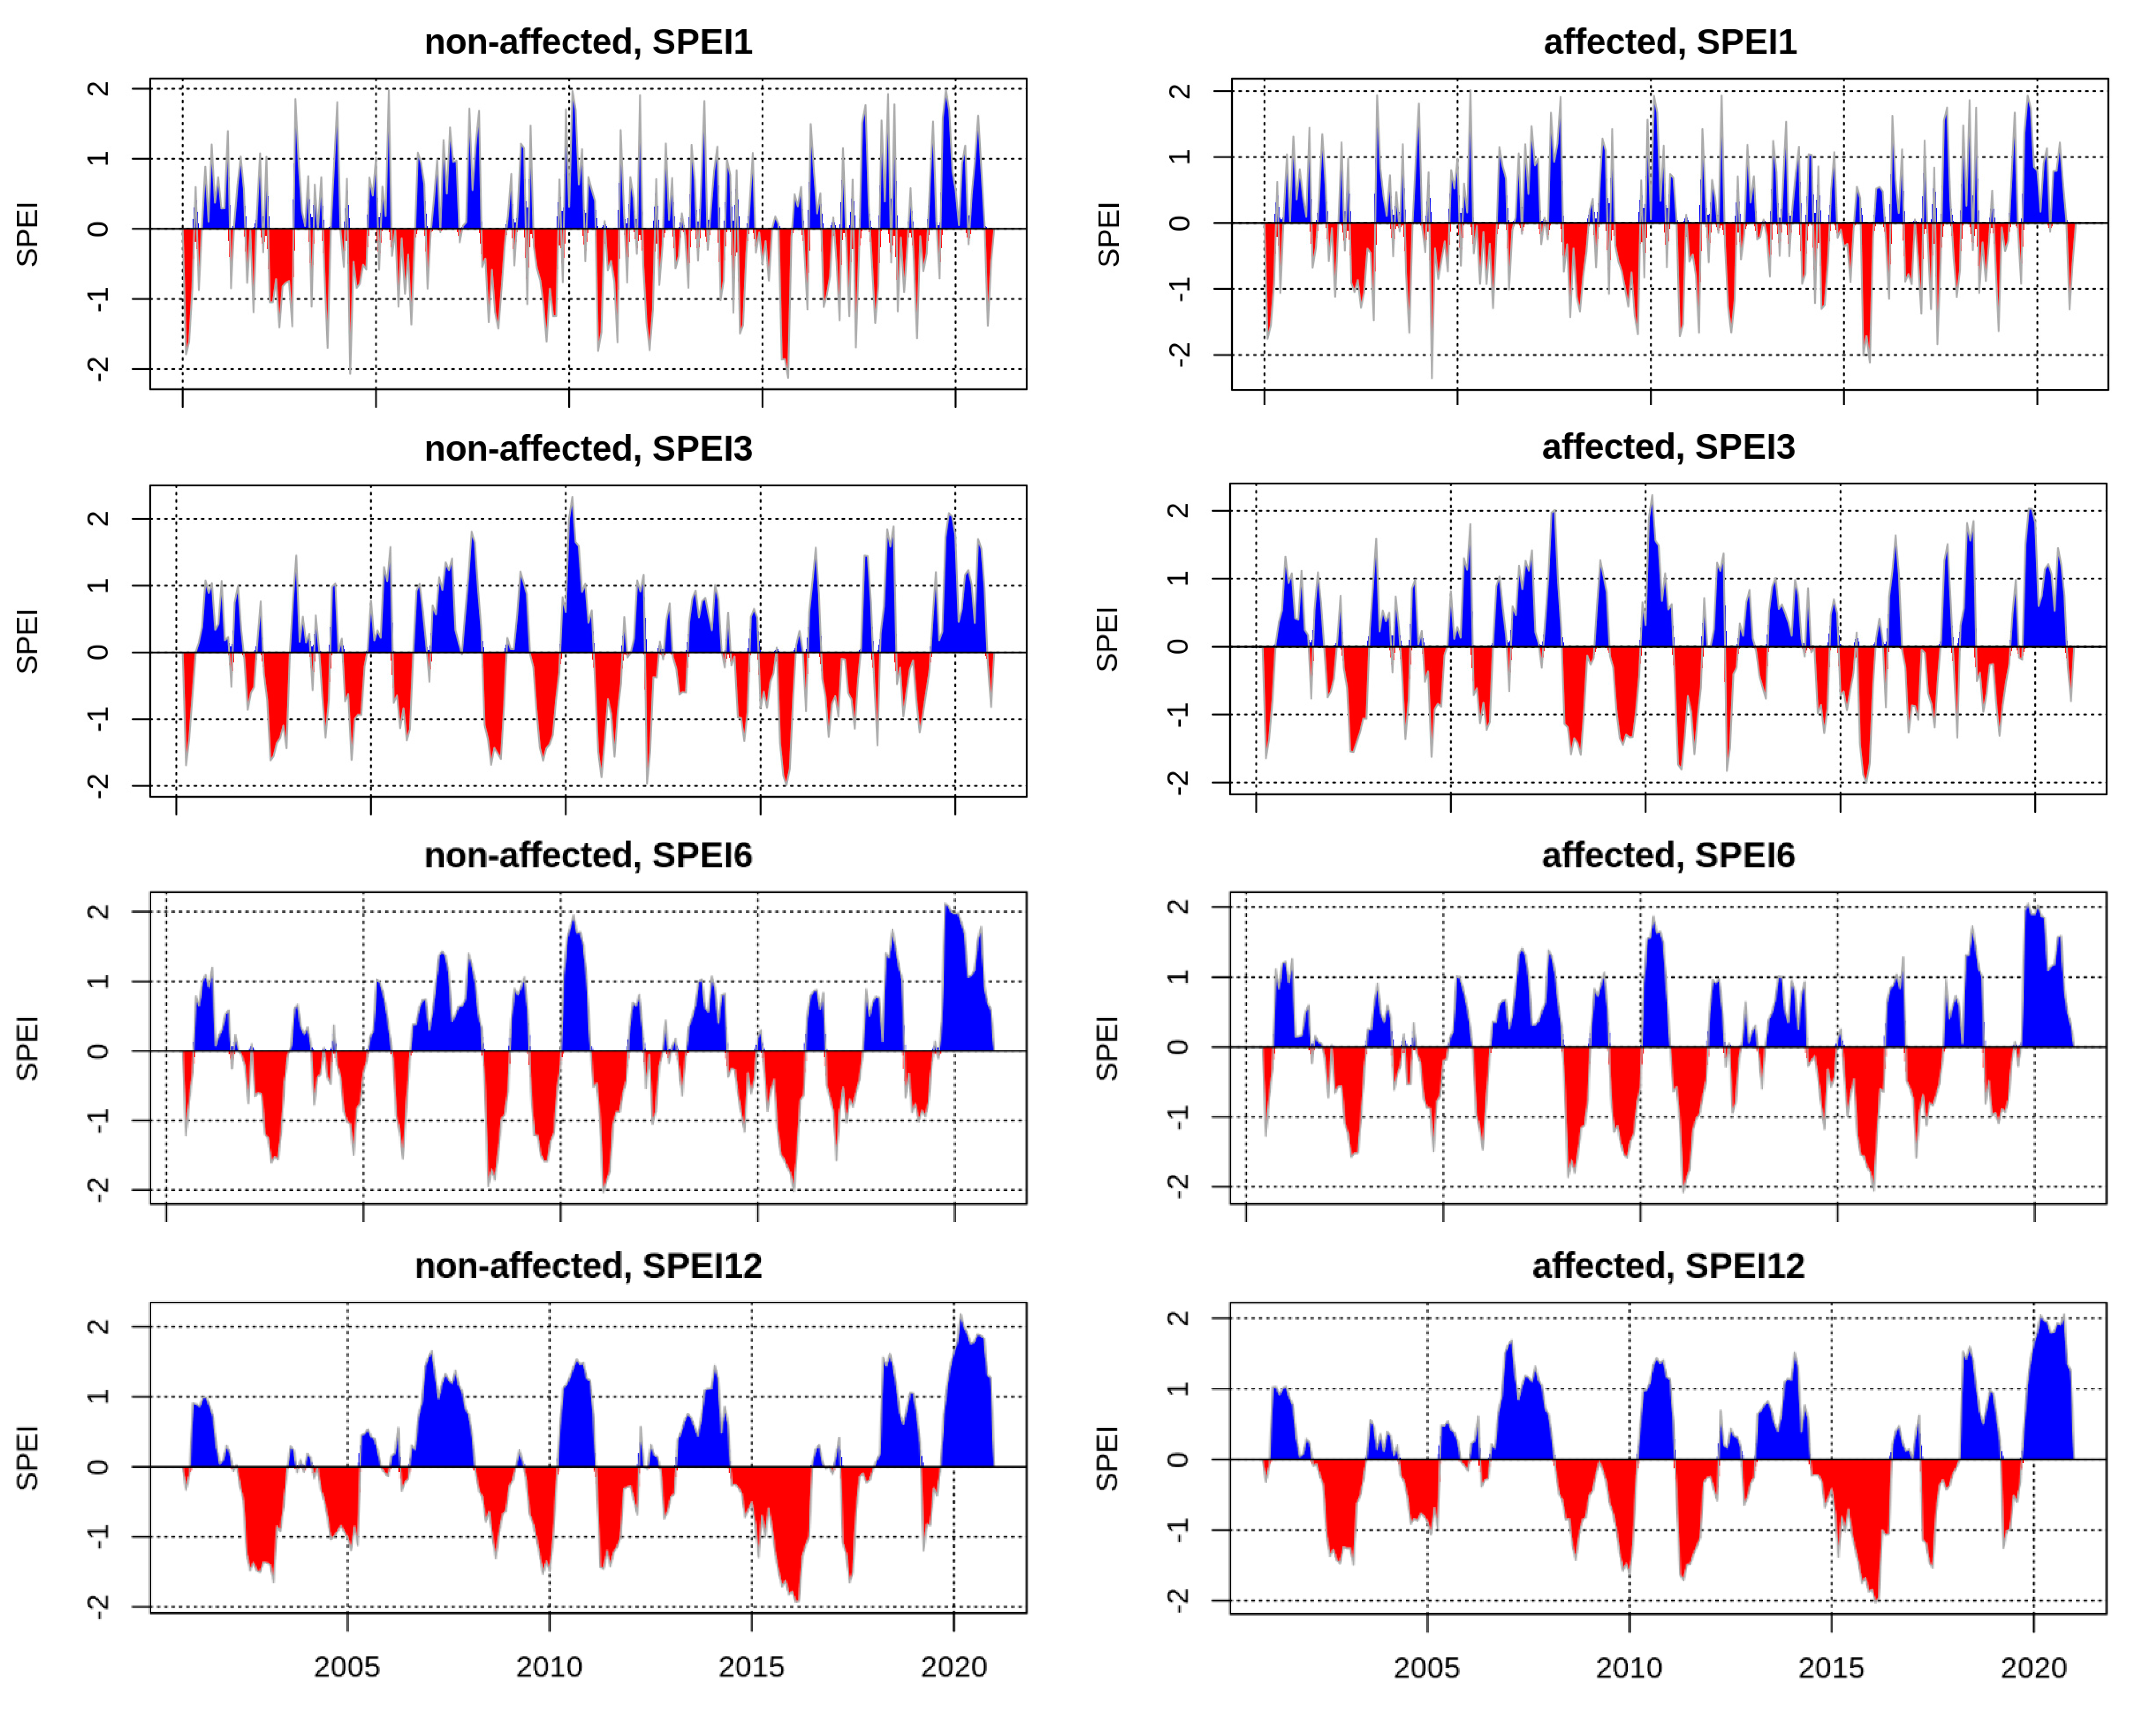
4.1. Drought Conditions in Ethiopia

Throughout recorded history, East African agricultural production has suffered from recurrent drought conditions. The recent 2015/2016 and 2009 droughts are among many in the region [10,11,12,13,14]. In contrast, other years experienced floods. The integrated drought indices analyzed in this research, namely, the Integrated Drought Condition Index (IDCI) and Vegetation Health Index (VHI), and the evaluation drought index (Standardized Precipitation-Evapotranspiration Index–SPEI) clearly revealed that the year 2020 was the wettest year since 2000 for both the locust non-affected and affected groups of sites (Figure 2 and Figure 4). Therefore, the slight inferiority in NDVI and backscatter coefficient for the desert locust-affected sites in 2020 was not due to drought.
In a drought analysis drought indices timeseries, monthly and shorter season drought indices showed the shorter-time fluctuations of meteorological drought, while the longer-time indices showed agricultural drought. At the end of 2020 and beginning of 2021 in this study, some sites experienced meteorological drought conditions that might continue well into 2021 to bring agricultural drought.

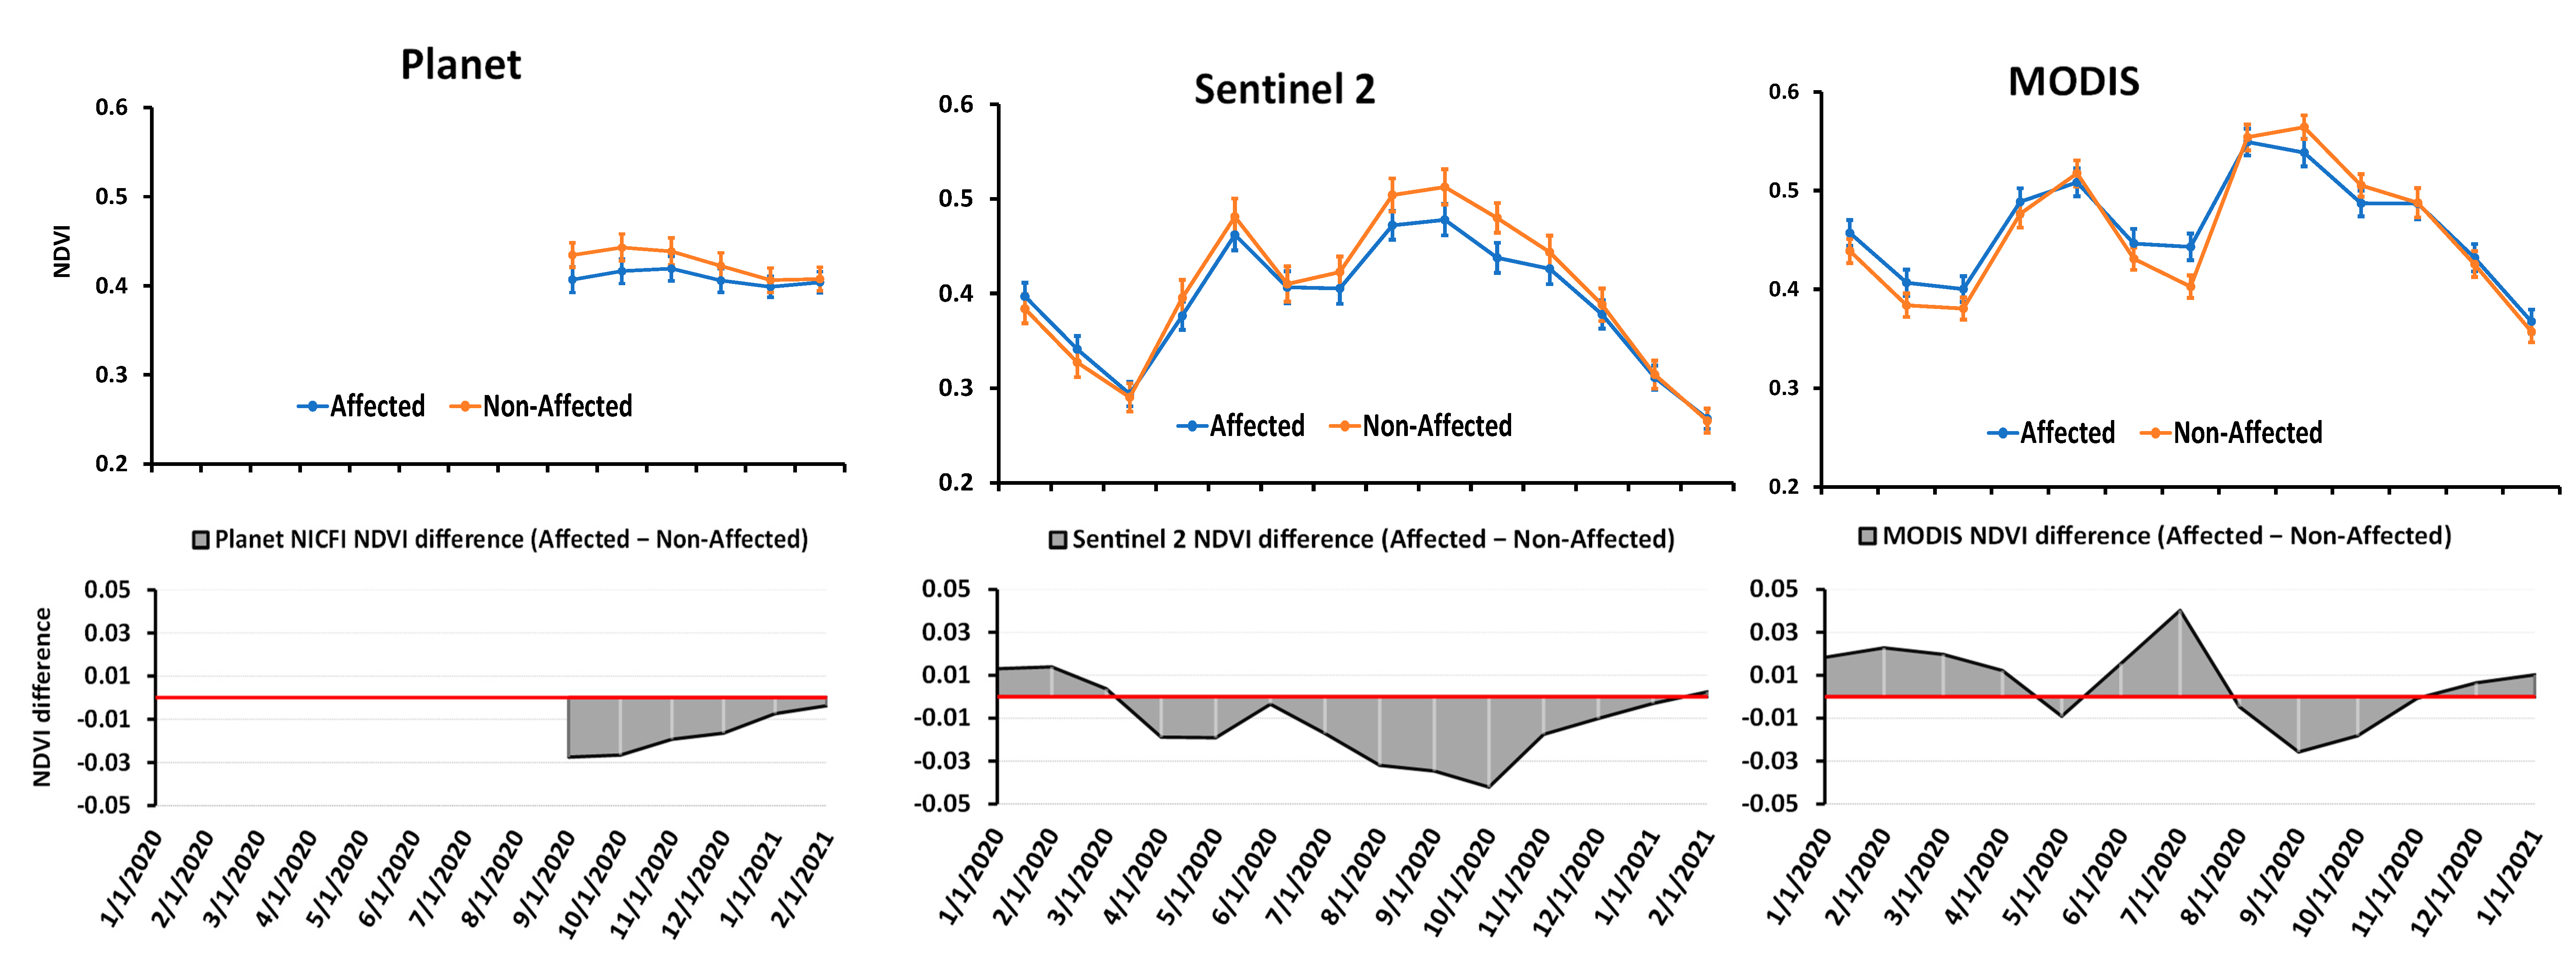
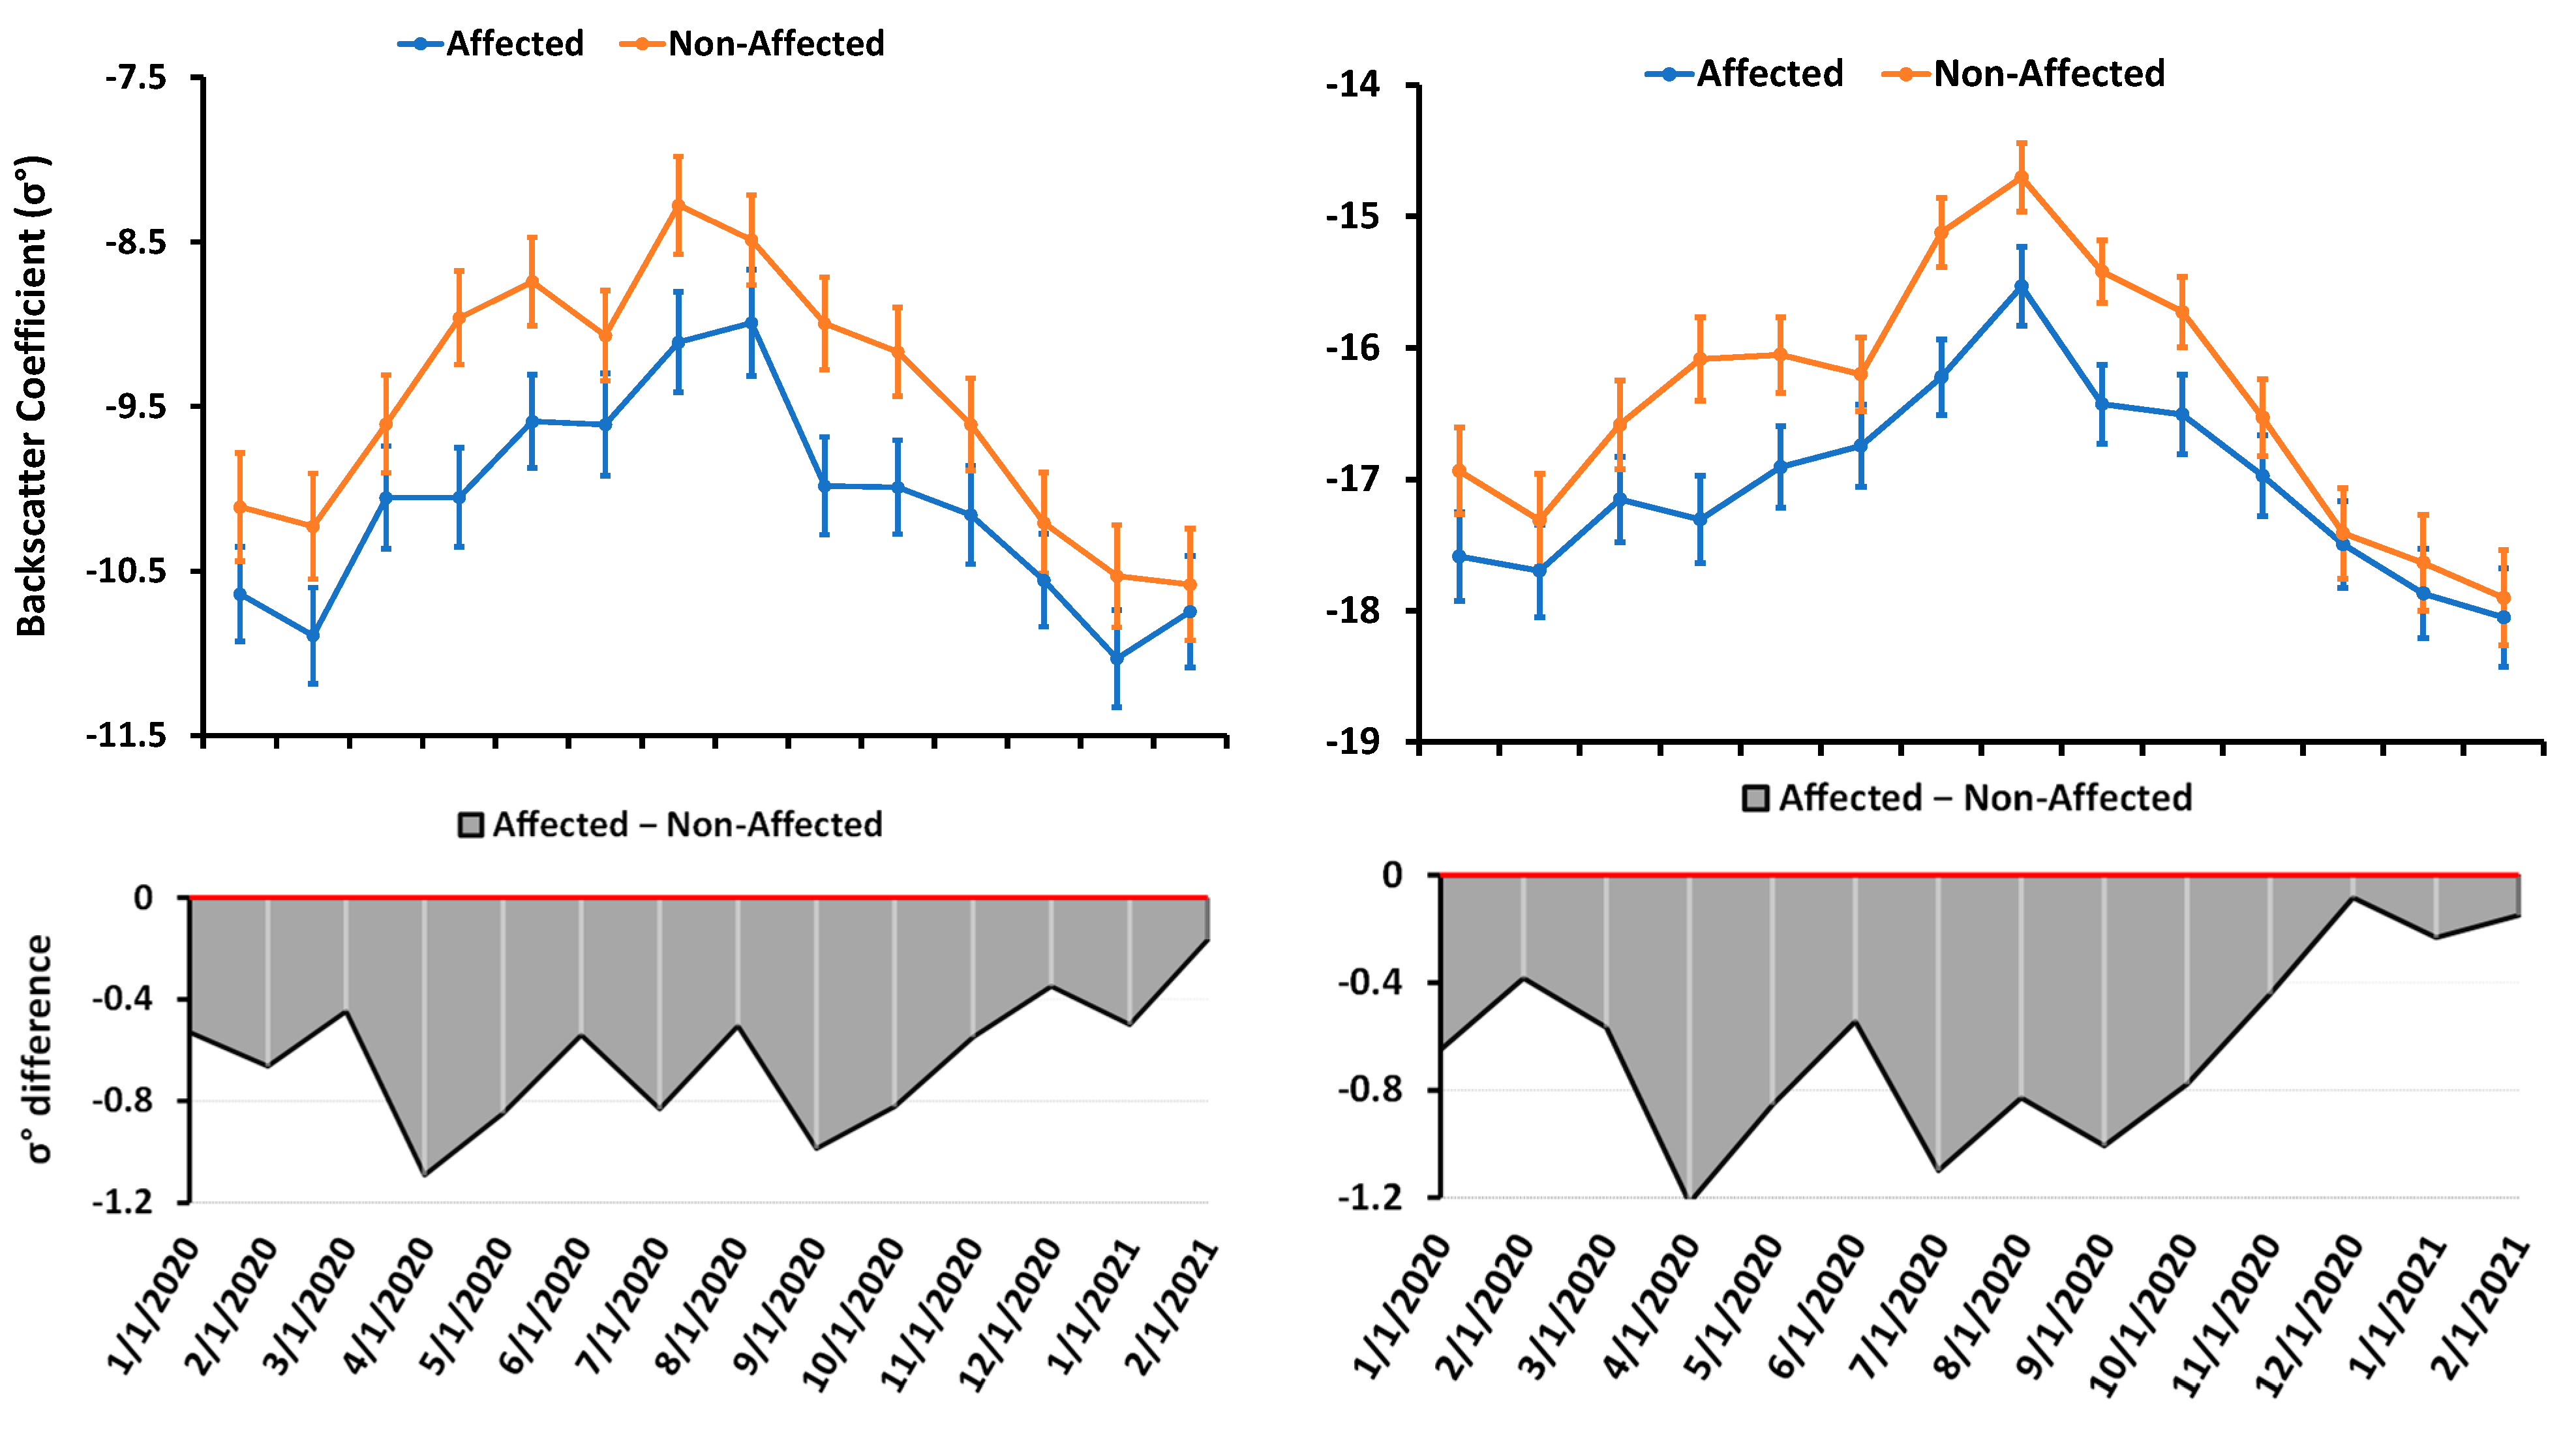
4.2. Cropland Dynamics

A site-to-site NDVI standard error (SE) across Ethiopia was slightly higher during the main growing season. This difference might be attributed to the slight differences in growing season and crop types between the northern semi-humid and southeastern semi-arid parts of Ethiopia. Even though, for the locust-affected sites, MODIS NDVI was slightly lower than that of the non-affected sites during September and October in 2020 in this research, the difference was not significant. Thus, the finer composited spatial resolution Sentinel-2 NDVI (50 vs. 500 m) performed better than the corresponding MODIS NDVI to discern the locust damage on croplands in the study area. The MODIS NDVI in the study area displayed a higher phenology amplitude throughout the year in 2020 (above 3.5) compared to the corresponding Sentinel-2 NDVI. This can be attributed to the fact that the 2 × 2 kernel aggregated 250 m MODIS NDVI (yielding 500 m spatial resolution) may have natural vegetation contamination compared to that of the 5 × 5 kernel aggregated 10 m Sentinel-2 NDVI (yielding 50 m spatial resolution). In contrast, Sentinel-2 NDVI revealed a higher dynamic range potentially due to improved sensitivity of the finer spatial resolution to vegetation dynamics throughout the growing season.
The limited duration of Planet Scope monthly Basemaps product (September 2020 onwards) reduced our ability to assess the NDVI gap throughout the year 2020 (unlike the other two NDVI products analyzed in this research–MODIS and Sentiniel-2), and ability to detect both growing seasons. However, the gap is present in the long growing (Kiremt) season and comparable to Sentinel-2. These results capture the current potential for Planet products to be used for locust swarm damage assessment. Future products from Planet with refined atmospheric correction models applied to derive surface reflectance could enhance the crop monitoring aspect of these data, and potentially enhance the locust signal we are trying to resolve.
The backscatter coefficient (σ°) for affected sites was consistently lower both during 2015–2019 when no locusts were present and during 2020 when locusts were present, suggesting the differences seen were not mainly due to locust damage but because the affected sites were intrinsically different, indicating locust habitat preferences. However, these gaps in 2020 were wider during April–May, July, and September–October, which is consistent with the other NDVI indices above that occurred during the desert locust active duration. While the precise characteristics of these preferences are uncertain, the lower coefficients are consistent with a lower vegetation biomass/structure and lower aggregated soil moisture. Lower vegetation biomass may aid such behaviors as basking to increase body temperatures while well-drained soils in more open areas can be preferred sites for laying [42,43].
The vegetation damage gaps we detected in this study during the small and main growing season in Ethiopia are in line with other studies. In a World Bank-Supported High-Frequency Phone Surveys report, there were two waves of locust invasion in Ethiopia [2]. The first invasion was from January to May, while the second round started in late September and peaked in October to November. The first round of locust invaded ~180–240 Woredas (Districts) and damaged over 200,000 hectares of mainly croplands, but also grazing lands and trees in eastern and southern Ethiopia. This round of locust vegetation damage corresponds to the March small growing season (Belg) phenology gap between the locust-affected and non-affected groups of sample sites in this study. The second round of invasion was reported to be 20 times more severe than the first round, and this was exacerbated by COVID-19 restrictions, war, and flooding that hindered locust management [2]. According to the World Bank report, due to the locust crop damage and related factors in Ethiopia, poverty levels were expected to rise and make over 2 million people to fall into poverty. The scale of Productive Safety Net Programme (PSNP) was expected to increase from 9 million to as high as 15 million [2]. Established in 2005, the PSNP is a multi-donor trust fund Ethiopia’s Government multi-billion dollar food security, public works, and social safety net program for millions in need across Ethiopia [44,45,46]. This study also found wider NDVI time-series gap in the main growing season (particularly October–November) between the locust-affected and non-affected sample sites.

5. Conclusions

NDVI and backscatter coefficient phenology from locust-affected sites (121) and adjacent non-affected sites (94) in Ethiopia for the year 2020 showed closely similar climate patterns. The gaps between affected and non-affected sites are slightly wider during March (shorter growing season) and August–October (late long growing season) with Sentinel-2 10 m resolution NDVI data. We conclude this can be attributed to the active locust swarms during these times in our study domain. Our meteorological and agricultural drought indices in the study area showed that the 2019/2020 growing season was in a non-drought phase. NDVI difference from Planet Scope Basemaps at 5 m resolution in the major locust-affected and important crop producing parts of the country also revealed that the 2020 NDVI in the late long growing season (September–October) was inferior compared to that of the 2021, while corresponding climatic conditions were comparable.
Through our analysis we found that the largest challenge in large area locust damage assessment with remote sensing includes: (1) locust infestations occur following strong rainfall that can support good crop vegetation growth; (2) locusts move toward good crop growing areas for feed; and (3) damage is variable, crops can regenerate after invasion, and the sensitivity of damage from 10 m (Sentinel-2) to 250 m (MODIS) is not consistent. Locust outbreaks continue to be difficult to detect with remote sensing, yet it appears Sentinel-2 had the ability to detect early and late season NDVI differences from the 121 sites we investigated. These combined factors make it very difficult to discriminate locust-affected and non-affected croplands with moderate and fine scale multi-temporal satellite remote sensing. We found phenology gaps between the two groups of samples are wider for finer resolution Planet, Sentinel-1 and Sentinel-2 datasets compared to that of the moderate resolution MODIS dataset, but the signal of locust outbreak remains quite small. Analysis of optical and/or microwave meter to sub-meter level very-high spatial resolution datasets collected at dense temporal intervals acquired from satellites (e.g., from Planet Scope [3–7 m], future WorldView Legion constellations, etc.), aerial (manned and unmanned aerial vehicles), and/or ground-based technologies may provide a more robust signal to detect cropland locust damage. Analyzing locust band cropland damage might also be an important consideration for future study, as locust hoppers are less mobile than adults.

Supplementary Materials

The following are available online at https://www.mdpi.com/article/10.3390/rs14071723/s1, Figure S1. Study sample sites Sentinel-1 radar Descending path vertical transmit and vertical receive (VV; top) and vertical transmit and Horizontal receive (VH; bottom) polarization average backscatter coefficients (σ°) time series for both the affected (blue) and non-affected (orange) sites for January 2015/2016–February 2021.

Author Contributions

Conceptualization, W.G.A. and C.S.R.N.; methodology, W.G.A. and C.S.R.N.; software, W.G.A.; validation, W.G.A. and C.S.R.N.; formal analysis, W.G.A.; investigation, W.G.A.; resources, W.G.A. and C.S.R.N.; data curation, W.G.A.; writing—original draft preparation, W.G.A.; writing—review and editing, W.G.A. and C.S.R.N.; visualization, W.G.A.; supervision, C.S.R.N.; project administration, W.G.A.; funding acquisition, W.G.A. All authors have read and agreed to the published version of the manuscript.

Funding

This research received no external funding.

Institutional Review Board Statement

Not applicable.

Informed Consent Statement

Not applicable.

Acknowledgments

Particularly, Alemu’s contribution in this research was supported by an appointment to the NASA Postdoctoral Program at the NASA Goddard Space Flight Center, administered by Universities Space Research Association (USRA) under contract with NASA. The study was also supported by the NASA's Land-Cover Land-Use Change Program under grant NNH20ZDA001N-LCLUC. The authors want to thank Girma Woldesilassie for requesting support for investigating locust damage in Ethiopia. We also want to acknowledge FAO and other data providers used in this study. Finally, the authors thank the anonymous reviewers for their much appreciated and helpful input.

Conflicts of Interest

The authors declare no conflict of interest.

References

  1. Alemu, W.G.; Henebry, G.M. Land Surface Phenology and Seasonality Using Cool Earthlight in Croplands of Eastern Africa and the Linkages to Crop Production. Remote Sens. 2017, 9, 914. [Google Scholar] [CrossRef] [Green Version]
  2. Ilukor, J.; Gourlay, S. Locust Invasion in Ethiopia: Scope & Impact-Evidence from the World Bank-Supported High-Frequency Phone Surveys; World Bank: Washington, DC, USA, 2021. [Google Scholar]
  3. The Desert Locust in Africa and Western Asia: Complexities of War, Politics, Perilous Terrain, and Development. In Radcliffe's IPM World Textbook; Kika de la Garza Subtropical Agricultural Research Center: Weslaco, TX, USA, 2009.
  4. Peng, J.; Albergel, C.; Balenzano, A.; Brocca, L.; Cartus, O.; Cosh, M.H.; Crow, W.T.; Dabrowska-Zielinska, K.; Dadson, S.; Davidson, M.W. A Roadmap for High-Resolution Satellite Soil Moisture Applications–Confronting Product Characteristics with User Requirements. Remote Sens. Environ. 2020, 252, 112162. [Google Scholar]
  5. FAO Central & Eastern Region Outbreaks (May 2018 to Present). Available online: https://www.fao.org (accessed on 20 November 2020).
  6. FAO. Locust Hub—An Initiative of the Food and Agriculture Organization of the United Nations. Available online: https://locust-hub-hqfao.hub.arcgis.com/ (accessed on 21 January 2021).
  7. FAO. Desert Locust Bulletin—General Situation during October 2020; FAO: Rome, Italy, 2020. [Google Scholar]
  8. FAO, Ethiopian Ministry of Agriculture, Fewsnet & Partners. Impact of Desert Locust Infestation on Household Livelihoods and Food Security in Ethiopia: Joint Assessment Findings; Ethiopian Ministry of Agriculture: Addis Ababa, Ethiopia, 2020. [Google Scholar]
  9. FAO. Greater Horn of Africa and Yemen Desert Locust Crisis Appeal January 2020–June 2021; FAO: Rome, Italy, 2021. [Google Scholar]
  10. Reuters East Africa Drought Leaves Millions Hungry. Available online: https://www.reuters.com/article/us-eastafrica-drought/east-africa-drought-leaves-millions-hungry-idUSTRE58S1F520090929 (accessed on 19 June 2021).
  11. Alemu, W.G.; Melesse, A.M.; Senay, G.B. Drought Monitoring in East Africa Using Integrated Satellite Passive Microwave Drought Indices. Available online: https://scholar.google.com/citations?user=EiJeQE4AAAAJ&hl=en (accessed on 15 November 2021).
  12. Senamaw, A.; Addisu, S.; Suryabhagavan, K. Mapping the Spatial and Temporal Variation of Agricultural and Meteorological Drought Using Geospatial Techniques, Ethiopia. Environ. Syst. Res. 2021, 10, 15. [Google Scholar] [CrossRef]
  13. UN-WFP Drought in Ethiopia: 10 Million People in Need. Available online: https://www.wfp.org/stories/drought-ethiopia-10-million-people-need (accessed on 11 November 2020).
  14. IFPRI Ethiopia’s 2015 Drought: No Reason for a Famine. Available online: http://www.ifpri.org/blog/ethiopias-2015-drought-no-reason-famine (accessed on 11 November 2020).
  15. Hao, C.; Zhang, J.; Yao, F. Combination of Multi-Sensor Remote Sensing Data for Drought Monitoring over Southwest China. Int. J. Appl. Earth Obs. Geoinf. 2015, 35, 270–283. [Google Scholar] [CrossRef]
  16. Sheffield, J.; Wood, E.F.; Chaney, N.; Guan, K.; Sadri, S.; Yuan, X.; Olang, L.; Amani, A.; Ali, A.; Demuth, S.; et al. A Drought Monitoring and Forecasting System for Sub-Sahara African Water Resources and Food Security. Bull. Am. Meteorol. Soc. 2014, 95, 861–882. [Google Scholar] [CrossRef]
  17. Jiao, W.; Tian, C.; Chang, Q.; Novick, K.A.; Wang, L. A New Multi-Sensor Integrated Index for Drought Monitoring. Agric. For. Meteorol. 2019, 268, 74–85. [Google Scholar] [CrossRef] [Green Version]
  18. Thenkabail, P.; Teluguntla, P.G.; Xiong, J.; Oliphant, A.; Congalton, R.G.; Ozdogan, M.; Gumma, M.K.; Tilton, J.C.; Giri, C.; Milesi, C.; et al. Global Cropland-Extent Product at 30-m Resolution (GCEP30) Derived from Landsat Satellite Time-Series Data for the Year 2015 Using Multiple Machine-Learning Algorithms on Google Earth Engine Cloud; Professional Paper; Reston, VA, 2021; p. 63. Available online: https://pubs.er.usgs.gov/publication/pp1868 (accessed on 2 February 2022).
  19. NASA JPL NASADEM Merged DEM Global 1 Arc Second V001. NASA EOSDIS Land Process. DAAC 2020. [CrossRef]
  20. Norwegian Ministry of Climate and Environment. Norway’s International Climate and Forests Initiative (NICFI) DATA Program User Guide; Planet.com: San Francisco, CA, USA, 2021.
  21. Roy, D.P.; Huang, H.; Houborg, R.; Martins, V.S. A Global Analysis of the Temporal Availability of PlanetScope High Spatial Resolution Multi-Spectral Imagery. Remote Sens. Environ. 2021, 264, 112586. [Google Scholar]
  22. Harrison, T.; Mascaro, J. Access to Planet High Spatial and Temporal Resolution Earth Observation Imagery via the NASA Commercial Smallsat Data Acquisition (CSDA) Program. LPI Contrib. 2021, 2549, 7107. [Google Scholar]
  23. European Space Agency. Sentiniel-2 User Handbook. ESA Standard Document, Issue 1 Rev 2, 64. 2015. Available online: https://sentinel.esa.int/documents/247904/685211/sentinel-2_user_handbook (accessed on 19 January 2021).
  24. European Space Agency. Sentinel-1 SAR User Guide. Available online: https://sentinel.esa.int/web/sentinel/user-guides/sentinel-1-sar/ (accessed on 19 January 2021).
  25. Schaaf, C.B.; Gao, F.; Strahler, A.H.; Lucht, W.; Li, X.; Tsang, T. First Operational BRDF, Albedo Nadir Reflectance Products from MODIS. Remote Sens. Environ. 2002, 83, 135–148. [Google Scholar] [CrossRef] [Green Version]
  26. Friedl, M.A.; Sulla-Menashe, D.; Tan, B.; Schneider, A.; Ramankutty, N.; Sibley, A.; Huang, X.M. MODIS Collection 5 Global Land Cover: Algorithm Refinements and Characterization of New Datasets. Remote Sens. Environ. 2010, 114, 168–182. [Google Scholar] [CrossRef]
  27. Alemu, W.G.; Wimberly, M.C. Evaluation of Remotely Sensed and Interpolated Environmental Datasets for Vector-Borne Disease Monitoring Using In Situ Observations Over the Amhara Region, Ethiopia. Sensors 2020, 20, 1316. [Google Scholar] [CrossRef] [PubMed] [Green Version]
  28. McNally, A.; Arsenault, K.; Kumar, S.; Shukla, S.; Peterson, P.; Wang, S.; Funk, C.; Peters-Lidard, C.D.; Verdin, J.P. A Land Data Assimilation System for Sub-Saharan Africa Food and Water Security Applications. Sci. Data 2017, 4, 170012. [Google Scholar] [CrossRef] [PubMed] [Green Version]
  29. European Space Agency. Copernicus Sentinel-2 MSI User Guide. Available online: https://sentinel.esa.int/web/sentinel/user-guides/sentinel-2-msi/product-types/level-2a (accessed on 19 January 2021).
  30. Didan, K. MOD13Q1 MODIS/Terra Vegetation Indices 16-Day L3 Global 250m SIN Grid V006. NASA EOSDIS Land Processes DAAC 2015, 10, 415. [Google Scholar]
  31. Funk, C.; Peterson, P.; Landsfeld, M.; Pedreros, D.; Verdin, J.; Shukla, S.; Husak, G.; Rowland, J.; Harrison, L.; Hoell, A. The Climate Hazards Infrared Precipitation with Stations—A New Environmental Record for Monitoring Extremes. Sci. Data 2015, 2, 150066. [Google Scholar] [CrossRef] [Green Version]
  32. Ghent University. European Space Agency Climate Change Initiative Global Land Evaporation Amsterdam Model (GLEAM); Ghent University: Ghent, Belgium, 2020. [Google Scholar]
  33. Tucker, C.J. Red and Photographic Infrared Linear Combinations for Monitoring Vegetation. Remote Sens. Environ. 1979, 8, 127–150. [Google Scholar] [CrossRef] [Green Version]
  34. Gansukh, B.; Batsaikhan, B.; Dorjsuren, A.; Jamsran, C.; Batsaikhan, N. Monitoring Wheat Crop Growth Parameters using Time Series Sentinel-1 and Sentinel-2 Data for Agricultural Application in Mongolia. Int. Arch. Photogramm. Remote Sens. Spat. Inf. Sci. 2020, 43, 989–994. [Google Scholar] [CrossRef]
  35. Fayad, I.; Baghdadi, N.; Bazzi, H.; Zribi, M. Near Real-Time Freeze Detection over Agricultural Plots Using Sentinel-1 Data. Remote Sens. 2020, 12, 1976. [Google Scholar] [CrossRef]
  36. Moharana, S.; Kambhammettu, B.V.N.P.; Chintala, S.; Rani, A.S.; Avtar, R. Spatial Distribution of Inter- and Intra-Crop Variability Using Time-Weighted Dynamic Time Warping Analysis from Sentinel-1 Datasets. Remote Sens. Appl. Soc. Environ. 2021, 24, 100630. [Google Scholar] [CrossRef]
  37. Zhang, X.; Chen, N.; Li, J.; Chen, Z.; Niyogi, D. Multi-Sensor Integrated Framework and Index for Agricultural Drought Monitoring. Remote Sens. Environ. 2017, 188, 141–163. [Google Scholar] [CrossRef] [Green Version]
  38. Zhang, A.; Jia, G.; Wang, H. Improving Meteorological Drought Monitoring Capability over Tropical and Subtropical Water-Limited Ecosystems: Evaluation and Ensemble of the Microwave Integrated Drought Index. Environ. Res. Lett. 2019, 14, 044025. [Google Scholar] [CrossRef]
  39. Hao, Z.; Hao, F.; Singh, V.P.; Ouyang, W.; Cheng, H. An Integrated Package for Drought Monitoring, Prediction and Analysis to Aid Drought Modeling and Assessment. Environ. Model. Softw. 2017, 91, 199–209. [Google Scholar] [CrossRef]
  40. Peng, J.; Dadson, S.; Hirpa, F.; Dyer, E.; Lees, T.; Miralles, D.G.; Vicente-Serrano, S.M.; Funk, C. A Pan-African High-Resolution Drought Index Dataset. Earth Syst. Sci. Data 2020, 12, 753–769. [Google Scholar] [CrossRef] [Green Version]
  41. Beguería, S.; Vicente-Serrano, S.M.; Beguería, M.S. Package ‘SPEI.’. 2017. Available online: https://cran.r-project.org/web/packages/SPEI/SPEI.pdf (accessed on 19 January 2021).
  42. Kimathi, E.; Tonnang, H.E.; Subramanian, S.; Cressman, K.; Abdel-Rahman, E.M.; Tesfayohannes, M.; Niassy, S.; Torto, B.; Dubois, T.; Tanga, C.M. Prediction of Breeding Regions for the Desert Locust Schistocerca Gregaria in East Africa. Sci. Rep. 2020, 10, 11937. [Google Scholar] [CrossRef] [PubMed]
  43. Skaf, R.; Popov, G.; Roffey, J. The Desert Locust: An International Challenge. Philos. Trans. R. Soc. Lond. B Biol. Sci. 1990, 328, 525–538. [Google Scholar]
  44. Devereux, S.; Sabates-Wheeler, R.; Slater, R.; Tefera, M.; Brown, T.; Teshome, A. Ethiopia’s Productive Safety Net Programme (PSNP): 2008 Assessment Report; Ethiopian Ministry of Agriculture: Addis Ababa, Ethiopia, 2008. [Google Scholar]
  45. Sharp, K.; Brown, T.; Teshome, A. Targeting Ethiopia’s Productive Safety Net Programme (PSNP); Overseas Development Institute: London, UK, 2006. [Google Scholar]
  46. Gilligan, D.O.; Hoddinott, J.; Taffesse, A.S. The Impact of Ethiopia’s Productive Safety Net Programme and Its Linkages. J. Dev. Stud. 2009, 45, 1684–1706. [Google Scholar] [CrossRef] [Green Version]
Figure 1. Map of our 121 affected and 94 non-affected study sample points in croplands superimposed on Digital Elevation Model (DEM) of Ethiopia [19]. The affected sites are presented with red graduated colors by month of locust occurrence from light orange (1 January 2020) to darker red (13 January 2021). Most of the swarms presented here occurred in October 2020. (Bottom-left) radii describe the double-ring buffer approach used for sample points.
Remotesensing 14 01723 g001
Figure 2. Time-series graphs of six-month Integrated Drought Condition Index (IDCI6) from 0.7 PCI, 0.1 TCI, 0.1 SMCI, and 0.1 VCI combinations (right), and three-month Vegetation Health Index (VHI3) from 0.2 TCI and 0.8 VCI combinations (left) for both the affected and non-affected groups of sample sites average for 2000–2020. The graphs presented here are for the best correlated IDCI and VHI with their corresponding Standardized Precipitation Evapotranspiration Index (SPEI). Note that the numbers at end of the indices refers to months.
Remotesensing 14 01723 g002
Figure 3. Scatterplots of the affected versus non-affected sites-average best correlated Integrated Drought Condition Index (IDCI6) and Vegetation Health Index (VHI3) with their corresponding Standardized Precipitation Evapotranspiration Index (SPEI) for 2000–2020 that are presented in Figure 2. The details for the individual drought indices are presented in the Figure 2 caption.
Remotesensing 14 01723 g003
Figure 4. Seasonal time-series of Standardized Precipitation Evapotranspiration Index (SPEI) for both the non-affected (left) and corresponding affected (right) sample sites average.
Remotesensing 14 01723 g004
Figure 5. One hundred and twenty-one study sample sites Planet Scope Base Maps (left), Sentinel-2 (center) and MODIS (right) site-average NDVI time series with bars indicating upper and lower quartiles for both the affected (blue) and non-affected (orange) sites for 2020, and their respective differences (bottom).
Remotesensing 14 01723 g005
Figure 6. Study sample sites Sentinel-1 radar Descending path vertical transmit and vertical receive (VV; top-left) and vertical transmit and Horizontal receive (VH; top-right) polarization average backscatter coefficients (σ°) time series for both the affected (blue) and non-affected (orange) sites for 2020, with superimposed spatial error bars, and their respective σ° difference (bottom).
Remotesensing 14 01723 g006
Table 1. Descriptions of datasets used in this study.
S/NDatasets and SourcesSpatial Res.Temporal Res.Study DurationData Variables
1Locust Hub [6]Point locations with impacted area (ha)As it occursJanuary 2020–February 2021Locust sites
2Planet Scope Basemaps [20]5 m (resampled to 50 m)MonthlySeptember 2020–February 2021NDVI
3Sentinel 2 L2A Surface Reflectance [29]10 m (resampled to 50 m)5 days *January 2020–February 2021NDVI
4Sentinel-1 σ° [24]10 m (resampled to 50 m)6 days *January 2020–February 2021VV, VH
5GFSAD30 [18]30 mAnnualJanuary 2020–February 2021Cropland points
6MOD13Q1 [30]250 m16 days *January 2000–December 2020NDVI
7CHIRPS [31]5 kmDaily *January 2000–December 2020rf
8FLDAS †† [28]10 kmDaily *January 2000–December 2020Ta, SM
9GLEAM ††† [32]25 kmMonthlyJanuary 2000–December 2020PET
Climate Hazards Group InfraRed Precipitation with Station data. †† Famine Early Warning Systems Network (FEWS NET) Land Data Assimilation System. ††† Global Land Evaporation Amsterdam Model. * Aggregated to monthly datasets.
Table 2. Descriptions of Remote Sensing Drought Indices.
Drought IndicesData SourceFormula
PCICHIRPS ( CHIRPS rf i   CHIRPS rf min ) ( CHIRPS rf max   CHIRPS rf min )
SMCIFLDAS ( FLDAS SM i FLDAS SM min ) ( FLDAS SM max   FLDAS SM min )
TCIFLDAS ( FLDAS ta max   FLDAS ta i ) ( FLDAS ta max   FLDAS ta min )
VCIMODIS ( MODIS NDVI i   MODIS NDVI min ) ( MODIS NDVI max MODIS NDVI min )
IDCICHIPS, FLDAS, MODIS α     PCI + β     TCI + γ   SMCI + ( 1 α   β     γ )     VCI
VHIMODIS, FLDAS V H I = α     TCI + ( 1   α )     VCI
α, β and γ represent the weight of single index while constituting the integrated drought indices; PCI: Precipitation Condition Index; SMCI: Soil Moisture Condition Index; TCI: Temperature Condition Index; VCI: Vegetation Condition Index; IDCI: Integrated Drought Condition Index; VHI: Vegetation Health Index.
Table 3. Correlation coefficient (r) values between the drought condition indices with different weights and the different timescales SPEI for the non-affected and affected cropland sample sites (p-value < 0.01). Note the highest r with gray-shaded bold values. Seasonal PCI and IDCI were correlated with corresponding seasonal SPEI. Also note that the 1-, 3-, 6-, and 12-months PCI and IDCI were correlated with the corresponding 1-, 3-, 6-, and 12-months of SPEI respectively (similar font colors), while the only-monthly drought indices (TCI, SMCI, VCI, and VHI; yellow background) were correlated with all the 1-, 3-, 6-, and 12-months SPEI. Also note that the numbers at end of the indices refers to months.
Correlation Coefficient (r)
Drought IndicesWeightNon-Affected CroplandsAffected Croplands
PCITCISMCIVCISPEI1SPEI3SPEI6SPEI12SPEI1SPEI3SPEI6SPEI12
PCI1
PCI3
PCI6
PCI12
0.870.930.960.960.870.920.960.96
TCI1 0.380.450.480.430.390.450.470.41
SMCI1 0.730.750.610.390.740.720.560.36
VCI1 0.500.720.620.370.510.710.610.35
IDCI1
IDCI3
IDCI6
IDCI12
0.70.10.10.10.870.930.950.940.880.920.940.93
0.60.20.10.10.860.920.930.910.860.910.920.90
0.60.10.20.10.870.920.930.900.870.910.920.89
0.50.10.30.10.860.900.890.840.860.890.880.83
0.50.20.20.10.850.900.900.860.850.890.890.85
0.50.10.20.20.850.910.900.860.860.900.890.85
0.40.20.20.20.830.900.880.810.830.880.860.79
VHI1 0.2 0.80.540.760.680.450.560.740.660.42
0.3 0.70.550.750.680.470.560.740.660.45
0.4 0.60.540.730.680.490.560.710.660.46
0.5 0.50.530.690.650.490.540.680.640.46
0.6 0.40.500.640.620.490.520.640.610.46
Publisher’s Note: MDPI stays neutral with regard to jurisdictional claims in published maps and institutional affiliations.

