Article

Facilitating Typhoon-Triggered Flood Disaster-Ready Information Delivery Using SDI Services Approach—A Case Study in Hainan

1
School of Remote Sensing and Information Engineering, Wuhan University, Wuhan 430079, China
2
School of Resources and Environmental Engineering, Hubei University, Wuhan 430062, China
*
Author to whom correspondence should be addressed.
Remote Sens. 2022, 14(8), 1832; https://doi.org/10.3390/rs14081832
Submission received: 16 February 2022 / Revised: 24 March 2022 / Accepted: 6 April 2022 / Published: 11 April 2022
(This article belongs to the Special Issue Progresses in Agro-Geoinformatics)

Abstract

:
Natural disaster response and assessment are key elements of natural hazard monitoring and risk management. Currently, the existing systems are not able to meet the specific needs of many regional stakeholders worldwide; traditional approaches with field surveys are labor-intensive, time-consuming, and expensive, especially for severe disasters that affect a large geographic area. Recent studies have demonstrated that Earth observation (EO) data and technologies provide powerful support for the natural disaster emergency response. However, challenges still exist in support of the entire disaster lifecycle—preparedness, response, and recovery—which build the gaps between the disaster Spatial Data Infrastructure (SDI) already-in-place requirements and the EO capabilities. In order to tackle some of the above challenges, this paper demonstrates how to facilitate typhoon-triggered flood disaster-ready information delivery using an SDI services approach, and proposes a web-based remote sensing disaster decision support system to facilitate natural disaster response and impact assessment, which implements on-demand disaster resource acquisition, on-the-fly analysis, automatic thematic mapping, and decision report release. The system has been implemented with open specifications to facilitate interoperability. The typhoons and floods in Hainan Province, China, are used as typical scenarios to verify the system’s applicability and effectiveness. The system improves the automation level of the natural disaster emergency response service, and provides technical support for regional remote-sensing-based disaster mitigation in China.

1. Introduction

With the global climate change background, notable disaster events, including extreme typhoons, floods, droughts, and earthquakes, have their complex mechanisms and progressions, which may cascade into severe secondary disasters or additional situations [1,2,3]. According to the World Health Organization (WHO) Atlas of Mortality and Economic Losses from Weather, Climate and Water Extremes (1970–2019), over the last 50 years, the number of disasters driven by climate change has increased fivefold, resulting in 2.06 million deaths and USD 3.64 trillion in economic losses [4]. Among the most common natural disasters worldwide, floods are the most frequent type and account for the most deaths [5,6,7]. The latest annual report of the United Nations Office for Disaster Risk Reduction shows that flooding has caused widespread devastation in the domain of agriculture, forestry, soils, biodiversity, food security, and environmental degradation in Asia [8,9]. To minimize disaster impacts, multiple jurisdictions worldwide are spending increasing time and resources to assist communities and citizens to mitigate, respond to, and recover from the disaster events. For example, in China, agencies such as the Ministry of Emergency Management have worked extensively with stakeholders to utilize geospatial resources and novel technologies and respond to large-scale natural disasters at a national, provincial, and regional level [10].
Geospatial information has been proven effective in supporting the understanding of, preparation for, response to, and recovery from natural disasters. The establishment of data, models, computing, services, and standards for enabling the integrated development of monitoring, rapid assessment, emergency communication, and decision-making is the key to improving efficiency and effectiveness in all phases of disaster emergency activities [10,11,12]. It helps disaster agencies and communities to enhance the current systems and policies, to better understand how relevant geospatial information can be qualified, integrated, and shared more efficiently, and to have an SDI already-in-place platform when disaster strikes [13,14,15]. According to the CEOS statistics, 63 agencies are operating 201 satellites [16], which are producing vast streams of EO data. National and regional jurisdictions have adopted common SDI policies and best practices to support the sharing of data resources. The European Union’s Copernicus Emergency Management Service (Copernicus EMS) provides all actors involved in the management of natural disasters with timely geospatial information derived from satellite remote sensing [17], e.g., the worldwide mapping of a range of emergency situations from natural or man-made disasters [18], the flood-relevant forecasting and monitoring information component, GloFAS [19], and drought-relevant information and early warnings [20]. The National Aeronautics and Space Administration (NASA) Earth Science Disasters Program provides the readiness of results to enable disaster management practices, advance damage reduction, and build resilience [21,22]. The National Oceanic and Atmospheric Administration (NOAA) Disaster Preparedness Program provides a breadth of preparedness, response, and recovery services to the National Ocean Service (NOS) by focusing on all aspects of potential risk [23,24]. The United States Geological Survey National Geospatial Program (USGS NGP) provides an emergency response to ensure that the community has rapid access to timely, accurate, and relevant geospatial imagery, products, and services [25,26]. The Federal Geographic Data Committee (FGDC) provides a Geoplatform to publish, share, and access authoritative geospatial data and applications related to disasters for federal, state, local, and tribal communities [27,28]. The Federal Emergency Management Agency (FEMA) Geospatial Resource Center provides world-class geospatial information, services, and technologies to prepare for, protect against, respond to, recover from, and mitigate against all hazards [29].
Interoperability and open standards are key to any spatial data infrastructure for disasters, as they enable the exchange of geospatial data and the use of data representation, processing, accessing, and visualization in distributed systems efficiently. The recent advances in computer science and technologies have led to the proliferation of distributed and interoperable web GIS services [30,31,32,33,34,35,36,37,38]. A web service is a software system designed to support interoperable machine-to-machine interactions (publication, discovery, access, and orchestration) over a network using explicit interfaces and standard protocols. The Open Geospatial Consortium (OGC) is an international standards organization leading the development of standards to make comprehensive efforts for the interoperability of geospatial data and services [31,39]. A series of OGC geospatial web service specifications have been published and widely adopted by industry companies, government agencies, and research organizations and universities, such as Geography Markup Language (GML), Web Map Service (WMS), Web Feature Service (WFS), Web Map Tile Service (WMTS), and Web Processing Service (WPS) [40]. In a recent effort, OGC followed the resource-centric design as the best practice of the modern web to develop the next generation of the OGC API (Application Programming Interface) family, and promoted JavaScript Object Notation (JSON) as the encoding format [41,42]. Any disaster SDI should benefit from these investments and could be based on standards-based web GIS patterns [43]. OGC efforts to support the disaster preparedness and response are also emerging. The OGC Disaster Resilience Pilot (DRP-2019) and GEOSS Architecture Implementation Pilot, and OGC Disaster Pilot 2021 have released a series of engineering reports and user guides to improve the ability of multiple users to discover, manage, access, qualify, share, and exploit location-based information. There are also many studies leveraging open standards and SDI to support a wide range of disasters, such as floods, drought, landslides, and public health. Damalas et al. proposed a platform based on a Geo-Spatial Early Warning Decision Support System (GE-DSS) to manage multiple natural and man-made hazards [44]. Sterlacchini et al. designed an SDI called SIRENE to access and share relevant distributed geospatial data to support decision makers in reducing disaster risks [45]. Rahman et al. estimated the crop-specific damage that occurs immediately after flood events by using a newly developed Disaster Vegetation Damage Index (DVDI) based on an interoperable system [46]. Sun et al. proposed a client framework called SUIS to support geoprocessing workflows in agricultural drought monitoring [47]. Magno et al. developed a drought monitoring and forecasting system for the Tuscany region [48]. Núñez-Andrés et al. used interoperable data specifications for inventory rockfalls with fragmentation information [49]. Tripathi and Gupta conceptualized an SDI framework for public health for accessing health information easily from the developed system [50]. However, in many cases, the disaster emergency response methods are still time-consuming, laborious, costly, and inefficient [51,52]. By some estimates, 80% of response time is spent on data procuring and wrangling [13]. On the other side, in certain government agencies’ data centers, there are redundant data accumulation and low data utilization problems [52,53,54]. Overall, several recurring challenges still exist in association with the disaster emergency response: (1) lack of stakeholder engagement, resulting in arduous and slow adaptation to the needs of particular disaster situations; (2) lack of operational disaster SDI frameworks for developing new or adapting already available algorithms and workflows, facilitating the rapid delivery of relevant disaster-ready information or derived products (e.g., added-value information products, automatic or semi-automatic tools), and creating downstream applications and services in favor of the range of decision makers, field responders, affected public, data analysts, and product providers.
The focus of this paper is to improve effective services for natural disaster management with timely and high-quality products derived from Earth observation, especially for the post-flood emergency response phase. This paper introduces how we facilitate a typhoon-triggered flood disaster response and impact assessment using an SDI services approach, and proposes a fully extensible geospatial web system that is designed to leverage the OGC web services to discover, request, and disseminate an analysis-ready and decision-ready data product, and make them discoverable, retrievable, analyzable, and visualizable in a 3D geographic context. This work will reduce the difficulties of data acquisition and cooperation in the process of disaster monitoring and impact assessment, especially innovating the traditional work mode of emergency stakeholders in China.
The remainder of this paper is organized as follows: Section 2 demonstrates the methodology, along with the key design for the system; Section 3 introduces the architecture framework and the detailed system functionalities; Section 4 presents the application scenarios and case studies; Section 5 discusses the system’s feasibility, thought-provoking findings, and future work; and Section 6 summarizes the conclusions.

2. Methods and Key Design

2.1. Task-Driven Disaster Emergency Response Service Flow Model

The task-driven disaster emergency response service flow model aims to solve the on-demand aggregation and coordination of disaster tasks, models, data, and other resources triggered by natural disaster emergencies, which assist various types of stakeholders of an SDI for disasters with their specific requirements on aspects. The task-driven service flow model involves multiple interactive roles, including the task management center, natural disaster events, model services, data resources, workflow software, and end users. With the task management center as the hub, the roles interact directly or indirectly through the operational interfaces, such as registration, query, binding, invocation, and update, forming a complete workflow of disaster SDI services collaboration and invocation.
Figure 1 shows the task-driven emergency response service flow for a typical typhoon-triggered flood disaster, which includes the following five main parts.
  • Earth observation data planning and acquisition: considering that the emergency government agencies usually use an internal network, the data acquisition mode from multi-source EO data centers to the broker server then to the internal data server shall be designed.
  • Rapid information extraction for typhoon and rainstorm early warning: create the disaster task according to a typhoon event, automatically harvest the typhoon meteorological message data, generate the typhoon track, and evaluate the impact area, population, and base stations; meanwhile, spatial interpolation analysis is used to map the rainfall distribution based on the field observations.
  • Flood inundation extraction at an interval: according to the remote sensing-based flood inundation calculation scientific model, configure the input/output parameters (e.g., processing services and data resources), invoke and run the workflow instance, and return the extraction result.
  • Comprehensive impact assessment and thematic mapping: based on the flood inundation analysis results, spatial overlay analysis is used to calculate the impact on critical infrastructures and facilities; in addition, dynamic thematic mapping is carried out by combining the statistical results, area of interest, and background topographic data based on thematic map templates.
  • Assessment report and decision support: an on-the-fly disaster monitoring and assessment report is generated based on the report template to support the decision-making; for the dynamic display and visualization of disaster analysis results, the thematic maps and reports are provided by using the map, list, and chart views.

2.2. Multi-Source Disaster Analysis-Ready Data (ARD) Preparation

The disaster management community provides a unique environment when it comes to data acquisition and management. The SDI is expected to facilitate and coordinate the exchange and sharing of static and dynamic spatial data between all stakeholders. Based on disaster emergency responses, the following key themes have been identified to be required within an effective disaster SDI at minimum.
  • Multi-source disaster data acquisition and management: According to the practical requirements of the disaster management agency and duty offices, the EO, topographic, critical infrastructure, land use, demographic, and meteorological data are obtained or purchased from the Department of Homeland, Meteorology, Civil Affairs, and Water Conservancy through the corresponding automatic downloading and pipeline methods. Taking EO data as an example, the China High-Resolution Earth Observation System Gaofen satellite images [55] are automatically pushed through the exclusive internal network, while the ESA Sentinel series images are regularly downloaded through the program scripts.
  • Disaster data preprocessing and ingestion: It is stated in many responses that all collected structured data, semi-structured data and unstructured data shall be tailored for analysis-ready integration and processing, or efficient map productions, which always includes (1) spatial datum unification, such as unification to the China Geodetic Coordinate System 2000 (CGCS 2000) [56]; (2) data clipping—background topographic data shall be clipped according to administrative divisions at all levels; (3) format conversion—define the conversion rules through the configuration file to convert data in batches; (4) attributes editing—modify, add, and delete data attributes as needed; (5) data index—index the data with the unified data model and determine the dimensions; (6) data representation—organize the data resources in multiple dimensions (such as space, time, resolution, subject, band, product type).
  • Disaster data dissemination and access: considering both business requirements and data exchange formats, the interoperable data dissemination and access modes include (1) file access: for the small dataset with GeoJSON, XML, JPG, DOC format, it is transmitted directly as a file through the HTTP protocol; (2) database access: for dynamic data that are bound to model and processing services, a database is used for data organization and access; (3) service access: for a large amount of geographical data that need to be slice, OGC Web Map Tile Service (WMTS) and Web Feature Service (WFS) are used for data access.

2.3. Automatic Disaster Thematic Mapping and Assessment Report Generation

By integrating spatial analysis, Natural Language Generation (NLG) [57], mapping and document templates in the SDI, and acquiring real-time or near-real-time data through the web service interface, the method of automatic disaster thematic mapping and assessment report generation is proposed to reduce the repetitive labor.
  • Thematic mapping. This consists of a series of map templates, which record the layer styles and layout items summarized for mapping typhoon-triggered flood events based on historical data and products. Several fixed layout items include the map view with coordinate annotations, overview, title, north arrow, legend, disaster descriptions, scale bar, and credits.
  • NLG. (1) Signal analysis—this detects basic patterns from the input data; for example, if the data of the typhoon track do not contain a “Landing Location” field, the GIS-based spatial analysis can be adopted to capture the landing information. Moreover, to convert the coordinates into place names, the vector dataset of country borders and the ocean base map can be used to identify the named fields. (2) Data interpretation—this infers more complex relationships between patterns and events. (3) Document planning—this arranges the paragraph structure and decides which themes to mention in the report. (4) Microplanning and realization—this generates actual texts. A template-based NLG method that combines direct mapping and rule-based aggregation is proposed to generate final texts.
  • Assessment report generation. A Microsoft Word document is selected as the format of the assessment report. In the document template, body text styles, headings at all levels, tables, and figures are designed, and a header of the organization can be added.

2.4. Efficient Integrated Visualization for Decision-Ready Information

Dynamic and efficient visualization of decision-ready information is crucial to support the high concurrent online requests from decision makers and stakeholders. We propose the following three main visualization strategies.
  • Rapid visualization strategies. (1) Data thinning: for disaster data with complex structure, the visualization strategy for layer object instances is constructed dynamically through asynchronous analysis, extraction, and organization to improve the readability of data; (2) bidirectional incremental loading: based on user behavior prediction, the preprocessing layer objects of adjacent nodes are dynamically loaded into the 3D engine in an idle state to reduce the subsequent rendering time of predicted nodes; (3) diversified interactive process: through the color and icon mapping methods, provide the layer management and view positioning functions to support the rapid combination and visualization for different types of data (vector, grid, etc.).
  • Optimization strategy for vector and grid data. (1) Unify the data to WGS84 coordinate system, and build the pyramid model based on the hierarchical organization of Quadtree Grid; (2) Since the browsers widely support GPU rendering, the rendering speed of vector data can be effectively improved by rasterizing with vertex shaders and fragment shaders.
  • Browser caching mechanism for high concurrent requests. For static data files that do not need regular updates, set the cache mode to mandatory in the HTTP request header; for static data files with a short update period, set it to the negotiated cache. The browser confirms whether the cached data are expired before request: if the data are not expired, the local cache is used; otherwise, new data are requested.

3. System Implementation

Based on the methodology discussed above, a data-intensive, interoperable, modular, and standard-compliant geospatial web service system called the Remote-sensing-based Disaster Decision Support System (RDDSS) is designed and built.

3.1. Architecture Framework

The RDDSS system adopts the mainstream design of separating the front and back ends, which decouples the system architecture and code logic, respectively. The front end is responsible for service invocation, data parsing, and visualization, while the back end is responsible for request processing, algorithm invocation, and multi-source data management, which results in loose confederation and cost efficiency. The overall design of the system is shown in Figure 2, and it consists of three major layers: the data layer, model layer, and application layer. All layers implement the well-known standards in both contents and interfaces.
  • Data layer: this layer supports the discovery of and access to geographic information systems and EO data archives, to obtain the inputs needed by RDDSS to generate the decision-ready products. On the basis of SDI and interoperability standards, databases are established to provide data management, data previews, spatial queries, and metadata.
  • Model layer: aiming at the comprehensive analysis and assessment of the emergency disaster response, this layer implements the processes and algorithms to support the image processing, GIS analysis, thematic assessment, and cartographic generalization functions. The distributed computing framework is also adopted to improve the processing speed and efficiency.
  • Application layer: this layer supports the construction of workflow application templates for different disaster stages and different sensors, and it provides engineering modules including workflow model reuse, disaster scenario reuse, on-demand customized analysis, and disaster engineering sharing.
As shown in Figure 3, a user-friendly interface is designed using different groups of application functionalities; the interface offers users a direct, interactive, and responsive way to view, query, download, and analyze the disaster-related data. The map view is implemented based on the Cesium Platform [58] to support both 2D and 3D web-based map display and map operations such as zoom in/out, drag-box zoom, and panning, and the geolocation of the current cursor position is displayed on the button. The toolbar contains a set of map operations for disaster decision support data analysis. The HTTP GET/POST requests are utilized in the communications between clients and the server through messages in XML or JSON format.

3.2. System Functionalities

As discussed in the Section 2, RDDSS aims to provide support for the early warning and emergency response of natural disasters such as typhoons and floods, and to ensure the rapid processing of and timely response to decision-ready information. This process involves the coordination and invocation of various resources, such as data, models, services, and computing. The system functionalities have been mainly implemented as the following five modules.

3.2.1. Data Management Module

This module supports the creation, reading, updating, and deleting of multi-source heterogeneous disaster data through the spatial database and traditional relational database, using Object-Relational Mapping (ORM) to implement the persistent operation of object type data. It also provides the geometry, temporal, and attribute query for EO images, online loading, and quick previews for background and disaster data. It supports interoperable data dissemination, access, and downloading through OGC standards (e.g., WMTS, WMS, WFS), and metadata management of data providers, sensor types, product grades, etc.

3.2.2. Model Service Module

This module considers integrated models or multi-dimensional analysis models that use a mixture of expertise models, which includes geoprocessing services, disaster thematic services, and workflow services. The geoprocessing services cover the basic GIS processing functions for vector, grid, and EO data based on GDAL and GRASS, and support five parallel processing services for the geometric, radiometric, and atmospheric correction of remote sensing images. The disaster thematic services cover the expertise models of typical typhoon–rainstorm–flood disasters based on a C++ compiled algorithm and PyQGIS, which includes index calculation, impact area evaluation, spatial statistical analysis, thematic mapping, disaster assessment report, etc. The workflow services orchestrate and manage the atomic services according to the disaster business logic, invoke the instantiated atomic services synchronously/asynchronously, and finally support the one-click automatic processing.

3.2.3. Engineering Application Module

This module provides the end user with the wizard-type engineering customization scheme, and the unified description of engineering applications, which can be quickly imported, on-demand modified, and shared. It supports the workflow business model’s reuse in different regions and different sensor platforms by using parameter adaptation middleware; the disaster scenario reuse of background maps and auxiliary thematic data by creating disaster event–data association configuration files; the on-demand customized analysis, which allows the users to conduct dynamic customized analysis and evaluation for disaster assessment according to Areas of Interest (AOIs); and the rapid engineering development and sharing through the unified description of workflow models and scenario templates.

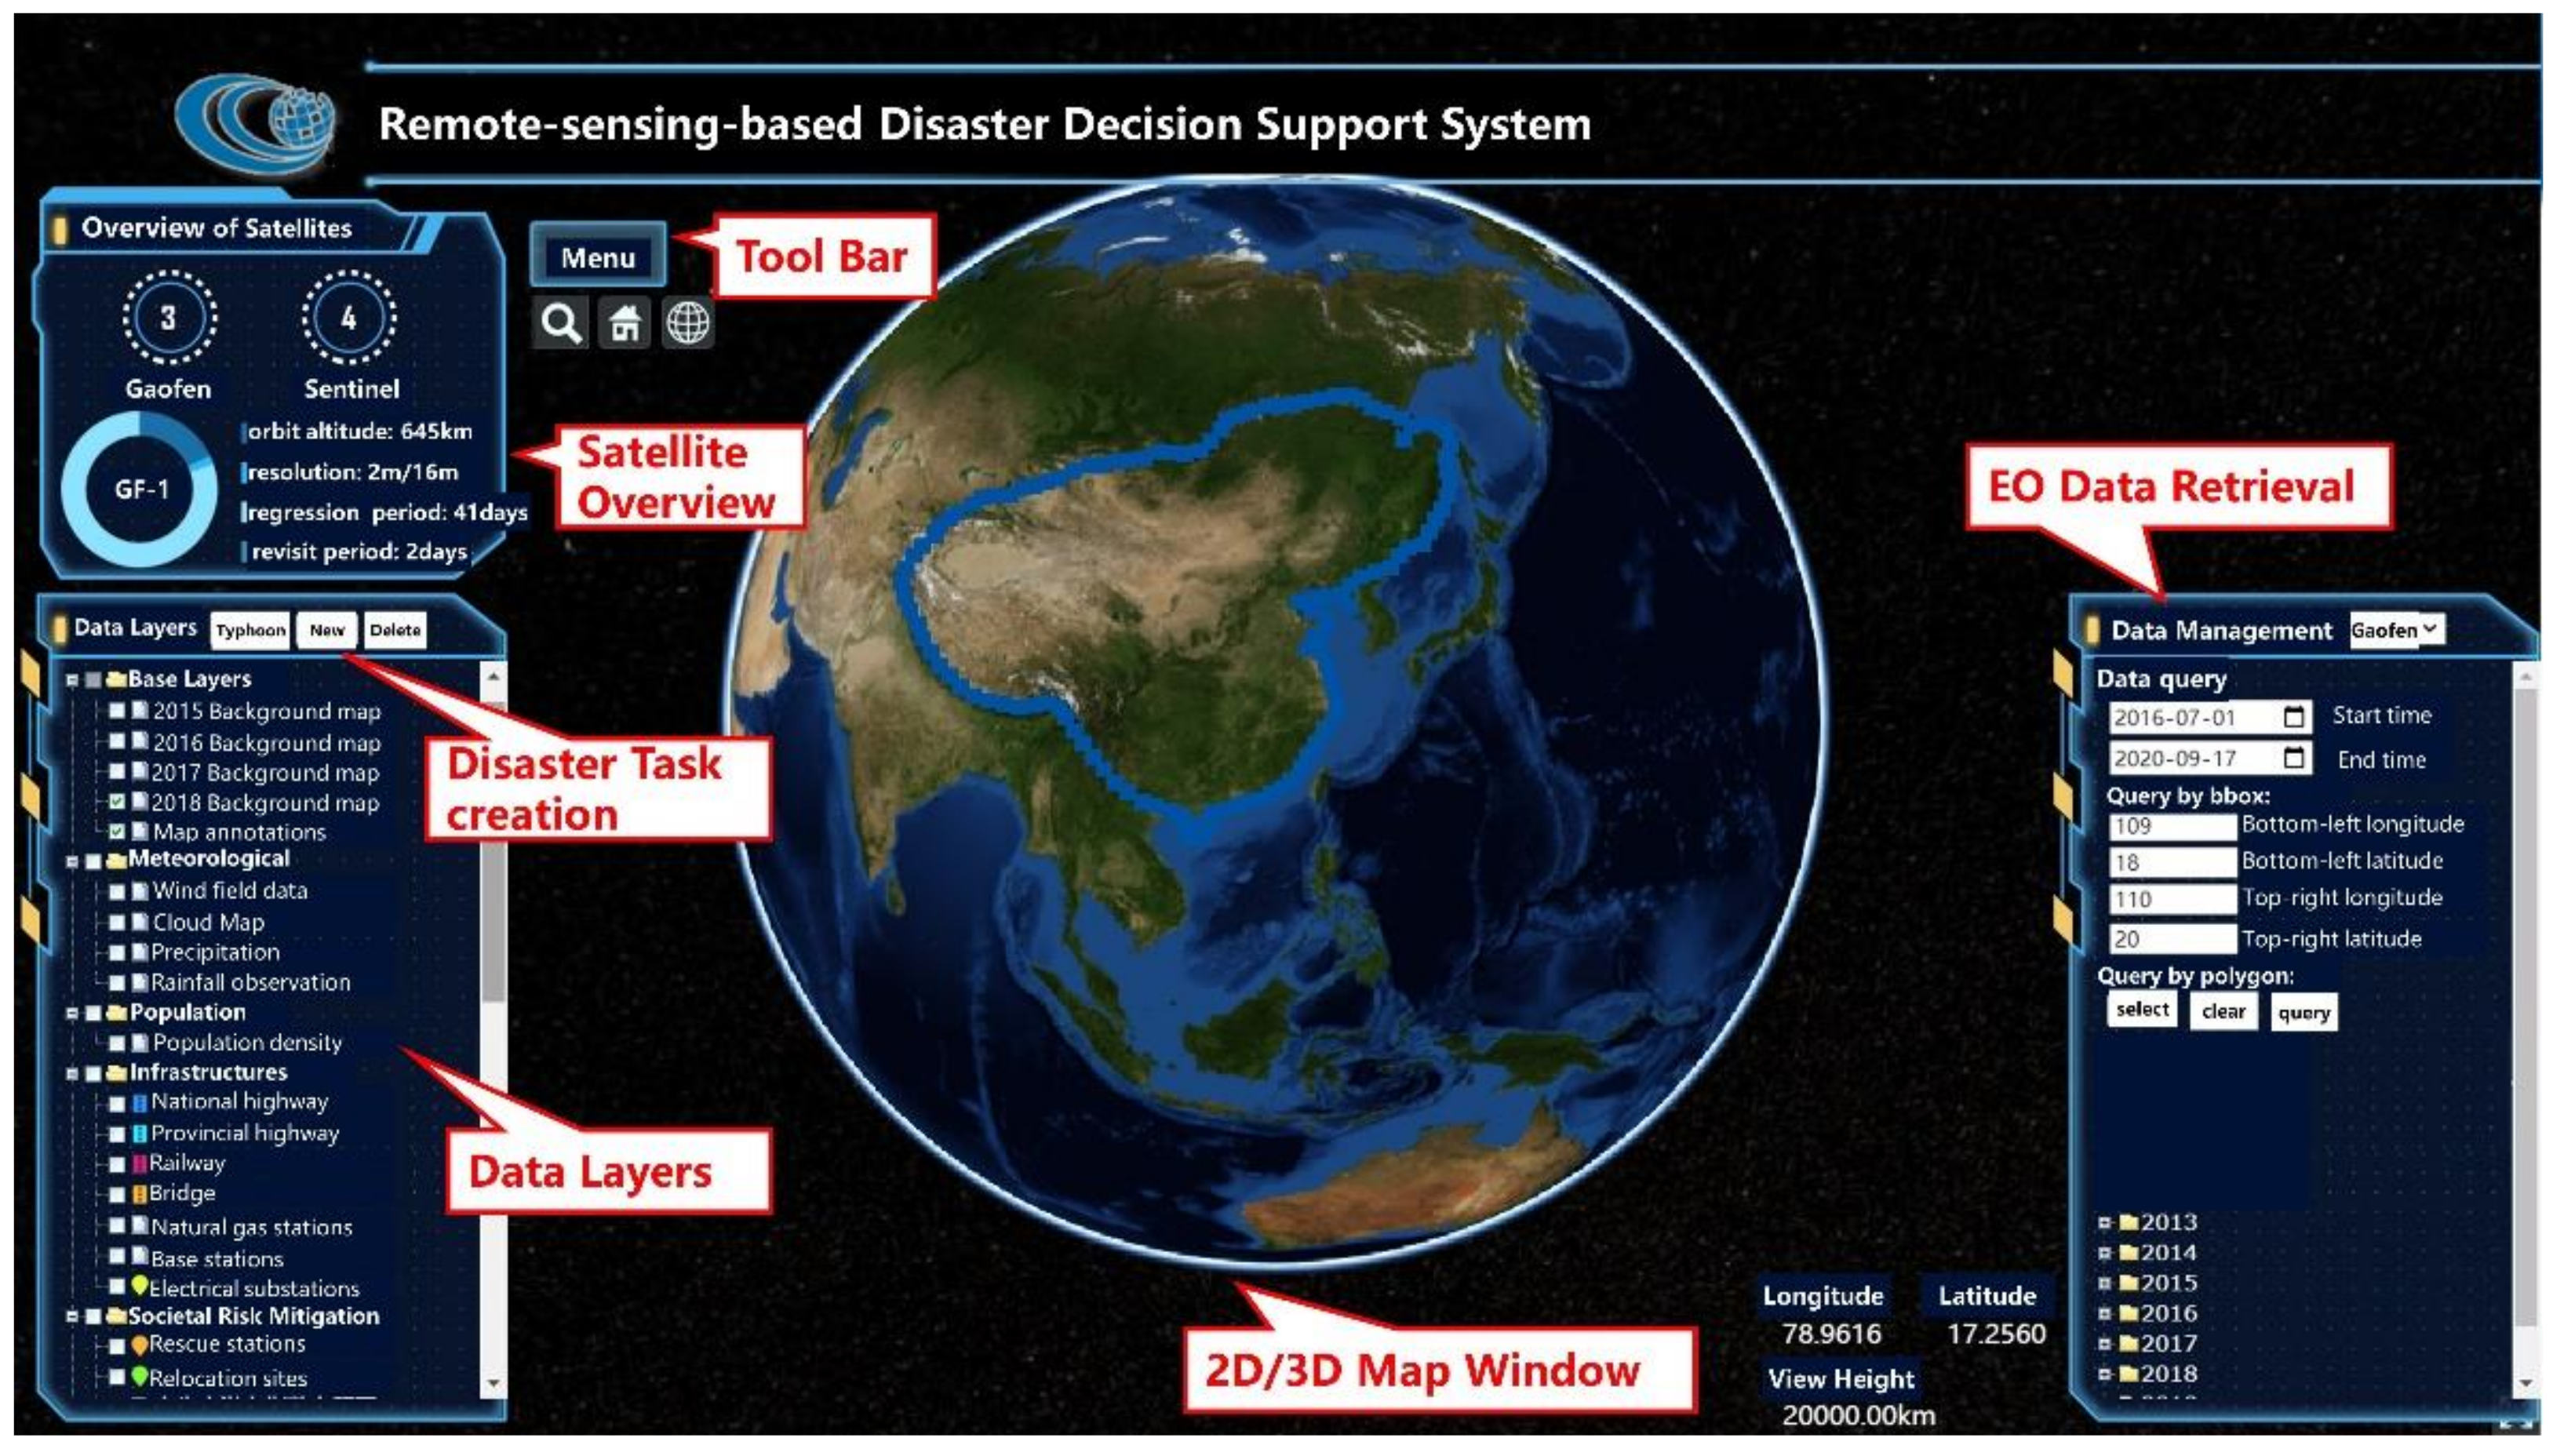
3.2.4. Visualization Module

This module is responsible for multi-source data rendering and visualization. It provides the template data rendering function, which supports the dynamic updating of webpage data by modifying the node attributes of the browser Document Object Model (DOM). It also supports the real-time rendering of vector, grid, and 3D data through WebGL Canvas, such as the loading of background data, typhoon message data, and web map services.

3.2.5. Security Management Module

This module is responsible for ensuring the data security and operating environment of the system. It provides log management, which records all the user operations in the platform through logs, and facilitates traceability when problems occur. It also supports the permission control of the system access through user login and token management, and the resource monitoring of CPU, memory, as well as the server running status.

3.3. Technology Selection

Considering the requirements of system compatibility, stability, and response speed, the current mainstream and stable technology is adopted in RDDSS. The system runs in the Linux environment, and the front end is based on the CesiumJS 3D engine [59]. CesiumJS is an open-source JavaScript library, which is used to build interactive web applications with dynamic geospatial data and provide visualization functions on a global scale; it supports 2D/3D vector and raster data rendering and web map service loading, while providing high performance based on the GPU. The jQuery library is used for HTML document traversal and manipulation, as well as event handling [60]. The wps-js library is used to handle the encoding and parsing of WPS requests/responses [61]. The back end implements service interfaces based on the Spring Boot framework [62]. The Spring Boot framework is used to build Spring-powered applications that support automatic engineering configuration, dependency library management, web server embedding, and application monitoring. The GDAL is used to implement the base algorithms for the WPS service [63]. The relational database system MySQL [64] and PostgreSQL [65] are used to store the geographic and other fundamental data. The technology selection details are shown in Table 1.

3.4. Deployment Environment

The RDDSS is deployed on the internal network of the provincial emergency department. As shown in Figure 4, the government’s internal network platform is isolated from the external internet environment by using the Virtual Private Cloud (VPC) of Taiji Cloud; the service network segments implement VLAN-level isolation through virtual switches. The platform provides security functions such as network access control, intrusion detection, antivirus, virtual network protection, and security isolation. The internal network interacts with the internet through the front loader to access the external EO data. The provincial, municipal, and county departments and units can access the internal network through the specific VPN. Currently, the system is limited to governmental users because of the security of certain background geographic data, which are gathered from various governmental agencies of Hainan province. The system will be deployed in an open network environment after removing the protected data.

4. Application Scenarios and Performance

4.1. Study Area

In this study, Hainan province is selected as the study area, because of the following advantages: (1) Hainan province is frequently struck by typhoon and flood disasters, as well as waterlogging caused by the abundant rainfall; (2) Hainan province is rich in EO data archiving and has the inherent advantage of “Eyes in the sky to feet on the ground” in the geospatial information industry chain; (3) Hainan province is the largest free trade port in China and the permanent headquarters of the Boao Forum for Asia, which is of great social and economic significance.

4.2. Fundamental Data and Indicators

Indicators are usually specific to a type of hazard or disaster, and they consider whether it is a risk, vulnerability, or an impact. The indicators are not equal but show certain critical information about a decision or an action. They depend on a great deal of investigation and experience. It is essential to perform backtracking to identify the key datasets and models once the specific indicators have been determined. Table 2 summarizes the solutions to improve the post-flood decision-making of the Department of Emergency Management of Hainan Province (DEMHP). In order to generate the indicators, we need specific components—the processing workflow and the relevant data. In our implementation, we obtain the data from multiple departments. Table 3 shows the fundamental data that we used in the RDDSS system. It contains the type of EO satellite imagery, transportation, critical facilities, societal risk mitigation, meteorological data, population data, and base map for the impact assessment.

4.3. Geospatial Processing Services

In addition to the basic data checking and preprocessing, we also developed over 20 web services based on the OGC WPS standard specifically. The services are chained by the workflow engine to further generate the relevant indicators and decision support products. Table 4 shows the WPS services input and output in detail. The basic GIS services include clipping a raster file by an extent, binarizing a raster file according to a specified threshold, converting a raster file into a vector file, and extracting the overlapping portions of features in the input and overlay layers. The EO image processing services include executing the geometric correction process, radiometric correction process, and atmospheric correction process for an EO image, and calculating a normalized difference index such as NDWI. The disaster impact assessment services include extracting the flood inundation area based on the NDWI calculation, extracting the roads, bridges, villages, hospitals, schools, paddy fields, and stations affected by the flood, and estimating the population and the acreage affected by the typhoon. The thematic mapping services include generating the thematic map of the typhoon track and intensity, rainfall distribution, affected facilities, etc. The report generation service is responsible for producing the final reports.

4.4. Use Case of Typhoon Sinlaku

Typhoon “Sinlaku” is a tropical storm that struck South China on 1 August 2020, with a maximum wind force of 18 m/s. It brought heavy rain to the northeastern and southern part of Hainan, resulting in flooding and waterlogging in many cities [66,67]. As a first responder, the Department of Emergency Management of Hainan Province (DEMHP) required a rapid impact assessment to make further decisions.
As shown in Figure 5 and Figure 6, the back-end resource center of RDDSS integrates the foundation and background data across six departments (Figure 5a), e.g., the disaster shelters and transportation facilities (Figure 5b). The system accesses the near-real-time typhoon message data from Hainan Meteorological Bureau, visualizes the typhoon track and wind field, and then estimates the impact area and population (Figure 5c). The system accesses the field observation data of rainfall stations from DEMHP, performs geospatial interpolation analysis every three hours, and generates the rainfall intensity distribution map (Figure 5d). According to the AOI selected by the user, the available remote sensing image resources are retrieved, and the latest two images of the pre and post-disaster period are chosen to analyze and extract the flood inundation area (Figure 6a). The system invokes the geospatial service chaining for the flood inundation extraction (Figure 6b); based on the extraction results (Figure 6c), the impacted roads, bridges, hospitals, villages, paddy fields, communication stations, and other critical objects are analyzed. In addition, thematic maps and assessment reports are generated with the statistical results. For example, Figure 6d shows a thematic map of a paddy field impacted by Typhoon “Sinlaku” and secondary flooding.

4.5. Use Case of Typhoon Wipha

Typhoon “Wipha” is a tropical cyclone that caused significant damage in China. On 31 July 2019, typhoon “Wipha” made landfall on Hainan Island at peak intensity. It caused the direct economic loss of 78,600 people in Hainan and a direct economic loss of CNY 2.636 million. There are 130 towns/districts on the island, with rainfall exceeding 100 mm, including Haikou, Tunchang, Chengmai, Dingan, Dongfang, Lingao, Baisha, Danzhou, and Wenchang; the maximum, in the urban area of Haikou, is 360.3 mm [66,67]. The DEMHP has similar requirements to those introduced in Section 4.2. As shown in Figure 7a, the system accesses the near-real-time typhoon message data, and automatically generates a series of thematic maps, including the track and wind field of Typhoon “Wipha”, the affected base stations, flood inundation area, affected roads and bridges, affected schools and hospitals, affected paddy fields, and disaster assessment reports (Figure 7b).

5. Discussion

Improving the ability of EO data discovery, management, access, transformation, and sharing will enhance the decision making in any of the disaster management phases—mitigation, preparedness, response, or recovery. This involves finding disaster-relevant data with a particular focus on EO data, processing them to generate analysis-ready data that are easily sharable, using these ARD to create decision-ready indicators to improve the decision-making efficiency, and providing tools to visualize, communicate, and collaborate with everyone involved in the disaster response.
Simply setting up a disaster response system is not sufficient; everyone involved needs to understand the types of decisions that will need to be taken for a disaster, therefore understanding which information, indicators, or triggers the disaster response team will seek. This is the so-called “disaster readiness”, which indicates that the solution is operational. This paper highlights the importance of how an operational disaster SDI framework can be applied to integrate the available data, models, and service workflows, facilitate the rapid delivery of relevant disaster decision support information and derived products, and create downstream applications and services in favor of the decision makers, field responders, and general public; we further conceptualized an SDI framework for similar disasters at a broader level worldwide. The implementation considers the stakeholder-identified value chain gaps. The flood indicators are not theoretical, based on the EO data at hand, or which data can be produced, but on extensive investigations according to the historical emergency mitigation and preparedness plans of DEMHP, which are attached with nine sheets of impact assessment statistical indicators and feedbacks concluded by six related duty offices.
In this study, we have evaluated two case studies to demonstrate the feasibility, applicability, and scalability of the proposed methods and system. The RDDSS has been deployed and applied in the Department of Emergency Management of Hainan Province; since its deployment in 2019, the system has managed more than 200 remote sensing images and 10 categories of thematic foundation datasets; provided over 50 algorithms and 9 disaster analysis models, which have served six duty departments; covered 19 cities and counties; and responded to more than 10 typhoon disaster events. The thematic maps and assessment reports can be automatically produced within one hour after the acquisition of EO images, thus significantly improving the working efficiency compared to their traditional methods.
The following are the observations, findings, and lessons learned.
  • Key disaster-ready indicators
The concept of a disaster-ready indicator considers the properties of a decision-making process, such as the priorities for action, most impacted areas, or those most in need of assistance; thus, it involves making connections between indicators and decisions. An indicator can be a detection of a disaster, can be a prediction of one in the future, or can be an evaluation of the severity of one that has happened. Although indicators and their associated components may vary from disaster to disaster, there will be a commonality by establishing them within a consistent framework that includes both the applicability timescale and the geospatial extent of the disaster.
One finding regarding the flood indicator is that the flood observations derived from satellite images are usually provided as merged flood extent products that are updated over time to capture the maximum inundation area. This is useful for first responders, but it would be even better if first responders could see how the flood evolves over time, and how it slowly propagates through an urban area over several days. When presented as time-dependent data, first responders can better evaluate who to rescue (those who are merely flooded or those who have experienced flooding for several days). Moreover, it is useful for flood depth simulations, e.g., a flood depth of 20 cm does not have a significant impact on transportation infrastructure, but may have critical impacts on specific crops; the relief forces and the farmers could not obtain the proper guidance only from the flood extent products.
  • Different user perspectives
The OGC Disaster Pilot 2021 proposes a six-user-persona perspective, and the collaboration between stakeholders represented by these personas is a critical element of successful disaster management. Making an objective decision on resource dissemination is only possible when the “right information is given to the right person at the right time”. For example, the first responders need a streamlined approach to discovering, accessing, processing, and applying data. They tend to require an easy-to-use interface within a narrow bandwidth environment. Meanwhile, the affected public need tailored interfaces with the properties of availability and simplicity. In addition, we should also keep in mind that not all department users have suitable technology, especially at the county level and town level.
  • Using SDI in disaster emergency response
In this data-intensive period of time, most datasets are available in some form, but it can be difficult to find the data needed. Furthermore, data are not always directly accessible, interoperable, or reusable. While a disaster is unfolding, delivery of the first crisis product within 24 h remains a challenging goal, due to the characteristics of the satellites, their orbits, and “true operational revisit”, which, for optical data, would include the impact of cloud cover. To be part of the envisaged collaborative ecosystem, both data providers and users need to be prepared to take part, and this means that there is a need for the harmonization of a series of standards and agreements, which will lead to smooth and rapid information delivery to enable decisions to be made and actions to be taken. The core idea of using SDI in a disaster emergency response is to show how independent components using standards can accomplish the task; then, it becomes much easier, faster, and straightforward to implement the next solution, and to bring in other participants without starting from scratch, because they have the standards-based ground rules for joining this ecosystem.
Additional efforts are needed in order to move forward; the main research work in the near future will concentrate on the following: (1) combining the current efforts with the Geo Data Cube, and integrating the typhoon-triggered flood disaster emergency response service workflow into the Geo Data Cube infrastructure; (2) adding a flood depth extraction model to support the more accurate damage assessment of critical facilities, and adding serval agricultural-related models for flood impact assessment, e.g., a flood crop loss assessment model; (3) duplicating the system to an open network environment without some protected data, and adding more EO data resources to the current system repository, e.g., Luojia series satellite images.

6. Conclusions

An operational remote-sensing-based disaster decision support system, RDDSS, has been developed to facilitate a natural disaster response and impact assessment. We describe the system architecture and functional modules’ development, and also highlight some key methods, such as the task-driven disaster emergency response service flow model, multi-source disaster analysis-ready data preparation, automatic disaster thematic mapping and assessment report generation, and efficient integrated visualization for decision-ready information. When disaster strikes, the system can provide automatic workflow support, from fetching the input data from the EO data systems, to releasing the thematic maps and assessment reports. The system has been deployed and applied in the Department of Emergency Management of Hainan Province, and served six duty departments, covered 19 cities and counties, and responded to more than 10 typhoon disaster events. The total cost of the RDDSS implementation and deployment is USD 125,600. Compared with the traditional method of DEMHP, the system helps to reduce labor and produces the assessment reports within 2 h after obtaining the EO data. The resources saved in dealing with more than 10 typhoon and flood disasters are equivalent to approximately USD 200,000 in economic benefits. The above evaluation of the system by the end-user agencies indicates that it offers a significant improvement for the typhoon-triggered flood disaster response and decision making.

Author Contributions

Conceptualization, L.H.; methodology, L.H. and P.Y.; software, Z.F.; validation, Z.F. and L.H.; formal analysis, L.H.; investigation, L.H.; resources, P.Y.; data curation, M.Z.; writing—original draft preparation, L.H.; writing—review and editing, L.H., P.Y. and L.J.; visualization, Z.F.; supervision, P.Y.; project administration, L.H.; funding acquisition, L.H. and P.Y. All authors have read and agreed to the published version of the manuscript.

Funding

This research was funded by the National Natural Science Foundation of China under Grant No. 42001330.

Data Availability Statement

Not applicable.

Acknowledgments

The authors would like to take this opportunity to thank the members of the editorial board and anonymous reviewers for their helpful comments and suggestions.

Conflicts of Interest

The authors declare no conflict of interest.

References

  1. Raikes, J.; Smith, T.F.; Jacobson, C.; Baldwin, C. Pre-Disaster Planning and Preparedness for Floods and Droughts: A Systematic Review. Int. J. Disaster Risk Reduct. 2019, 38, 101207. [Google Scholar] [CrossRef]
  2. Wu, J.; Han, X.; Zhou, Y.; Yue, P.; Wang, X.; Lu, J.; Jiang, W.; Li, J.; Tang, H.; Wang, F.; et al. Disaster Monitoring and Emergency Response Services in China. In Proceedings of the IGARSS 2018—2018 IEEE International Geoscience and Remote Sensing Symposium, Valencia, Spain, 22–27 July 2018; pp. 3473–3476. [Google Scholar]
  3. Chen, H.; Liang, Z.; Liu, Y.; Jiang, Q.; Xie, S. Effects of Drought and Flood on Crop Production in China across 1949–2015: Spatial Heterogeneity Analysis with Bayesian Hierarchical Modeling. Nat. Hazards 2018, 92, 525–541. [Google Scholar] [CrossRef]
  4. World Meteorological Organization (WMO). WMO Atlas of Mortality and Economic Losses from Weather, Climate and Water Extremes (1970–2019) (WMO-No. 1267); WMO: Geneva, Switzerland, 2021; ISBN 978-92-63-11267-5. [Google Scholar]
  5. Lin, L.; Di, L.; Tang, J.; Yu, E.; Zhang, C.; Rahman, M.S.; Shrestha, R.; Kang, L. Improvement and Validation of NASA/MODIS NRT Global Flood Mapping. Remote Sens. 2019, 11, 205. [Google Scholar] [CrossRef] [Green Version]
  6. Rahman, M.S.; Di, L.; Yu, E.; Lin, L.; Zhang, C.; Tang, J. Rapid Flood Progress Monitoring in Cropland with NASA SMAP. Remote Sens. 2019, 11, 191. [Google Scholar] [CrossRef] [Green Version]
  7. Phan, A.; Ha, D.N.; Man, C.D.; Nguyen, T.T.; Bui, H.Q.; Nguyen, T.T.N. Rapid Assessment of Flood Inundation and Damaged Rice Area in Red River Delta from Sentinel 1A Imagery. Remote Sens. 2019, 11, 2034. [Google Scholar] [CrossRef] [Green Version]
  8. UNDRR Annual Report. 2019. Available online: https://www.undrr.org/publication/undrr-annual-report-2019 (accessed on 16 February 2022).
  9. United Nations Office for Disaster Risk Reduction: 2018 Annual Report. Available online: https://www.undrr.org/publication/united-nations-office-disaster-risk-reduction-2018-annual-report (accessed on 16 February 2022).
  10. Lin, L.; Di, L.; Yu, E.G.; Kang, L.; Shrestha, R.; Rahman, M.S.; Tang, J.; Deng, M.; Sun, Z.; Zhang, C. A Review of Remote Sensing in Flood Assessment. In Proceedings of the 2016 Fifth International Conference on Agro-Geoinformatics (Agro-Geoinformatics), Tianjin, China, 18–20 July 2016; pp. 1–4. [Google Scholar]
  11. Parsons, M.; Glavac, S.; Hastings, P.; Marshall, G.; McGregor, J.; McNeill, J.; Morley, P.; Reeve, I.; Stayner, R. Top-down Assessment of Disaster Resilience: A Conceptual Framework Using Coping and Adaptive Capacities. Int. J. Disaster Risk Reduct. 2016, 19, 1–11. [Google Scholar] [CrossRef] [Green Version]
  12. Zhang, C.; Di, L.; Lin, L.; Guo, L. Machine-Learned Prediction of Annual Crop Planting in the U.S. Corn Belt Based on Historical Crop Planting Maps. Comput. Electron. Agric. 2019, 166, 104989. [Google Scholar] [CrossRef]
  13. OGC Disaster Pilot 2021: Call for Participation (CFP). Available online: https://portal.ogc.org/files/?artifact_id=97381 (accessed on 27 July 2021).
  14. OGC Invites You to Participate in Its Combined Disasters Resilience 2019 & GEOSS Architecture Implementation Pilot|OGC. Available online: https://www.ogc.org/pressroom/pressreleases/2980 (accessed on 27 July 2021).
  15. Sendai Framework for Disaster Risk Reduction 2015–2030. Available online: https://www.undrr.org/publication/sendai-framework-disaster-risk-reduction-2015-2030 (accessed on 16 February 2022).
  16. Agencies|CEOS|Committee on Earth Observation Satellites. Available online: https://ceos.org/about-ceos/agencies/ (accessed on 16 February 2022).
  17. Emergency|Copernicus. Available online: https://www.copernicus.eu/en/copernicus-services/emergency (accessed on 24 March 2022).
  18. Copernicus Emergency Management Service-Mapping. Available online: https://emergency.copernicus.eu/mapping/ (accessed on 24 March 2022).
  19. Global Flood Awareness System–Global Ensemble Streamflow Forecasting and Flood Forecasting. Available online: https://www.globalfloods.eu/ (accessed on 24 March 2022).
  20. European Drought Observatory|Copernicus. Available online: https://www.copernicus.eu/en/european-drought-observatory (accessed on 24 March 2022).
  21. NASA Earth Science Disasters Program. Available online: https://www.nasa.gov/centers/ames/earthscience/nasa-earth-science-disasters-program (accessed on 24 March 2022).
  22. Disaster Activations|NASA Applied Sciences. Available online: http://appliedsciences.nasa.gov/what-we-do/disasters/disaster-activations (accessed on 24 March 2022).
  23. Disaster Preparedness Program. Available online: https://response.restoration.noaa.gov/disaster-preparedness-program (accessed on 24 March 2022).
  24. US Department of Commerce, N. Disaster Preparedness. Available online: https://www.weather.gov/sgf/disaster_preparedness (accessed on 24 March 2022).
  25. NGP Emergency Response|U.S. Geological Survey. Available online: https://www.usgs.gov/ngp-user-engagement-office/ngp-emergency-response (accessed on 24 March 2022).
  26. Emergency Operations Portal|U.S. Geological Survey. Available online: https://www.usgs.gov/emergency-operations-portal (accessed on 24 March 2022).
  27. Disasters Community on GeoPlatform—Federal Geographic Data Committee. Available online: https://www.fgdc.gov/initiatives/disaster-risk-resilience/disasters-community-geoplatform (accessed on 24 March 2022).
  28. GeoPlatform Hub Template. Available online: https://disasters-geoplatform.hub.arcgis.com/ (accessed on 24 March 2022).
  29. FEMA Geospatial Resource Center. Available online: https://gis-fema.hub.arcgis.com/ (accessed on 24 March 2022).
  30. Yue, P.; Guo, X.; Zhang, M.; Jiang, L.; Zhai, X. Linked Data and SDI: The Case on Web Geoprocessing Workflows. ISPRS J. Photogramm. Remote Sens. 2016, 114, 245–257. [Google Scholar] [CrossRef]
  31. Yue, P.; Baumann, P.; Bugbee, K.; Jiang, L. Towards Intelligent GIServices. Earth Sci. Inform. 2015, 8, 463–481. [Google Scholar] [CrossRef]
  32. Hu, L.; Yue, P.; Zhang, M.; Gong, J.; Jiang, L.; Zhang, X. Task-Oriented Sensor Web Data Processing for Environmental Monitoring. Earth Sci. Inform. 2015, 8, 511–525. [Google Scholar] [CrossRef]
  33. Cheng, M.-C.; Chiou, C.-R.; Chen, B.; Liu, C.; Lin, H.-C.; Shih, I.-L.; Chung, C.-H.; Lin, H.-Y.; Chou, C.-Y. Open Data Cube (ODC) in Taiwan: The Initiative and Protocol Development. In Proceedings of the IGARSS 2019—2019 IEEE International Geoscience and Remote Sensing Symposium, Yokohama, Japan, 28 July–2 August 2019; pp. 5654–5657. [Google Scholar]
  34. Lacayo, M.; Rodila, D.; Giuliani, G.; Lehmann, A. A Framework for Ecosystem Service Assessment Using GIS Interoperability Standards. Comput. Geosci. 2021, 154, 104821. [Google Scholar] [CrossRef]
  35. Rowland, A.; Folmer, E.; Beek, W. Towards Self-Service GIS—Combining the Best of the Semantic Web and Web GIS. ISPRS Int. J. Geo-Inf. 2020, 9, 753. [Google Scholar] [CrossRef]
  36. Baumann, P. A General Conceptual Framework for Multi-Dimensional Spatio-Temporal Data Sets. Environ. Model. Softw. 2021, 143, 105096. [Google Scholar] [CrossRef]
  37. Stasch, C.; Pross, B.; Gräler, B.; Malewski, C.; Förster, C.; Jirka, S. Coupling Sensor Observation Services and Web Processing Services for Online Geoprocessing in Water Dam Monitoring. Int. J. Digit. Earth 2018, 11, 64–78. [Google Scholar] [CrossRef]
  38. Drost, S.; Vogt, A.; Danowski-Buhren, C.; Jirka, S.; Kirstein, V.; Pakzad, K.; Rieke, M. WaCoDiS: Automated Earth Observation Data Processing within an Event-Driven Architecture for Water Monitoring. Comput. Geosci. 2022, 159, 105003. [Google Scholar] [CrossRef]
  39. Di, L. Big Data and Its Applications in Agro-Geoinformatics. In Proceedings of the 2016 IEEE International Geoscience and Remote Sensing Symposium (IGARSS), Beijing, China, 10–15 July 2016; pp. 189–191. [Google Scholar]
  40. Mueller, M.; Pross, B. OGC WPS 2.0 Interface Standard. Version 2.0.; Open Geospatial Consortium: Rockville, MD, USA, 2015. [Google Scholar]
  41. OGC API. Available online: https://ogcapi.ogc.org/ (accessed on 16 February 2022).
  42. OGC API-Features|OGC. Available online: https://www.ogc.org/standards/ogcapi-features (accessed on 16 February 2022).
  43. Di, L.; Yang, Z. Foreword to the Special Issue on Agro-Geoinformatics-The Applications of Geoinformatics in Agriculture. IEEE J. Sel. Top. Appl. Earth Observ. Remote Sens. 2014, 7, 4315–4316. [Google Scholar] [CrossRef] [Green Version]
  44. Damalas, A.; Mettas, C.; Evagorou, E.; Giannecchini, S.; Iasio, C.; Papadopoulos, M.; Konstantinou, A.; Hadjimitsis, D. Development and Implementation of a DECATASTROPHIZE Platform and Tool for the Management of Disasters or Multiple Hazards. Int. J. Disaster Risk Reduct. 2018, 31, 589–601. [Google Scholar] [CrossRef]
  45. Sterlacchini, S.; Bordogna, G.; Cappellini, G.; Voltolina, D. SIRENE: A Spatial Data Infrastructure to Enhance Communities’ Resilience to Disaster-Related Emergency. Int. J. Disaster Risk Sci. 2018, 9, 129–142. [Google Scholar] [CrossRef] [Green Version]
  46. Rahman, M.S.; Di, L.; Yu, E.; Lin, L.; Yu, Z. Remote Sensing Based Rapid Assessment of Flood Crop Damage Using Novel Disaster Vegetation Damage Index (DVDI). Int. J. Disaster Risk Sci. 2021, 12, 90–110. [Google Scholar] [CrossRef]
  47. Sun, Z.; Di, L.; Gaigalas, J. SUIS: Simplify the Use of Geospatial Web Services in Environmental Modelling. Environ. Model. Softw. 2019, 119, 228–241. [Google Scholar] [CrossRef]
  48. Magno, R.; De Filippis, T.; Di Giuseppe, E.; Pasqui, M.; Rocchi, L.; Gozzini, B. Semi-Automatic Operational Service for Drought Monitoring and Forecasting in the Tuscany Region. Geosciences 2018, 8, 49. [Google Scholar] [CrossRef] [Green Version]
  49. Núñez-Andrés, M.A.; Lantada Zarzosa, N.; Martínez-Llario, J. Spatial Data Infrastructure (SDI) for Inventory Rockfalls with Fragmentation Information. Nat. Hazards 2022. [Google Scholar] [CrossRef]
  50. Tripathi, A.K.; Agrawal, S.; Gupta, R.D. A Conceptual Framework of Public Health SDI. In Proceedings of the Applications of Geomatics in Civil Engineering; Ghosh, J.K., da Silva, I., Eds.; Springer: Singapore, 2020; pp. 479–487. [Google Scholar]
  51. Di, L.; Eugene, G.Y.; Kang, L.; Shrestha, R.; BAI, Y. RF-CLASS: A Remote-Sensing-Based Flood Crop Loss Assessment Cyber-Service System for Supporting Crop Statistics and Insurance Decision-Making. J. Integr. Agric. 2017, 16, 408–423. [Google Scholar] [CrossRef]
  52. Deng, M.; Di, L.; Yu, G.; Yagci, A.; Peng, C.; Zhang, B.; Shen, D. Building an On-Demand Web Service System for Global Agricultural Drought Monitoring and Forecasting. In Proceedings of the 2012 IEEE International Geoscience and Remote Sensing Symposium, Munich, Germany, 22–27 July 2012; pp. 958–961. [Google Scholar]
  53. Han, W.; Yang, Z.; Di, L.; Mueller, R. CropScape: A Web Service Based Application for Exploring and Disseminating US Conterminous Geospatial Cropland Data Products for Decision Support. Comput. Electron. Agric. 2012, 84, 111–123. [Google Scholar] [CrossRef]
  54. Han, W.; Yang, Z.; Di, L.; Yue, P. A Geospatial Web Service Approach for Creating On-Demand Cropland Data Layer Thematic Maps. Trans. ASABE 2014, 57, 239–247. [Google Scholar] [CrossRef]
  55. China National Space Administration (CNSA) High-Resolution Earth Observation System. Available online: http://www.cnsa.gov.cn/ (accessed on 21 March 2022).
  56. United Nations China Geodetic Coordinate System 2000. Available online: https://unstats.un.org/home/ (accessed on 21 March 2022).
  57. Dong, C.; Li, Y.; Gong, H.; Chen, M.; Li, J.; Shen, Y.; Yang, M. A Survey of Natural Language Generation. arXiv 2021, arXiv:2112.11739. [Google Scholar]
  58. Cesium: The Platform for 3D Geospatial. Available online: https://cesium.com/ (accessed on 20 March 2022).
  59. CesiumJS: 3D Geospatial Visualization for the Web. Available online: https://cesium.com/platform/cesiumjs/ (accessed on 20 March 2022).
  60. JQuery: A Fast, Small, and Feature-Rich JavaScript Library. Available online: https://jquery.com/ (accessed on 20 March 2022).
  61. Wps-Js: A Javascript Library to Build Client Application for OGC WPS. Available online: https://wiki.52north.org/Geoprocessing/Wps-js (accessed on 20 March 2022).
  62. Spring Boot: An Open Source Java-Based Framework Used to Create Micro Service. Available online: https://spring.io/projects/spring-boot (accessed on 20 March 2022).
  63. GDAL: A Translator Library for Raster and Vector Geospatial Data Formats. Available online: https://gdal.org/ (accessed on 26 March 2022).
  64. MySQL: MySQL Documentation. Available online: https://dev.mysql.com/doc/ (accessed on 24 March 2022).
  65. PostgreSQL: Documentation. Available online: https://www.postgresql.org/docs/ (accessed on 24 March 2022).
  66. National Hurricane Center and Central Pacific Hurricane Center. Available online: https://www.nhc.noaa.gov/ (accessed on 20 March 2022).
  67. China Meteorological Administration. Available online: https://weather.cma.cn/ (accessed on 20 March 2022).
Figure 1. Task-driven emergency response service flow for typhoon-triggered flood disaster.
Remotesensing 14 01832 g001
Figure 2. Architecture of Remote-sensing-based Disaster Decision Support System (RDDSS).
Remotesensing 14 01832 g002
Figure 3. User interface of RDDSS.
Remotesensing 14 01832 g003
Figure 4. System deployment environment.
Remotesensing 14 01832 g004
Figure 5. System application on Typhoon “Sinlaku”. (a) Resource center of RDDSS; (b) Foundation data layer of disaster shelters and transportation facilities; (c) Typhoon track, wind field, impact area, and population; (d) Rainfall intensity analysis.
Remotesensing 14 01832 g005
Figure 6. System application on Typhoon “Sinlaku”. (a) Remote sensing image resource retrieval; (b) Geospatial service chaining for the flood inundation extraction; (c) Flood inundation analysis based on Gaofen-1 image (16 m); (d) Thematic map of impact paddy field analysis.
Remotesensing 14 01832 g006
Figure 7. System application on Typhoon “Wipha”. (a) Thematic maps of typhoon track and wind field, affected base stations, flood inundation area, affected roads and bridges, affected schools and hospitals, affected paddy fields; (b) Disaster assessment reports.
Remotesensing 14 01832 g007
Table 1. Technology selection.
NameTypeUsage
AJAXAsynchronous web techniqueFront- and back-end data interaction, webpage dynamic modification
jQuery [60]JavaScript libraryHTML document traversal and manipulation, event handling
wps-js [61]JavaScript libraryEncoding and parsing of WPS requests and responses
Spring Boot [62]Web application framework for Java platformCreation of Spring-powered web applications and services
GDAL [63]Translator library for raster and vector geospatial data formatsUtilities for data translation and processing
MySQL [64]Relational database systemStore the critical facilities data, such as hospitals, base stations, rescue stations
PostgreSQL [65]Relational database system emphasizing extensibility and SQL complianceStore the geographic data
Table 2. Decision activities and relevant indicators after a typical typhoon-triggered flood disaster.
Decision ActivitiesFundamental DataMethods/ModelsIndicators/Decision Support Products
Check the typhoon track and quickly estimate the potentially impacted regions, population, and critical facilitiesTyphoon Vortex Data Message,
typhoon tracking and intensity, base map, population density, distribution of critical facilities
Typhoon track generation model,
rapid estimate of impacted regions and population
Near-real-time typhoon tracking and impacted area
Check the rainfall distribution to see which cities/areas are most affected and need potential flood analysisRainfall field observations,
precipitation data
Geospatial interpolation analysisTime series rainfall distribution map
Check the flood inundation area on a relatively large scale where the decision makers concernedGaofen imagery,
Sentinel imagery
Flood inundation extraction modelTime series flood inundation map
Check the specific impacted facilities of flood disaster based on area of interest, and generate the thematic map on demandDistribution of transportation, critical facilities, societal risk mitigation facilities, base map, flood inundation extentGeospatial interpolation analysis,
geospatial overlay analysis,
geostatistical analysis,
thematic mapping process
Periodic impact assessment thematic maps
Check the final assessment report with all thematic maps and statistical resultsAll the outputs of the statistics and thematic mapsReport generation processPeriodic impact assessment report
Table 3. Fundamental data used in RDDSS system.
TypeNameFormatDescriptionSource
Earth Observation Satellite ImageryGaofen-1 imageryGeoTIFFOptical data, 16 m spatial resolutionHainan Data and Application Center for High-Resolution Earth Observation System, http://gfdc.hainan.gov.cn/ (accessed on 26 March 2022)
Gaofen-2 imageryGeoTIFFOptical data, 4 m spatial resolution
Sentinel-1 SAR DatasetSAFE,
GeoTIFF
SAR data, 10 m spatial resolutionEuropean Space Agency, https://sentinels.copernicus.eu/web/sentinel/ (accessed on 26 March 2022)
Sentinel-2 imagerySAFE,
GeoTIFF
Optical data, 10 m spatial resolution
TransportationNational highwayJSONLinestring data, the national highway system and regional major roads in Hainan provinceDEMHP, originally collected from the Hainan Administration of Surveying, Mapping, and Geoinformation
Provincial highway
Municipal road
Railway
BridgeGeoJSONPoint data, bridges in Hainan province
RiverGeoJSONLinestring data, rivers in Hainan province
Critical FacilitiesVillagesGeoJSONPoint data, typical critical facilities in Hainan provinceDEMHP, originally collected from the Department of Natural Resources and Planning of Hainan Province
Schools
Hospitals
Paddy fields
Natural gas stations
Base stations
Electrical substations
Societal Risk MitigationRescue stationsGeoJSONPoint data, relevant societal risk mitigation places in Hainan provinceDEMHP, originally from Department of Civil Affairs of Hainan Province
Shelters
Relocation sites
Geological collapse sites
Meteorological DataTyphoon Vortex Data MessageTextThe message contains information of latitude and longitude coordinates, intensity, wind speed, etc.National Meteorological Center, http://www.nmc.cn/ (accessed on 26 March 2022)
Typhoon track and intensityJSONNear-real-time typhoon tracking and forecast trackingDEMHP, provided by Hainan Meteorological Administration
PrecipitationHDF5,
GeoTIFF
10 km spatial resolutionNASA Global Precipitation Measurement Mission (GPM), https://gpm.nasa.gov/data/ (accessed on 26 March 2022)
Rainfall field observationJSONThe field observation data from Hainan rainfall stationsDEMHP, published on http://zh.hainan.gov.cn/portal/ (accessed on 26 March 2022)
PopulationPopulation densityGeoTIFF100 m spatial resolution, estimates of numbers of people per pixel (ppp) and people per hectare (pph)WorldPop, https://www.worldpop.org/geodata/ (accessed on 26 March 2022)
Base MapBackground map layerPNGWMTS services, background map and annotation of Hainan provinceHainan Administration of Surveying, Mapping, and GeoinformationMap World, http://lbs.tianditu.gov.cn/server/MapService.html (accessed on 26 March 2022)
Map annotation layerPNG
Administrative divisionGeoJSONLinestring, the boundary files of Hainan province, cities, countiesDEMHP
Table 4. WPS services implemented in RDDSS system.
FunctionalitiesWPS ServicesInputsOutputs
Basic GIS functionsClipRasterSpatial extent represented by well-known text (WKT) string or GeoJSONClipped raster file
BinarizationRaster file and the thresholdBinarized raster file
PolygonizeRaster fileVector file
SpatialOverlayTwo vector filesVector file with intersected features
EO Image ProcessingGeometricCorrectionImage that has not been geometrically correctedImage that has been geometrically corrected
RadiometricCalibriationImage that has not been radiometrically calibratedImage that has been radiometrically calibrated
AtmosphericCorrectionImage not been radiometrically calibratedImage that has been radiometrically calibrated
IndexCalculationImage with multiple bandsImage presenting a specific remote sensing index
Disaster Impact AssessmentGetFloodInundationAreaPre- and post-flood NDWI imagesThe vector layer and acreage of flood inundation area
GetImpactedRoadsFlood inundation and road networkThe vector layer and the total length of affected roads
GetImpactedBridgesFlood inundation and distribution of bridgesThe vector layer and the number of affected bridges
GetImpactedVillagesFlood inundation and distribution of villagesThe vector layer of affected villages and the number of affected people
GetImpactedHospitalsFlood inundation and distribution of hospitalsThe vector layer and the number of affected hospitals
GetImpactedSchoolsFlood inundation and distribution of schoolsThe vector layer and the number of affected schools
GetImpactedPaddyfieldsFlood inundation and distribution of paddy fieldsThe vector layer and the number of affected paddy fields
GetImpactedStationsFlood inundation and distribution of natural gas, base, electrical stationsThe vector layer and the number of affected stations
ImpactedPopulationStatsTyphoon path and intensity, wind direction and speed, population densityThe number of potential affected population
ImpactedAreaStatsTyphoon path and intensity, wind direction and speed, base mapThe potential affected acreage of the target area
Thematic MappingTMTyphoonPathIntensityReal-time typhoon vortex data message or typhoon trackThematic map of the typhoon track, forecast track, and intensity
TMRainfallDistributionThe field observation data of meteorological stationsThematic map of the rainfall distribution
TMFloodInundationReference image, flood inundation layer, and the spatial extent of the areaThematic map of the flood inundation
TMImpactedVillagesThe vector layers and the numbers of affected villages and peopleThematic map of the affected villages and population
TMImpactedTransportationsThe vector layers and the numbers of affected roads, railways, and bridgesThematic map of the affected transportation
TMImpactedCriticalFacilitiesThe vector layers and the numbers of affected schools and hospitalsThematic map of the affected critical facilities
TMImpactedCroplandThe vector layer and the number of affected paddy fieldsThematic map of the affected cropland
Report GenerationReportGenerationAll the outputs of the statistics and thematic maps as mentioned above, report template fileThe .docx and .pdf file of disaster assessment report
Publisher’s Note: MDPI stays neutral with regard to jurisdictional claims in published maps and institutional affiliations.

