
Areas Available for the Potential Sustainable Expansion of Soy in Brazil: A Geospatial Assessment Using the SAFmaps Database

 ,
,
Abstract
:1. Introduction
2. Materials and Methods
2.1. Suitability, Costs, and Yield Database
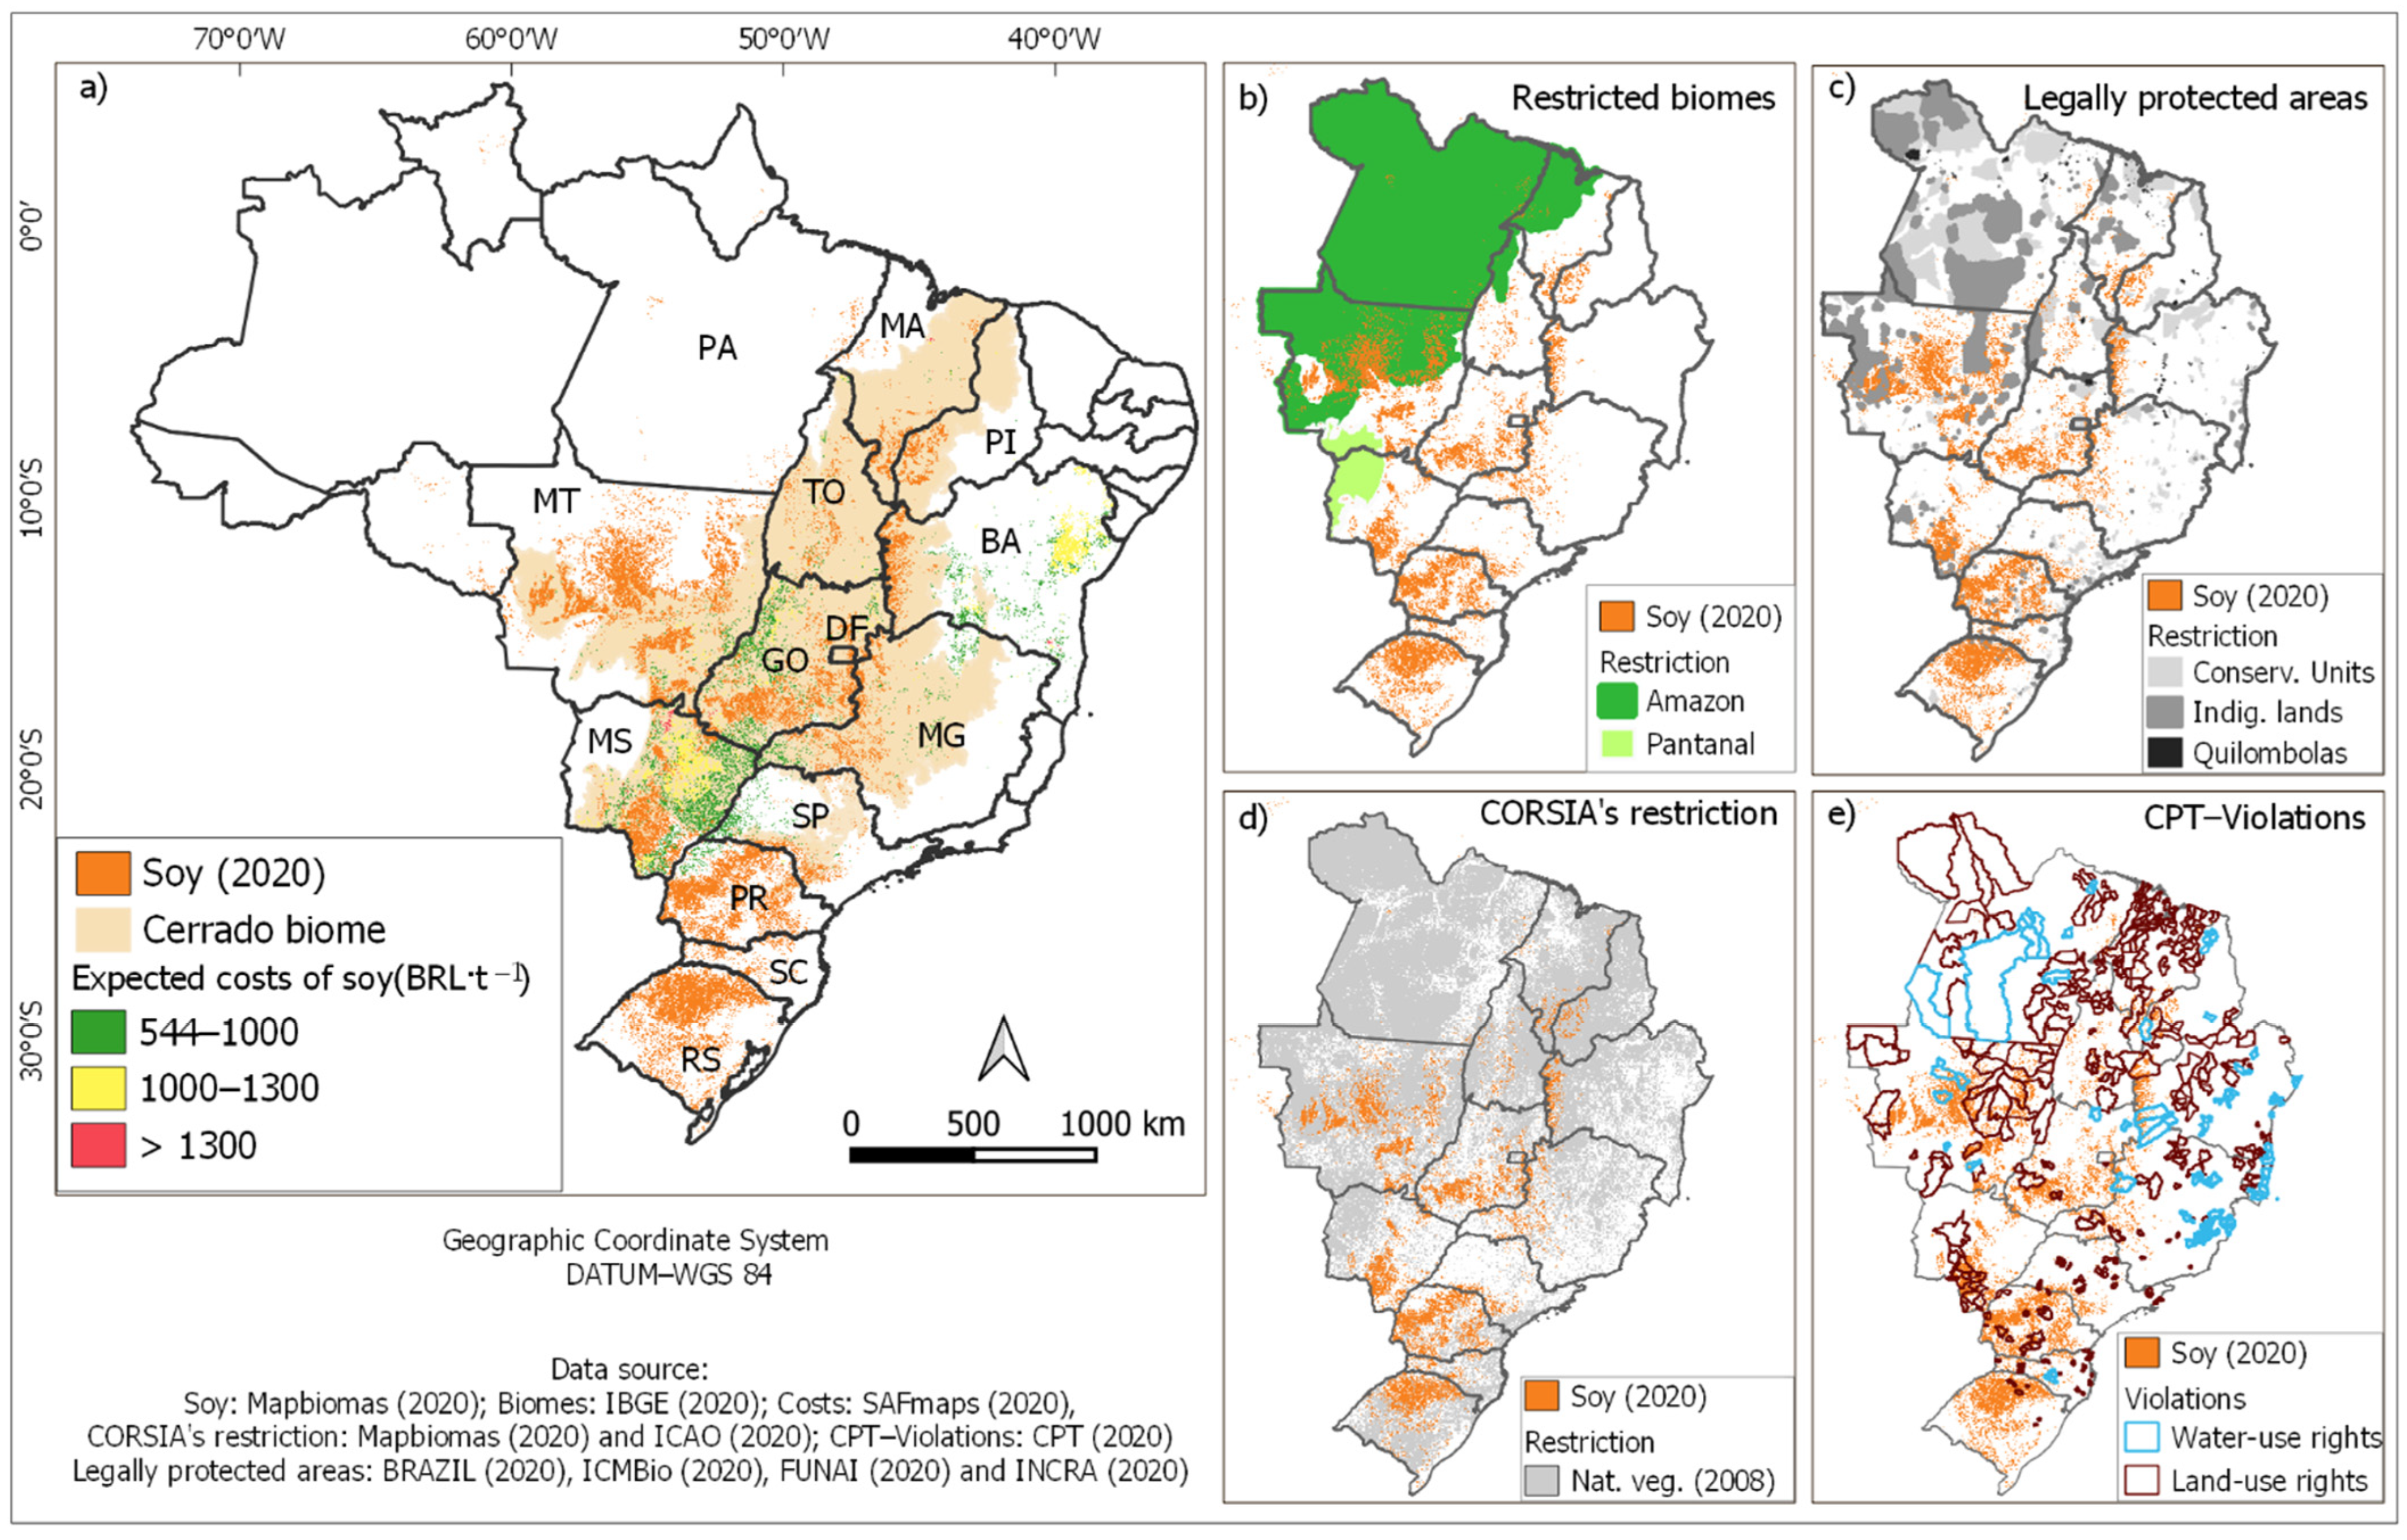
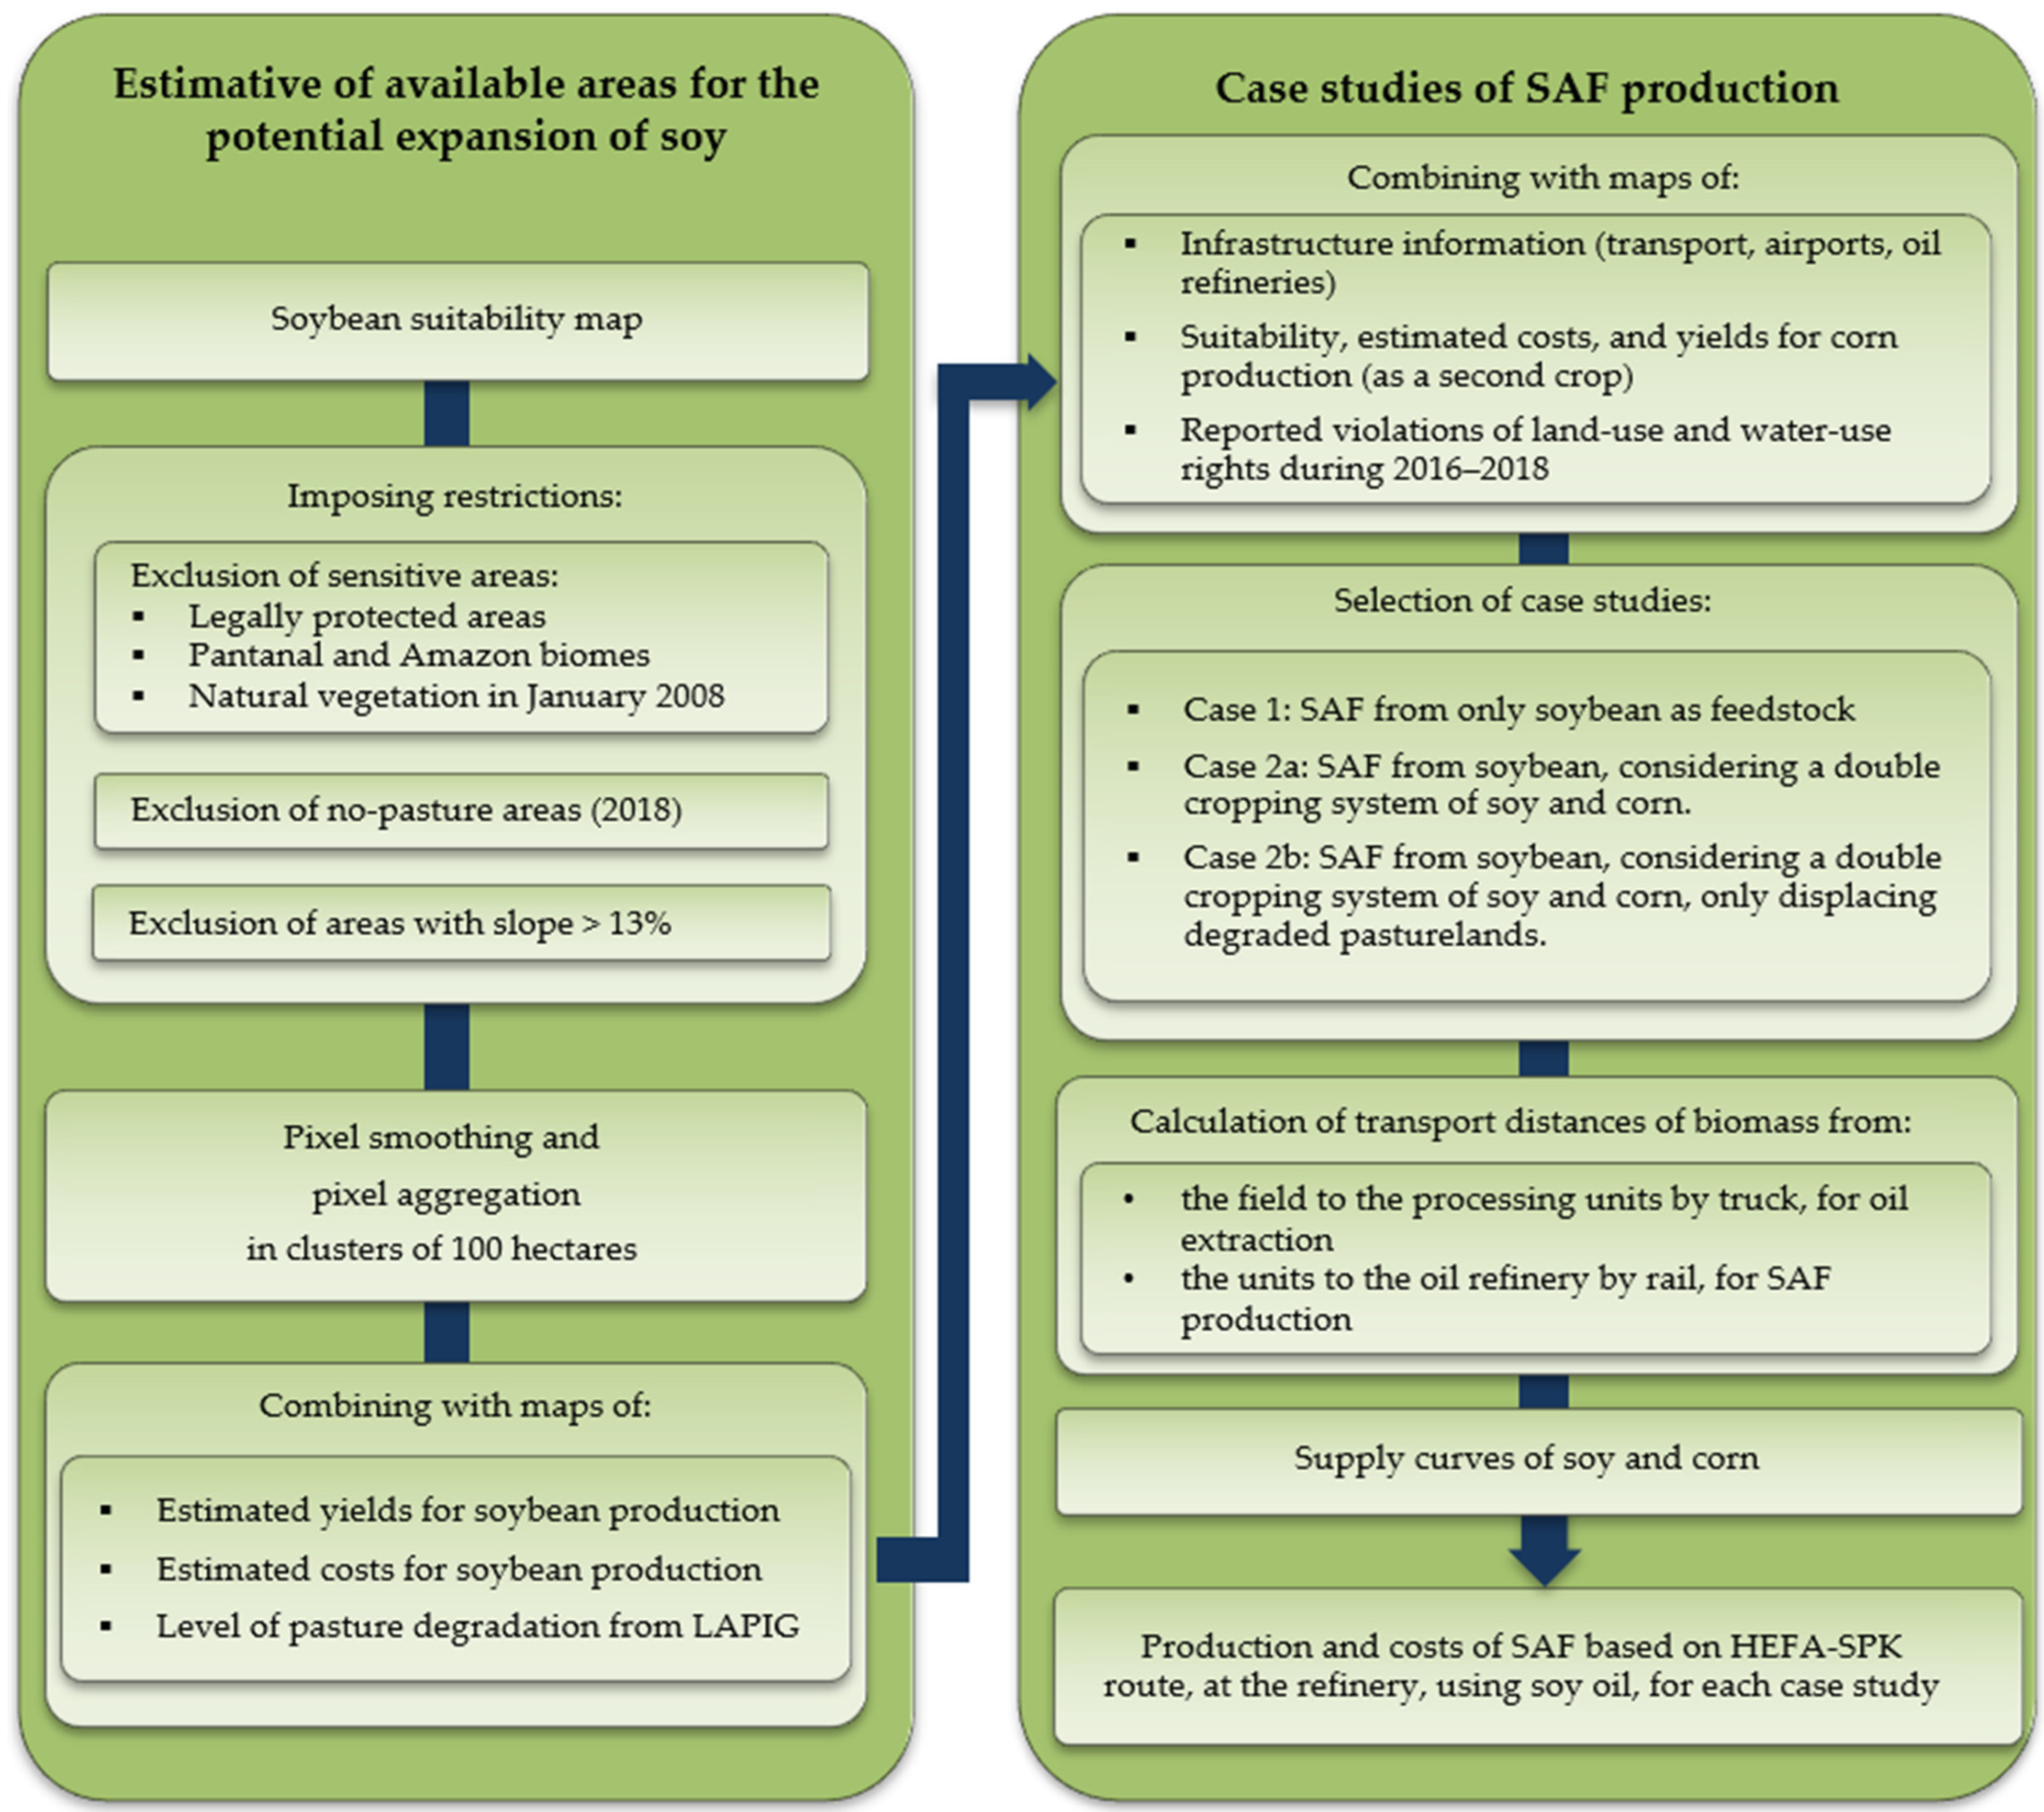
2.2. Estimative of Areas Available for the Potential Expansion of Soy in Brazil
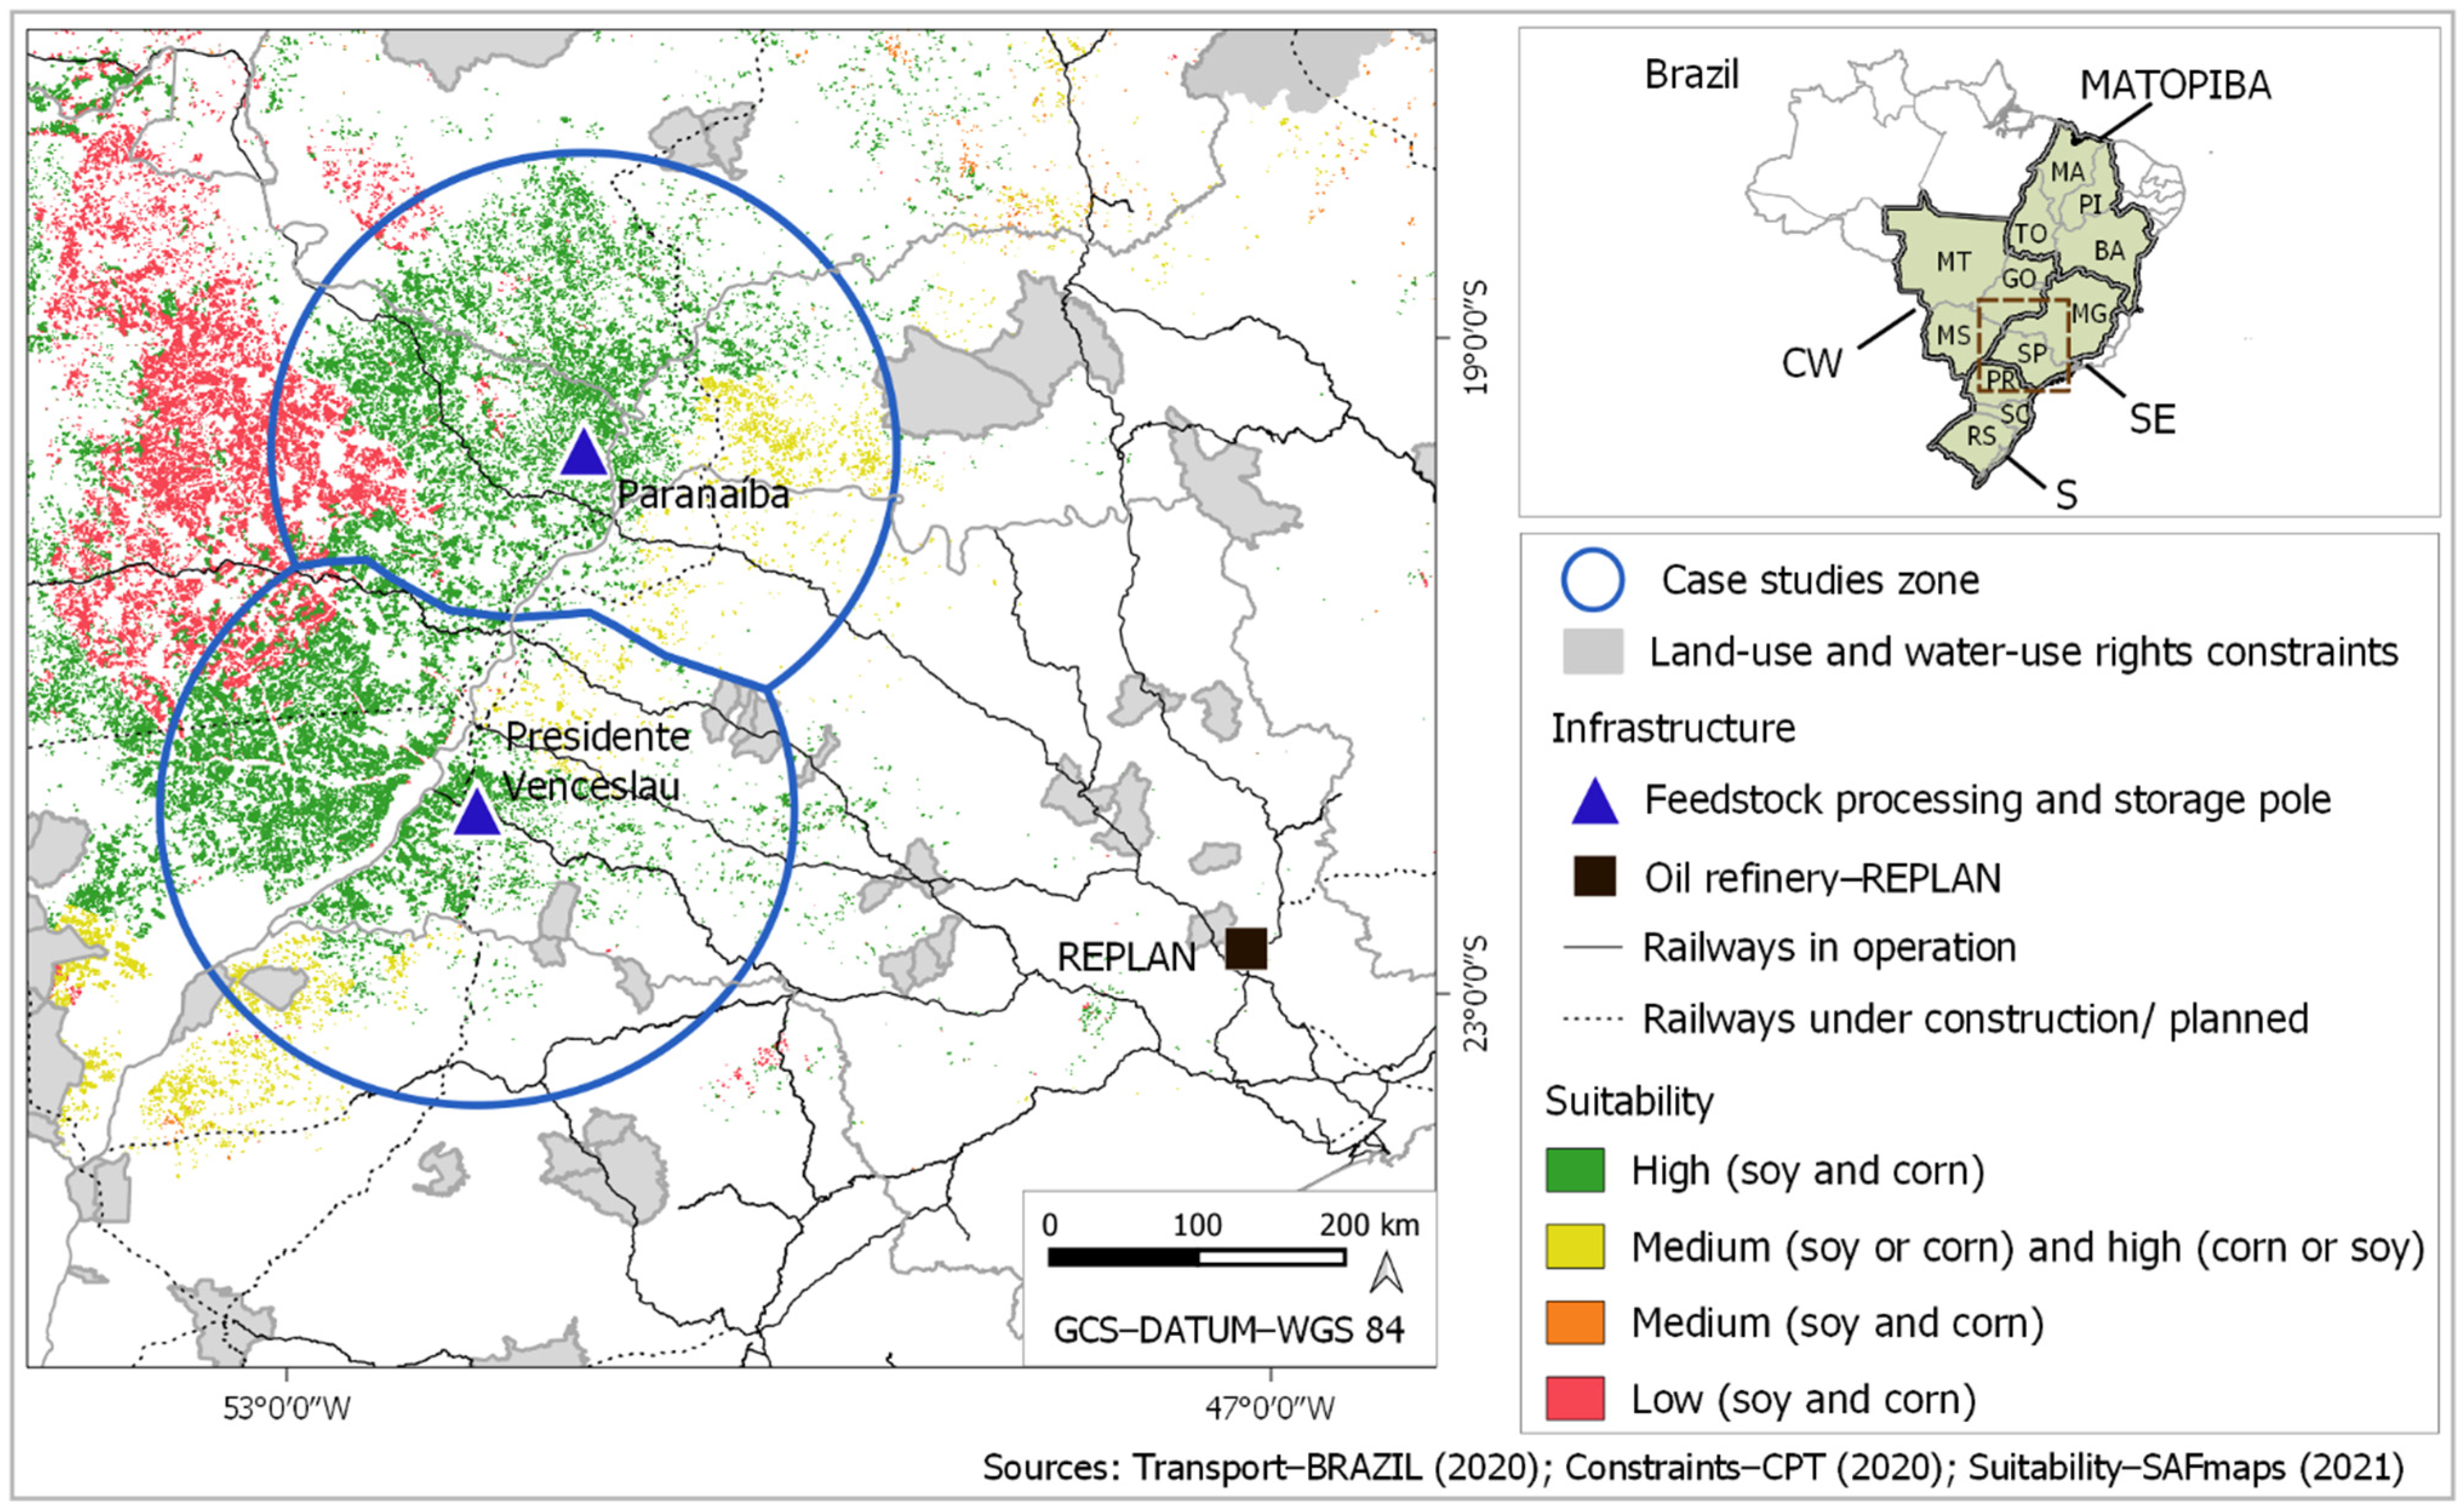
2.3. Construction of Case Studies
2.4. Estimative of Feedstocks’ Transport Costs
2.5. Industrial Parameters
3. Results
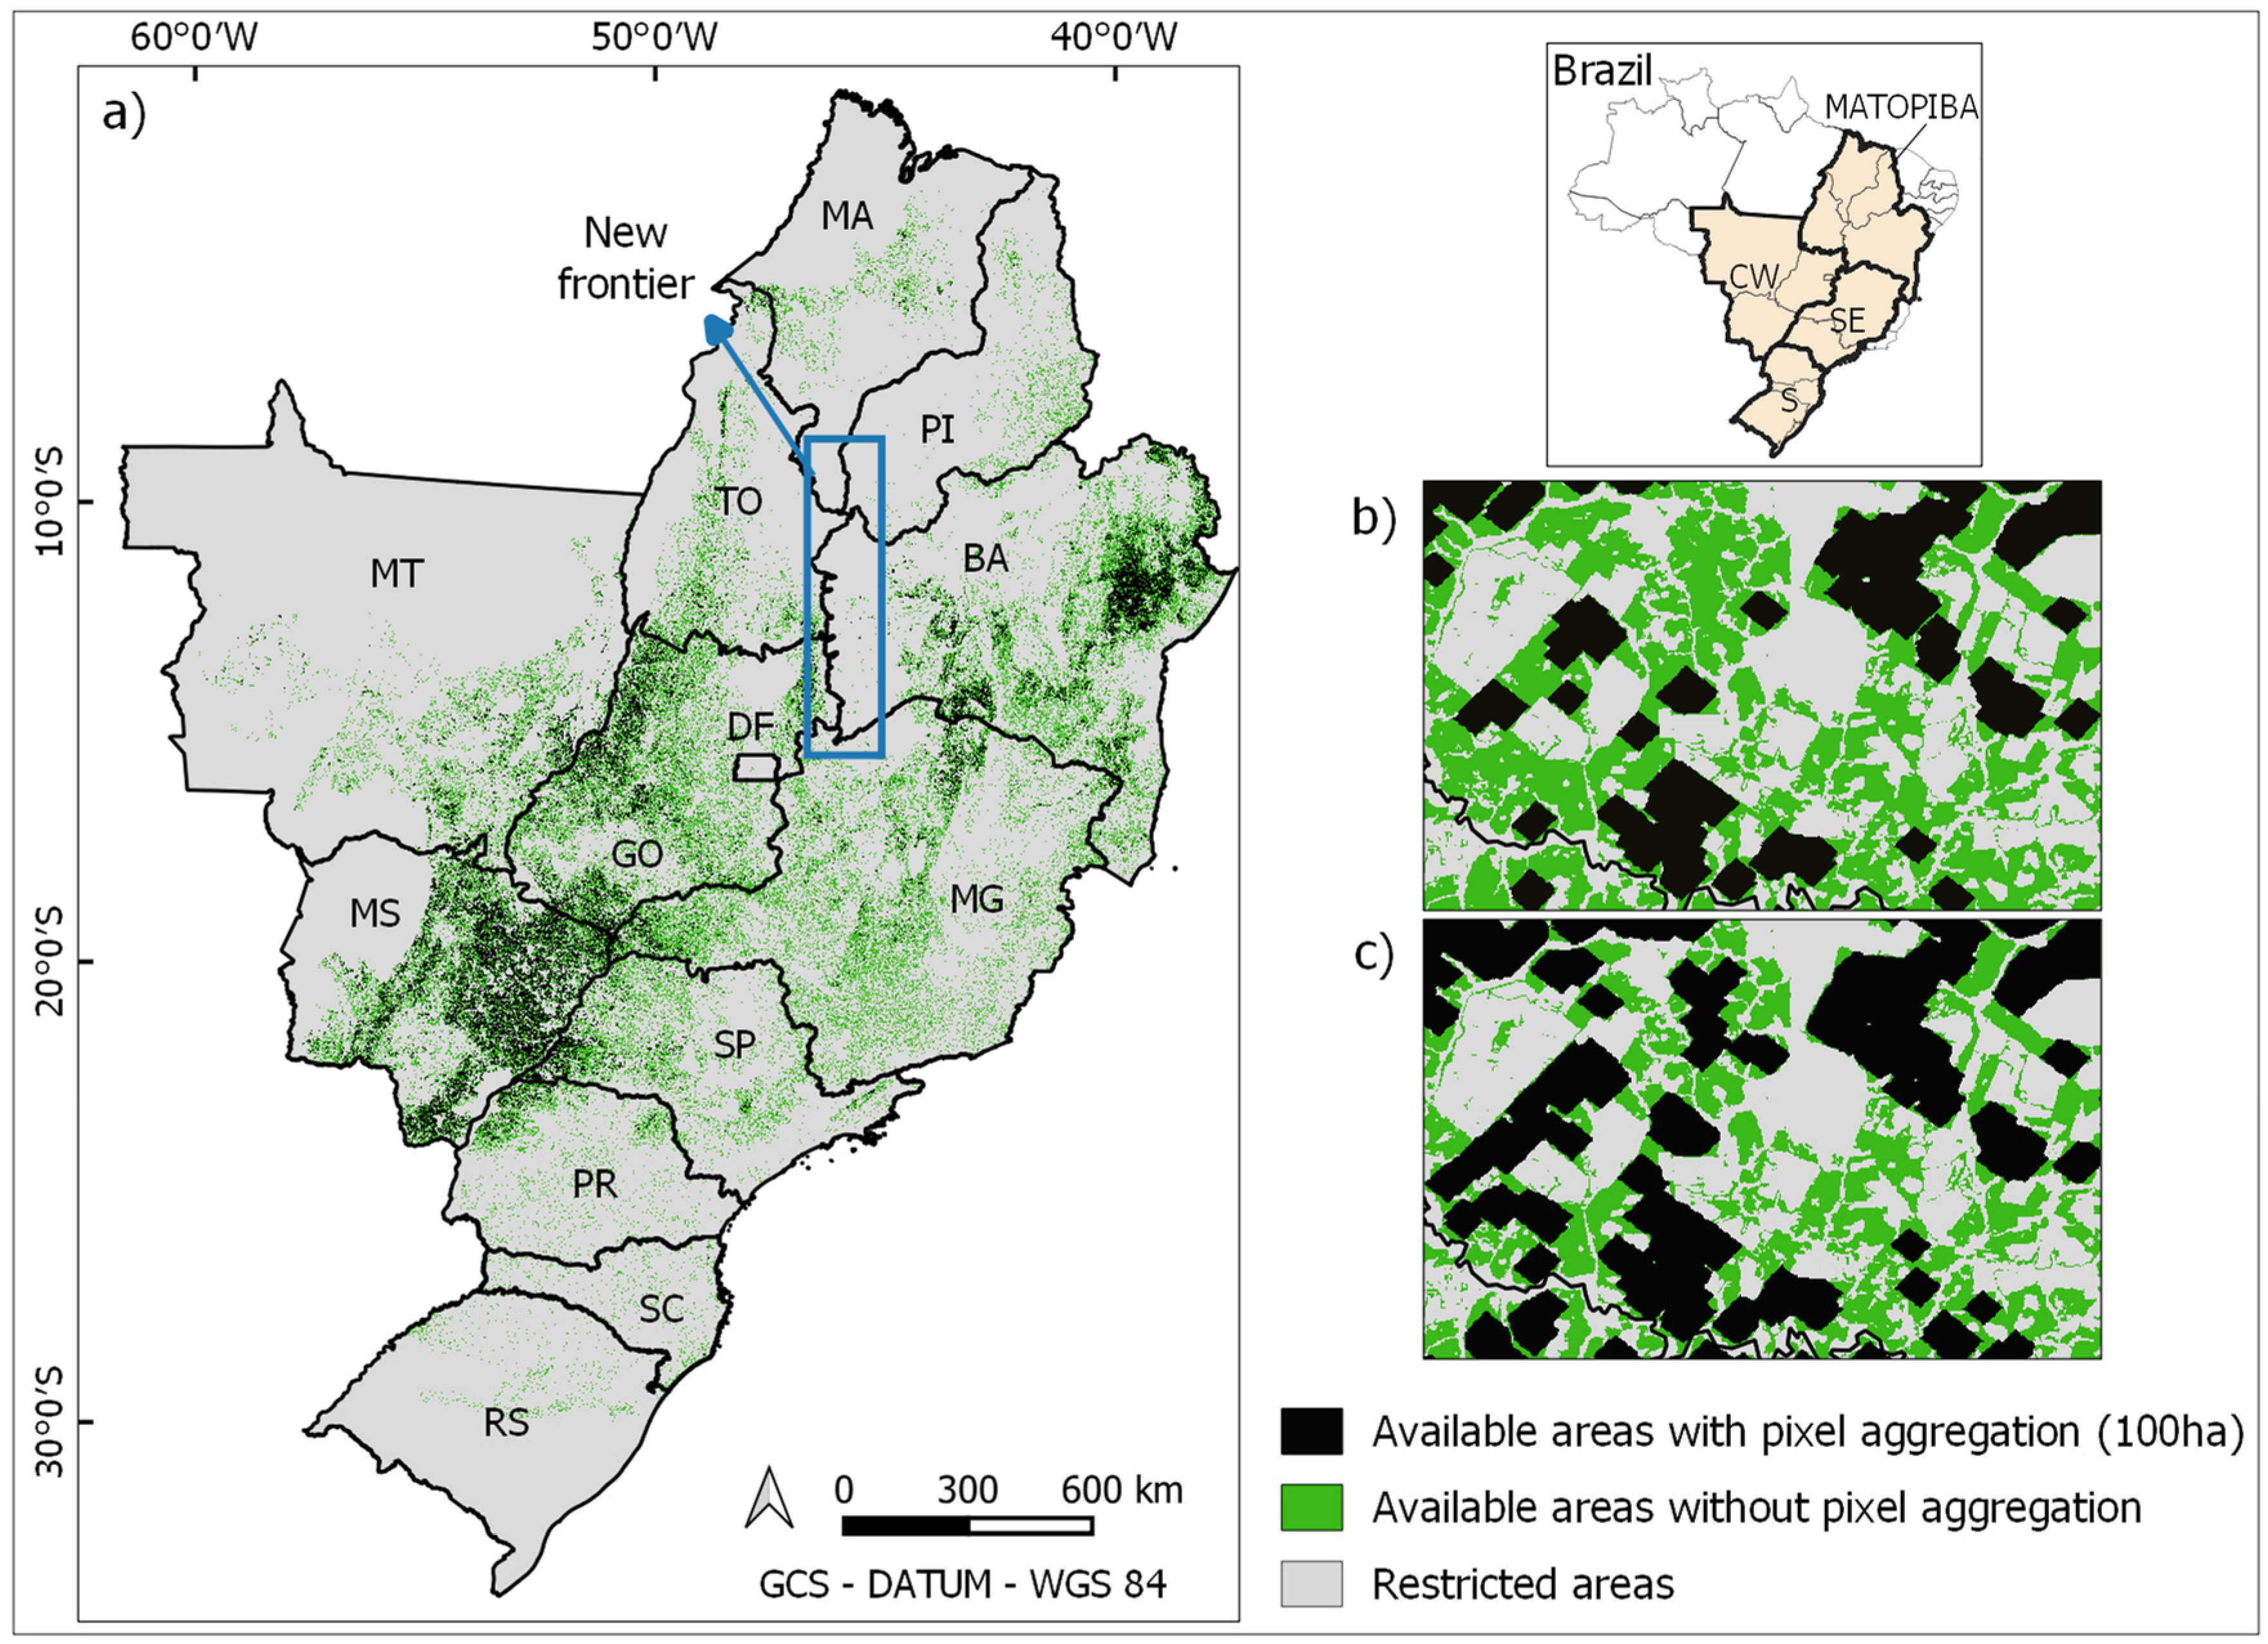
3.1. Areas Available for the Potential Expansion of Soy
3.2. Results of Case Studies
4. Discussion
4.1. The Expansion of Soy Production and the Perception of Deforestation
4.2. SAF Results and the Conditioning of Sustainability
5. Conclusions
Supplementary Materials
Author Contributions
Funding
Informed Consent Statement
Data Availability Statement
Acknowledgments
Conflicts of Interest
References
- Mapbiomas. Map and Data Platform. Brasil Collections 4.1, 5.0 and 6.0. Available online: https://mapbiomas.org/ (accessed on 2 October 2020).
- Song, X.-P.; Hansen, M.C.; Potapov, P.; Adusei, B.; Pickering, J.; Adami, M.; Lima, A.; Zalles, V.; Stehman, S.V.; Di Bella, C.M.; et al. Massive Soybean Expansion in South America since 2000 and Implications for Conservation. Nat. Sustain. 2021, 4, 784–792. [Google Scholar] [CrossRef] [PubMed]
- Agrosatélite Geotecnologia Aplicada Ltda. Análise Geoespacial da Soja No BIOMA Cerrado: Dinâmica da Expansão | Aptidão Agrícola da Soja | Sistema de Avaliação para Compensação Financeira: 2001 a 2019; Agrosatélite Geotecnologia Aplicada Ltda: Florianópolis, Brazil, 2020; p. 60. [Google Scholar]
- da Silva Junior, C.A.; Leonel-Junior, A.H.S.; Rossi, F.S.; Correia Filho, W.L.F.; de Barros Santiago, D.; Oliveira-Júnior, J.F.D.; Teodoro, P.E.; Lima, M.; Capristo-Silva, G.F. Mapping Soybean Planting Area in Midwest Brazil with Remotely Sensed Images and Phenology-Based Algorithm Using the Google Earth Engine Platform. Comput. Electron. Agric. 2020, 169, 105194. [Google Scholar] [CrossRef]
- Paludo, A.; Becker, W.R.; Richetti, J.; Silva, L.C.D.A.; Johann, J.A. Mapping Summer Soybean and Corn with Remote Sensing on Google Earth Engine Cloud Computing in Parana State—Brazil. Int. J. Digit. Earth 2020, 13, 1624–1636. [Google Scholar] [CrossRef]
- Rudorff, B.; Risso, J.; Baldi, C.; Aguiar, D.; Salgado, M.; Perrut, J.; Oliveira, L.; Virtuoso, M.; Cabral, G.; Rosa, O.; et al. Geospatial Analysis of Soy Expansion, Associated Land Use and Land Cover Change, and Agricultural Suitability in the Brazilian Amazon Biome—2000 to 2017; Agrosatélite Applied Geotechnology Ltda: Florianópolis, Brazil, 2018; p. 40. [Google Scholar]
- IBGE—Instituto Brasileiro de Geografia e Estatística. Sistema IBGE de Recuperação Automática—SIDRA. Available online: https://sidra.ibge.gov.br/home/cnt/brasil (accessed on 2 November 2021).
- FAO Statistics. FAOSTAT. Available online: https://www.fao.org/faostat/en/#home (accessed on 2 December 2021).
- CONAB—Companhia Nacional de Abastecimento. Available online: https://www.conab.gov.br/ (accessed on 2 December 2021).
- Soterroni, A.C.; Ramos, F.M.; Mosnier, A.; Fargione, J.; Andrade, P.R.; Baumgarten, L.; Pirker, J.; Obersteiner, M.; Kraxner, F.; Câmara, G.; et al. Expanding the Soy Moratorium to Brazil’s Cerrado. Sci. Adv. 2019, 5, eaav7336. [Google Scholar] [CrossRef] [PubMed] [Green Version]
- Rausch, L.; Gibbs, H.; Schelly, I.; Brandão Junior, A.; Morton, D.; Carneiro Filho, A.; Strassburg, B.; Walker, N.; Noojipady, P.; Barreto, P.; et al. Soy Expansion in Brazil’s Cerrado. Conserv. Lett. 2019, 12, e12671. [Google Scholar] [CrossRef]
- Lapola, D.M.; Schaldach, R.; Alcamo, J.; Bondeau, A.; Koch, J.; Koelking, C.; Priess, J.A. Indirect Land-Use Changes Can Overcome Carbon Savings from Biofuels in Brazil. Proc. Natl. Acad. Sci. USA 2010, 107, 3388–3393. [Google Scholar] [CrossRef] [Green Version]
- Berndes, G.; Bird, N.; Cowie, A. Bioenergy, Land Use Change and Climate Change Mitigation: Background Technical Report (No. ExCo:2011:04); Background Technical Report; IEA Bioenergy: Rotorua, New Zealand, 2011; p. 62. [Google Scholar]
- Picoli, M.C.A.; Rorato, A.; Leitão, P.; Camara, G.; Maciel, A.; Hostert, P.; Sanches, I.D. Impacts of Public and Private Sector Policies on Soybean and Pasture Expansion in Mato Grosso—Brazil from 2001 to 2017. Land 2020, 9, 20. [Google Scholar] [CrossRef] [Green Version]
- Trase Insights—Yearbook. Available online: https://insights.trase.earth/yearbook/contexts/brazil-soy (accessed on 2 January 2022).
- da Silva PC, G.; Tiritan, C.S.; Echer, F.R.; dos Santos Cordeiro, C.F.; Rebonatti, M.D.; dos Santos, C.H. No-Tillage and Crop Rotation Increase Crop Yields and Nitrogen Stocks in Sandy Soils under Agroclimatic Risk. Field Crops Res. 2020, 258, 107947. [Google Scholar] [CrossRef]
- dos SCordeiro, C.F.; Batista, G.D.; Lopes, B.P.; Echer, F.R. Interactive Effects of Nitrogen-Fixing Bacteria Inoculation and Nitrogen Fertilization on Soybean Yield in Unfavorable Edaphoclimatic Environments. Sci. Rep. 2019, 9, 15606. [Google Scholar] [CrossRef] [Green Version]
- Cordeiro CF, D.S.; Batista, G.D.; Lopes, B.P.; Echer, F.R. Cover Crop Increases Soybean Yield Cropped after Degraded Pasture in Sandy Soil. Rev. Bras. Eng. Agrícola Ambient. 2021, 25, 514–521. [Google Scholar] [CrossRef]
- Alkimim, A.; Sparovek, G.; Clarke, K.C. Converting Brazil’s Pastures to Cropland: An Alternative Way to Meet Sugarcane Demand and to Spare Forestlands. Appl. Geogr. 2015, 62, 75–84. [Google Scholar] [CrossRef]
- Bergtold, J.S.; Caldas, M.M.; Sant’anna, A.C.; Granco, G.; Rickenbrode, V. Indirect Land Use Change from Ethanol Production: The Case of Sugarcane Expansion at the Farm Level on the Brazilian Cerrado. J. Land Use Sci. 2017, 12, 442–456. [Google Scholar] [CrossRef]
- Borchers, A.; Truex-Powell, E.; Wallander, S.; Nickerson, C. Multi-Cropping Practices: Recent Trends in Double-Cropping; EIB-125; U.S. Department of Agriculture, Economic Research Service: Washington, DC, USA, 2014; pp. 1–22. [Google Scholar]
- IATA—International Air Transport Association. Climate Change. Available online: www.iata.org/en/programs/environment/climate-change (accessed on 3 August 2021).
- ICAO—International Civil Aviation Organization. ICAO Document Series. Available online: https://www.icao.int/environmental-protection/CORSIA/Pages/CORSIA-Eligible-Fuels.aspx (accessed on 2 December 2020).
- ASTM D7566-21. Standard Specification for Aviation Turbine Fuel Containing Synthesized Hydrocarbons; ASTM International: West Conshohocken, PA, USA, 2020. [Google Scholar]
- IRENA. Reaching Zero with Renewables: Biojet Fuels; International Renewable Energy Agency: Abu Dhabi, United Arab Emirates, 2021; pp. 1–96. [Google Scholar]
- van Dyk, S.; Saddler, J. Progress in Commercialization of Biojet/Sustainable Aviation Fuels (SAF): Technologies, Potential and Challenges. IEA Bioenergy Task 39; IEA Bioenergy: Rotorua, New Zealand, 2021; pp. 1–95. [Google Scholar]
- SAFmaps. Project Web Page. Available online: http://www.safmaps.com/ (accessed on 2 December 2020).
- Walter, A.; Seabra, J.; Rocha, J.; Guarenghi, M.; Vieira, N.; Damame, D.; Santos, J.L. Spatially Explicit Assessment of Suitable Conditions for the Sustainable Production of Aviation Fuels in Brazil. Land 2021, 10, 705. [Google Scholar] [CrossRef]
- Walter, A.; Seabra, J.; Rocha, J.; Guarenghi, M.; Vieira, N.; Damame, D.; Santos, J.L. Spatially Explicit Assessment of the Feasibility of Sustainable Aviation Fuels Production in Brazil: Results of Three Case Studies. Energies 2021, 14, 4972. [Google Scholar] [CrossRef]
- Walter, A.; Seabra, J.; Rocha, J.; Guarenghi, M.; Vieira, N.; Damame, D.; Santos, J. Bio-Jet Fuels Production from Macaw Oil Palm in Brazil: An Assessment Based on a Comprehensive Database of Feedstocks. In Proceedings of the European Biomass Conference and Exhibition, Virtual Conference, ETA, Florence, Italy, 26–29 April 2021; pp. 45–56. [Google Scholar] [CrossRef]
- Chaves, M.E.D.; De Carvalho Alves, M.; De Oliveira, M.S.; Sáfadi, T. A Geostatistical Approach for Modeling Soybean Crop Area and Yield Based on Census and Remote Sensing Data. Remote Sens. 2018, 10, 680. [Google Scholar] [CrossRef] [Green Version]
- Branco, J.E.H.; Bartholomeu, D.B.; Alves Junior, P.N.; Caixeta Filho, J.V. Mutual Analyses of Agriculture Land Use and Transportation Networks: The Future Location of Soybean and Corn Production in Brazil. Agric. Syst. 2021, 194, 103264. [Google Scholar] [CrossRef]
- FAO—Food and Agriculture Organization of the United Nations. The Future of Food and Agriculture: Trends and Challenges; FAO: Rome, Italy, 2017; pp. 1–180. [Google Scholar]
- Duarte, A.P.; Carvalho, C.R.L.; Cavichioli, J.C. Densidade, teor de óleo e produtividade de grãos em híbridos de milho. Bragantia 2008, 67, 759–767. [Google Scholar] [CrossRef] [Green Version]
- Mittelmann, A.; de Filho, J.B.M.; de Lima, G.J.M.M.; Hara-Klein, C.; da Silva, R.M.; Tanaka, R.T. Análise Dialética do teor de óleo e milho. Curr. Agric. Sci. Technol. 2006, 12, 139–143. [Google Scholar] [CrossRef]
- Agrianual. Private Database on Agribusiness. Available online: http://www.agrianual.com.br/ (accessed on 12 March 2020).
- Walter, A.; Seabra, J.; Rocha, J.; Guarenghi, M.; Vieira, N.; Dalmane, D.; Santos, J.L. SAFmaps-Soybean, Mendeley Data, 2021, 1. Available online: https://data.mendeley.com/datasets/jpwggmp9zy/3 (accessed on 2 December 2020). [CrossRef]
- FAO—Food and Agriculture Organization of the United Nations. Crop Ecological Requirements Database (ECOCROP); FAO: Rome, Italy; Available online: https://www.fao.org/land-water/land/land-governance/land-resources-planning-toolbox/category/details/en/c/1027491/ (accessed on 18 April 2021).
- Alvares, C.A.; Stape, J.L.; Sentelhas, P.C.; de Moraes Gonçalves, J.L.; Sparovek, G. Köppen’s Climate Classification Map for Brazil. Meteorol. Z. 2013, 22, 711–728. [Google Scholar] [CrossRef]
- Manzatto, C.; Freitas-Junior, E.; Peres, J.R.R. Uso Agrícola dos Solos Brasileiros; Portal Embrapa; Embrapa Solos: Rio de Janeiro, Brazil, 2002; pp. 1–184. [Google Scholar]
- IBGE—Instituto Brasileiro de Geografia e Estatística. Mapeamento de Recursos Naturais Do Brasil. Escala 1:250.000. Pedologia. Versão 2019. Available online: https://geoftp.ibge.gov.br/informacoes_ambientais/pedologia/vetores/escala_250_mil/ (accessed on 3 February 2020).
- ABIOVE—Associação Brasileira das Indústrias Óleos Vegetais. Statistics Database. Available online: https://abiove.org.br/ (accessed on 3 February 2020).
- BRAZIL-Ministério do Meio Ambiente. Download de Dados Geográficos. Available online: http://mapas.mma.gov.br/i3geo/datadownload.htm (accessed on 12 February 2020).
- ICMBio-SIMRPPM. Reservas Particulares do Patrimônio Natural. Available online: https://sistemas.icmbio.gov.br/simrppn/publico/ (accessed on 12 February 2020).
- FUNAI—Fundação Nacional do Índio. Geoprocessamento e Mapas. Available online: https://www.gov.br/funai/pt-br/atuacao/terras-indigenas/geoprocessamento-e-mapas (accessed on 12 March 2020).
- INCRA—Instituto Nacional de Colonização e Reforma Agrária. Acervo Fundiário. Available online: https://acervofundiario.incra.gov.br/i3geo/interface/openlayers.htm (accessed on 12 March 2020).
- TOPODATA. Banco de Dados Geomorfométricos Do Brasil. Available online: http://www.dsr.inpe.br/topodata/ (accessed on 3 February 2020).
- Lima, M.; Skutsch, M.; de Medeiros Costa, G. Deforestation and the Social Impacts of Soy for Biodiesel: Perspectives of Farmers in the South Brazilian Amazon. Ecol. Soc. 2011, 16, 4. [Google Scholar] [CrossRef] [Green Version]
- Rodrigues, M.; Campos, I. Soybean Cropping by Family Farmers: A New Institutional Path for Rural Development in Brazilian Central-West. Italian Rev. Agric. Econ. 2019, 74, 29–39. [Google Scholar] [CrossRef]
- Jung, M. LecoS—A Python Plugin for Automated Landscape Ecology Analysis. Ecol. Inform. 2016, 31, 18–21. [Google Scholar] [CrossRef]
- LAPIG—Laboratório de Processamento de Imagens e Geoprocessamento. Atlas Digital das Pastagens Brasileiras. Available online: https://pastagem.org/map (accessed on 20 September 2020).
- Oliveira-Santos, C.; Mesquita, V.V.; Parente, L.L.; de Siqueira Pinto, A.; Ferreira, L.G. Assessing the Wall-to-Wall Spatial and Qualitative Dynamics of the Brazilian Pasturelands 2010–2018, Based on the Analysis of the Landsat Data Archive. Remote Sens. 2022, 14, 1024. [Google Scholar] [CrossRef]
- CPT—Comissão Pastoral da Terra. Massacres No Campo. Available online: https://www.cptnacional.org.br/ (accessed on 12 March 2020).
- Walter, A.; Seabra, J.; Rocha, J.; Guarenghi, M.; Vieira, N.; Dalmane, D.; Santos, J.L. SAFmaps—Corn, Mendeley Data, 2021, 1. Available online: https://data.mendeley.com/datasets/g25wt3t7k5/1 (accessed on 10 March 2020). [CrossRef]
- BRAZIL. Cartas e Mapas. Bases Cartográficas Contínuas. Versao 2019. Available online: http://geoftp.ibge.gov.br/cartas_e_mapas/bases_cartograficas_continuas/bc250/versao2019/shapefile/ (accessed on 10 March 2020).
- BRAZIL. Mapas e Bases Dos Modos de Transportes—Português (Brasil). Available online: https://www.gov.br/infraestrutura/pt-br/assuntos/dados-de-transportes/bit/bitmodosmapas (accessed on 10 March 2020).
- IEMA—Instituto Energia e Meio Ambiente. Reservatórios Verdes. São Paulo, Brazil, 2017. Available online: https://Energiaeambiente.Org.Br/Produto/Estudo-de-Pre-Viabilidade-Potencial-Do-Uso-de-Florestas-de-Eucalyptus-Na-Geracao-de-Eletricidade-No-Brasil (accessed on 10 March 2020).
- de Jong, S.; Hoefnagels, R.; Wetterlund, E.; Pettersson, K.; Faaij, A.; Junginger, M. Cost Optimization of Biofuel Production—The Impact of Scale, Integration, Transport and Supply Chain Configurations. Appl. Energy 2017, 195, 1055–1070. [Google Scholar] [CrossRef] [Green Version]
- Lemos, R. Custos do Transporte Ferroviário; Instituto Brasil Logístico: São Paulo, Brazil, 2020; Available online: https://institutobrasillogistico.com.br/2020/01/29/custos-do-transporte-ferroviario/ (accessed on 12 March 2020).
- Forkenbrock, D.J. External Costs of Truck and Rail Freight Transportation; Public Policy Center, University of Iowa Press: Iowa City, LA, USA, 1998. [Google Scholar]
- Leite, C.; Bittencourt, J.; Pereira, L.; Marinho, C. Análise Comparativa Custos Entre Os Meios de Transporte Rodoviário e Ferroviário. In Proceedings of the Congresso Nacional de Excelência em Gestão, São Paulo, Brazil, 29–30 September 2016. [Google Scholar]
- de Jong, S.; Hoefnagels, R.; Faaij, A.; Slade, R.; Mawhood, R.; Junginger, M. The Feasibility of Short-Term Production Strategies for Renewable Jet Fuels—A Comprehensive Techno-Economic Comparison. Biofuels Bioprod. Biorefin. 2015, 9, 778–800. [Google Scholar] [CrossRef]
- de Jong, S.; Antonissen, K.; Hoefnagels, R.; Lonza, L.; Wang, M.; Faaij, A.; Junginger, M. Life-Cycle Analysis of Greenhouse Gas Emissions from Renewable Jet Fuel Production. Biotechnol. Biofuels 2017, 10, 64. [Google Scholar] [CrossRef] [Green Version]
- Chemical Engineering. Chemical Engineering Price Cost Index. Available online: https://www.chemengonline.com/2019-cepci-updates-january-prelim-and-december-2018-final/ (accessed on 10 December 2019).
- Araújo, M.L.S.; de Sano, E.E.; Bolfe, É.L.; Santos, J.R.N.; dos Santos, J.S.; Silva, F.B. Spatiotemporal Dynamics of Soybean Crop in the Matopiba Region, Brazil (1990–2015). Land Use Policy 2019, 80, 57–67. [Google Scholar] [CrossRef]
- Zalles, V.; Hansen, M.C.; Potapov, P.V.; Stehman, S.V.; Tyukavina, A.; Pickens, A.; Song, X.-P.; Adusei, B.; Okpa, C.; Aguilar, R.; et al. Near Doubling of Brazil’s Intensive Row Crop Area since 2000. Proc. Natl. Acad. Sci. USA 2019, 116, 428–435. [Google Scholar] [CrossRef] [Green Version]
- Alencar, A.; Shimbo, J.Z.; Lenti, F.; Balzani Marques, C.; Zimbres, B.; Rosa, M.; Arruda, V.; Castro, I.; Fernandes Márcico Ribeiro, J.P.; Varela, V.; et al. Mapping Three Decades of Changes in the Brazilian Savanna Native Vegetation Using Landsat Data Processed in the Google Earth Engine Platform. Remote Sens. 2020, 12, 924. [Google Scholar] [CrossRef] [Green Version]
- de Espindola, G.M.; de Aguiar, A.P.D.; Pebesma, E.; Câmara, G.; Fonseca, L. Agricultural Land Use Dynamics in the Brazilian Amazon Based on Remote Sensing and Census Data. Appl. Geography 2012, 32, 240–252. [Google Scholar] [CrossRef]
- Polizel, S.P.; Vieira RM DS, P.; Pompeu, J.; da Cruz Ferreira, Y.; de Sousa-Neto, E.R.; Barbosa, A.A.; Ometto, J.P.H.B. Analysing the Dynamics of Land Use in the Context of Current Conservation Policies and Land Tenure in the Cerrado—MATOPIBA Region (Brazil). Land Use Policy 2021, 109, 105713. [Google Scholar] [CrossRef]
- Carneiro-Filho, A.; Costa, K. The Expansion of Soybean Production in the Cerrado: Paths to Sustainable Territorial Occupation, Land Use and Production; INPUT and Agroicone: São Paulo, Brazil, 2016; pp. 1–30. [Google Scholar]
- Sawyer, D.; Mesquita, B.; Coutinho, B.; Almeida, F.V.; Figueiredo, I.; Lamas, I.; Pereira, L.E.; Pinto, L.P.; Pires, M.O.; Kasecker, T.; et al. Ecosystem Profile of the Cerrado Ecosystem Biodiversity Hotspot: Full Report. In Critical Ecosystem Partnership Fund; Supernova: Brasília, Brazil, 2017. [Google Scholar]
- Russo Lopes, G.; Bastos Lima, M.G.; Reis, T.N.P. dos Maldevelopment Revisited: Inclusiveness and Social Impacts of Soy Expansion over Brazil’s Cerrado in Matopiba. World Dev. 2021, 139, 105316. [Google Scholar] [CrossRef]
- Nakagawa, L.; Pó, M.; Seifer, P.; Kleeb, S. Entre Chapadas e Baixões do MATOPIBA-Dinâmicas Territoriais e Impactos Socioeconômicos na Fronteira da Expansão Agropecuária no Cerrado; Favareto, A., Ed.; Greenpeace and Ilustre Editora: São Paulo, Brazil, 2019. [Google Scholar]
- Wiegmann, K.; Hennenberg, K.; Fritsche, U.R. Degraded Land and Sustainable Bioenergy Feedstock Production: Issue Paper; Öko-Institut: Darmstadt, Germany, 2008; pp. 1–12. [Google Scholar]
- Sumfleth, B.; Majer, S.; Thrän, D. Recent Developments in Low ILUC Policies and Certification in the EU Biobased Economy. Sustainability 2020, 12, 8147. [Google Scholar] [CrossRef]
- Ben Aoun, W.; Gabrielle, B. Chapter 8—Life Cycle Assessment and Land-Use Changes: Effectiveness and Limitations. In Life-Cycle Assessment of Biorefineries; Elsevier: Amsterdam, The Netherlands; Academic Press: Cambridge, MA, USA, 2017; pp. 221–231. [Google Scholar]
- ANP—Agência Nacional de Petróleo, Gás Natural e Biocombustíveis. Statistic Database. Available online: http://www.anp.gov.br/dados-estatisticos (accessed on 12 April 2021).


| Base Map | Procedures and Criteria |
|---|---|
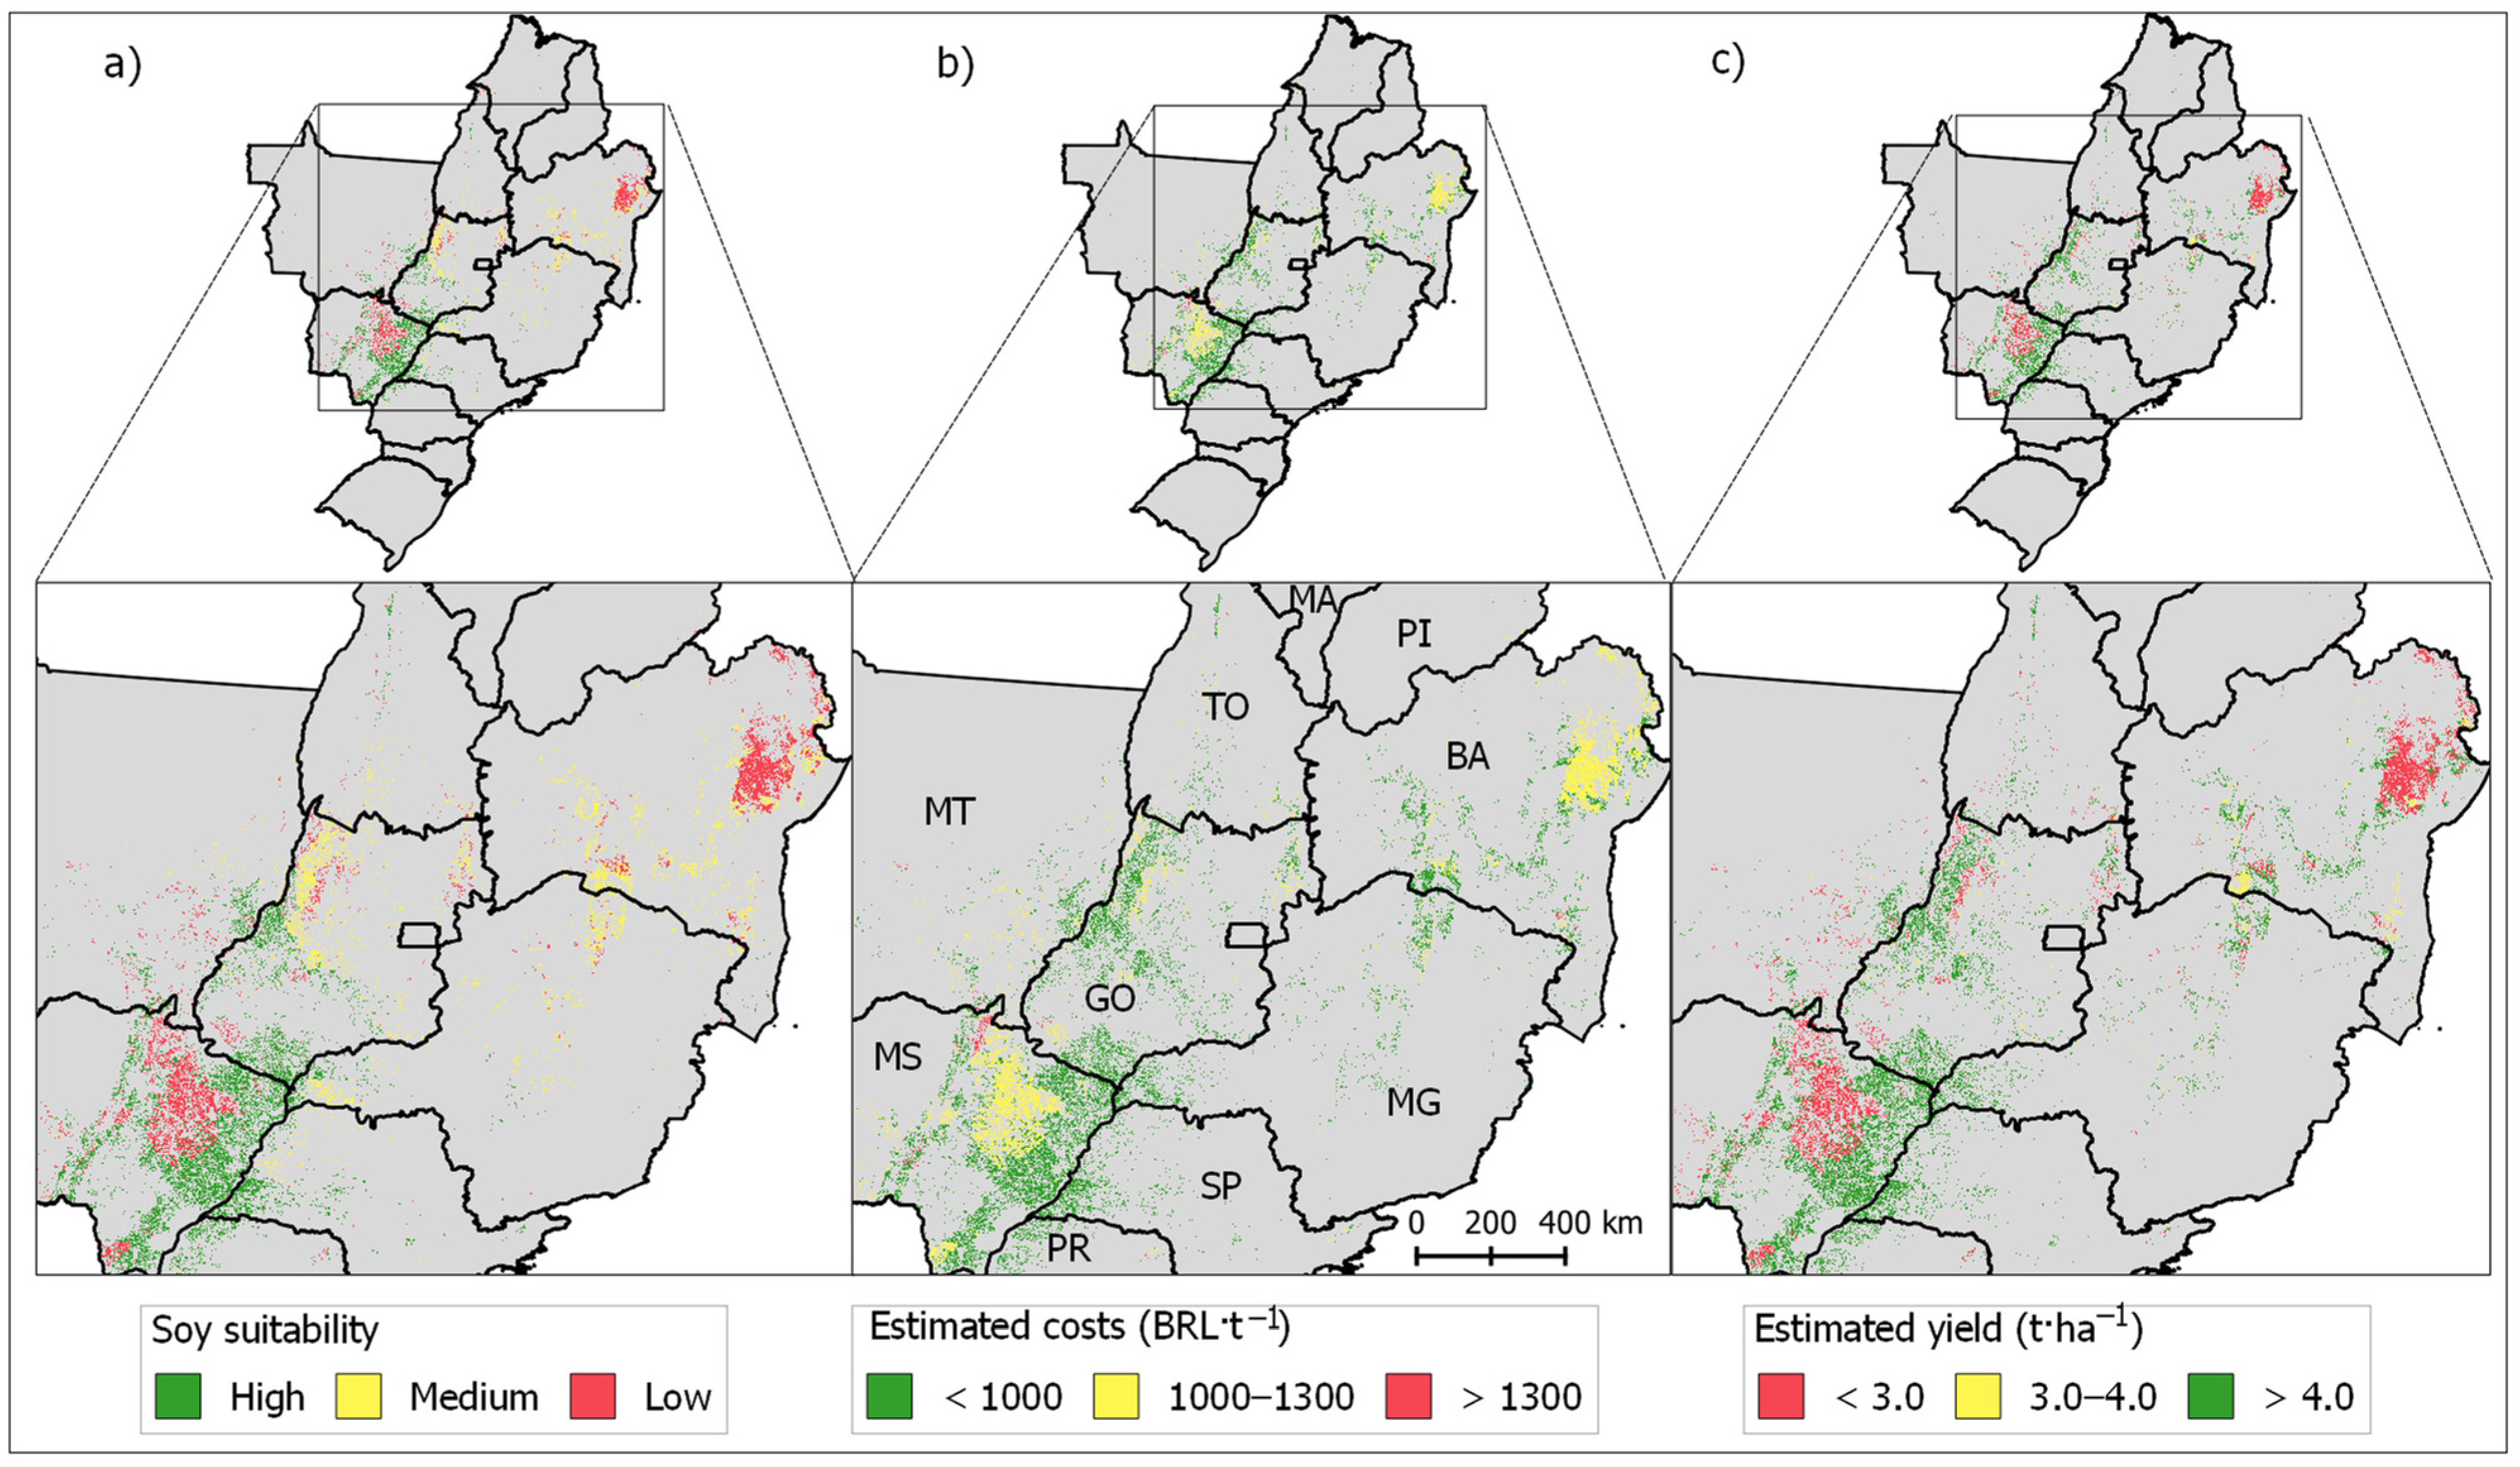
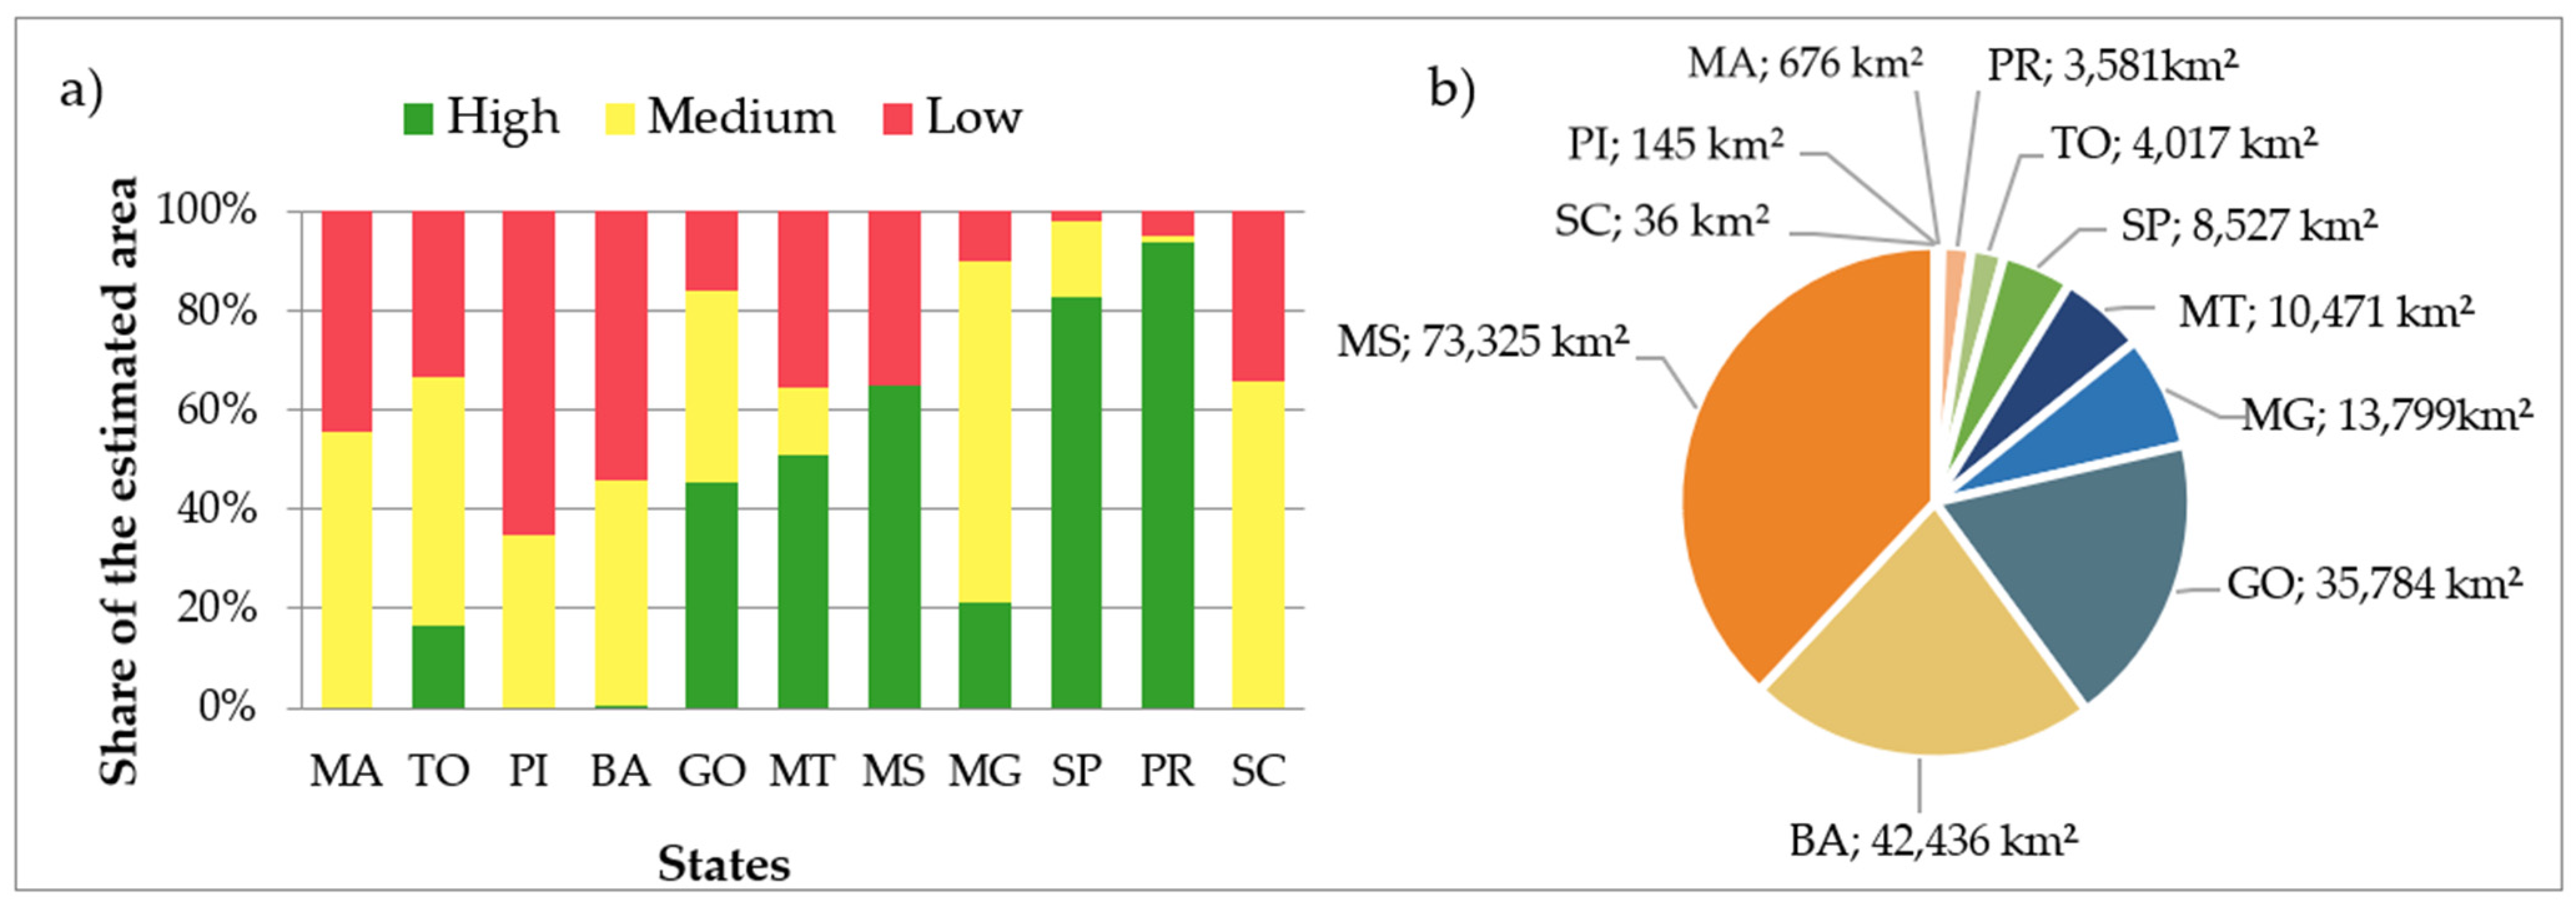
| Suitability | Based on climatic conditions (mainly rainfall and atmospheric temperature), altitude, soil suitability and slope, using a Boolean classification. The climatic suitability criteria were determined according to the crop requirements database of [38], using climatic data from [39], considering the planting period from September to January. The altitude criterion was defined based on the location of the largest soybean areas in Brazil, using data presented in [39]. The slopes considered suitable are less than 13%, taking into account the objective of total mechanization; a digital elevation model presented in [40] was used to obtain the slope of the terrain. The soil classification according to the suitability for agriculture was defined based on soil characteristics described in [40] and the soil map available in [41] was used to spatialize the information. Each parameter was classified into three groups (low, medium, and high suitability). All the information was presented in raster format, with spatial resolution of 30 m × 30 m, and the maps were combined spatially. A pixel was classified as “low suitability” if at least one parameter presented low conditions to cultivation, “medium” if at least one parameter was classified as marginal (and not low), and “high” if the suitability of the pixel was adequate for all parameters. The final map presents the areas classified in low, medium, and high suitability for soybean production. Municipal cultivation data [7] and the map of soybean production in 2018 [1] were also used in the validation procedure. |
| Estimated soybean yield | A statistical regression model on a municipal basis was constructed between current soybean yields [7] and a set of explanatory variables (e.g., rainfall and temperature over the period of growth). For SAF production, only transgenic soy was considered. Dummy variables were introduced into the model to differentiate the best from worst average yield values. The municipal data were combined with the suitability map and the validation procedure was carried out with current data at the municipal level (average values) [7]. |
| Expected costs of soybean production | The agricultural costs of soybean production, in BRL (2018), were estimated considering new production areas and that the expansion of the soybean crop would occur only with the displacement of pastures. The costs are based on cost structures presented by [36] for different producing regions. Costs comprise sowing, crop management, harvest, short-term grain storage, and land prices (land used as pastures). The estimated values were compared to the information available in [36] and to market prices presented in [36,42], for validation. |
| Parameters | Units 1 | Values |
|---|---|---|
| Industrial yield | tf−1) | 0.83 |
| Industrial yield | tf−1) | 120.0 |
| Input capacity | day−1) | 2500 |
| Hydrocarbon production | day−1) | 2075 |
| SAF production | day−1) | 300.1 |
| Procedure | No Aggregation | Remaining Areas after Pixel Smoothing and Aggregation (100 ha) Procedure | |||||||
|---|---|---|---|---|---|---|---|---|---|
| Available Area | Available Area | Estimated Costs | Estimated Yield | Shares of Degraded Land a | |||||
| Region | Area (km2) | Area (km2) | (%) a | Average (BRLt−1) | Median (BRLt−1) | Average (BRLt−1) | Median (BRLt−1) | Moderate (%) | Severe (%) |
| Center-West (CW) | 288,232 | 119,580 | 62 | 811 | 604 | 3.8 | 4.5 | 24 | 21 |
| MATOPIBA | 192,819 | 47,274 | 25 | 980 | 1264 | 3.2 | 2.2 | 14 | 64 |
| Southeast (SE) | 180,749 | 22,326 | 12 | 665 | 604 | 4.3 | 4.5 | 22 | 38 |
| South (S) | 34,387 | 3617 | 2 | 677 | 604 | 4.6 | 4.5 | 28 | 19 |
| Total | 696,187 | 192,797 | 100 | ||||||
| No Additional Restriction | Only in Degraded Pasturelands a | |||||||
|---|---|---|---|---|---|---|---|---|
| Paranaíba | Presidente Venceslau | Paranaíba | Presidente Venceslau | |||||
| Soy | Corn | Soy | Corn | Soy | Corn | Soy | Corn | |
| Case studies | 1 and 2a | 2a | 1 and 2a | 2a | 2b | 2b | 2b | 2b |
| Area available for production (km2) | 20,468 | 20,468 | 21,124 | 21,124 | 3972 | 3972 | 3517 | 3517 |
| Cultivable area compared to total (%) | 18% | 18% | 17% | 17% | 3% | 3% | 3% | 3% |
| year−1) (grain) | 9270 | 12,536 | 9515 | 12,808 | 1798 | 2433 | 1583 | 2145 |
| year−1) (soy oil) b | 1948 | – | 1999 | – | 365 | – | 321 | – |
| ha−1·year−1) (grain) | 4.53 | 6.12 | 4.50 | 6.11 | 4.53 | 6.13 | 4.50 | 6.10 |
| t−1) | 146.9 | 87.4 | 150.4 | 93.5 | 146.8 | 86.8 | 147.6 | 94.5 |
| Regions of Soy (and Corn) Production | Paranaíba (MS) | Presidente Venceslau (SP) | Combined Production a | ||
|---|---|---|---|---|---|
| Case studies | 1 | 2a | 1 | 2a | 2b |
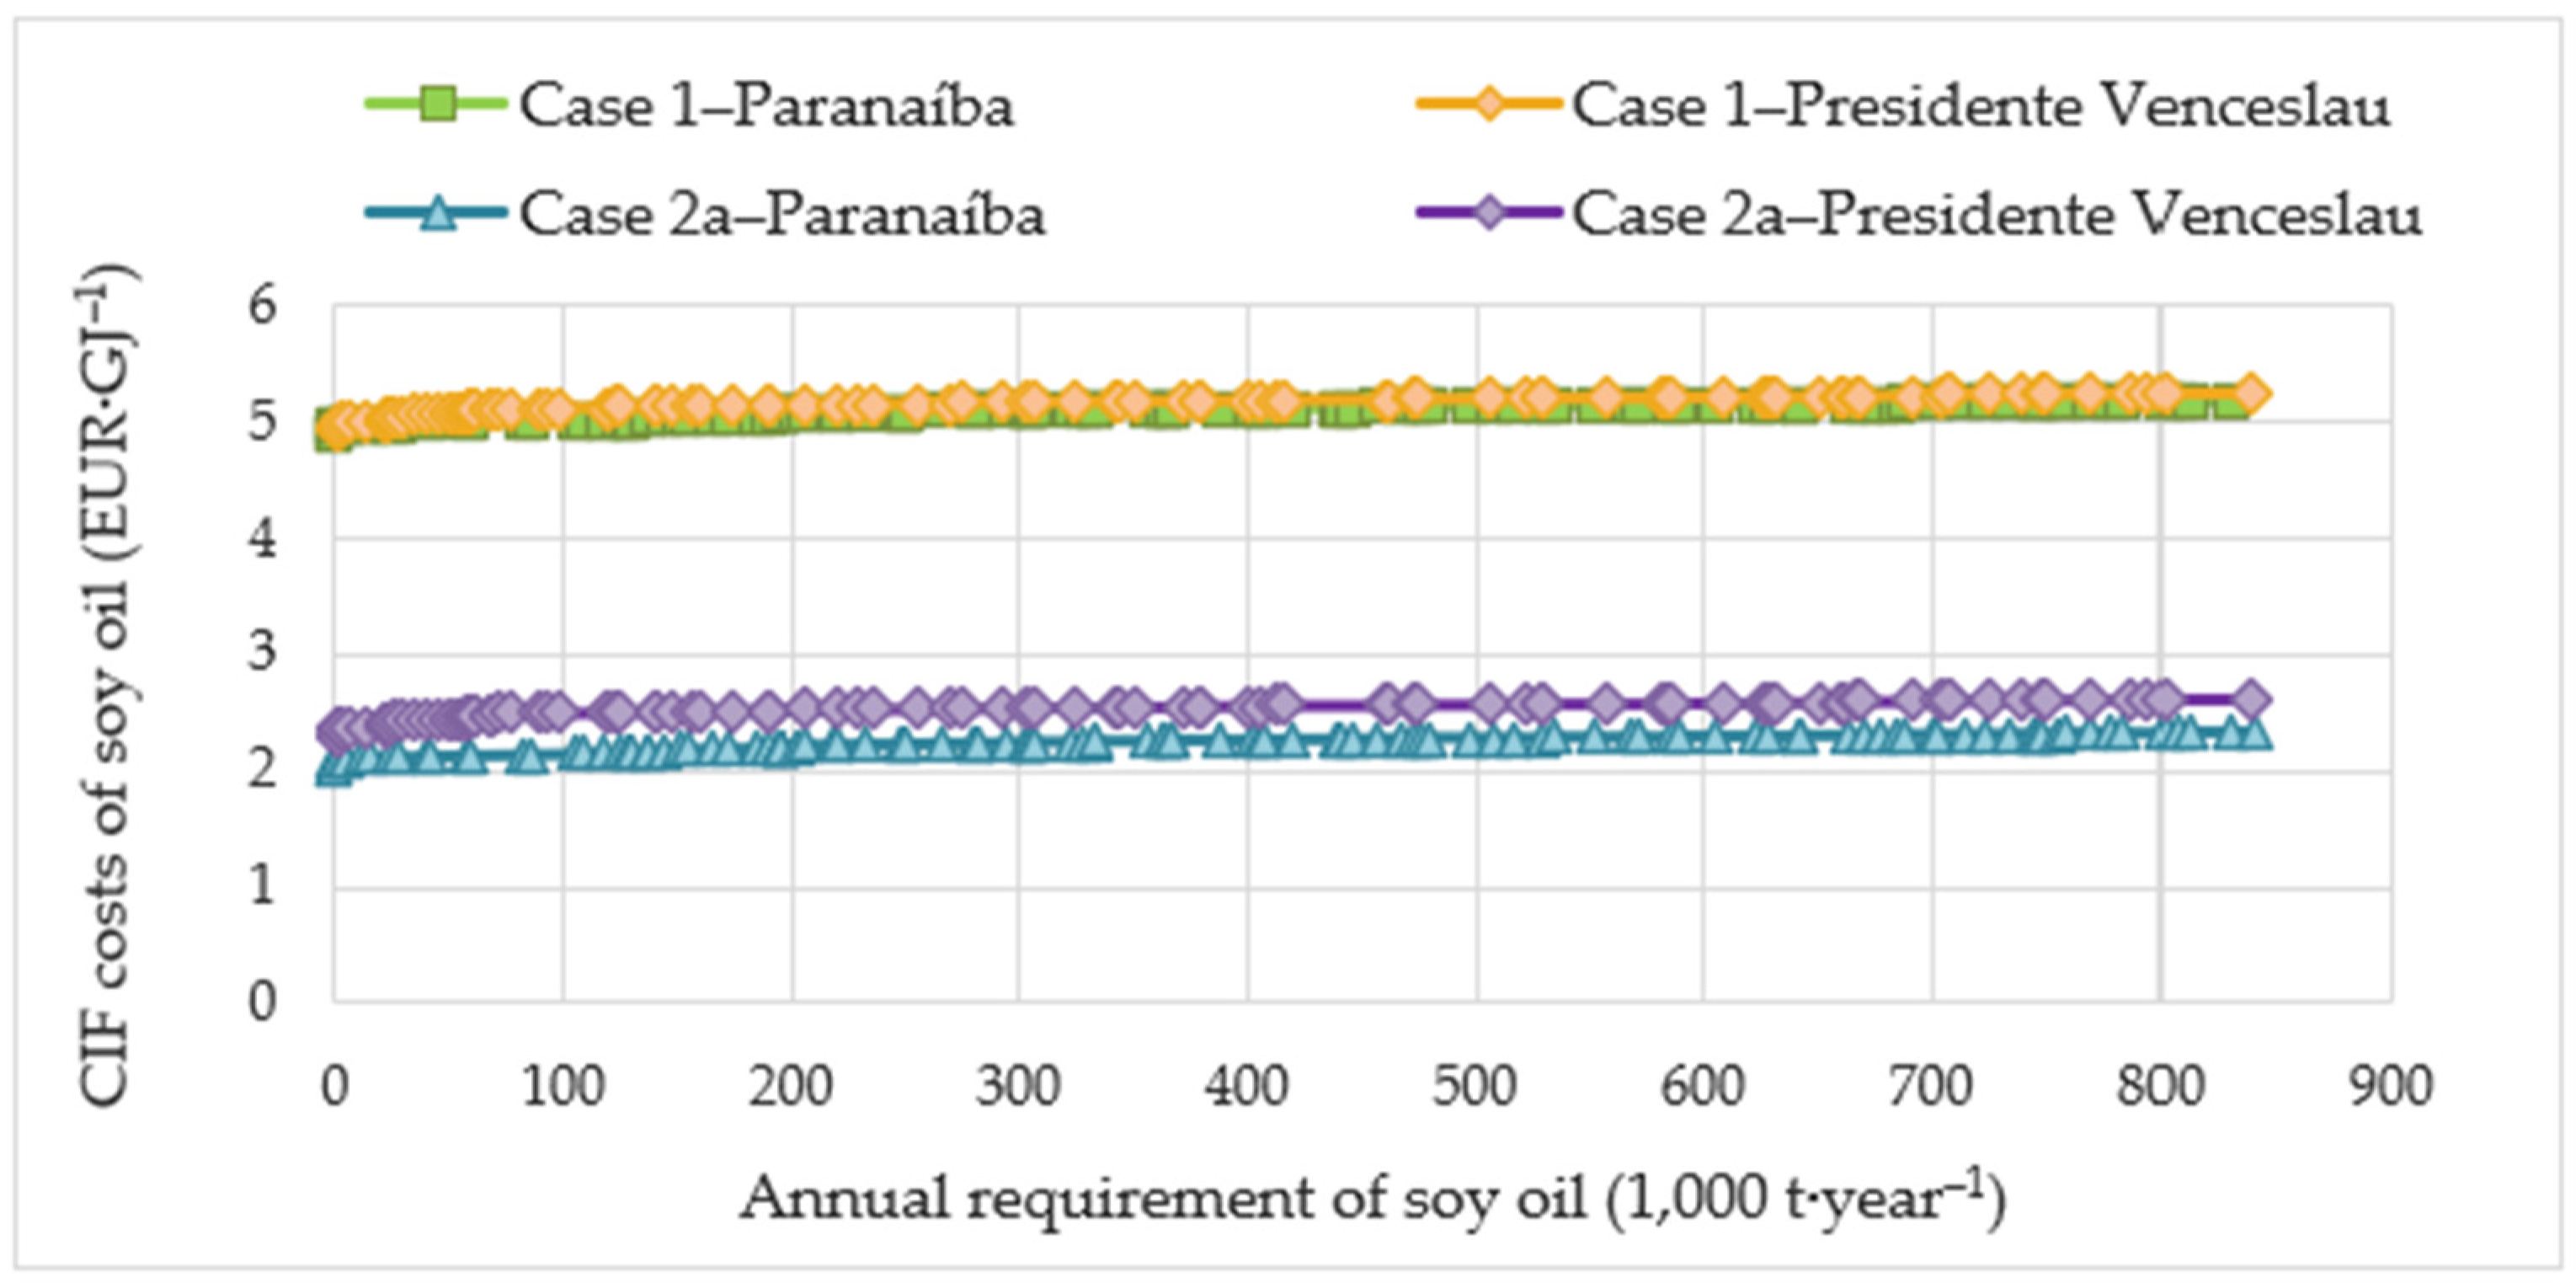
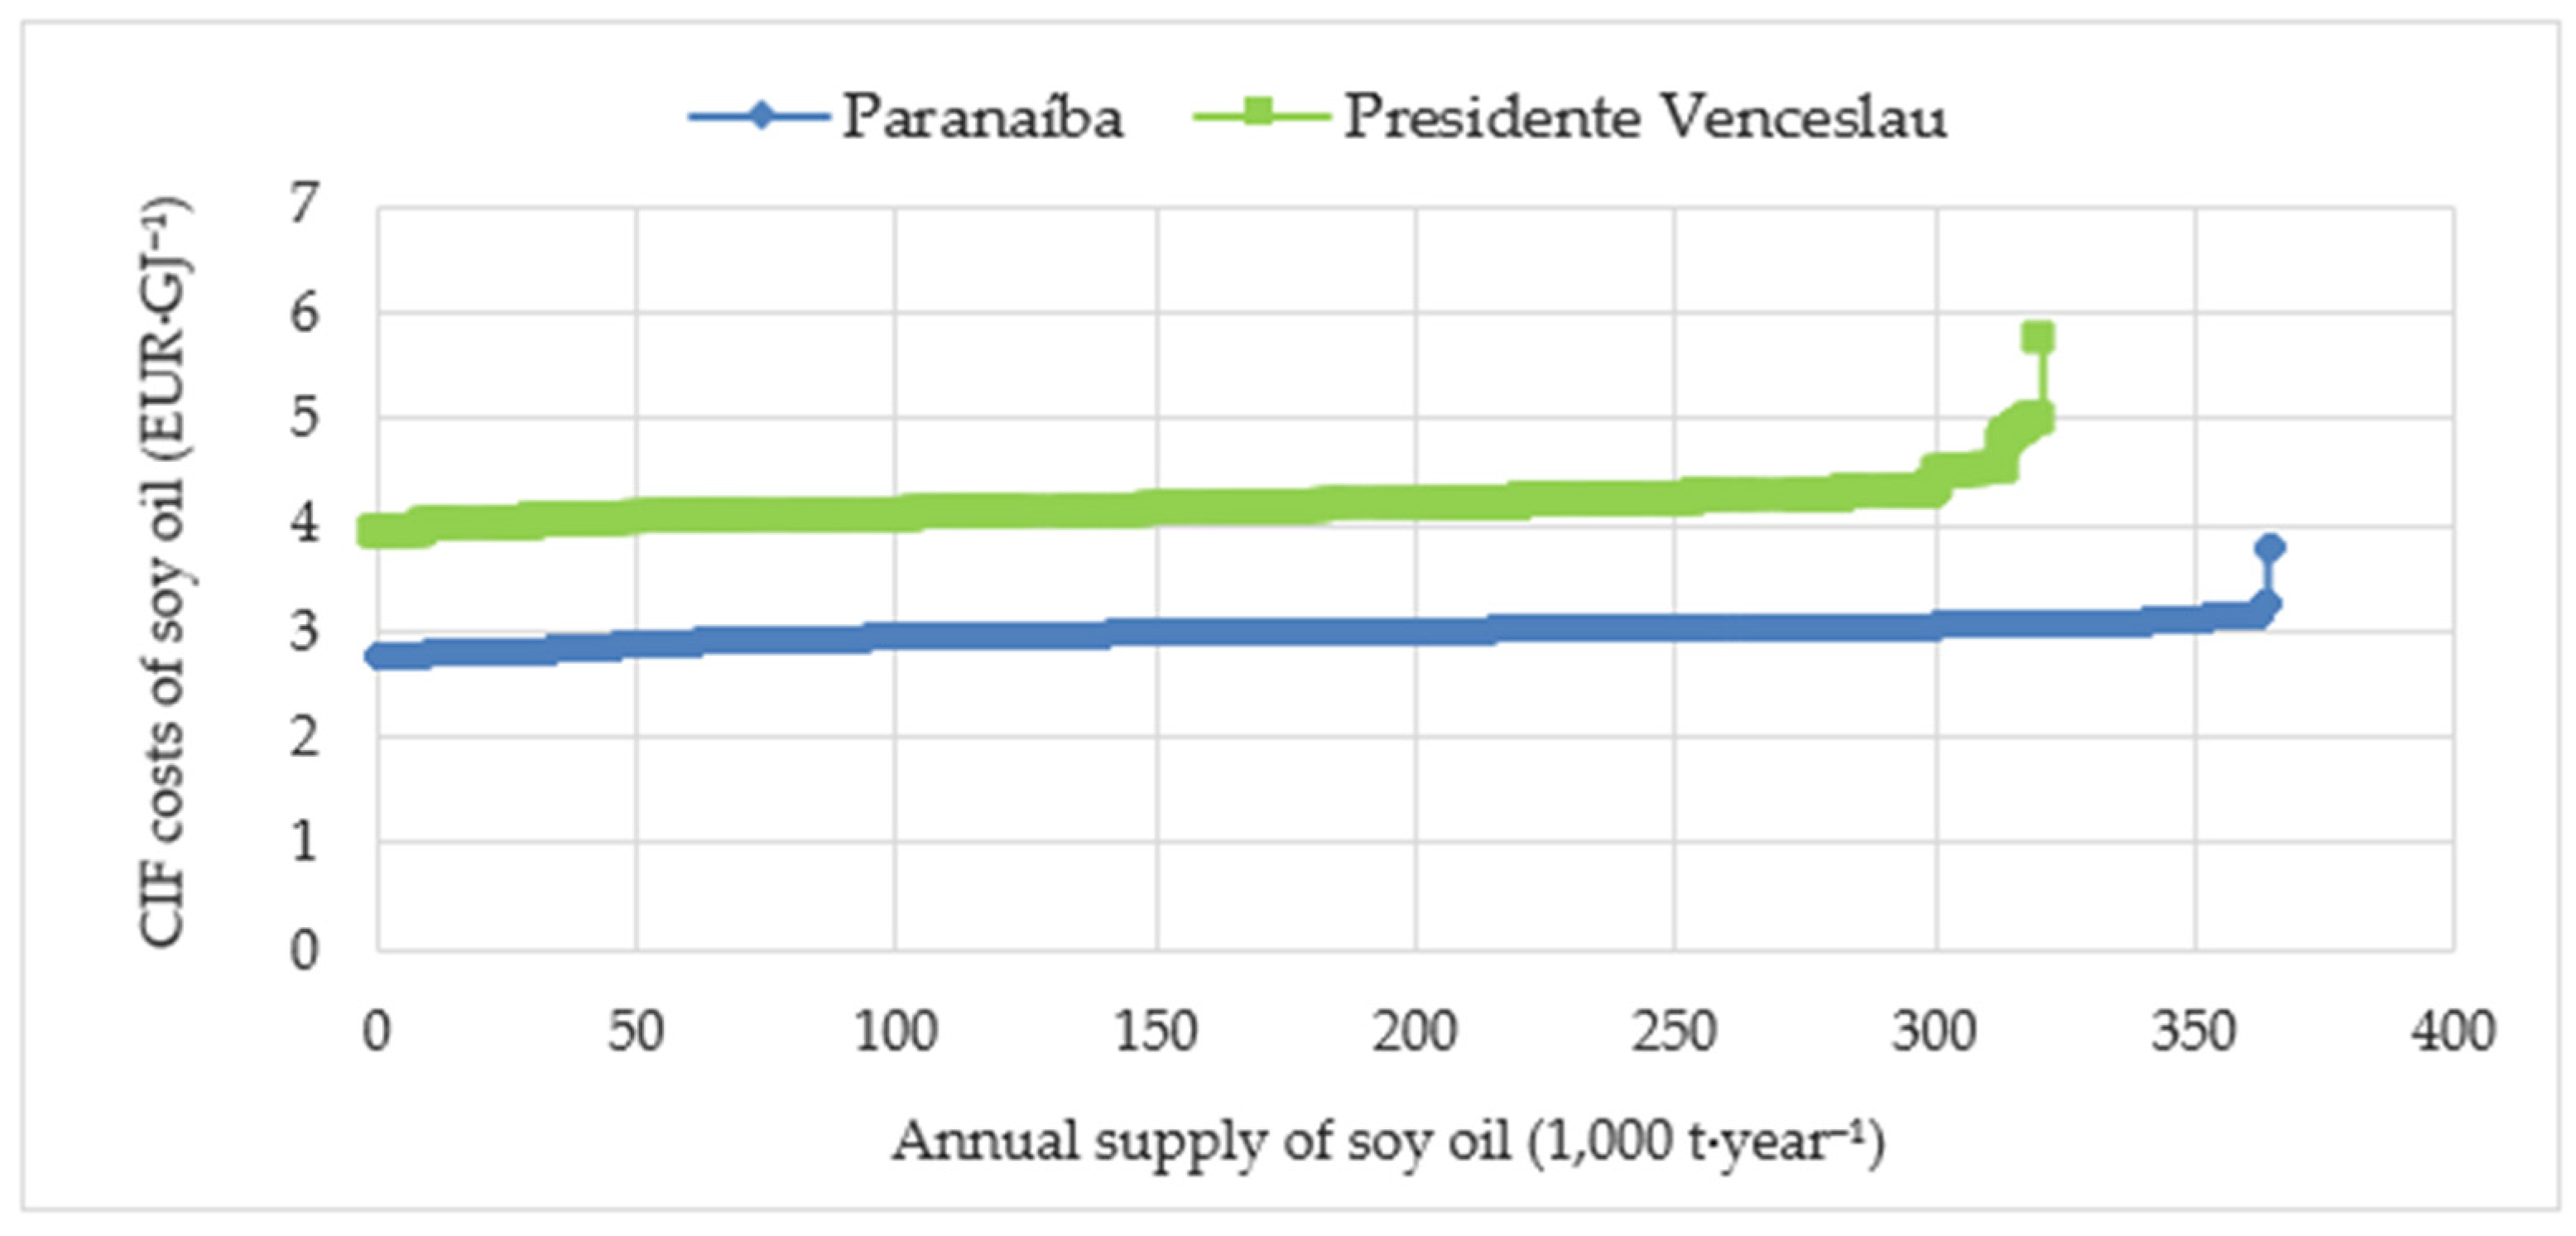
| GJ−1) | 5.08 | 2.23 | 5.13 | 2.52 | 3.56 |
| GJ−1) | 12.87 | 9.66 | 12.93 | 9.90 | 12.13 |
| t−1) | 550.86 | 413.64 | 553.27 | 427.60 | 519.03 |
| year−1) | 98.6 | 98.6 | 98.6 | 98.6 | 74.0 |
| year−1) | 79.3 | 79.3 | 79.3 | 79.3 | 59.5 |
Publisher’s Note: MDPI stays neutral with regard to jurisdictional claims in published maps and institutional affiliations. |
© 2022 by the authors. Licensee MDPI, Basel, Switzerland. This article is an open access article distributed under the terms and conditions of the Creative Commons Attribution (CC BY) license (https://creativecommons.org/licenses/by/4.0/).
Share and Cite
Guarenghi, M.M.; Walter, A.; Seabra, J.E.A.; Rocha, J.V.; Vieira, N.; Damame, D.; Santos, J.L. Areas Available for the Potential Sustainable Expansion of Soy in Brazil: A Geospatial Assessment Using the SAFmaps Database. Remote Sens. 2022, 14, 1628. https://doi.org/10.3390/rs14071628
Guarenghi MM, Walter A, Seabra JEA, Rocha JV, Vieira N, Damame D, Santos JL. Areas Available for the Potential Sustainable Expansion of Soy in Brazil: A Geospatial Assessment Using the SAFmaps Database. Remote Sensing. 2022; 14(7):1628. https://doi.org/10.3390/rs14071628
Chicago/Turabian StyleGuarenghi, Marjorie Mendes, Arnaldo Walter, Joaquim E. A. Seabra, Jansle Vieira Rocha, Nathália Vieira, Desirée Damame, and João Luís Santos. 2022. "Areas Available for the Potential Sustainable Expansion of Soy in Brazil: A Geospatial Assessment Using the SAFmaps Database" Remote Sensing 14, no. 7: 1628. https://doi.org/10.3390/rs14071628
APA StyleGuarenghi, M. M., Walter, A., Seabra, J. E. A., Rocha, J. V., Vieira, N., Damame, D., & Santos, J. L. (2022). Areas Available for the Potential Sustainable Expansion of Soy in Brazil: A Geospatial Assessment Using the SAFmaps Database. Remote Sensing, 14(7), 1628. https://doi.org/10.3390/rs14071628