Article

A TIR-Visible Automatic Registration and Geometric Correction Method for SDGSAT-1 Thermal Infrared Image Based on Modified RIFT

1
Aerospace Information Research Institute, Chinese Academy of Sciences, Beijing 100094, China
2
International Research Center of Big Data for Sustainable Development Goals (CBAS), Beijing 100094, China
3
College of Resource and Environment, University of Chinese Academy of Sciences, Beijing 100049, China
*
Author to whom correspondence should be addressed.
Remote Sens. 2022, 14(6), 1393; https://doi.org/10.3390/rs14061393
Submission received: 27 January 2022 / Revised: 9 March 2022 / Accepted: 11 March 2022 / Published: 14 March 2022
(This article belongs to the Section Earth Observation Data)

Abstract

:
High-resolution thermal infrared (TIR) remote sensing images can more accurately retrieve land surface temperature and describe the spatial pattern of urban thermal environment. The Thermal Infrared Spectrometer (TIS), which has high spatial resolution among spaceborne thermal infrared sensors at present, and global data acquisition capability, is one of the sensors equipped in the SDGSAT-1. It is an important complement to the existing international mainstream satellites. In order to produce standard data products, rapidly and accurately, the automatic registration and geometric correction method needs to be developed. Unlike visible–visible image registration, thermal infrared images are blurred in edge details and have obvious non-linear radiometric differences from visible images, which make it challenging for the TIR-visible image registration task. To address these problems, homomorphic filtering is employed to enhance TIR image details and the modified RIFT algorithm is proposed to achieve TIR-visible image registration. Different from using MIM for feature description in RIFT, the proposed modified RIFT uses the novel binary pattern string to descriptor construction. With sufficient and uniformly distributed ground control points, the two-step orthorectification framework, from SDGSAT-1 TIS L1A image to L4 orthoimage, are proposed in this study. The first experiment, with six TIR-visible image pairs, captured in different landforms, is performed to verify the registration performance, and the result indicates that the homomorphic filtering and modified RIFT greatly increase the number of corresponding points. The second experiment, with one scene of an SDGSAT-1 TIS image, is executed to test the proposed orthorectification framework. Subsequently, 52 GCPs are selected manually to evaluate the orthorectification accuracy. The result indicates that the proposed orthorectification framework is helpful to improve the geometric accuracy and guarantee for the subsequent thermal infrared applications.

1. Introduction

The thermal infrared (TIR) bands are the significant channels for land surface temperature retrieval [1,2] and urban heat island effect monitoring [3,4,5], as well as croplands evapotranspiration studies [6,7,8]. In the past few decades, TIR remote sensing has been developed rapidly. The resolution of spaceborne TIR images and the global data acquisition capability of TIR satellites are improved continuously. SDGSAT-1, successfully launched on 5 November 2021, is the world’s first space scientific satellite dedicated to serving the U.N. 2030 Agenda for Sustainable Development Goals (SDGs). The Thermal Infrared Spectrometer (TIS) is one of the sensors equipped in the SDGSAT-1 [9]. TIS uses a long linear array whisk broom method, which combines both high spatial resolution and large width, with a spatial resolution of 30 m and a width of 300 km. It has high spatial resolution among the in-orbit spaceborne TIR imagers at present, and will be an important supplement to the existing earth observation TIR data. TIS has three channels, i.e., 8.0~10.5 μm, 10.3~11.3 μm and 11.5~12.5 μm. Table 1 lists the argument of TIS and the comparison of other TIR sensors in orbit.
In order to produce SDGSAT-1 TIS orthoimage products, rapidly and accurately, the automatic registration and geometric correction method needs to be developed. Considering that there are no TIR images with the same 30m resolution as the reference image, the TIR-visible registration method is proposed in this study. However, due to the different imaging mechanisms, there are significant non-linear radiometric differences (NRD) between TIR and visible images, which bring enormous challenges to the TIR-Visible image registration. Thus, it is necessary to develop an effective registration method for TIR and visible remote sensing images.
Generally speaking, traditional registration methods can be divided into two types, area-based methods and feature-based methods [10,11,12]. Area-based methods, using a template matching scheme, adopt the original pixel values of images to establish the similarity metric between image pairs, so as to determine the corresponding points. The common area-based methods include normalized cross-correlation (NCC) [13,14], mutual information (MI) [15,16] and phase correlation, based on Fourier transform [17,18,19]. This kind of method is robust to linear radiance differences and the translation changes of images, but they have no robustness to scale, rotation and non-linear radiance differences. The computation efficiency is low because of using the template matching strategy. Feature-based methods adopt the gradient information of images. Firstly, some stable and obvious feature points from the sensed image and the reference image are extracted by some feature extraction operators. Then, the image patches centered on the feature points are extracted and the feature descriptors of the features points are constructed, according to the gradient information of the image patches. Finally, the two points in the image pairs, having the closest distance of feature descriptors, are regarded as the corresponding points. Scale Invariant Feature Transform (SIFT) is the classical feature-based method [20,21]. In subsequent studies, scholars make a series of improvements to SIFT in computing efficiency and denoising, such as speeded-up robust features (SURF) [22,23], principal component analysis SIFT (PCA-SIFT) [24], SAR-SIFT [25] and OS-SIFT [26]. All these SIFT-like algorithms use the gradient to construct descriptors, which is sensitive to radiance changes. These algorithms are not robust to non-linear radiometric difference and achieve bad performance in multimodal remote sensing image registration, such as TIR-Visible registration.
At present, with the rapid development of deep learning in computing vision, learning-based registration methods have drawn much attention [27,28,29]. The main ideas of learning-based methods are to use deep convolution neural networks (CNN) to extract the feature points [30,31], or learn the descriptors’ construction pattern [32,33,34], or build the similarity metric function about descriptors [35,36]. These steps can also be joint to form an end-to-end architecture for image registration [37,38]. Compared with the classic registration methods, learning-based registration adopts the data-driven mechanisms to learn the registration strategy, including robustness to scale, rotation and non-linear radiance differences, but the drawbacks are also obvious. The training process needs enormous training samples and vast hyperparameters need to be tuned manually. The generalization of deep learning registration methods is unsatisfactory.
Since neither traditional ways nor learning-based methods can effectively address the problem of non-linear radiation difference in remote sensing image registration, another model, called phase congruency (PC) [39], is taken into account, gradually. This model can detect image features, such as points and lines with illumination and contrast invariance [40]. The histogram of orientated phase congruency (HOPC) extends the PC model and defines a novel similarity metric [41,42]. HOPC uses a Harris Operator to extract features in the sensed image, and then calculates the PC values of the sensed image and reference image. Subsequently, using the strategy of template matching, the points that get the highest scores of similarity metric, in each template, are selected as corresponding points. Due to the use of template matching, this algorithm is essentially an area-based method, which cannot address the scale and rotation changes. It needs to know the accurate geographic information and the offsets between sensed image and reference image, which must be within several pixels. If not, the cost of computation is very high. Radiation-invariant Feature Transform (RIFT) is another PC-extending model that combines features-based methods [43]. RIFT uses PC values instead of pixel values for feature points detection, which can extract enormous and repeatable points in both the sensed image and reference image. Then, a maximum index map (MIM) is proposed for feature description. RIFT is robust to non-linear radiance difference and rotation changes, and achieves excellent performance in the multimodal remote sensing image registration.
Comparing with visible–visible image registration, high-resolution TIR-visible image registration has three challenges: (1) there is an obvious nonlinear difference between the TIR image and visible image in gray scale, which is not conducive to the construction of descriptors and the selection of the metric function; (2) ground objects with a different spectrum in visibility may be the same or similar in temperature, resulting in unclear texture details and ambiguous image edges of thermal infrared images, which are not conducive to selecting stable and repeatable feature points; (3) TIR images are noisy, and TIR-Visible image registration is easily affected by noise. To address the problems mentioned above, and implement production for the Level4 (L4) orthorectification TIR images of SDGSAT-1, a modified RIFT algorithm for registration and the orthorectification framework for SDGSAT-1 TIS images are proposed in this study. The main three contributions of this study are summarized as follows:
  • Homomorphic filtering is employed before the feature points extraction stage to denoise and enhance the texture details of TIR images.
  • In the descriptors construction stage, a novel binary pattern string is proposed, which is more robust to NRD than the MIM of the original RIFT. The binary pattern string is able to express a log-Gabor convolution sequence, while reducing computational complexity.
  • Two-step orthorectification method from Leve1A (L1A) to L4 is designed. For the first step, the L1A TIR image is orthorectified with RPC coefficients and DEM data. Then the orthorectified image is registered with the reference visible image using the modified RIFT. To get the ground control points (GCPs), the corresponding points in the orthorectified image are remapped back to the L1A image coordinates and the points in the reference visible image are mapped to geographic coordinates. Later, the RPC refinement is executed with GCPs. For the second step, the L1A TIR image is orthorectified again, with refined RPCs coefficients and DEM, resulting the L4 production.
This paper is organized as follows. Section 2 describes the TIR-visible image registration method and the orthorectification flow of the SDGSAT-1 TIS L1A image. Section 3 states two experimental designs and the results. Section 4 discusses the experiment results and Section 5 is the conclusion.

2. Methodology

The modified RIFT algorithm is described in detail in Section 2.1 and the framework of orthorectification for the SDGSAT-1 TIS image is outlined in Section 2.2.

2.1. Modified RIFT

Most of the rotation distortion of SDGSAT-1 TIS image can be removed by selecting a few GCPs manually or orthorectification with the initial RPC coefficients. The scale difference can be eliminated by down-sampling the visible reference image to the same resolution as TIR image. Thus, the modified RIFT algorithm only takes the non-linear radiometric difference into account.

2.1.1. Homomorphic Filtering

All the registration methods in computer vision are applied for the 8-bit nature images, while the SDGSAT-1 TIS images are 12-bit. It needs to compress the TIR images into 8-bit. Because TIR images represent the temperature information, the pixel values in the same scene are concentrated at a certain interval, which is inappropriate for a global linear stretch in gray. The global linear gray transform from 12-bit to 8-bit will lose a lot of detail, which makes it difficult for the feature detection later.
Homomorphic filtering is a non-linear filter, which can compress the gray range of the image in the frequency domain and improve the image contrast at the same time, and enhance the details in the dark area of the image without losing the details in the bright area [44,45,46]. Homomorphic filtering assumes that the image f ( x , y ) is regarded as the product of the low-frequency incident component i ( x , y ) and high-frequency reflection component r ( x , y ) . This is f ( x , y ) =   i ( x , y ) r ( x , y ) , where ( x , y ) stands for image coordinates. A transfer function H ( u ,   v ) is applied for non-linear gray enhancement in the frequency domain, and the specific process is shown in Figure 1.
The transfer function H ( u , v ) is expressed as:
H ( u , v ) = ( r H r L ) ( 1 e c D 2 ( u , v ) D 0 2 ) + r L
where D ( u , v ) is the distance from the image coordinate point ( u , v ) to the image center in the frequency domain. r H , r L , D 0 and c are the tuning parameters. When r L < 1 and r H > 1 , the filter weakens the low-frequency part of the image and enhances the high-frequency part of the image. The final result is that the texture details of the image are enhanced while the gray scale range of the image is compressed. In this study, the parameters are set as r H = 4 , r L = 0.5 , and c = 4 . D 0 is taken as a quarter of the width of the input image.

2.1.2. Feature Points Extraction

A large number of feature points, which are repeatable and evenly distributed in the sensed image and reference image, are selected during the feature points extraction process. Traditional extraction methods usually depend on image pixel values or gradient information, which are spatial domain information. These methods are sensitive to the illumination and extract little repeatable points in the TIR image and visible reference image. Except spatial domain information, frequency domain information, such as phase, can also be applied in feature points extraction. Phase information has high invariance to non-linear radiometric changes [47,48]. Phase congruency (PC) model is used for measuring the degree of consistency in the local phase information at different angles. The PC model at the specific orientation θ o is described as follows:
PC ( x , y ; θ o ) = s w o ( x , y ) A s o ( x , y ) Δ Φ s o ( x , y ) T s A s o ( x , y ) + ξ
where ( x , y ) is the image coordinate; w o ( x , y ) is a weighting function; ξ is a small value to prevent denominator being zero; T is the noise compensation term; operator takes zero when the enclosed quantity is negative, and itself when the enclosed quantity is non-negative. A s o ( x , y ) Δ Φ s o ( x , y ) is defined as:
A s o ( x , y ) Δ Φ s o ( x , y ) = ( E s o ( x , y ) ϕ ¯ E ( x , y ) + O s o ( x , y ) ϕ ¯ O ( x , y ) ) | ( E s o ( x , y ) ϕ ¯ O ( x , y ) O s o ( x , y ) ϕ ¯ E ( x , y ) ) |
where,
ϕ ¯ E ( x , y ) = s E s o ( x , y ) / C ( x , y ) ,   ϕ ¯ O ( x , y ) = s O s o ( x , y ) / C ( x , y )
A s o = E s o ( x , y ) 2 + O s o ( x , y ) 2
and,
C ( x , y ) = ( s E s o ( x , y ) ) 2 + ( s O s o ( x , y ) ) 2
The E s o ( x , y ) and O s o ( x , y ) are the real part and imaginary part respectively of the image convolution result using 2D log-Gabor filter. The 2D log-Gabor filter, which is determined by the orientation o and scale s , is defined as:
L ( ρ , θ ; s , o ) = e x p ( ( ρ ρ s ) 2 2 σ ρ 2 ) e x p ( ( θ θ o ) 2 2 σ θ 2 )
where ( ρ , θ ) is the log-polar coordinate; ( ρ s , θ o ) is the center frequency; σ ρ and σ θ are the bandwidths in ρ and θ , respectively. The detailed calculation process can be referred to [43].
After obtaining the PC map with specific orientation according to Equation (2), the minimum moment m ψ and maximum moment M ψ of phase congruency covariance are calculated as follows:
m ψ = 1 2 ( c + a b 2 + ( a c ) 2 )
M ψ = 1 2 ( c + a + b 2 + ( a c ) 2 )
where
a = o ( P C ( θ o ) c o s ( θ o ) ) 2
b = 2 o ( P C ( θ o ) c o s ( θ o ) ) ( P C ( θ o ) s i n ( θ o ) )
c = o ( P C ( θ o ) s i n ( θ o ) ) 2
In this study, 8 orientations are applied and θ o gets the value in the list {0°, 22.5°, 45°, 67.5°, 90°, 112.5°, 135°, 157.5°} in turn. In PC model, minimum moment m ψ can be used as a measure of corner strength and maximum moment M ψ can be used as measure of edge strength. They are insensitive to the non-linear radiometric changes. Then the FAST feature detector [49] is executed on the minimum and maximum moment maps to extract repeatable points in both TIR image and visible image.

2.1.3. Feature Description

After extracting points in both sensed and reference images, descriptors for each point are constructed to perform feature matching. Descriptors need to be distinguishable. The distance between two description vectors for corresponding points is as close as possible, while is as far as possible for unrelated points. Different from using maximum index map (MIM) for feature description in RIFT, a novel binary pattern string is proposed in this study.
The binary pattern string is constructed via 8 orientations log-Gabor convolution sequence, obtained in the feature points extraction stage. For each orientation o , the amplitudes of all s scales are summed up to get the log-Gabor convolution layer A o ( x , y ) :
A o ( x , y ) = s A s o ( x , y )  
Thus, for each position ( x , y ) in image coordinate, 8 convolution values can be obtained ordered by the orientations list mentioned above. In RIFT, the orientation index of the maximum convolution value is selected to construct the MIM map. The shortcoming of this method is that the functional relationship between the orientation and the convolution cannot be completely described. In this study, the orientation indexes of maximum and minimum value are selected and the numerical relationship between adjacent orientations are taken into account. The 0 or 1 sign is defined as follows:
s i g n ( o ) = { 1 ,   A o > A o + 1 0 ,   A o < A o + 1   w h e r e   ( o { 0 , 1 , 2 , 3 , 4 , 5 , 6 , 7 }   and   when   o = 7 ,   take   o + 1 = 0 )
Then an 8-bit binary string is generated for each pixel. In order to be consistent with the binary string, the indexes of the maximum and minimum convolution, for which the value is the integer from 0 to 7, are also converted to binary number. Both indexes are converted into 3-bit binary. Finally, a 14-bit binary string is generated for each pixel and a binary data cube is constructed with 14 channels. Theoretically, the more orientations taken, the more details the relationship between orientations and convolution achieves. However, more orientations will increase the computation so 8 orientations are considered in this study.
After obtaining the binary pattern string, the distribution histogram technique similar to RIFT is applied for feature description. In detail, for each feature point, an image patch is extracted with J × J × 14 pixels centered at the point. Then the patch is divided into 6 × 6 sub-grids. For each sub-grid, sum up the binary value in every channels. The description vector is obtained by concatenating the summation of all the sub-grid and the dimension of the vector is 6 × 6 × 14 . Then the vector is compressed and normalized. Finally, the descriptor with 504 dimension is obtained. In this study, the value of J is 96.

2.1.4. Feature Matching and Outliers Removal

After obtaining the descriptors of TIR and visible image, the Fast Library for Approximate Nearest Neighbors (FLANN) [50] is adopted for feature matching. The second-order transformation function is used for image transform and outliers removal with Random Sample Consensus (RANSAC) [51]. The second order transformation is defined as follows:
{ x = a 0 + a 1 x + a 2 y + a 3 x y + a 4 x 2 + a 5 y 2 y = b 0 + b 1 x + b 2 y + b 3 x y + b 4 x 2 + b 5 y 2
where ( x , y ) is the coordinate of sensed image and ( x , y ) is the coordinate of reference image; a 0 , , a 5 , b 0 , , b 5 are the transform coefficients that need to be fitted.
Finally, the correct corresponding points are obtained and used for fitting the transform coefficients again. The second-order image transformation is executed to align the TIR and visible image.
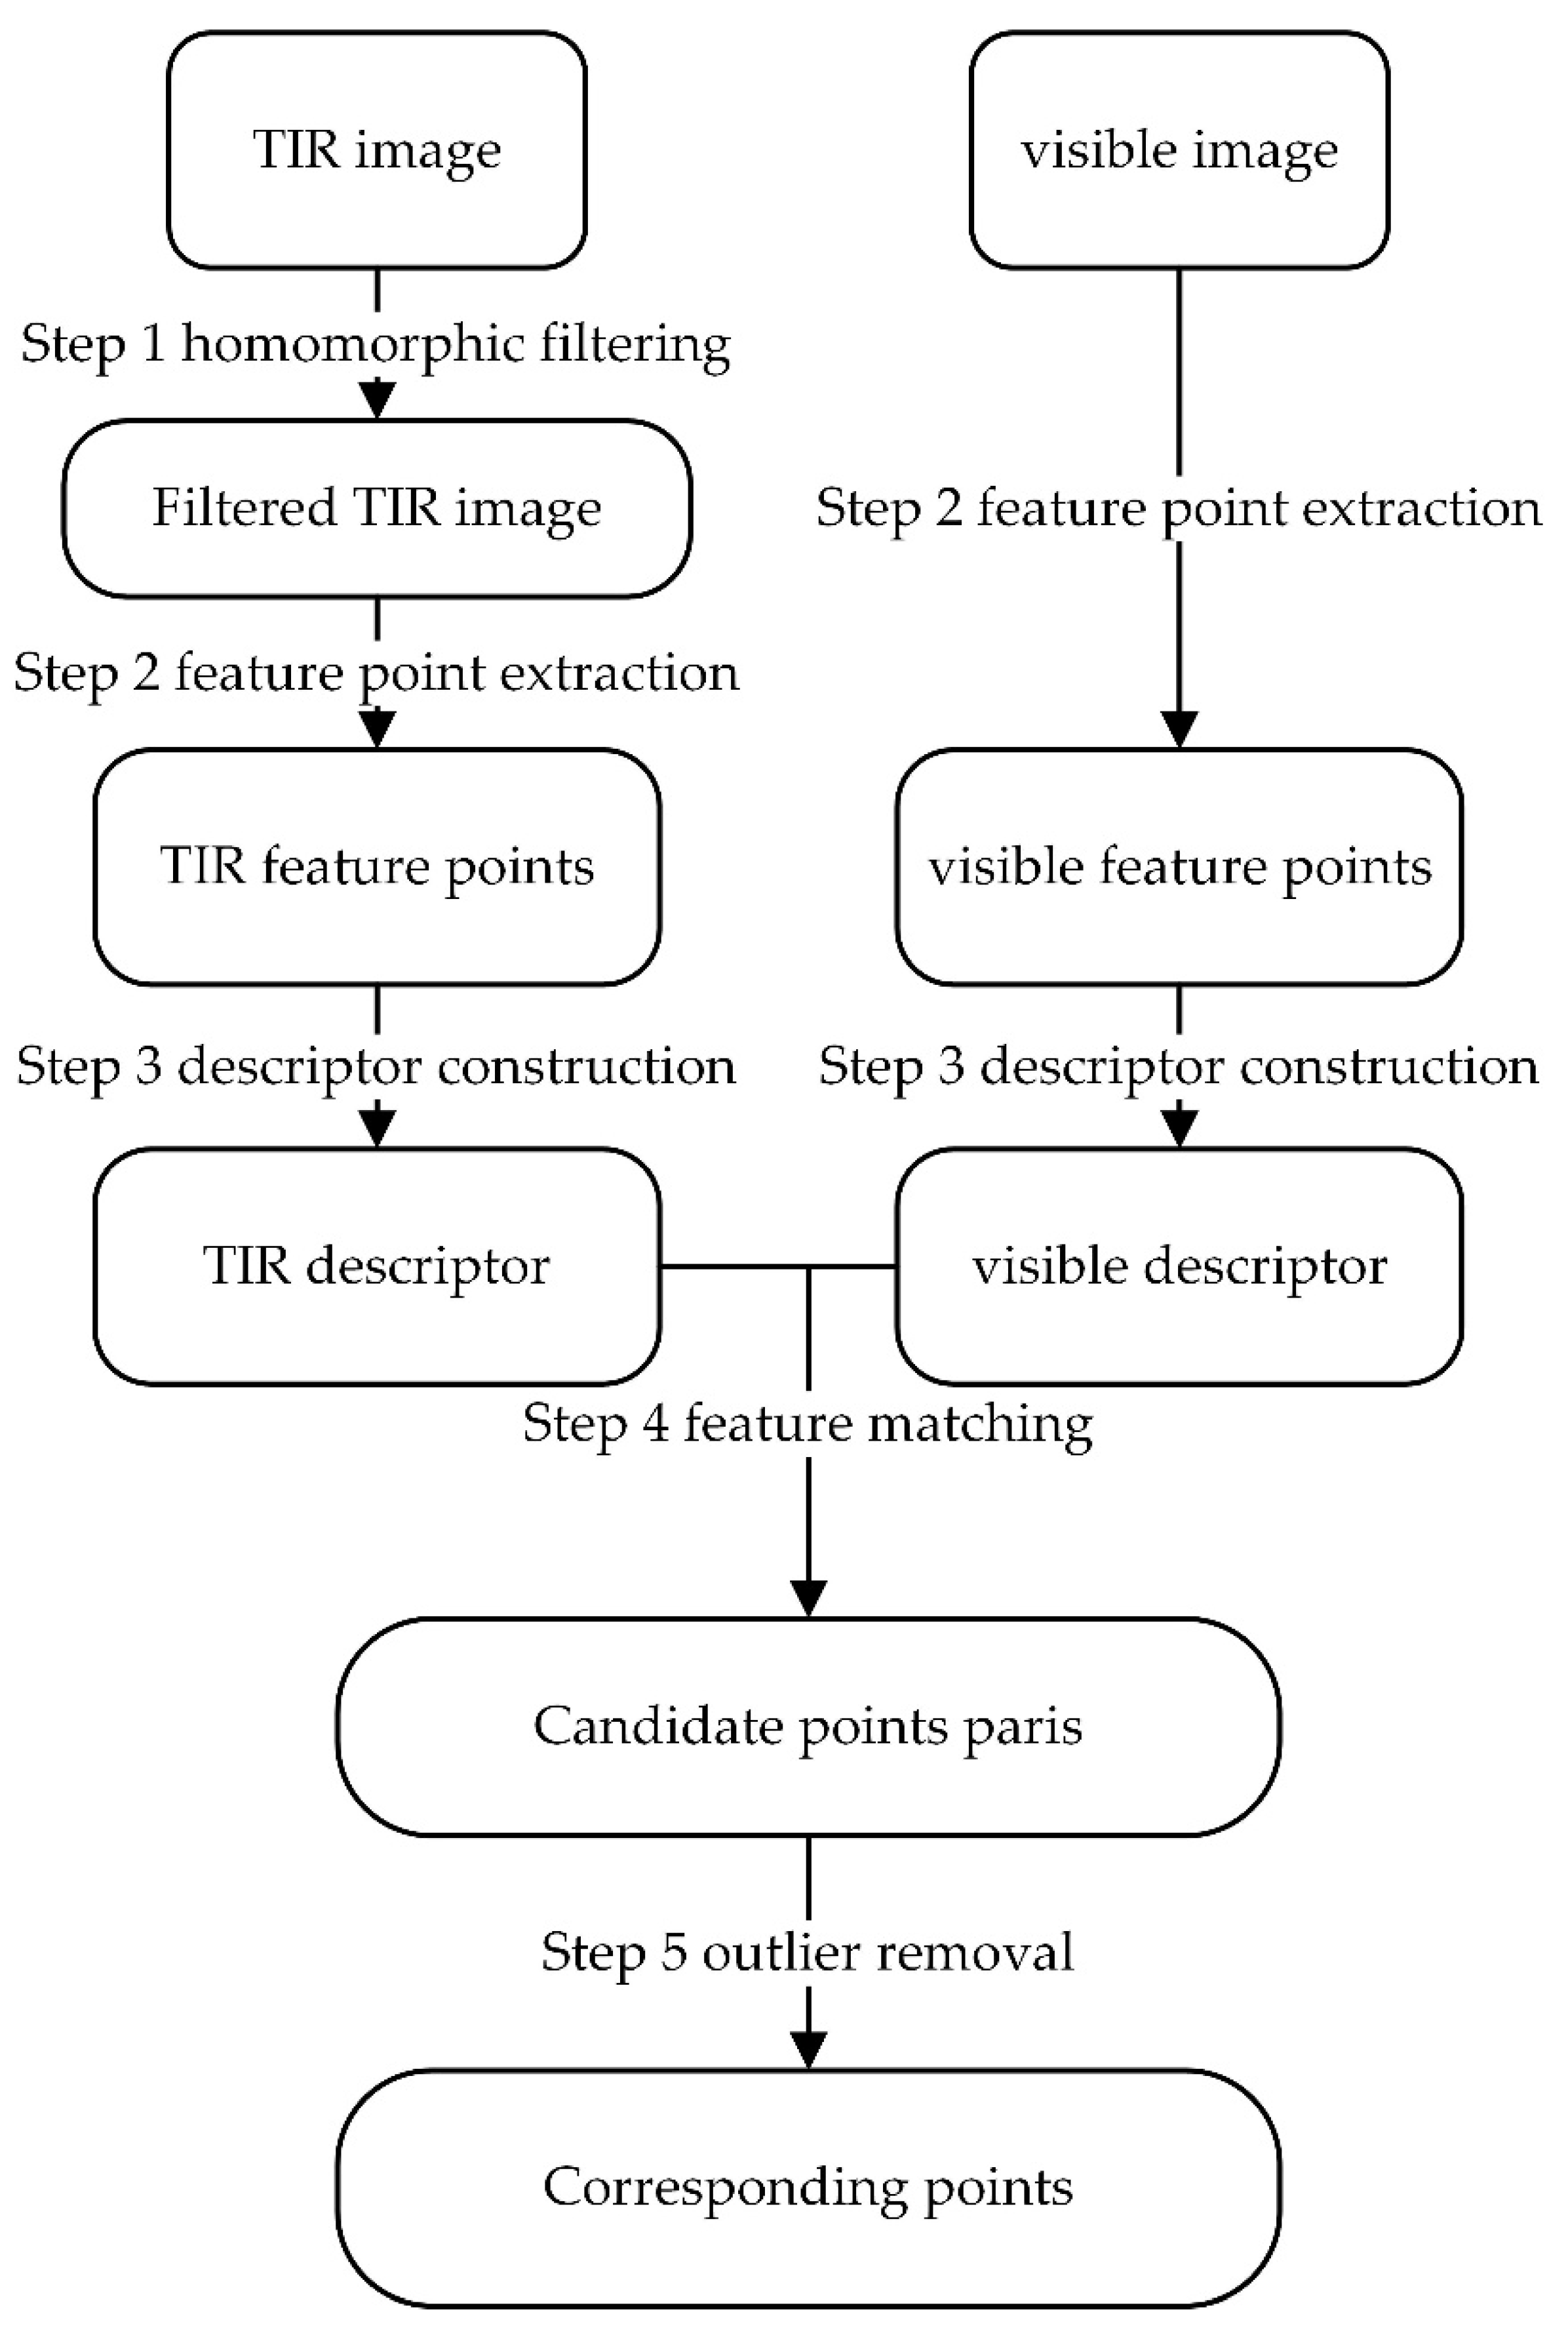
The total process of modified RIFT for TIR-VIS image registration is shown in Figure 2:

2.2. Orthorectification Framework for SDGSAT-1 TIS Image

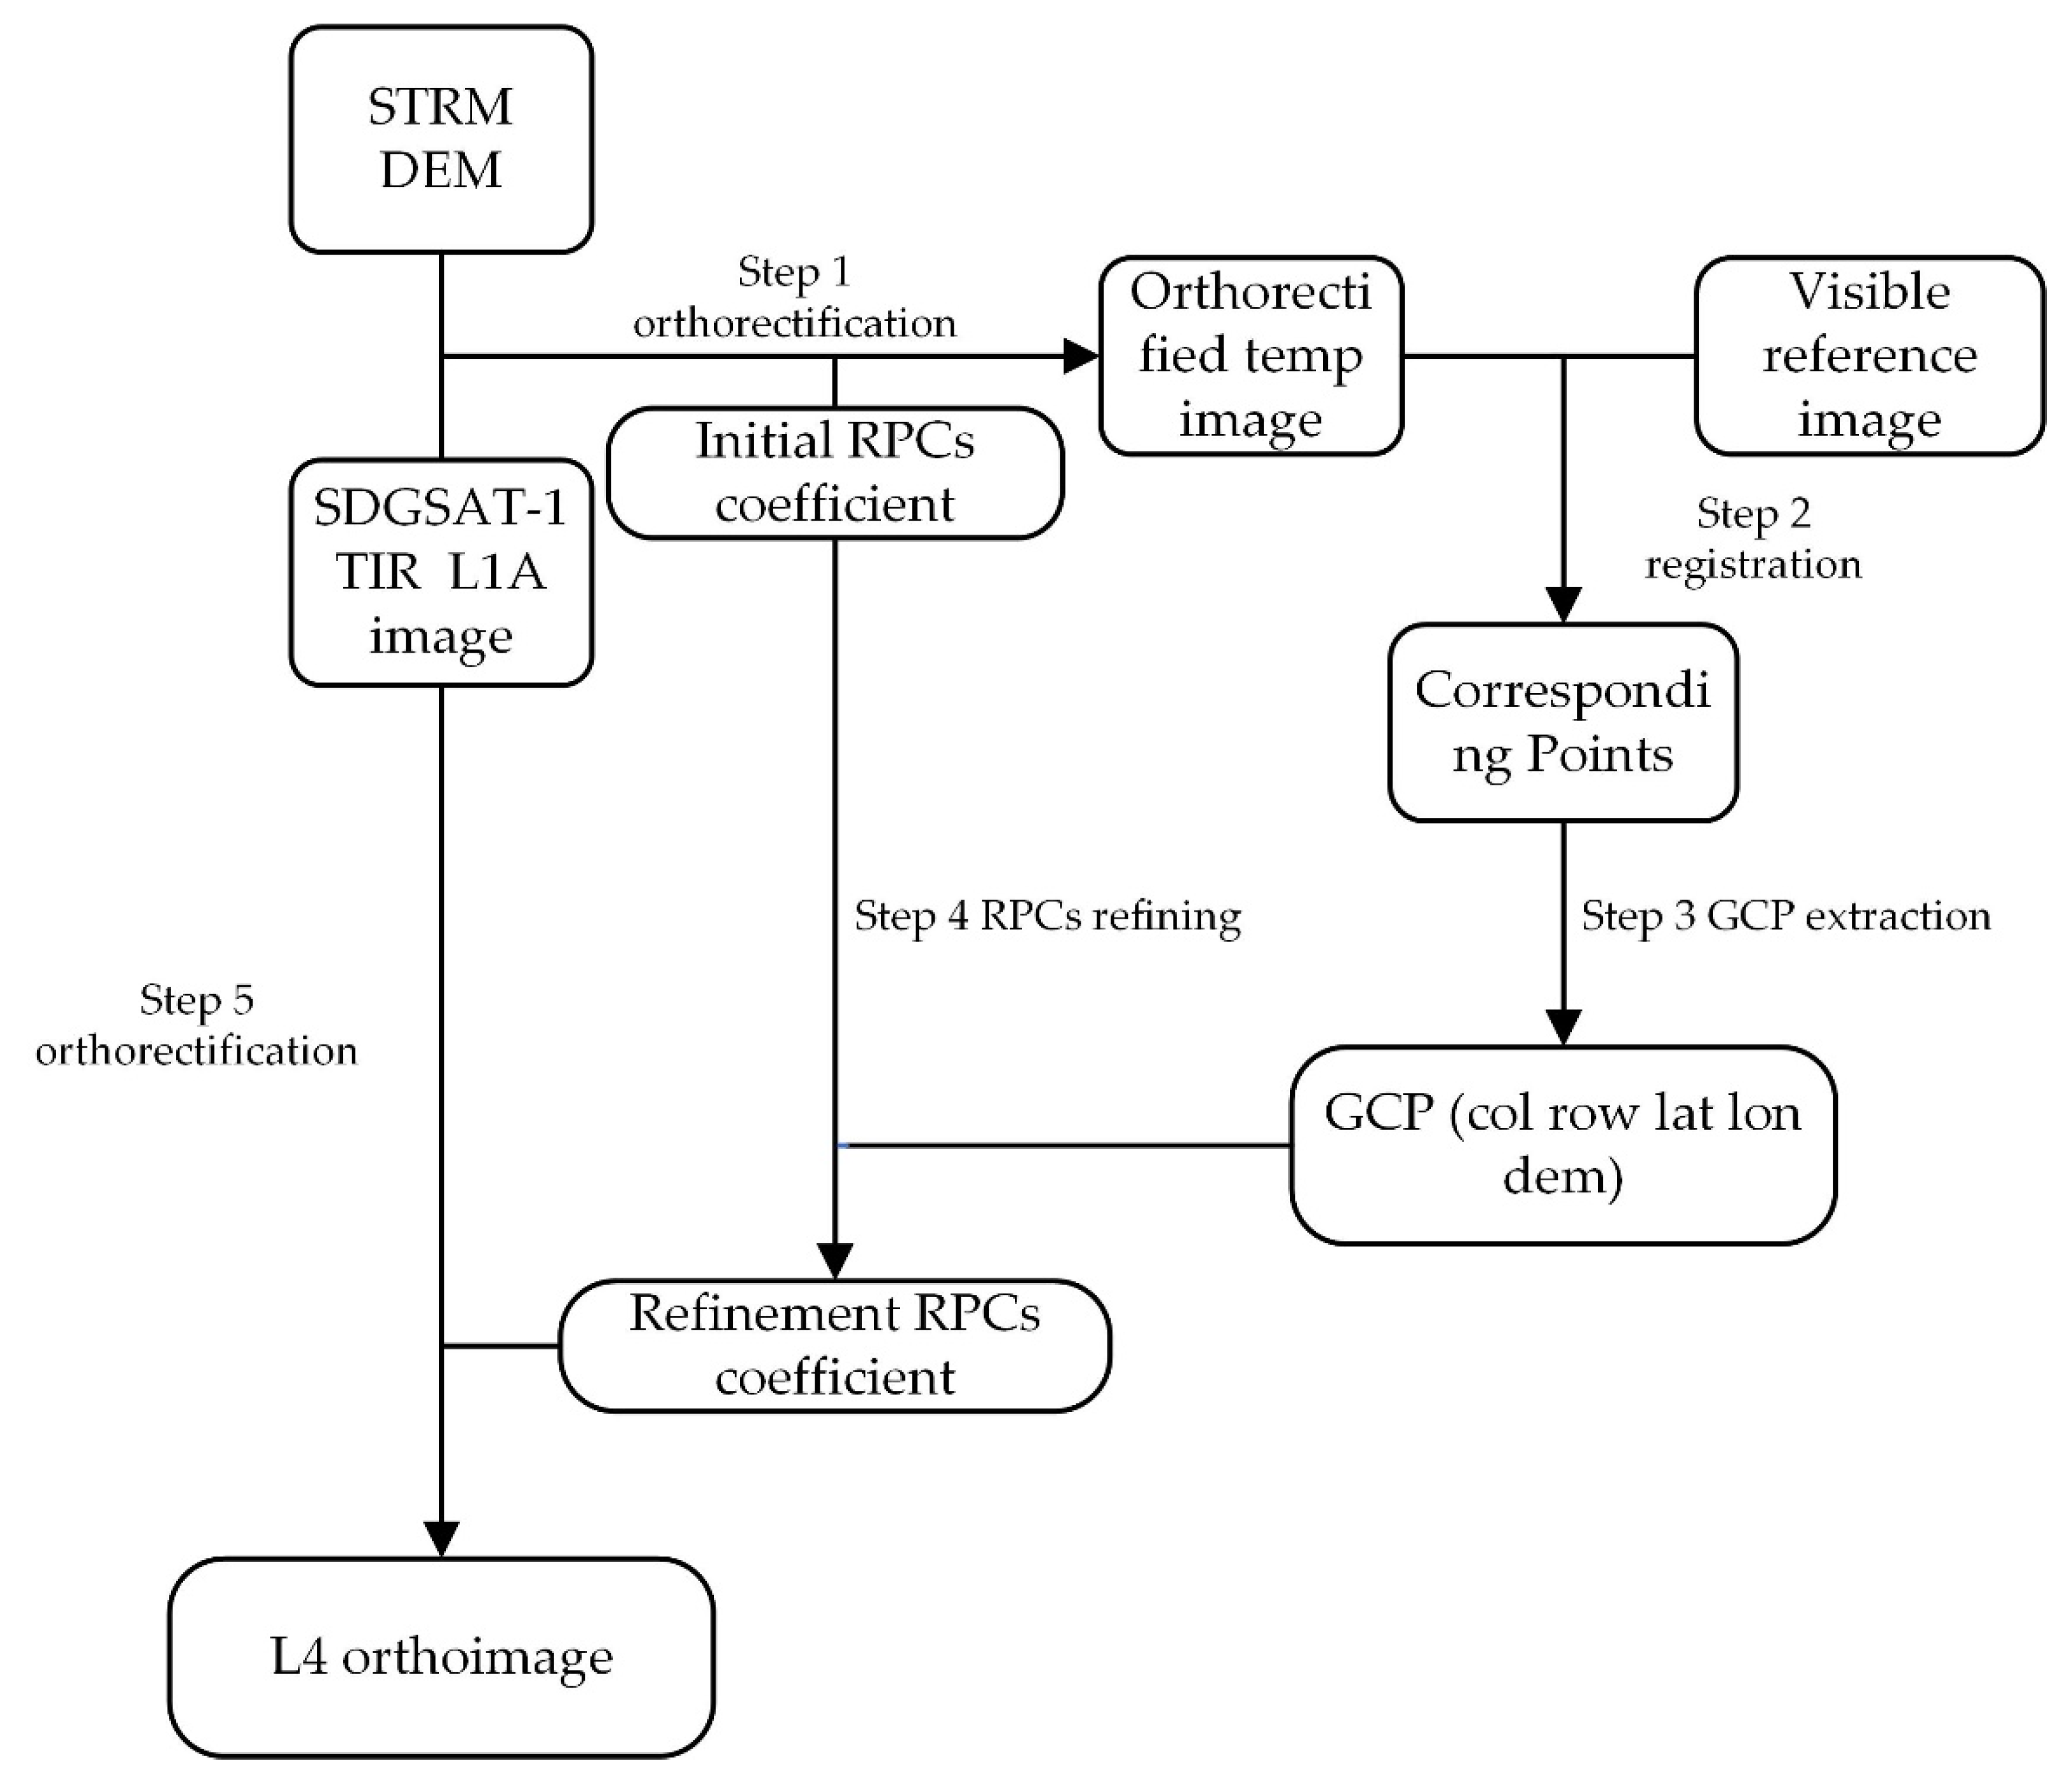
SDGSAT-1 TIS uses the long linear array whisk broom method to capture the thermal infrared image with 300-km width and 30-m spatial resolution. An image with 1987 × 10 , 000 pixels is captured in every scan. Combining with the sensor and ephemeris parameters, the RPC coefficients are derived. Then the L1A image products are generated. In this study, an orthorectification framework for SDGSAT-1 TIS image from L1A to L4 is proposed.
Firstly, the L1A TIR image is orthorectified with RPC coefficients and DEM data. Then the orthorectified image is registered with the reference visible image using the modified RIFT algorithm. The TIR image has 3 thermal infrared bands and they have been aligned in the L1A product. Therefore, only the B1 band (8.0~10.5 μm), which is closer to the visible band than the others, is used for registration.
Lots of corresponding points are obtained after the registration. However, the registration only records the corresponding points’ row and column index with respect to the orthorectified image and reference image, which is not consistent with the ground control points (GCPs) format. Thus, the points in the orthorectified image are remapped back to the L1A image coordinate space by the RPC inverse transforming. Further, the points in the reference visible image are mapped to geographic coordinate. The DEM value for each GCP can be retrieve by the geographic coordinate. Each GCP is recorded as its row and column index in L1A image coordinate space, the latitude and longitude vales, as well as DEM value. Then the RPC refinement is executed with GCPs.
Finally, the L1A TIR image is orthorectified again with refined PRC coefficients and DEM to generate the L4 production. The orthorectification process is shown in Figure 3.

3. Experiment and Results

The two experiment designs, regarding the modified RIFT registration and SDGSAT-1 TIS image orthorectification, respectively, are described in Section 3.1, and the experiment results are displayed in Section 3.2.

3.1. Experiment Design

The performances of the proposed modified RIFT algorithm and orthorectification framework are tested in the following two experiments.

3.1.1. Experiment for Modified RIFT

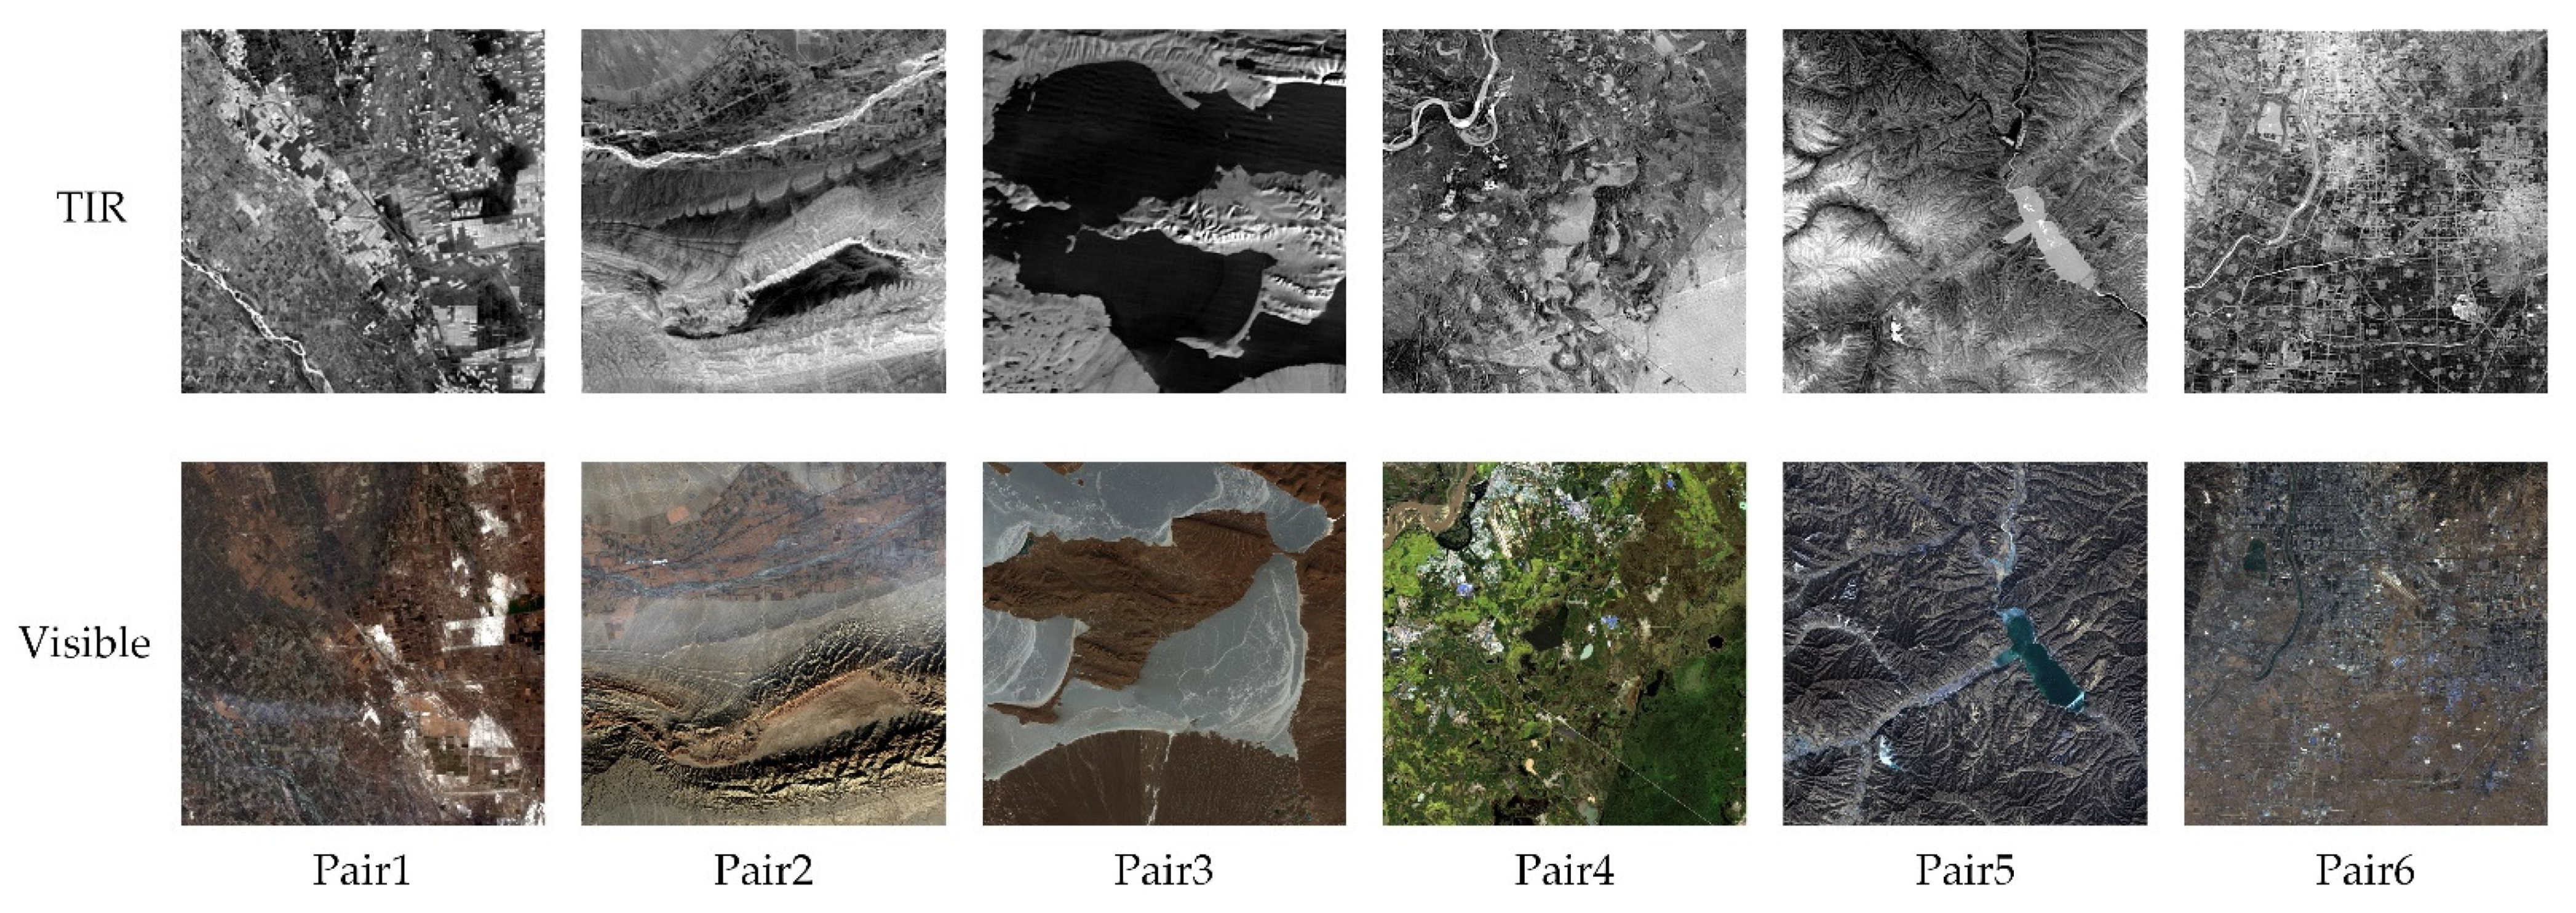
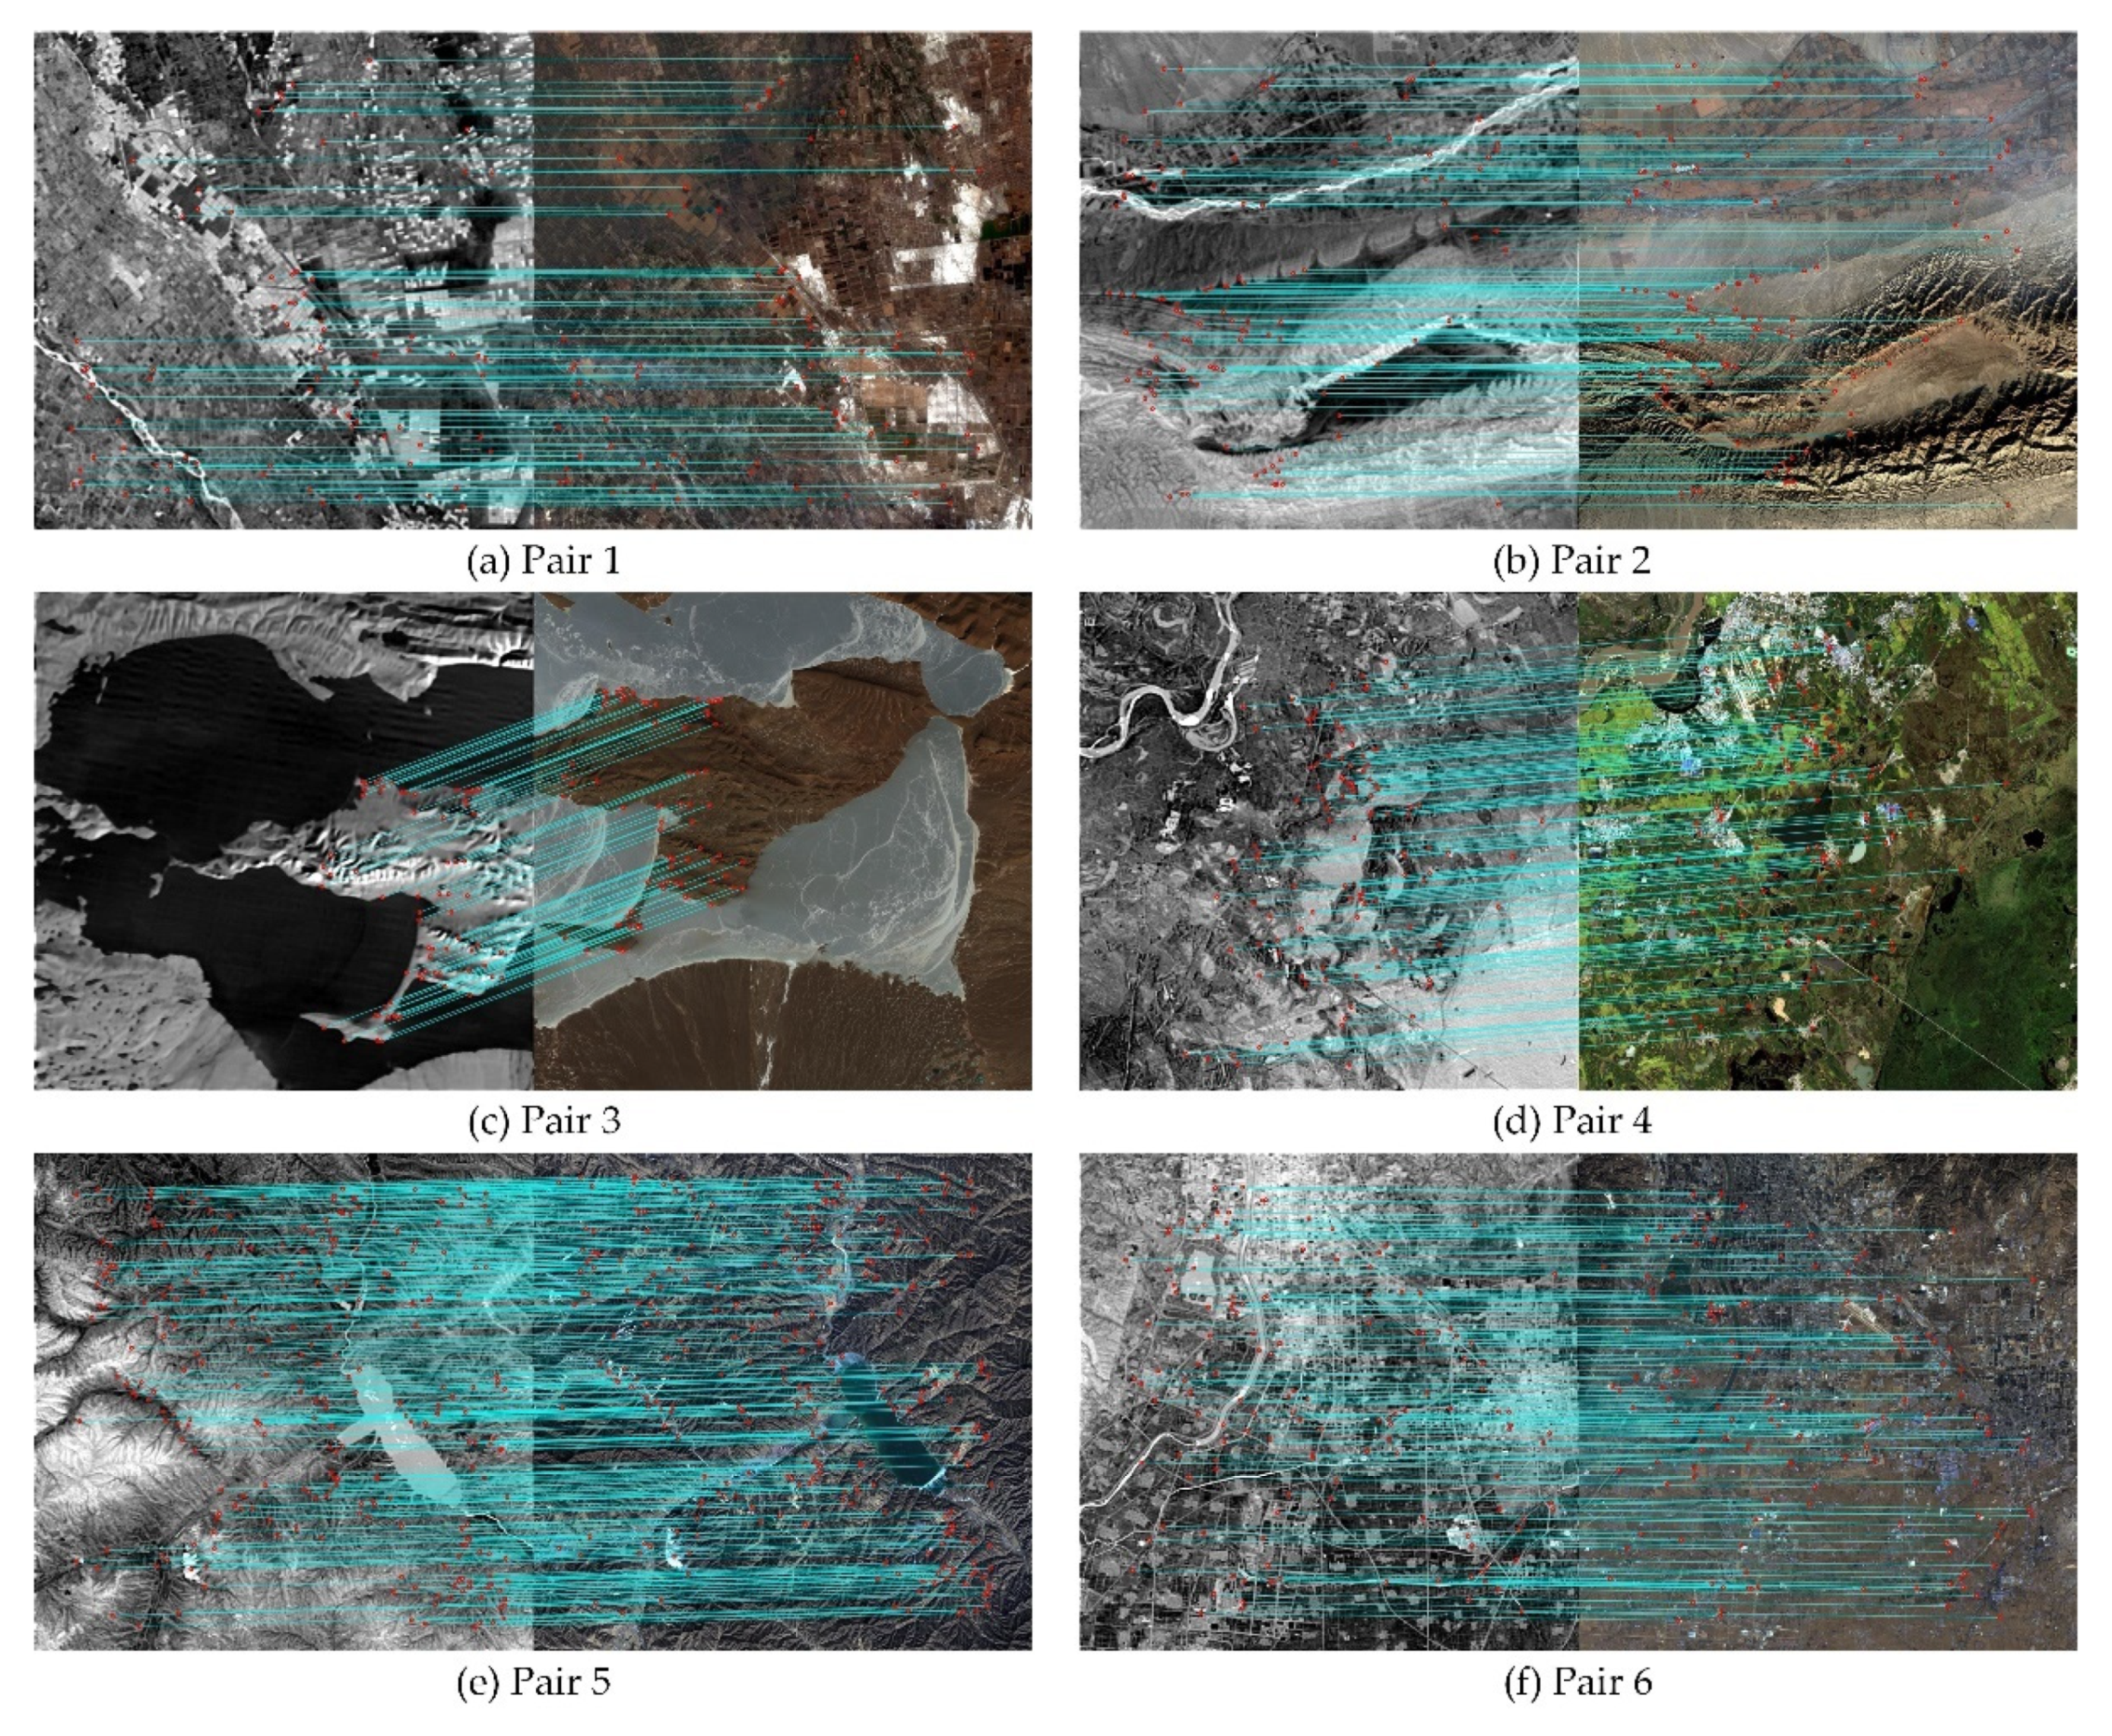
Six image pairs, TIR images of SDGSAT-1 and visible images of Landsat and GF1-WFV, are used for this experiment. Each image has 1000 × 1000 pixels. The TIR and Landsat visible images have 30-m spatial resolution. The GF1-WFV visible images have 16-m spatial resolution and are resampled to 30 m. The reason for using Landsat and GF1-WFV as a reference image is that they have global data acquisition capability and are free open sharing. These test image pairs are captured on different days and have different landforms in China. Each image pair has more than 50 percent area overlap. The TIR images have been coarsely registered by several manual GCPs to obtain the georeferenced coordinate. The visible images are orthoimages. All the test image pairs, and their detailed information, are shown in Figure 4 and Table 2.

3.1.2. Experiment for Orthorectification of SDGSAT-1 TIS

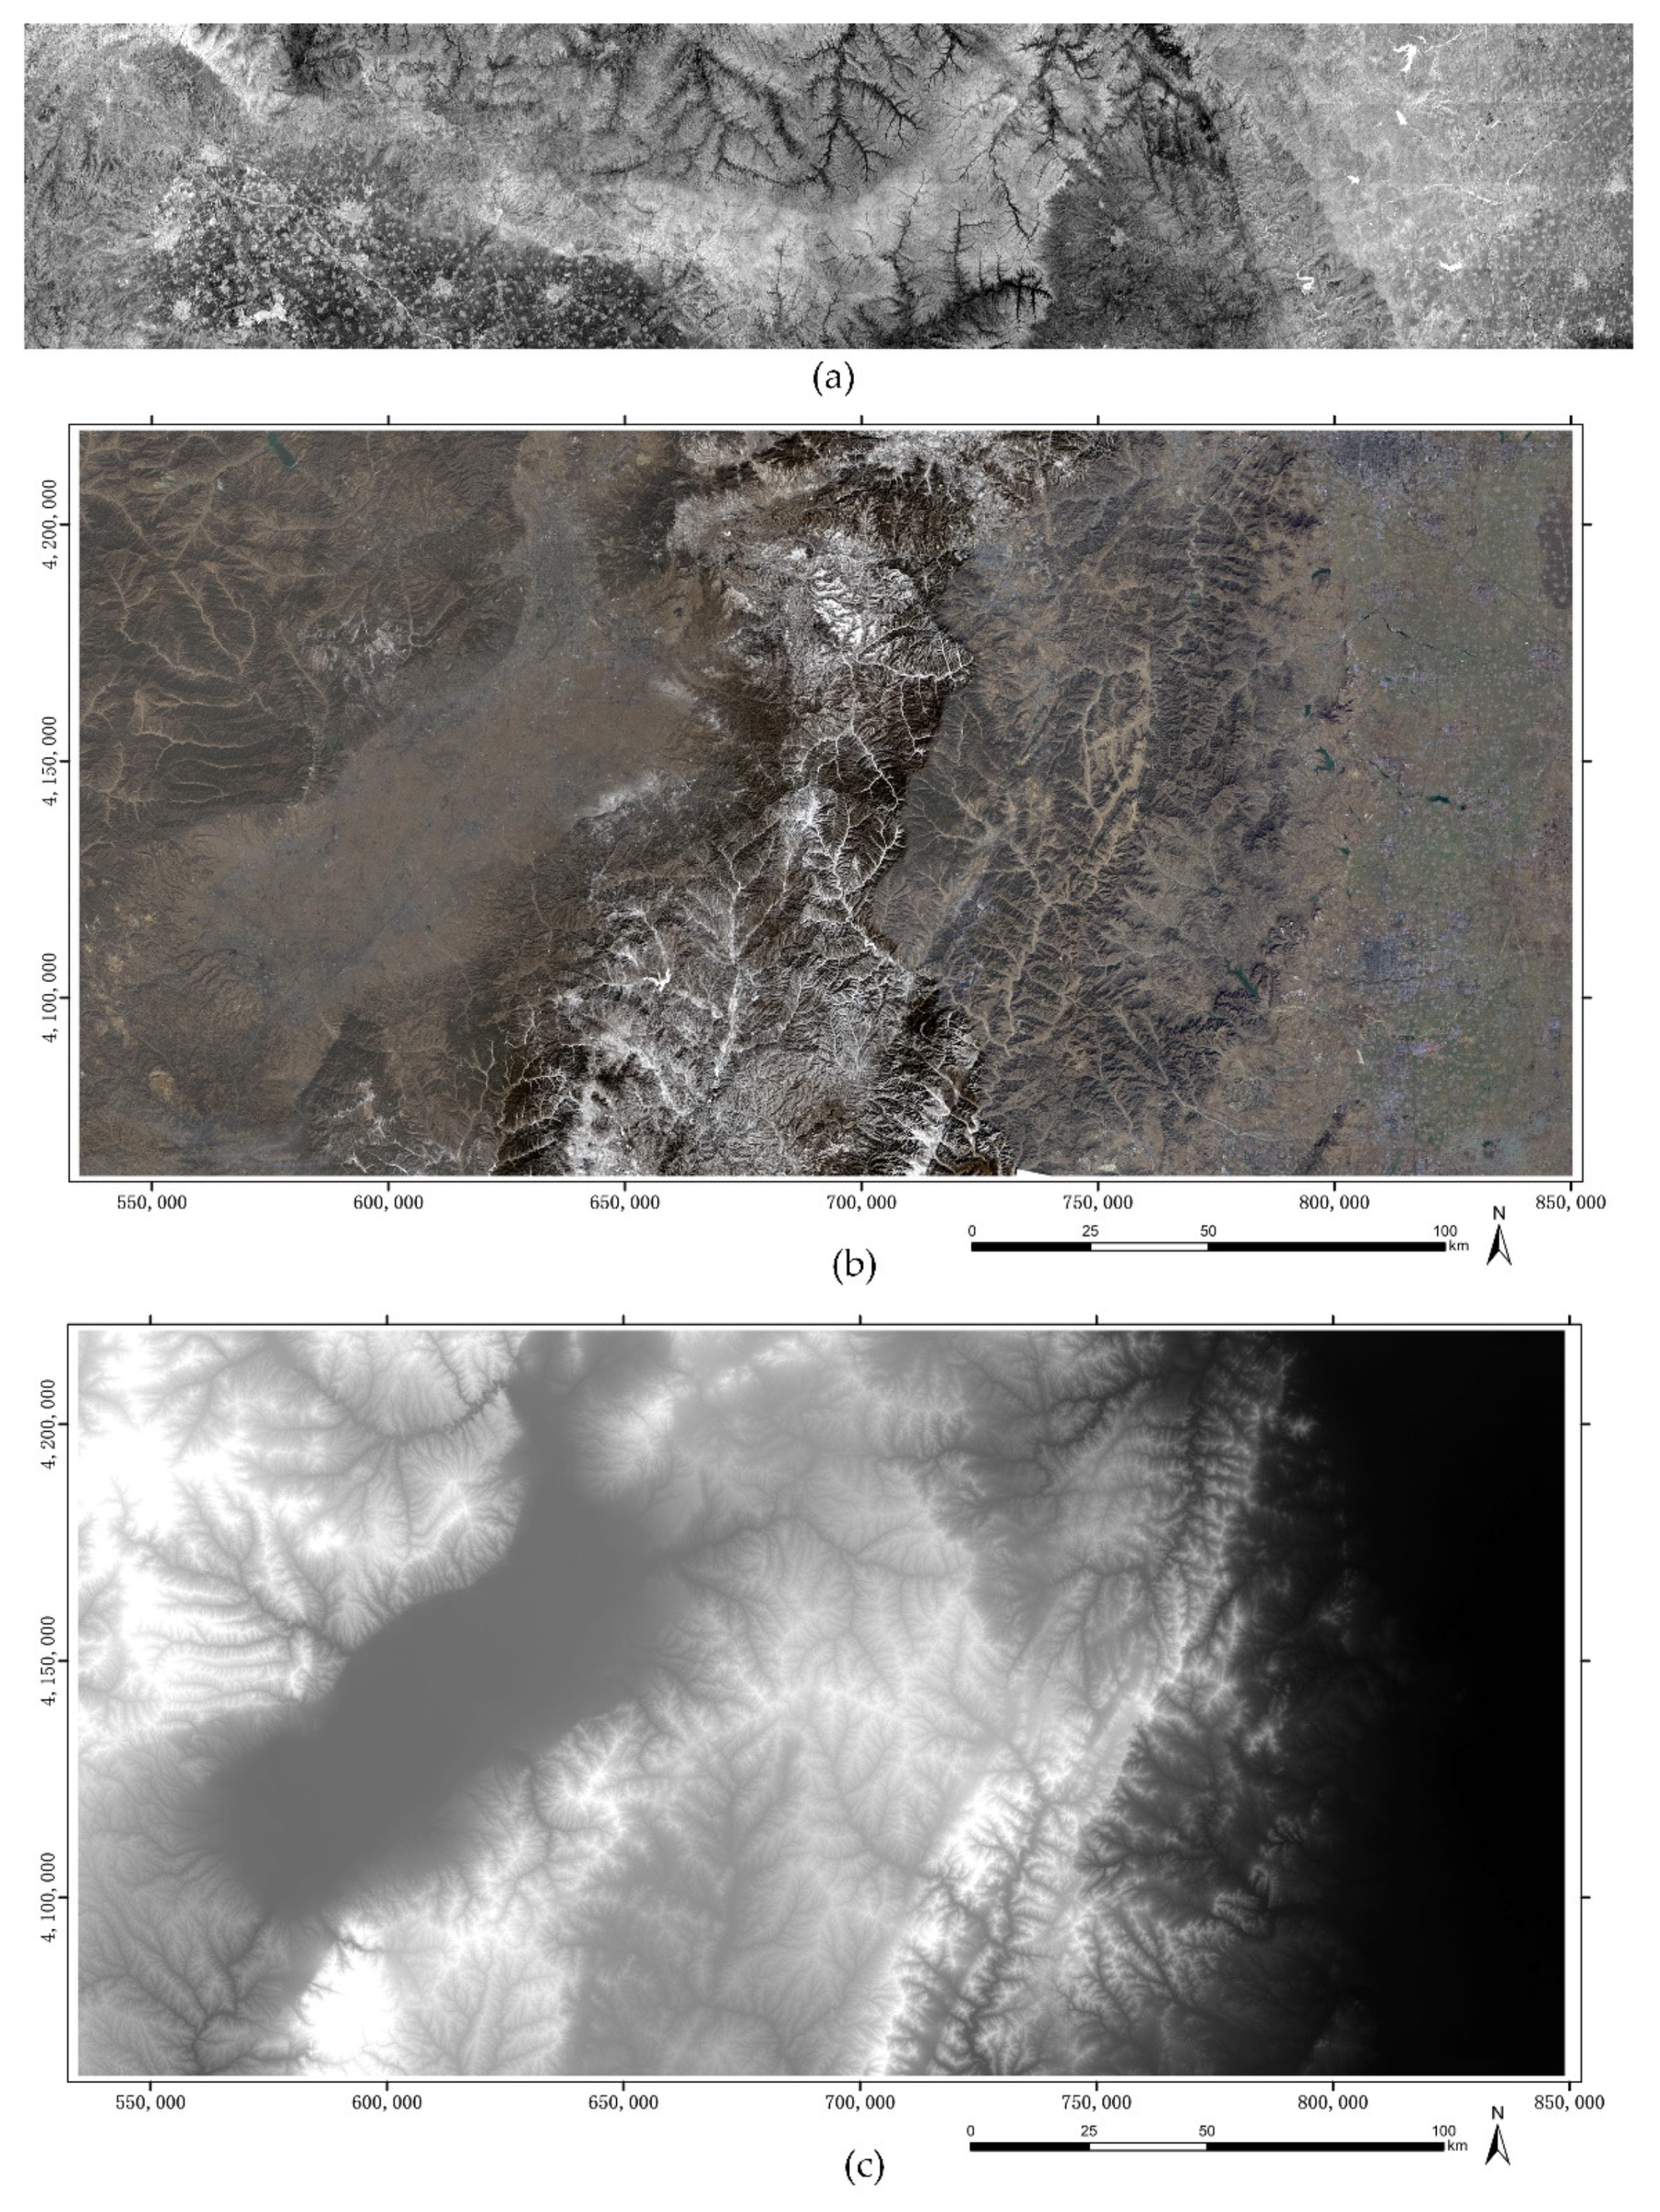
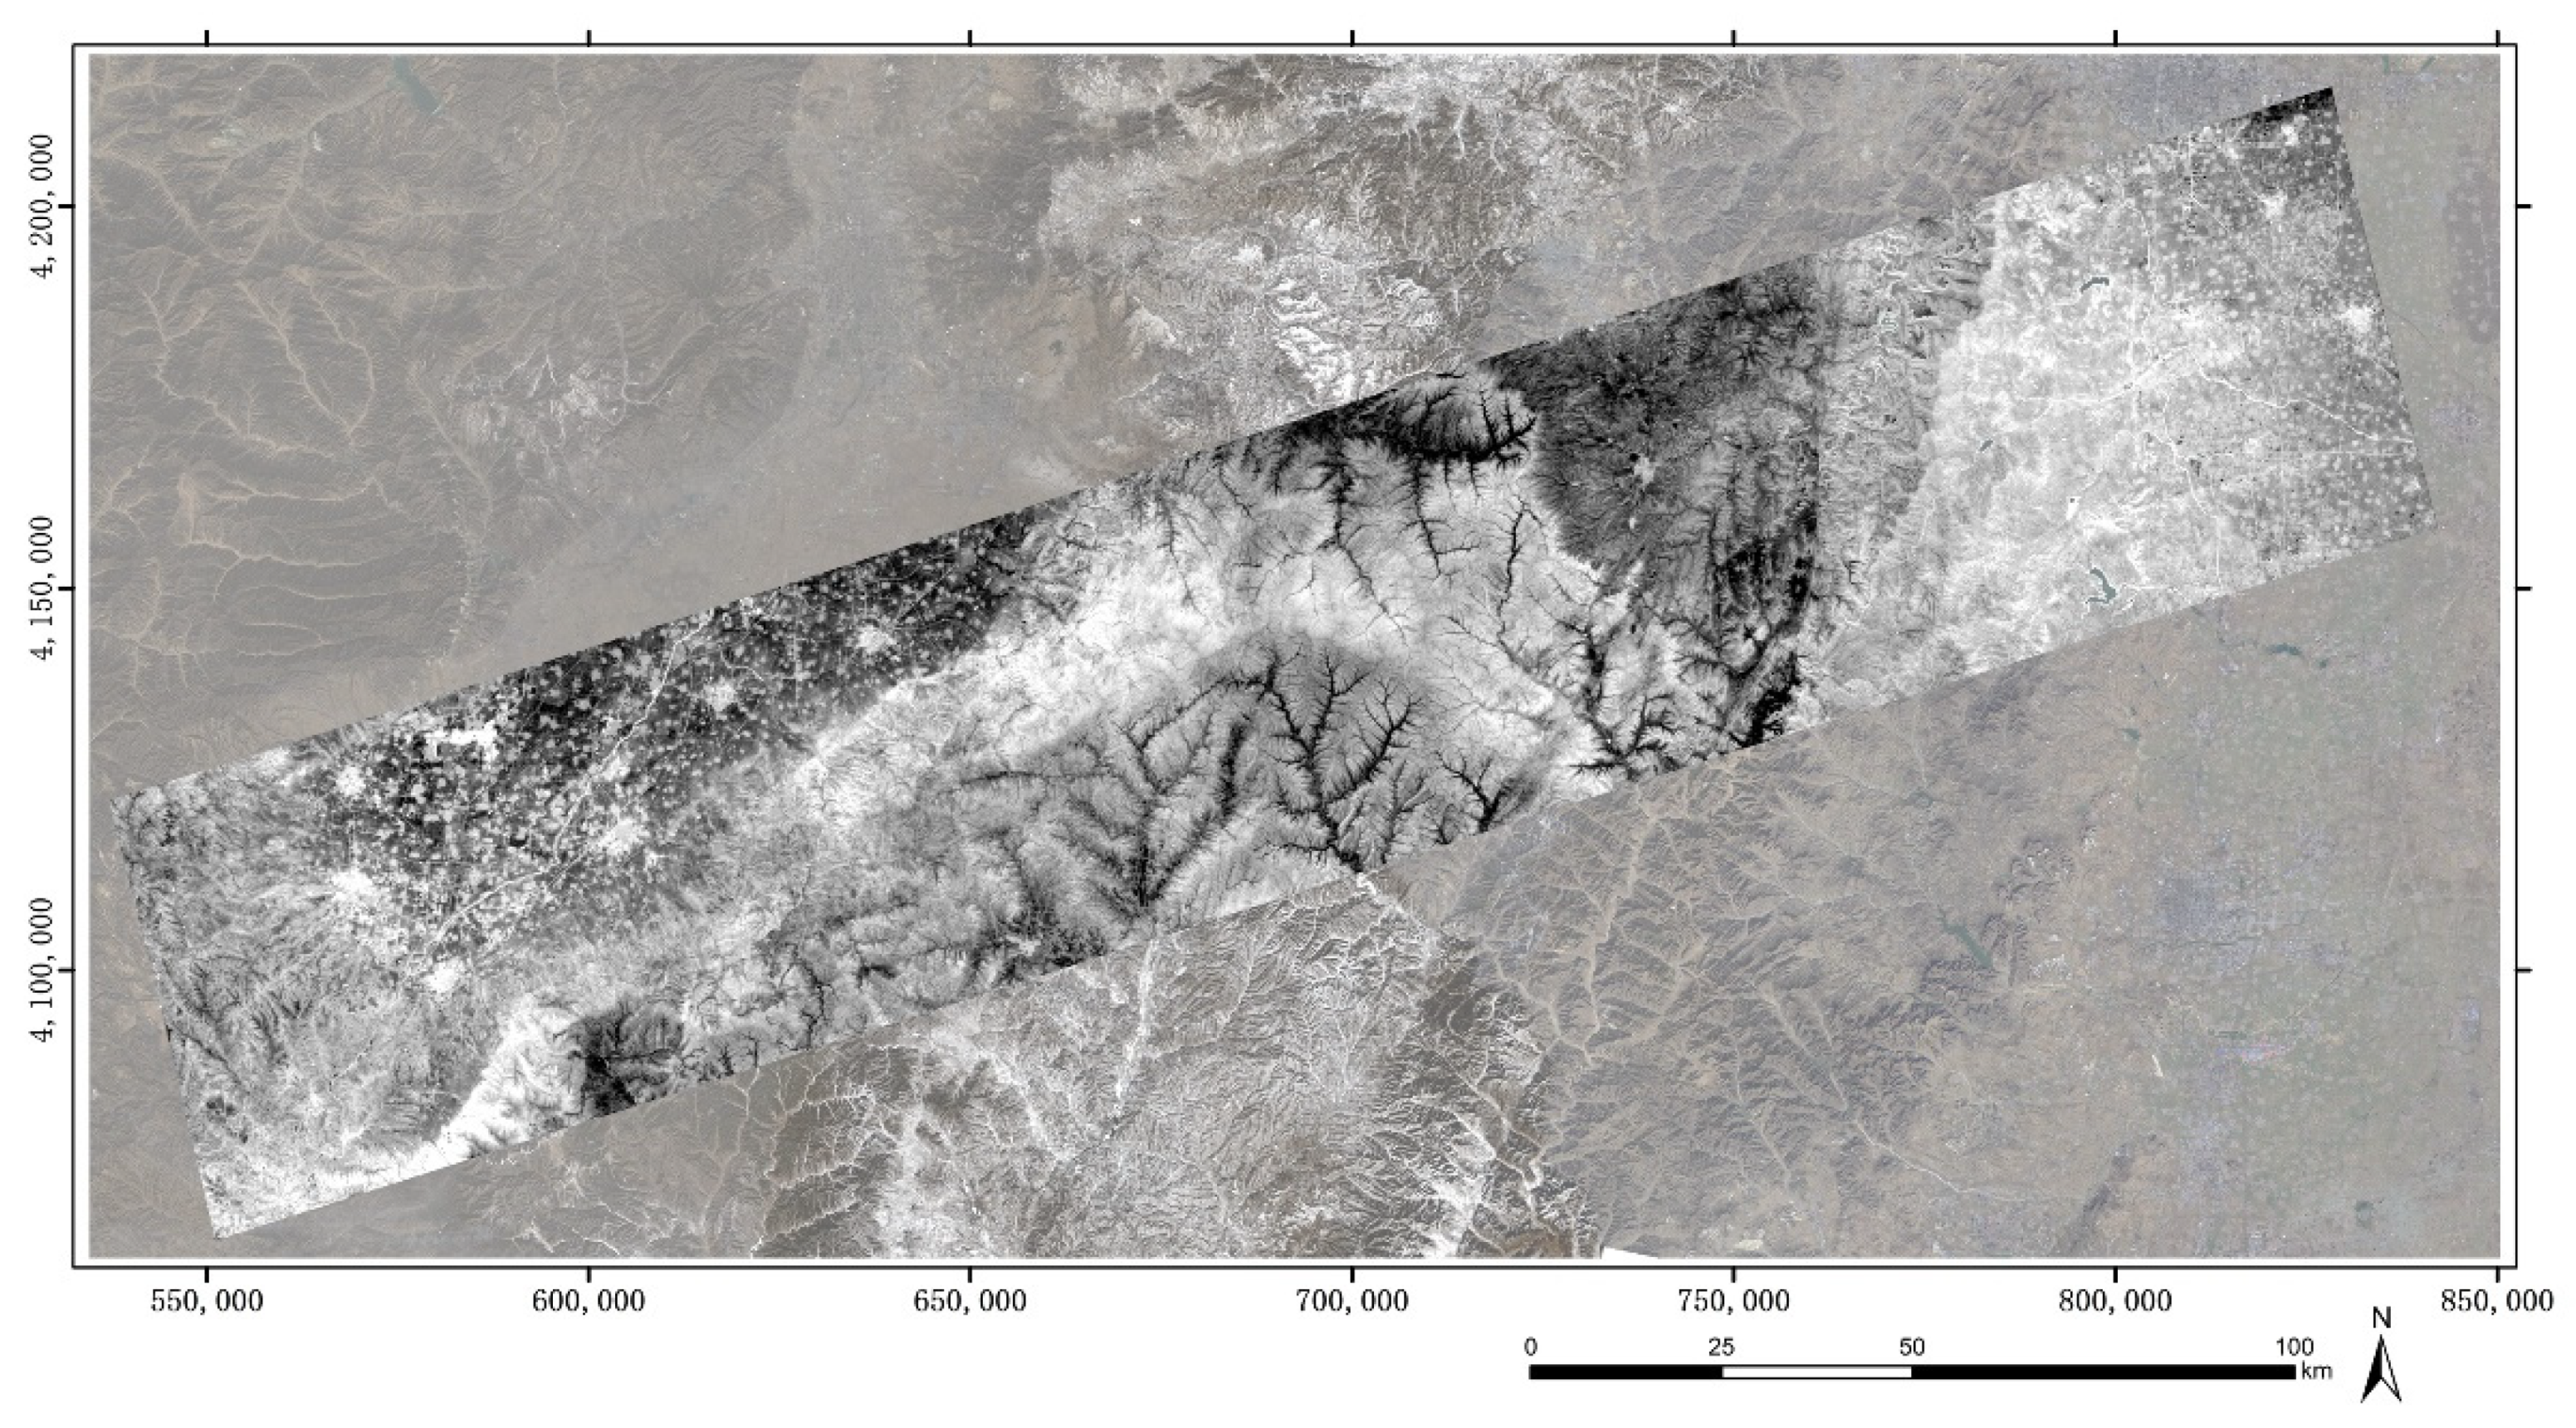
One scene of the SDGSAT-1 TIS image, with 1987 × 10 , 000 pixels, is used for this experiment. The TIR image is the L1A product with RPC coefficients. It was captured on 6 January 2022, in Taiyuan, China. The visible image of Landsat 8, with 30-m spatial resolution, is an orthoimage and is used as the reference base image. The SRTM data, with 30-m spatial resolution, is used as the DEM. All the Landsat 8 and SRTM data are downloaded from https://earthexplorer.usgs.gov (12 March 2022) and mosaiced by the ENVI software to generate the corresponding range with the TIR image. All the test data are shown in Figure 5.
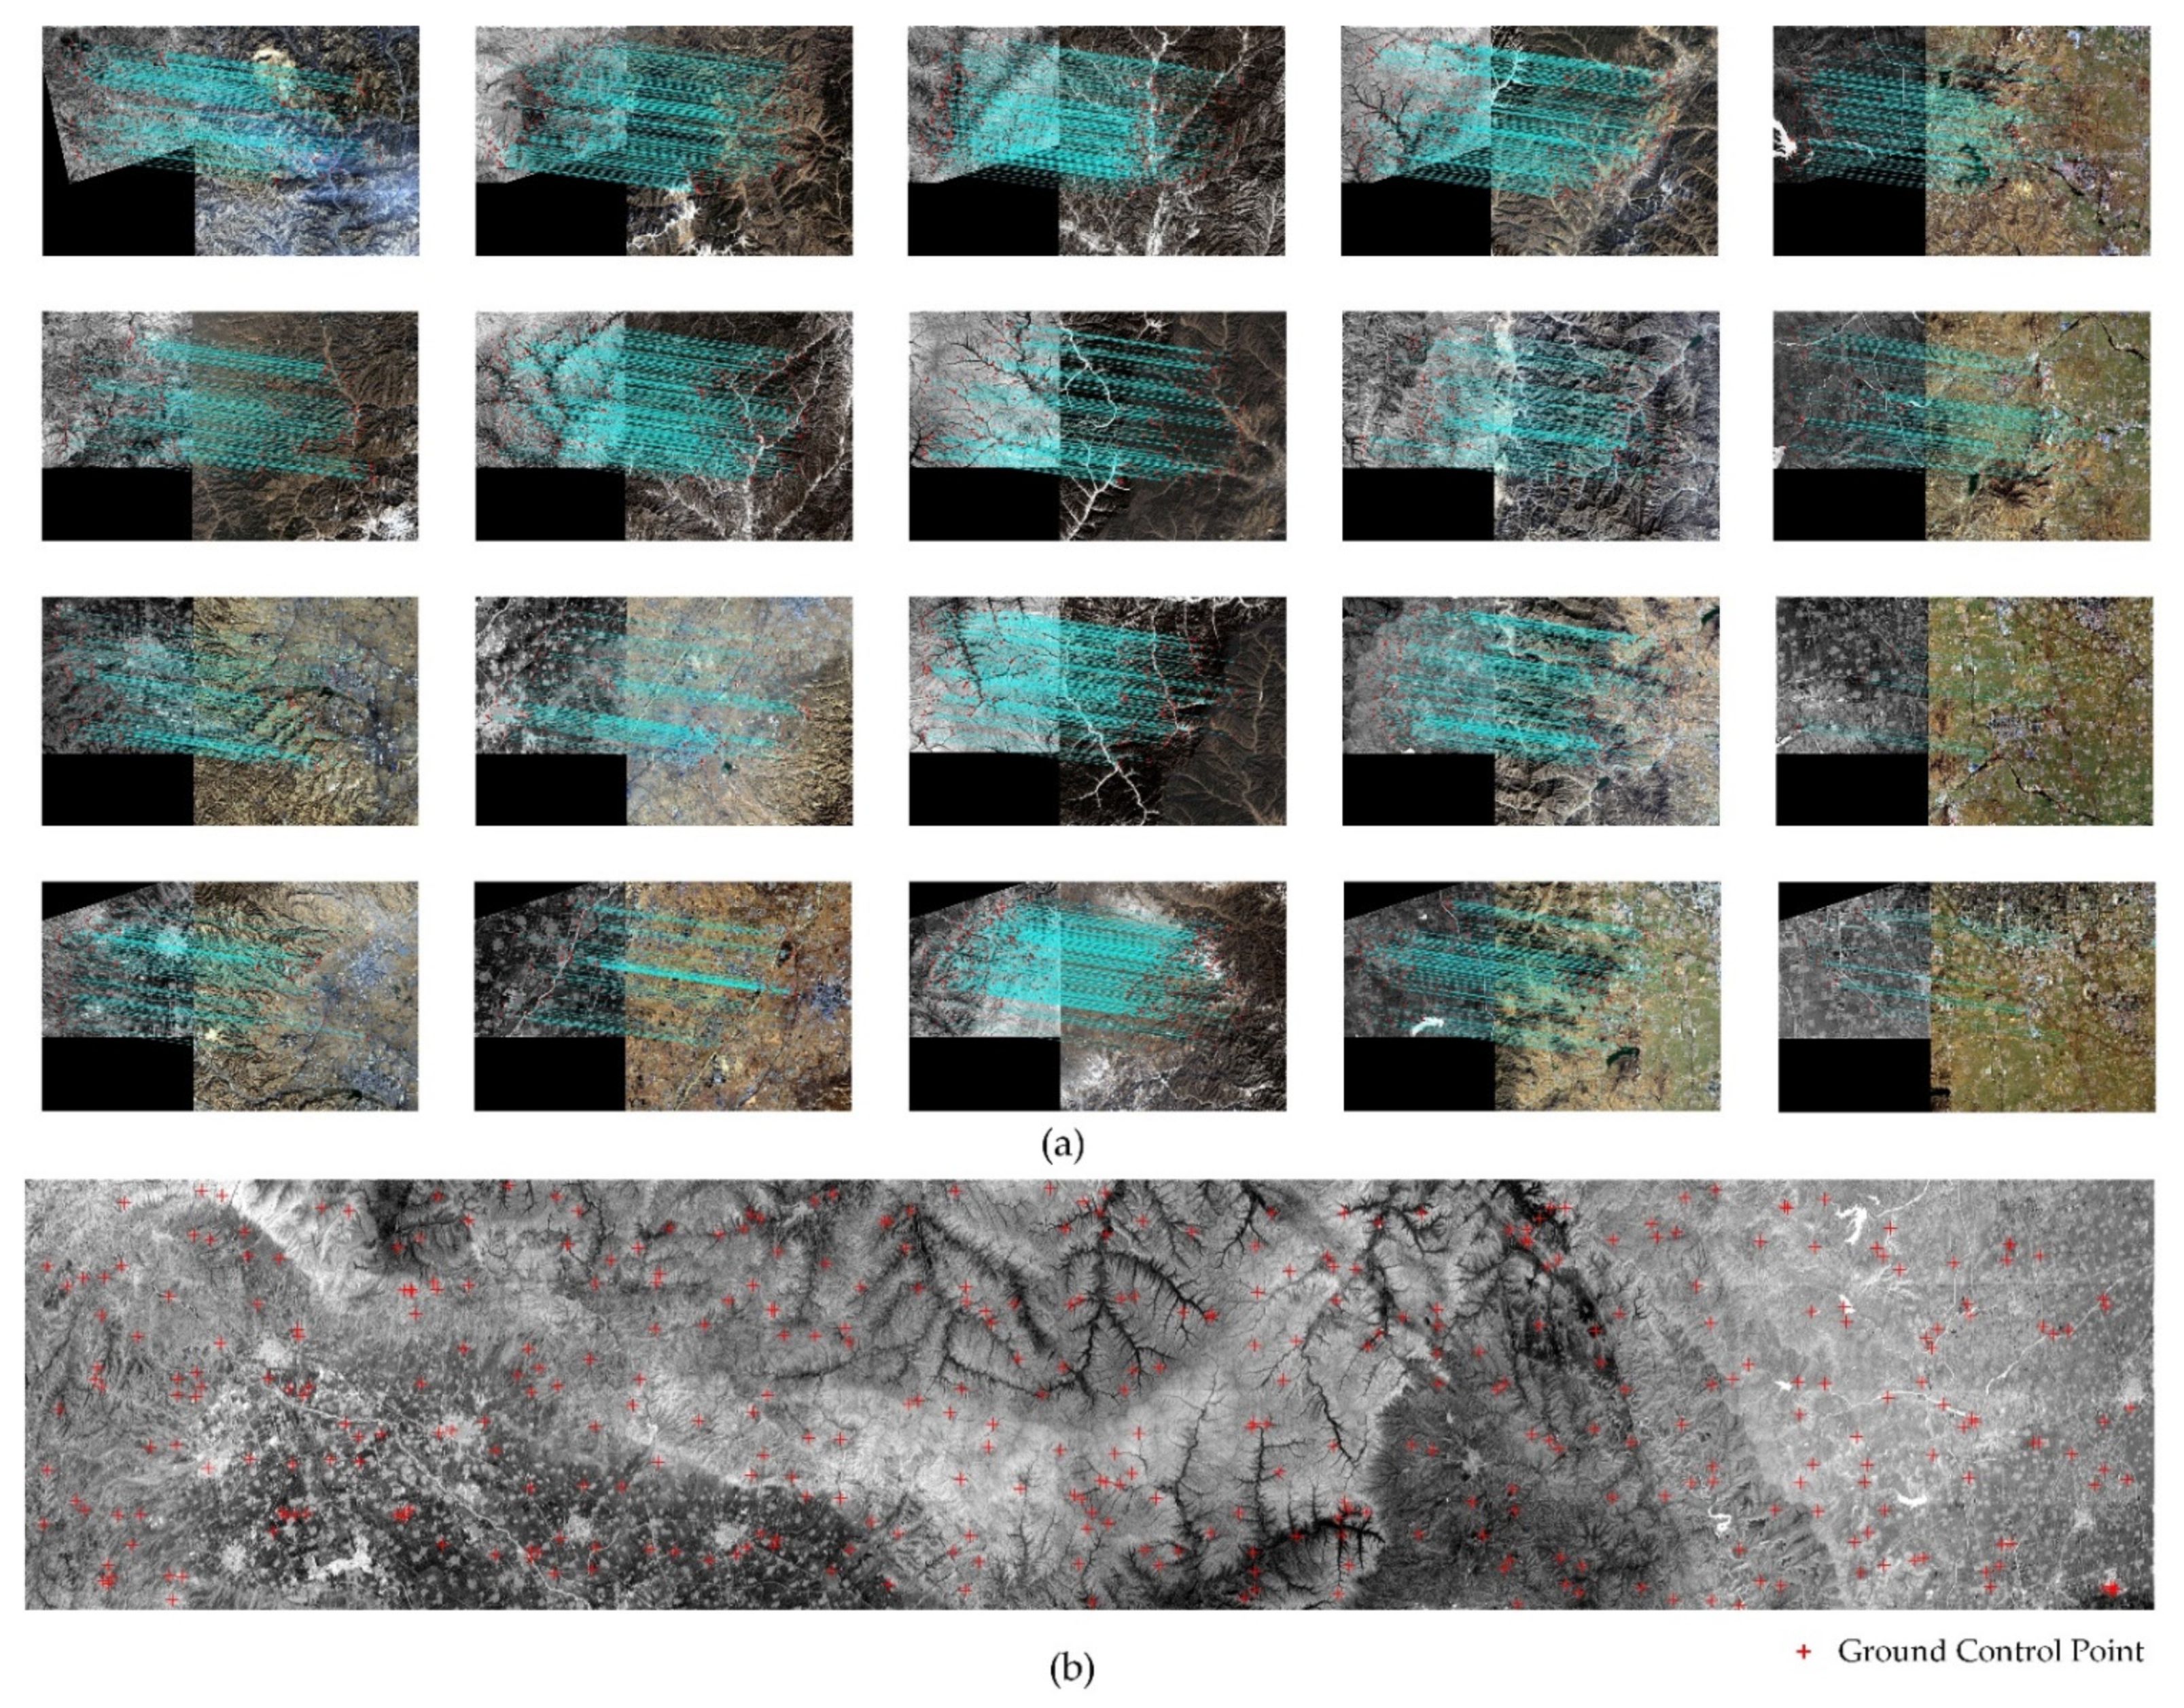
In order to improve the computation efficiency, the L1A TIR image is divided into a 500 × 500 pixels patch, which has, totally, 4 × 20 patches. Considering the georeferenced offset exists, the visible patch is set to 800 × 800 pixels. Each TIR patch is registered with the corresponding visible image patch. Only five corresponding points are selected randomly in each patch. Totally, 400 GCPs are used for refining the RPC coefficients. The RPCs’ refinement and orthorectification are executed with the ENVI RPC Orthorectification Workflow toolbox.

3.2. Result

In order to show the registration results more clearly, the TIR images are displayed with the homomorphic filtering in the following sections.

3.2.1. Results of Modified RIFT

As shown in Figure 6, the modified RIFT can effectively find enough corresponding points between the TIR and visible images, in the situation of different sensed time, different landforms and different sensors. The images in pair3 and pair4 have relatively large georeferenced offset between TIR and visible, but the modified RIFT can still find corresponding points in the overlap areas. The visible images come from different sensors, Landsat8 and GF1-WFV, and fair registration consequences are achieved. The modified RIFT is robust enough in the TIR-visible registration task for SDASAT-1.

3.2.2. Results of Orthorectification

As shown in Figure 7, some patch pairs’ registration results are displayed and all GCPs, extracted after the registration, are plotted on the original L1A TIR image. Each GCP contains the index of column and row, latitude and longitude coordinates, and DEM value. The L4 TIR image is shown in Figure 8, overlaying with the reference image to display the orthorectification result. Combining with the modified RIFT, the orthorectification framework proposed in this study can extract GCPs automatically from SDASAT-1 L1A TIR products and achieve L4 orthoimage production effectively.

4. Discussion

In this section, the improved performances of the modified RIFT are discussed and the registration and orthorectification accuracy are analyzed.

4.1. Performances of the Homomorphic Filtering

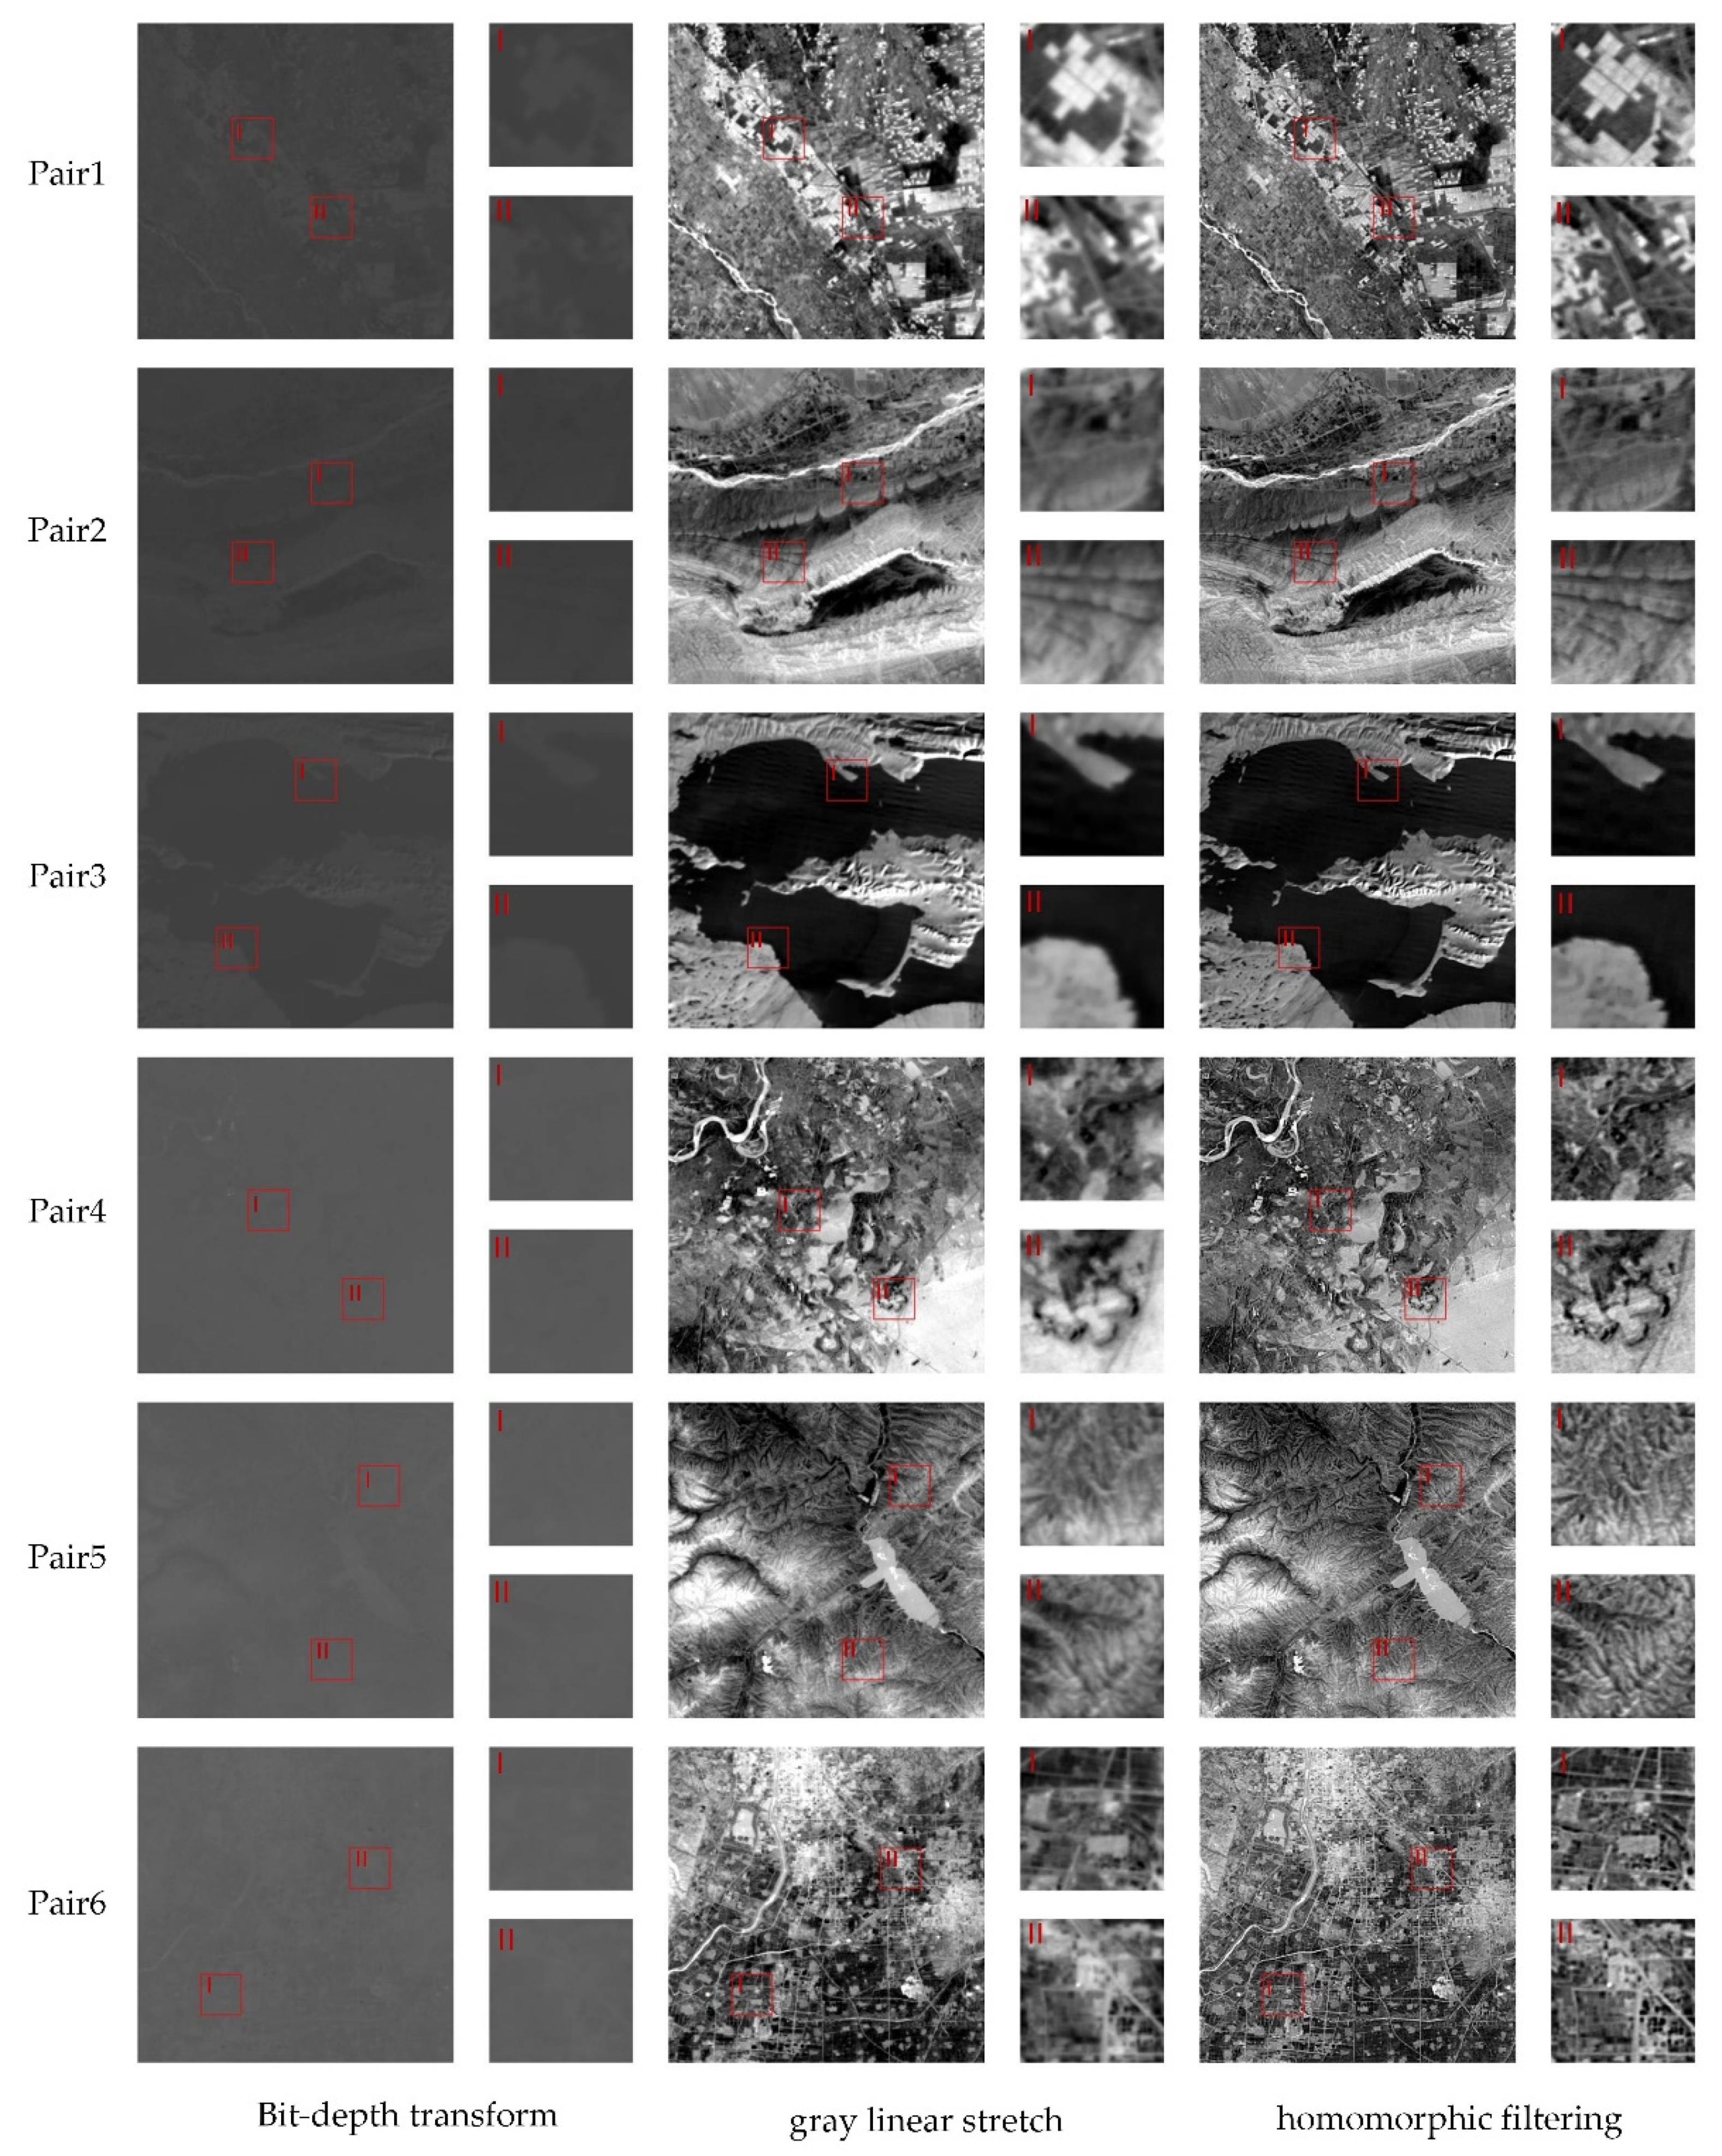
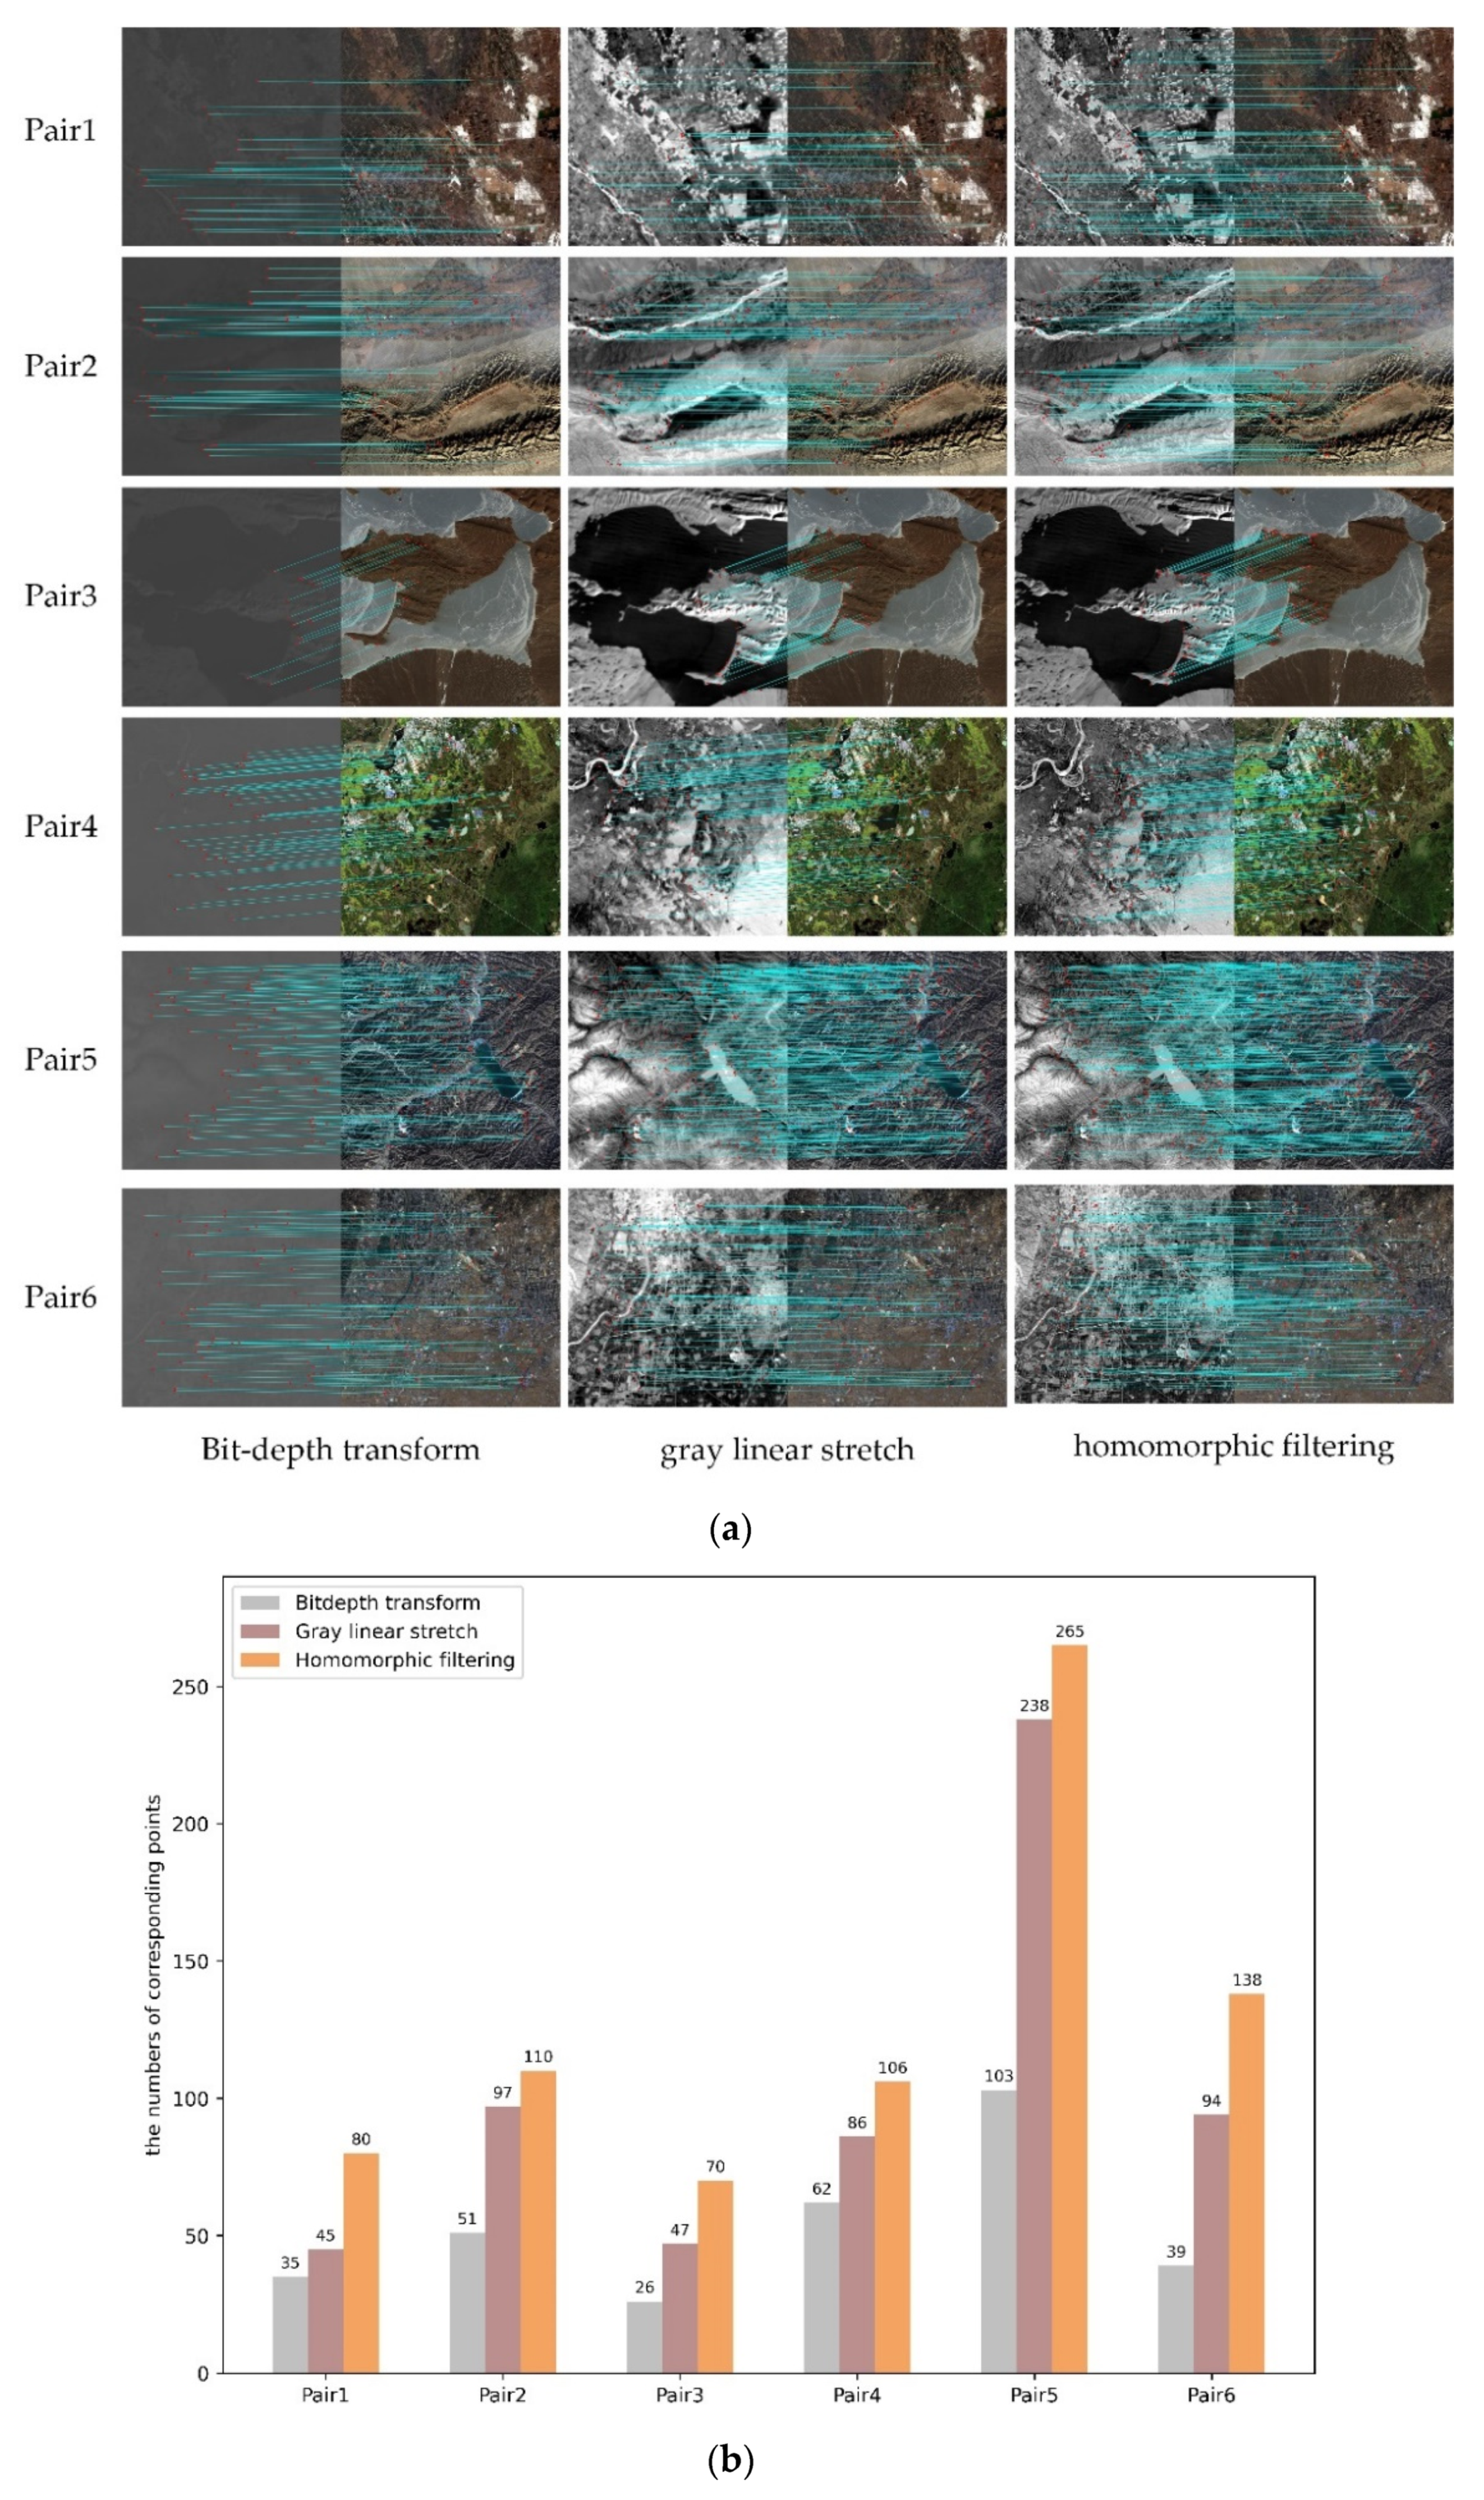
The traditional registration algorithms in computer vision are suitable for an 8-bit nature image, while the SDGSAT-1 TIS images are 12-bit. Bit-depth transform or gray linear stretch, from 12-bit to 8-bit, may compress image details, which is bad for the descriptor construction during the registration. In order to preserve the image detailed information, the homomorphic filtering is proposed in this study. The contrast test is performed as follows.
Figure 9 displays the TIR images’ gray transformation by using bit-depth transform, gray linear stretch and homomorphic filtering, respectively. It is quite obvious that the homomorphic filtering can enhance the image contrast and keep the image edge details, when transforming TIR images from 12-bit to 8-bit. Bit-depth transform compresses the effective grayscale range of the image and reduces the image contrast. Gray linear stretch keeps the effective grayscale range, but the edge details are blurrier than homomorphic filtering. Figure 10 shows the registration result by using the modified RIFT, with three different gray transformations. The correct corresponding points are counted. The homomorphic filtering gets more corresponding points than the other two gray transformation methods, which indicates that it is necessary to execute homomorphic filtering for the TIR image before registration.

4.2. Performances of Modified RIFT

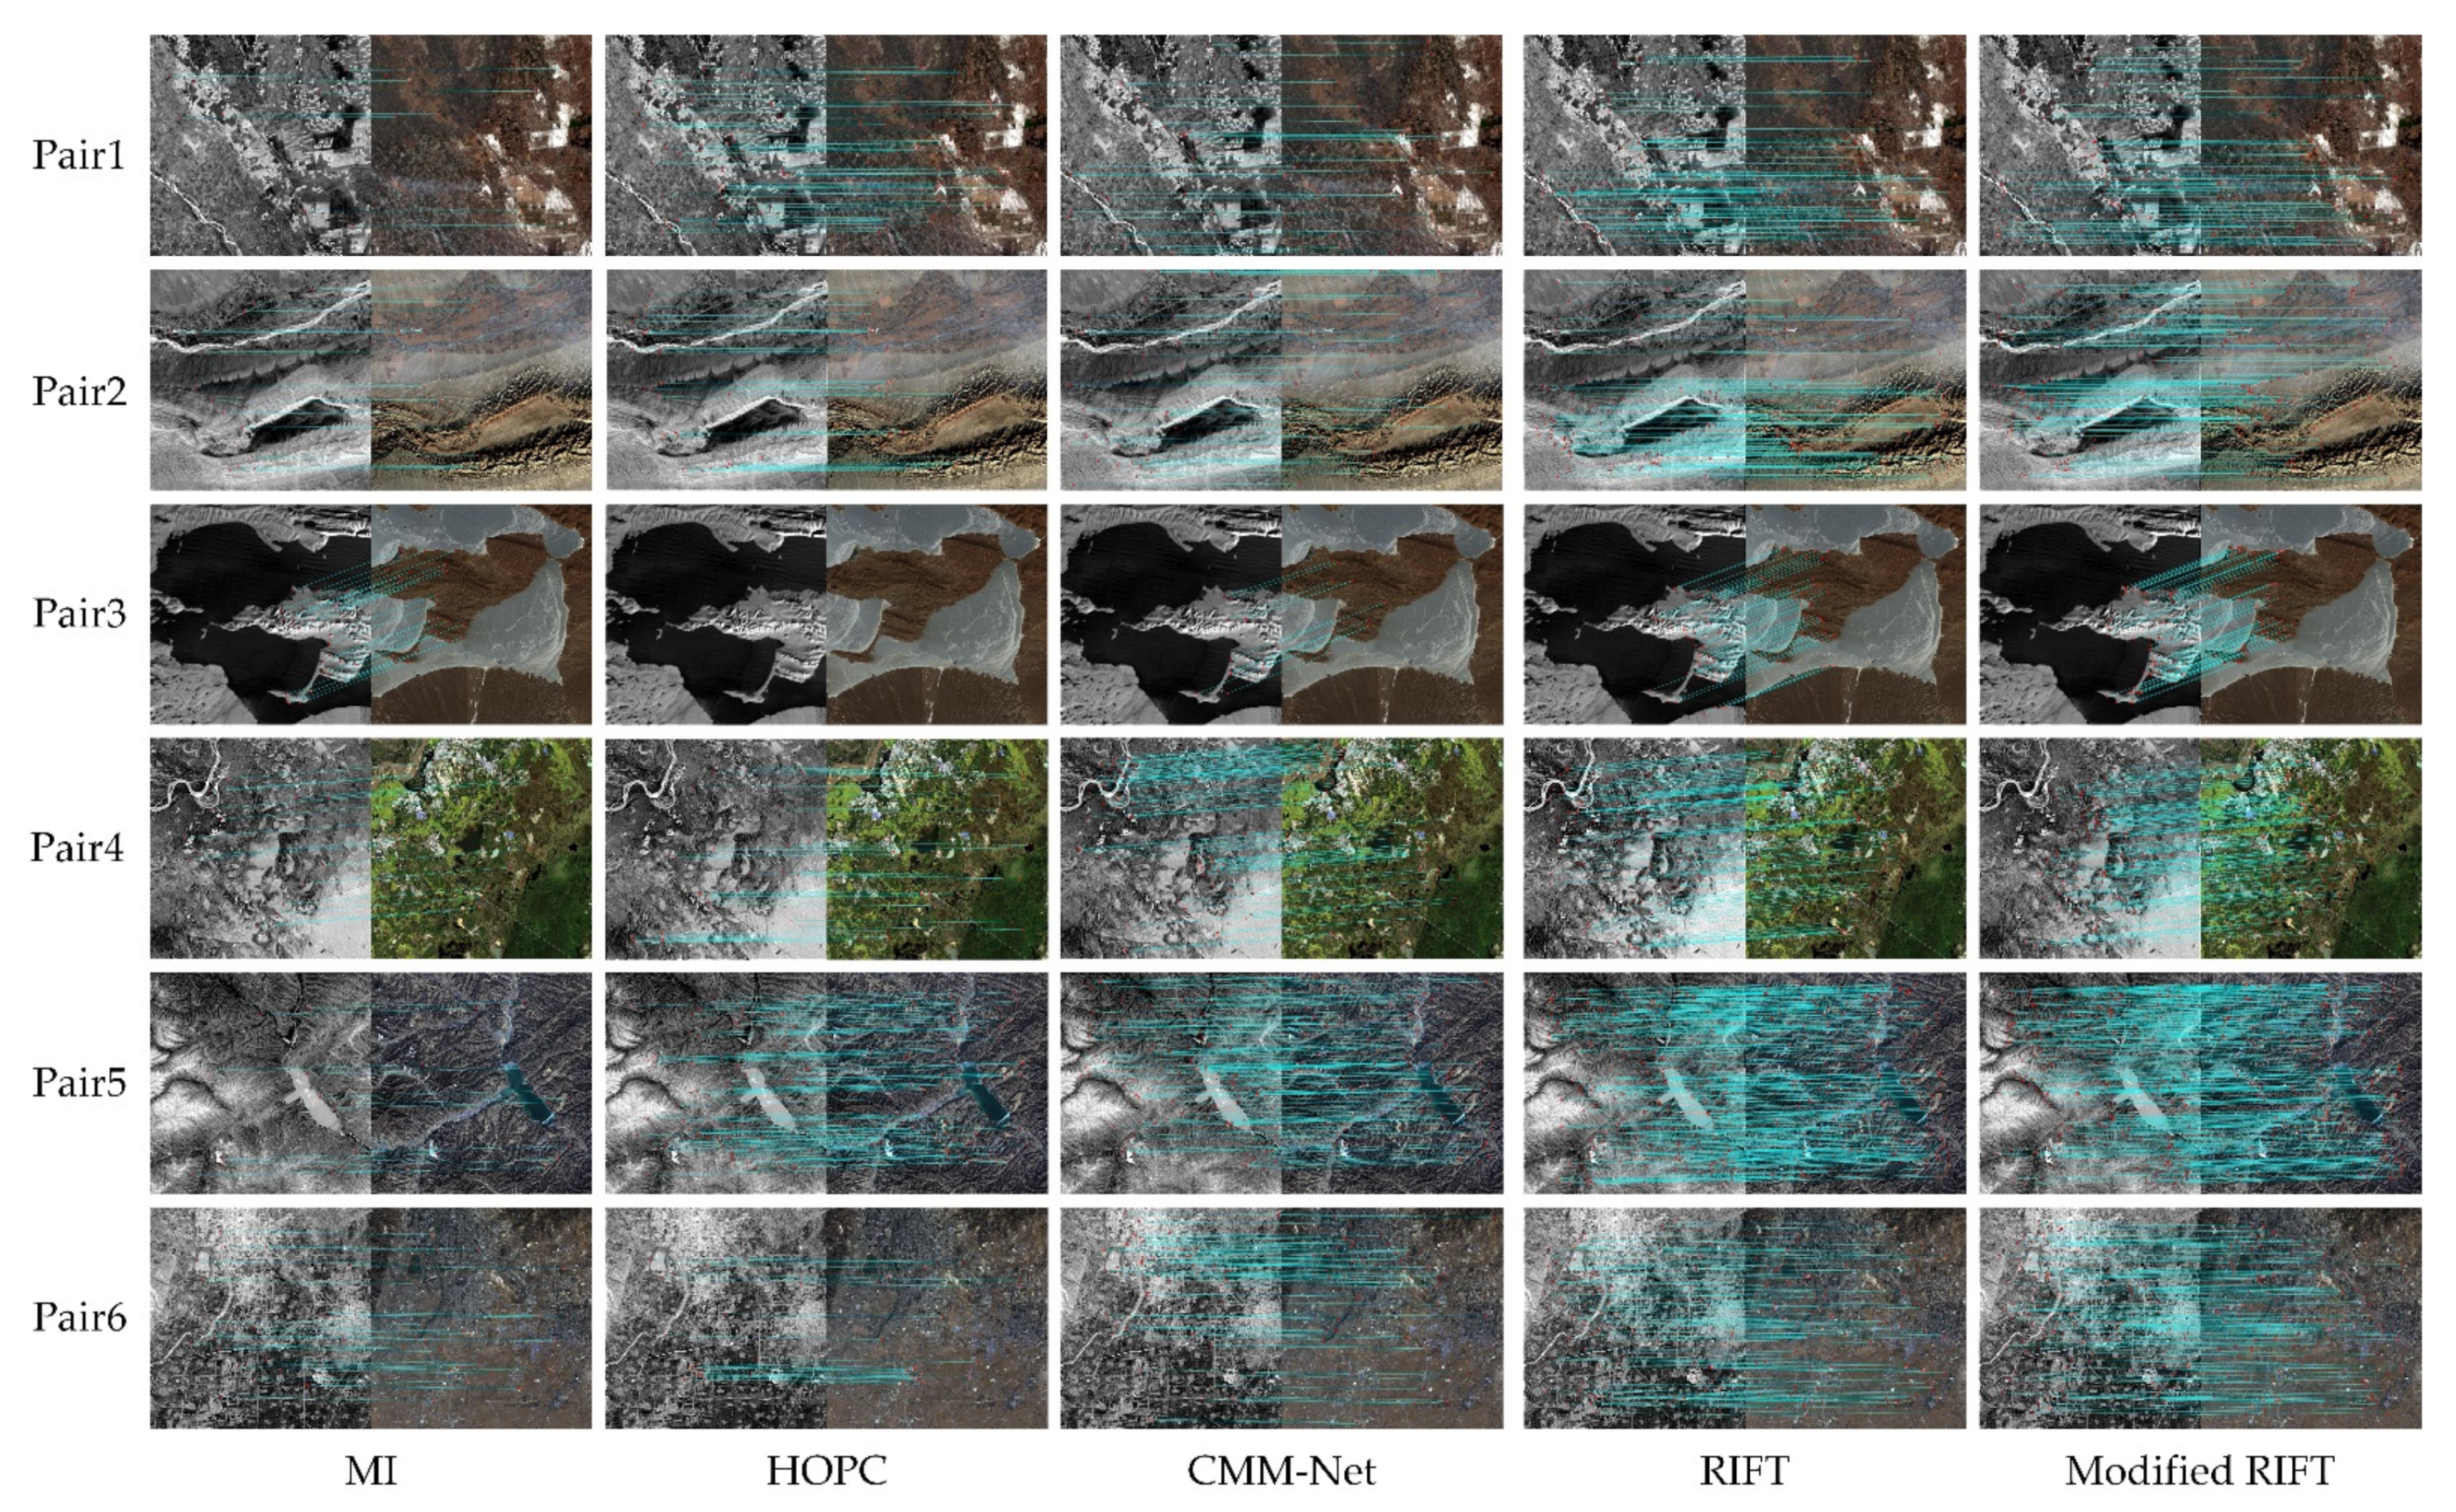
The comparison test is performed to establish the potentially improved performances of modified RIFT. Four registration methods, which are invented for the cross-modality remote sensing image registration, i.e., MI, HOPC, CMM-Net, RIFT, are used as the comparative experiment with the modified RIFT proposed in this study. All these methods include the traditional methods and the state-of-the-art methods. They are applied for the six test image pairs. Figure 11 shows the registration results. The number of correct corresponding points is considered as the evaluation index. The statistical results are shown in Table 3.
MI is the traditional area-based method. Because it is easy to calculate, the MI method has been integrated into the image-processing software, such as ENVI. It is more robust to non-linear radiometric differences than other traditional area-based methods. In this test, MI can get some corresponding points, but not enough. Due to using the template matching scheme, the offset between the sensed image and the reference image must be within several pixels. If the offset is too large, such as pair3, the search area needs to be widened, which uses more computation time. HOPC is one of the state-of-the-art area-based methods that combines with the PC model. It performs better than the MI, except for pair3. The HOPC needs to know the accurate geographic information and is invalid when the offset between the sensed and reference image is too large. CMM-Net [52] is one of the state-of-the-art deep learning registration methods. It uses D2-Net as the feature extractor, to extract corresponding points efficiently and construct robust descriptors. It achieves an acceptable result in six test pairs. However, CMM-Net needs vast TIR-visible image pairs as training data and lacks generalization. RIFT is the feature-based registration method that combines with the PC model. It achieves a satisfying result in all the test pairs. Modified RIFT gets better performance than RIFT because of adopting the homomorphic filtering and the binary pattern string construction of the descriptor. The modified RIFT has high generalization in different landforms.
In terms of time efficiency, modified RIFT also has satisfying performances. Although CMM-Net spends the least time in the test, it needs a large amount of time to train the model. The processing time of MI and HOPC is not balanced in the six test pairs. When the offset is large, the search radius of template matching needs to increase, which results in more processing time. The time of modified RIFT is slightly faster than RIFT, due to the binary pattern string construction methods and is steady in all the six test pairs.
Modified RIFT can effectively address the problem of non-linear radiance differences, but it does not achieve good performance when the sensed and reference images have significantly different spatial resolution. Further, the processing time of modified RIFT still needs to be optimized in a future study.

4.3. Qualitative Analysis of the Registration Accuracy

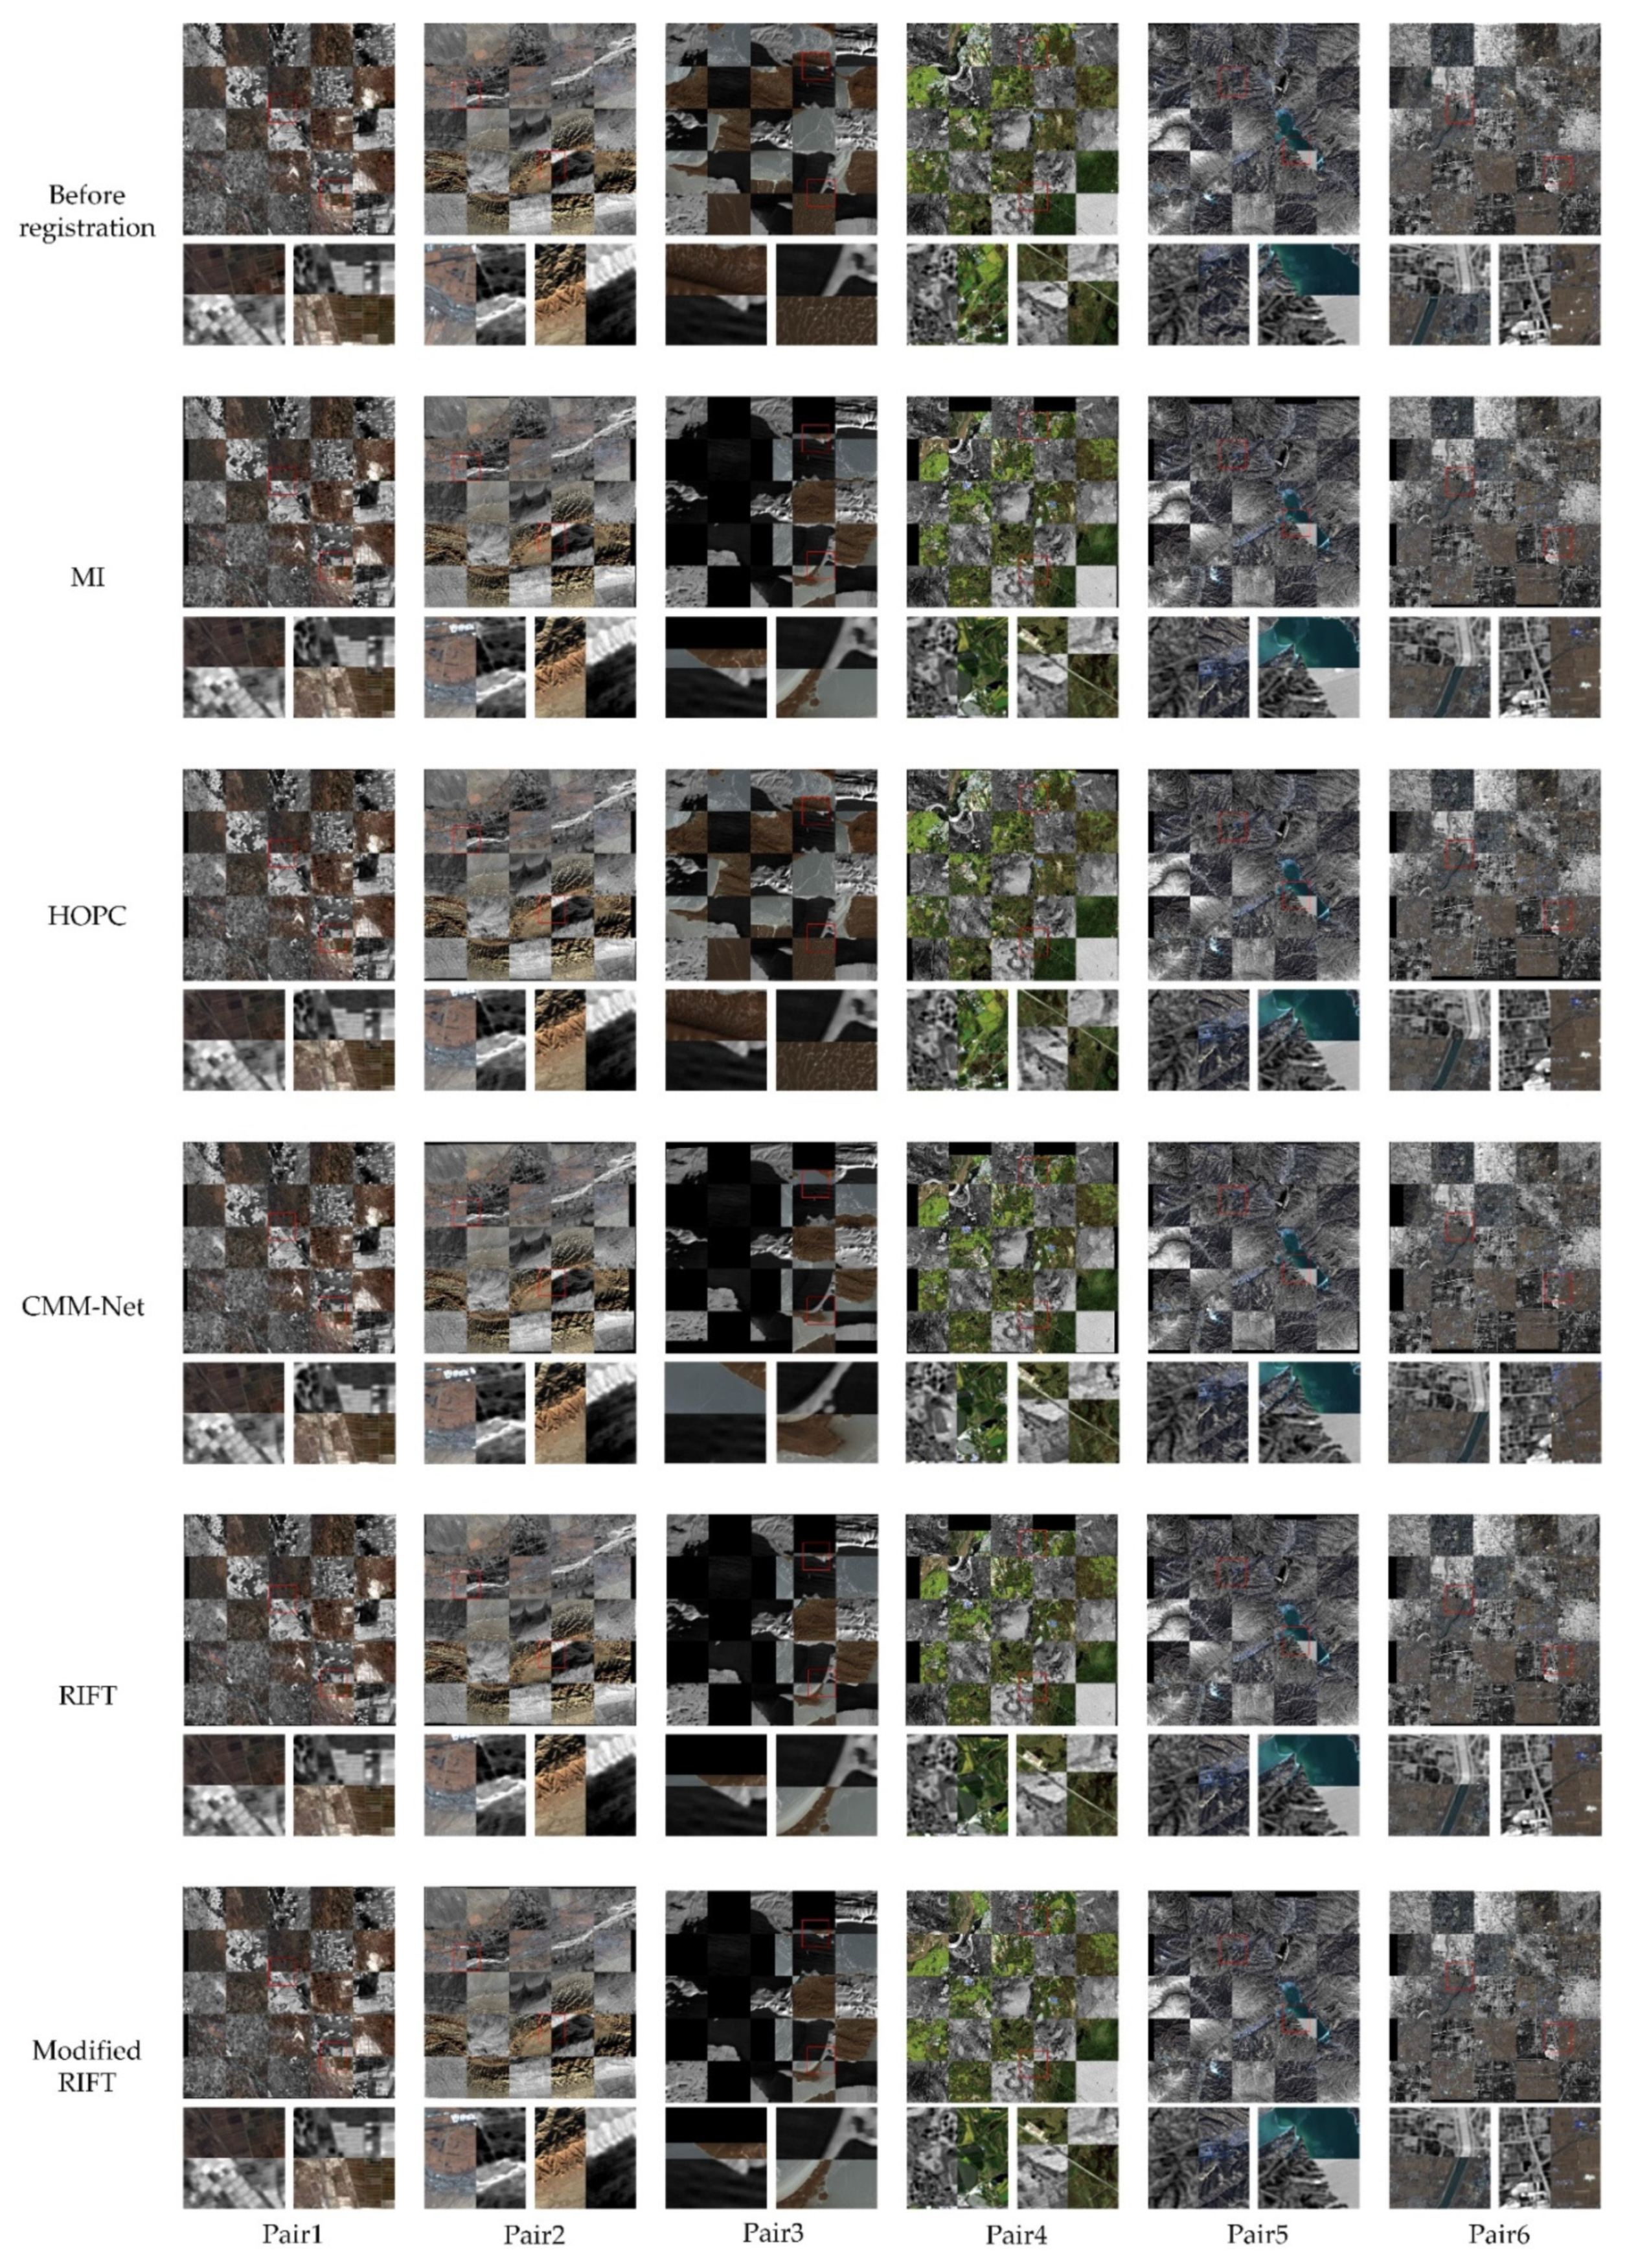
The checkboard-displaying method is adopted to analyze the registration accuracy, qualitatively. Figure 12 displays the stacking image of TIR-visible pairs, with enlarged views of five registration methods. There are obvious misalignments between the TIR and visible image before registration. MI eliminates most of the misalignments and there are still a few stitching errors. HOPC achieves good performance in pair1 and pair2, and fails in pair3. CMM-Net also has unsatisfactory registration results in pair3. The reason for the bad registration accuracy is that the corresponding points are insufficient and imprecise. RIFT acquires good registration results and removes little stitching errors in pair6. The modified RIFT achieves ideal registration accuracy in all test pairs.

4.4. Quantitative Analysis of the Orthorectification Accuracy

The effectiveness of modified RIFT for TIR-visible image registration has been proved in the above discussion. In this section, the geometric accuracy of the SDGSAT-1 TIS image after orthorectification is discussed. Distributed uniformly, 52 GCPs, which are in the image, are selected manually. The root-mean-square error (RMSE), which is defined as follows, is used to evaluate the orthorectification accuracy:
RMSE = 1 n i = 1 n [ ( x i x i ˜ ) 2 + ( y i y i ˜ ) 2 ]  
where ( x i , y i ) are the geographic coordinates in the TIR image, and ( x i ˜ , y i ˜ ) are the geographic coordinates in the reference visible image.
The RMSE in each GCP is calculated and the total RMSE is 1.98 pixels. Figure 13 displays the distribution of GCPs. The GCPs are divided into two types. The GCP plotted in green means that its error is less than 2.5 pixels and the GCP plotted in red means that its error is more than 2.5 pixels. The GCPs, whose errors are more than 2.5 pixels, are distributed in both sides of the images and the mountainous area.
Because the TIR orthoimage is generated by the refinement RPCs, the orthorectification error may result from the original RPCs and the spatial distribution of GCPs. The SDGSAT-1 is currently undergoing in-orbit testing, and there is still internal distortion of the image, which makes the initial RPCs inaccurate. By using modified RIFT to get enough GCPs, and the two-step orthorectification framework, the SDGSAT-1 TIR L4 image production can attain ideal geometric accuracy. With the ongoing work of in-orbit geometric calibration, and the elimination of internal distortion, the geometric accuracy of the SDGSAT-1 TIR image will be further improved by using the method proposed in this paper.

5. Conclusions

In this study, we propose a process flow of the SDGSAT-1 TIS image, from L1A to L4 orthoimage production. Aiming to resolve the problem of unclear details in the TIR image, we employ the homomorphic filtering to enhance image contrast before registration, which can improve the TIR-visible registration performance. Aiming at the problem of the non-linear radiation difference between TIR and visible images, we propose the modified RIFT to registration and GCP extraction. This proposed method has better performance than traditional registration methods. The two-step orthorectification framework is proposed for the SDGSAT-1 TIS orthoimage production. Firstly, the initial RPCs and DEM are adopted for orthorectification, to eliminate the image internal distortion and obtain rough geographic coordinates. Then, the image is divided and registered with the visible reference image to attain enough uniformly distributed GCPs. Finally, the RPCs are refined with the GCPs and the L1A TIR image is orthorectified, again, to generate the L4 orthoimage. The validating GCPs, with uniform spatial distribution, are selected manually, to evaluate the orthorectification accuracy. The accuracy results indicate that the SDGSAT-1 TIS orthoimage is acceptable for the subsequent applications. All of the SDGSAT-1 images in the above experiment are used for the in-orbit testing data. With the ongoing work of in-orbit geometric calibration, the geometric accuracy of SDGSAT-1 TIS images will be further improved.

Author Contributions

J.C. designed the algorithm and experiments and wrote the manuscript. B.C. (Bo Cheng) supervised the study and reviewed the draft paper. X.Z., T.L. and D.Z. revised the manuscript and gave some appropriate suggestions. B.C. (Bo Chen) and G.W. provided the original data. All authors have read and agreed to the published version of the manuscript.

Funding

This research was funded by the Strategic Priority Research Program of the Chinese Academy of Sciences (Grant Number XDA19010401).

Institutional Review Board Statement

Not applicable.

Informed Consent Statement

Not applicable.

Data Availability Statement

Not applicable.

Acknowledgments

This work was partially funded by the Strategic Priority Research Program of the Chinese Academy of Sciences (Grant Number XDA19010401) and the National Natural Science Foundation of China (72073125). The authors also thank the anonymous reviewers and the editors, for their insightful comments and helpful suggestions to improve the manuscript.

Conflicts of Interest

The authors declare no conflict of interest.

References

  1. Zheng, X.; Li, Z.-L.; Nerry, F.; Zhang, X. A new thermal infrared channel configuration for accurate land surface temperature retrieval from satellite data. Remote Sens. Environ. 2019, 231, 111216. [Google Scholar] [CrossRef]
  2. Ren, H.; Ye, X.; Liu, R.; Dong, J.; Qin, Q. Improving Land Surface Temperature and Emissivity Retrieval From the Chinese Gaofen-5 Satellite Using a Hybrid Algorithm. IEEE Trans. Geosci. Remote Sens. 2018, 56, 1080–1090. [Google Scholar] [CrossRef]
  3. Wei, C.; Chen, W.; Lu, Y.; Blaschke, T.; Peng, J.; Xue, D. Synergies between Urban Heat Island and Urban Heat Wave Effects in 9 Global Mega-Regions from 2003 to 2020. Remote Sens. 2022, 14, 70. [Google Scholar] [CrossRef]
  4. Peng, J.; Xie, P.; Liu, Y.; Ma, J. Urban thermal environment dynamics and associated landscape pattern factors: A case study in the Beijing metropolitan region. Remote Sens. Environ. 2016, 173, 145–155. [Google Scholar] [CrossRef]
  5. Quan, J.; Zhan, W.; Chen, Y.; Wang, M.; Wang, J. Time series decomposition of remotely sensed land surface temperature and investigation of trends and seasonal variations in surface urban heat islands. J. Geophys. Res. Atmos. 2016, 121, 2638–2657. [Google Scholar] [CrossRef]
  6. Bhattarai, N.; Wagle, P. Recent Advances in Remote Sensing of Evapotranspiration. Remote Sens. 2021, 13, 4260. [Google Scholar] [CrossRef]
  7. Abbasi, N.; Nouri, H.; Didan, K.; Barreto-Muñoz, A.; Chavoshi Borujeni, S.; Salemi, H.; Opp, C.; Siebert, S.; Nagler, P. Estimating Actual Evapotranspiration over Croplands Using Vegetation Index Methods and Dynamic Harvested Area. Remote Sens. 2021, 13, 5167. [Google Scholar] [CrossRef]
  8. Zhou, Z.; Majeed, Y.; Diverres Naranjo, G.; Gambacorta, E.M.T. Assessment for crop water stress with infrared thermal imagery in precision agriculture: A review and future prospects for deep learning applications. Comput. Electron. Agric. 2021, 182, 106019. [Google Scholar] [CrossRef]
  9. Liu, W.; Li, J.; Zhang, Y.; Zhao, L.; Cheng, Q. Preflight Radiometric Calibration of TIS Sensor Onboard SDG-1 Satellite and Estimation of Its LST Retrieval Ability. Remote Sens. 2021, 13, 3242. [Google Scholar] [CrossRef]
  10. Zhang, X.; Leng, C.; Hong, Y.; Pei, Z.; Cheng, I.; Basu, A. Multimodal Remote Sensing Image Registration Methods and Advancements: A Survey. Remote Sens. 2021, 13, 5128. [Google Scholar] [CrossRef]
  11. Tondewad, M.P.S.; Dale, M.M.P. Remote Sensing Image Registration Methodology: Review and Discussion. Procedia Comput. Sci. 2020, 171, 2390–2399. [Google Scholar] [CrossRef]
  12. Feng, R.; Shen, H.; Bai, J.; Li, X. Advances and Opportunities in Remote Sensing Image Geometric Registration: A systematic review of state-of-the-art approaches and future research directions. IEEE Geosci. Remote Sens. Mag. 2021, 9, 120–142. [Google Scholar] [CrossRef]
  13. Sarvaiya, J.N.; Patnaik, S.; Bombaywala, S. Image Registration by Template Matching Using Normalized Cross-Correlation. In Proceedings of the 2009 International Conference on Advances in Computing, Control, and Telecommunication Technologies, Bangalore, India, 28–29 December 2009; pp. 819–822. [Google Scholar]
  14. Luo, J.; Konofagou, E. A fast normalized cross-correlation calculation method for motion estimation. IEEE Trans. Ultrason. Ferroelectr. Freq. Control 2010, 57, 1347–1357. [Google Scholar] [CrossRef] [Green Version]
  15. Johnson, K.; Cole-Rhodes, A.; Zavorin, I.; Moigne, J. Mutual information as a similarity measure for remote sensing image registration. Proc. SPIE 2001, 4383, 51–61. [Google Scholar]
  16. Woo, J.; Stone, M.; Prince, J.L. Multimodal Registration via Mutual Information Incorporating Geometric and Spatial Context. Ieee Trans. Image Processing 2015, 24, 757–769. [Google Scholar] [CrossRef] [PubMed] [Green Version]
  17. Xie, X.; Zhang, Y.; Ling, X.; Wang, X. A novel extended phase correlation algorithm based on Log-Gabor filtering for multimodal remote sensing image registration. Int. J. Remote Sens. 2019, 40, 5429–5453. [Google Scholar] [CrossRef]
  18. Dong, Y.; Long, T.; Jiao, W.; He, G.; Zhang, Z. A Novel Image Registration Method Based on Phase Correlation Using Low-Rank Matrix Factorization With Mixture of Gaussian. IEEE Trans. Geosci. Remote Sens. 2017, 56, 446–460. [Google Scholar] [CrossRef]
  19. Dong, Y.; Jiao, W.; Long, T.; He, G.; Gong, C. An Extension of Phase Correlation-Based Image Registration to Estimate Similarity Transform Using Multiple Polar Fourier Transform. Remote Sens. 2018, 10, 1719. [Google Scholar] [CrossRef] [Green Version]
  20. Lowe, D.G. Distinctive image features from scale-invariant keypoints. Int. J. Comput. Vis. 2004, 60, 91–110. [Google Scholar] [CrossRef]
  21. Lowe, D.G. Object recognition from local scale-invariant features. In Proceedings of the Seventh IEEE International Conference on Computer Vision, Kerkyra, Greece, 20–27 September 1999; Volume 1152, pp. 1150–1157. [Google Scholar]
  22. Bay, H.; Tuytelaars, T.; Van Gool, L. SURF: Speeded Up Robust Features. In European Conference on Computer Vision 2006; Springer: Berlin/Heidelberg, Germany, 2006; Volume 3951, pp. 404–417. [Google Scholar]
  23. Bay, H.; Ess, A.; Tuytelaars, T.; Van Gool, L. Speeded-Up Robust Features (SURF). Comput. Vis. Image Underst. 2008, 110, 346–359. [Google Scholar] [CrossRef]
  24. Ke, Y.; Sukthankar, R. PCA-SIFT: A More Distinctive Representation for Local Image Descriptors. In Proceedings of the 2004 IEEE Computer Society Conference on Computer Vision and Pattern Recognition, Washington, DC, USA, 27 June–2 July 2004; Volume 2, p. II-506. [Google Scholar]
  25. Dellinger, F.; Delon, J.; Gousseau, Y.; Michel, J.; Tupin, F. SAR-SIFT: A SIFT-Like Algorithm for SAR Images. IEEE Trans. Geosci. Remote Sens. 2015, 53, 453–466. [Google Scholar] [CrossRef] [Green Version]
  26. Xiang, Y.; Wang, F.; You, H. OS-SIFT: A Robust SIFT-Like Algorithm for High-Resolution Optical-to-SAR Image Registration in Suburban Areas. IEEE Trans. Geosci. Remote Sens. 2018, 56, 3078–3090. [Google Scholar] [CrossRef]
  27. Ma, L.; Liu, Y.; Zhang, X.L.; Ye, Y.X.; Yin, G.F.; Johnson, B.A. Deep learning in remote sensing applications: A meta-analysis and review. ISPRS J. Photogramm. Remote Sens. 2019, 152, 166–177. [Google Scholar] [CrossRef]
  28. Wang, S.; Quan, D.; Liang, X.F.; Ning, M.D.; Guo, Y.H.; Jiao, L.C. A deep learning framework for remote sensing image registration. ISPRS J. Photogramm. Remote Sens. 2018, 145, 148–164. [Google Scholar] [CrossRef]
  29. Jiang, X.; Ma, J.; Xiao, G.; Shao, Z.; Guo, X. A review of multimodal image matching: Methods and applications. Inf. Fusion 2021, 73, 22–71. [Google Scholar] [CrossRef]
  30. Dusmanu, M.; Rocco, I.; Pajdla, T.; Pollefeys, M.; Sivic, J.; Torii, A.; Sattler, T. D2-Net: A Trainable CNN for Joint Description and Detection of Local Features. In Proceedings of the 2019 IEEE/CVF Conference on Computer Vision and Pattern Recognition (CVPR 2019), Long Beach, CA, USA, 16–20 June 2019; pp. 8084–8093. [Google Scholar] [CrossRef]
  31. DeTone, D.; Malisiewicz, T.; Rabinovich, A. SuperPoint: Self-Supervised Interest Point Detection and Description. In Proceedings of the 2018 IEEE/CVF Conference on Computer Vision and Pattern Recognition Workshops (CVPRW), Salt Lake City, UT, USA, 18–22 June 2018; pp. 337–349. [Google Scholar] [CrossRef] [Green Version]
  32. Han, X.F.; Leung, T.; Jia, Y.Q.; Sukthankar, R.; Berg, A.C. MatchNet: Unifying Feature and Metric Learning for Patch-Based Matching. In Proceedings of the IEEE Conference on Computer Vision and Pattern Recognition (CVPR), Boston, MA, USA, 7–12 June 2015; pp. 3279–3286. [Google Scholar]
  33. Dong, Y.; Jiao, W.; Long, T.; Liu, L.; He, G.; Gong, C.; Guo, Y. Local Deep Descriptor for Remote Sensing Image Feature Matching. Remote Sens. 2019, 11, 430. [Google Scholar] [CrossRef] [Green Version]
  34. Zhang, Y.; Zhang, Z.; Ma, G.; Wu, J. Multi-Source Remote Sensing Image Registration Based on Local Deep Learning Feature. In Proceedings of the 2021 IEEE International Geoscience and Remote Sensing Symposium IGARSS, Salt Lake City, UT, USA, 11–16 July 2021; pp. 3412–3415. [Google Scholar]
  35. Aguilera, C.A.; Aguilera, F.J.; Sappa, A.D.; Aguilera, C.; Toledo, R. Learning cross-spectral similarity measures with deep convolutional neural networks. In Proceedings of the 2016 IEEE Conference on Computer Vision and Pattern Recognition Workshops (CVPRW), Las Vegas, NV, USA, 26 June–1 July 2016; pp. 267–275. [Google Scholar] [CrossRef]
  36. Tian, Y.; Fan, B.; Wu, F. L2-Net: Deep Learning of Discriminative Patch Descriptor in Euclidean Space. In Proceedings of the 2017 IEEE Conference on Computer Vision and Pattern Recognition (CVPR), Honolulu, HI, USA, 21–26 July 2017; pp. 6128–6136. [Google Scholar]
  37. Zhu, R.; Yu, D.; Ji, S.; Lu, M. Matching RGB and Infrared Remote Sensing Images with Densely-Connected Convolutional Neural Networks. Remote Sens. 2019, 11, 2836. [Google Scholar] [CrossRef] [Green Version]
  38. Kumari, K.; Krishnamurthi, G. GAN-based End-to-End Unsupervised Image Registration for RGB-Infrared Image. In Proceedings of the 2020 3rd International Conference on Intelligent Autonomous Systems (ICoIAS), Singapore, 26–29 February 2020; pp. 62–66. [Google Scholar]
  39. Kovesi, P. Image Features from Phase Congruency. Videre A J. Comput. Vis. Res. 1999, 1, 1–26. [Google Scholar]
  40. Kovesi, P. Phase congruency: A low-level image invariant. Psychol. Res. 2000, 64, 136–148. [Google Scholar] [CrossRef]
  41. Ye, Y.; Shen, L. HOPC: A Novel Similarity Metric Based on Geometric Structural Properties for Multi-Modal Remote Sensing Image Matching. ISPRS Ann. Photogramm. Remote Sens. Spat. Inf. Sci. 2016, III-1, 9–16. [Google Scholar] [CrossRef] [Green Version]
  42. Ye, Y.; Shan, J.; Bruzzone, L.; Shen, L. Robust Registration of Multimodal Remote Sensing Images Based on Structural Similarity. IEEE Trans. Geosci. Remote Sens. 2017, 55, 2941–2958. [Google Scholar] [CrossRef]
  43. Li, J.; Hu, Q.; Ai, M. RIFT: Multi-Modal Image Matching Based on Radiation-Variation Insensitive Feature Transform. Trans. Img. Proc. 2020, 29, 3296–3310. [Google Scholar] [CrossRef] [PubMed]
  44. Pullagura, R.; Valasani, U.S.; Kesari, P.P. Hybrid wavelet-based aerial image enhancement using georectification and homomorphic filtering. Arab. J. Geosci. 2021, 14, 1235. [Google Scholar] [CrossRef]
  45. Qu, J.; Li, Y.; Du, Q.; Dong, W.; Xi, B. Hyperspectral Pansharpening Based on Homomorphic Filtering and Weighted Tensor Matrix. Remote Sens. 2019, 11, 1005. [Google Scholar] [CrossRef] [Green Version]
  46. Hee Young, R.; Kiwon, L.; Byung-Doo, K. Change detection for urban analysis with high-resolution imagery: Homomorphic filtering and morphological operation approach. In Proceedings of the IGARSS 2004. 2004 IEEE International Geoscience and Remote Sensing Symposium, Anchorage, AK, USA, 20–24 September 2004; Volume 2664, pp. 2662–2664. [Google Scholar]
  47. Oppenheim, A.V.; Lim, J.S. The importance of phase in signals. Proc. IEEE 1981, 69, 529–541. [Google Scholar] [CrossRef]
  48. Morrone, M.C.; Owens, R.A. Feature detection from local energy. Pattern Recognit. Lett. 1987, 6, 303–313. [Google Scholar] [CrossRef]
  49. Muja, M.; Lowe, D.G. Fast Matching of Binary Features. In Proceedings of the 2012 Ninth Conference on Computer and Robot Vision, Toronto, ON, Canada, 28–30 May 2012; pp. 404–410. [Google Scholar]
  50. Muja, M. FLANN-Fast Library for Approximate Nearest Neighbors User Manual; Computer Science Department, University of British Columbia: Vancouver, BC, Canada, 2009; Available online: https://www.fit.vutbr.cz/~ibarina/pub/VGE/reading/flann_manual-1.6.pdf (accessed on 25 January 2022).
  51. De Rpanis, K.G. Overview of the RANSAC algorithm. Image Rochester NY 2010, 4, 2–3. [Google Scholar]
  52. Chaozhen, L.; Wanjie, L.; Junming, Y. Deep learning algorithm for feature matching of cross modality remote sensing images. Acta Geod. Et Cartogr. Sin. 2021, 50, 189–202. [Google Scholar]
Figure 1. The process of homomorphic filtering.
Remotesensing 14 01393 g001
Figure 2. The process of modified RIFT.
Remotesensing 14 01393 g002
Figure 3. The two-step orthorectification process for SDGSAT-1 TIS image.
Remotesensing 14 01393 g003
Figure 4. Six test image pairs. The TIR images (SDGSAT-1, B1 band) are in the first line and the visible images (Landsat8, true color synthesis) are in the second line. In order to display clearly, the TIR images have been processed by homomorphic filtering.
Remotesensing 14 01393 g004
Figure 5. Test data for orthorectification. (a) SDGSAT-1 L1A TIR image (in order to display clearly, the TIR images have been processed by homomorphic filtering.); (b) reference image (Landsat-8 true color synthesis orthoimage, UTM 49 N); (c) STRM DEM image (UTM 49 N).
Remotesensing 14 01393 g005
Figure 6. The registration results of modified RIFT. In each image pair, the image on the left is TIR image and the image on the right is visible reference image. All the images are 1000 × 1000 pixels.
Remotesensing 14 01393 g006
Figure 7. (a) Part of registration patch pairs are shown. The left one is TIR image patch with 500 × 500 pixels and the right one is visible image with 800 × 800 pixels. Totally 80 patches are needed for registration and 20 registration results are displayed; (b) all GCPs extracted by the registration process are plotted on the original L1A TIR image.
Remotesensing 14 01393 g007
Figure 8. The orthorectification result of SDASAT-1 TIS image overlayed with the visible reference image. (UTM, 49 N).
Remotesensing 14 01393 g008
Figure 9. The gray transformation from 12-bit to 8-bit by using bit-depth transform, gray linear stretch and homomorphic filtering respectively.
Remotesensing 14 01393 g009
Figure 10. The contrast test for three gray transformation methods. (a) The registration result by using the modified RIFT with three different gray transformation. (b) The numbers of the correct corresponding points of the registration.
Remotesensing 14 01393 g010
Figure 11. The comparison of different registration methods (NCC, MI, SIFT, RIFT, modified RIFT).
Remotesensing 14 01393 g011
Figure 12. The chessboard image to compare the offsets before and after registration.
Remotesensing 14 01393 g012
Figure 13. The GCPs which are distributed uniformly in the image are selected manually (UTM, 49 N).
Remotesensing 14 01393 g013
Table 1. SDGSAT-1 TIS characteristics and the comparison of other TIR sensor.
SensorPlatformWavelengths (μm)Resolution (m)Swath
Width (km)
Altitude (km)Imaging
Method
TISSDGSAT-18.0~10.5, 10.3~11.3
11.5~12.5
30300505Whisk broom
VIMSGF-58.01~8.39, 8.42~8.83
10.3~11.3, 11.4~12.5
4060705Push broom
IRSHJ-1B10.5~12.5300720649-
IRMSSCBERS-0410.4~12.580120778Push broom
TIRSLandsat8\910.6~11.2, 11.5~12.5100185705Push broom
ASTERTERRA8.13~8.48, 8.47~8.83,
8.93~9.28, 10.25~10.95
10.95~11.65
9060705Push broom
Table 2. The detailed information about the test image pairs.
Image PairAcquired DateTypePosition
Pair1TIR (SDGSAT-1)
Visible (Landsat-8)
15 December 2021
18 November 2021
FarmlandAksu, Xinjiang, China
Pair2TIR (SDGSAT-1)
Visible (Landsat-8)
15 December 2021
13 December 2021
PlateauAksu, Xinjiang, China
Pair3TIR (SDGSAT-1)
Visible (Landsat-8)
14 December 2021
12 December 2021
LakeUlan UL Lake, Qinghai, China
Pair4TIR (SDGSAT-1)
Visible (Landsat-8)
20 December 2021
18 September 2021
Plainthe Northeast Plain, China
Pair5TIR (SDGSAT-1)
Visible (GF1-WFV)
2 January 2022
26 December 2021
MountainTaiyuan, Shanxi, China
Pair6TIR (SDGSAT-1)
Visible (GF1-WFV)
2 January 2022
16 December 2021
CityTaiyuan, Shanxi, China
Table 3. The number of correct corresponding points of different registration methods.
MIHOPCCMM-NetRIFTModified RIFT
Pair1854358280
Pair214304496110
Pair3280145270
Pair416307389106
Pair51390122260265
Pair6282370106138
Publisher’s Note: MDPI stays neutral with regard to jurisdictional claims in published maps and institutional affiliations.