Article

A Geomatics Approach in Scan to FEM Process Applied to Cultural Heritage Structure: The Case Study of the “Colossus of Barletta”

by
Vincenzo Saverio Alfio
1,
Domenica Costantino
1,
Massimiliano Pepe
1,* and
Alfredo Restuccia Garofalo
2
1
Dipartimento di Ingegneria Civile, Ambientale, del Territorio, Edile e di Chimica, Polytechnic of Bari, Via E. Orabona 4, 70125 Bari, Italy
2
AESEI Spin-Off Polytechnic of Bari, Via S. Eligio 1/L, 74015 Martina Franca, Italy
*
Author to whom correspondence should be addressed.
Remote Sens. 2022, 14(3), 664; https://doi.org/10.3390/rs14030664
Submission received: 12 January 2022 / Revised: 26 January 2022 / Accepted: 28 January 2022 / Published: 29 January 2022

Abstract

:
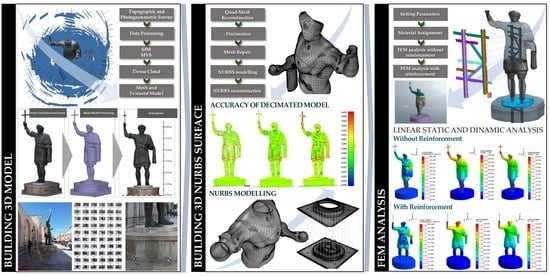
Artistic, architectural and Cultural Heritage (CH) structures are often exposed to a high risk of damage caused by seismic events, natural disasters and more by negligence and poor state of preservation and conservation; the use of a series of technologies, based on digital acquisition and high-level data processing, allows the realisation of a three-dimensional model of high detail. In order to preserve structures of particular historical and architectural value, it is necessary to assess their structural stability. In addition, many structures, such as statues, have rather complex geometries. Therefore, it is necessary to identify a methodology able to transform the point cloud generated through a geomatics approach into a model suitable for FEM (Finite Element Analysis) analysis. This process, known as Scan to FEM, is addressed in this paper. The paper shows the case study of the “Colossus of Barletta”, a bronze statue dating back to the 5th century A.D. located in the city of Barletta, Italy. To analyse this structure, a suitable methodology has been developed which is based on the optimisation of the surface model of the structure; in this way, it is possible to obtain an efficient transformation from a digital photogrammetric model with complex geometry into a model suitable for structural finite element analysis. The digital photogrammetry technique was applied for the survey of the structure, which allowed us to obtain a very high-resolution dense point cloud and a geometrically accurate three-dimensional mesh model, i.e., in a TIN (Triangulated Irregular Network) model. Subsequently, the TIN was transformed into a quad mesh model (identifying a suitable reduction value) and finally into NURBS (Non-Uniform Rational Basis-Splines) to be optimised and imported into a finite element calculation software. This geomatics approach has validated an efficient Scan to FEM process; in fact, thanks to this methodology, it is possible to elaborate three-dimensional models with complex geometry and draw a series of considerations related to structural behaviour or specific restoration interventions.

Graphical Abstract

1. Introduction

Nowadays, the current exponential growth in computer processing capacity and constant technological evolution has made it possible to obtain photorealistic and dimensionally accurate 3D models [1,2].
Digitisation and three-dimensional modelling techniques make it possible to faithfully reconstruct the exact shape of objects or structures. Three-dimensional modelling can be applied in several fields of application, such as: (i) realization of data archives to support museum activities and historical collections; (ii) production of multimedia content and prototypes for web and app representation; (iii) production of three-dimensional scale prints for cultural dissemination and to reconstruct a duplicate faithful to the original; (iv) study of an artistic asset from the topological and conservation point of view; (v) 4D monitoring for the evaluation of the state of conservation and for the analysis of all possible variations [3].
Three-dimensional modelling can be performed by the use of range-based modelling or image-based techniques [4,5]. An example of range-based modelling can be performed by the Terrestrial Laser Scanner (TLS), which allows us to quickly determine the position of millions of points that accurately define and reproduce the surface and geometry of the objects detected [6,7]. Bertolini-Cestari et al. (2013) [8] propose an integration of innovative and consolidated investigation techniques for 3D metric modelling of the building heritage. In particular, the TLS method, complemented by close-range digital photogrammetry, allowed us to perform a series of structural analyses and evaluate the effects of deformations. Virtanen et al. (2014) [9] use two separate datasets, both acquired by terrestrial laser scanning to produce physical models from three-dimensional digital mesh models. Khodja et al. (2019) [10] use the laser scanner survey technique to be supportive of the restoration and provide useful and accurate details, following defacement, of the missing part of a marble statue representing a nymph and publicly displayed in the centre of the main square.
An example of the image-based technique is the Structure from Motion (SfM) that allows us to extract an elevated number of points from individual photos, calculate the calibration parameters of the camera and then identify the points recognizable on multiple photos, finally allowing us to obtain a point cloud that is dense, geometrically accurate and able to represent the detected object with a high degree of detail [11]. In 2013, Muzzupappa et al. [12] created a detailed 3D model of an area of tens of square metres without the need to use any dedicated devices such as laser scanners, drones or helium balloons, but simply by using a digital camera and open-source software. Bagnéris et al. (2017) [13] starting from a 3D model generated by photogrammetry, evaluate the mechanical behaviour of a marble statue with complex fracture planes and localised cracks. Adamopoulos et al. (2021) [14] propose the use of digital tools to better visualise and map the state of deterioration of stone statues in three-dimensional (3D) representations. In particular, it analyses combined techniques such as photography, geomatics and 3D visualisation techniques for the investigation of the deterioration of historical materials.
In general, the choice of one of these techniques is not a simple process and it is related to the complexity of a structure to be surveyed. In addition, to obtain an excellent quality of the 3D model, these techniques can be integrated [15,16]. The integration of these two approaches has been applied to reconstruct the shape of a Statue of Hope located in the English (Protestant) Cemetery in Florence (Italy) [17].
Once the point cloud is processed, it is then possible to generate a mesh model that defines a polygonal surface (triangular or tetrahedral meshes) or fits the point cloud [18]. In this way, it is therefore possible to build a 3D model suitable for structural analyses of structures. However, it is first necessary to transform the point cloud obtained by survey in 3D surface suitable for structural analysis. The knowledge of the structural behaviour of particular structures, such as statues of particular historical, artistic and architectural value, plays an important role in order to preserve and safeguard these cultural heritage assets. The very often slender shapes and the masses involved create high stresses not only related to the static field, but also linked to other factors such as earthquakes or vibrations of any other kind. It is therefore necessary to define a methodological approach that, starting from an accurate representation of the model, is able to provide structural information (static and dynamic) on the element examined. This aim can be achieved through an FEM analysis (Finite Element Analysis), also called FEA (Finite Element Analysis) since it is possible to study complex physical phenomena that otherwise could be addressed only with an experimental approach.
Barazzetti et al., 2015 [19] described a method to transform the point clouds for structural simulation based on Finite Element Analysis; in particular, the authors performed two different types of analysis: a static analysis to calculate plate stresses and a dynamic analysis simulating the effects on the historical structure due to an earthquake. Guarnieri et al., 2017 [20] using data acquired from a laser scanner survey have created a three-dimensional model of the Revedin–Bolasco villa; a portion of the villa was then modelled and subsequently used to perform a finite element analysis in order to evaluate the effects of the external walls and the weight of the roof on the structure itself. Pfeuffer et al., 2018 [21] interpreted 3D digitization as a suitable tool for planning conservation measures related to natural stone sculptures by setting up a comparison related to 2D and 3D surfaces. Pepe et al., 2020 [22] have shown how it is possible to transform the point cloud into an FEM model; to realize this transformation, NURBS (Non Uniform Rational B-Splines) surfaces (implemented in Rhinoceros’s software) have been built to generate the parametric model of a stone arch bridge of the late 1800s. Santini et al., 2021 [23] proposed a methodology related to the design of non-destructive measures using an HBIM approach; starting from historical, structural and design information, it was possible to reconstruct and model the information obtained from the geometric and material survey and then convey it in a finite element model built on Midas Fea NX. Nowadays, thanks to the potentialities offered by software able to manage mesh models and to define a parametric modelling approach, it is possible to rapidly transform point clouds into geometric entities. In fact, Funari et al., 2021 [24], starting from a 3D survey and through generative programming, define a parametric Scan to FEM approach applied to architectural heritage.
Regarding the modelling and FEM analysis on the statues belonging to a cultural heritage environment, an important example of the contribution of geomatics to the structural analysis of statues is the 3D model of Michelangelo’s David. This model was obtained from a survey using laser-scan technology performed by the ISTI-CNR in collaboration with Stanford University, which provided a surface composed of over 50 million triangles, later simplified to 20,000, 50,000 and 100,000 triangles to facilitate structural analysis computations [25,26]. This latter model was imported in “Ansys” software (software FEM) in order to analyse the lesions and stability of Michelangelo’s David. Another important contribution in the Scan to FEM process was addressed by Visintini et al. (2014) [27] on the statue of Emperor Claudius preserved at the National Archaeological Museum of Aquileia; the statue was scanned with laser scanner technology and was modelled with MeshLab software. The structural analyses of the surface model were imported into Rhinoceros thanks to the availability of the Scan&Solve plugin: therefore, the most stressed areas were evaluated and in addition, a hypothetical model was analysed to evaluate the influence of a rear support on the balance of the whole structure. Using a similar approach, Spangher et al. (2017) [28], through the Rhinoceros plug-in, performed an FEM analysis to evaluate the possible risks of the marble statue of San Giovannino Martelli (Saint John the Baptist) preserved in Florence. In order to make the best use of computational resources for the accuracy of the solver and for the congruent geometric and FEM resolution, the three-dimensional model was simplified, considering only 7% of the initial triangles. A particularly interesting study is that of Riccardelli et al. (2014) [29] held on the Tullio Lombardo’s statue of Adam, preserved in the Metropolitan Museum of Art in New York (USA), which crashed because of the collapse of its pedestal in 2002. Bici et al. (2018) [30] performed more static and modal analyses in order to identify the weaknesses of the statue and define its correct positioning; the 3SD model was obtained by the use of a 3D scanner integrated by an ultrasound instrument. Viti et al. (2020) [31] wrote about the evaluation of the seismic performance of Ceres, the central sculpture of the Fountain of Juno by Bartolomeo Ammannati, currently located in Florence, at the Bargello Museum; in order to build the FEM element on which to conduct the analysis, the 3D geometric model was obtained by laser scanner survey.
This research aims to make a contribution to the identification of efficient processes in the application of the Scan-to-FEM process applied to cultural heritage, by identifying innovative and high-quality methods and geometric criteria for modelling structures. In particular, this research aims to investigate the aspects related to the building of a parametric model for FEM analysis starting from a model with a rather complex geometry.
The paper is organized as follows. In Section 2.1, we discuss the structure taken into consideration from the historical and material point of view. The methodological approach developed in the manuscript is described in Section 2.2 where the 3D model processing techniques used and the final construction of the NURBS representing the input model for the FEM environment are reported. Section 2.3 describes the Scan to FEM process performed on the statue, while Section 2.4 describes the FEM model realisation process. The results of the FEM analysis are reported in Section 3 and discussed in Section 4. Conclusions are summarized at the end of the paper.

2. Materials and Methods

2.1. Case Study

The “Colossus of Barletta”, located in the homonymous city of Barletta, Italy (41°19′9.21″ N 16°16′53.55″ E), is a gigantic bronze statue, about 5 m high, dating back to the fifth century (see Figure 1). The emperor is depicted as imperator, one of the standard schemata for imperial portrayal (statua loricata). He wears a tunica, a muscle cuirass with a cingulum and a paludamentum; the separately inserted fibula is lost [32]. The work of Byzantine construction probably depicts Emperor Theodosius II. There are currently several versions about the making of the statue. The only certain news dates back to the year 1309 when some religious officials of the area asked and obtained from Carlo II D’Angiò the permission to remove and melt the limbs of the statue for the creation of some bells to locate in their church. Recent studies have shown that the head and the bust of the statue are original, while the legs have a later date.
Several studies were conducted on the statue to characterize the casting materials used and their dating. In fact, from a non-destructive Energy Dispersion X-ray Fluorescence (EDXRF) analysis carried out on the structure, it was shown that the statue was made with different bronze alloys: an alloy richer in copper for the face and hands, a second alloy with high tin value for the crown, and a third alloy with high lead value for the bust; as for the lower limbs, historians confirm that they are not coeval with the rest of the work [33].
Moreover, according to thermoluminescence tests of the casting earths of the statue conducted by the Archaeometry Laboratory of the University of Milano-Bicocca in 2017, beyond a classification of the casting earths used, they conclude that the casting of the statue’s torso occurred with maximum probability between the fourth AD and the sixth century AD, excluding earlier and later dates; as for the limbs, however, the casting occurred with maximum probability in the second half of the fourteenth century AD. The monument underwent structural restoration in 1981, during which the Central Institute for Restoration in Rome carried out cleaning treatments and consolidation of the patinas; furthermore, during the same restoration, the Colossus of Barletta was fixed to a steel structure (completely prefabricated on a wooden model) located inside the statue [33,34].

2.2. Methodological Approach

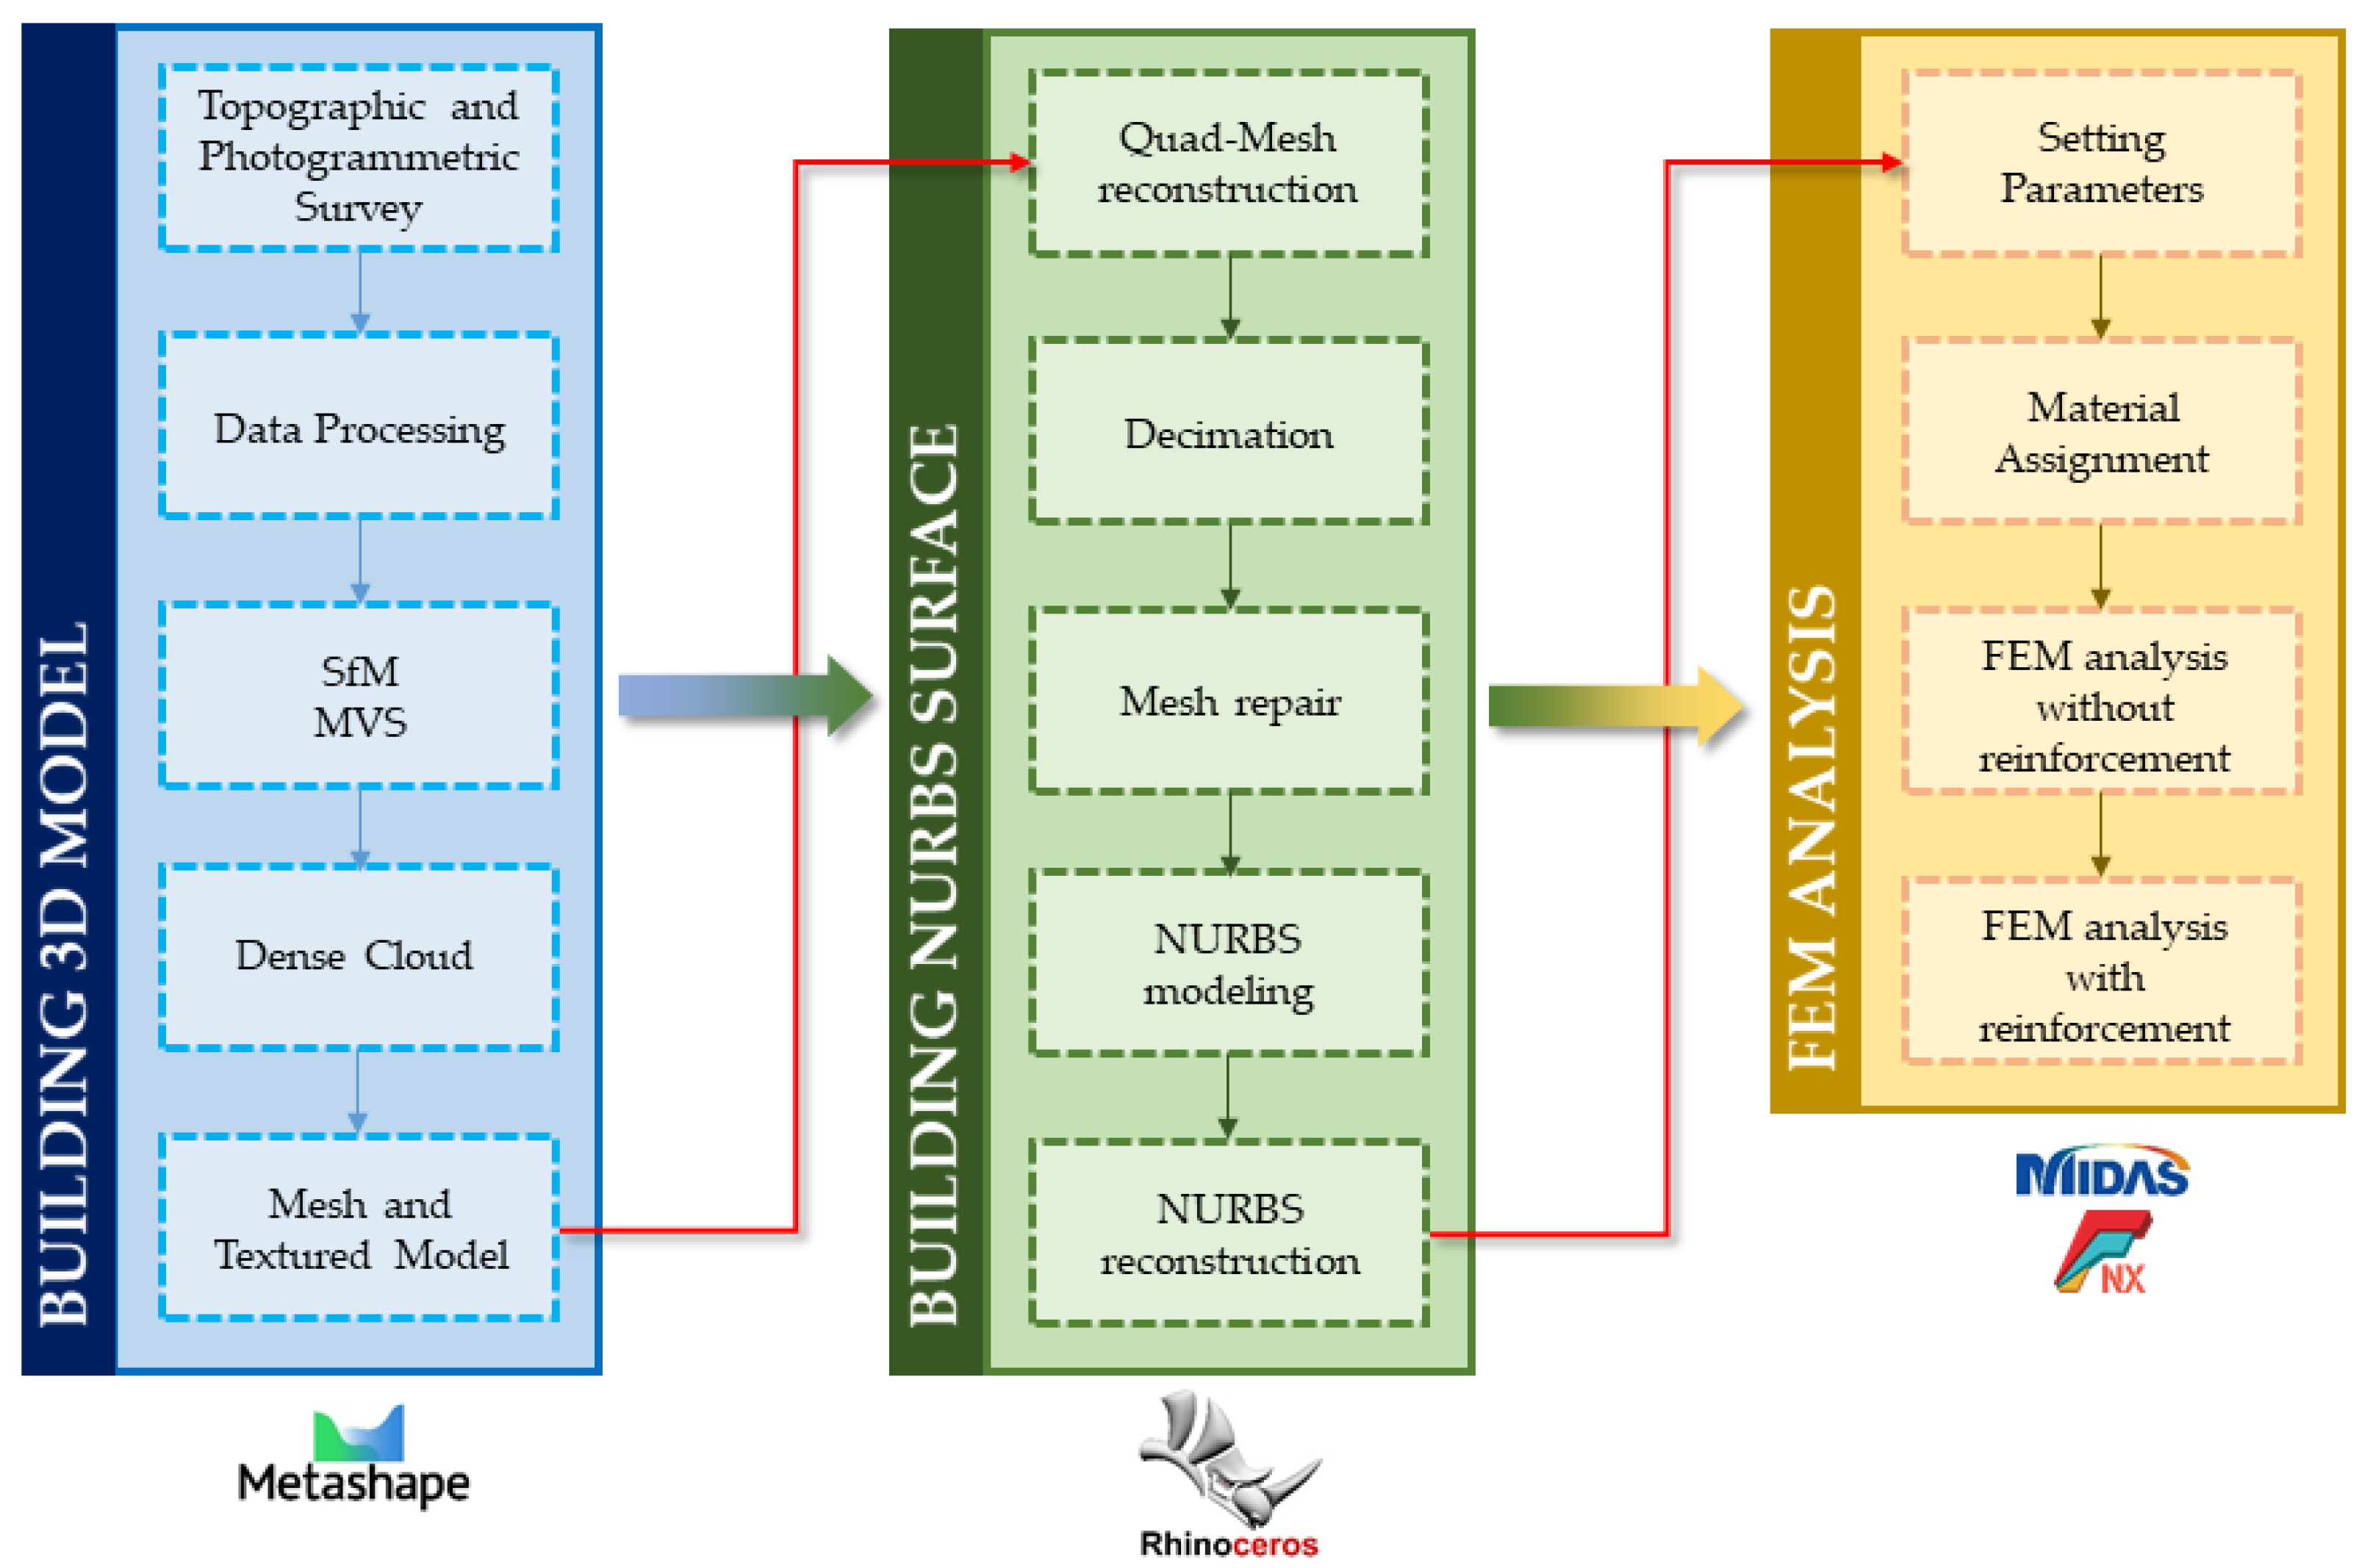
The method proposed in this manuscript makes it possible to obtain a 3D model for FEM analysis from a photogrammetric survey. The first step concerns the identification of a suitable geomatics technique for the construction of a tri-dimensional model. Once the 3D model characterised by a TIN surface is created, in order to improve the management of this model in the FEM environment, it must be transformed into a polygonal surface and then decimated. Therefore, the main phases of the process leading to the FEM analysis of the structure under consideration are the following: (i) building the 3D model; (ii) transformation of the TIN into a quad mesh and NURBS model; (iii) FEM analysis.

2.2.1. Building the 3D Model

In building the 3D model, the first step concerns the identification of a suitable survey technique. The 3D model of the statue can be performed using both TLS and photogrammetric techniques; however, taking into account the inexpensiveness of the photogrammetric survey and the possibility of acquiring information of the geometry of the statue in a rather simple and detailed manner of the upper part of the structure with a tripod that can be extended to a height of about 6 m, it was preferred to use this latter technique.
The close-range photogrammetry techniques allow us to obtain an accurate and detailed model; in an SfM and MVS environment, it is possible to obtain a dense and coloured point cloud able to reconstruct the 3D geometry of the structure. In general, the several processing steps that lead to the construction of the photogrammetric model in SfM/MVS environment are: (i) alignment of the images; (ii) building a dense point cloud (PC) with the application of a colour filter to remove some noise due to the sky and manual editing of points outside the statue; (iii) building mesh and identifying the planes of the single façade; (iv) building the orthomosaic [34]. However, the first step of photogrammetric process is the calibration of the camera. Using the Agisoft Lens tool (v. 0.4.2), it was possible to calculate the main parameters of the camera (focal length, main point coordinates, radial and tangential distortions).
Subsequently, the calibration parameters were imported in Agisoft Metashape software (v. 1.5.1) in order to improve the quality of the photogrammetric process. The accuracy of the alignment process was evaluated using 7 GCPs and 6 CPs.
The Total Error, i.e., the root-mean-square error for x, y, z coordinates, can be calculated by the following formula:
T o t a l   E r r o r = i = 1 n ( x i , e s t x i ) 2 + ( y i , e s t y i ) 2 + ( z i , e s t z i ) 2 n
where x i is the input value for x coordinate, y i the input value for y and z i the input value for z coordinate for the i–th camera position, while ( x i , e s t , y i , e s t , z i , e s t ) corresponds to its estimated position.
In order to scale and georeference the model, it is necessary to perform a topographic survey. This task can be performed using a Total Station, which is an electronic surveying instrument that combines an electronic distance measuring (EDM) device with an electronic theodolite and a computer. The electronic theodolite simply measures the angle in two planes, the X-Y plane (horizontal plane) and from the X-Y plane (vertical plane). The EDME (or EDM) measures the distance (slope distance) from the prisms it is pointed at, while the on-board computer stores and calculates a large number of values from these three measurements. EDM measurements are made using laser technology (Light Amplification by Stimulated Emission of Radiation), which was developed in the 1960s. There are two types of measurement signals, “phase shift” and “time of flight” (TOF), also known as “pulse”. Phase shift is considered the most accurate and has a narrow range but has the disadvantage of a small range. TOF, in contrast, has a longer range but a larger signal, resulting in reduced accuracy [35].

2.2.2. Building the NURBS Model

From the point cloud, a triangular surface mesh can be generated; this surface can be textured for photorealistic digital representation of the object/scene. The Triangulated Irregular Network (TIN) is a surface where the known points in the three coordinates, however they are distributed in space, are joined by lines to form flat, adjacent triangles that allow the surface of the object to be represented with continuity. However, in some cases, the triangular model does not allow the object or structure to be represented according to a closed mesh; in other words, the elements that compose the object cannot be treated (and therefore modelled) as separate entities. In addition, the triangular mesh generated by the photogrammetric (or TLS) process involves a difficulty in managing the model in relation to the number of triangles. This becomes particularly important when the geometry of the structure or object is rather complex.
For this reason, the further step consists of the transformation of the TIN model into quad mesh.
A quad mesh is semi-regular if it is obtained by gluing, in a conforming way, several regular 2D arrays of quads side to side. Each such regular sub mesh is called “patch” and the number of patches is assumed to be much smaller than the total number of facets.
In the context of FEM, a semi-regular mesh is called a multi-block grid, i.e., the blocks corresponding to patches [36]. Quad meshes are often preferred in some numerical analyses as they allow both a reduction in approximation error and the number of elements compared to triangles [37]. Consequently, taking into account the complexity of the statue’s geometry, quad mesh is a valid approach for modelling this type of structure. In this way, is possible to obtain an accurate modelling of each component of the object detected and avoid the problem of working with a mesh not properly structured and difficult to manage both for modelling and for the computational aspects related to the subsequent FEM analysis. Rhino software (v. 7) allows the generation of quad mesh.
In order to further reduce the mesh to be analysed and to decrease the computational requirements powers for the finite element analysis, the quad mesh was decimated through a special tool available in Rhino software.
In order to geometrically validate the model, a comparison was made between the modelled quad mesh generated in the Rhino environment and the point cloud obtained from the photogrammetric survey.
In general, a cloud-to-mesh (C2M) comparison was then performed using the Cloud Compare software (v. 2.11); with this algorithm it is possible to calculate the distance between the point cloud and the vertices of the meshes that make up the mesh [38]. The C2M distance is calculated according to Equation (2):
D C 2 M = ( X M X C ) 2 + ( Y M Y C ) 2 + ( Z M Z C ) 2
where X M , Y M , Z M are the coordinates of the vertex of the mesh polygon and X C , Y C , Z C are the coordinates of the point cloud.
The estimation of the distance is, of course, strongly influenced by the quality of the mesh, as it may present roughness or approximations related to the degree of detail in the 3D model reconstruction process.
This operation may result in non-manifold mesh, or mesh with an edge shared by more faces that can be eliminated later, through appropriate commands. This operation is of fundamental importance in order not to create any errors in the next phase of importing the model in the calculation program. This means to elaborate a continuous model suitable for FEM analysis.
Finally, the quad mesh model can be transformed into an NURBS surface [39] able to faithfully represent the object detected. The NURBS surface, understood as a generalisation of a b-spline curve (composite curves connecting several Bezier curves), can be expressed by the relation [40,41]:
C ( u ) = i = 0 n N i , p ( u ) · W i · P i i = 0 n N i , p ( u ) · W i
where W i are the weights, the P i are the control points, and N i , p ( u ) are the normalized B-Spline basis functions of degree p , where:
N i , 0 ( u ) = { 1       i f   u i u u i + 1                   0       o t h e r w i s e N i , p ( u ) = u u i u i + p u i N i , p 1 ( u ) + u i + p + 1 u u i + p + 1 u i + 1 N i + 1 , p 1 ( u )
where u i are the knots forming the knot vector U = { u 0 ;   u 0 ; ;   u n + p + 1 } .

2.2.3. FEM Analysis

Then, once the three-dimensional and parametric model is generated, it can be imported into software based on the FEM approach. On the commercial market, there are several tools and software available to import 3D mesh for FEM analysis.
Midas FEA NX represents, for example, an FEM analysis software predisposed to the analysis of complex geometries. Within the software, a series of parameters can be assigned to the model in order to define its material composition and consequently conduct two different types of structural analysis: a first analysis that only concerns the model of the external structure and a second analysis that instead takes into account the reinforcing elements present inside the statue. This allows us to verify the contribution of the structural elements in the conservation and protection of the cultural heritage.
The construction of the FEM model requires the knowledge of a parametric model, that is a model where each object is described according to its dimensional and material characteristics.
Regarding the internal support of the statue, it is necessary to model the steel structures that cannot be detected with a photogrammetric survey. In fact, in order to increase the stability of the statue, in the last phase of restoration, steel reinforcements were inserted inside. This reticular steel structure is connected to the statue through bolted joints. The 2D drawings and construction details of this reinforcement structure were available in non-vector format. For this reason, it is necessary to reconstruct the geometry of the internal reinforcement structures through 2D drawings in CAD format and made in one of the restoration phases. 3D reconstruction of the internal structure can be modelled in Rhino software; all structures can be assembled in Rhino and, subsequently, imported in FEM environment.
Therefore, the methodological approach developed and applied to a statue belonging to the Cultural Heritage can be sketched in the following pipeline (Figure 2).

2.3. Scan to FEM Methodology Applied to “Colossus of Barletta”

2.3.1. Topographic and Photogrammetric Survey for 3D Reconstruction

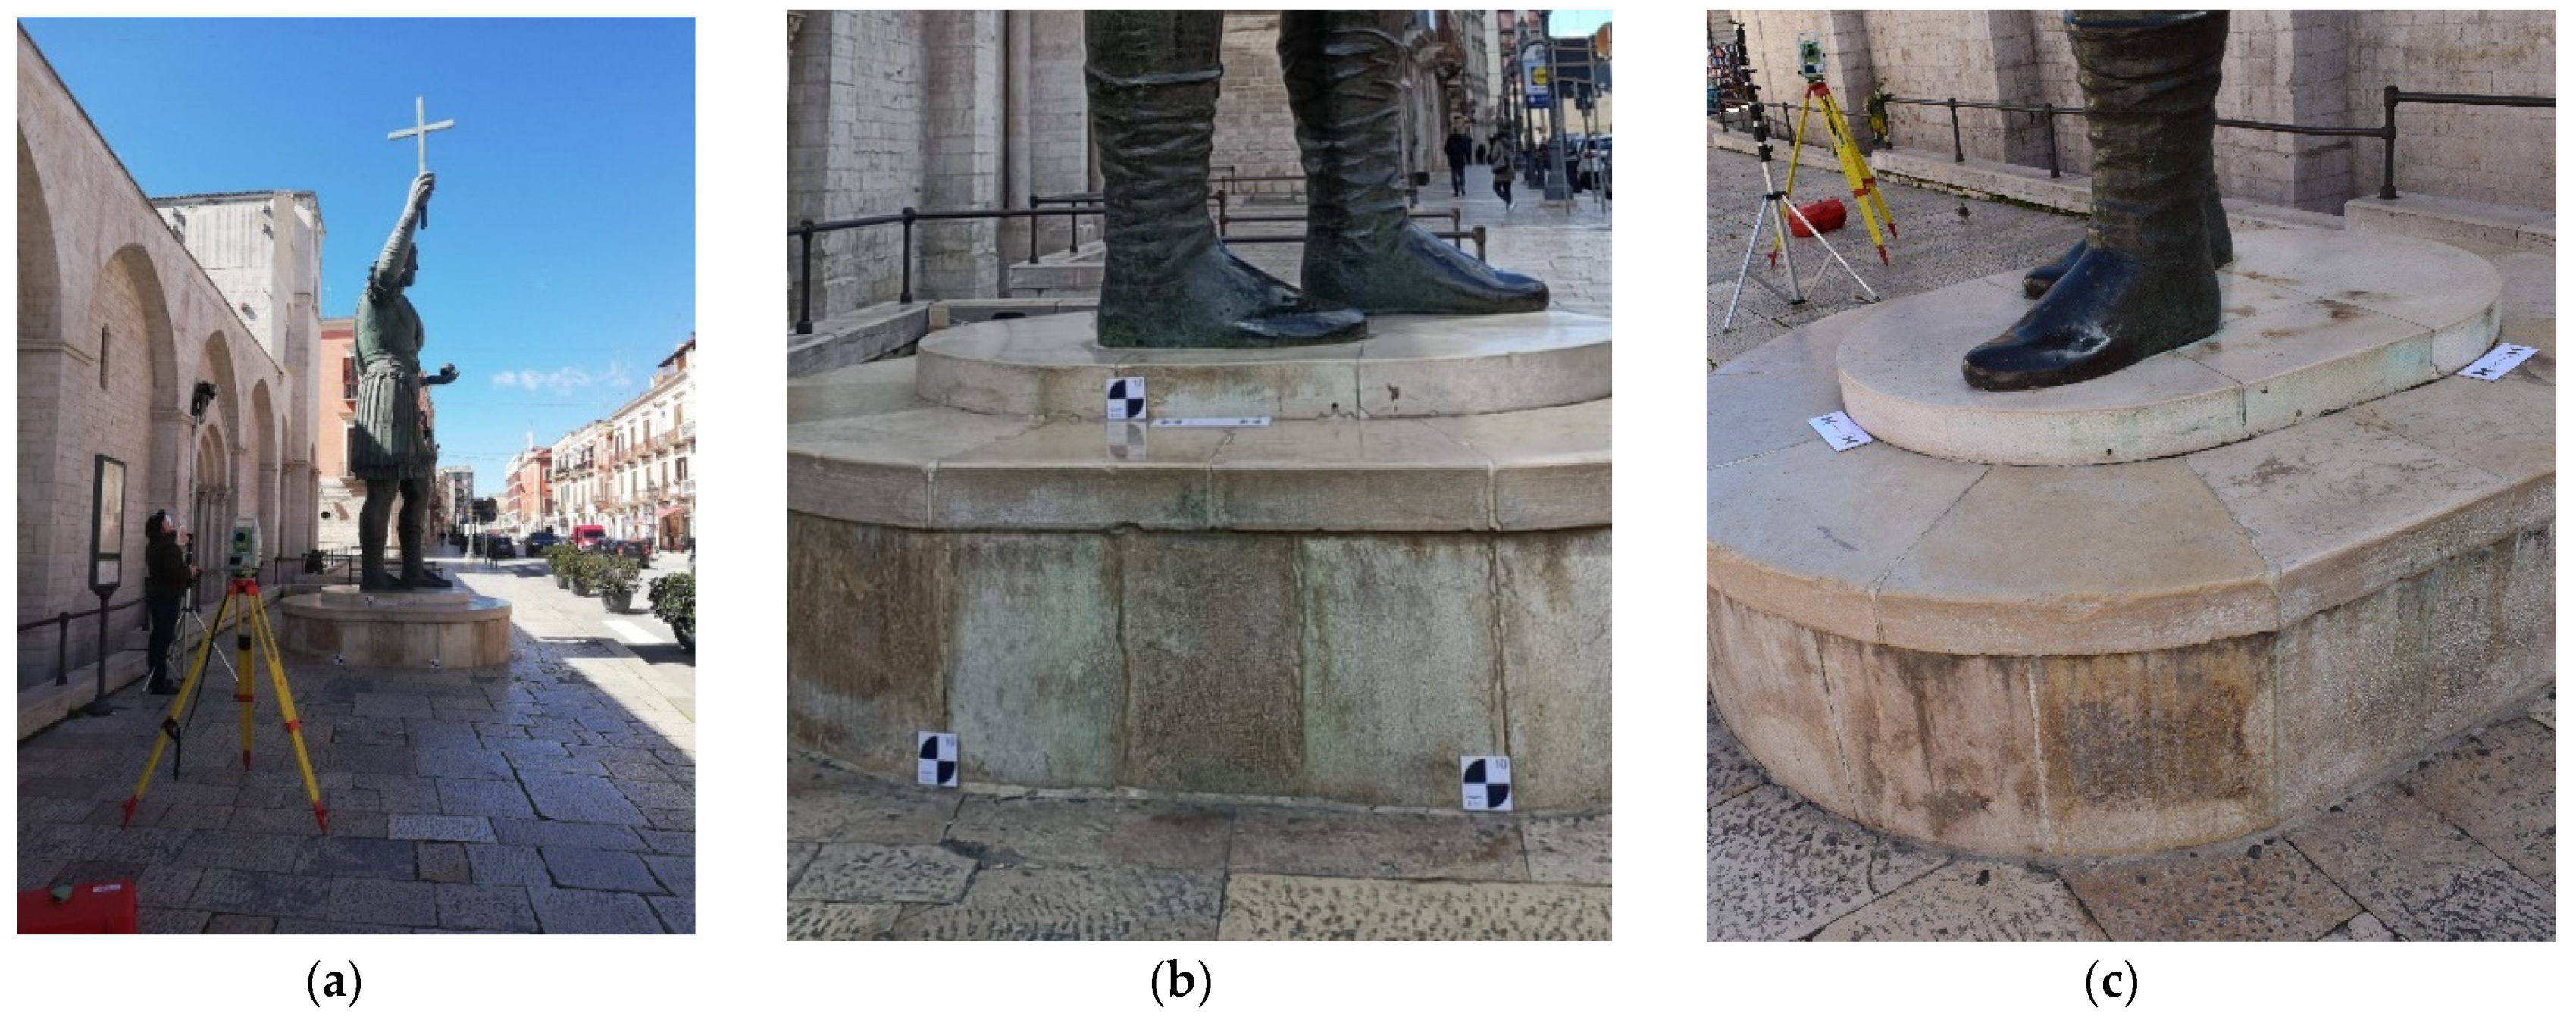
The topographic survey was carried out using a Leica TS11 Total Station, which has an angular accuracy of 1” (0.3 mgon) and a linear measurement accuracy with prism of 1 mm + 1ppm and without prism of 2 mm + 2 ppm (Figure 3a). For the determination of GCPs, referred to as the case study, the polar coordinates of the targets were made without the use of prisms; the software implemented within the Total Station allows us to obtain the Cartesian coordinates of the identified points for the georeferencing and scaling of the model. In this way, the survey of the targets positioned along the base of the statue was carried out; in particular, and 7 GCPs (Ground Control Points) were surveyed. As far as the vertical development of the statue is concerned, 6 “natural” points on the statue were surveyed (Figure 3b). In addition to the GCPs just described, several CPs (Check Points) and some metric bars were surveyed (Figure 3c).
After the topographic survey phase, the photogrammetric survey of the statue was carried out using a reflex camera mod. Nikon D3300 with a Nikkor 20 mm f/2.8D fixed focal lens.
Considering the height of the statue, a module was added to the reflex camera that would allow us to take images remotely through the use of a remote control; moreover, for the same reason, during the survey phase, the use of a tripod/pole was made necessary to reach the desired heights.
In particular, the maximum height of 6 m was reached at which the first images were acquired following an orbital trajectory around the statue. Subsequently the tripod/pole was gradually lowered by 0.50 m until it reached the height of the base, and the other images were acquired in the same way; in addition, further images were acquired from the ground which allowed a more accurate definition of the details and engravings of the statue.
A total number of 960 images was acquired. The Ground Sample Distance (G.S.D.) of the image was about 1 mm/pix.
The following Table 1 summarizes the errors, in metric and pixel, for each control and check point and the total error.
In addition, Agisoft Metashape software allowed, through several steps, the creation of a three-dimensional textured mesh model.
For a more accurate representation of the model, masks were drawn on the photos to focus the algorithmic process on specific parts of the image. The creation of these masks is not only necessary to eliminate elements outside the scene under consideration, but also allows processing times to be reduced.
The settings used for each phase of photogrammetric process are reported in Table 2. In addition, Table 2 shows for each phase the processing times performed with a workstation that has the following characteristics: CPU (Central Process Unit) Intel(R) Xeon(R) E5-1650 v4 @ 3.60 GHz, RAM (Random Access Memory) 64 GB, GPU (Graphics Processing Unit) NVIDIA Quadro M4000.
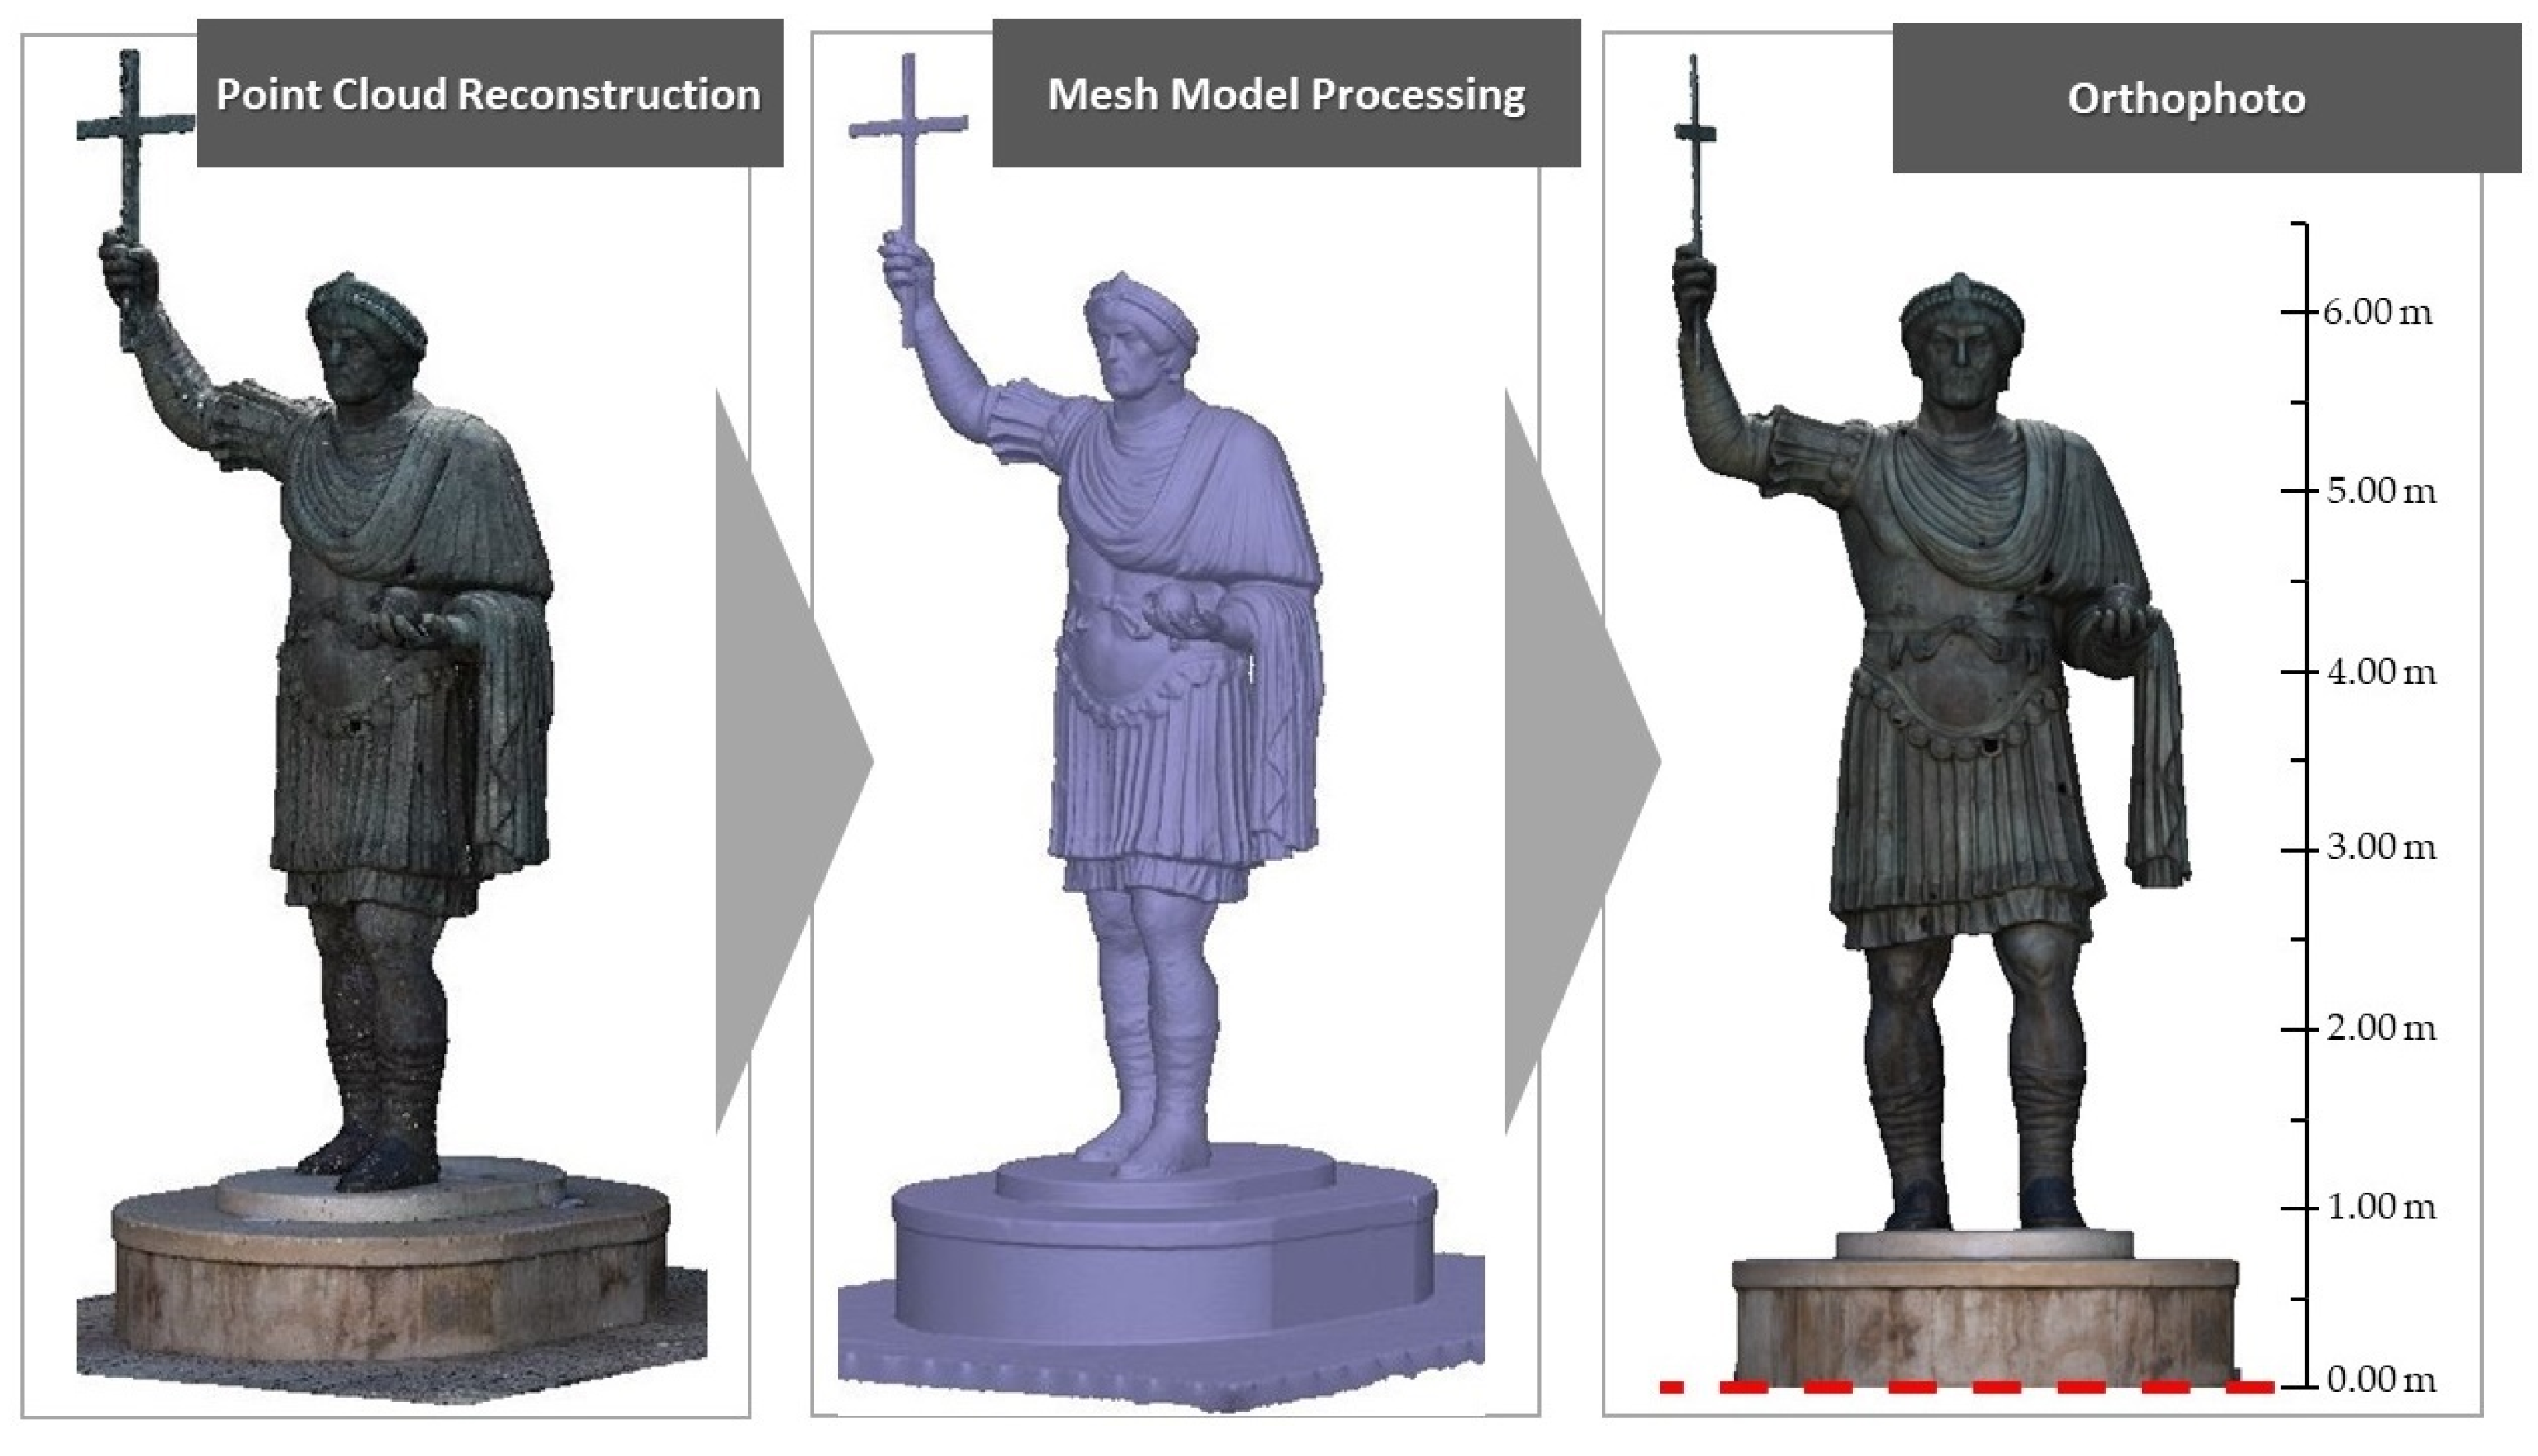
Therefore, in addition to the 3D model (point cloud or mesh), in this photogrammetric environment, orthophotos with high geometric resolution can be generated that allow a visual and interpretative analysis of the state of conservation of the monument and, consequently, support decisions to undertake targeted maintenance activities (Figure 4).

2.3.2. Modelling in Rhino Software

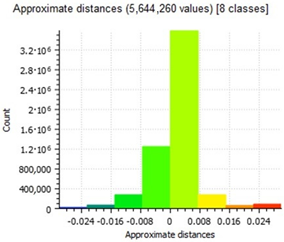
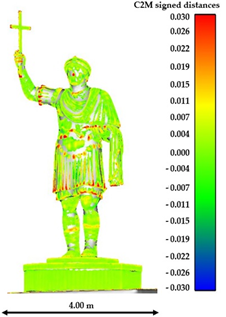
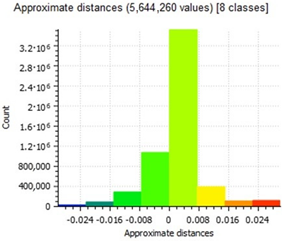
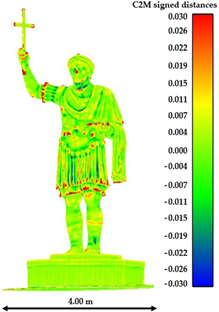
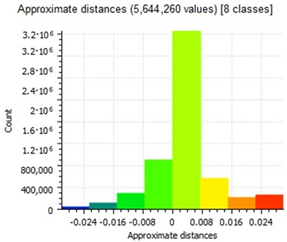
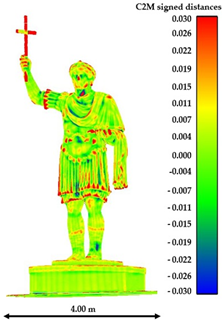
In general, it was possible to build, in photogrammetric processing, a 3D model with triangular meshes; the import of this model into the Rhino software unfortunately did not produce an acceptable result, since a series of errors were generated due to the imperfect closure of the structural elements of which the statue is composed. Moreover, the management of a modelling consisting of 10,775,533 faces is rather complex. For this reason, the mesh, once imported into Rhinoceros software (also called Rhino), was decimated using the “QuadRemesh” tool which quickly creates a quad mesh with optimised topology from existing surfaces. With this tool, it is also possible to define the number of faces for re-meshing. By setting a minimum value, the result will be a mesh with a minimum number of polygons with uniform size. On the contrary, setting a high value, the mesh detail will be more accurate and the polygon sizes will be smaller in correspondence with the high curvature areas. The values of the “Adaptive Size” tool vary from 0 to 100. A value of 0 means constructing a face mesh as square as possible with a uniform face density and the risk of obtaining an irregular topology; conversely, a value of 100 means obtaining face shapes that are variable in height and width and with a very high face density. In the case study of the statue, a value of 90 was applied, i.e., reducing the quad mesh by 10%. Table 3 summarizes the main values of mean, standard deviation, and maximum value, obtained from the C2M comparison at different decimation rates.
From the analysis of Table 3, it can be seen that the model decimated to 10% shows a mean deviation value, compared to the original model, of 0.001 m. In fact, at some points it is possible to note that the distance value between the dense cloud and the mesh model is null, i.e., it remains outside the search cylinder. Increasing the degree of decimation of the mesh model, the average distance between the point cloud and the mesh increases; in particular, in the model reduced by 70% we obtain a value of an average distance equal to 0.003 m and a standard deviation value of about 0.02. In the latter case, from the qualitative analysis of the image it is possible to note how some particulars and construction details are completely eliminated from the mesh model.
Subsequently, the decimated mesh was optimized through commands able to close holes, repair intersecting meshes and eliminate non-manifold elements in order to reduce possible errors in the following calculation phases. Once these operations were completed, the entire model was transformed into a NURBS surface, i.e., the representation of a mathematical surface capable of accurately defining any shape.
In the parametric modelling, the objects of the statue (cloth, cross, sphere, etc.) were modelled as single objects and then assembled; for the FEM analysis, a series of parameters linked to the material composition were attributed to each object. In particular, the different parameters that contribute to the structural analysis of the statue, such as Poisson’s coefficient, modulus of elasticity, density, etc., were taken into account.
In the following images, it is possible to visualize some details of the structure, such as the bust (Figure 5a), the bust and insertion of the face and the drap (Figure 5b), basement (Figure 5c), basement with insertion of the boots (Figure 5d).

2.4. Finite Element Method

2.4.1. Computations

In order to characterize the structural behaviour of the statuary element, an FEM analysis was conducted using Midas FEA NX software (MIDASoft, Inc., New York, NY, USA, v. 1.1). The choice of this software is based on the fact that it has advanced modelling tools and that, thanks to its compatibility with other formats, it is possible to reach very advanced modelling levels in a short time. Moreover, the power to manage and solve numerous meshes allows us to represent and solve with precision the finite element model that more accurately represents the solid geometry that has been previously created [42]. In general, two different analyses were conducted: a linear static analysis and a linear dynamic analysis, which then takes into account the dynamic characteristics of the structure by means of a modal analysis at the eigenvalues, which involves the determination of the pro-prior modes of vibration of the structure. For the linear dynamic analysis, the design spectrum of the site where the colossus is located was used according to NTC 2018 [43]. Once the geometric model was imported into Midas Fea NX (processed in Rhino software), the masses of the individual components were defined and, for the purposes of linear dynamic analysis, the vibration modes of the statue were determined through an eigenvalue analysis. Subsequently, for each mode of vibration, the maximum values in terms of stress and displacement obtained following the application of the elastic response spectrum under acceleration were calculated and finally, the same effects were combined with a CQC analysis (in accordance with the current regulations NTC2018 and the explanatory circular). The FEM analysis was conducted on two different models: a first model realized without taking into account the internal support structures and a second reinforced by a system of steel struts embedded in a concrete foundation plinth.

2.4.2. Unreinforced FEM Analysis

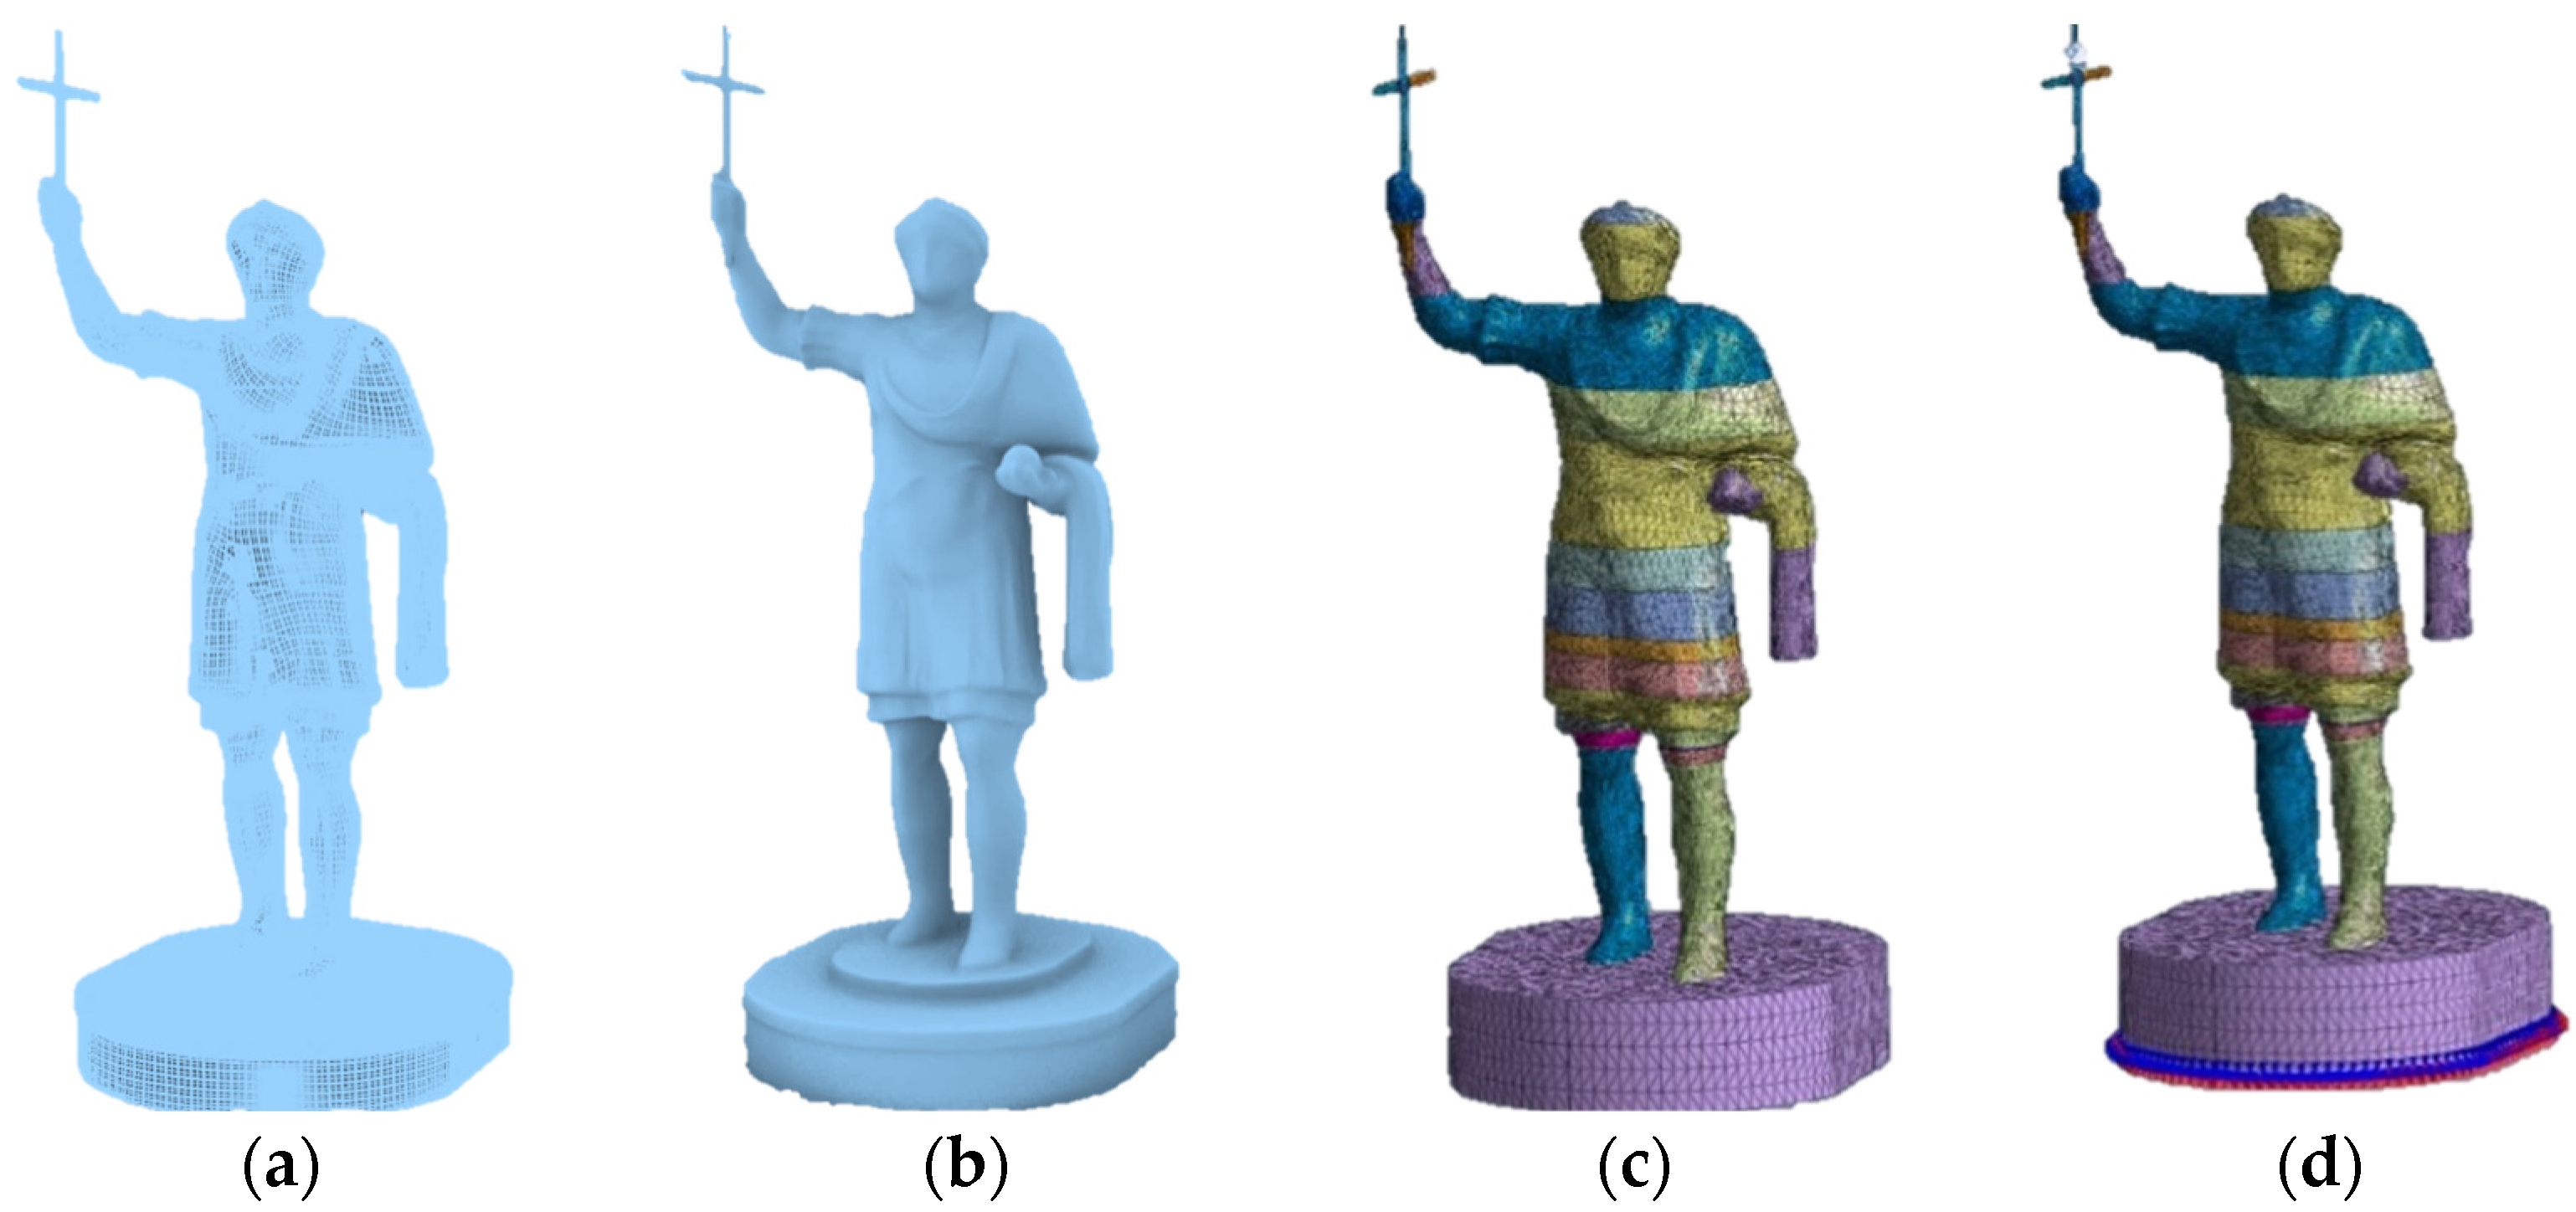
Once we elaborated the geometry built through the NURBS surfaces, the model was imported in Midas Fea NX software (Figure 6a,b); in this phase we found a lack of recognition of all the surfaces composing the geometry. To overcome this problem, the geometry was sectioned and divided into different portions; subsequently, the model was reimported into the FEM program. In this way, the software was able to correctly recognize all the geometries of the surfaces or the geometries of the statue. Through Boolean commands, the geometries were re-joined and made congruent. The structural mesh was then created from the reconstructed geometry (Figure 6c), where each colour represents a single portion of the model. The model was perfectly reassembled and thus available for subsequent analysis. The first step for the analysis was to set boundary conditions such as that of creating an interlocking constraint at the base of the structure (Figure 6d).
In Midas Fea NX software, the next step was to transform the masses in order to perform an eigenvalue analysis. In addition, for a complete evaluation, it was necessary to assign to each element of which the structure is composed, the relative physical–chemical characteristics. For the entire structure of the statue, a bronze alloy was used as a material (data deduced from the classification and characterization of materials on the basis of a non-destructive EDXRF analysis); in particular, a single material (bronze alloy) of 0.004 m thickness was used, obtained as the average value between the concentrations of copper (Cu) and lead (Pb) present on the major surfaces of the structure. For the basic structure, the proprieties of concrete were assigned. Table 4 shows the values of elastic modulus (E), Poisson’s ratio (v), and unit weight (γ).
The seismic design actions are calculated starting from the definition of the basic seismic hazard of the construction site and are a function of the morphological and stratigraphic characteristics that contribute to determining the local seismic response; for this reason, depending on the project area, the design spectrum for the evaluation of the “ULS” or the Ultimate Life Saving Limit State and for the “DLS” or the response to the Damage Limit State has been defined. The choice of the seismic spectral parameters has been inferred from the datasets of the Ministry of Infrastructure and Sustainable Mobility of Italy and subsequently imported into the calculation program for the subsequent linear dynamic analyses.

2.4.3. FEM Analysis with Reinforcement

For the elaboration of the FEM analysis with reinforcement, it was necessary to model the entire steel structure in Rhino software first. For the modelling, the design drawings used in one of the restoration phases were useful for the three-dimensional reconstruction of the structure. The reinforcing structure was oriented and positioned inside the statue (see Figure 7).
Subsequently, this model was imported into the calculation software, and, through Boolean commands, all the different parts of the reinforcement structure were connected as geometries. The realization of the mesh of the reinforcement structure and its exact positioning inside the statue were not simple operations since the steel structure had several areas of overlapping steel sheets (structural nodes).
To resolve this problem, in correspondence with the nodes, the mesh has been carefully calibrated and scaled. Moreover, a further difficulty related to the connections was faced: to create a connection between the steel structure and the statue, the structural parts to be connected were extruded with Boolean commands and intersected the surface of the statue by 0.004 m. Subsequently, the parts exceeding the statue were cut off. The congruence between structure and statue was achieved through sophisticated contact modelling (see Figure 8).
In particular, the mesh modelling of the steel parts that constitute the internal structure is shown in Figure 8a,b. Each colour refers to the creation of a mesh of a distinct geometric element. In addition, the mesh can be detailed differently with respect to the type of element in order to visualize clearly and in detail the stresses and displacements on the structure. In Figure 8c,d, the results obtained in the phase of realisation of the connections between the bronze structure, the body of the statue and the steel structure are represented.
This strategy is frequently used in mechanical engineering in the realization of precise mechanical unions, bolts, steel nodes, welds, etc. Once the whole structure was realized, the boundary conditions and the forces at play were recalibrated.

3. Results

This section shows the main results as regards the quality 3D parametric model and the stability analysis of the statue taken into consideration.
Section 3.1 analyses the metric quality of the 3D model generated by a suitable method developed in the paper.
Section 3.2 shows the potentialities of the 3D model for the analysis in the FEM environment as well as the results obtained both with and without the action of dynamic effects on the structure such as the one due to the earthquake. Indeed, the Italian territory and in particular the territory on which the structure falls has a medium-high seismic risk where strong earthquakes can occur.
Therefore, highly performing calculation models, able to analyse with a high degree of detail the structure under examination, represent an important aspect for the conservation of cultural heritage.

3.1. Quality of the 3D Model for FEM Analysis

The three-dimensional model deriving from the photogrammetric approach has led to the construction of a detailed TIN model both from the geometric point of view and of the constructive parts; however, the TIN obtained was composed of more than ten million faces that did not contribute in some parts of the structure to improve the definition necessary for the FEM analysis. For this reason, before importing the NURBS model into the FEM software, a decimation of the triangular mesh was carried out. In this way, it was possible to build the parametric model of the statue.
Among the different phases listed, almost automated by the software used, the phase related to the reparation of the quad mesh model represented a phase with a rather important manual editing and crucial for the correct definition of the subsequent NURBS model. However, this activity depends on the type of structure (statue) taken into consideration. The comparison between the model for the FEM analysis and the photogrammetric point cloud provided an average distance value of 0.001 m and a standard deviation value of 0.009 m.

3.2. FEM Analysis of the Colossus of Barletta

In order to evaluate the stability conditions of the structure, two different static analyses were carried out, namely, a linear static analysis and another linear dynamic analysis; these analyses were carried out on two models: a first model that does not take into account the steel reticular reinforcement structure, and a second model in which the effect due to the internal reinforcement is objectively evaluated.
In the implemented FEM models, a single bronze alloy with a thickness of 4 mm was assumed.
The construction of the parametric model within the FEM software made it possible to carry out an FEM analysis of the structure taking into account solid stress (Figure 9a), displacement along x (Figure 9b) and along y (Figure 9c).
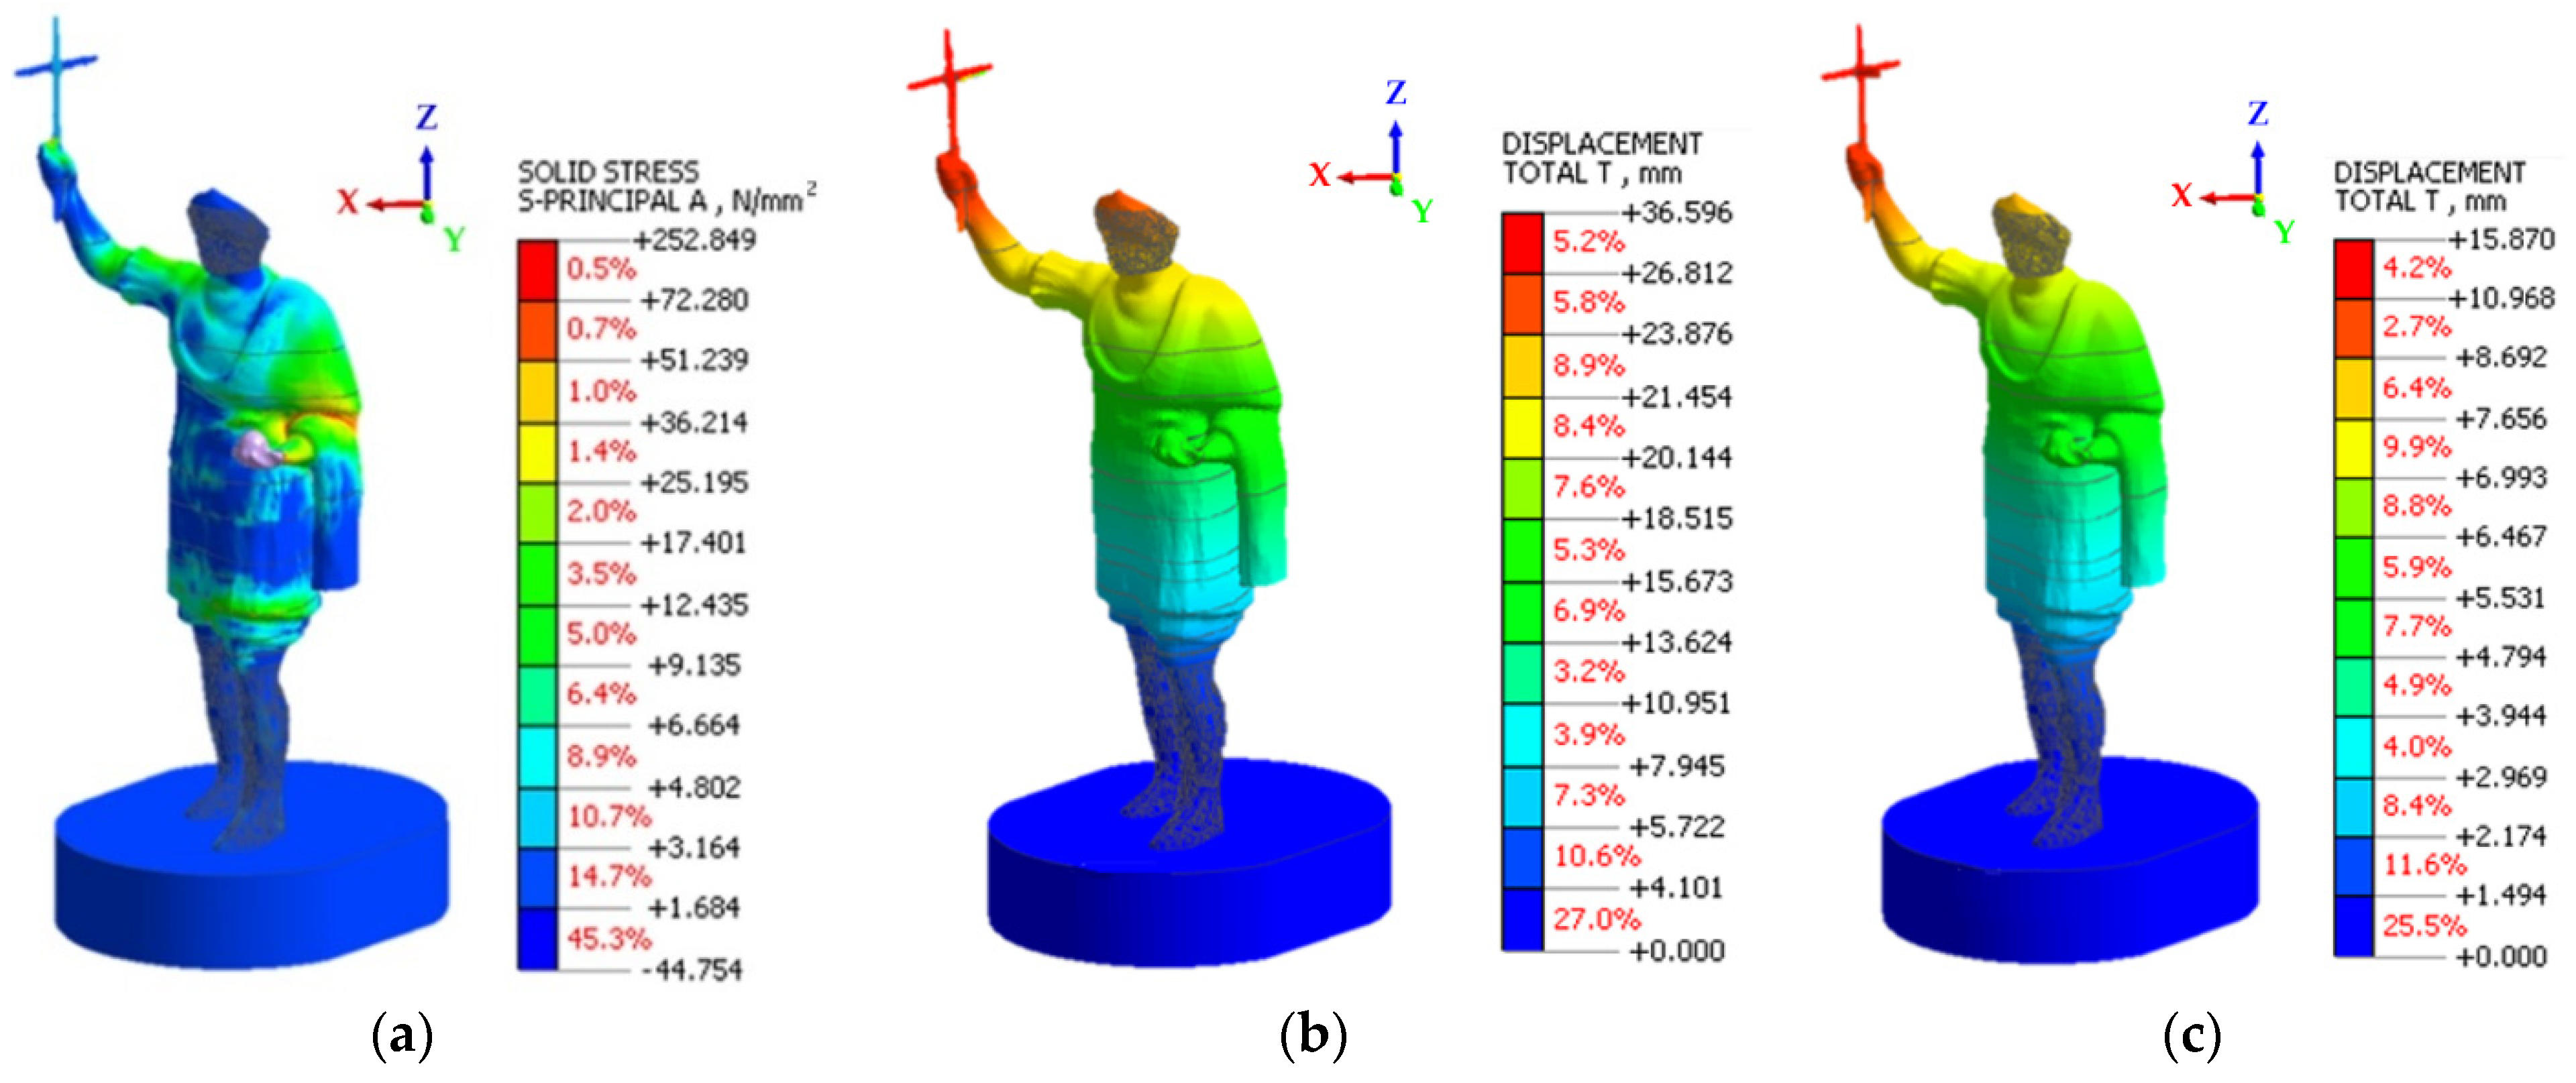
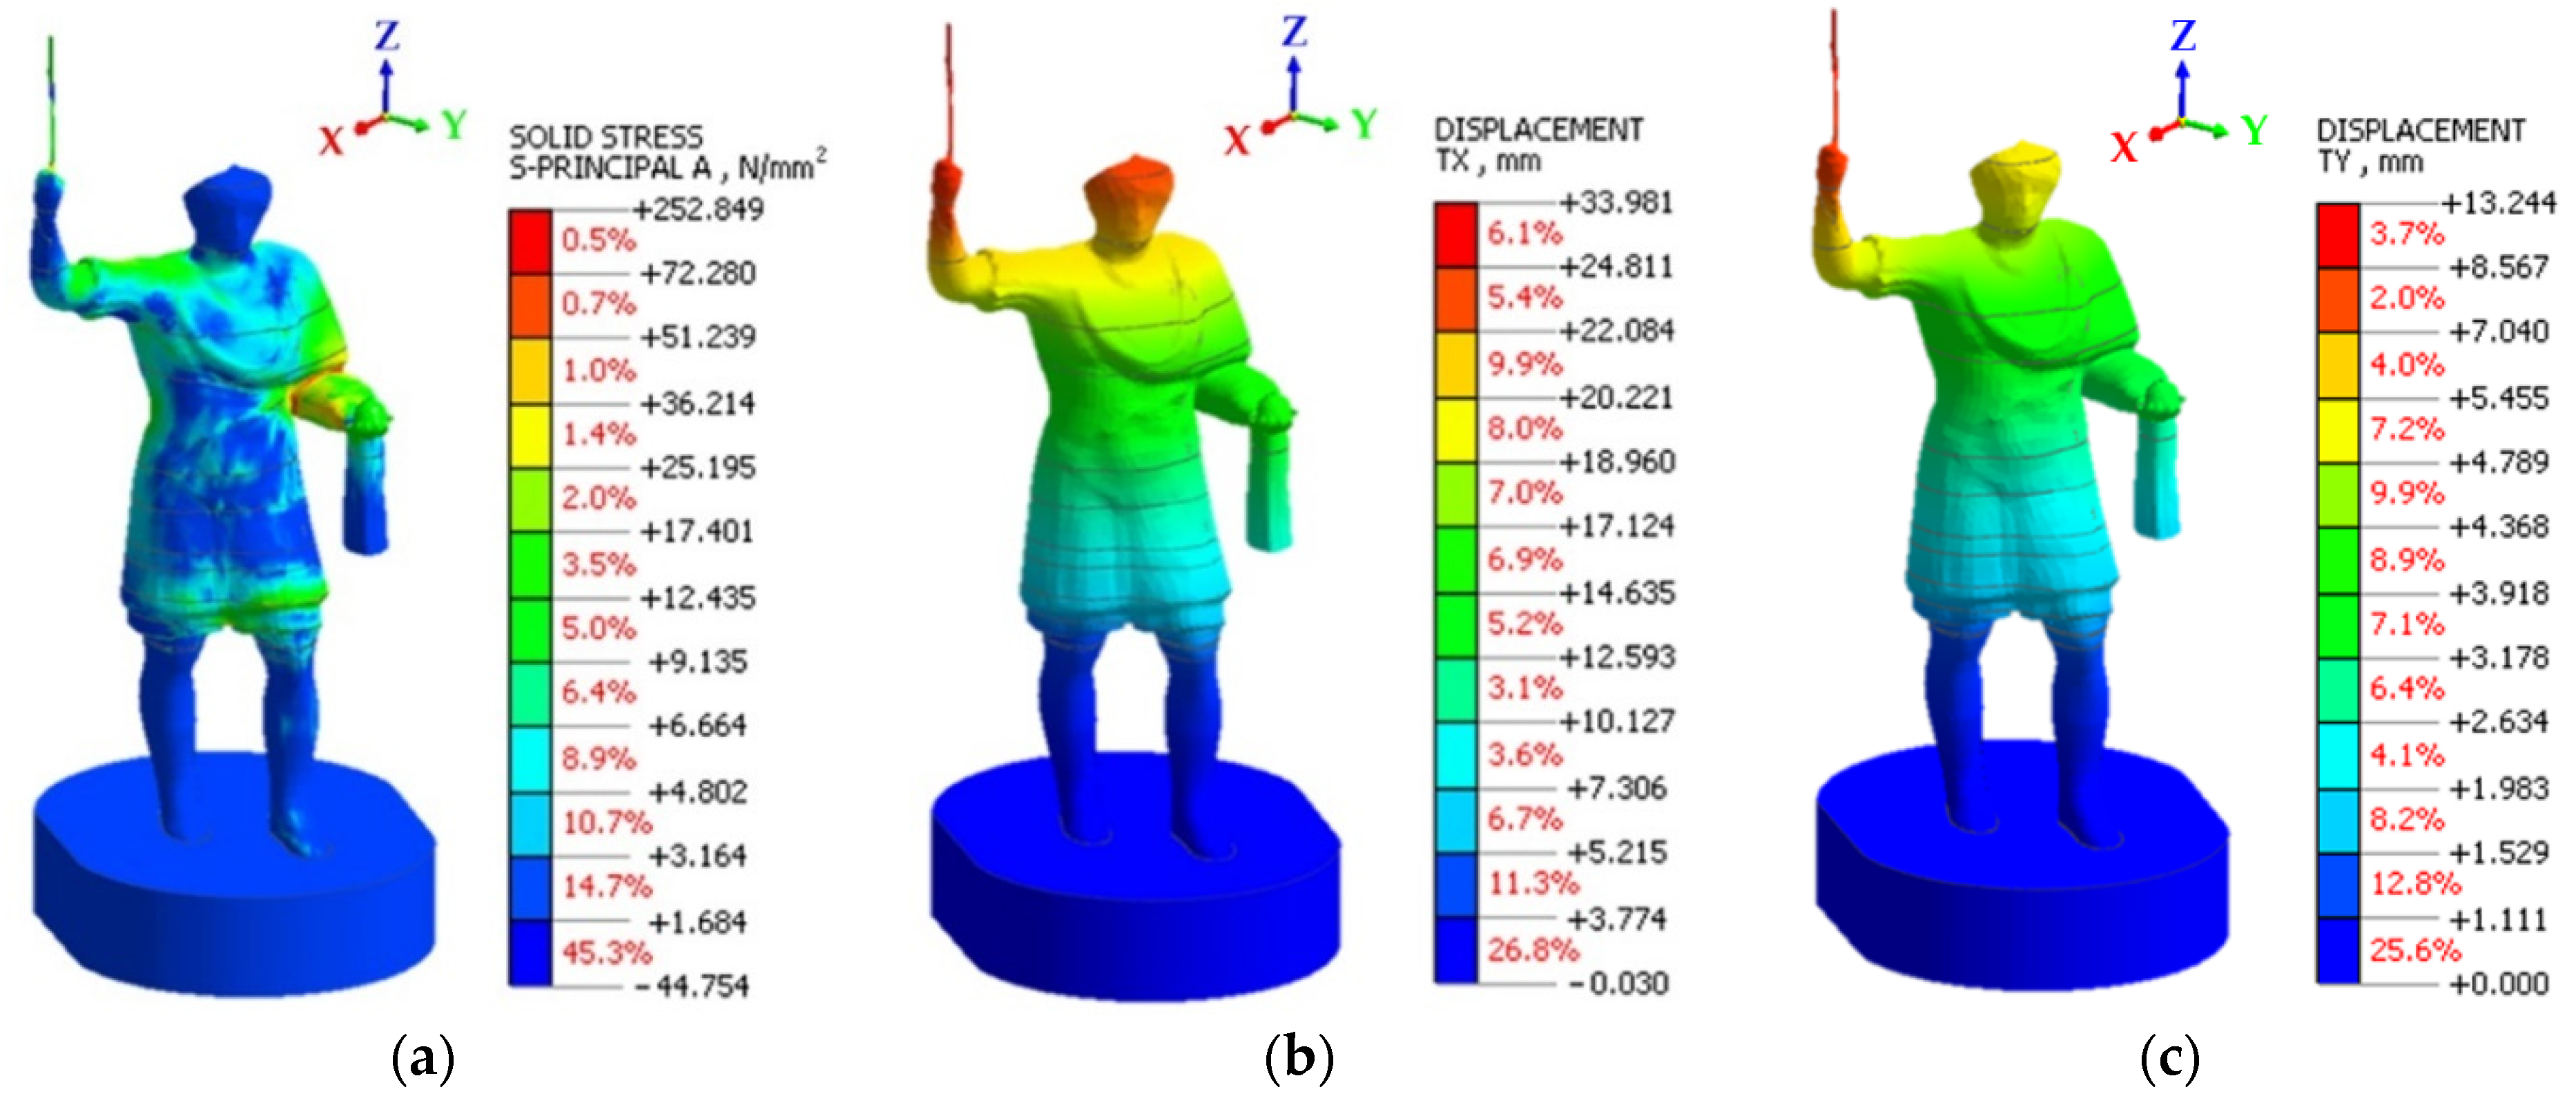
This analysis made it possible to compare the two structures with and without reinforcement. From the analysis carried out on the model both without and with reinforcement, it is possible to note that some parts of the structure are at risk. In this case, the statue tends to move forward and especially in the upper part of the structure in the linear dynamic seismic SLV analysis along x and along y.
From the analysis of the models, it was possible to detect important displacements in correspondence with some construction details such as the arm, the hand and the cross at the top; this means that these parts of the structure are exposed to a high risk of breakage or deformation under seismic action.
As already shown in the FEM analysis without the reinforcing structure, static, modal and seismic dynamic analyses were carried out on the latter model, the results of which are shown in Figure 10 below.

4. Discussions

The proposed methodology has allowed the transformation of a 3D model (obtained through a photogrammetric process) into a model for FEM analysis. In particular, the photogrammetric survey made it possible to obtain a three-dimensional model quickly and accurately, reconstructing every detail of the structure taken into consideration in detail. In fact, the 3D model showed very low RMSE values, in the order of millimetres. Furthermore, from the three-dimensional model of the statue, it was possible to extrapolate detailed orthophotos (see Figure 4), which were particularly useful for visually analysing the possible criticalities of the structure.
In the previous sections, the Scan to FEM process applied to the case study of the statue of “Colossus of Barletta” was described. The phases that have led to the definition of this process were: (i) creation of the TIN model; (ii) reduction in the number of faces of the TIN model; (iii) construction of the quad mesh; (iv) decimation of the quad mesh model; (v) repair of the model from any errors on the surface mesh; (vi) transformation into NURBS surfaces. With this methodological approach, it was possible to obtain a three-dimensional model as faithful as possible to the original structure, while retaining its accuracy and detail. Indeed, a comparison of the point cloud generated by the photogrammetric process (reference) with the quad mesh reduced by 10% shows that 85% of the points differ by about 3mm. In addition, as the level of decimation increases, it can be seen that some of the finer and more complex construction details, such as the cross or the folds of the cloth and cloak, deviate to a greater extent from the original model.
In order to verify the quality and repeatability of the developed method, additional photogrammetric datasets were considered. In particular, several models of statues were analysed. Dataset A (Headmask) and B (Lausanne Aquarius) were obtained from the website of the Geometric Computing Laboratory, École Polytechnique Fédérale de Lausanne, School of Computer and Communication Sciences, Switzerland (https://lgg.epfl.ch/ accessed on 30 December 2021). In particular, the height of Headmask’s statue is about 2.00 m and Lausanne Aquarius is about 1.50 m. Dataset C concerns the point cloud of Kossuth Statue obtained by the photogrammetric approach and using images generated by a DJI Mavic Mini drone. This latter model (point cloud) was created by the Furaysolutions Company and downloaded from Sketchfab (https://sketchfab.com/3d-models/kossuth-statue-point-cloud-29d3f031a9ce4cd095b1ee7c3fbe9391) accessed on 30 December 2021. The height of this latter statue is about 6.00 m. As discussed in the previous paragraphs, the different photogrammetric datasets (number of images, dense cloud, number of meshes) were compared with the respective point clouds. In particular, a C2M distance was performed. The results of this comparison were reported in Table 5; moreover, in this table, the number of faces (quad mesh) and the memory occupation for each dataset have been reported when varying the decimation percentage (10%, 30%, 70%).
From the analysis of these tests carried out on other photogrammetric datasets concerning statues (see Table 5), it is possible to note that the reduction from the TIN model to quad mesh is optimal for values of 10% as the accuracy and detail of some details are reproduced in a manner close to the reference model. As the reduction percentage increases, there is an increase in error and a consequent loss of detail in the structure. In addition, the file size has been reduced by about one tenth compared to the TIN model; this aspect becomes important as the number of points and/or the size of the structure increases.
With regard to the structural analysis, the quality of the 3D model produced according to the proposed methodology allowed the management and computation of the models in the FEM environment. In fact, as shown in the case study of the Colossus of Barletta, it was possible to process different structures (with and without steel reinforcement) by developing static and dynamic analysis models. Indeed, it was shown how the contribution of the reinforcements inside the structure positively affects the overall structural balance. In this way this last intervention has improved the performance of the statue but has not prevented all the criticalities and seismic vulnerabilities. Indeed, as can be seen from the models obtained from the FEM analysis, no significant improvement was found in the reinforced model from the seismic point of view. In other words, from the seismic point of view, the contribution of the reinforced structure is weakly efficient.

5. Conclusions

The paper showed an efficient and practical process for modelling geometrically complex structures from point clouds. In fact, thanks to the use of suitable photogrammetric techniques based on SfM and MVS approach, it was possible to build a detailed model both from the point of view of the definition of the particulars of the statue and from the dimensional point of view. From the dimensional point of view, the use of control points allowed us to evaluate a model accuracy of a few millimetres. However, the model generated in this environment needed adequate editing in order to obtain a model defined in the details, congruent in the different parts of which the structure is composed, light to manage in graphic environment, and importable in the FEM software. To reach this purpose, a procedure based on the use of Rhino software was developed. Thanks to the use of specific tools for three-dimensional modelling as well as tools for the simplification of the triangular mesh in quad mesh, it was possible to generate a 3D model very close to reality. A comparison in the Cloud Compare environment showed that by reducing the quad mesh by 10%, the average distance between it and the point cloud was 0.001 m; the value obtained is therefore acceptable with the accuracy required for an FEM analysis of the structure. In addition, it has been observed that a strong mesh reduction can lead to a loss of essential information; therefore, the identification of the mesh reduction threshold must be evaluated for the specific case study, i.e., taking into account the intrinsic geometry of the structure.
The Scan to FEM process applied to the Colossus of Barletta described in the paper, has allowed us to identify, through an analysis in FEM environment, the criticalities related to the state of preservation of the statue. In fact, the portions of the statue that show a high level of criticality are those that structurally present strong overhangs such as the arm stretched upwards that supports the cross or those areas in which there are joints that connect the various elements (clothes, legs, etc.). The FEM analysis carried out showed the low contribution of the internal reinforcement structure in the dynamic analysis. Therefore, in order to safeguard structures of this type, it is necessary to seismically isolate the base of the statue. The anti-seismic device, elastomeric isolator and viscous sliding absorbing the seismic action would leave the statue only the burden of its own weight and therefore only the static loads for which the reinforcement is obviously useful. The benefits of this approach have been shown recently in some case studies of the safeguarding of statues belonging to the cultural heritage, such as the “Bronzi di Riace”, three statues at the “Opera del Duomo Museum (MODO)” of Orvieto [44] and the famous statue of the “Pietà Rondanini” by Michelangelo Buonarroti [45].
In general, the geomatics approach experimented in the Scan to FEM process can be applied in a simple way even to structures with very complex geometry and allows us to obtain an easily manageable model in all its phases of construction, from the survey to the modelling, up to the interpretation of the results for a specific intervention of maintenance or restoration.

Author Contributions

Conceptualization, V.S.A., D.C., M.P. and A.R.G.; Methodology, V.S.A., D.C., M.P. and A.R.G.; Software, V.S.A., D.C., M.P. and A.R.G.; Validation, V.S.A., D.C., M.P. and A.R.G.; Writing—review and editing, V.S.A., D.C., M.P. and A.R.G. All authors have read and agreed to the published version of the manuscript.

Funding

This research received no external funding.

Institutional Review Board Statement

Not applicable.

Informed Consent Statement

Not applicable.

Data Availability Statement

Not applicable.

Acknowledgments

We would like to thank the Municipality of Barletta (BAT) for its support and for having provided the project drawings for the restauration of the statue. In addition, we want to thank the reviewers for their careful reading of the manuscript and their constructive remarks.

Conflicts of Interest

The authors declare no conflict of interest.

References

  1. Pieraccini, M.; Guidi, G.; Atzeni, C. 3D Digitizing of Cultural Heritage. J. Cult. Herit. 2001, 2, 63–70. [Google Scholar] [CrossRef]
  2. Kabadayi, A.; Yunus, K.; Yiğit, A.Y. Comparison of Documentation Cultural Artifacts Using the 3D Model in Different Software. Mersin Photogramm. J. 2020, 2, 51–58. [Google Scholar]
  3. Patias, P.; Grussenmeyer, P.; Hanke, K. Applications in Cultural Heritage Documentation. In Advances in Photogrammetry, Remote Sensing and Spatial Information Sciences: 2008 ISPRS Congress Book; CRC Press: Beijing, China, 2008; pp. 381–402. [Google Scholar]
  4. Baik, A. The Use of Interactive Virtual BIM to Boost Virtual Tourism in Heritage Sites, Historic Jeddah. ISPRS Int. J. Geo-Inf. 2021, 10, 577. [Google Scholar] [CrossRef]
  5. Costantino, D.; Pepe, M.; Restuccia, A.G. Scan-to-HBIM for Conservation and Preservation of Cultural Heritage Building: The Case Study of San Nicola in Montedoro Church (Italy). Appl. Geomat. 2021. [Google Scholar] [CrossRef]
  6. Petrie, G.; Toth, C.K. Terrestrial Laser Scanners. In Topographic Laser Ranging and Scanning; CRC Press: Boca Raton, FL, USA, 2009. [Google Scholar]
  7. Artese, S. The Survey of the San Francesco Bridge by Santiago Calatrava in Cosenza, Italy. Int. Arch. Photogramm. Remote Sens. Spat. Inf. Sci 2019, 42, 33–37. [Google Scholar] [CrossRef] [Green Version]
  8. Bertolini-Cestari, C.; Chiabrando, F.; Invernizzi, S.; Marzi, T.; Spanò, A. Terrestrial Laser Scanning and Settled Techniques: A Support to Detect Pathologies and Safety Conditions of Timber Structures. Adv. Mater. Res. 2013, 778, 350–357. [Google Scholar] [CrossRef] [Green Version]
  9. Virtanen, J.-P.; Hyyppä, H.; Kurkela, M.; Vaaja, M.; Alho, P.; Hyyppä, J. Rapid Prototyping—A Tool for Presenting 3-Dimensional Digital Models Produced by Terrestrial Laser Scanning. ISPRS Int. J. Geo-Inf. 2014, 3, 871–890. [Google Scholar] [CrossRef] [Green Version]
  10. Khodja, N.A.; Zeghlache, H.; Benali, F.; Guani, O. The Use of New Technologies in the Restoration and Conservation of Built Cultural Heritage/the Case of the Statue of Fouara, Setif, Algeria. Int. Arch. Photog. Remote Sens. Spat. Inf. Sci. 2019, 42, 43–46. [Google Scholar] [CrossRef] [Green Version]
  11. Schonberger, J.L.; Frahm, J.-M. Structure-from-Motion Revisited. In Proceedings of the IEEE Conference on Computer Vision and Pattern Recognition, Las Vegas, NV, USA, 27–30 June 2016; pp. 4104–4113. [Google Scholar]
  12. Muzzupappa, M.; Gallo, A.; Spadafora, F.; Manfredi, F.; Bruno, F.; Lamarca, A. 3D Reconstruction of an Outdoor Archaeological Site through a Multi-View Stereo Technique. In Proceedings of the 2013 Digital Heritage International Congress (Digitalheritage), Marseille, France, 28 October–1 November 2013; IEEE: Piscataway, NJ, USA, 2013; Volume 1, pp. 169–176. [Google Scholar]
  13. Bagnéris, M.; Cherblanc, F.; Bromblet, P.; Gattet, E.; Gügi, L.; Nony, N.; Mercurio, V.; Pamart, A. A Complete Methodology for the Mechanical Diagnosis of Statue Provided by Innovative Uses of 3D Model. Application to the Imperial Marble Statue of Alba-La-Romaine (France). J. Cult. Herit. 2017, 28, 109–116. [Google Scholar] [CrossRef] [Green Version]
  14. Adamopoulos, E.; Rinaudo, F. Documenting the State of Preservation of Historical Stone Sculptures in Three Dimensions with Digital Tools. In Proceedings of the Pattern Recognition. ICPR International Workshops and Challenges, Proceedings, Part III, Virtual Event. online, 10–15 January 2021; Springer: Berlin/Heidelberg, Germany, 2021; pp. 666–673. [Google Scholar]
  15. El-Hakim, S.F.; Beraldin, J.-A.; Picard, M.; Vettore, A. Effective 3D Modeling of Heritage Sites. In Proceedings of the Fourth International Conference on 3-D Digital Imaging and Modeling, Banff, AB, Canada, 6–10 October 2003; IEEE: Piscataway, NJ, USA, 2003; pp. 302–309. [Google Scholar]
  16. Scianna, A.; Gaglio, G.F.; La Guardia, M. Digital Photogrammetry, TLS Survey and 3D Modelling for VR and AR Applications in CH. Int. Arch. Photogramm. Remote Sens. Spat. Inf. Sci. 2020, 43, 901–909. [Google Scholar] [CrossRef]
  17. Barone, S.; Paoli, A.; Razionale, A.V. 3D Reconstruction and Restoration Monitoring of Sculptural Artworks by a Multi-Sensor Framework. Sensors 2012, 12, 16785–16801. [Google Scholar] [CrossRef] [PubMed] [Green Version]
  18. Pepe, M.; Costantino, D. Techniques, Tools, Platforms and Algorithms in Close Range Photogrammetry in Building 3D Model and 2D Representation of Objects and Complex Architectures. Comput.-Aided Des. Appl. 2020, 18, 42–65. [Google Scholar] [CrossRef]
  19. Barazzetti, L.; Banfi, F.; Brumana, R.; Oreni, D.; Previtali, M.; Roncoroni, F.; Gusmeroli, G.; Schiantarelli, G. BIM from Laser Clouds and Finite Element Analysis: Combining Structural Analysis and Geometric Complexity. In Proceedings of the International Archives of the Photogrammetry, Remote Sensing and Spatial Information Sciences, 3D Virtual Reconstruction and Visualization of Complex Architectures, Avila, Spain, 25–27 February 2015; 2015; Volume XL-5/W4, pp. 345–350. [Google Scholar]
  20. Guarnieri, A.; Fissore, F.; Masiero, A.; Di Donna, A.; Coppa, U.; Vettore, A. From survey to FEM analysis for documentation of built heritage: The case study of Villa Revedin-Bolasco. Int. Arch. Photogramm. Remote Sens. Spat. Inf. Sci. 2017, 42, 527–533. [Google Scholar] [CrossRef] [Green Version]
  21. Pfeuffer, C.; Rahrig, M.; Snethlage, R.; Drewello, R. 3D Mapping as a Tool for the Planning of Preservation Measures on Sculptures Made of Natural Stone. Environ. Earth Sci. 2018, 77, 312. [Google Scholar] [CrossRef]
  22. Pepe, M.; Costantino, D.; Restuccia Garofalo, A. An Efficient Pipeline to Obtain 3D Model for HBIM and Structural Analysis Purposes from 3D Point Clouds. Appl. Sci. 2020, 10, 1235. [Google Scholar] [CrossRef] [Green Version]
  23. Santini, S.; Baggio, C.; Sabbatini, V.; Sebastiani, C. Setup Optimization of Experimental Measures on a Historical Building: The Octagonal Hall of the Diocletian’s Bath. Heritage 2021, 4, 2205–2223. [Google Scholar] [CrossRef]
  24. Funari, M.F.; Hajjat, A.E.; Masciotta, M.G.; Oliveira, D.V.; Lourenço, P.B. A Parametric Scan-to-FEM Framework for the Digital Twin Generation of Historic Masonry Structures. Sustainability 2021, 13, 11088. [Google Scholar] [CrossRef]
  25. Valenti, M.C.; Parronchi, A.; Giovannini, P.; Paolucci, A.; Luchinat, C.A.; D’Adda, S.B.; Matteini, M. Exploring David: Diagnostic Tests and State of Conservation; Giunti: Firenze, Italy, 2004. [Google Scholar]
  26. Borri, A.; Grazini, A. Diagnostic Analysis of the Lesions and Stability of Michelangelo’s David. J. Cult. Herit. 2006, 7, 273–285. [Google Scholar] [CrossRef]
  27. Visintini, D.; Spangher, A. Il Contributo Della Geomatica per l’analisi Strutturale Dei Beni Culturali: L’esempio Di Una Statua Romana Lesionata. In Proceedings of the Atti 18a Conferenza Nazionale ASITA, Firenze, Italy, 14–16 October 2014; pp. 1229–1236. [Google Scholar]
  28. Spangher, A.; Visintini, D.; Tucci, G.; Bonora, V. Geomatic 3D modeling of a statue (also) for structural analysis and risk evaluation: The example of San Giovannino Martelli in Florence. Int. Arch. Photogramm. Remote Sens. Spat. Inf. Sci. 2017, 42, 61–68. [Google Scholar] [CrossRef] [Green Version]
  29. Riccardelli, C.; Morris, M.; Wheeler, G.; Soultanian, J.; Becker, L.; Street, R. The Treatment of Tullio Lombardo’s Adam: A New Approach to the Conservation of Monumental Marble Sculpture. Metrop. Mus. J. 2014, 49, 48–116. [Google Scholar] [CrossRef]
  30. Bici, M.; Campana, F.; Colacicchi, O.; D’Ercoli, G. CAD-CAE Methods to Support Restoration and Museum Exhibition of Bronze Statues: The “Principe Ellenistico”. In Proceedings of the IOP Conference Series: Materials Science and Engineering, Florence, Italy, 16–18 May 2018; IOP Publishing: Bristol, UK, 2018; Volume 364, p. 012014. [Google Scholar]
  31. Stefania, V.; Pintucchi, B.; Tommaso, R.; Tanganelli, M. The Seismic Analysis of Cerere at the Museum of Bargello. Bull. Earthq. Eng. 2020, 18, 2635–2656. [Google Scholar]
  32. Kiilerich, B. The Barletta Colossus Revisited: The Methodological Challenges of an Enigmatic Statue. Acta Archaeol. Artivm Hist. Pertin. 2015, 28, 55–72. [Google Scholar]
  33. Buccolieri, G.; Nassisi, V.; Delle Side, D.; Giuffreda, E.; Marabelli, M.; Buccolieri, A.; Iacobellis, V.N.; Paladini, F.; Vona, F.; Castellano, A. The Restoration of the Colosso Di Barletta: EDXRF Analysis. In Proceedings of the 4th Workshop-Plasmi, Sorgenti, Biofisica ed Applicazioni, Lecce, Italy, 17-18 October 2014; Volume 2014, pp. 7–10. [Google Scholar]
  34. Berger, M.; Tagliasacchi, A.; Seversky, L.; Alliez, P.; Levine, J.; Sharf, A.; Silva, C. State of the Art in Surface Reconstruction from Point Clouds. In Proceedings of the Eurographics 2014-State of the Art Reports, Strasbourg, France, 7–11 April 2014; Volume 1, pp. 161–185. [Google Scholar]
  35. Coaker, L.H. Reflector-Less Total Station Measurements and Their Accuracy, Precision and Reliability. Bachelor’s Thesis, University of Southern Queensland, Toowoomba, Australia, October 2009. [Google Scholar]
  36. Bommes, D.; Lévy, B.; Pietroni, N.; Puppo, E.; Silva, C.; Tarini, M.; Zorin, D. Quad-Mesh Generation and Processing: A Survey. Comput. Graph. Forum 2013, 32, 51–76. [Google Scholar] [CrossRef]
  37. Shepherd, J.F.; Johnson, C.R. Hexahedral Mesh Generation Constraints. Eng. Comput. 2008, 24, 195–213. [Google Scholar] [CrossRef]
  38. Girardeau-Montaut, D. CloudCompare; EDF R&D Telecom ParisTech: Paris, France, 2016. [Google Scholar]
  39. Pepe, M.; Costantino, D.; Alfio, V.S.; Restuccia, A.G.; Papalino, N.M. Scan to BIM for the Digital Management and Representation in 3D GIS Environment of Cultural Heritage Site. J. Cult. Herit. 2021, 50, 115–125. [Google Scholar] [CrossRef]
  40. Piegl, L. On NURBS: A Survey. IEEE Comput. Graph. Appl. 1991, 11, 55–71. [Google Scholar] [CrossRef]
  41. Ji, S.; Lei, L.; Zhao, J.; Lu, X.; Gao, H. An Adaptive Real-Time NURBS Curve Interpolation for 4-Axis Polishing Machine Tool. Robot. Comput.-Integr. Manuf. 2021, 67, 102025. [Google Scholar] [CrossRef]
  42. MIDASoft North America. Available online: https://www.midasoft.com (accessed on 2 December 2021).
  43. NTC2018-D.M.; Ministero Delle Infrastrutture e dei Trasporti Aggiornamento delle «Norme Tecniche per le Costruzioni». Il ministero delle infrastrutture e dei trasporti: Rome, Italy, 17 January 2018. (In Italian)
  44. De Canio, G. New anti seismic basements for high vulnerable statues in Italy. In Proceedings of the 14th World Conference on Seismic Isolation, Energy Dissipation and Active Vibration Control of Structures, San Diego, CA, USA, 9–11 September 2015. [Google Scholar]
  45. Cigada, A.; Sabbioni, E.; Siami, A.; Zappa, E. Modeling and Testing of the Anti-Vibration Base for Michelangelo’s Pietà Rondanini. In Special Topics in Structural Dynamics; Springer: Berlin/Heidelberg, Germany, 2016; Volume 6, pp. 11–21. [Google Scholar]
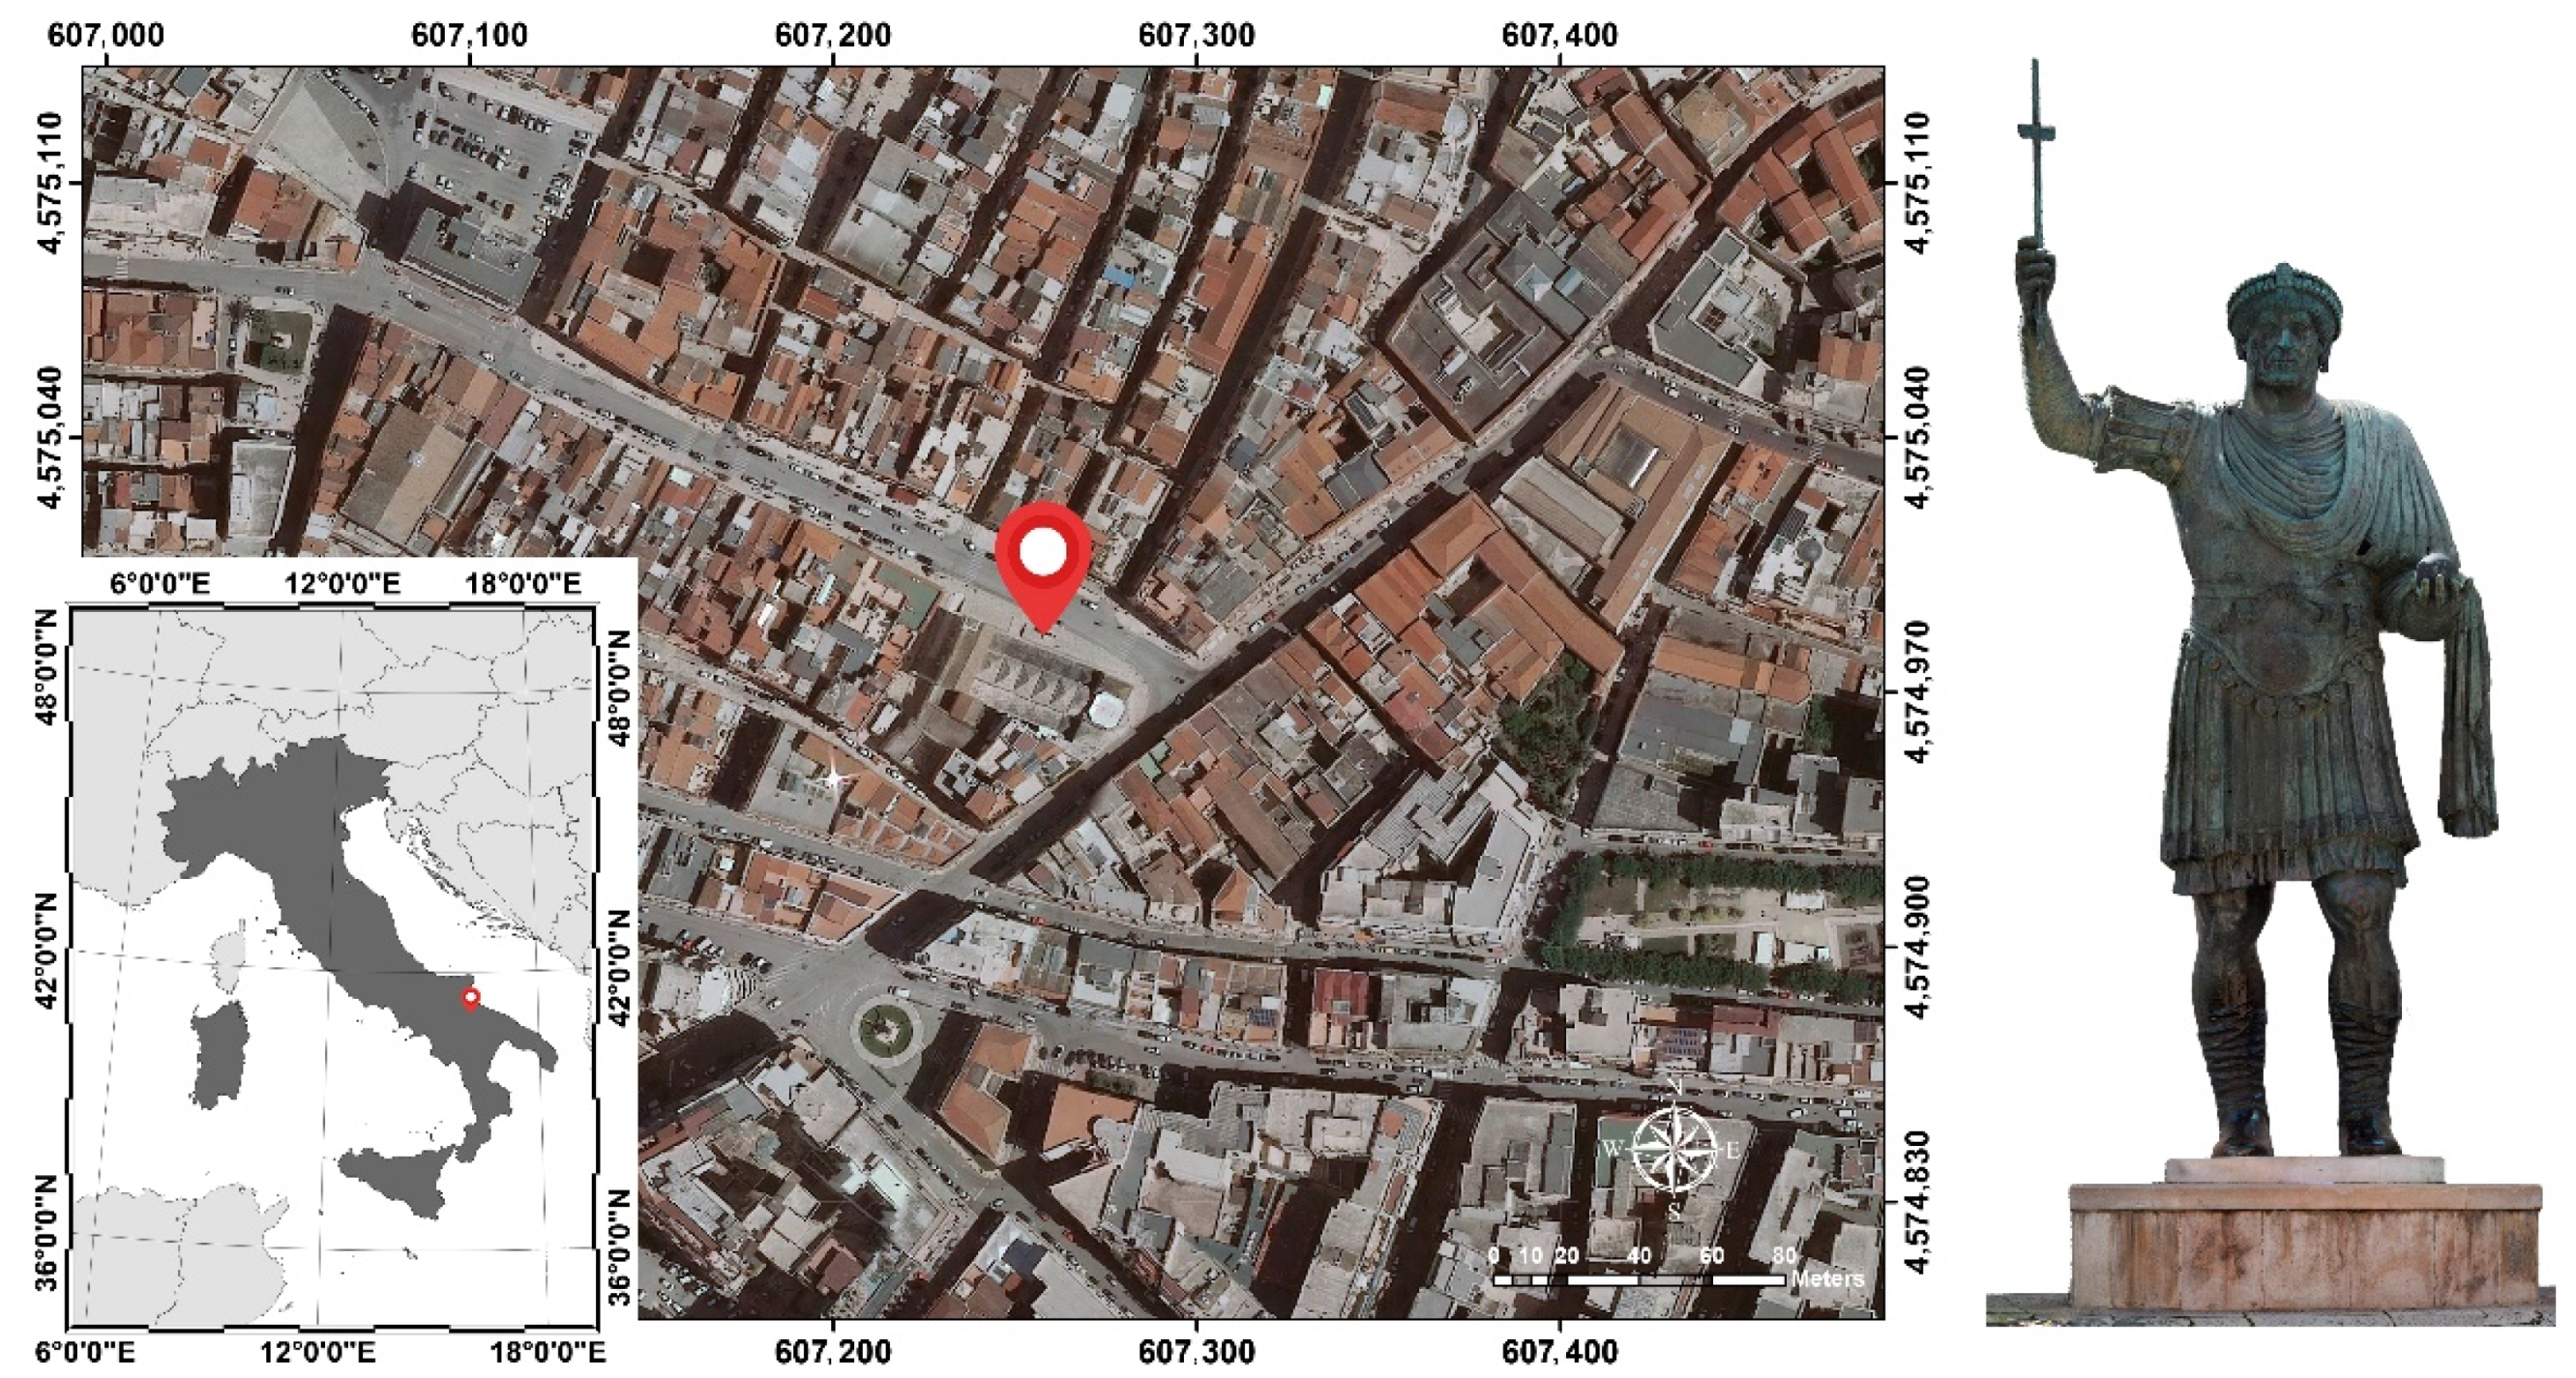
Figure 1. Geolocation of the ‘Colossus of Barletta’ statue.
Remotesensing 14 00664 g001
Figure 2. Pipeline of the developed and experimented methodological approach.
Remotesensing 14 00664 g002
Figure 3. Geomatics survey: acquisition of the images using the photogrammetric method and view of the total station used for the georeferencing-scaling of the model (a); detail of GCPs (b) and CPs positioning (c).
Remotesensing 14 00664 g003
Figure 4. Three-dimensional models view and orthophoto generated by the photogrammetric process.
Remotesensing 14 00664 g004
Figure 5. Details of the parameterized model: the bust (a), the bust and insertion of the face and the drap (b), basement (c), the basement with insertion of the boots (d).
Remotesensing 14 00664 g005
Figure 6. Importing the model into the calculation software: NURBS model (a), rendered view (b), congruent structural mesh unions (c), setting the base interlock constraint (d).
Remotesensing 14 00664 g006
Figure 7. Three-dimensional modelling and insertion of the reinforcement structure using two-dimensional CAD support in Rhinoceros environment: bottom view (a), perspective view (b) and side view (c).
Remotesensing 14 00664 g007
Figure 8. Generation of congruence between reinforcement structure and statue: mesh generation of structural parts (a,b) and connection systems and positioning within the structure (c,d).
Remotesensing 14 00664 g008
Figure 9. Results of FEM analysis (model without reinforcement): linear static analysis (a), linear dynamic seismic SLV analysis along x (b), linear dynamic seismic SLV analysis along y (c).
Remotesensing 14 00664 g009
Figure 10. Results of FEM analysis (model with reinforcement): linear static analysis (a), linear dynamic seismic SLV analysis along x (b), linear dynamic seismic SLV analysis along y (c).
Remotesensing 14 00664 g010
Table 1. Errors on GCPs and CPs.
Spatial PositionIDTypeError [m]Error [pix]
Remotesensing 14 00664 i00110GCP0.00080.846
12GCP0.00070.898
19GCP0.00030.831
21GCP0.00062.102
1001GCP0.00342.129
1002GCP0.00072.000
1003GCP0.00391.636
Total error0.00201.607
C1-2CP0.00001
C3-4CP−0.00003
C5-6CP0.00046
Total error0.00027
Table 2. Setting and results of photogrammetric process.
ProcessSettingDescriptionValuesProcessing Times
AlignmentHighestHighest accuracy setting upscales the image by factor of 41,932,377 (tie points)36 m 44 s
Dense cloudMediumMedium setting causes image downscaling by factor of 165,644,260 (vertices)1 d 20 h
MeshMediumMedium setting causes image downscaling by factor of 1610,775,553 (triangles)3 m 20 s
Table 3. Application of the C2M algorithm to the different decimation levels evaluated in Cloud Compare software.
DecimationC2M Distance [m]HistogramC2M Image
AverageStDMax
90 (10%)0.0010.0090.029 Remotesensing 14 00664 i002 Remotesensing 14 00664 i003
60 (40%)0.0010.0110.031 Remotesensing 14 00664 i004 Remotesensing 14 00664 i005
30 (70%)0.0030.0190.037 Remotesensing 14 00664 i006 Remotesensing 14 00664 i007
Table 4. Physical–mechanical properties of the materials used.
MaterialPropertiesValue
bronze alloyE11,000 KN/cm2
v0.35
γ9200 Kg/m3
concreteE3057 KN/cm2
v0.20
γ2400 Kg/m3
steelE21,000 KN/cm2
v0.30
γ7859 Kg/m3
Table 5. Test on additional photogrammetric datasets.
DatasetImages [#]Dense Cloud [n. of Points]Mesh [n. of Mesh]Quad MeshC2M Distances
DecimationFaces [#]Memory OBJ Format [KB]Average Distances [m]StD [m]Max Distances [m]
A Remotesensing 14 00664 i0083259,630133,31190 (10%)668311420.0010.0010.024
70 (30%)49328420.0020.0010.025
30 (70%)28284790.0030.0030.047
B Remotesensing 14 00664 i009101341,712800,95690 (10%)13,85724090.0010.0020.023
70 (30%)943716180.0020.0020.034
30 (70%)38696600.0030.0040.048
C Remotesensing 14 00664 i010-2,369,663149,82090 (10%)11,93220530.0020.0100.032
70 (30%)817313940.0030.0110.050
30 (70%)35436010.0040.0120.060
Publisher’s Note: MDPI stays neutral with regard to jurisdictional claims in published maps and institutional affiliations.