Article

Mapping the Abundance of Multipurpose Agroforestry Faidherbia albida Trees in Senegal

1
Department of GeoSciences and Natural Resource Management, University of Copenhagen, 1350 Copenhagen, Denmark
2
Pastoralisme Conseil, 30 Chemin de Jouanal, 82160 Caylus, France
3
CIRAD, UPR AÏDA, Dakar, Sénégal and AÏDA, University of Montpellier, CIRAD, 34398 Montpellier, France
4
Agroecology and Sustainable Intensification for Annual Crop, University of Montpellier, CIRAD, 34090 Montpellier, France
5
Centre de Suivi Ecologique, Dakar, Senegal, Institute of Environmental Sciences, Faculty of Sciences and Technics, Cheikh Anta Diop University of Dakar, Dakar 15532, Senegal
*
Author to whom correspondence should be addressed.
Remote Sens. 2022, 14(3), 662; https://doi.org/10.3390/rs14030662
Submission received: 24 November 2021 / Revised: 18 January 2022 / Accepted: 25 January 2022 / Published: 29 January 2022
(This article belongs to the Special Issue Mapping Tree Species Diversity)

Abstract

:
Multi-purpose Faidherbia albida trees represent a vital component of agroforestry parklands in West Africa as they provide resources (fodder for livestock, fruits and firewood) and support water lifting and nutrient recycling for cropping. Faidherbia albida trees are characterized by their inverse phenology, growing leaf flowers and pods during the dry season, thereby providing fodder and shedding leaves during the wet season, which minimizes competition with pastures and crops for resources. Multi-spectral and multi-temporal satellite systems and novel computational methods open new doors for classifying single trees and identifying species. This study used a Multi-Layer Perception feedforward artificial neural network to classify pixels covered by Faidherbia albida canopies from Sentinel-2 time series in Senegal, West Africa. To better discriminate the Faidherbia albida signal from the background, monthly images from vegetation indices were used to form relevant variables for the model. We found that NDI54/NDVI from the period covering onset of leaf senescence (February) until end of senescence (leaf-off in June) to be the most important, resulting in a high precision and recall rate of 0.91 and 0.85. We compared our result with a potential Faidherbia albida occurrence map derived by empirical modelling of the species ecology, which deviates notably from the actual species occurrence mapped by this study. We have shown that even small differences in dry season leaf phenology can be used to distinguish tree species. The Faidherbia albida distribution maps, as provided here, will be key in managing farmlands in drylands, helping to optimize economic and ecological services from both tree and crop products.

1. Introduction

Faidherbia albida (Del.) A. Chev. (synonym Acacia albida Del.) trees belong to the mimosoideae sub family of the Fabaceae family and are a key component of West African agroforestry parklands, where crops are grown under a discontinuous cover of scattered trees. Faidherbia albida trees provide resources such as fodder for livestock, fruits, firewood, wood products for construction and traditional medicine [1,2,3,4,5,6]. The deep-rooted trees have access to deep water layers and mineral resources. In addition, Faidherbia albida trees contribute to symbiotic nitrogen fixation, and thus serve multiple ecosystem services, such as water lifting, nutrients recycling and carbon sequestration [7]. What makes Faidherbia albida trees distinct is their unique leaf phenology, which is characterized by leafing out during the dry season and shedding leaves in the rainy season. Due to this “inverse phenology” [8], the trees do not intercept rainfall and sunlight from crops growing below the tree canopy during the rainy season, and the litter dropped by trees provides organic matter and nutrients to the soil. Faidherbia albida trees are therefore kept within fields while other woody species are often removed [9].
Faidherbia albida trees are found in parklands throughout the Sudano-Sahelian zone of West Africa, as well as in eastern and southern Africa [10,11,12,13,14]. Several scholars have demonstrated that Faidherbia albida trees improve crop yields as well as agricultural resilience and sustainability [15,16,17,18,19]. Roupsard [20] used unmanned aerial vehicles (UAV) to derive detailed field data to quantify the radius where Faidherbia albida trees influence crop yields in an agroforestry parkland in Senegal. Accurate mapping of Faidherbia albida trees is therefore important for a better understanding and management of the interaction of trees with crops within the agricultural system (species, density, planting design, etc.). This has become even more important in recent times with increases in human population driving agricultural intensification, and climate change threatening established agroforestry systems. The effectiveness and optimal implementation of restoration plans in relation to Farmer-Managed Natural Regeneration projects in Sub-Saharan Africa [21,22,23,24], also calls for accurate mapping of the spatial distribution of Faidherbia albida as a prerequisite.
The intriguing question of how specific tree species are spatially distributed has inspired many scholars within plant ecology. In addition to detailed and laborious field inventories, species distribution modelling (SDM) has been the main method to predict the spatial distribution of plant species. Since woody species are known to be highly dependent on biotic and abiotic conditions, most SDM approaches use computer algorithms to predict the spatiotemporal distribution of a species using geo-spatial data of the physical environment combined with observed species distribution points [25]. Data used for modelling are related to climatic, geomorphologic and pedologic variables like temperature, precipitation, elevation and soil type as well as human management, like land use [26]. However, such empirical models generate maps of the probability or potential occurrence rather than the actual distribution of particular species. The coarse resolution of gridded input data, as well as difficulties regarding how to adequately account for anthropogenic drivers, limits the prediction capacity of these models [27,28]. Species distribution points, serving as input to the SDM model, still rely on field records of tree species data, and accurate remotely sensed tree species mapping across large scales would provide valuable complementary information. Large-scale actual distribution of Faidherbia albida generated from remote sensing would thereby open new research avenues for data-driven SDM approaches that allow studying the importance of input environmental variables on species distribution for an improved variable parameterization of SDMs.
As an alternative to modelling the potential occurrence of a given species, recent advances in remote sensing enable the mapping of actual species distributions, yet previous studies remain at a local scale [29,30]. The principles behind the majority of the methods are linked to an understanding that woody species have unique individual biochemical and biophysical characteristics such as spectral reflectance, canopy structure, branch and foliage density, as well as phenological cycles. Mapping attempts grounded in these characteristics have been conducted along three separate pathways in relation to the use of satellite and aerial data: the first pathway utilizes optical remote sensing data to capture the biochemical character of tree species [31,32,33,34]. The second relies on the vertical structure of vegetation, and here LiDAR [35,36] is an effective data source. A third approach integrates synthetic aperture radar (SAR) with optical data [37,38,39,40]. The recent availability of high temporal resolution optical data enables the capture of the seasonal phenology of tree leaves with the timing of the images being the key for a successful classification [41]. Schriever et al. [42] compared images from different periods and found that the period of leaf senescence is most important for classifying tree species. Hesketh et al. [43] also found that inter-seasonal spectral variation allowed the accurate discernment of species of trees using automated classification methods. Moreover, several studies showed that the combination of images from the leaf-out (May/June) and senescence (October) phases provide a higher accuracy as compared to the use of single image [44,45,46].
So far, most attempts to conduct tree species mapping from remote sensing have focused on forest environments, and mapping tree species of scattered woody populations in drylands on a large-scale remains a challenge. The scattered distribution of agroforestry parkland trees in the Sahel makes the mapping different from trees in forest stands, as the signal from a pixel can be influenced by the soil or herbaceous background, especially when the pixel is at the edge of the canopy. Despite the improvement in spatial, temporal and spectral resolution of sensor systems, remote sensing has not yet been widely applied for the mapping of Faidherbia albida on a country scale. For instance, Triboulet et al. [47] pioneered this area by using pixel value thresholding, but due to the lack of field data the final result was not validated. Lelong [48] utilized WorldView-3 imagery to classify 7 tree species including Faidherbia albida in Senegal. However, these studies were limited to a local scale and a snapshot in time. It is still a challenging endeavour to achieve species-level detection across large geographic areas due to restrictions related to data costs and the workload associated with the data analysis.
Previous studies have demonstrated that large savanna trees can be identified with the 10-m resolution of Sentinel-2 [49]. Classification algorithms are rooted in computer science and statistical learning [29], for example, machine learning algorithms like Random Forest and neural networks [50,51,52]. Considering trade-offs between data cost and spatiotemporal resolution requirements, this study investigates the possibility of mapping the distribution of Faidherbia albida over Senegal based on publicly available Sentinel-2 time series data. The constellation of Sentinel-2A and 2B multi-spectral satellite systems were launched in 2015 and 2017 as a part of European Commission’s Copernicus Programme. This system, with a 5-day revisiting time under the same viewing conditions [53], provides an unprecedented opportunity for mapping Faidherbia albida trees. The high temporal resolution may capture the inverse phenology of Faidherbia albida, contrasting with other woody and herbaceous vegetation types in the semi-arid Sahel. Our specific objectives are (1) to select dates and bands from Sentinel-2 images suited to map Faidherbia albida trees, (2) to use a Multi-Layer Perception (MLP) artificial neural network fed with a number of features to generate a 10-m resolution Faidherbia albida distribution map over Senegal and (3) to compare this distribution map with a potential occurrence map derived from an SDM model.

2. Materials and Methods

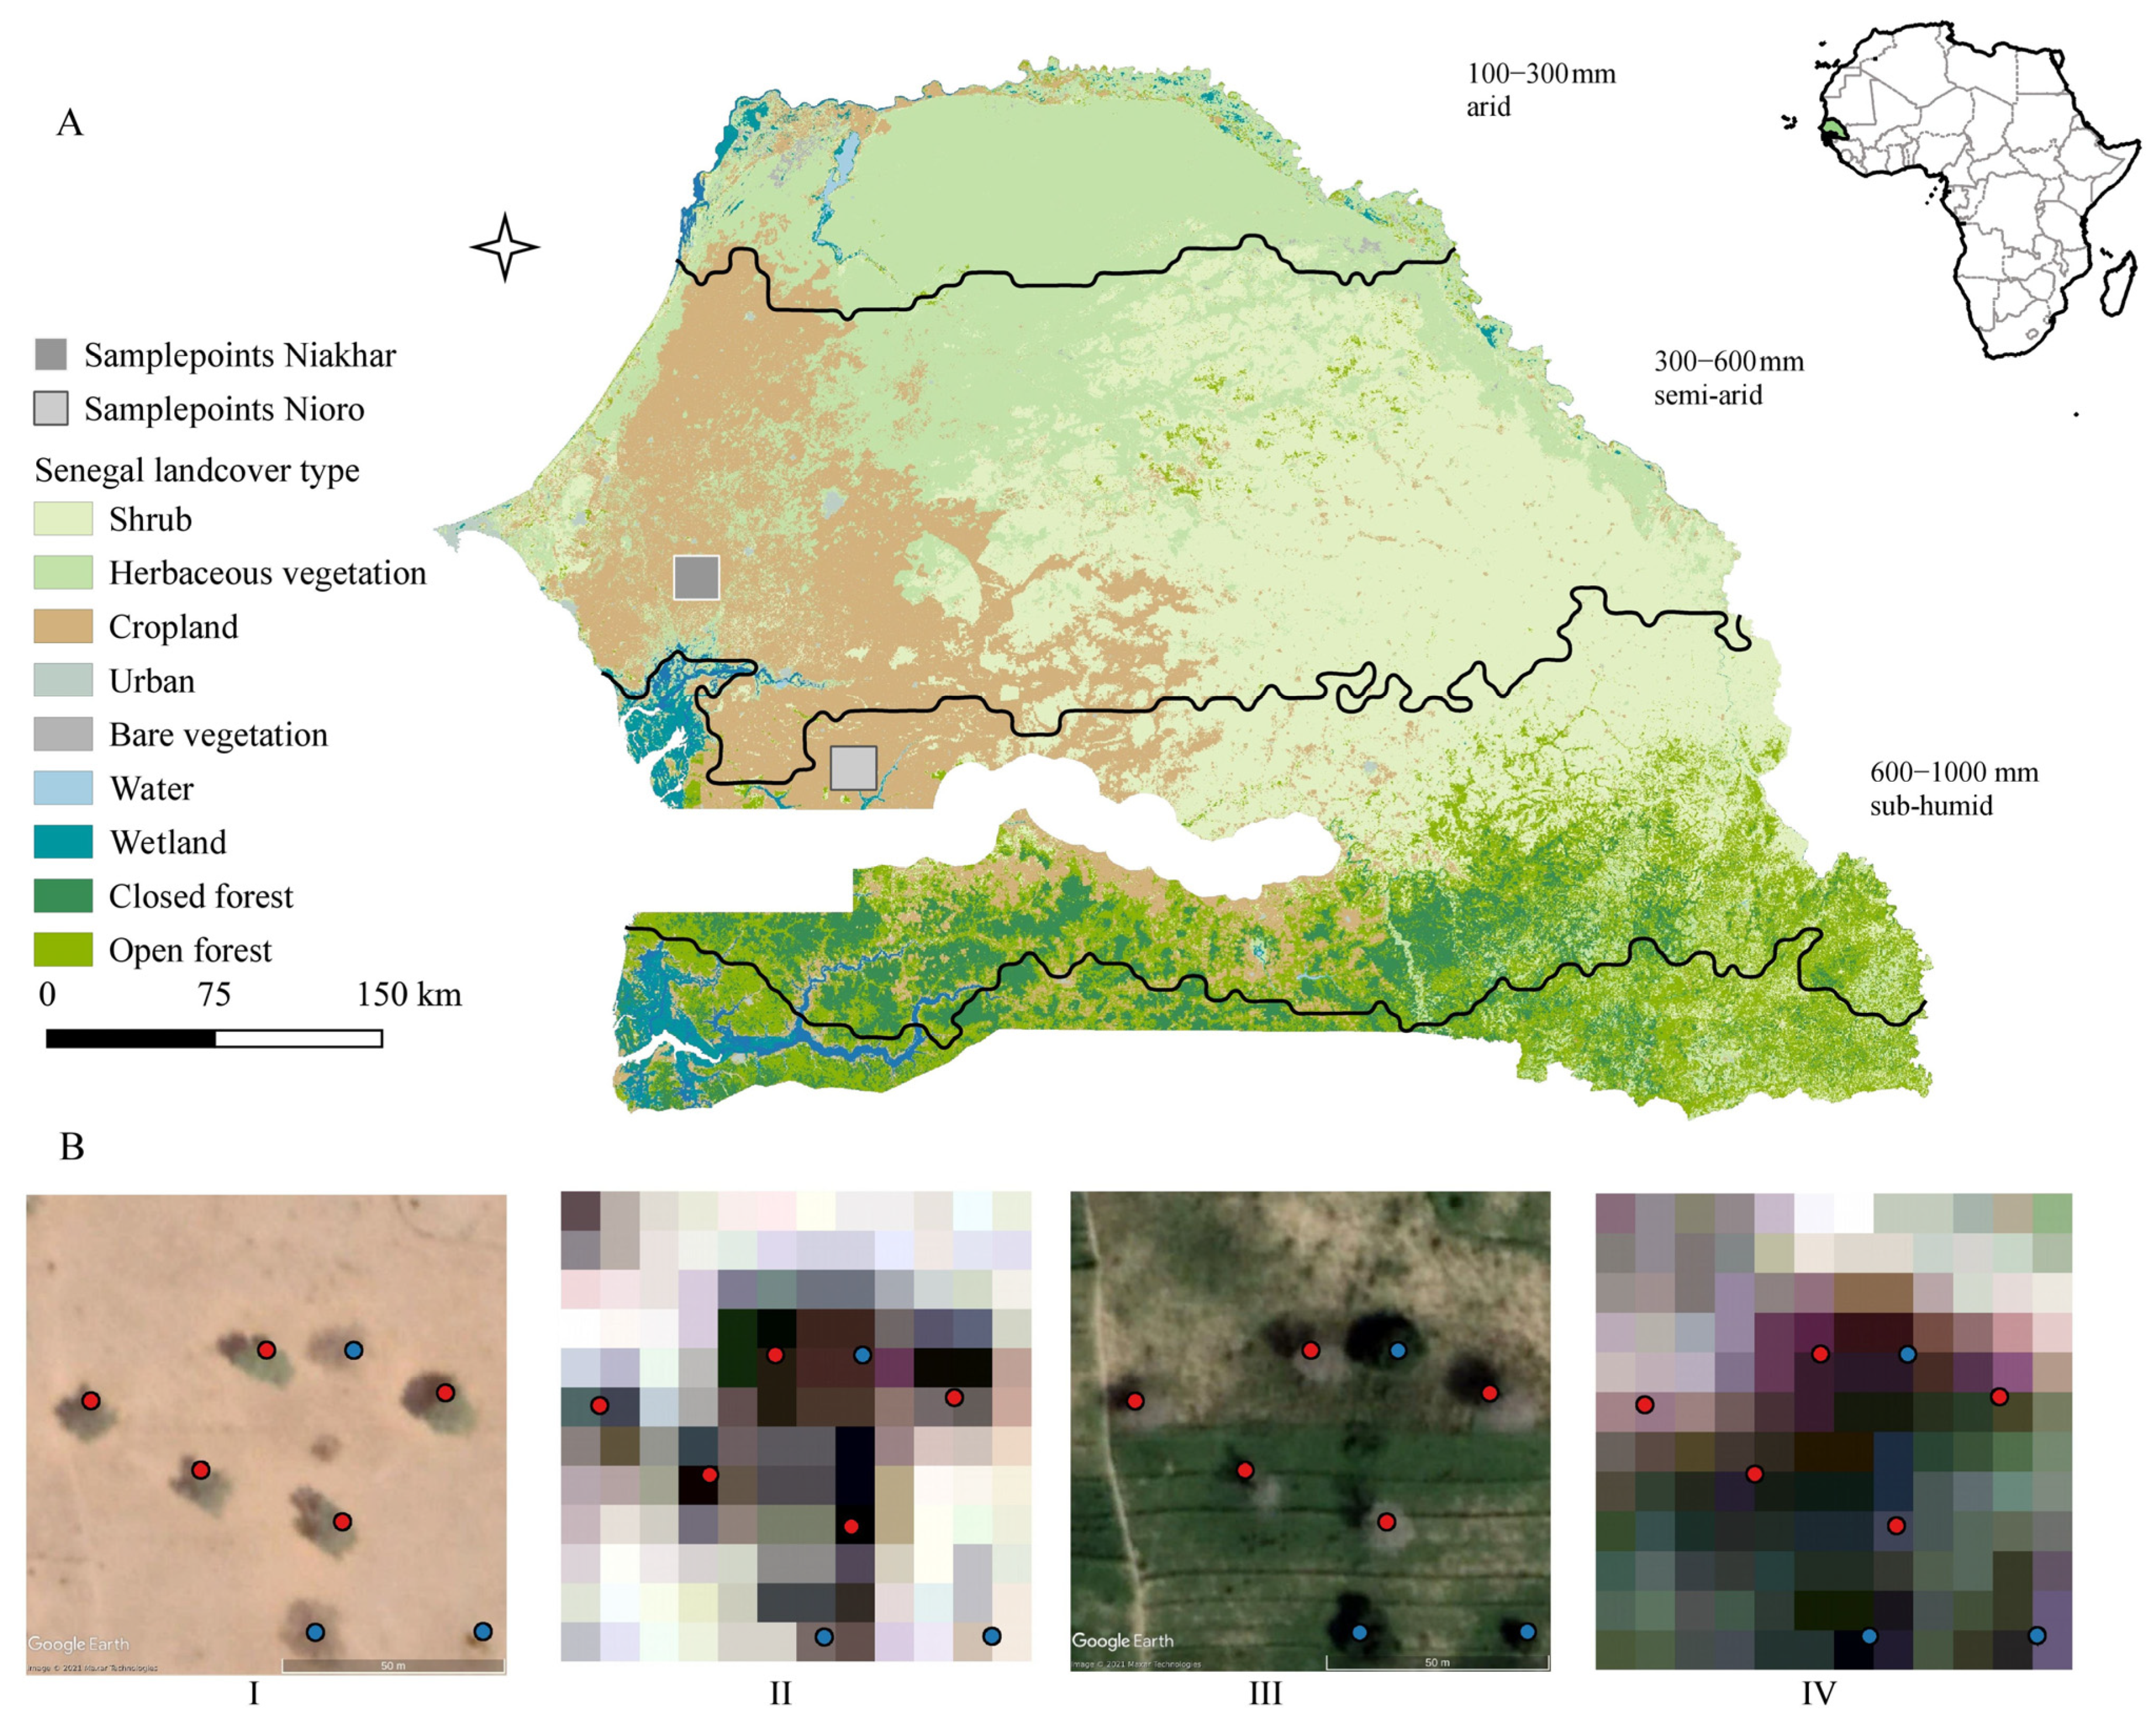
2.1. Study Area and Sample Data

Most of Senegal extends in the Sahelian and Sudanian regions with annual rainfall ranging between 100 to 1000 mm (Figure 1). The western part of Senegal comprises a vast area of subsistence rain-fed cultivation, called the peanut basin. Livelihoods are based on traditional farming systems rotating millet grown for on-farm consumption and groundnuts as cash crops. The peanut basin is the most important crop production area in the country and is characterized by intensively cultivated parklands [54] comprising randomly scattered trees and woody shrubs within cropped fields. The two major soil types are arenosols and calcisols, according to the FAO classification [55]. They are characterized by a high sand content and low organic matter. Among tree species forming the parklands, Faidherbia albida is widely present across the peanut basin. Generally, the natural habitat of Faidherbia albida species occurs throughout most areas in West, East and Southern Africa where annual rainfall ranges between 400 and 900 mm [56]. As a leguminous nitrogen-fixing tree species, Faidherbia albida adds nitrogen and organic matter through leaf fall, and hence improves soil fertility and boosts crop productivity [57]. Consequently, Faidherbia albida occurs widely in croplands as a result of human management promoting the presence of this species on deep light sands or sandy clays [58], which is also the case for the peanut basin in Senegal [11]. Faidherbia albida rarely occurs in pristine savannas but is mainly disseminated by livestock in croplands.
Field samples were collected in two different semi-arid regions of Senegal (Niakhar and Nioro; Figure 1) in 2018 and 2019 using an optimized sampling strategy based on a landscape heterogeneity classification [59,60]. At each sampling site, an exhaustive inventory of all trees was conducted in a 1-hectare plot. The coordinates of each individual tree were recorded with a GPS. The collection of tree species contains over 70 common species, including 6612 sample points in the Nioro area where Faidherbia albida accounted for 3.07% (203) of the samples. A total of 9258 trees were collected in Niakhar among which Faidherbia albida accounted for 41.82% (3872). Since the spatial resolution of Sentinel-2 is 10 m, we only selected Faidherbia albida samples with a canopy diameter greater or equal than the Sentinel-2 pixel size as the reference data used for the building the MLP model. The individual tree canopy diameter information was derived from a previous study [61]. We further selected and added samples of other tree species, cropland, water, urban, herbaceous vegetation, bare soil and shrubs. In total, 2310 samples were used as reference points for a binary classification of two classes encompassing 516 points representing Faidherbia albida, and 1794 point for the other class. The Sentinel-2 pixels that contain the reference points were sampled and used for building the model. Since the sampled pixels are often a mixture of the tree canopy and the immediate surroundings of the tree, the Faidherbia albida mapping is thus conducted at a canopy level with a tree canopy minimum mapping unit of one pixel.

2.2. Sentinel-2 Data Pre-Processing

Sentinel-2 top of atmosphere data are available in the Google Earth Engine (GEE) cloud computing platform. All available Sentinel-2 images from January 2017 to December 2019 with cloud cover less than 50% were fused to monthly composites. Cloud masking was done according to the flags of the Sentinel-2 QA band. The spectral noise caused by scene-specific illumination conditions and residual cloud effects is expected to be reduced by using 3-year average values from the period 2017–2019. Vegetation indices and bands (next section) in specific months and their dynamic changes were selected as feature collection for the following image classification based on Recursive Feature Elimination. The detailed Sentinel-2 data processing is described in the following sections.

2.2.1. Vegetation Indices

The Sentinel-2A and B instruments sample 13 spectral bands: visible and near-infrared at 10-m, red edge and SWIR at 20-m and atmospheric bands at 60-m spatial resolution. The bands with a resolution >20 m have been discarded from the current study due to the mismatch between pixel resolution and tree size, and the six bands of 20-m resolution were resampled to 10-m by the nearest neighbour, leaving 10 bands for the monthly composites. To better isolate the signal inherent to photosynthetic activity from other signals within spatially mixed pixels, 10 vegetation indices, which are widely applied to Sentinel-2 imagery [62], were selected (Table S1). As some of those vegetation indices were derived from the same spectral bands, considerable redundancy in information exists. To determine the similarity of indices, the pair-wise correlation coefficient was calculated (Table S2). Based on the high co-variability, those indices were categorized into 3 classes. The first class is composed of NDVI, NDVI74, PSSRa, EVI, MCARI, S2REP and EVI2. The second class is composed of NDI54 and GNDVI and the third class includes only MTCI. To select only one of each group for feature collection, the correlation coefficient between vegetation index values of Faidherbia albida and other species (Table S3) was taken into consideration, with a lower coefficient value indicating a higher discrepancy between Faidherbia albida and other tree species. Hence only NDVI and NDI54 were retained, and the MTCI was omitted because its monthly values showed a high standard deviation during the growing season (Figure S1H). The initial feature bands used to construct the model are the monthly values of each band and 2 vegetation index bands, yielding in total 12 × (2 + 10) = 144 bands.
The foliage production of Faidherbia albida trees is high in the dry season and low in the rainy season, and their foliage production reaches a peak in December (Figure 2). As biochemical and structure properties of woody plants can influence the spectral signature, the inverse phenology of Faidherbia albida potentially makes the tree distinguishable from other deciduous or evergreen tree species. The green herbaceous layer and understory impact the Faidherbia albida canopy pixels in Sentinel-2 images, so this study discriminates Faidherbia albida trees not only based on monthly band/vegetation index values but also uses seasonal dynamics. This was done by calculating all possible monthly image combinations (by subtraction of images) producing 792 dynamic images, leading to a total of 936 feature bands.

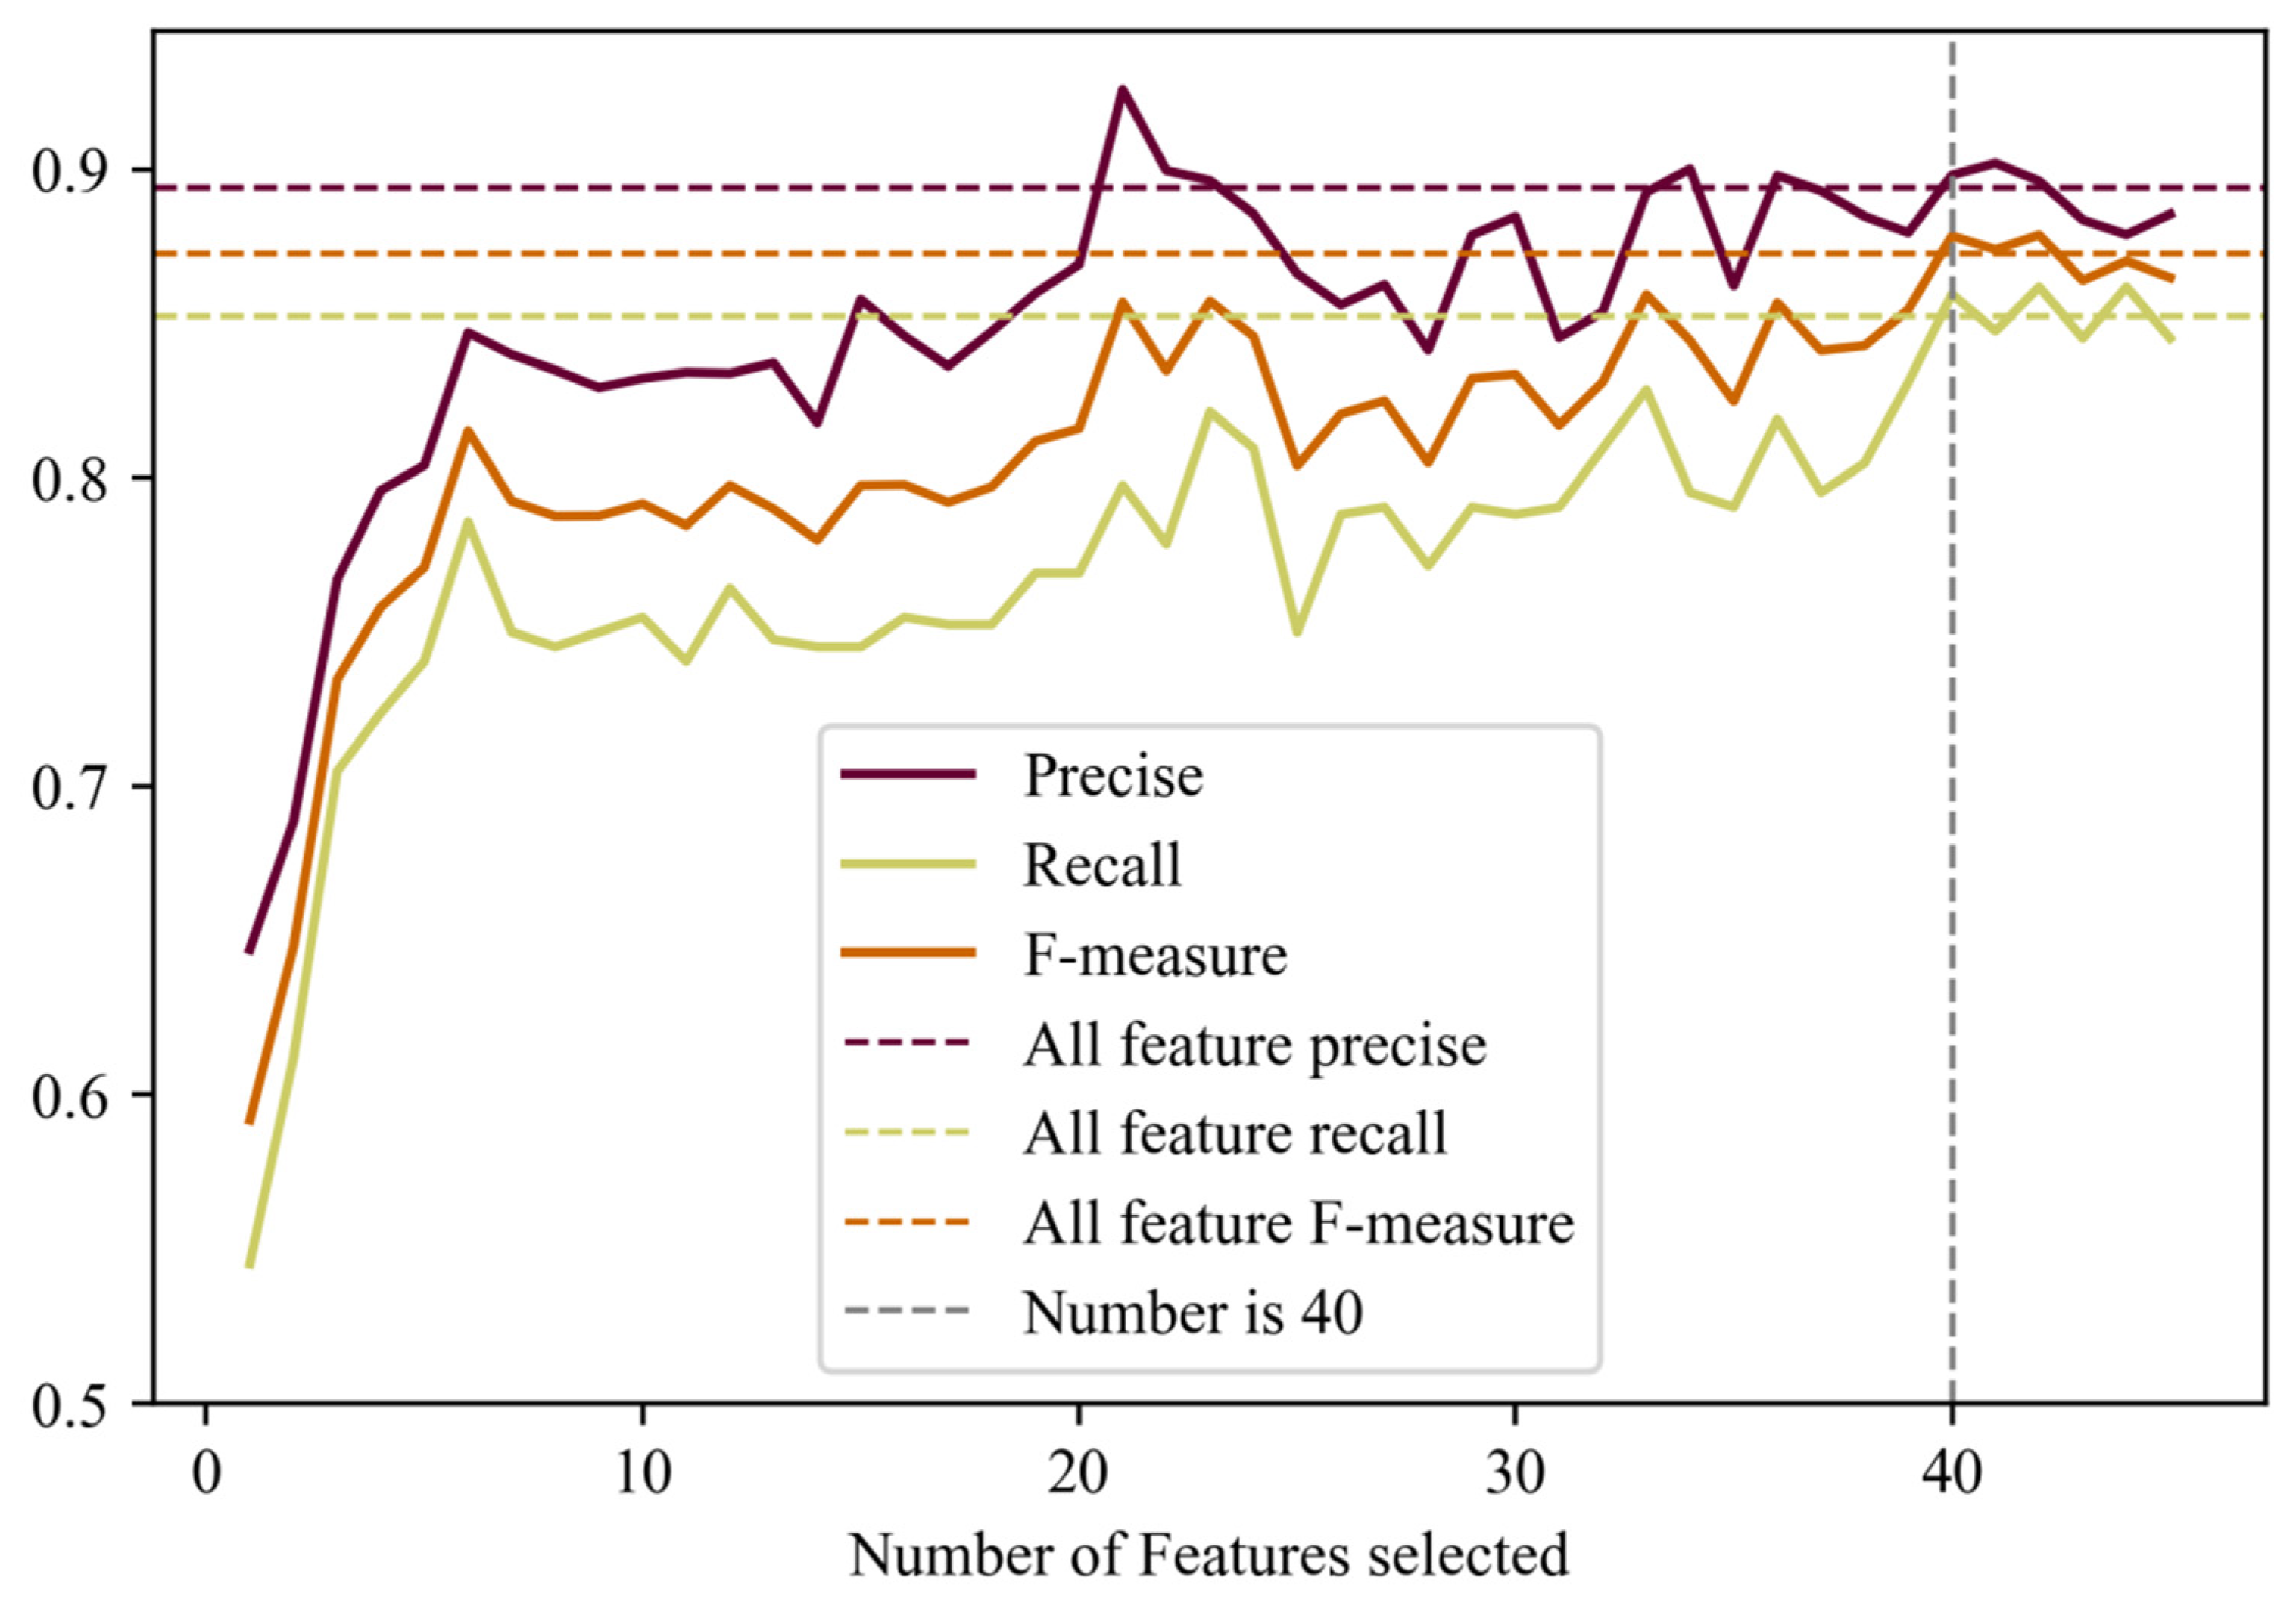
2.2.2. Feature Selection

A recursive feature elimination was then applied to reduce redundant features. The Random Forest classifier ranks the importance of features through their impact on the model accuracy. Recursive feature elimination can be used to rank the feature by looping through Random Forest classifiers and removing the least important feature until the accuracy remains stable. Here we generated collections of features and a 4-fold cross-validation was utilized to test the performance of the various feature collections on the MLP model. Cross-validation is a universal method for assessing the accuracy of a classifier based on a limited data sample. The dataset was generated from the field-observed data in combination with the Sentinel-2 imagery, and the whole dataset was split into 5 individual sets. A test set was held out for final evaluation. Then, three of the remaining datasets were used as training datasets, initially used to fit the model. The last dataset is used as a validation dataset, which provides an unbiased evaluation of a model fit on the training dataset while tuning the parameters. The process is repeated 4 times. The feature collection including the fewest number of features achieving the same performance as using all features was selected for the final model.
The performance metrics of recall and precision were used to evaluate models using different feature collections [63]. Precision is defined as the fraction of relevant instances among the retrieved instances, i.e., the number of true positives divided by the total number of elements labelled as belonging to the positive class. Recall is defined as the fraction of relevant instances that were retrieved, i.e., the number of true positives divided by the total number of elements that actually belong to the positive class. The true positives refer to the elements correctly labelled as belonging to the positive class, here, Faidherbia albida trees. The elements labelled as belonging to the positive class is the sum of true positives and false positives, the latter which are instances incorrectly labelled as belonging to the class. The elements that actually belong to the positive class are the sum of true positives and false negatives, which are the elements that were not labelled as belonging to the positive class but should have been. Recall and precision scores are often inversely related. Taking the harmonic average of precision and recall leads to the F-measure (a measure that combines precision and recall):
F-measure = 2 × recall × precision/(recall + precision)
Precision and recall weigh equally in F-measure and a higher F-measure represents a superior model.

2.3. Mapping Faidherbia albida Trees Using Artificial Neural Networks

The Multi-Layer Perception (MLP) model was adopted for the binary classification of Faidherbia albida trees. MLP is an artificial neural network with multiple densely connected layers between the input and output layers. The densely connected layers in MLP models combine all the features of the previous layer, which is suitable for complex classification tasks. We used the artificial neural network instead of other non-parametric classifiers, such as Random Forests or Support Vector Machines, which have been applied in previous tree species classifications, because of the irregular spectral signatures of the dataset and the uneven composition of species in the data structure. Considering the image resolution and the size of tree canopy, any given Faidherbia albida pixel will usually be a mix of reflectance from Faidherbia albida canopies and background vegetation or bare soil. Therefore, even the same tree species would show considerable intra-species spectral variability among training and testing data. Neural networks as a general-purpose technique for classification hold the potential to map Faidherbia albida in such a challenging case. The MLP model is created with three layers, and the learning rate, batch size and epochs are fine-tuned through grid search. The input of the MLP is the feature collection selected by cross-validation. The output of the MLP is the probability that a pixel includes a Faidherbia albida canopy, with values ranging from 0 to 1. Here, pixel values > 0.5 were mapped as Faidherbia albida canopies.

2.4. Post Processing

To comply with the nature of parklands and savanna ecosystems where Faidherbia albida trees are predominantly scattered without forming a closed canopy, all clusters of predicted Faidherbia albida pixels covering more than 1000 m2 were masked. This threshold was selected based on Brandt et al. [61], where very high spatial resolution image analysis revealed that <0.0001 of all single tree canopies surpass this size in the study area.
We combined the Faidherbia albida canopy map derived from MLP with the woody canopy map produced by Zhang et al. [49], which is also based on time-series Sentinel-2 data. A map representing the relative cover of Faidherbia albida related to all woody plant cover was generated by calculating the fraction of the Faidherbia albida cover (per hectare) and the woody canopy cover (per hectare) map. To explore the agreement between our remote sensing based Faidherbia albida distribution map and the potential occurrence based on ecological modelling, we obtained a Faidherbia albida potential occurrence map that was provided by Kindt [64] at a 5-km resolution. The occurrence map was generated from 9 bioclimatic layers, 2 topographic layers and 3 soil maps by the R package BiodiversityR. Details about the data sources and resolution of the layers can be found in Table S4. This map consists of a unitless Faidherbia albida habitat suitability index varying from 0 (lowest) to 910 (highest). The absence–presence threshold for suitability of Faidherbia albida was provided by the SDM model as 534, meaning that suitability values above 534 correspond to the likely presence of the species with increasing values associated with higher likelihood of species presence.

3. Results

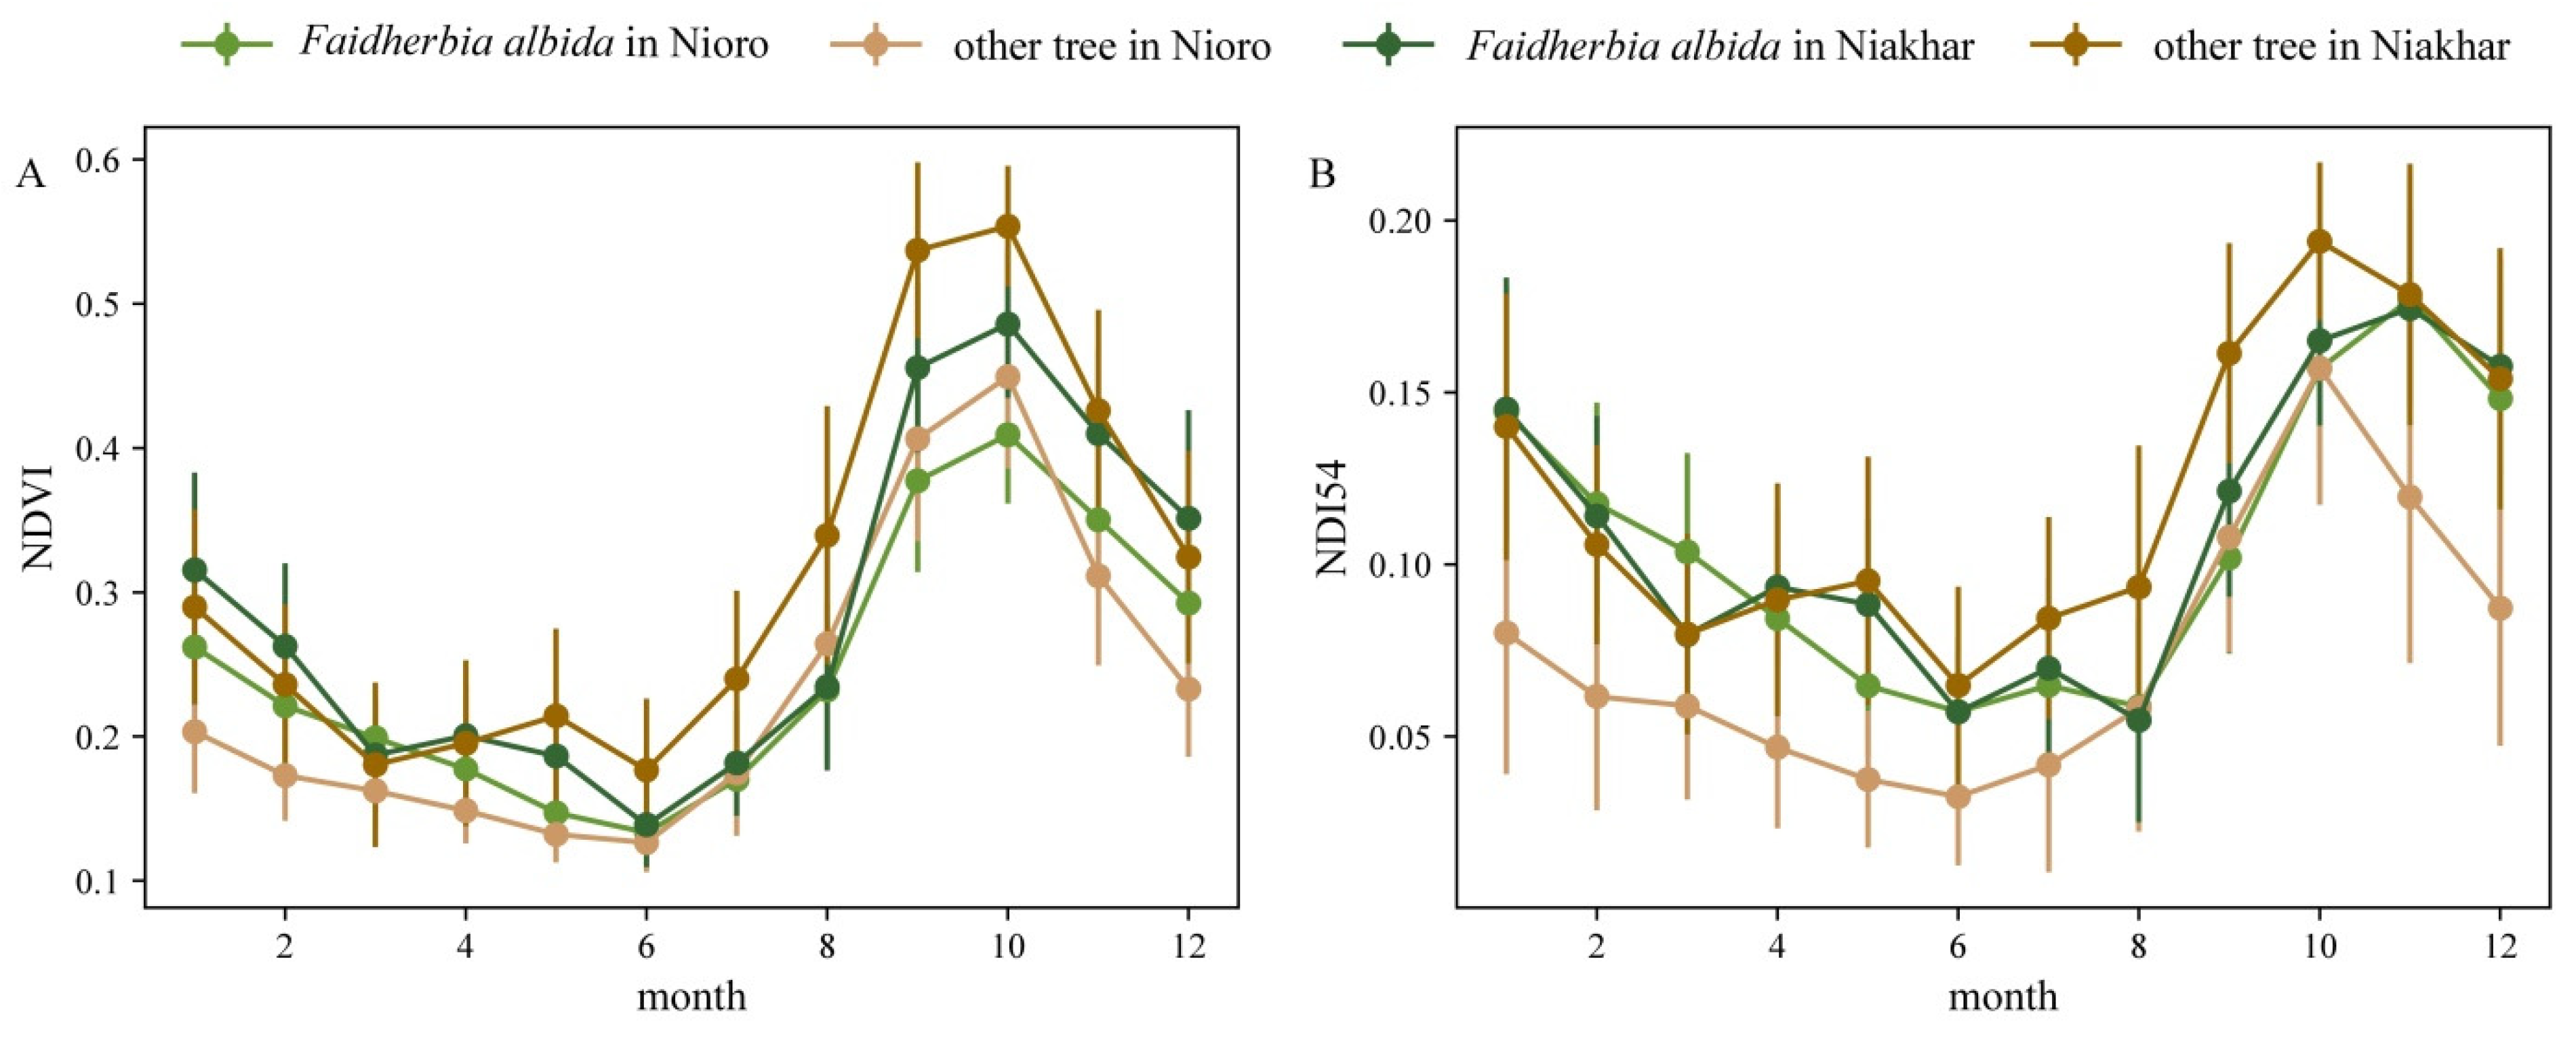
3.1. Intra-Annual Difference in Vegetation Indices

Monthly values of NDVI and NDI54 for pixels covering Faidherbia albida and other tree species were analysed for Nioro and Niakhar. It is noticeable that even pixels covering the same group of tree species show varying index values in the two study regions. This is likely because the majority of the sampled pixels in Sentinel-2 images are mixed pixels, and the index value is the result of the reflectance from the tree canopy and a complex set of other covers underneath such as crops and herbaceous vegetation or bare soil, especially in the wet season when the Faidherbia albida trees are defoliated. However, the values of pixels with Faidherbia albida show the same seasonality in both regions different to other tree species (Figure 3). Specifically, pixels with Faidherbia albida have a lower NDVI value in the rainy season and a higher NDVI value in the dry season as compared to the pixels representing other tree species (Figure 3A), which means that the relative difference of Faidherbia albida NDVI values between the dry and wet seasons is smaller as compared to other tree species. While all tree species reach their NDVI peak in October, the NDVI value of pixels with Faidherbia albida decrease much slower after the peak month as compared to other tree species. As for NDI54 (Figure 3B), Faidherbia albida pixels have the highest values in November while the pixels of other tree species show a peak in October. Consequently, the mapping of Faidherbia albida ideally should not only depend on the absolute index values of individual months, but also take the dynamics between different months into consideration.

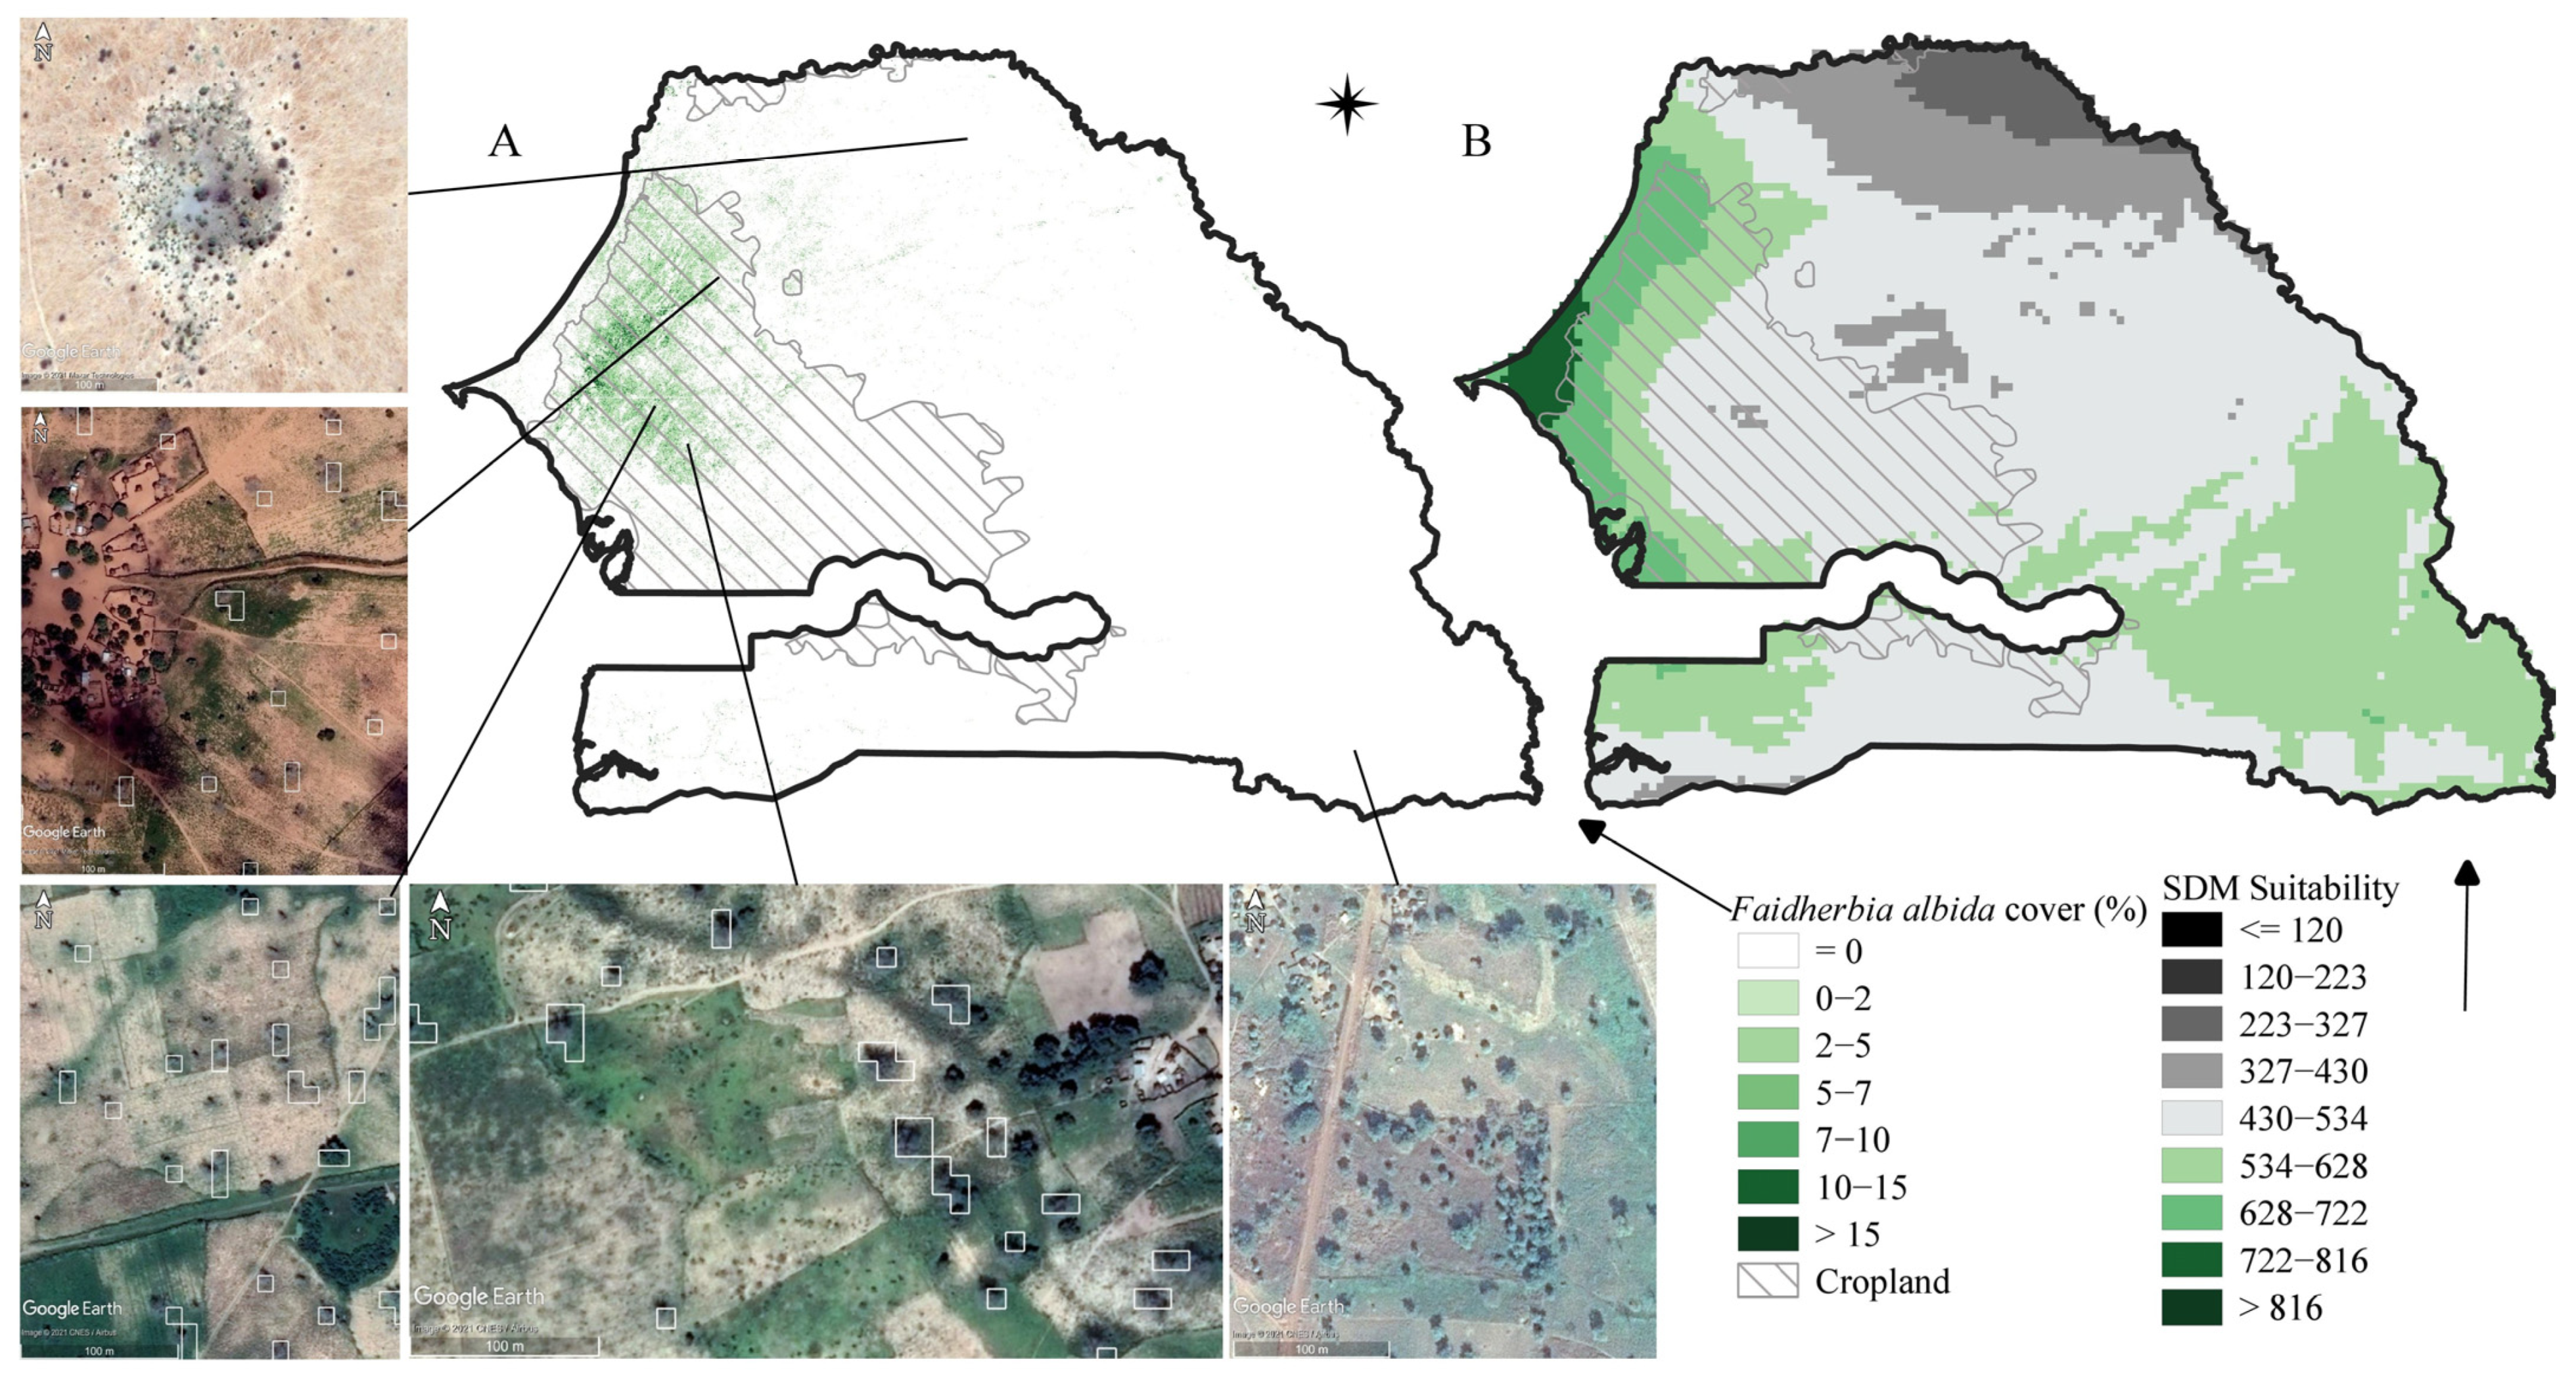
3.2. Mapping Faidherbia albida Using the MLP Model

By conducting a recursive feature elimination on the original 936 features (Section 2.2) we tested subsets of feature combinations as a function of the model mean accuracy using a 4-fold cross-validation approach (Figure 4). The evaluation of the Faidherbia albida mapping was performed by mean accuracy of all iterations using a test set. Using only the seasonal dynamic feature of NDI54 between November and August, the classifier achieves an average F-measure of 60%. When increasing the features to 40, the total variability in the feature layers reaches the same level of accuracy (precision, recall and the F-measure) as when using all features, indicating that 40 features are sufficient. Using 40 features, the model achieves an overall F-measure of 89%, with a fairly well-balanced rate of 91% precision and 85% recall, showing that the pixels of Faidherbia albida canopies are captured well (Table S5). The final selected features for the MLP model (Table 1) show that the seasonal dynamic features account for more than 50% of all selected features, and the typical span of the two months forming the difference feature is around 5 months, usually representing one month in the start of the dry season and the other month at the end of the dry season. The acquired times of the selected data by recursive feature elimination are February (start of Faidherbia albida senescence), July (leaf-off) and October (leaf-out). In terms of feature type (vegetation index or single band reflectance), the NDVI and NDI54 dominate the selected features.

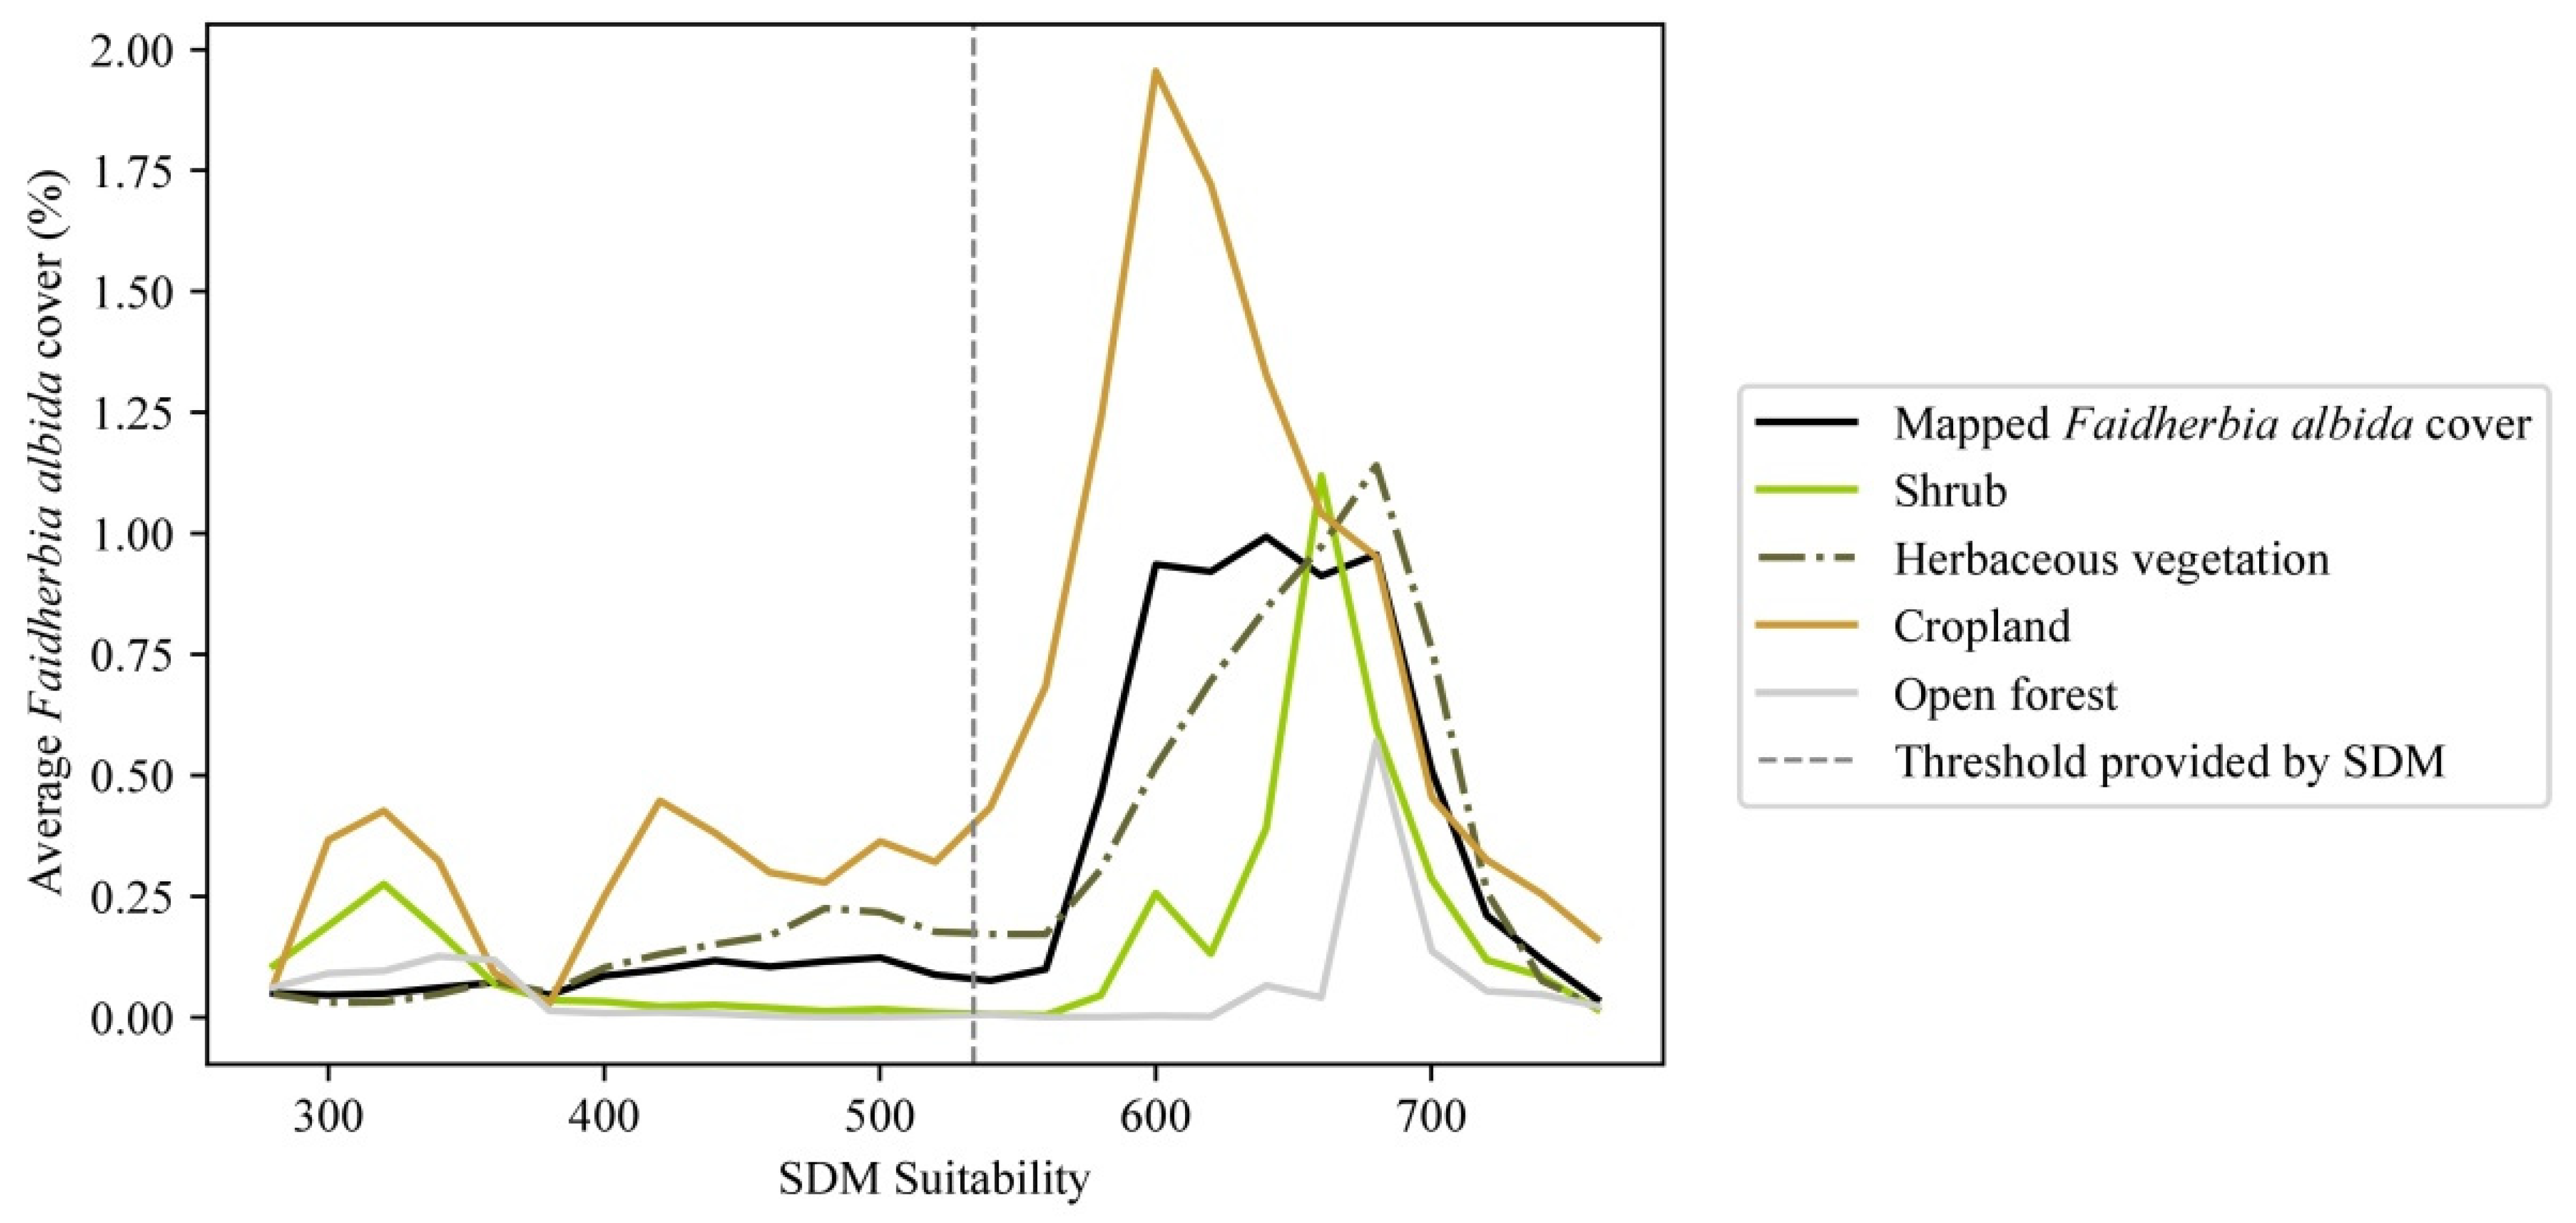
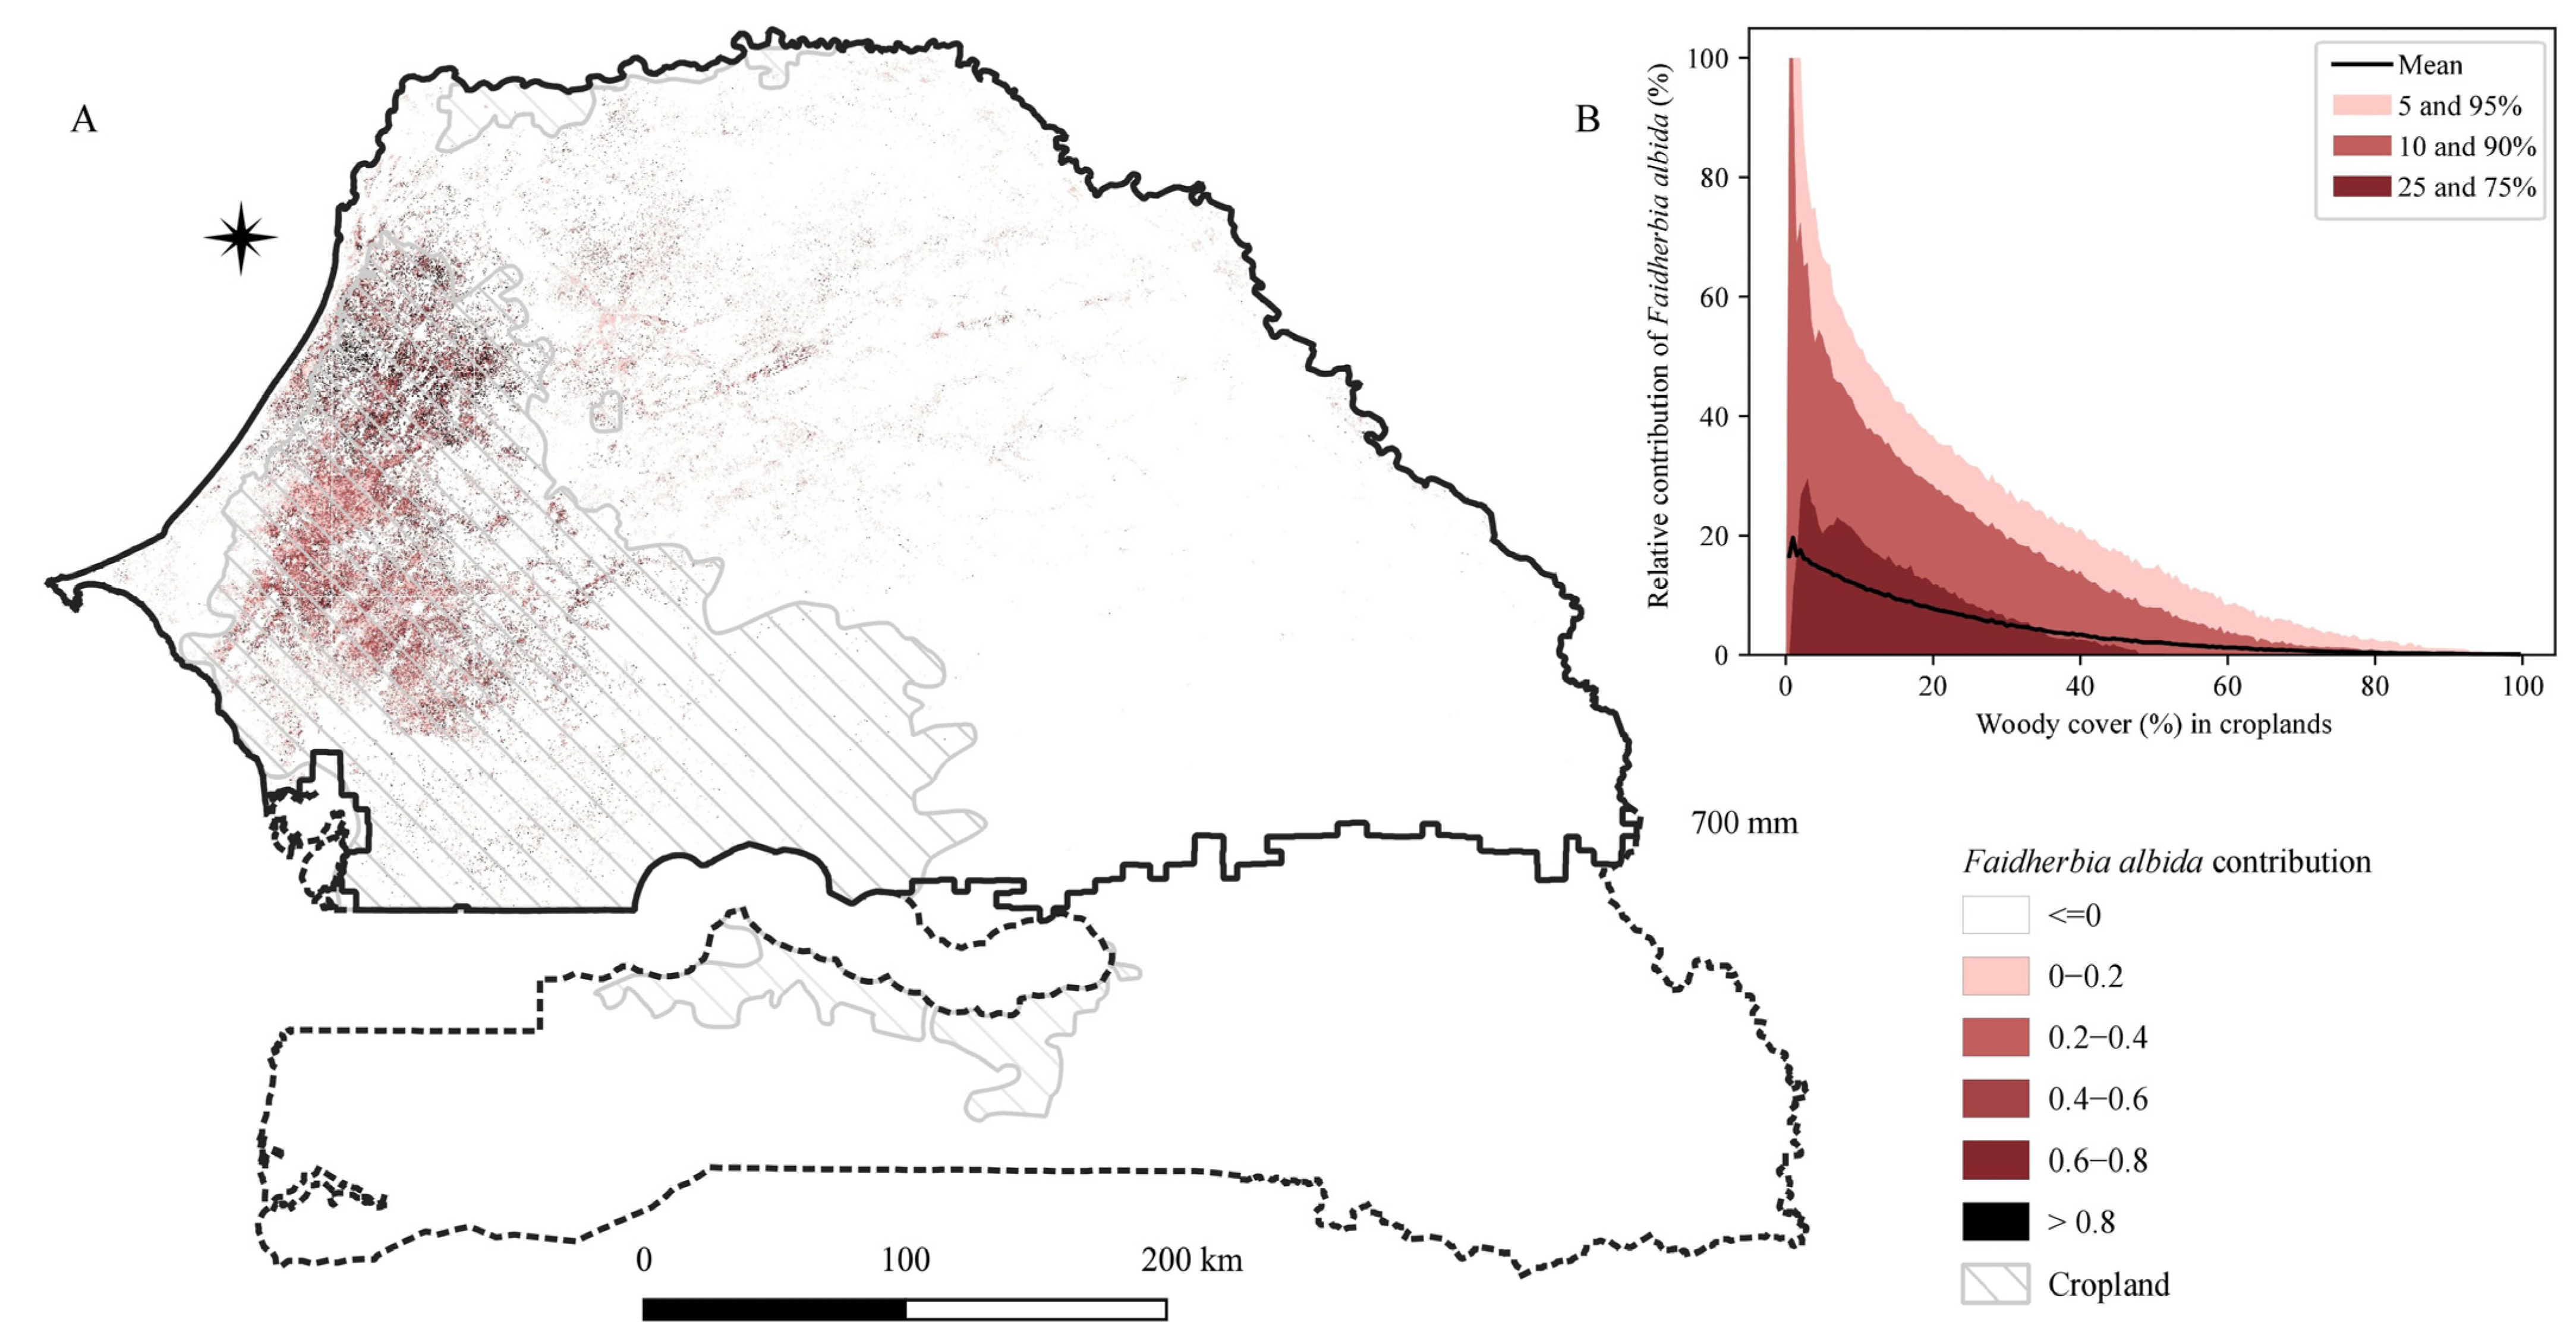
3.3. Comparing Faidherbia albida Canopy Cover Maps with Potential Occurrence Maps

A Faidherbia albida canopy map at 10-m resolution covering Senegal was generated based on 3 years of Sentinel-2 data. To illustrate the mapping at the national scale, the per-pixel mapping was aggregated to 1 hectare showing the percentage of Faidherbia albida cover (Figure 5A). Faidherbia albida trees are mainly distributed in the western cropland areas (Figure 5A) where annual precipitation ranges from 300 to 600 mm. Faidherbia albida trees are to a less extent also found in the croplands of the northern part of the country, where rainfall is less than 300 mm/year. For most of the cropland areas, the percentage of Faidherbia albida cover is in the range between 2–15%. Our remote sensing-based distribution agrees to some extent with the potential occurrence map from ecological modelling (Figure 5B) in which the potential occurrence is shown by SDM suitability values. While similar patterns are shown in western Senegal, the southeast, the Cap Vert peninsula and the limited cropland areas along the north-western coast do not match with our map.
The remote sensing-based map of Faidherbia albida cover was directly compared with the SDM suitability score within different land use/cover types (Figure 6). The SDM map at a 5-km resolution was resampled to 1 ha using the nearest neighbour. Faidherbia albida trees mainly occur in areas with suitability values above 560 and are almost absent below this threshold except in croplands where they occur even with SDM values of 300. Faidherbia albida trees were barely found in the north/north-eastern shrub and open forest areas of Senegal (Figure 5), even though the SDM suitability was around 600. When suitability values exceed 680, we observe that the high suitability score relates to low Faidherbia albida cover (<0.25%). This discrepancy is linked to the Senegal land cover, which is related to the near coastal areas around the Dakar peninsula (Figure 1 and Figure 5).
By combing the woody cover map from Zhang et al. [49] and our results, we calculated the relative contribution of Faidherbia albida trees to the overall woody plant cover per hectare (Figure 7). The map of this relative contribution shows the degree of dominance of Faidherbia albida among woody plant cover. The higher the contribution of Faidherbia albida to the woody plant cover, the lower is the woody plant diversity. Furthermore, in areas where woody cover is nonzero, the contribution of Faidherbia albida to cover as a function of all woody species cover is illustrated in Figure 7B. The relative contribution of Faidherbia albida in croplands is on average 7.23%, with several areas being dominated by Faidherbia albida.

4. Discussion

4.1. Mapping Faidherbia albida

This study presents a method to estimate Faidherbia albida cover across Senegal from Sentinel-2 spatiotemporal signatures at 10-m resolution. Previously, only Lelong et al. [48] used very high resolution Worldview-3 imagery to map 7 tree species including Faidherbia albida. Our approach was based on the assumption that the classification could take advantage of the distinct and inverse phenological behaviour of Faidherbia albida trees as compared to other tree species. However, we found that this phenological behaviour was not seen in satellite time series from Sentinel-2. A possible explanation is that the herbaceous layer growing below the canopy of Faidherbia albida trees during the non-leaf season dominates the signal. It impedes the capacity of satellite time series to capture the inverse phenology during the leaf-off period. As for the leaf-on period, the difference is also unexpectedly small and varies with location and time. Since most remote sensing applications in mapping forest types or tree species rely on the phenological differences in satellite time series between the target and the background [45], the mapping of Faidherbia albida trees is more challenging than initially assumed.
Given this situation, we maximized the input capacity by generating a total of 936 features, which include monthly and seasonal features of both multiple vegetative indices and bands. Instead of directly using sparse temporal features and single vegetation indices [43,65], we made use of recursive feature elimination to reduce data redundancy. The accuracy stabilized when 40 features were included, mainly from the senescence month of Faidherbia albida and including both spectral bands and vegetation indices [44,45]. Features related to seasonal dynamics were most important, which aligns with the results of [43,66]. NDVI, NDI54 and the second SWIR band of Sentinel-2 are often picked as high-ranking features, indicating the importance of the red, red edge and SWIR bands for tree species mapping [29]. Additionally, the background reflectance causes different values for different regions with Faidherbia albida trees (Figure 3A). This effect can be mitigated by using images of seasonal changes in addition to monthly composites (Table 1).
We did not use a convolutional neural network (CNN) because CNNs rely on features which are extracted by sliding windows within an image, and the widow size N is usually larger than the tree canopy pixel (usually one pixel). Thus, the importance from a given tree canopy pixel might be diluted on the extracted window’s feature. Contrastingly, the input for the MLP is the labelled feature collection, which is derived from single pixels in an image, which is considered as more suitable when using Sentinel-2 imagery.
In the past decades, mapping forest cover and type have achieved satisfactory outcomes globally and operationally using remote sensing techniques [37,39]. Mapping tree species at large scale has however only progressed slowly, mainly because the required remote sensing datasets are expensive to acquire, such as LiDAR and other very high-resolution data [35,40]. Furthermore, the Faidherbia albida agroforestry multipurpose trees studied here grow in drylands where trees grow as individuals, and such trees outside of forest have been underestimated [61]. As such, our study represents a first attempt to conduct a national scale mapping of scattered non-forest tree species. It would be interesting to further map the distribution of Faidherbia albida trees using higher spatial resolution images like PlanetScope, which are now provided as a pre-processed product in an analysis-ready data format of monthly composites of 4.7-m spatial resolution free of charge from the Norwegian International Climate & Forests Initiative (NICFI). However, PlanetScope data has a lower spectral resolution (only four classical bands of R, G, B and NIR) as compared to Sentinel-2. The degraded spectral information may thus decrease the mapping capacity. With a monthly temporal resolution and spatial resolution of 4.7 m, recurrent CNN techniques could boost the mapping by interpreting temporal and textural information of individual tree canopies simultaneously [67].

4.2. Comparison with Ecological Niche Modelling Products

Our results show that Sentinel-2 image time series are able to map the actual distribution of Faidherbia albida trees, which is a significant advance as compared to SDM-based potential species occurrence maps [64]. Our results indicate that Faidherbia albida trees are mainly found in croplands where they are the dominating tree species. The relation in Figure 6 showed that when the land suitability exceeds the threshold defined by the SDM model, there is indeed often an observed occurrence of Faidherbia albida trees. The average Faidherbia albida cover is always higher in croplands than for other land use/cover types because farmers are well aware of the benefits of Faidherbia albida trees being an integral part of agroforestry systems [68,69,70]. In the sparsely populated south-eastern part of Senegal where land cover is mainly open woodland and shrublands, we did not predict to find any Faidherbia albida, while the SDM model predicts a high suitability, likely because human management was not carefully considered in the applied model.

5. Conclusions

A 10-m resolution Faidherbia albida canopy map was generated for Senegal based on a time series of Sentinel-2 images from the period of 2017 to 2019, used to form 12 monthly composites covering the phenological phases of the Faidherbia albida tree. Ground observations of tree species from two different regions in Senegal were used to generate a robust model mapping the occurrence of Faidherbia albida trees. Compared to an existing map showing the potential occurrence of Faidherbia albida trees from a suitability modelling approach (species distribution modelling; SDM), our study took advantage of the unique phenology of Faidherbia albida trees to separate this tree species from other trees. We showed that the actual distribution does not always agree with the potential distribution. We also showed that Faidherbia albida dominates tree cover in some cropland areas, supporting the well-known benefits of the tree in agroforestry systems of West Africa (termed parklands). Faidherbia albida is managed and utilised by farmers in different ways as this multi-purpose tree does not only provide fuel wood and fodder like other species, but also affects crop traits for improved productivity and yield by shedding leaves in the crop growing season. The derived 10-m map of Faidherbia albida occurrence could be used as a base-map in support of an empirically based understanding of the role of Faidherbia albida in parkland ecosystems in relation to crop yields. Ultimately, this could serve as a vantage point for spatially explicit analyses of the extent to which the use/management of this tree resource is optimally implemented.

Supplementary Materials

The following supporting information can be downloaded at: https://www.mdpi.com/article/10.3390/rs14030662/s1, Figure S1: Averaged monthly (A) NDVI74, (B) MCARI, (C)S2REP, (D) PSSRa, (E) EVI, (F) EVI2, (G) GNDVI, (H) MTCI values for sample pixels of Faidherbia albida and other species in the regions of Nioro and Niakhar. Vertical lines represent the standard deviation of the sample population. Overall, 1418 pixels were sampled and averaged over the study period, including 57 Faidherbia albida pixels and 112 pixels with other tree species in the Nioro region, and 459 Faidherbia albida pixels and 790 pixels with other species in the Niakhar region; Table S1: Vegetation indices used in the study. Their formulation and the related spectral bands (band numbering is referring to the Sentinel-2 sensor system); Table S2: Correlation coefficient of monthly vegetation index of Faidherbia albida; Table S3: Correlation coefficient between vegetation index values of Faidherbia albida and other species; Table S4: Climatic, geomorphologic, and pedologic layers used for the Species Distribution Modelling [71]; Table S5: Results from the 4-fold cross-validation using a test set of 40 features.

Author Contributions

T.L.: Conceptualization, Methodology, Writing—original draft. M.B.: Supervision, Writing—review and editing. X.T.: Methodology. P.H.: Validation, Writing—review and editing. L.L.: Validation, Writing—review and editing. B.N.: Resource. R.F.: Supervision, Writing—review and editing. All authors have read and agreed to the published version of the manuscript.

Funding

This research was funded by the China Scholarship Council. R.F (grant No. 201906400012). Acknowledge support by the Villum Foundation through the project ‘Deep Learning and Remote Sensing for Unlocking Global Ecosystem Resource Dynamics’ (DeReEco), grant number 34306. This work was also supported by the European Research Council (ERC) under the European Union’s Horizon 2020 research and innovation programme (grant No. 947757 TOFDRY) and a DFF Sapere Aude (grant No. 9064–00049B).

Institutional Review Board Statement

Not applicable.

Informed Consent Statement

Not applicable.

Data Availability Statement

All the Sentinel-2 images used in this study can be downloaded from Google Earth Engine (https://code.earthengine.google.com/, accessed on 1 December 2021). Please contact Louise Leroux for sharing of the species data.

Acknowledgments

We thank Roeland Kindt who provided the ecologically Faidherbia albida occurrence map.

Conflicts of Interest

The authors declare no conflict of interest.

References

  1. Gonzalez, P.; Tucker, C.J.; Sy, H. Tree density and species decline in the African Sahel attributable to climate. J. Arid. Environ. 2012, 78, 55–64. [Google Scholar] [CrossRef] [Green Version]
  2. Karlson, M.; Reese, H.; Ostwald, M. Tree crown mapping in managed woodlands (parklands) of semi-arid West Africa using WorldView-2 imagery and geographic object based image analysis. Sensors 2014, 14, 22643–22669. [Google Scholar] [CrossRef] [PubMed]
  3. Sinare, H.; Gordon, L.J. Ecosystem services from woody vegetation on agricultural lands in Sudano-Sahelian West Africa. Agr. Ecosyst. Environ. 2015, 200, 186–199. [Google Scholar] [CrossRef]
  4. Kuyah, S.; Öborn, I.; Jonsson, M.; Dahlin, A.S.; Barrios, E.; Muthuri, C.; Malmer, A.; Nyaga, J.; Magaju, C.; Namirembe, S. Trees in agricultural landscapes enhance provision of ecosystem services in Sub-Saharan Africa. Int. J. Biodivers. Sci. Ecosyst. Serv. Manag. 2016, 12, 255–273. [Google Scholar] [CrossRef] [Green Version]
  5. Brandt, M.; Rasmussen, K.; Hiernaux, P.; Herrmann, S.; Tucker, C.J.; Tong, X.; Tian, F.; Mertz, O.; Kergoat, L.; Mbow, C. Reduction of tree cover in West African woodlands and promotion in semi-arid farmlands. Nat. Geosci. 2018, 11, 328–333. [Google Scholar] [CrossRef]
  6. Koffi, C.; Lourme-Ruiz, A.; Djoudi, H.; Bouquet, E.; Dury, S.; Gautier, D. The contributions of wild tree resources to food and nutrition security in sub-Saharan African drylands: A review of the pathways and beneficiaries. Int. Forest. Rev. 2020, 22, 64–82. [Google Scholar] [CrossRef]
  7. Tschakert, P.; Khouma, M.; Sene, M. Biophysical potential for soil carbon sequestration in agricultural systems of the Old Peanut Basin of Senegal. J. Arid. Environ. 2004, 59, 511–533. [Google Scholar] [CrossRef]
  8. Hiernaux, P.H.; Cissé, M.; Diarra, L.; De Leeuw, P. Fluctuations saisonnières de la feuillaison des arbres et des buissons sahéliens. Conséquences pour la quantification des ressources fourragères. Rev. d’Elevage. Méd. Vét. Pays. Trop. 1994, 47, 117–125. [Google Scholar] [CrossRef]
  9. Garrity, D.P.; Akinnifesi, F.K.; Ajayi, O.C.; Weldesemayat, S.G.; Mowo, J.G.; Kalinganire, A.; Larwanou, M.; Bayala, J. Evergreen Agriculture: A robust approach to sustainable food security in Africa. Food Secur. 2010, 2, 197–214. [Google Scholar] [CrossRef]
  10. Wood, P.J. Faidherbia albida (Del.) A Chev. (Synonym: Acacia albida Del.): A Monograph; CTFT: Nogent-sur-Marne, France, 1989. [Google Scholar]
  11. Boffa, J.M. Agroforestry Parklands in Sub-Saharan Africa; Food and Agriculture Organization of the United Nations: Rome, Italy, 1999. [Google Scholar]
  12. Barnes, R.; Fagg, C.W. Faidherbia albida Monograph and Annotated Bibliography. 2003. Available online: https://ora.ox.ac.uk/objects/uuid:fe18e8c9-1a92-435f-94c2-7c5827cbea57 (accessed on 23 November 2021).
  13. Glover, J.D.; Reganold, J.P.; Cox, C.M. Plant perennials to save Africa’s soils. Nature 2012, 489, 359–361. [Google Scholar] [CrossRef]
  14. Noulekoun, F.; Birhane, E.; Chude, S.; Zenebe, A. Characterization of Faidherbia albida (Del.) A. Chev. population in agroforestry parklands in the highlands of Northern Ethiopia: Impact of conservation, environmental factors and human disturbances. Agroforest. Syst. 2017, 91, 123–135. [Google Scholar] [CrossRef]
  15. Vandenbeldt, R.; Williams, J. The effect of soil surface temperature on the growth of millet in relation to the effect of Faidherbia albida trees. Agr. Forest Meteorol. 1992, 60, 93–100. [Google Scholar] [CrossRef] [Green Version]
  16. Saka, A.; Bunderson, W.; Itimu, O.; Phombeya, H.; Mbekeani, Y. The effects of Acacia albida on soils and maize grain yields under smallholder farm conditions in Malawi. Forest. Ecol. Manag. 1994, 64, 217–230. [Google Scholar] [CrossRef]
  17. Hadgu, K.M.; Kooistra, L.; Rossing, W.A.; van Bruggen, A.H. Assessing the effect of Faidherbia albida based land use systems on barley yield at field and regional scale in the highlands of Tigray, Northern Ethiopia. Food Secur. 2009, 1, 337–350. [Google Scholar] [CrossRef] [Green Version]
  18. Sida, T.S.; Baudron, F.; Kim, H.; Giller, K.E. Climate-smart agroforestry: Faidherbia albida trees buffer wheat against climatic extremes in the Central Rift Valley of Ethiopia. Agric. Forest Meteorol. 2018, 248, 339–347. [Google Scholar] [CrossRef]
  19. Leroux, L.; Falconnier, G.N.; Diouf, A.A.; Ndao, B.; Gbodjo, J.; Tall, L.; Balde, A.; Clermont-Dauphin, C.; Bégué, A.; Affholder, F. Using remote sensing to assess the effect of trees on millet yield in complex parklands of Central Senegal. Agric. Syst. 2020, 184, 102918. [Google Scholar] [CrossRef]
  20. Roupsard, O.; Audebert, A.; Ndour, A.P.; Clermont-Dauphin, C.; Agbohessou, Y.; Sanou, J.; Koala, J.; Faye, E.; Sambakhe, D.; Jourdan, C. How far does the tree affect the crop in agroforestry? New spatial analysis methods in a Faidherbia parkland. Agric. Ecosyst. Environ. 2020, 296, 106928. [Google Scholar] [CrossRef]
  21. Rinaudo, T. The development of farmer managed natural regeneration. LEISA Mag. 2007, 23, 32–34. [Google Scholar]
  22. Haglund, E.; Ndjeunga, J.; Snook, L.; Pasternak, D. Dry land tree management for improved household livelihoods: Farmer managed natural regeneration in Niger. J. Environ. Manag. 2011, 92, 1696–1705. [Google Scholar] [CrossRef] [Green Version]
  23. Weston, P.; Hong, R.; Kaboré, C.; Kull, C.A. Farmer-managed natural regeneration enhances rural livelihoods in dryland West Africa. Environ. Manag. 2015, 55, 1402–1417. [Google Scholar] [CrossRef] [Green Version]
  24. Chomba, S.; Sinclair, F.; Savadogo, P.; Bourne, M.; Lohbeck, M. Opportunities and constraints for using farmer managed natural regeneration for land restoration in sub-Saharan Africa. Front. For. Glob. Chang. 2020, 3, 122. [Google Scholar] [CrossRef]
  25. Elith, J.; Leathwick, J.R. Species distribution models: Ecological explanation and prediction across space and time. Ann. Rev. Ecol. Evol. Syst. 2009, 40, 677–697. [Google Scholar] [CrossRef]
  26. Chakraborty, A.; Joshi, P.; Sachdeva, K. Predicting distribution of major forest tree species to potential impacts of climate change in the central Himalayan region. Ecol. Eng. 2016, 97, 593–609. [Google Scholar] [CrossRef]
  27. Guisan, A.; Thuiller, W. Predicting species distribution: Offering more than simple habitat models. Ecol. Lett. 2005, 8, 993–1009. [Google Scholar] [CrossRef] [PubMed]
  28. He, K.S.; Bradley, B.A.; Cord, A.F.; Rocchini, D.; Tuanmu, M.N.; Schmidtlein, S.; Turner, W.; Wegmann, M.; Pettorelli, N. Will remote sensing shape the next generation of species distribution models? Remote Sens. Ecol. Conserv. 2015, 1, 4–18. [Google Scholar] [CrossRef] [Green Version]
  29. Fassnacht, F.E.; Latifi, H.; Stereńczak, K.; Modzelewska, A.; Lefsky, M.; Waser, L.T.; Straub, C.; Ghosh, A. Review of studies on tree species classification from remotely sensed data. Remote Sens. Environ. 2016, 186, 64–87. [Google Scholar] [CrossRef]
  30. Karlson, M.; Ostwald, M.; Reese, H.; Bazié, H.R.; Tankoano, B. Assessing the potential of multi-seasonal WorldView-2 imagery for mapping West African agroforestry tree species. Int. J. Appl. Earth Observ. Geoinform. 2016, 50, 80–88. [Google Scholar] [CrossRef]
  31. Wang, L.; Sousa, W.; Gong, P. Integration of object-based and pixel-based classification for mapping mangroves with IKONOS imagery. Int. J. Remote Sens. 2004, 25, 5655–5668. [Google Scholar] [CrossRef]
  32. Tigges, J.; Lakes, T.; Hostert, P. Urban vegetation classification: Benefits of multitemporal RapidEye satellite data. Remote Sens. Environ. 2013, 136, 66–75. [Google Scholar] [CrossRef]
  33. Adelabu, S.; Dube, T. Employing ground and satellite-based QuickBird data and random forest to discriminate five tree species in a Southern African Woodland. Geocarto. Int. 2015, 30, 457–471. [Google Scholar] [CrossRef]
  34. Cho, M.A.; Malahlela, O.; Ramoelo, A. Assessing the utility WorldView-2 imagery for tree species mapping in South African subtropical humid forest and the conservation implications: Dukuduku forest patch as case study. Int. J. Appl. Earth Observ. Geoinform. 2015, 38, 349–357. [Google Scholar] [CrossRef]
  35. Korpela, I.; Ørka, H.O.; Maltamo, M.; Tokola, T.; Hyyppä, J. Tree species classification using airborne LiDAR–effects of stand and tree parameters, downsizing of training set, intensity normalization, and sensor type. Silva. Fenn. 2010, 44, 319–339. [Google Scholar] [CrossRef] [Green Version]
  36. Yao, W.; Krzystek, P.; Heurich, M. Tree species classification and estimation of stem volume and DBH based on single tree extraction by exploiting airborne full-waveform LiDAR data. Remote Sens. Environ. 2012, 123, 368–380. [Google Scholar] [CrossRef]
  37. Heinzel, J.; Koch, B. Exploring full-waveform LiDAR parameters for tree species classification. Int. J. Appl. Earth Observ. Geoinform. 2011, 13, 152–160. [Google Scholar] [CrossRef]
  38. Cho, M.A.; Mathieu, R.; Asner, G.P.; Naidoo, L.; Van Aardt, J.; Ramoelo, A.; Debba, P.; Wessels, K.; Main, R.; Smit, I.P. Mapping tree species composition in South African savannas using an integrated airborne spectral and LiDAR system. Remote Sens. Environ. 2012, 125, 214–226. [Google Scholar] [CrossRef]
  39. Dalponte, M.; Bruzzone, L.; Gianelle, D. Tree species classification in the Southern Alps based on the fusion of very high geometrical resolution multispectral/hyperspectral images and LiDAR data. Remote Sens. Environ. 2012, 123, 258–270. [Google Scholar] [CrossRef]
  40. Kukkonen, M.; Maltamo, M.; Korhonen, L.; Packalen, P. Multispectral Airborne Lidar Data in the Prediction of Boreal Tree Species Composition. IEEE Trans. Geosci. Remote Sens. 2019, 57, 3462–3471. [Google Scholar] [CrossRef]
  41. Gärtner, P.; Förster, M.; Kleinschmit, B. The Benefit of Synthetically Generated Rapideye and Landsat 8 Data Fusion Time Series for Riparian Forest Disturbance Monitoring. Remote Sens. Environ. 2016, 177, 237–247. [Google Scholar] [CrossRef] [Green Version]
  42. Schriever, J.R.; Congalton, R.G. Evaluating Seasonal Variability as an Aid to Cover-Type Mapping from Landsat Thematic Mapper Data in the Northeast. Photogramm. Eng. Remote Sens. 1995, 61, 321–327. [Google Scholar]
  43. Hesketh, M.; Sánchez-Azofeifa, G.A. The Effect of Seasonal Spectral Variation on Species Classification in the Panamanian Tropical Forest. Remote Sens. Environ. 2012, 118, 73–82. [Google Scholar] [CrossRef]
  44. Key, T.; Warner, T.A.; McGraw, J.B.; Fajvan, M.A. A Comparison of Multispectral and Multitemporal Information in High Spatial Resolution Imagery for Classification of Individual Tree Species in a Temperate Hardwood Forest. Remote Sens. Environ. 2001, 75, 100–112. [Google Scholar] [CrossRef]
  45. Sheeren, D.; Fauvel, M.; Josipović, V.; Lopes, M.; Planque, C.; Willm, J.; Dejoux, J.-F. Tree Species Classification in Temperate Forests Using Formosat-2 Satellite Image Time Series. Remote Sens. 2016, 8, 734. [Google Scholar] [CrossRef] [Green Version]
  46. Mickelson, J.G.; Civco, D.L.; Silander, J.A. Delineating Forest Canopy Species in the Northeastern United States Using Multi-Temporal Tm Imagery. Photogramm. Eng. Remote Sens. 1998, 64, 891–904. [Google Scholar]
  47. Triboulet, C. Identification des parcs à Faidherbia albida par télédétection. Cirad-Forêt Cahiers Sci. 1996, 12, 203–216. [Google Scholar]
  48. Lelong, C.C.; Tshingomba, U.K.; Soti, V. Assessing Worldview-3 multispectral imaging abilities to map the tree diversity in semi-arid parklands. Int. J. Appl. Earth Observ. Geoinform. 2020, 93, 102211. [Google Scholar] [CrossRef]
  49. Zhang, W.; Brandt, M.; Wang, Q.; Prishchepov, A.V.; Tucker, C.J.; Li, Y.; Lyu, H.; Fensholt, R. From woody cover to woody canopies: How Sentinel-1 and Sentinel-2 data advance the mapping of woody plants in savannas. Remote Sens. Environ. 2019, 234, 111465. [Google Scholar] [CrossRef]
  50. Chan, J.C.-W.; Paelinckx, D. Evaluation of Random Forest and Adaboost tree-based ensemble classification and spectral band selection for ecotope mapping using airborne hyperspectral imagery. Remote Sens. Environ. 2008, 112, 2999–3011. [Google Scholar] [CrossRef]
  51. Dalponte, M.; Ørka, H.O.; Gobakken, T.; Gianelle, D.; Næsset, E. Tree species classification in boreal forests with hyperspectral data. IEEE Transac. Geosci. Remote Sens. 2012, 51, 2632–2645. [Google Scholar] [CrossRef]
  52. Immitzer, M.; Atzberger, C.; Koukal, T. Tree species classification with random forest using very high spatial resolution 8-band WorldView-2 satellite data. Remote Sens. 2012, 4, 2661–2693. [Google Scholar] [CrossRef] [Green Version]
  53. Drusch, M.; Del Bello, U.; Carlier, S.; Colin, O.; Fernandez, V.; Gascon, F.; Hoersch, B.; Isola, C.; Laberinti, P.; Martimort, P. Sentinel-2: ESA’s optical high-resolution mission for GMES operational services. Remote Sens. Environ. 2012, 120, 25–36. [Google Scholar] [CrossRef]
  54. Tottrup, C.; Rasmussen, M.S. Mapping long-term changes in savannah crop productivity in Senegal through trend analysis of time series of remote sensing data. Agr. Ecosyst. Environ. 2004, 103, 545–560. [Google Scholar] [CrossRef]
  55. Lufafa, A.; Diédhiou, I.; Samba, S.; Séné, M.; Khouma, M.; Kizito, F.; Dick, R.; Dossa, E.; Noller, J. Carbon stocks and patterns in native shrub communities of Senegal’s Peanut Basin. Geoderma 2008, 146, 75–82. [Google Scholar] [CrossRef]
  56. Lamprecht, H. Silviculture in the Tropics; GTZ: Eschborn, Germany, 1989; p. 296. [Google Scholar]
  57. Sileshi, G.W. The magnitude and spatial extent of influence of Faidherbia albida trees on soil properties and primary productivity in drylands. J. Arid. Environ. 2016, 132, 1–14. [Google Scholar] [CrossRef]
  58. Tschakert, P. Carbon for farmers: Assessing the potential for soil carbon sequestration in the old peanut basin of Senegal. Clim. Chang. 2004, 67, 273–290. [Google Scholar] [CrossRef]
  59. Ndao, B.; Leroux, L.; Gaetano, R.; Diouf, A.A.; Soti, V.; Bégué, A.; Mbow, C.; Sambou, B. Landscape heterogeneity analysis using geospatial techniques and a priori knowledge in Sahelian agroforestry systems of Senegal. Ecol. Indic. 2021, 125, 107481. [Google Scholar] [CrossRef]
  60. Ndao, B.; Leroux, L.; Hema, A.; Diouf, A.A.; Bégué, A.; Sambou, B. Tree Species Diversity Mapping Using Species Distribution Models: A Faidherbia albida Parkland Case Study in Senegal. Ecol. Model 2021. submitted. [Google Scholar]
  61. Brandt, M.; Tucker, C.J.; Kariryaa, A.; Rasmussen, K.; Abel, C.; Small, J.; Chave, J.; Rasmussen, L.V.; Hiernaux, P.; Diouf, A.A. An unexpectedly large count of trees in the West African Sahara and Sahel. Nature 2020, 587, 78–82. [Google Scholar] [CrossRef]
  62. Frampton, W.J.; Dash, J.; Watmough, G.; Milton, E.J. Evaluating the capabilities of Sentinel-2 for quantitative estimation of biophysical variables in vegetation. ISPRS J. Photogramm. Remote Sens. 2013, 82, 83–92. [Google Scholar] [CrossRef] [Green Version]
  63. Hripcsak, G.; Rothschild, A.S. Agreement, the f-measure, and reliability in information retrieval. J. Am. Med. Inform. Assoc. 2005, 12, 296–298. [Google Scholar] [CrossRef]
  64. Kindt, R. Ensemble species distribution modelling with transformed suitability values. Environ. Model Softw. 2018, 100, 136–145. [Google Scholar] [CrossRef]
  65. Yan, E.; Wang, G.; Lin, H.; Xia, C.; Sun, H. Phenology-Based Classification of Vegetation Cover Types in Northeast China Using Modis Ndvi and Evi Time Series. Int. J. Remote Sens. 2015, 36, 489–512. [Google Scholar] [CrossRef]
  66. Bradley, B.A. Remote detection of invasive plants: A review of spectral, textural and phenological approaches. Biol. Invas. 2014, 16, 1411–1425. [Google Scholar] [CrossRef]
  67. Franklin, S.E.; Hall, R.J.; Moskal, L.M.; Maudie, A.J.; Lavigne, M.B. Incorporating Texture into Classification of Forest Species Composition from Airborne Multispectral Images. Int. J. Remote Sens. 2000, 21, 61–79. [Google Scholar] [CrossRef]
  68. Lykke, A.M. Local perceptions of vegetation change and priorities for conservation of woody-savanna vegetation in Senegal. J. Environ. Manag. 2000, 59, 107–120. [Google Scholar] [CrossRef]
  69. Lykke, A.; Kristensen, M.; Ganaba, S. Valuation of local use and dynamics of 56 woody species in the Sahel. Biodiv. Conserv. 2004, 13, 1961–1990. [Google Scholar] [CrossRef]
  70. Sambou, A.; Sambou, B.; Ræbild, A. Farmers’ contributions to the conservation of tree diversity in the Groundnut Basin, Senegal. J. Forest. Res. 2017, 28, 1083–1096. [Google Scholar] [CrossRef]
  71. Kindt, R. A climate change atlas for Africa. In Presentation Made during a Workshop on the Estimation of the Potential of Agroforestry to Mitigate Climate Change in Sub-Saharan Africa; CIRAD: Montpellier, France, 2021. [Google Scholar] [CrossRef]
Figure 1. (A) Location of Senegal and land use/cover map of 2019 (Copernicus Global Land Service at 100-m resolution). The precipitation data are derived from the CHIRPS long-term (1981–2019) yearly average. The rainfall zones of 100–300 mm, 300–600 mm and 600–1000 mm are categorized as arid area, semi-arid area and sub-humid area. The two grey boxes represent locations of data sampling in Niakhar and Nioro. (B) Examples of Faidherbia albida trees (red dots) during the (I) dry and (III) rainy season from Google Earth. Image (II) and (IV) represent the corresponding stretched true colour images from Sentinel-2 at 10-m resolution. Blue points represent other tree species.
Remotesensing 14 00662 g001
Figure 2. Seasonal distribution of leaf mass depending on the phenological type of woody plants in the Sahel [8]. The inverse deciduous type represents Faidherbia albida trees.
Remotesensing 14 00662 g002
Figure 3. Averaged monthly (A) NDVI and (B) NDI54 values for sample pixels of Faidherbia albida and other species in the regions of Nioro and Niakhar. Vertical lines represent the standard deviation of the sample population. Overall, 1418 pixels were sampled and averaged over the study period, including 57 Faidherbia albida pixels and 112 pixels with other tree species in the Nioro region, and 459 Faidherbia albida pixels and 790 pixels with other species in the Niakhar region.
Remotesensing 14 00662 g003
Figure 4. Relationship between mean accuracy and number of features fed to the MLP classifier. The flat horizontal dashed line represents the accuracy from a model using all features.
Remotesensing 14 00662 g004
Figure 5. (A) Faidherbia albida cover map (%) at 1-hectare resolution from our classification. Included are close-up maps showing detailed Faidherbia albida classification maps of different regions as white polygons superimposed on images from Google Earth. (B) Faidherbia albida potential occurrence map provided by Kindt [64].
Remotesensing 14 00662 g005
Figure 6. Average Faidherbia albida cover (%) in relation to modelled suitability scores (intervals of 20 units) for different land use/cover types. The land use/cover map of 2019 is provided by Copernicus Global Land Service at 100-m resolution. Wetland, urban, water, bare vegetation and closed forest types were not included in this comparison due to the limited number of observations.
Remotesensing 14 00662 g006
Figure 7. (A) Map of relative contribution of Faidherbia albida canopy cover to the cover of all woody plants shown as a percentage at the hectare scale. The rainfall zones are derived from the CHIRPS long-term (1981–2019) yearly average. (B) Relation between the relative contribution of Faidherbia albida to canopy cover in croplands. The land use/cover map of 2019 is provided by Copernicus Global Land Service at 100-m resolution.
Remotesensing 14 00662 g007
Table 1. Feature information of the 40 features finally retained to feed the MLP model including monthly features (band/spectral index and specific month) and seasonal dynamics features (band/spectral index and related months).
Monthly FeatureSeasonal Dynamic Feature
Band/IndexMonthFeature ImportanceBand/IndexMonthFeature Importance
NDI5420.040NDVI2–60.063
Band1260.035NDI542–60.043
Band1230.032NDVI2–50.041
Band1160.031NDI548–120.038
Band1250.030NDVI4–60.031
NDI54120.029NDVI7–120.031
NDI5430.029NDI542–50.029
Band2100.026NDI542–80.024
Band1240.025Band123–110.023
NDI5440.025NDVI2–70.023
NDI5460.025NDVI6–120.022
NDVI60.023NDI5410–110.020
Band3100.022NDI543–80.020
Band8100.019NDI542–100.018
NDVI100.017Band123–100.018
NDVI70.017Band124–110.017
Band310–120.017
NDVI4–70.015
Band410–110.014
NDI5410–120.014
NDI541–80.014
Band46–120.014
NDVI3–70.010
Publisher’s Note: MDPI stays neutral with regard to jurisdictional claims in published maps and institutional affiliations.

