1. Introduction
Landslide refers to the movement of rock, gravel, or soil along the slope [
1]. Its distribution is primarily influenced by geological, climatic and other variables. Landslides are more common in geological tectonic zones such as fault zones and seismic zones, earthquakes of magnitude 7 or above and slopes of greater than 25°. Rock fragmentation and fracture growth in the fault zone are extremely favorable to the creation of landslides. It is straightforward to slide rocks and soil about in this location (slope). Loose overburden, loess, mudstone, shale, coal measure strata, tuff, schist, slate, phyllite, and other rocks and soils, for example, provide a suitable material basis for landslide formation. In these places, unusual rainfall acts as a catalyst for landslides. The overlay region of the above zones creates a dense landslide development area. The Yunnan–Guizhou Plateau in China, for example, is a typical location with a high landslide density and significant damage [
2].
According to the 2020 national geological disasters and 2021 trend forecast report of Guizhou Provincial Department of natural resources (DNR), 7840 geological disasters occurred in China in 2020, including 4810 landslides, accounting for 61.35% of the total of geological disasters. Landslides are one of the most prevalent disasters in China, accounting for the majority of geological disasters and causing significant damage to the country’s economic infrastructure and people’s property. A massive landslide happened around 20:40 on 23 July 2019 at Chagou Group, Pingdi Village, Jichang Town, Shuicheng County, Guizhou Province. There were 23 households, 77 persons, and 27 houses involved, with 21 of them being buried. As of 29 July, 42 persons had killed and 9 more remained unaccounted for [
2].
In the past, thematic maps were often used for manual interpretation in landslide extraction, a method that has low efficiency, low accuracy, is time consuming and has poor classification accuracy. The resolution of satellite images is gradually improving as remote sensing technology advances, and the pixel-based classification approach cannot meet the needs of researchers for classification accuracy and effect. Given its high spatial resolution, remote sensing images contain more texture and spectral information, and object-oriented classification methods, such as the yuan classification method, have more advantages, as they can fully apply the spectrum, shape and texture features of images to classification, avoiding the salt and pepper phenomenon. As a result, object-oriented classification can provide more accurate landslide data [
3].
The object-oriented classification method based on the features of high-resolution remote sensing images was first proposed by Baatz and Shape (1999) [
4]. This method takes into account not only the object’s spectral information, but also its size, texture and other characteristics. The pixels that have the same characteristics are considered the same object, and the object is then classified. The “salt and pepper” effect is effectively eliminated [
5]. Barlow et al. (2003) used an object-oriented method to detect landslides in the Cascade Mountains region using Landsat 7 images [
6]. Hu Deyong et al. (2008) extracted the landslide data in the tropical rainforest area of Malaysia’s Kamalun Plateau using high-resolution remote sensing images and an object-based landslide detection method [
7]. To extract Wenchuan landslide points, Wang Qiulai (2008) used Landsat 5, 7 remote sensing images and SPOT5 panchromatic band images, as well as multi-scale segmentation and object-oriented classification technology based on fuzzy logic classification. This method has the advantages of being quick and accurate [
8]. Martha et al. (2010) combined the spectrum, spatial information, texture, shape, context and other feature information of the segmented objects to extract seismic damage information using object-oriented methods. Finally, the landslides in the study area are classified as debris flow, rockfall and other categories, with an accuracy of 69.1% [
5]. Wu Jian et al. (2010) extracted earthquake-damaged landslides and damaged buildings in Zipingpu Town, Du Jiangyan, using QuickBird and IKONOS data of pre-disaster and post-disaster high-resolution remote sensing images, and used homogeneity technology instead of single pixel for processing, resulting in a total object-oriented accuracy of 90.8 percent [
9]. Lahousse et al. (2011) used object-oriented analysis technology to identify landslides caused by typhoons in Taiwan’s Baichi Basin using images of various time and phase scales [
10]. Libao Zhang et al. (2015) proposed a remote sensing image segmentation algorithm based on a two-dimensional gradient remote sensing histogram in combination with the MMAD model [
11]. Yin and Shoulin (2018) combined fuzzy competition and a Gaussian model to create a new large-scale image segmentation technology. This method can fit high-precision data with a statistical distribution, removing the negative effects of noise and resulting in more high-precision segmentation results [
12].
Based on summarizing previous studies, this study adopts the latest remote sensing data, such as high spatial resolution GF-1 satellite images and multi band sentinel-2 satellite images. On the basis of image enhancement and other processing of the data, the object-oriented method is used to extract and classify the landslide mass and surrounding features. Combined with the regional geological map, elevation data and other auxiliary data, the destructiveness and causes of landslide are analyzed and discussed. This is an application of remote sensing comprehensive method, which can predict landslides in similar areas. The research contents and steps of this paper are as follows:
Remote sensing data preprocessing, ortho-correction was performed on the GF-1 image, image matching and data fusion were performed with the Sentinel-2 image, and the fusion results were cropped;
The image is enhanced, using three enhancement methods: band synthesis, principal component analysis and filtering. Perform band synthesis (Band 2, 3, 4, 8, 11, 12) on Sentinel-2 data; perform principal component analysis on Sentinel-2 data (including landslides) and select the first three principal components for band synthesis; use Sobel filtering and directional filtering filters the sentinel-2 data after the occurrence of the landslide;
The sample-based object-oriented method is used to extract information about landslide disasters and classify the surrounding ground cover of the landslide body by using Sentinel-2 data after the occurrence of the landslide. By determining the segmentation scale, creating classification indicators, determining categories and selecting samples, the feature space is optimized and the output result is finally obtained, and the accuracy of the classification result is evaluated;
Combining the use of object-oriented methods to compare and analyze the classification results before and after the landslide and evaluate the destructiveness of the landslide based on the damaged area of houses, farmland, forest and roads. Analyze the composition of the landslide, draw the geological interpretation map of the study area, analyze the lithological characteristics of the landslide area and determine the various reasons for the formation of the landslide through the above analysis, combining the influence of precipitation and man-made construction. The research flow chart is shown in
Figure 1.
It is hoped that by analyzing this landslide event, accurate morphological information about the landslide can be obtained, the loss caused by the landslide can be assessed and the formation reasons for the landslide can be discussed in conjunction with relevant data, to aid in the prevention and treatment of related disasters.
1.1. Study Area
1.1.1. Location
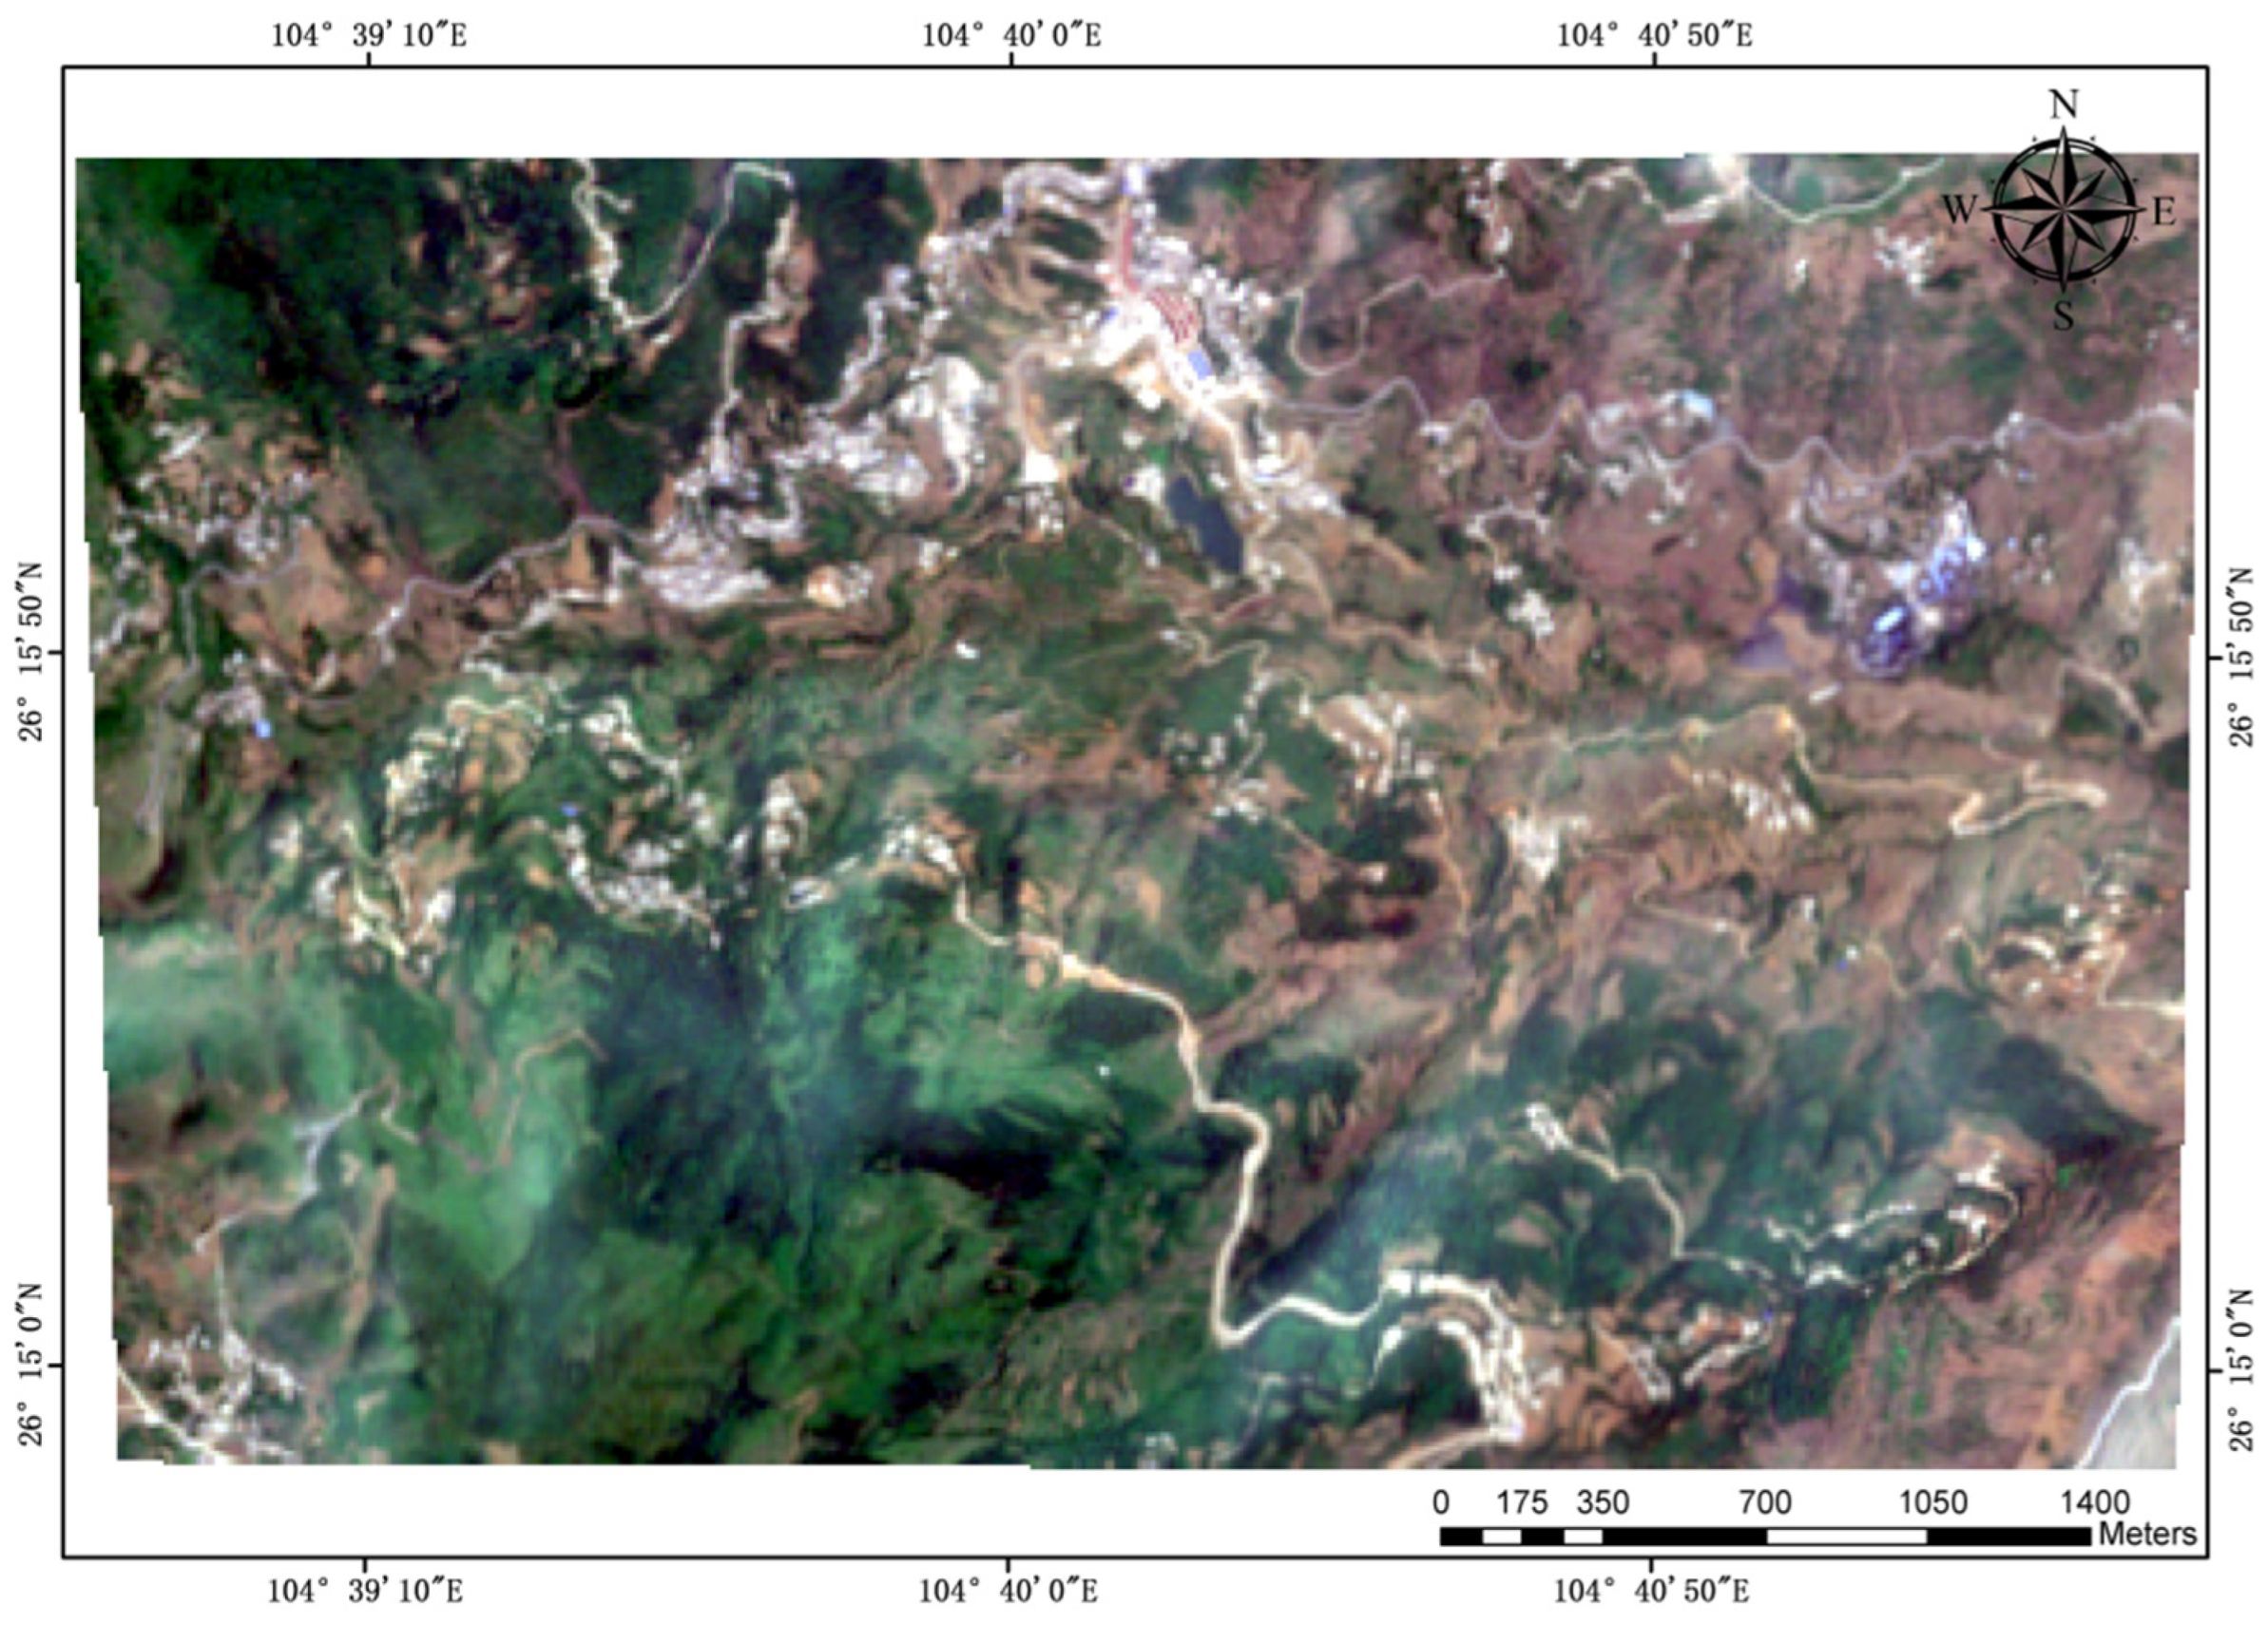
Shuicheng is a county-level administrative unit of Liupanshui City, Guizhou Province, as shown in
Figure 2. The longitude span is 104°33′00″ E–104°15′23″ E, and the latitude span is 26°02′26″ N–26°55′21″ N. It has the nickname of “Plateau Pearl” in Guizhou province. The north–south length is 97 km, the east–west width is 69 km the total jurisdiction area is 3605 km
2. Shuicheng has a pleasant climate, abundant rain and a subtropical monsoon climate, which is mild and wet, rainy and hot at the same time, with spring and autumn together, short sunny days, an annual average temperature of around 12 °C and a frost-free season of more than 200 days [
13,
14]. It receives more than 1000 mm of rain each year. Precipitation is lowest in the northwest and increases in the southeast, with an uneven distribution of precipitation throughout the season. Winter and spring have little precipitation, whereas summer has the most precipitation, with persistent rainstorms. A single season’s precipitation accounts for more than half of the total annual precipitation [
14]. There are many rivers in Shuicheng, among which Sancha River and Beipan River are the two main rivers. Because the water network is densely covered and the flow is large, it has become an important factor for the formation of natural geological disasters in Shuicheng [
14].
1.1.2. Geological Setting
Because the northwest region’s average elevation is more than 1000 m higher than the southeast, most of the rivers in the northwest region flow east–west. The cutting influence of the Beipanjiang River system and the Sancho River, respectively, affects the north and south of the research region, and the landscape is highly undulating. The North-pan River, which flows out of Huaga Township, is at an elevation of about 646 m, while the summit of The Roof of Ganshan Mountain in Yingpan Township is at an elevation of about 2852 m, providing an undulating mountain scenery. Karst, erosion–dissolution and tectonic erosion are the three types of natural geomorphology found in the studied area. The strata of Shuicheng County are all exposed, ranging from Jurassic to Quaternary, and may be classified into 31 groups. The geological map of the study area is shown in
Figure 3. Landslide areas of Jichang town are mainly as follows: T1-2j (the first to fourth members of the middle and lower Triassic system Jialing river formation); T1f (the first to third members of the Lower Triassic Feixianguan formation); P3x (the first to third members of the Permian Xuanwei formation); P2-3em (the first and second members of the middle upper Permian Mount Emei basalt formation); P2m (the first or second member of the middle Permian Maokou formation); P2q2 (the second member of the middle Permian Qixia formation); and residual or impact loose material of the Quaternary system [
14,
15]. The stratigraphic lithology is shown in
Table 1.
2. Materials and Methods
2.1. Data Sources
Remote sensing data sources as well as non-remote sensing data sources were utilized in this study. Sentinel-2 (10 m, 27 April 2019 and 15 August 2019) and GF-1 (8 m, 6 January 2018) data were among the remote sensing data sources. County-level vector map, ASTER GDEM, and Geological and ecological environment map of Karst rock area of 1:50,000 Puli, Yushe, Aga Jichang, Yangmei, and Houchang in Guizhou province are examples of non-remote sensing data sources (hereinafter referred to as Ecological Environment Map).
Table 2 shows a quick overview of the remote sensing data used in this work.
2.2. Related Software
Object-oriented landslide extraction is mainly realized in eCognition. It is an intelligent image analysis software developed by Germany Definiens Imaging. ECognition is the first remote sensing information extraction software based on target information among all commercial remote sensing software. The birth of eCognition software leads the innovation and development of image processing technology, becoming the mainstream information extraction and image interpretation and analysis technology in the world, providing solutions for the industry’s leading data providers, product value-added and remote sensing experts.
eCognition Developer is a powerful object-oriented image analysis and processing software, mainly used in the field of Geoscience remote sensing image automatic analysis and processing, in the form of rule set development to achieve image and object interpretation.
The software features:
A collection of object-based image analysis tools and algorithms (the earliest object-oriented analysis software);
Ability to analyze raster data, vector data and point cloud data;
Provide intuitive development environment based on CNL language;
Ability to scale from a single desktop to an enterprise-level production process;
Software Development Kit (SDK).
As for the specific use of eCognition software, it has applications in stratigraphic boundary, forestry and water in this paper. The object-oriented method based on ecognition software can be applied to railway site selection, geological and lithologic classification, water system extraction and so on.
2.3. Pretreatment
Preprocessing remote sensing data is an important step in the remote sensing data processing process. The preprocessing in this research includes GF-1 data Orthophoto, image registration and data fusion with Sentinel-2 data before the data is classified via object-orientation before a landslide occurs.
2.3.1. Orthographic Correction
The typical model cannot be used since the study region is located in a mountainous terrain area with a considerable relative height difference. Furthermore, because the GF-1 data includes an RPC (*.rpc) file (which is used in RPC model for geometric correction), the GF-1 image can be rectified without the use of control points. It mainly relies on its own RPC files and aster GDEM data for positioning and geometric correction. The results show that the accuracy of orthophoto correction is high.
Figure 4 shows the results of GF-1’s orthographic correction.
The general steps of orthophoto correction for RPC files are as follows:
- (1)
Interior orientation (for aerial photos only)—interior orientation will establish the relationship between camera parameters and aerial photos. It will use strip control points between aerial photos, camera frame punctuation and camera focal length for internal orientation;
- (2)
External orientation—external orientation will connect the ground object points on aerial or satellite photos with the actually known ground position (geographic coordinates) and elevation. By selecting ground control points and inputting corresponding geographical coordinates, external orientation is carried out;
- (3)
Orthophoto correction using digital elevation model (DEM)—this step will carry out real orthophoto correction for aerial and satellite photos. Orientation files, satellite position parameters, and collinearity equations will be used in the correction process. The collinear equation is created by the above two steps and using digital elevation model (DEM).
2.3.2. Image Matching
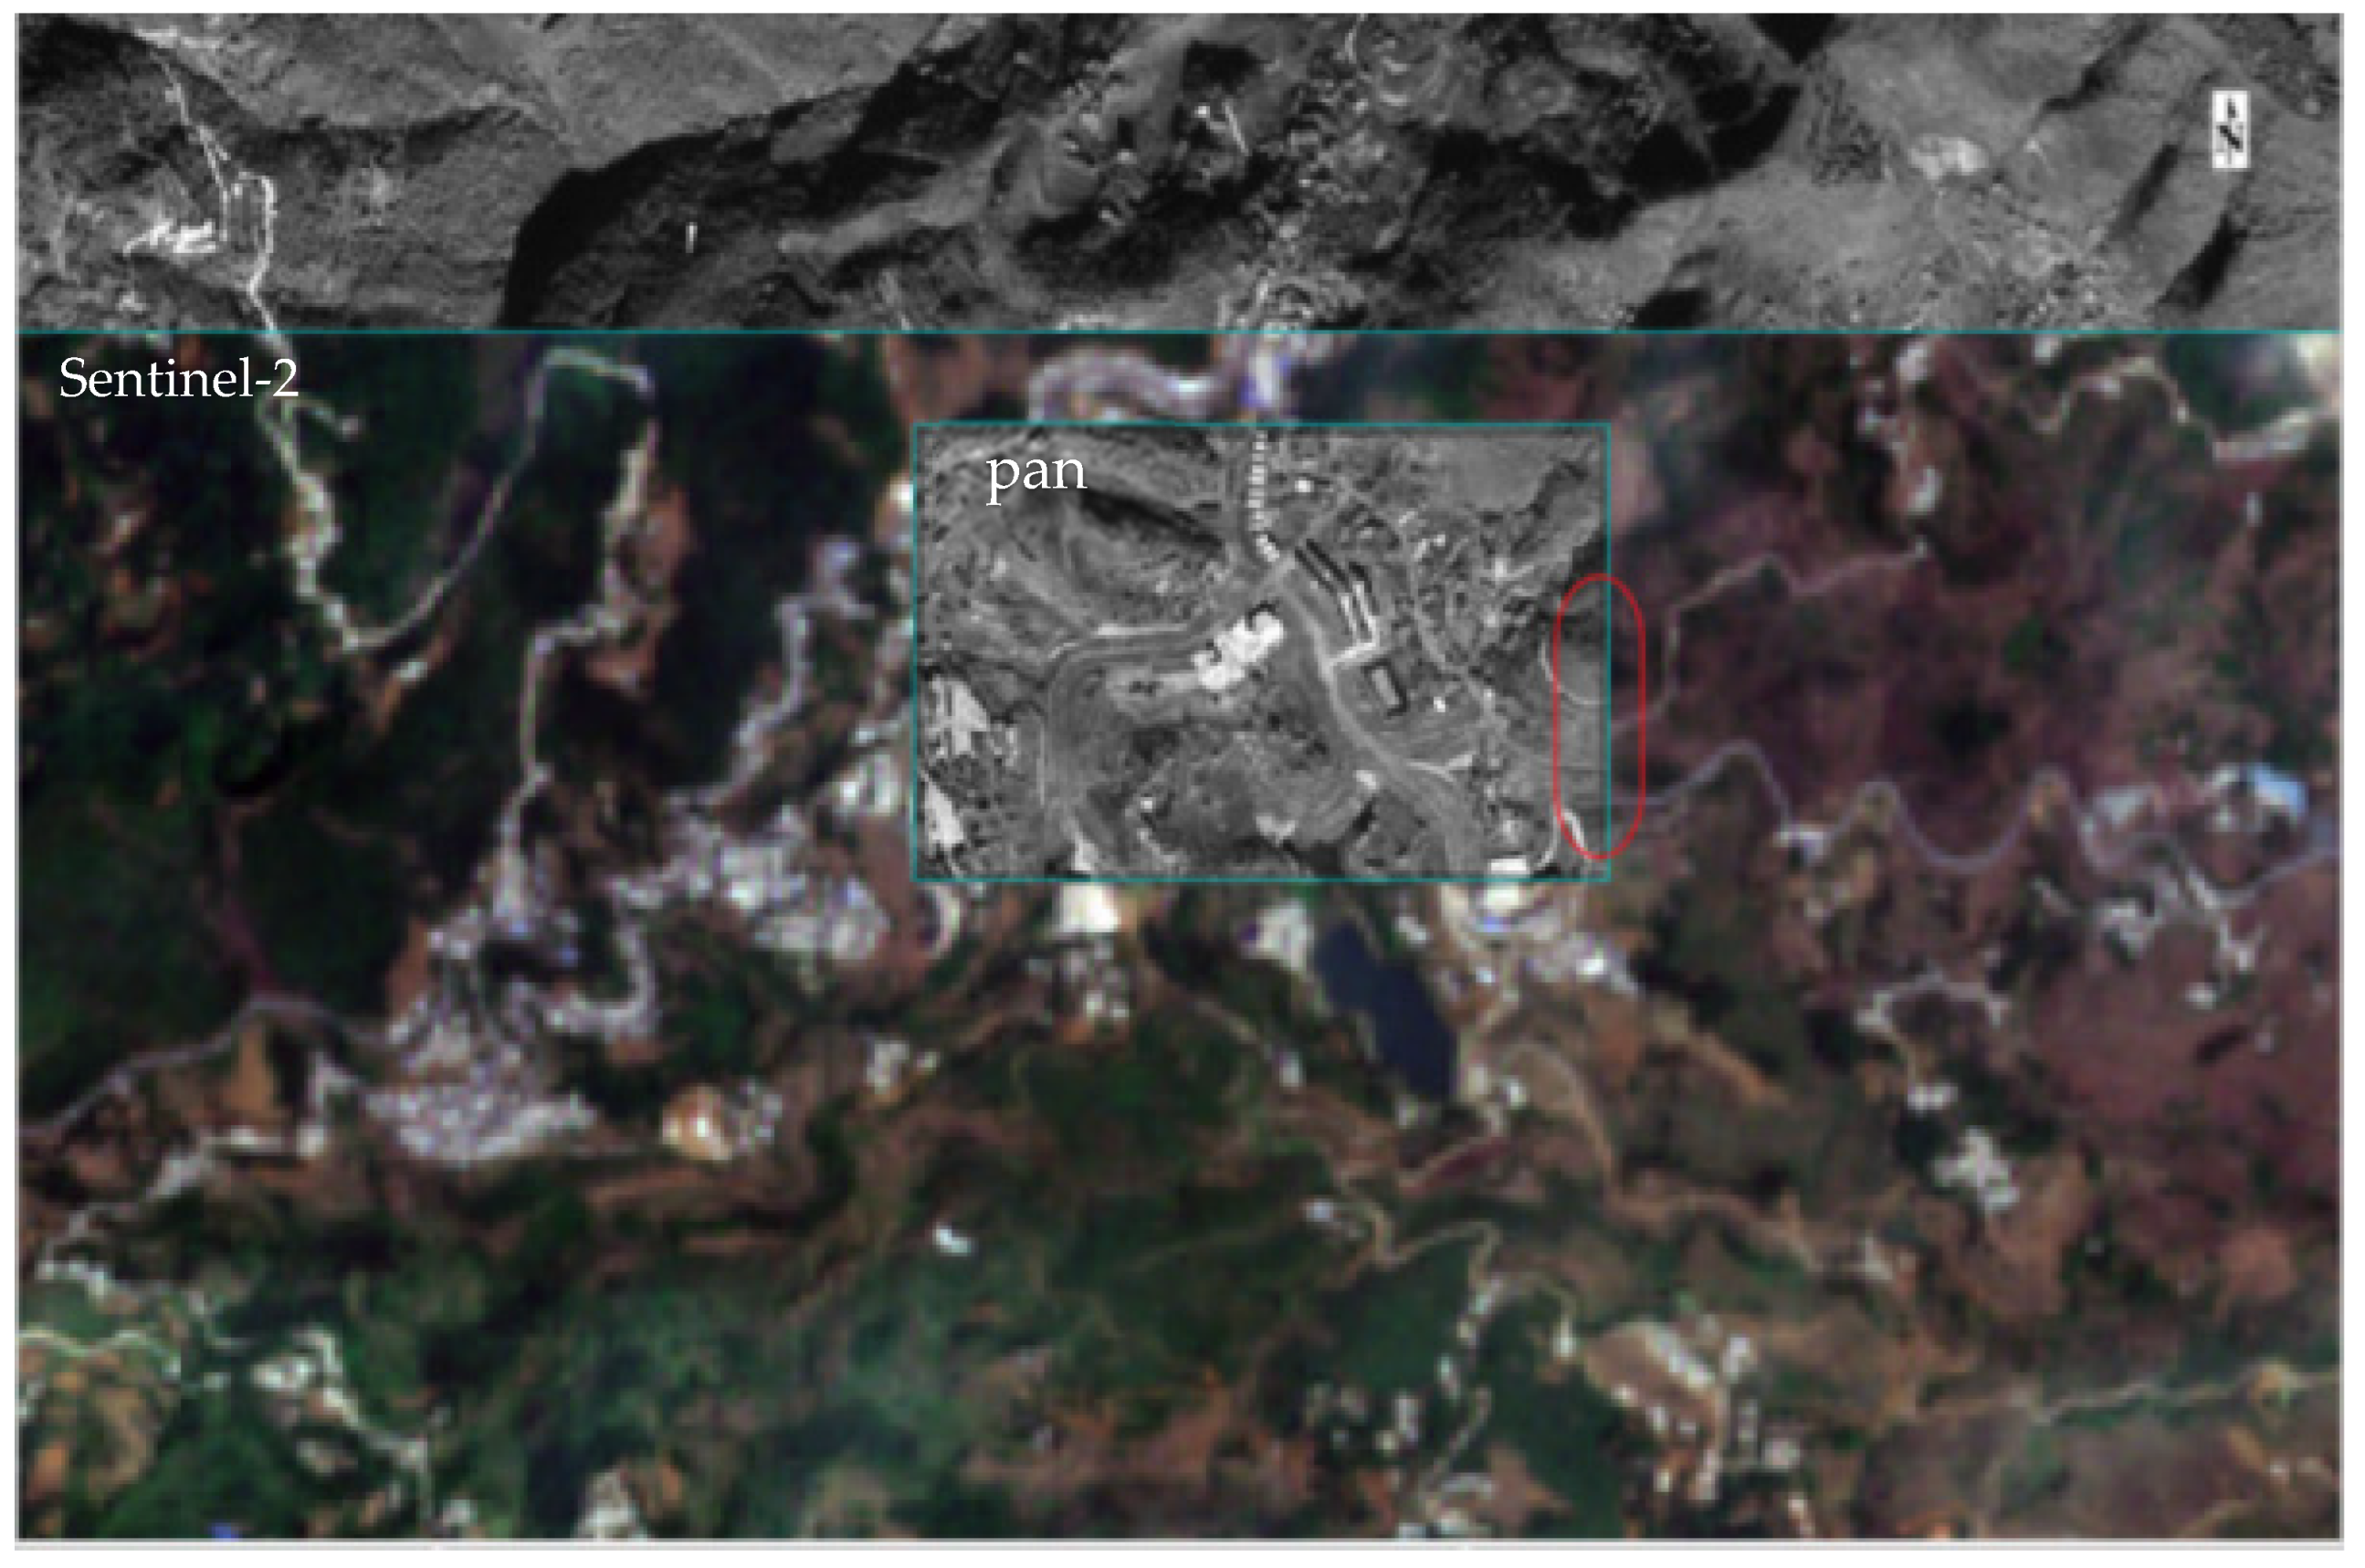
Due to the difference in resolution, the spatial positions of sentinel data and high score data are inconsistent, as shown in
Figure 5. In order to prepare for further data fusion, remote sensing image geometric correction model (RPC model) should be used for image registration, and the registration results are shown in
Figure 6. The sentinel-2 image is automatically registered with the high score data as the basic image. Relevant parameters of the model, the matching degree threshold (minimum) of the connection point is 0.6, the connection point error threshold (maximum) is 3.0, the number of connection points is 121. The advantage of this matching method is that by combining many complex factors into a modular tool, it can register images quickly and accurately without too much manual interaction.
2.3.3. Data Fusion
Sentinel-2 has a lower resolution than GF-1 data, but Sentinel-2 data has more bands than GF-1 data, so data fusion needs to be carried out to combine their advantages to improve the accuracy of subsequent classification. Sentinel-2 and GF-1 data were merged using the Gram–Schmidt transform fusion method for panchromatic and multi-spectral band fusion. The GS technique is a new data fusion method that not only solves the problem of too much information concentration in the PCA transform method (Principal Components Analysis), but improves image detail, texture and spectral information retention. Part of the results are shown in
Figure 7.
2.4. Image Enhancement
Image enhancement is a typical approach of digital image processing in remote sensing. The goal of image enhancement is to make image interpretation more visually appealing. The image was enhanced using waveband synthesis, principal component analysis and filtering (including Sobel and directional filtering) in this paper. The goal of band synthesis and principal component analysis was to highlight the color variations of ground objects in different parts of the image, making stratigraphic classification more accurate. Sobel filter can detect the edge and highlight the boundary, while directional flow wave can strengthen the elements in a certain direction. Therefore, the landslide boundary can be highlighted with a Sobel filter, and the fault direction and stratigraphic boundary can be highlighted using a directional filter. It provides support for further landslide boundary extraction.
2.4.1. Band Synthesis
Band synthesis is the process of combining images from different bands into a single image based on research requirements. Band synthesis can help to save time and money by reducing the quantity of data. The Blue band (B2), Green band (B3), Red band (B4), NIR band (B8) and SwIR-1,2 (B11, B12) of Sentinel-2 data before and after the landslide were selected in this research as six bands that were advantageous to the extraction of landslide and the classification of surrounding features.
Figure 8 shows the final results as a composite. The texture features of the first image after fusion were richer than the second, which was more favorable to the classification of ground items, as seen in the two findings.
2.4.2. Principal Component Analysis (PCA)
Principal component analysis was first introduced into remote sensing image processing by Pearson in the early 20th century. Thirty-two years later, the principal component analysis method was popularized by Hotelling. The principal component analysis method is to change the original correlated random vectors into a new set of irrelevant random vectors with the help of an orthogonal matrix. At the same time, according to the actual needs, several principal components that can best reflect the original information can be taken out, so as to reduce the amount of computation and remove unnecessary interference. The calculation process is:
- (1)
Standardize the original data;
- (2)
Calculate the correlation coefficient matrix R;
Correlation coefficient matrix R = (
)
m × n = 1, = , is the correlation coefficient between the and ;
- (3)
Calculate eigenvalues and eigenvectors
Calculate the eigenvalue of the correlation coefficient matrix R λ1
≥ λ2 ≥ … ≥ λm ≥ 0, and corresponding eigenvectors μ1, μ2, …, μm;
- (4)
Select p (p ≤ m) principal components and calculate the comprehensive evaluation value;
- (a)
Calculate eigenvalue Information contribution rate and cumulative contribution rate of λ ( = 1, 2, …, m);
- (b)
Calculate comprehensive score.
With the use of an orthogonal matrix, principal component analysis (PCA) transforms the original correlated random vectors into a new collection of incoherent random vectors. Simultaneously, numerous major components that best reflect the original data can be removed based on the actual demands, reducing the amount of processing and removing unwanted interference. Principal component analysis is used to remove the noise interference in the image. In order to highlight the information related to geological strata, the first three principal components are synthesized in this study, and the results are shown in
Figure 9a. The principal component analysis not only shows the surface information, but also highlights the underground information, such as water content, fragmentation and fracture. This reflected information has a strong correlation with the geological interpretation map. The color range of the second member of the middle and lower Triassic Jialingjiang Formation (T1-2J2), for example, is nearly identical to that shown in the
Figure 9b, allowing the stratigraphic boundary to be determined more intuitively, which was useful when drawing the geological interpretation map. So we use the results of principal component synthesis and other auxiliary data to interpret and map the stratum.
2.4.3. Sobel Filtering
Because this paper mainly uses the object-oriented method to extract and analyze the landslide, the edge detection is only a preliminary judgment and understanding of the landslide, so there is no need for too complex filtering methods; the Sobel filter has the advantages of simple principle, convenient use and good recognition effect, so the Sobel filter is used. Sobel filter can be regarded as a kind of edge detection. Edge detection can be regarded as a directional filtering. Sobel filtering is based on two simple 3 × 3 windows. For the kernel of the window, the filter is defined as follows:
Sobel operator is the change speed of the image in both horizontal and vertical directions, also known as gradient, if the remote sensing image is considered a two-dimensional function. Here, it is a two-dimensional vector, and the vector element is the first derivative of the function in both horizontal and vertical directions:
Sobel operator calculates the difference of pixel values in the horizontal and vertical directions to obtain the approximate value of image gradient. It operates in a small interval near the pixel, which can reduce the interference caused by noise. Sobel filtering improves the edge information of the landslide. The landslide’s unambiguous boundary can be seen in
Figure 10, which can help support the object-oriented classification of landslide extraction that follows. At the same time, it draws attention to the landslide’s internal texture, which aids in the investigation of the landslide’s causes and slide process.
It can be seen from the figure (
Figure 10) that the boundary of features has been enlarged, especially the boundary of landslide and road. The texture features of landslide are also enhanced. These are conducive to the extraction of landslide mass.
2.4.4. Directional Filtering
Edge enhancement filtering is referred to as directional filtering. It is roughly 30° north by east, according to fracture strike judgment. The image is filtered along the fracture direction using the directional filter; 30° directional filters were used, with window sizes of 3 × 3 and 5 × 5, respectively.
Directional filtering improves the NE fracture, as shown in
Figure 11. On the edge protruding, the result calculated for the 3 × 3 window was less effective than the result calculated for the 5 × 5 window, and the result of the 5 × 5 window was more apparent and obvious on the protruding of the fracture trend, while the result of the 3 × 3 window has white points.
2.5. Object Oriented Method Theory
2.5.1. Determination of Segmentation Scale
This study adopted the method of He Min et al. [
16,
17,
18]: ”Using the standard deviation within the object to express the heterogeneity within the object, and spatial correlation to express the heterogeneity between the objects”.
The standard deviation inside the object is used to represent the homogeneity inside the object. vi is the standard deviation of the object (i), ai is the area of the object (i), and n is the total number of objects in the whole area (the total number of objects after segmentation).
In order to better estimate the heterogeneity between image objects, Moran’s index is used to represent the heterogeneity between objects.
In the formula,
n is the total number of objects;
represents the adjacency relationship between object R
i and object R
j. If object R
i and object R
j are adjacent,
, otherwise
0;
yi is the spectral average of the object R
i;
is the spectral average of the whole image.
F(v) represents the homogeneity within objects, F(I) represents the heterogeneity between objects, ρ is the weight of Moran’s index I in the objective function value, and the range is [0, 1].
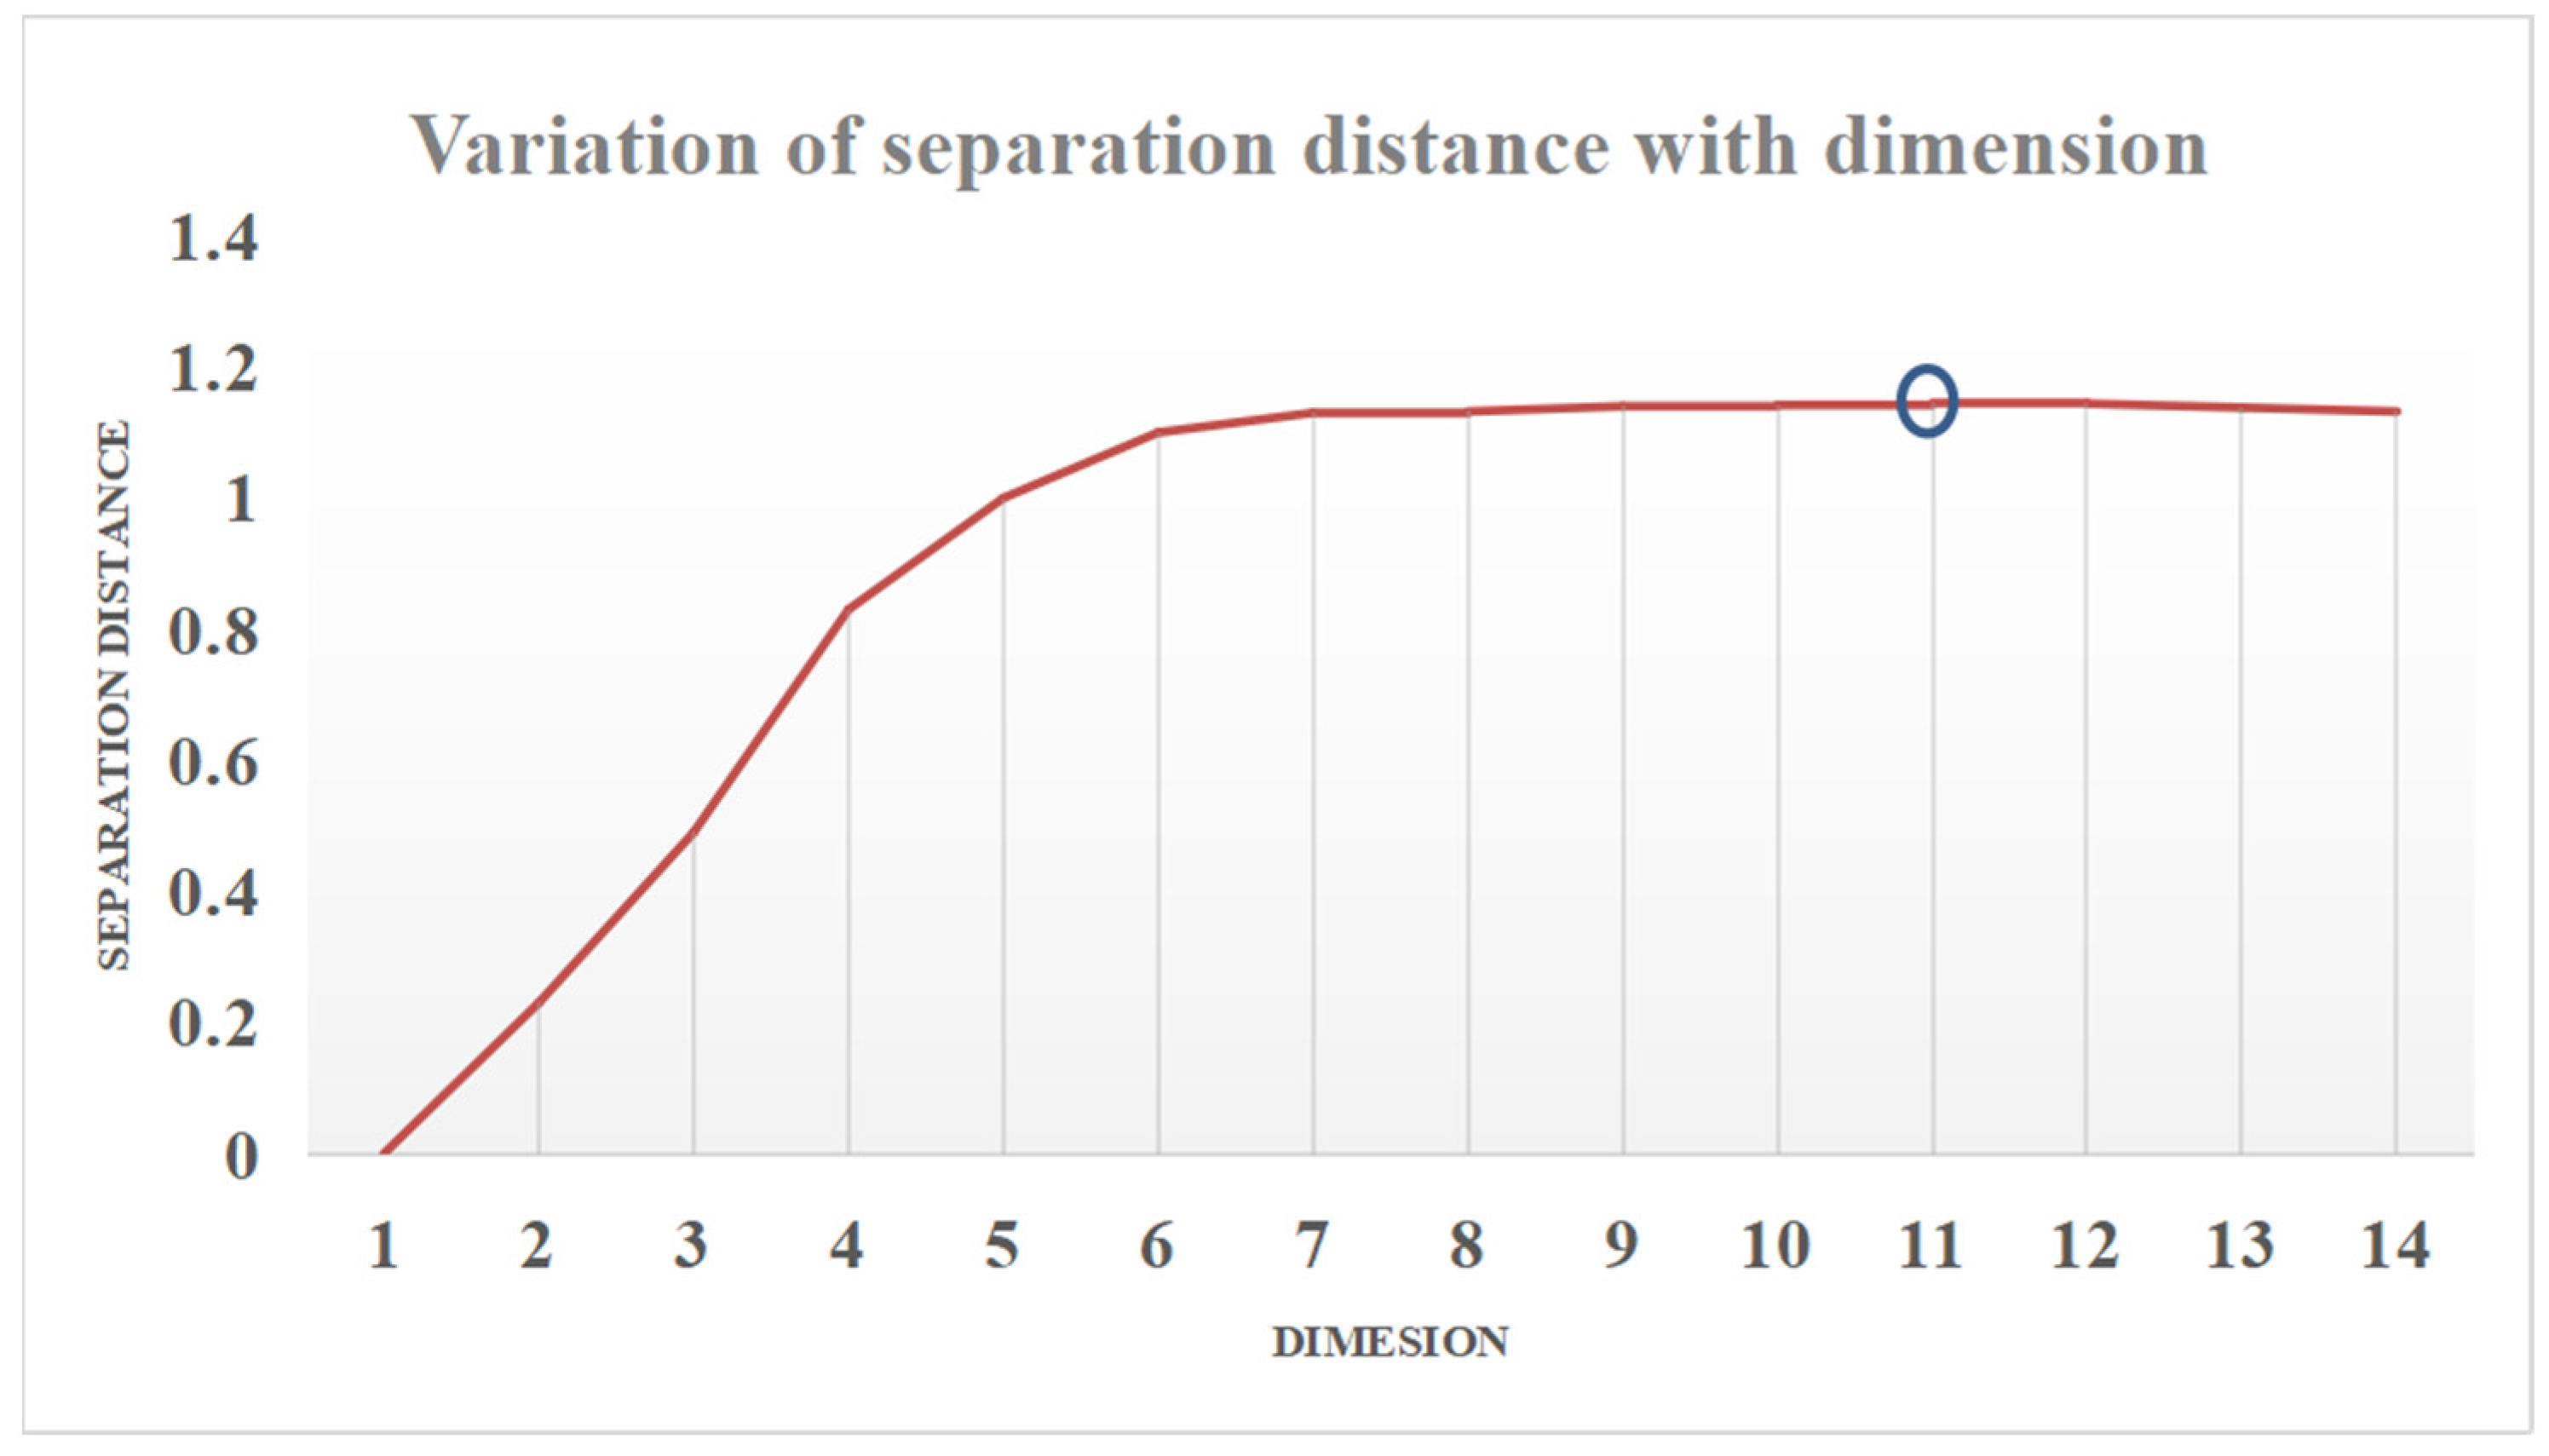
A mathematical method (interpolation function) is used to find the segmentation quality function (the optimal segmentation scale calculation model) that directly uses the segmentation scale as a variable, and the optimal segmentation scale can be calculated through this model.
hn(x) is the interpolation function (the quality function of the segmentation scale x), X represents the segmentation scale, are the coefficients, . Through n + 1 segmentation experiments on the image to be analyzed, n + 1 F (v, I) values will be obtained from Equations (5)–(10), and the values of coefficients can be calculated by using these interpolation nodes, obtain Equation (10) such a segmentation quality function with the segmentation scale x as the variable, so as to obtain the optimal segmentation scale of the image.
2.5.2. Classification Characteristic
It is a very important step to select the appropriate feature to effectively distinguish the target feature from other features. The object to be classified is the segmentation unit after multi-scale segmentation. Different from the traditional pixel, it reflects the abstract feature. Through the analysis of the relationship between the feature and the segmented object, different features are identified according to the feature features, this is of great significance in image interpretation. Various appropriate features can be selected to represent ground objects. Therefore, the extraction of ground objects in image segmentation is actually the analysis and recognition of various features of various representational objects. Based on previous studies, object-oriented image classification technology can select spectrum, texture, shape, terrain, NDVI and other attributes to define the feature space to be classified.
Table 3 shows the spectral and geometric characteristic properties of this object.
2.5.3. Create Classification Categories and Training Samples
The selection of training samples directly affects the overall accuracy of the final classification results. The more typical areas are selected for experiments to obtain appropriate parameters, so that the prediction of unknown samples can be more accurate. Compared with the types of features that can be seen with the naked eye in the image, it is obviously more difficult to select the training samples of landslide, because only selecting the typical landslide samples can correctly reflect the characteristics of landslide. Only then can the discrimination between landslide and other land types be further improved, and the prediction results can be more accurate. Secondly, when selecting training samples, too few samples will affect the final accuracy and reduce the training accuracy. If there are too many samples, it may not improve the accuracy, but increase the time. Therefore, the typicality and quantity of samples are extremely important.
2.5.4. Optimization of Feature Space
In practice, having too many classification indices leads to information redundancy and mutual interference, which is counterproductive to improving classification accuracy. The utilization degree of different classification indexes can be calculated using the Feature Space Optimization tool, allowing to find the best combination of spatial features, complete the simplification and redundancy of all types of selected classification features and achieve the best classification effect.
4. Analysis and Discussion on the Destructiveness and Cause of Landslide
The combination of several components causes landslides. The specific mechanism and how the procedure works are still unknown [
20]. Landslides are the most common and destructive natural hazard. They result in the loss of life and property, as well as harm to natural resources (for example, vegetation, land and soil) and the impediment of construction projects such as roads, bridges and communication lines [
20]. Aerial images have helped to alleviate some of these issues. With the advent of remote sensing and GIS technology, it is now possible to collect, alter and combine a range of spatial data from an area, such as geology, structure, surface cover, slope characteristics and so on, in a way that is useful for landslide characterization [
21,
22,
23,
24,
25].
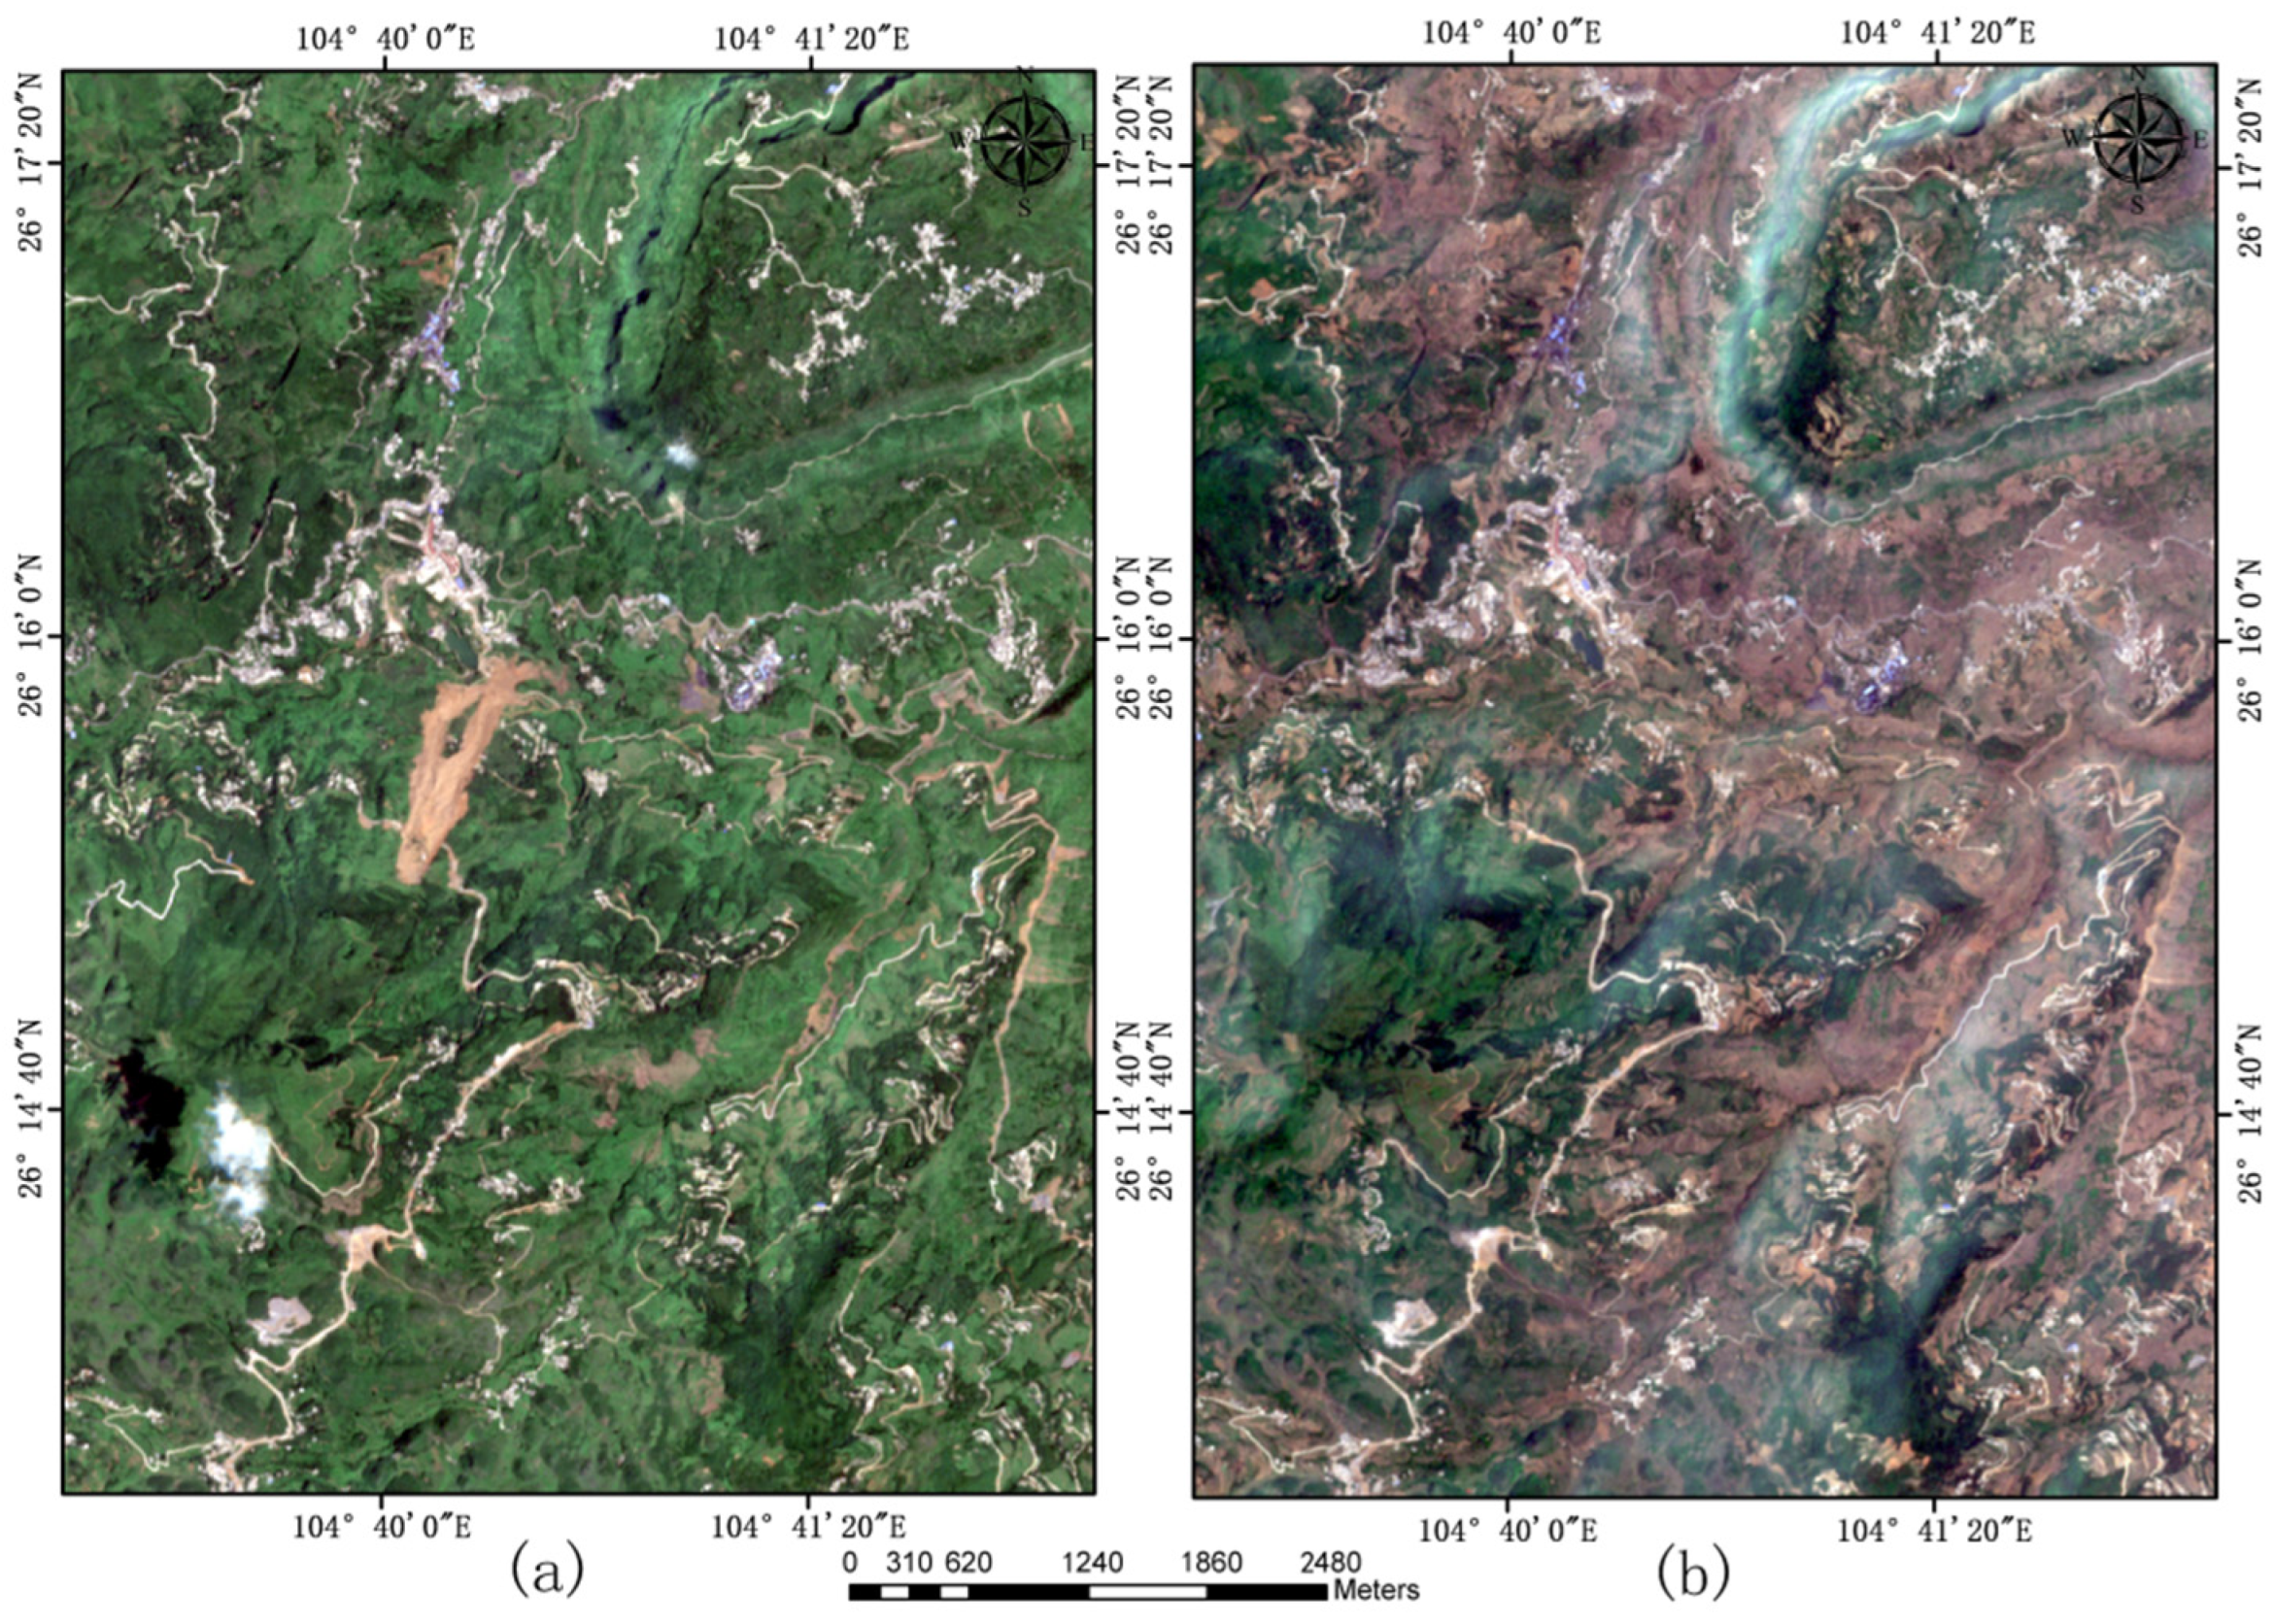
The occurrence of a landslide disaster in Shuicheng is caused by its unique terrain, extreme climate and man-made damage. The landslide will have a significant influence on agricultural and industrial development in the area, as well as on people’s living standards. The destructive area of the landslide is examined using the classification findings of the landslide before and after the occurrence. Before the landslide, the object-oriented technique is used to categorize the data fusion image, and the classification results are presented in
Figure 18. The confusion matrix is shown in
Table 6. The classification findings had a mapping accuracy of 0.75 and a Kappa coefficient of 0.6. Because human activities and subsequent deforestation have altered the stability of slopes, landuse/landcover exerts an influence over landslides and is considered second only to slope in importance. Slope modification occurs as a result of urban operations such as road widening and terrain leveling, resulting in a steep cut.
4.1. Landslide Destructiveness
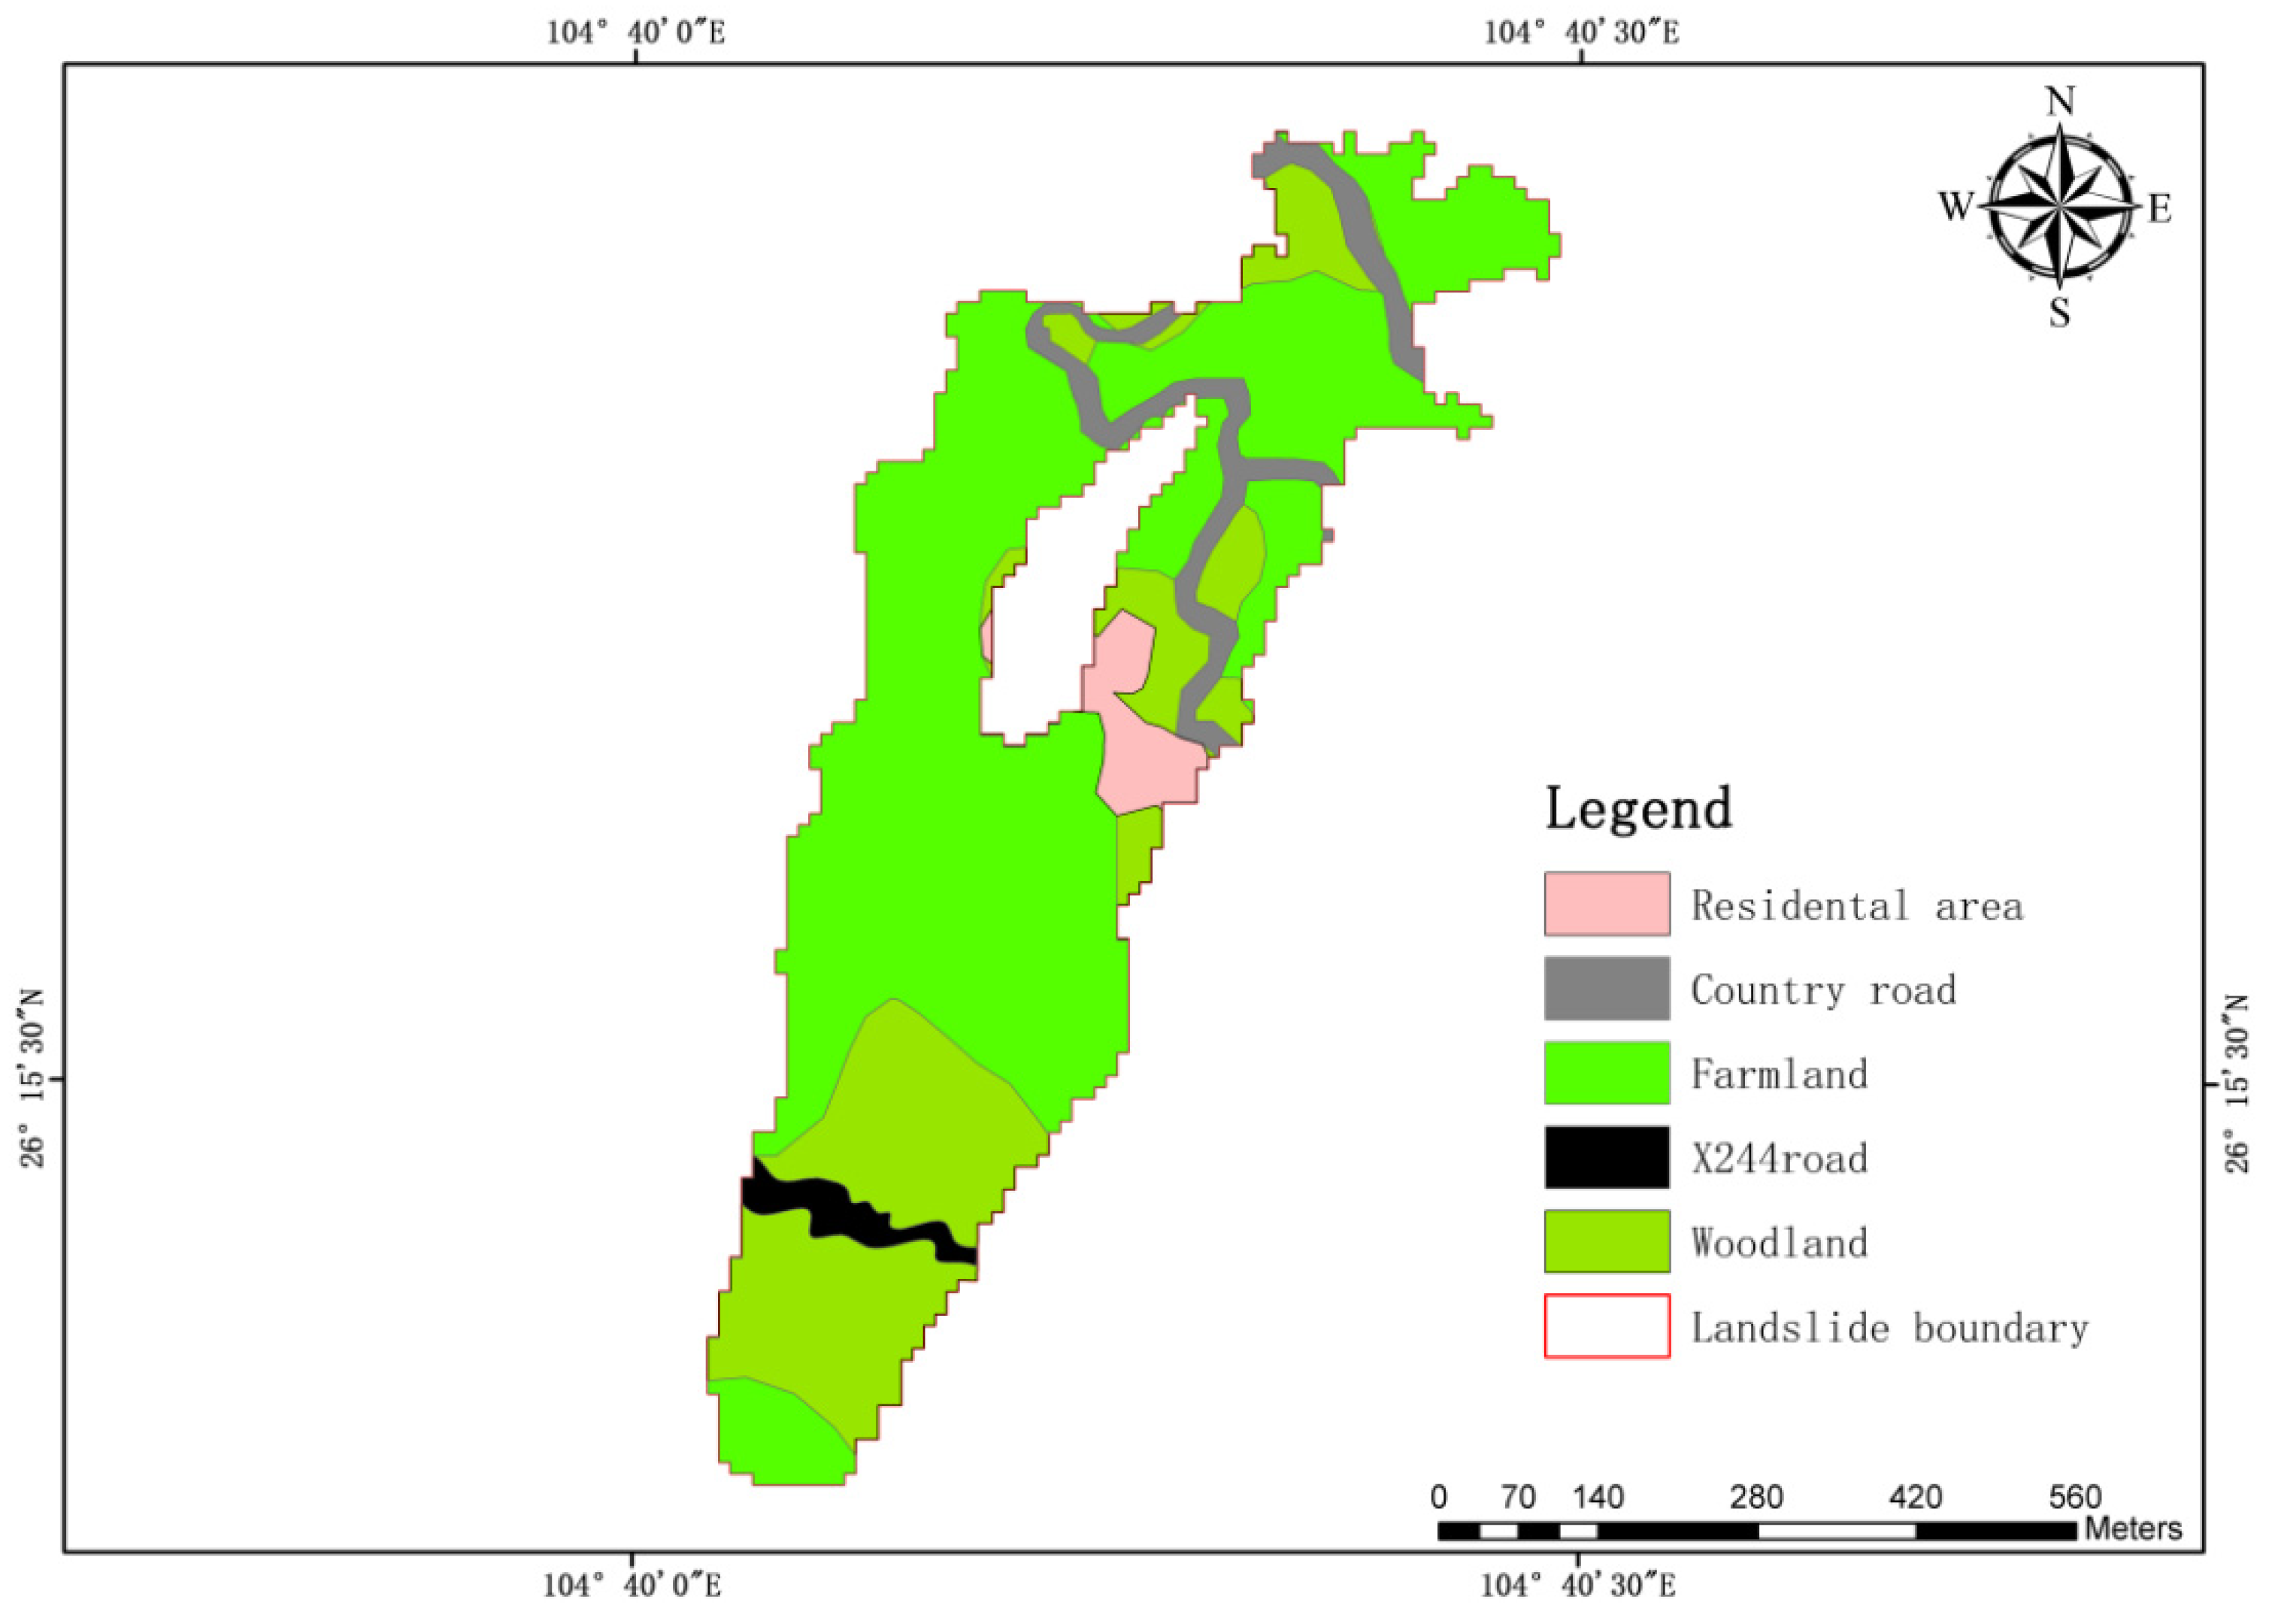
Taking the damage range of landslide mass as the boundary, the damaged features are extracted, as shown in
Figure 19. Based on the land use before landslide, combined with the extraction results of landslide and the land classification results after landslide, this paper makes a comprehensive analysis. After statistical analysis, the devastation to farmland is the most extensive, resulting in significant economic losses; the damage to the chicken farm rural houses and roads caused significant harm to villagers’ personal safety and property, culminating in the X244 highway being broken, obstructing residents’ travel. According to statistics (by superposition of landslide vector map and vector file of correlation quantity, the statistical result is obtained as shown in
Figure 20), farmland damage accounted for 56% of the overall landslide damage, while woodland damage accounted for 33%, residential area damage accounted for 3%, rural road damage accounted for 6%, and X244 highway damage accounted for 2%.
4.2. Landslide Causes
Before analyzing the causes of landslide, firstly, the spatial distribution of landslide location is studied and investigated, and then the whole sliding process of landslide is understood and analyzed in combination with relevant research data. On the basis of these two aspects, combined with the geological structure distribution of the landslide area, the geological causes of the landslide are discussed and analyzed. Combined with the precipitation data 14 days before the landslide, the driving effect of precipitation on the cause of landslide is analyzed and, finally, so too is the influence of human activities on the formation and occurrence of landslide.
4.2.1. Landslide Spatial Display
The basis of spatial data analysis is the expression and display of data. Three-dimensional displays provide users with a three-dimensional sense tube, which can supply researchers with information that two-dimensional visuals cannot, as well as boost their understanding and analysis abilities. The ASTER GDEM 30 m resolution digital elevation data is added to the elevation layer, and the Sentinel-2 (containing landslide) remote sensing image information is added to the texture layer. The data of each scene covers 1° of latitude and longitude, the horizontal and vertical accuracy of the data are 7~50 m, and the horizontal resolution is about 30 m. This part does not require high accuracy of DEM, and 30 m resolution DEM can achieve good results, which has been adopted. Using the perspective of the method, superposition together, both embody the elevation information and show the ground information, resulting in a two-dimensional image with a three-dimensional effect [
11].
The
Figure 21 shows a side view of the landslide. According to the occurrence conditions of landslide, first, there is a low and open sliding space in front of the slope, which aids the landslide’s fall. Second, cutting surfaces can be found on both sides of the slope. Slopes with weak compressive capacity, such as a fluffy broken soil layer, a broken rock soil layer and an exposed surface eroded by weathering, are prone to landslides. When the compressive strength of the mountain is high, it is difficult for landslides to occur; however, if the mountain has a sliding surface, it may lead to landslide in the face of continuous heavy rainfall [
24]. Flash floods from surrounding mountains are becoming more frequent, bringing massive amounts of loose material with them [
26,
27]. The landslide in Shuicheng County meets the geological conditions of landslide occurrence.
4.2.2. Sliding Process of Landslide
Among the classification schemes based on the specific characteristics of rock and soil movement process and material composition, the most representative is the classical classification system of Varnes (Varnes, 1978). Varnes divides the slope into collapse, toppling, sliding, lateral expansion, flow and composite movement [
28]. According to DEM data, the elevation of landslide (~1200 m–~1680 m), and the relative elevation from slope bottom to slope top is about 480 m. By querying relevant materials and reports, the landslide is a high-speed landslide with sudden characteristics. The mountain on the upper part of the Houshan slope in Jichang township became unstable and formed debris flow in late July 2019, due to prolonged severe rainfall. The debris flow then accelerated down the slope at a fast rate. It encountered a tiny ridge and split into two strands, producing a safety island in the middle, after sliding forward for more than 700 m. Both debris flows proceeded to slam against each other and scrape downward. Residential buildings on the safety island’s left side were hit and buried. Because it happened at night, it struck when the inhabitants were sleeping and spread quickly, killing a great number of people. Finally, at the bottom of the gentle slope, the two mud debris flows mixed and expanded in three directions, forming a debris accumulation area [
29].
Figure 22a depicts the landslide’s progression process.
The landslide may be separated into three sections based on its development process and visual characteristics: sliding source area, shovel scraping accumulation mixed area, and primary accumulation area [
29] (
Figure 22b).
The sliding source area is the landslide’s beginning, the debris flow’s generation area, and the landslide’s key area, which is located at the back of the landslide. The primary flow area of landslide debris flow, with fast flow speed and located in the middle of the landslide, is the shovel scraping accumulation mixing area. The accumulation area is the debris flow’s final accumulation area, which is located on the gentle slope at the landslide’s lower section and the flat or depression at the bottom. The velocity of the mud debris flow slows, the shoveling capacity drops dramatically, and the mud debris spreads and accumulates around [
30,
31,
32,
33].
4.2.3. Geological and Lithologic Factors
The permeability and strength of an area’s rocks and soil, and hence the landslides, are linked by geology and geomorphology [
34]. The data source is a composite image of the first three main components, and the research area’s remote sensing geological interpretation map is generated in conjunction with the Ecological Environment Map.
Figure 23 depicts the landslide and associated stratum distribution.
The plane of discontinuity marks lithological boundaries, which are often weak zones. They have an impact on the rock’s strength. The higher the density of geologic barriers, the more vulnerable the area is to landslides [
35]. Because different rock types and lithological units react differently to changes in the geomorphic process, permeability and strength of rocks and soils, bedrock geology plays an important role in landslide failure and distribution [
36,
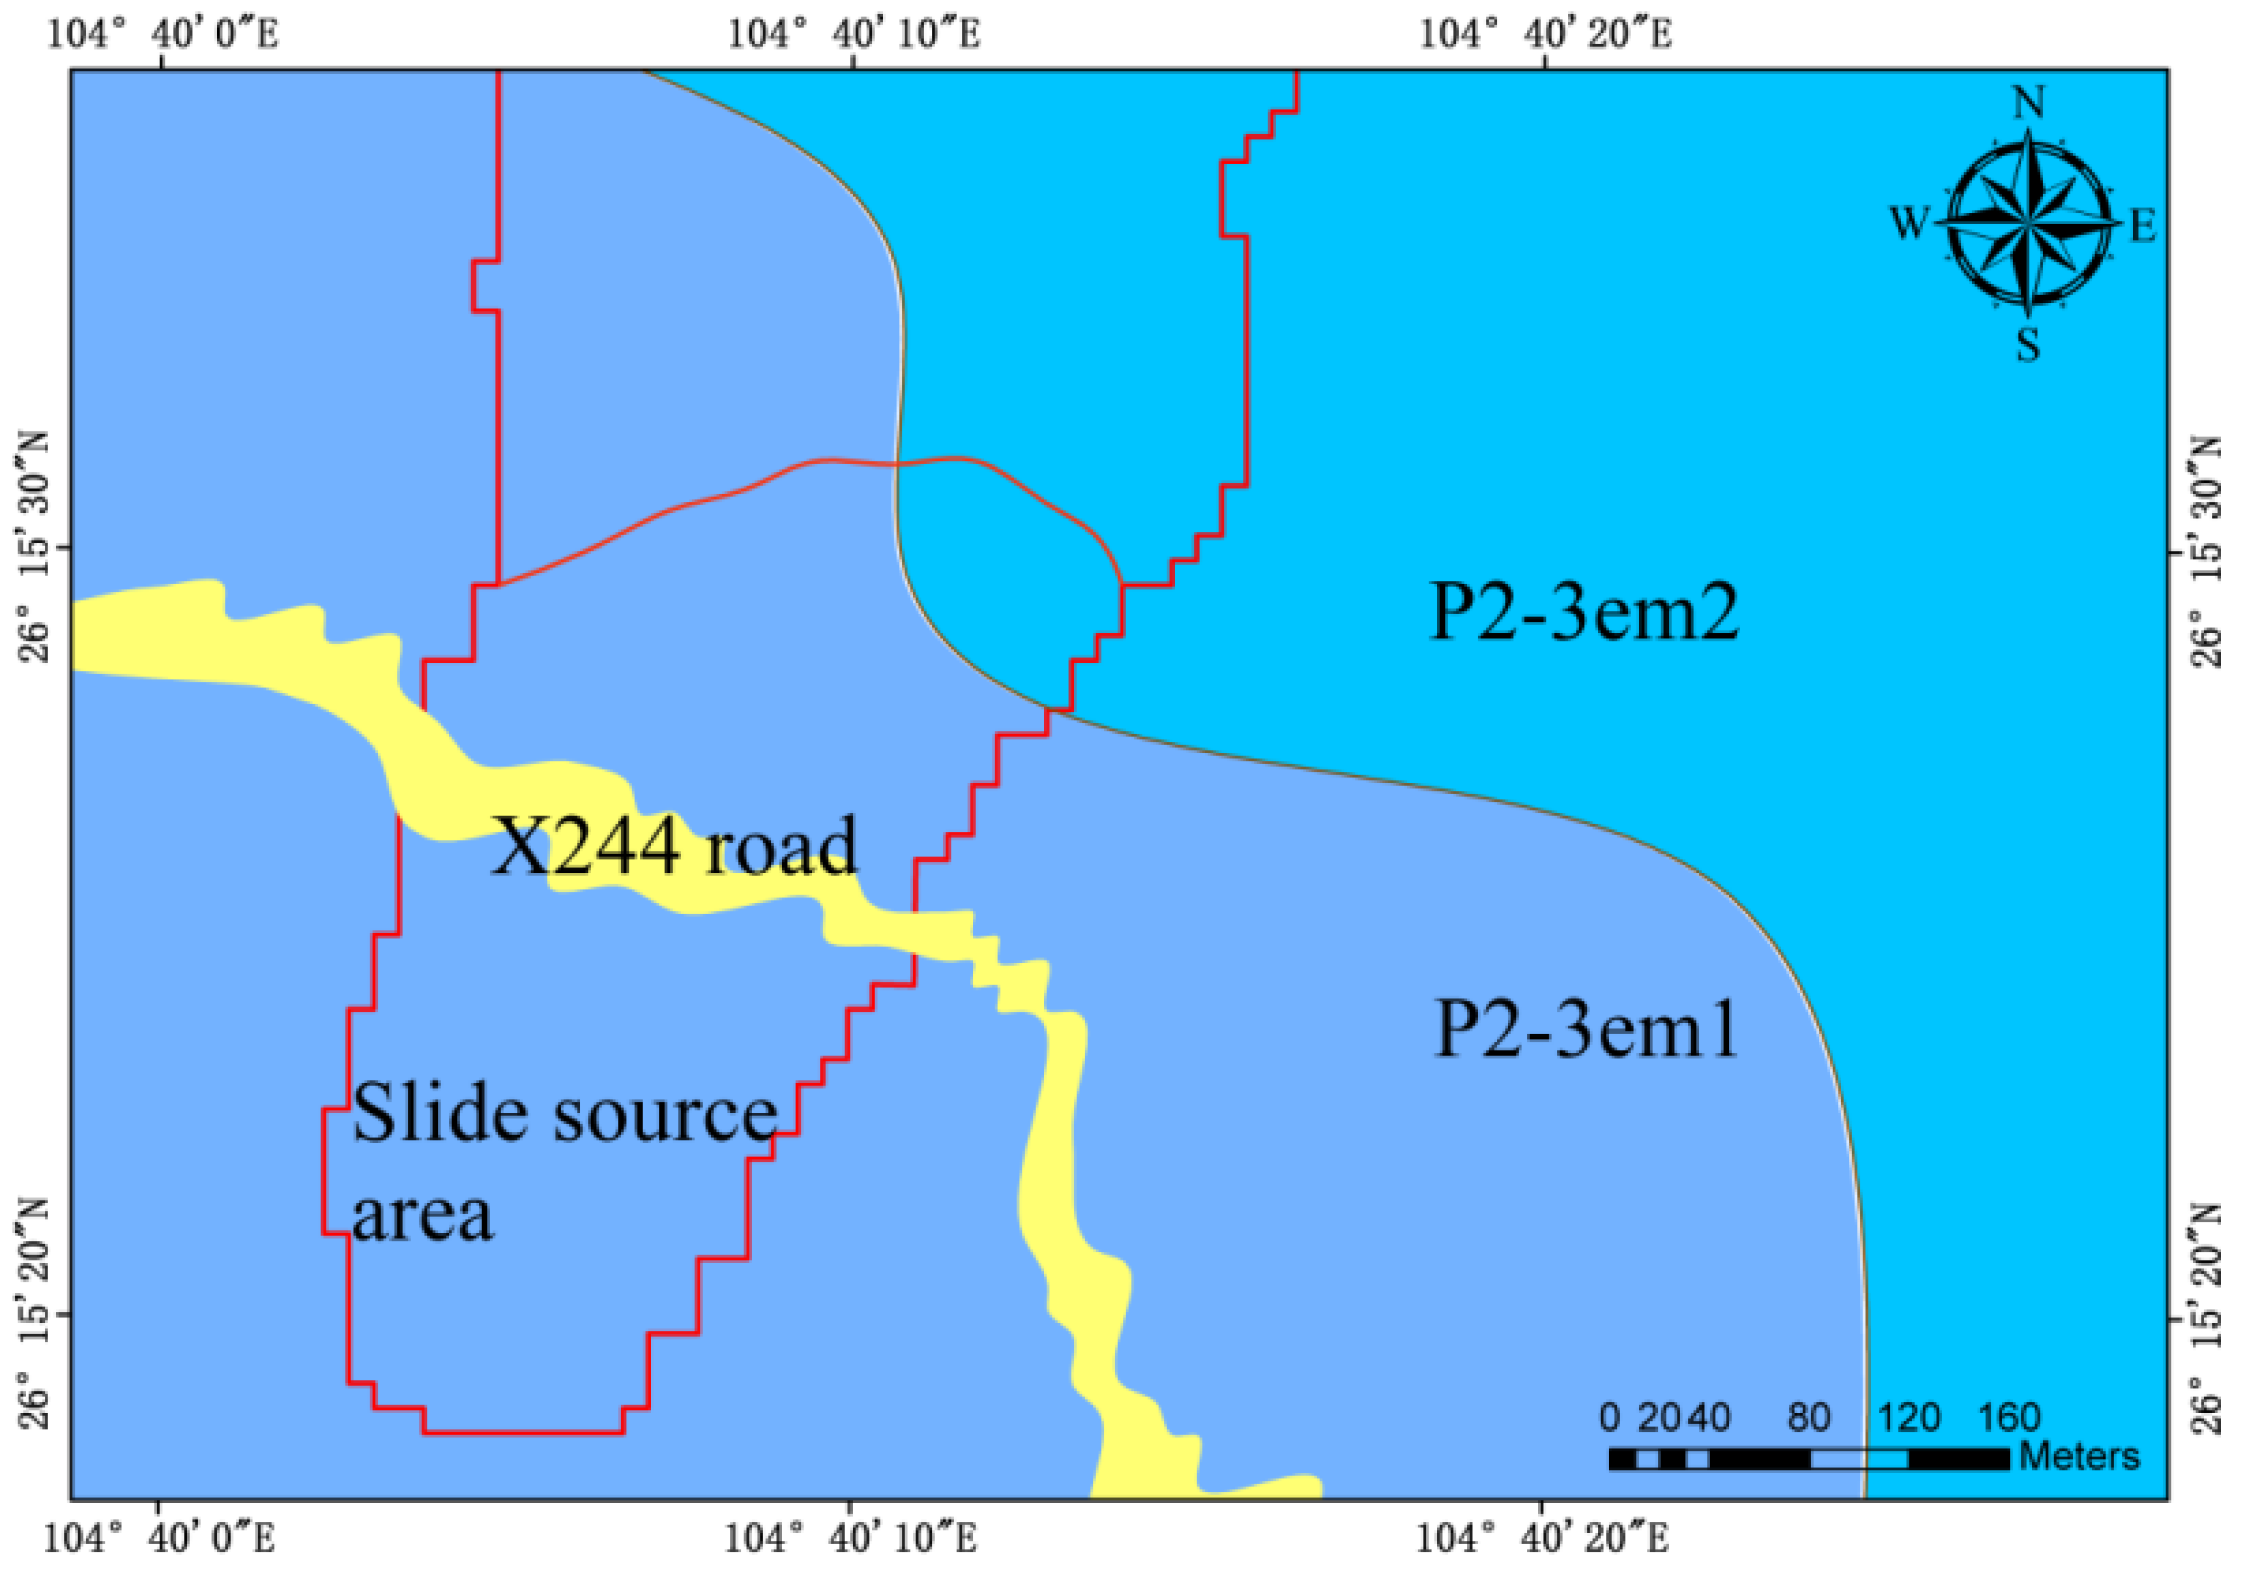
37]. The Jichang landslide is located on the slopes of the Middle Upper Permian Emeishan Basalt Formation (P2-3em) and the Upper Permian Xuanwei Formation(P3x), as shown in the
Figure 23. The landslide source area’s rock strata are mostly from the Middle Upper Permian Emeishan Basalt Formation’s first member (P2-3em1). The lithology of the Emeishan basalt formation is grayish white to yellowish brown quartz sandstone with different structures from loose to cataclastic. Basalt is the main rock type in the Emeishan basalt formation, with some siliceous rock and breccia in the lower section. Basalt is a type of magma that forms when crustal action causes volcanic eruptions [
38,
39,
40,
41]. It is a volcanic extrusive rock with a stomata-like structure. Its main geochemical components are SiO
2, Al
2O
3, Fe
2O
3, CaO and MgO, of which SiO
2 content is the most, accounting for about 45–50%. Emeishan basalt is mainly distributed in the adjacent areas of Yunnan, Sichuan and Guizhou provinces. It is divided into upper land (facies) and lower sea (facies), with multiple cycles central-fissure eruption-spill characteristics. The Emeishan basalt in this area is classified into the Upper Permian on the sequence.
Figure 24 shows rock specimens from the location of the landslide in the study area. It can be seen from this figure that the basalt is loose and porous, with a hard texture and is susceptible to weathering and erosion. The basalt bodies here are strongly weathered. After the basalt is fully weathered, the surface layer is clayed, and the shallow rock mass is cracked and fragmented. According to the investigation, the basalt weathering intensity varies greatly in different sections along X244 Highway, and some sections have a weak weathering degree and high weathering intensity, which can form steep slopes [
31]. However, the rock mass weathering zone near the slip source area is deep and strong, and the rock mass is generally in the shape of block cracks and open cracks, and the strength is low. Due to the repeated eruption and condensation of basalt rock mass and the influence of long-term geological tectonic movement, the rock mass develops structural planes such as joints, cleavages and cracks, resulting in relatively loose mountains with low overall shear strength, coupled with strong weathering, making the area more prone to landslide. Slope instability is influenced more by these structural discontinuities in proportion to the slope inclination [
42]. Fault lines show tectonic breaks, which reduce the rock’s strength. Landslides are more likely in areas closer to the faultline than in areas further away [
43].
4.2.4. Climate and Precipitation Factors
Rainfall intensity has a direct relationship with slope instability issues. As a result, the majority of landslides [
44,
45,
46,
47] occur during the rainy season. Rainfall can cause surface erosion as well as replenish groundwater, saturating the slope material in the process [
48]. The landslide area is located in the subtropical monsoon climate zone, with a warm and rainy climate. Precipitation in the landslide area is primarily concentrated from May to July, with precipitation ranging from 500 to 600 mm, accounting for around 62%of the year. The cumulative rainfall in the 30 days before the landslide reached 435 mm, according to the changing curve of rainfall in the 30 days before the landslide (
Figure 25), with the cumulative rainfall from 18 July to 23 July nearing 111 mm, and the rainfall reaching 47 mm the day before the landslide. The landslide occurred at 21:20 on 23 July as a result of the persistent heavy rain. Excessive rainfall can promote soil saturation, which can result in debris flow on these slopes [
49]. Rainwater infiltration into slope materials may recharge groundwater, affecting slope stability indirectly [
50]. Following the landslide, severe rains continued, exacerbating the severity of the disaster. As a result, it is clear that the landslide is exacerbated by the ongoing severe rainfall.
4.2.5. Human Activities
One of the most prominent triggering mechanisms is anthropogenic activities along the natural slope [
42]. By examining geomorphic responses to anthropogenic land cover changes, the study examined the impact of land use on triggering landslides. Settlement in hilly places resulted in changes in land use and pattern, which had unanticipated consequences in terms of causing landslides. Landslides pose a significant physical and environmental risk to communities in landslide-prone locations [
51]. Road construction, which can have a wide-ranging influence [
52,
53,
54] is one of the most common man-made activities that destabilize slopes in mountainous terrain. Slope cutting by mechanical methods or blasting, which is usually done in an unexpected manner, may be used in road construction [
55].
Road construction is the most common human activity in the chicken farm town. The “Jichang to Yingpan Highway Project,” on the other hand, has a clear link to landslide generation. The project entails the construction of the X244 county road, which runs from Jichang to Yingpan and passes through the landslide source area, as depicted in
Figure 26. In order to improve traffic flow, the highway’s landslide stretch was straightened, and the ridge was lowered by 10 m in 2019, as depicted in
Figure 27. The slope cutting of the X244 highway causes the increase of the dangerous area of the sliding surface, and also causes the position of the shear outlet of the sliding surface to move upward to the slope toe of the highway slope, but the change range is small. It reduces the safety factor of slope land from 1.032, which is basically stable, to 0.997, which is unstable [
29]. This is one of the major inducements for the landslide to occur.
5. Conclusions
A detailed assessment of landslides in the Shuicheng county of Liupanshui city, Guizhou province, China was carried out in this study. These landslides were triggered by a combination of geological, lithological, rainfall and anthropogenic events. This study suggests that landslide characterization is mostly determined by a mix of geoenvironmental circumstances, such as geology, geomorphology, as well as land cover, climatic factors, human disturbances and other factors. The Sentinel-2 remote sensing image and the GF-1 remote sensing image were used in this paper to extract the landslide, classify the terrain cover around the landslide and assess the landslide’s destruction, and were combined with the analysis of various factors to investigate the causes of the landslide.
Three image enhancement approaches were utilized to give data support for the development of geological interpretation maps, provide reference for object-oriented landslide extraction, and help to extract fault lines more clearly, including band synthesis, principal component analysis and filtering. Remote sensing images with different satellites, different resolutions and different bands were used for fusion, resulting in fusion images with multiple bands and high resolution, which increased the operability of classification. This paper attempted to interpret the geological situation by combining the principal component analysis method with the geological thematic map. Through object-oriented landslide extraction and surrounding area classification, combined with local geological and climatic conditions, the causes and damage of landslide were analyzed.
Through object-oriented classification and extraction of remote sensing images before and after the occurrence of a landslide, the shape (tree root type), constituent elements (composed of landslide mass, sliding surface and sliding bed) and the damage degree of the landslide (remote sensing area estimation) were analyzed and studied, so as to provide data support and a theoretical basis for further analysis of landslide causes. There are still many improvements in the process of object-oriented landslide extraction, in the process of selecting the optimal segmentation scale, including further refining the details of the process by, for example, reducing the test scale, so as to obtain a more accurate segmentation scale. In the selection of features, more new features can be considered.
Combined with the spatial distribution and sliding process of landslide, the causes of landslide were analyzed. There are three reasons for the formation of landslides in Shuicheng County, according to the findings. First, the landslide area’s geological lithology is basalt, with joint, cleavage and fissure development, and low overall shear strength. Second, torrential rain fell continuously in Jichang town prior to the landslide, acting as an external influence that aided the landslide. Third, the construction of the X244 highway diminishes the slope’s skid resistance and accelerates the landslide tendency.
Due to the limitation of my own specialty, I have insufficient understanding of geological genesis and geological structure. In the process of analysis, the geological genesis analysis of landslide is not sufficient and accurate. I hope to improve these aspects in future research.
In the current research, it has been focused to improve each step of treatment, optimize the test process, improve the accuracy of classification, and explore the causes of landslide more deeply. It provides a reference for other landslide extraction and analysis. At the same time, it also provides a basis for extracting geological hazards such as karst depression and collapse.


 ,
, 


