Article

Response of Vegetation to Different Climate Extremes on a Monthly Scale in Guangdong, China

1
College of Agriculture, South China Agricultural University, Guangzhou 510642, China
2
Faculty of Veterinary and Agricultural Sciences, University of Melbourne, Melbourne, VIC 3010, Australia
*
Author to whom correspondence should be addressed.
These authors contributed equally to this work.
Remote Sens. 2022, 14(21), 5369; https://doi.org/10.3390/rs14215369
Submission received: 21 September 2022 / Revised: 20 October 2022 / Accepted: 24 October 2022 / Published: 26 October 2022

Abstract

:
Climate extremes, particularly drought, often affect the ecosystem. Guangdong Province is one of the most vulnerable areas in China. Using the normalized difference vegetation index (NDVI) to capture vegetation dynamics, this study investigated vegetation responses to drought, temperature, and precipitation extremes on a monthly scale in the vegetation area of Guangdong without vegetation type changes from 1982 to 2015. As extreme temperatures rose, a drought trend occurred in most months, with a higher rate in February and April. The vegetation evenly showed a significant greening trend in all months except June and October. The vegetation activity was significantly positively correlated with the increased extreme temperatures in most months. However, it exerted a negative correlation with drought in February, April, May, June, and September, as well as precipitation extremes in February, April, and June. The response of vegetation to drought was the most sensitive in June. The vegetation tended to be more sensitive to short-term droughts (1–2 months) and had no time lag in response to drought. The results are helpful to provide references for ecological management and ecosystem protection.

1. Introduction

Vegetation, the plant community covering the ground’s surface, is an irreplaceable component of terrestrial ecosystems and is very sensitive to climate change [1,2]. Changes in vegetation can alter the ecology and reflect natural evolution [3,4,5]. Climate extremes have profound impacts on ecosystems and vegetation patterns, such as productivity reduction and ecosystem degeneration [6,7,8,9,10,11,12,13,14,15]. Among all climate extremes, drought is the most common natural hazard that occurs owing to an imbalance between precipitation and high temperatures [16,17]. The variability of climate extremes has great spatial inhomogeneity [18,19,20]. In the few past decades, high-temperature extremes mostly showed an increasing trend in China, while precipitation extremes showed various trends in different directions [21]. Drought has become increasingly severe since the late 1990s in China [22]. Areas affected by drought have doubled in China during the last three decades [23]. Understanding the vegetation response to climate extremes can help evaluate hydrological and ecological responses, identify the most vulnerable ecosystems, and guide adaptation decisions [8,19,20,24]. Therefore, it is important to study the variations in vegetation dynamics and their responses to climate extremes.
The influence of climate extremes on vegetation dynamics differs in different regions [5,13,25]. Extreme temperature shows a complex effect on vegetation in China [26]. Extreme precipitation generally promotes vegetation growth in most arid areas of China but inhibits it in humid areas [26,27]. Water shortage caused by drought can trigger leaf damage and substantial reductions in ecosystem productivity [7,10]. Vegetation recovery is usually slow after severe damage [8]. The effect of drought on terrestrial ecosystems is becoming increasingly acute and will worsen and intensify with global warming [28]. Thus, the response of vegetation to climate extremes, especially drought, is a crucial scientific issue in regions sensitive to climate warming [29].
The normalized difference vegetation index (NDVI) has been widely used to represent vegetation coverage and investigate vegetation responses to climate extremes [13,26,30,31,32,33]. An increase in NDVI generally indicates enhanced vegetation growth, whereas a decrease in NDVI displays reduced vegetation growth. Many studies investigated the spatial heterogeneity of the NDVI trends in different regions, pointing out that the NDVI has been increasing in recent years in China at both the national and regional scales [34]. Nevertheless, due to uneven changes in the NDVI in different growing periods [19,35], the analyses focusing only on the annual or longer scales rather than the monthly scale are insufficient to reflect variations in the NDVI.
In addition, many studies respectively identified the temporal differences in vegetation responses to climate extremes, as well as different time-lag effects in different spaces [8,19,34,35,36]. The timescales at which different plants respond to drought can also be substantially different [8]. Temperature and water requirements of vegetation vary in different months [29], and the influence of extreme factors on vegetation differs in different growing periods [35,37]. In terms of exploring the relationship between vegetation dynamics and climate extremes, the analysis on a monthly scale is more helpful to understand the main limiting factors of vegetation growth than that on a longer time scale [35,37]. Hence, it is of great significance to study this relationship on a monthly scale.
Guangdong Province, one of China’s southernmost provinces, is a typical subtropical monsoon region. Strong monsoon, uneven terrain, dense river net, and negative effects of erosion and deposition have resulted in Guangdong being one of the most vulnerable areas to climate change. Vegetation is a significant ecological barrier in Guangdong. Extreme temperature and precipitation indices in Guangdong were much higher than those in most areas of China [38]. The fragile environment makes it vitally important to understand the impact of climate extremes on vegetation in this region. Some studies have addressed the influences of mean climate variations and anthropogenic activities on vegetation in Guangdong [39,40]. Nevertheless, the impacts of climate extremes, especially drought, on vegetation dynamics remain unclear in Guangdong.
A monthly scale analysis is essential for the vegetation variations and their responses to different climate extremes (temperature and precipitation extremes, and drought) in Guangdong. This kind of study can determine the critical period and the sensitivity of vegetation responses to climate extremes, and provide knowledge for meteorological disaster forecasts, vegetation conservation, and ecosystem restoration in both Guangdong and other similar regions. Considering the different climate extremes and focusing on the effect of drought during 1982–2015, this study tried to identify the leading extreme indicators driving vegetation changes in each month, the most sensitive months, and the drought timescales at which vegetation highly responded to drought in the vegetation area of Guangdong.

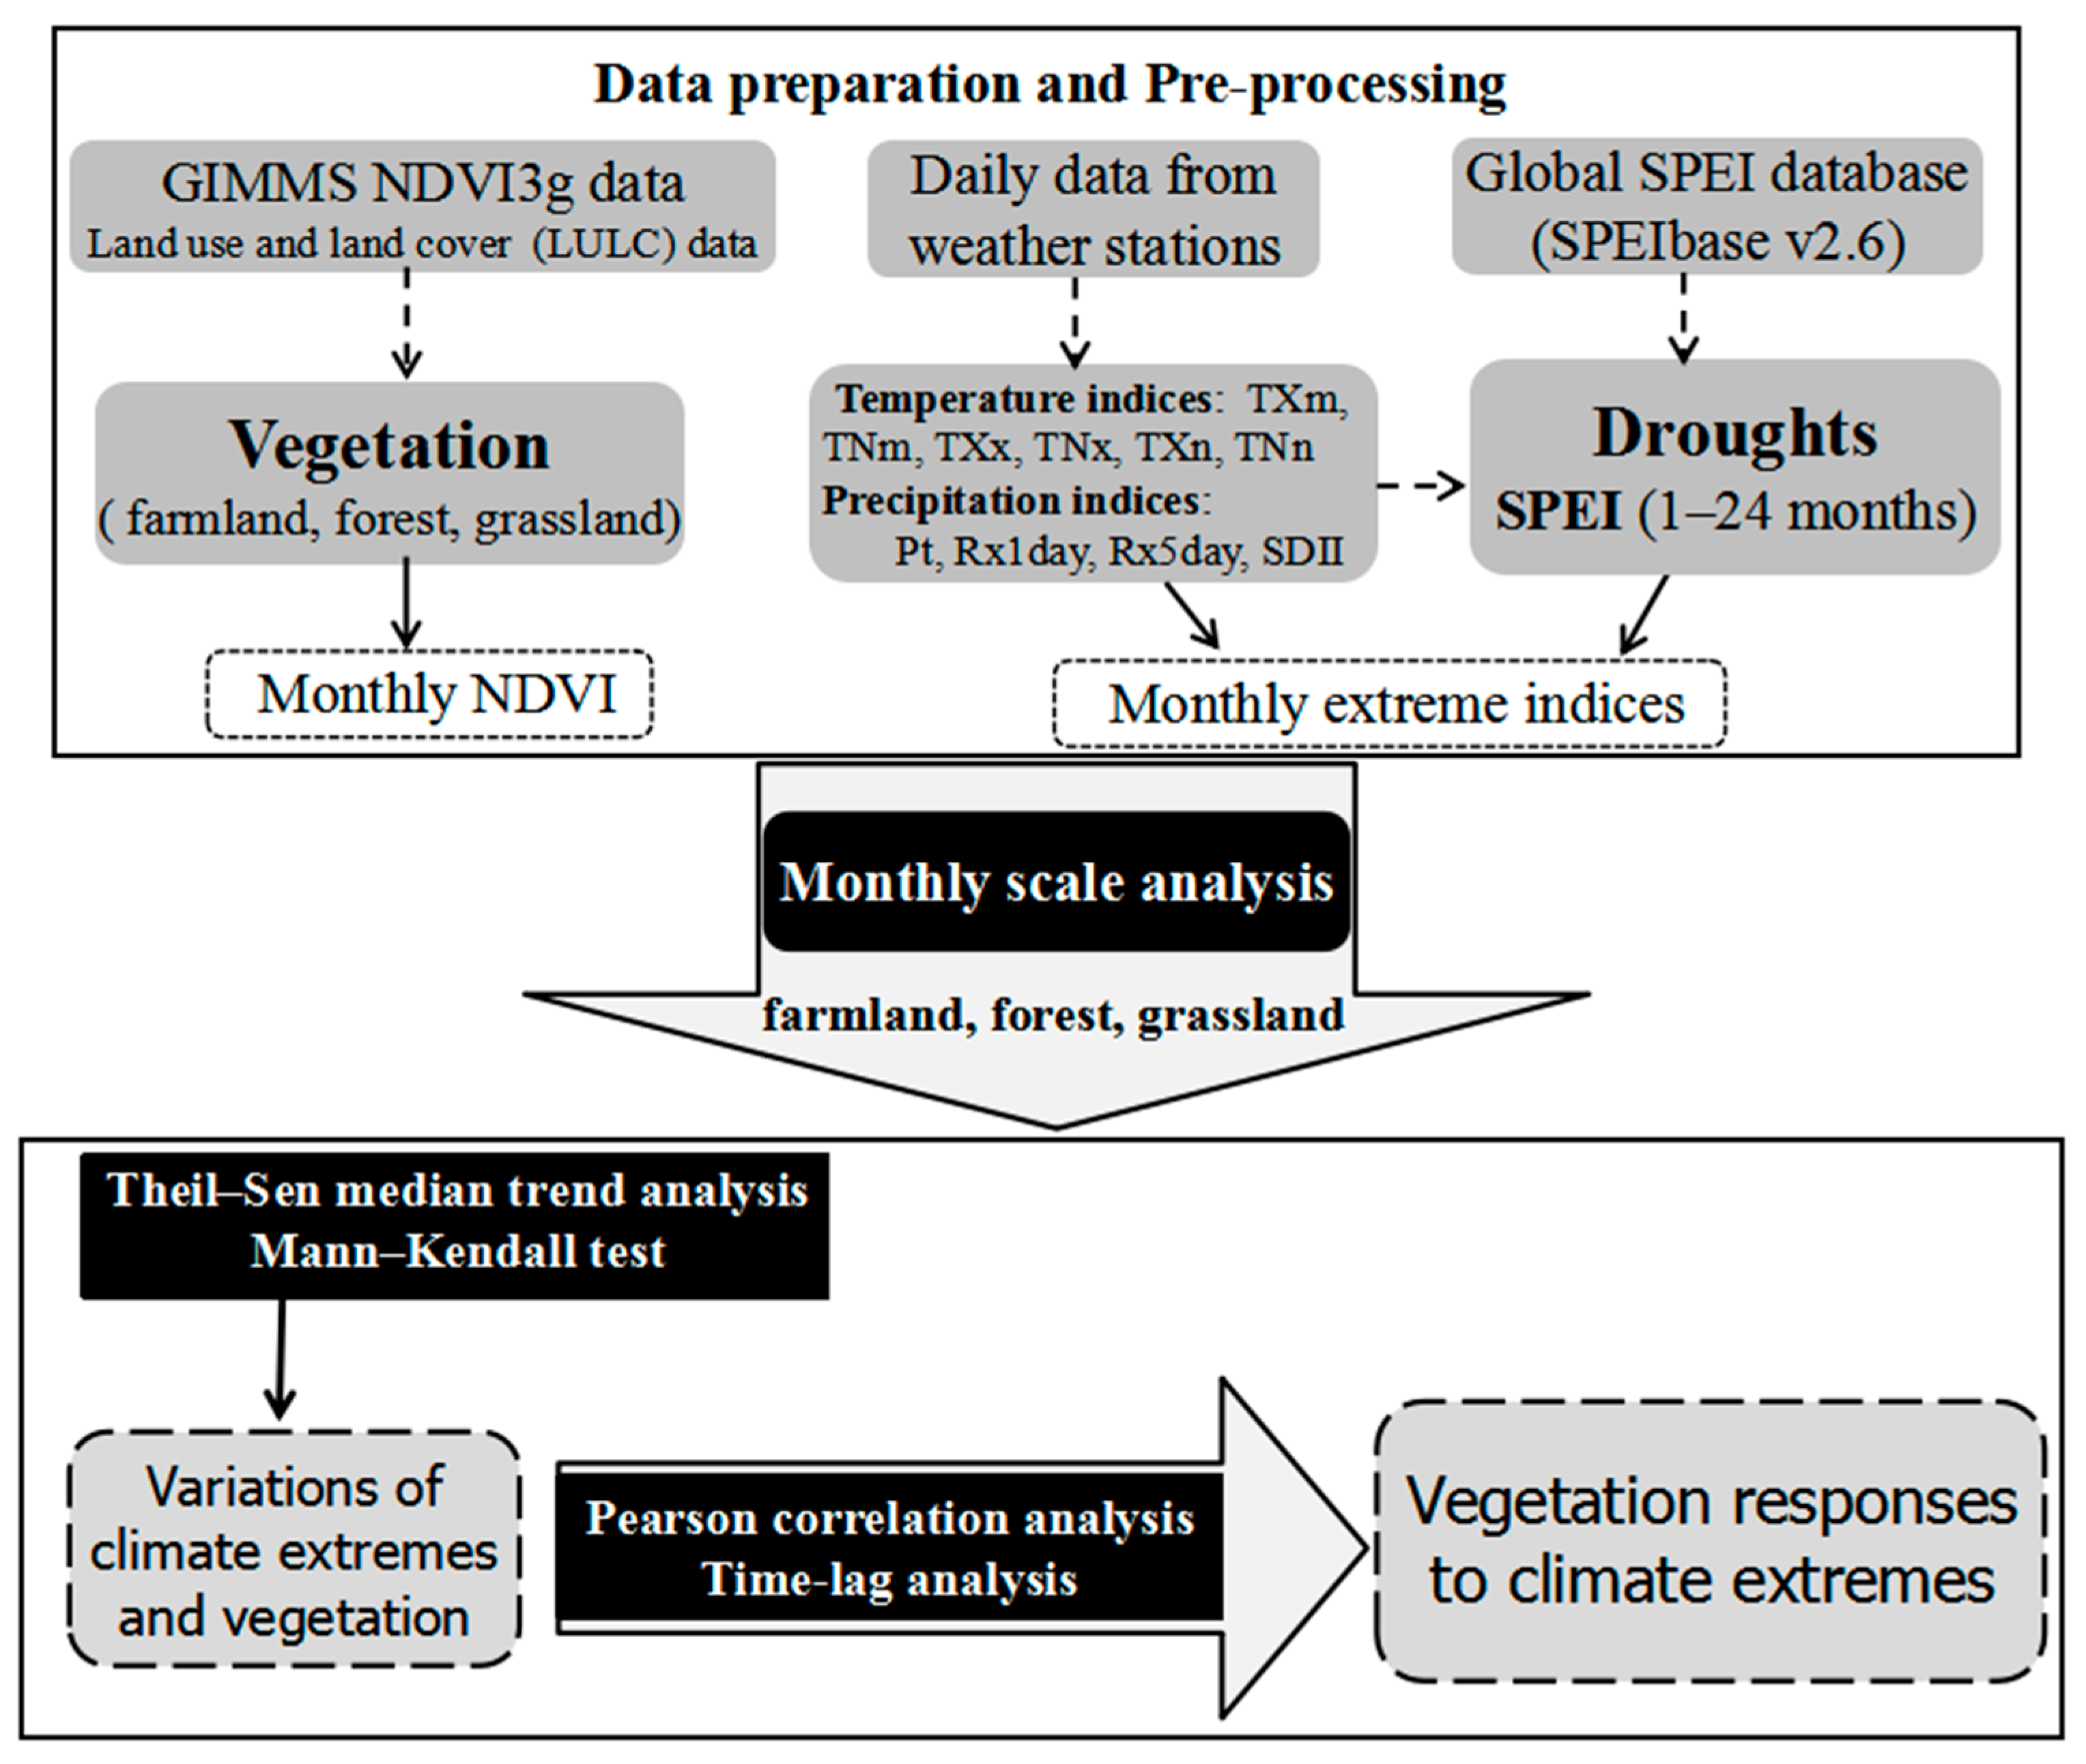
2. Materials and Methods

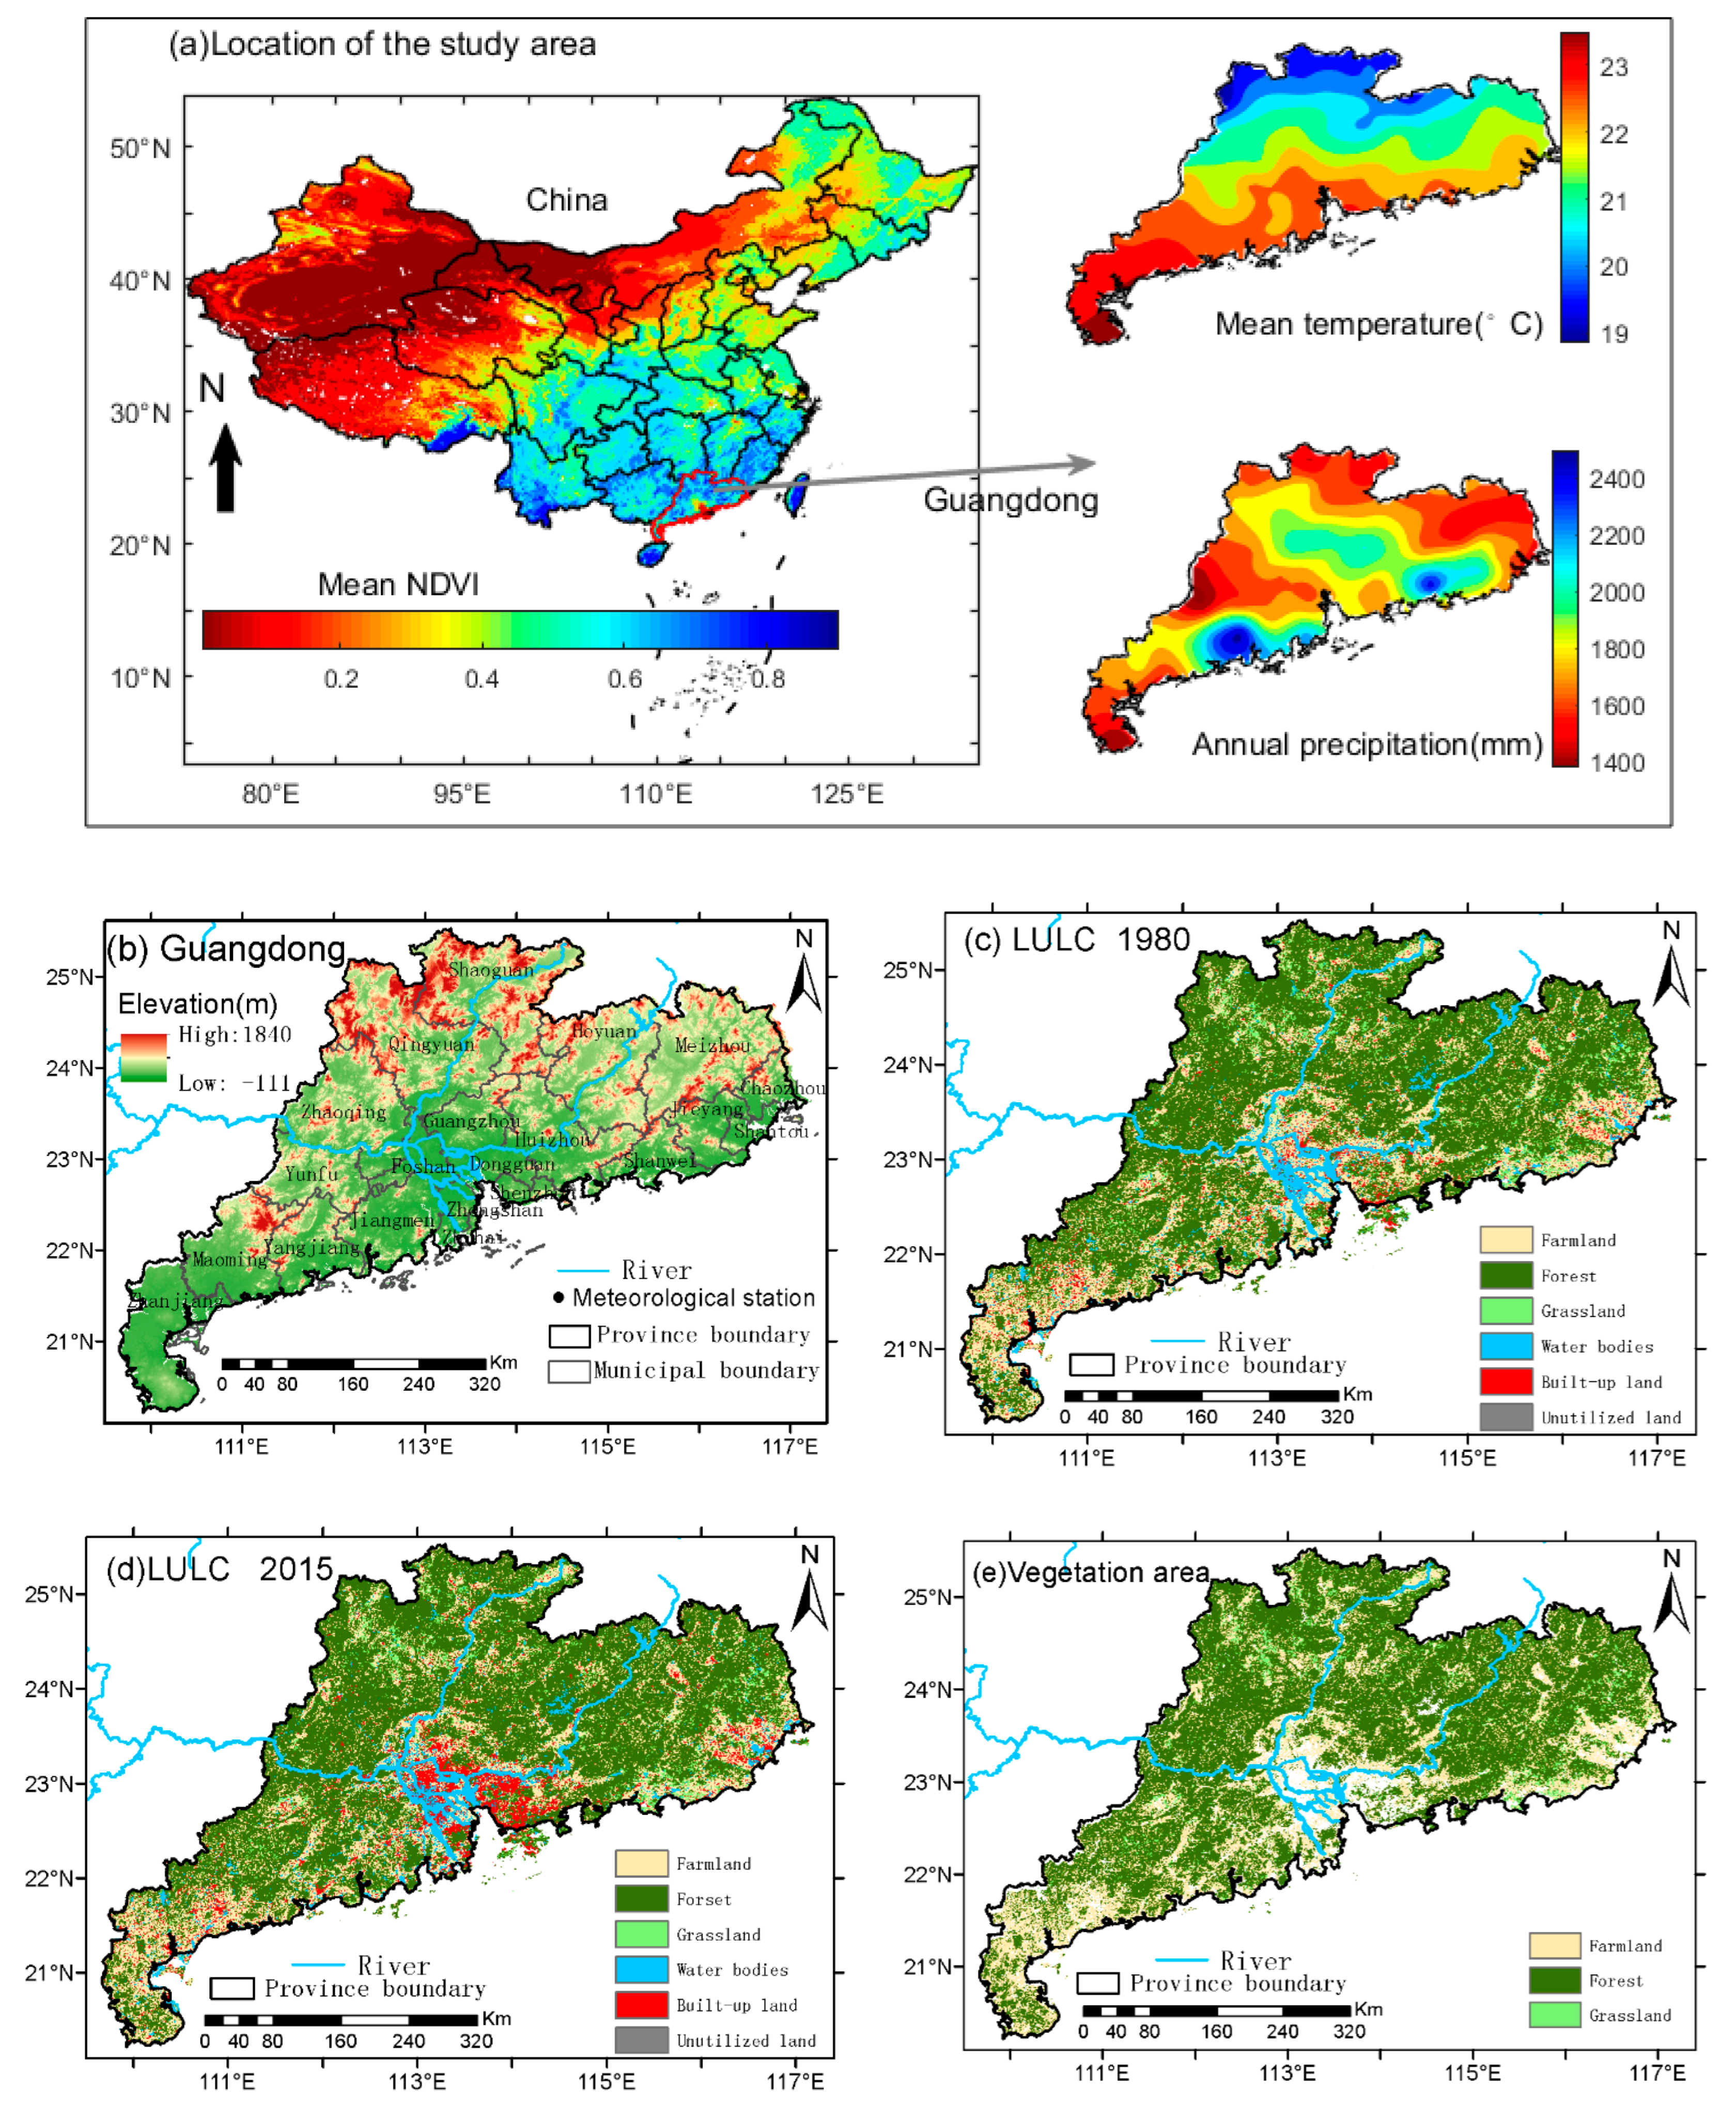
2.1. Study Area and Data

Figure 1 shows the geographic location of Guangdong. As the largest province in the southern coastal area of China, Guangdong has a subtropical monsoon climate with an average temperature of around 21 °C and annual total precipitation of approximately 1800 mm (Figure 1a). Guangdong usually experiences wet conditions from April to September and arid conditions from November to January. It is an important crop production base in China, and its main crops include rice, vegetables, peanuts, tuber crops, sugar cane, corn, and soybeans. In view of a strong monsoon climate, uneven terrain, and dense river net, Guangdong is vulnerable to climate change.
Table 1 shows the datasets used in this study. The daily maximum temperature (TX), daily minimum temperature (TN), and daily precipitation data were obtained from the China Meteorological Administration (http://data.cma.cn/ (accessed on 15 October 2019)). This study selected 85 meteorological stations with high quality data records. Based on the climate characteristics of Guangdong (a subtropical monsoon climate with generally warm temperature and sufficient rainfall) (Figure 1a), this study selected six extreme temperature indices and four extreme precipitation indices from the Expert Team on Climate Change Detection and Indices (ETCCDI) [41] to reflect the frequency and intensity of temperature and preconception extremes (Table 2).
The standardized precipitation evapotranspiration index (SPEI), which is sensitive to temperature and precipitation, integrates the effect of evapotranspiration and precipitation. The SPEI is a standardized metric that allows comparisons across regions [42] and can indicate drought on multiple timescales [43]. Meanwhile, it is advantageous in quantifying drought compared with many other drought indices (i.e., the standardized precipitation index and the Palmer drought severity index) and studying responses of vegetation to drought [8,19,29,44,45]. The Global SPEI database (https://spei.csic.es/database.html (accessed on 15 October 2021)) has been widely used worldwide [8,29,44]. Therefore, the SPEI from 1-month scale to 24-month scale obtained from the Global SPEI database (SPEIbase v.2.6) was chosen to characterize drought in this research. The SPEI values less than or equal to –0.5 indicate drought conditions.
The land use and land cover (LULC) data and the digital elevation data were obtained from the Resource and Environment Science and Data Center, Chinese Academy of Sciences (https://www.resdc.cn/ (accessed on 10 October 2021)). The sub-regions of the three vegetation types (farmlands, forests, and grasslands) were extracted from the LULC data (Figure 1c–e). This study only analyzed the vegetation areas that did not change in vegetation type from 1982 to 2018 to avoid the impact of land use and land cover change, and, therefore, excluded urban, water, and barren areas from the spatial analysis.
At present, although a series of vegetation indices, such as the NDVI, the vegetation condition index (VCI), and the vegetation health index (VHI), have been developed to reflect changes in vegetation activities [46], the NDVI is still a good indicator when dealing with vegetation coverage and greenness in China and many other regions [13,26,29,30,31,32,33]. Thus, the NDVI was employed as an indicator to monitor vegetation dynamics in this work. This study used the NDVI remote sensing data from the Global Inventory Monitoring and Modeling Studies (GIMMS) NDVI3g dataset [47], which originated from the advanced very-high-resolution radiometer sensors of the National Oceanic and Atmospheric Administration (https://www.nasa.gov/nex (accessed on 1 January 2021)). The GIMMS NDVI3g dataset has been corrected to remove non-vegetation effects, such as atmospheric attenuation, cloud cover, volcanic aerosol, radiometric calibration, sensor degradation, view, and illumination geometry [48]. Although the spatial resolution of the GIMMS NDVI3g dataset is relatively low, the GIMMS NDVI3g dataset has the longest time series (1982–2015). The dataset has been verified to be reliable through comparisons with ground-based validations or other NDVI products [49,50] and possesses sufficient quality in identifying vegetation dynamics and its relationship with climate indices [47,51]. Considering the above, this study used the GIMMS NDVI data directly. The monthly NDVI values were obtained using the maximum-value composites (MVCs) method.

2.2. Methods

Since the GIMMS NDVI3g dataset only covers data from 1982 to 2015, this research conducted the analysis based on the data of this period. The flowchart of this study is illustrated in Figure 2. All climate indices were generally calculated on a monthly scale. The climate data of the meteorological stations were resampled to a spatial resolution of 1/12° to spatially match the NDVI dataset via the kriging method. Additionally, the SPEI data were rescaled to the spatial resolution of the NDVI dataset by the bilinear interpolation method. The Theil–Sen (TS) median trend analysis method has low sensitivity to both the influence of missing time series observations and the outliers in the time series [52]. Consequently, in this study, the TS slope estimator was used to explore the variation rate β within the time series and calculated using Equation (1):
β = Median [ x i x j i j ]   for   all   j < i ,   1 < j < i < n
where β is the variation rate within the time series; n is the number of years (equal to 34 in this study); i and j are the ordinal numbers of years; xi and xj are the sequential data at times i and j, respectively. A positive β-value indicates an upward trend, and vice versa. β = 0 means no change.
Since the Mann–Kendall (MK) test [53] does not require the data to be distributed normally or linearly, in this study the MK trend test was used to detect significant trends. Pearson correlation analysis was applied to investigate the strength of the correlations between extreme indices and vegetation dynamics. The significance level of p = 0.05 was used as the threshold to distinguish significance. In addition, this research analyzed the time-lag effects of climate extremes on vegetation. The time lag for a climate index was defined as the number of months after which the vegetation showed the strongest significant correlation with this climate index [17,36,54]. The time lag is generally shorter than six months [36,54]. Thus, this paper only took into account time lags of 0–6 months.
The SPEI time series for different timescales represent the cumulative water balance over the previous corresponding number of months [8]. For each pixel, this study calculated the maximum value (Rmax) of the correlation coefficient between the monthly NDVI series (Jan–Dec) and the different timescales SPEI (from 1-month scale to 24-month scale).
R i , j = c o r ( N D V I i , S P E I i , j )   for   all   1 i 12 ,   1 j 24
R m a x = max 1 i 12   ,   1 j 24 ( R i , j )
where i is the ith month, ranging from 1st to 12nd month; j is the SPEI timescale, ranging from 1 to 24 months; N D V I i is the NDVI series of ith month; S P E I i , j is the ith month SPEI with the timescale of j months; R i , j is the correlation coefficient between N D V I i   and   S P E I i , j ; Rmax is the maximum correlation coefficient, indicating the strength of drought impacts on vegetation.
The month corresponding to Rmax is the sensitive month, indicating the period when vegetation is the most sensitive to drought. The SPEI timescale corresponding to Rmax indicates the dominant drought timescale, representing the speed at which vegetation responds to drought. The longer sensitive timescale implies a slower vegetation response and a stronger vegetation resistance or resilience, partly indicating the low sensitivity of vegetation to drought. On the contrary, the shorter timescale demonstrates the higher sensitivity of vegetation to drought [29].

3. Results

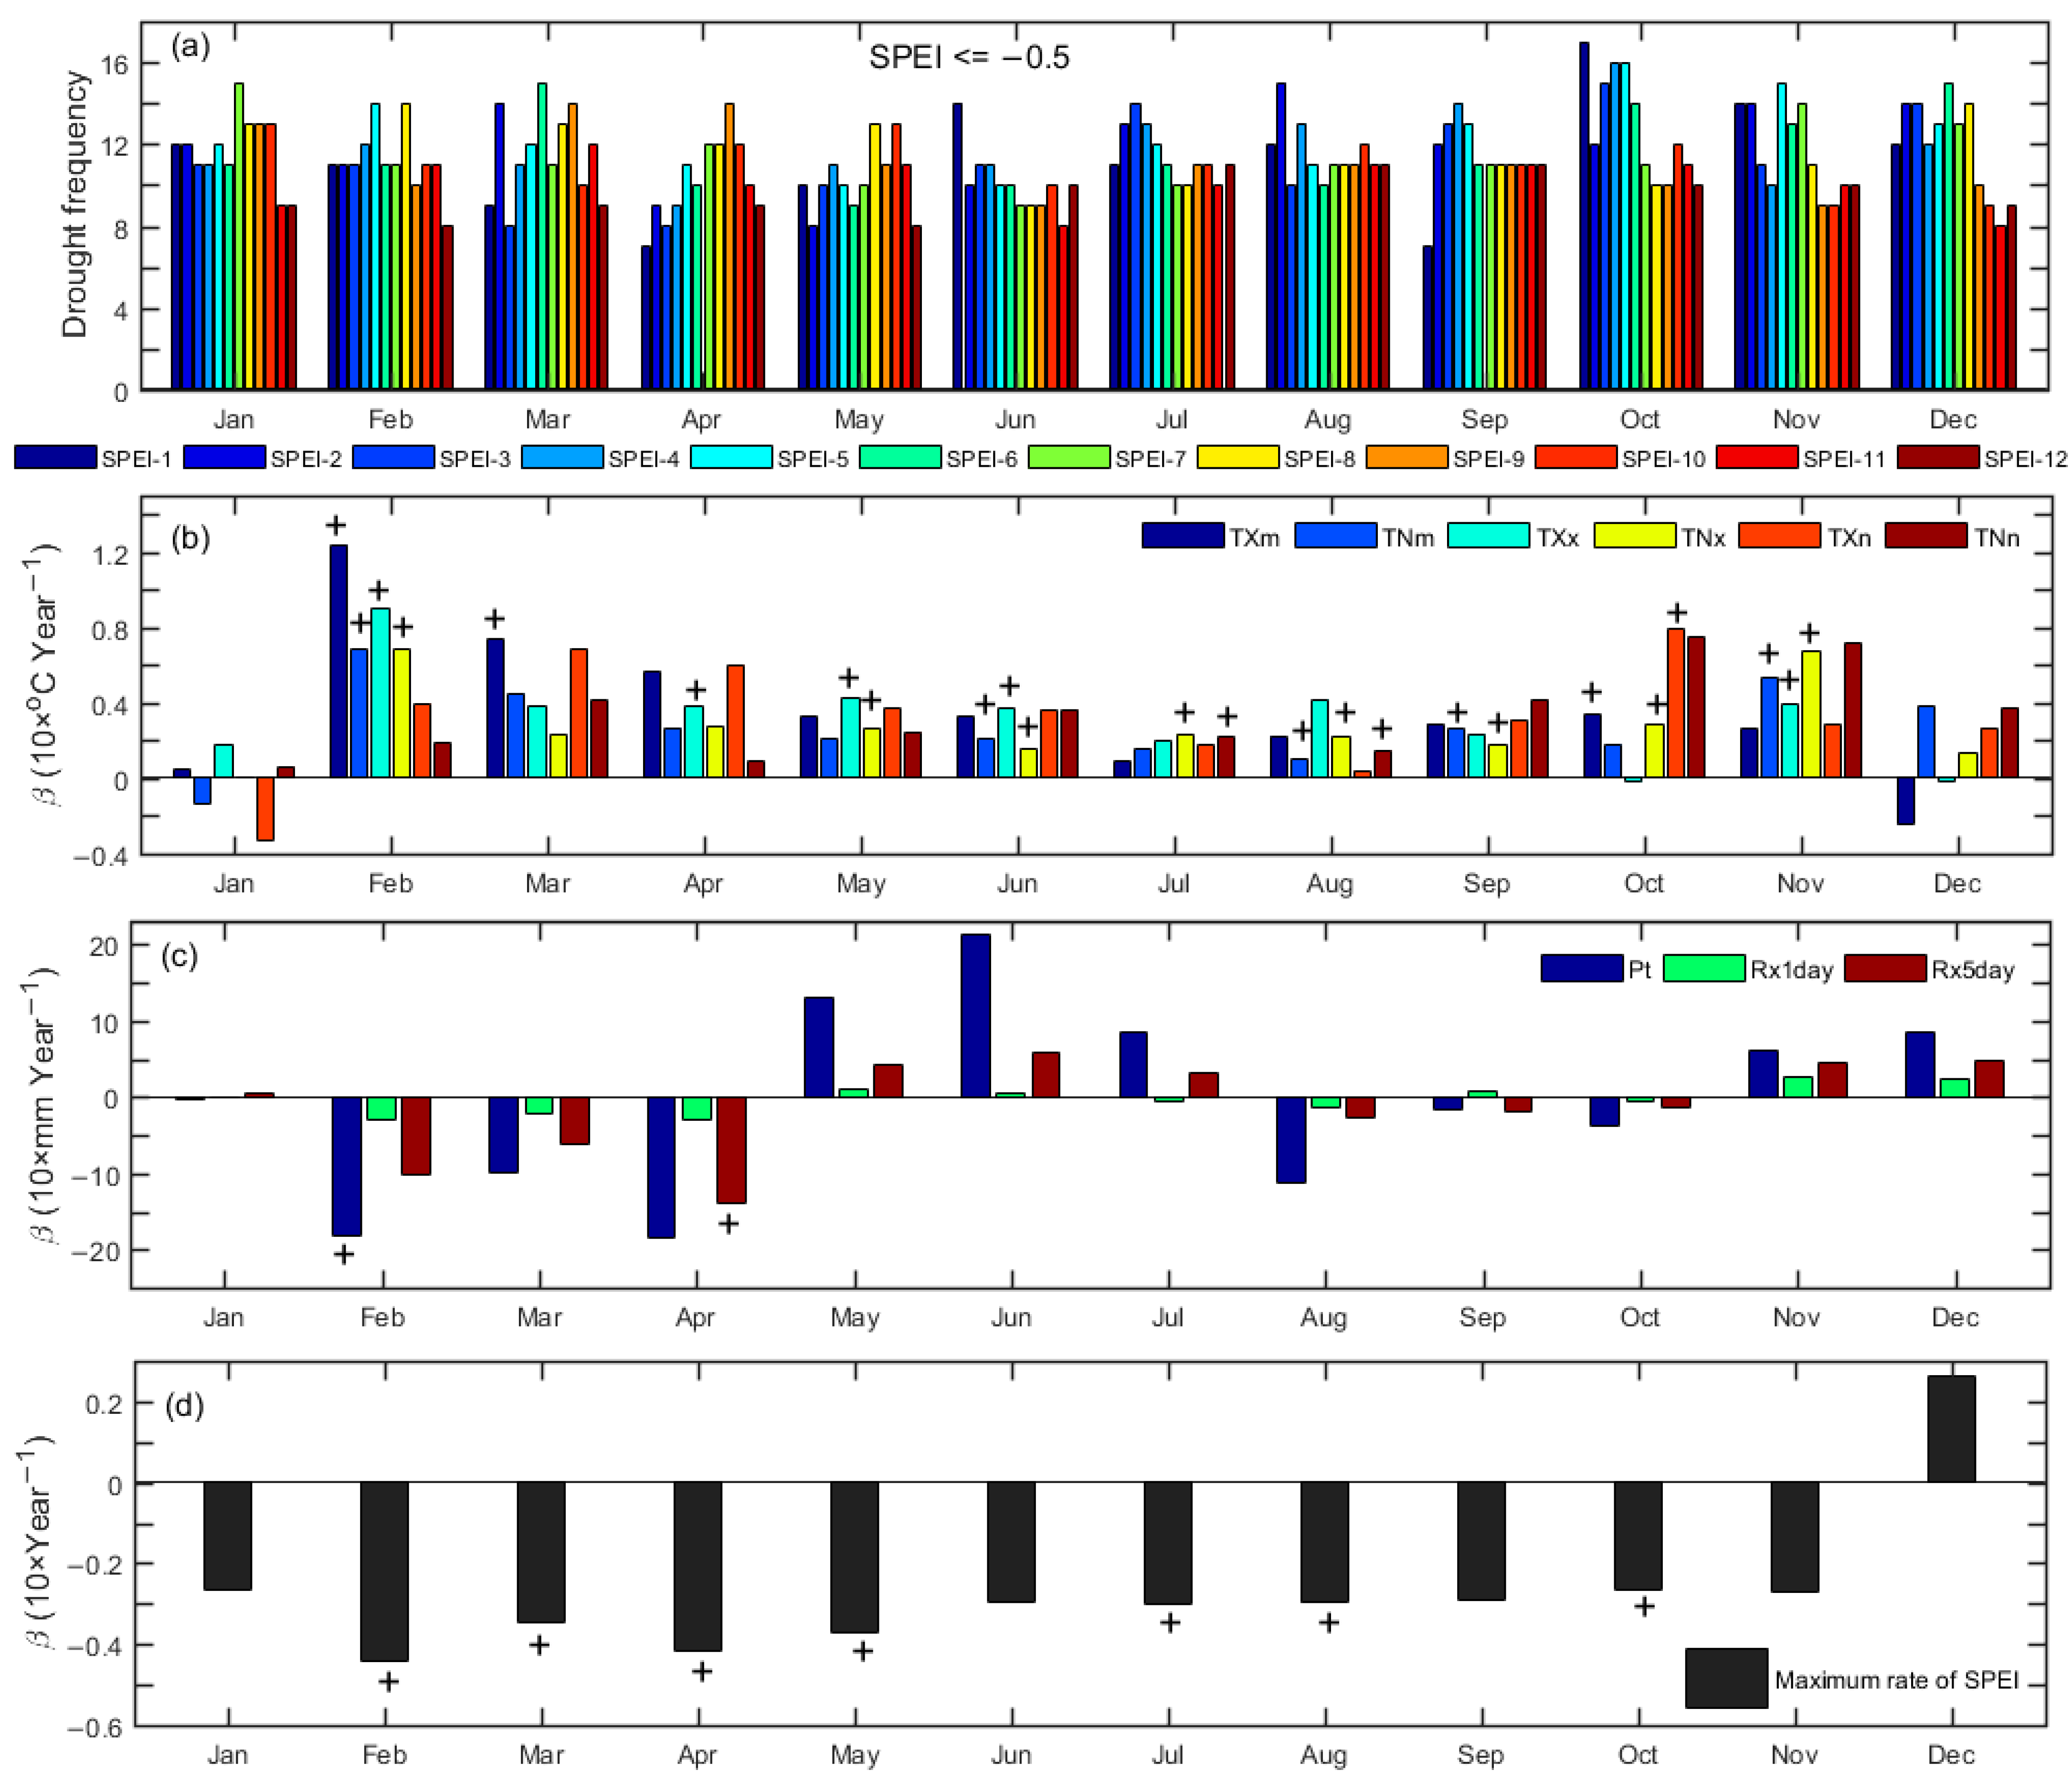
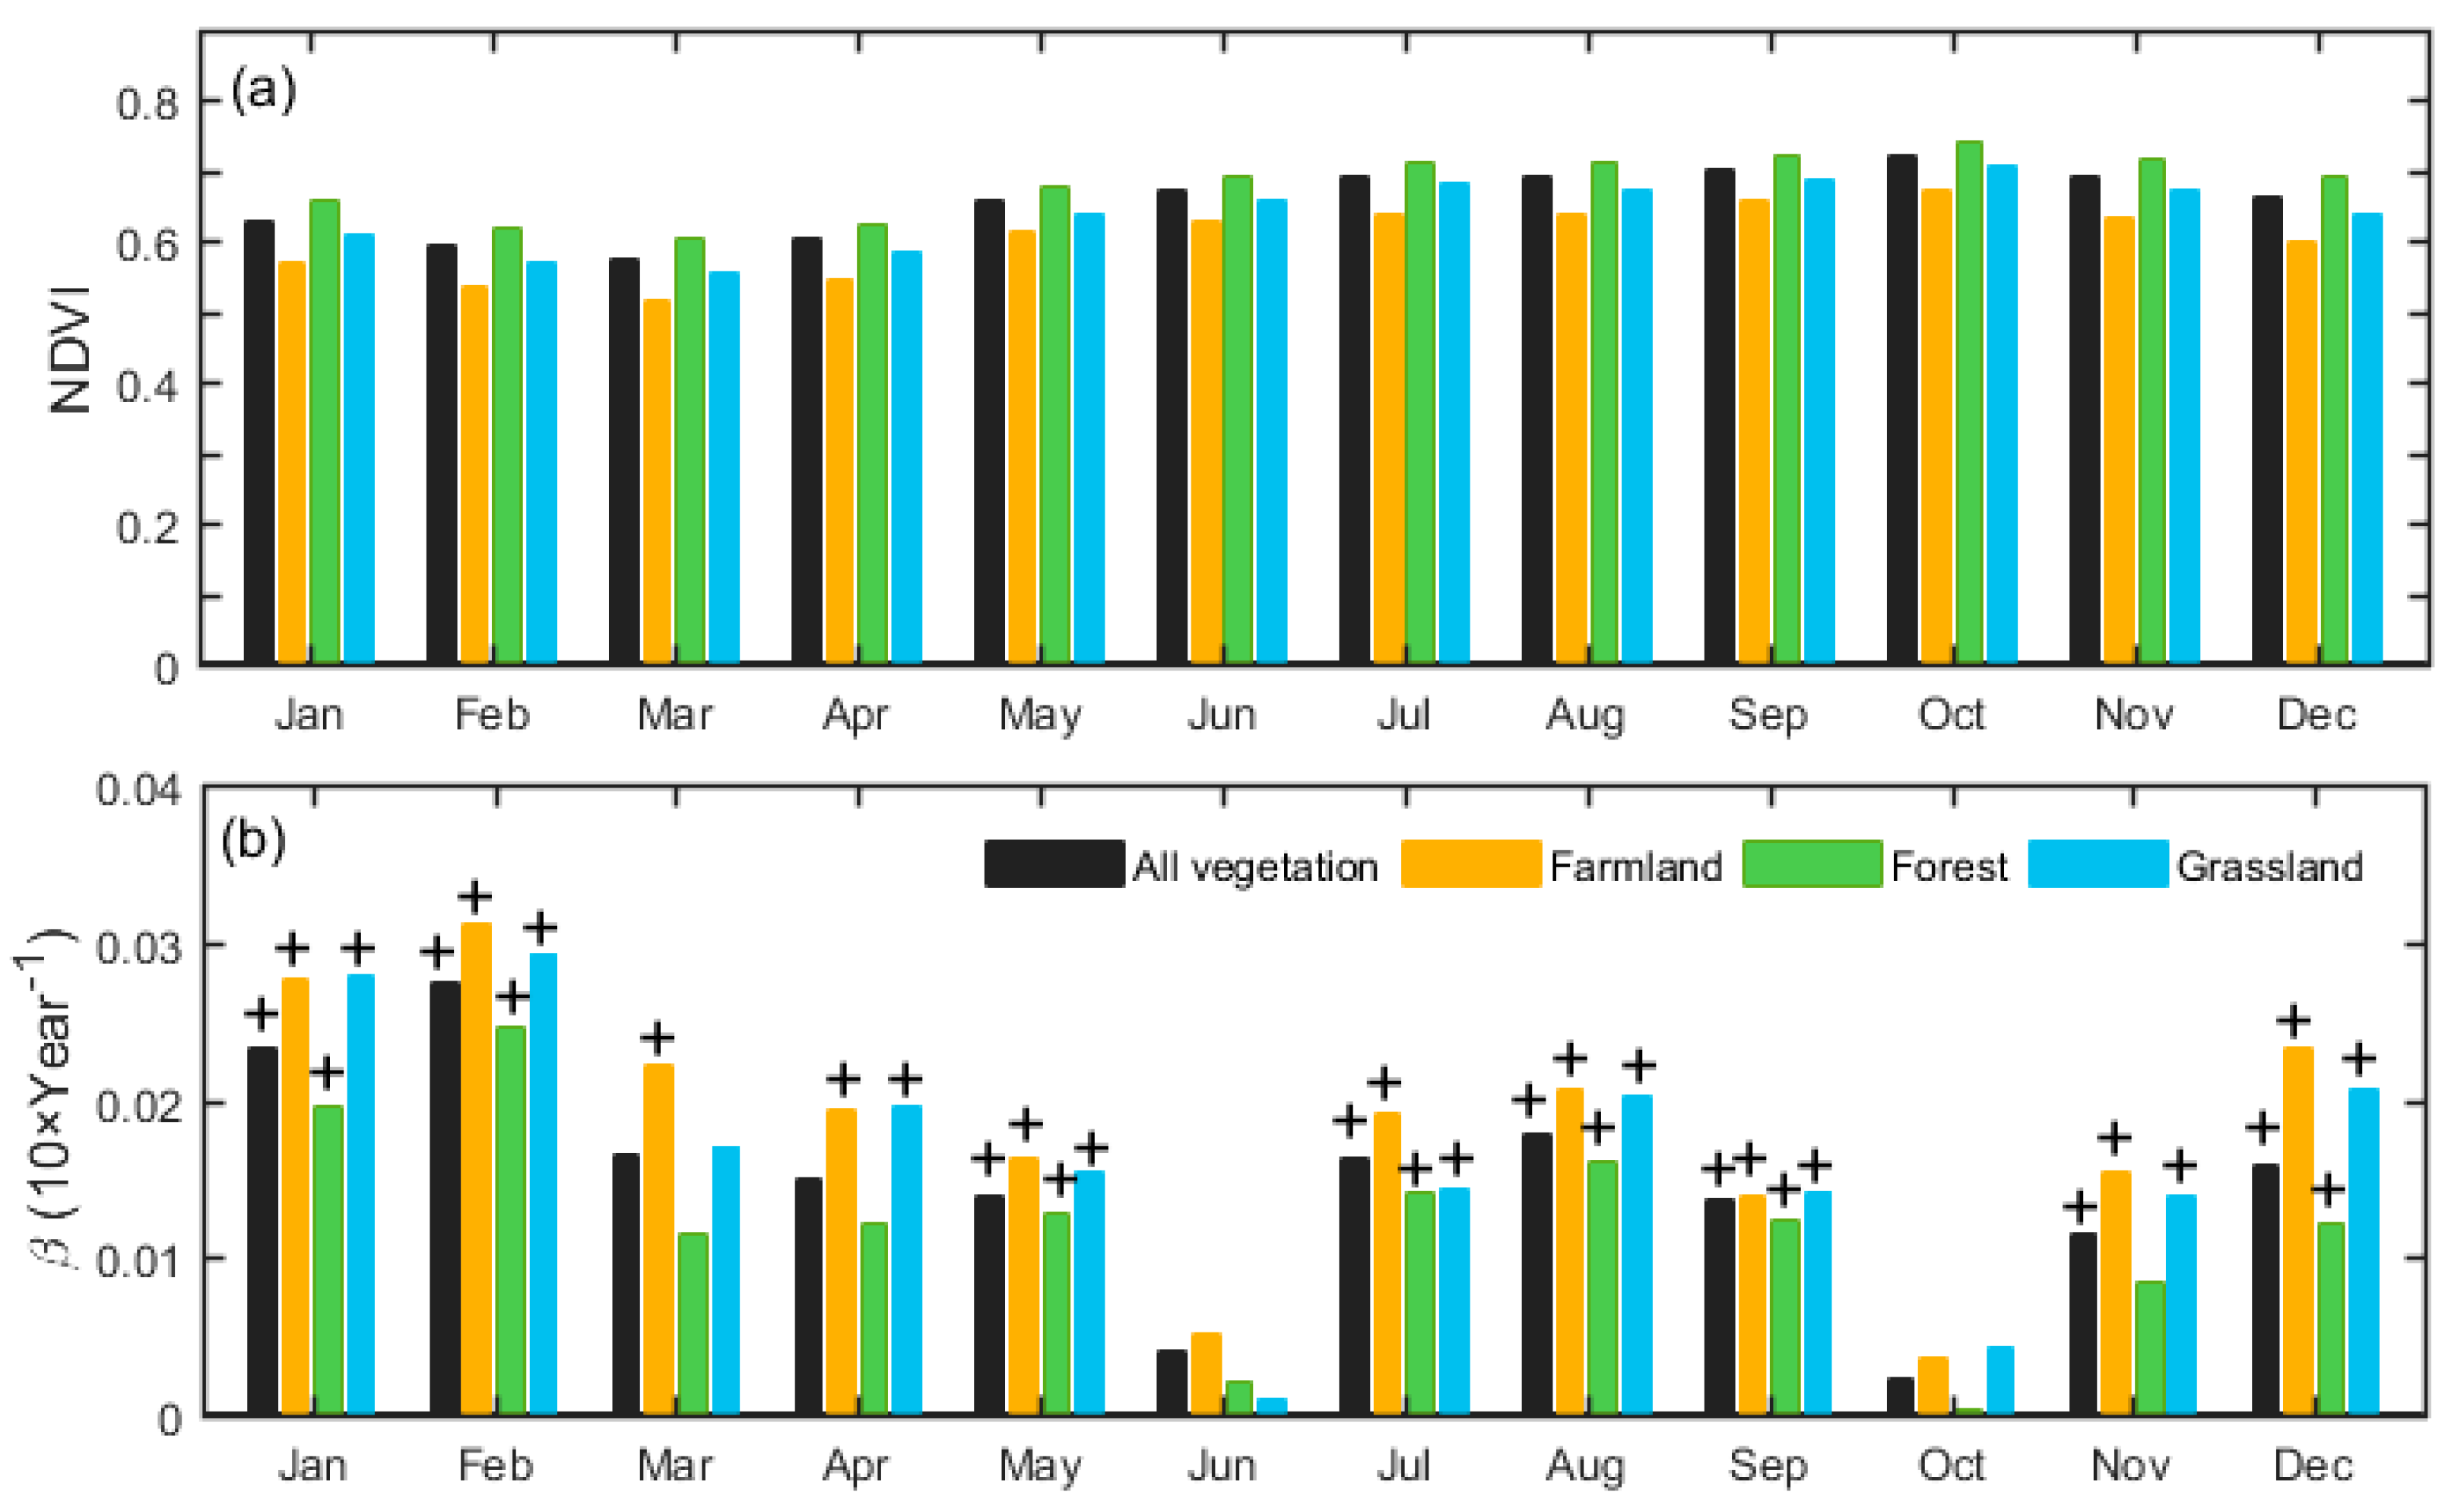
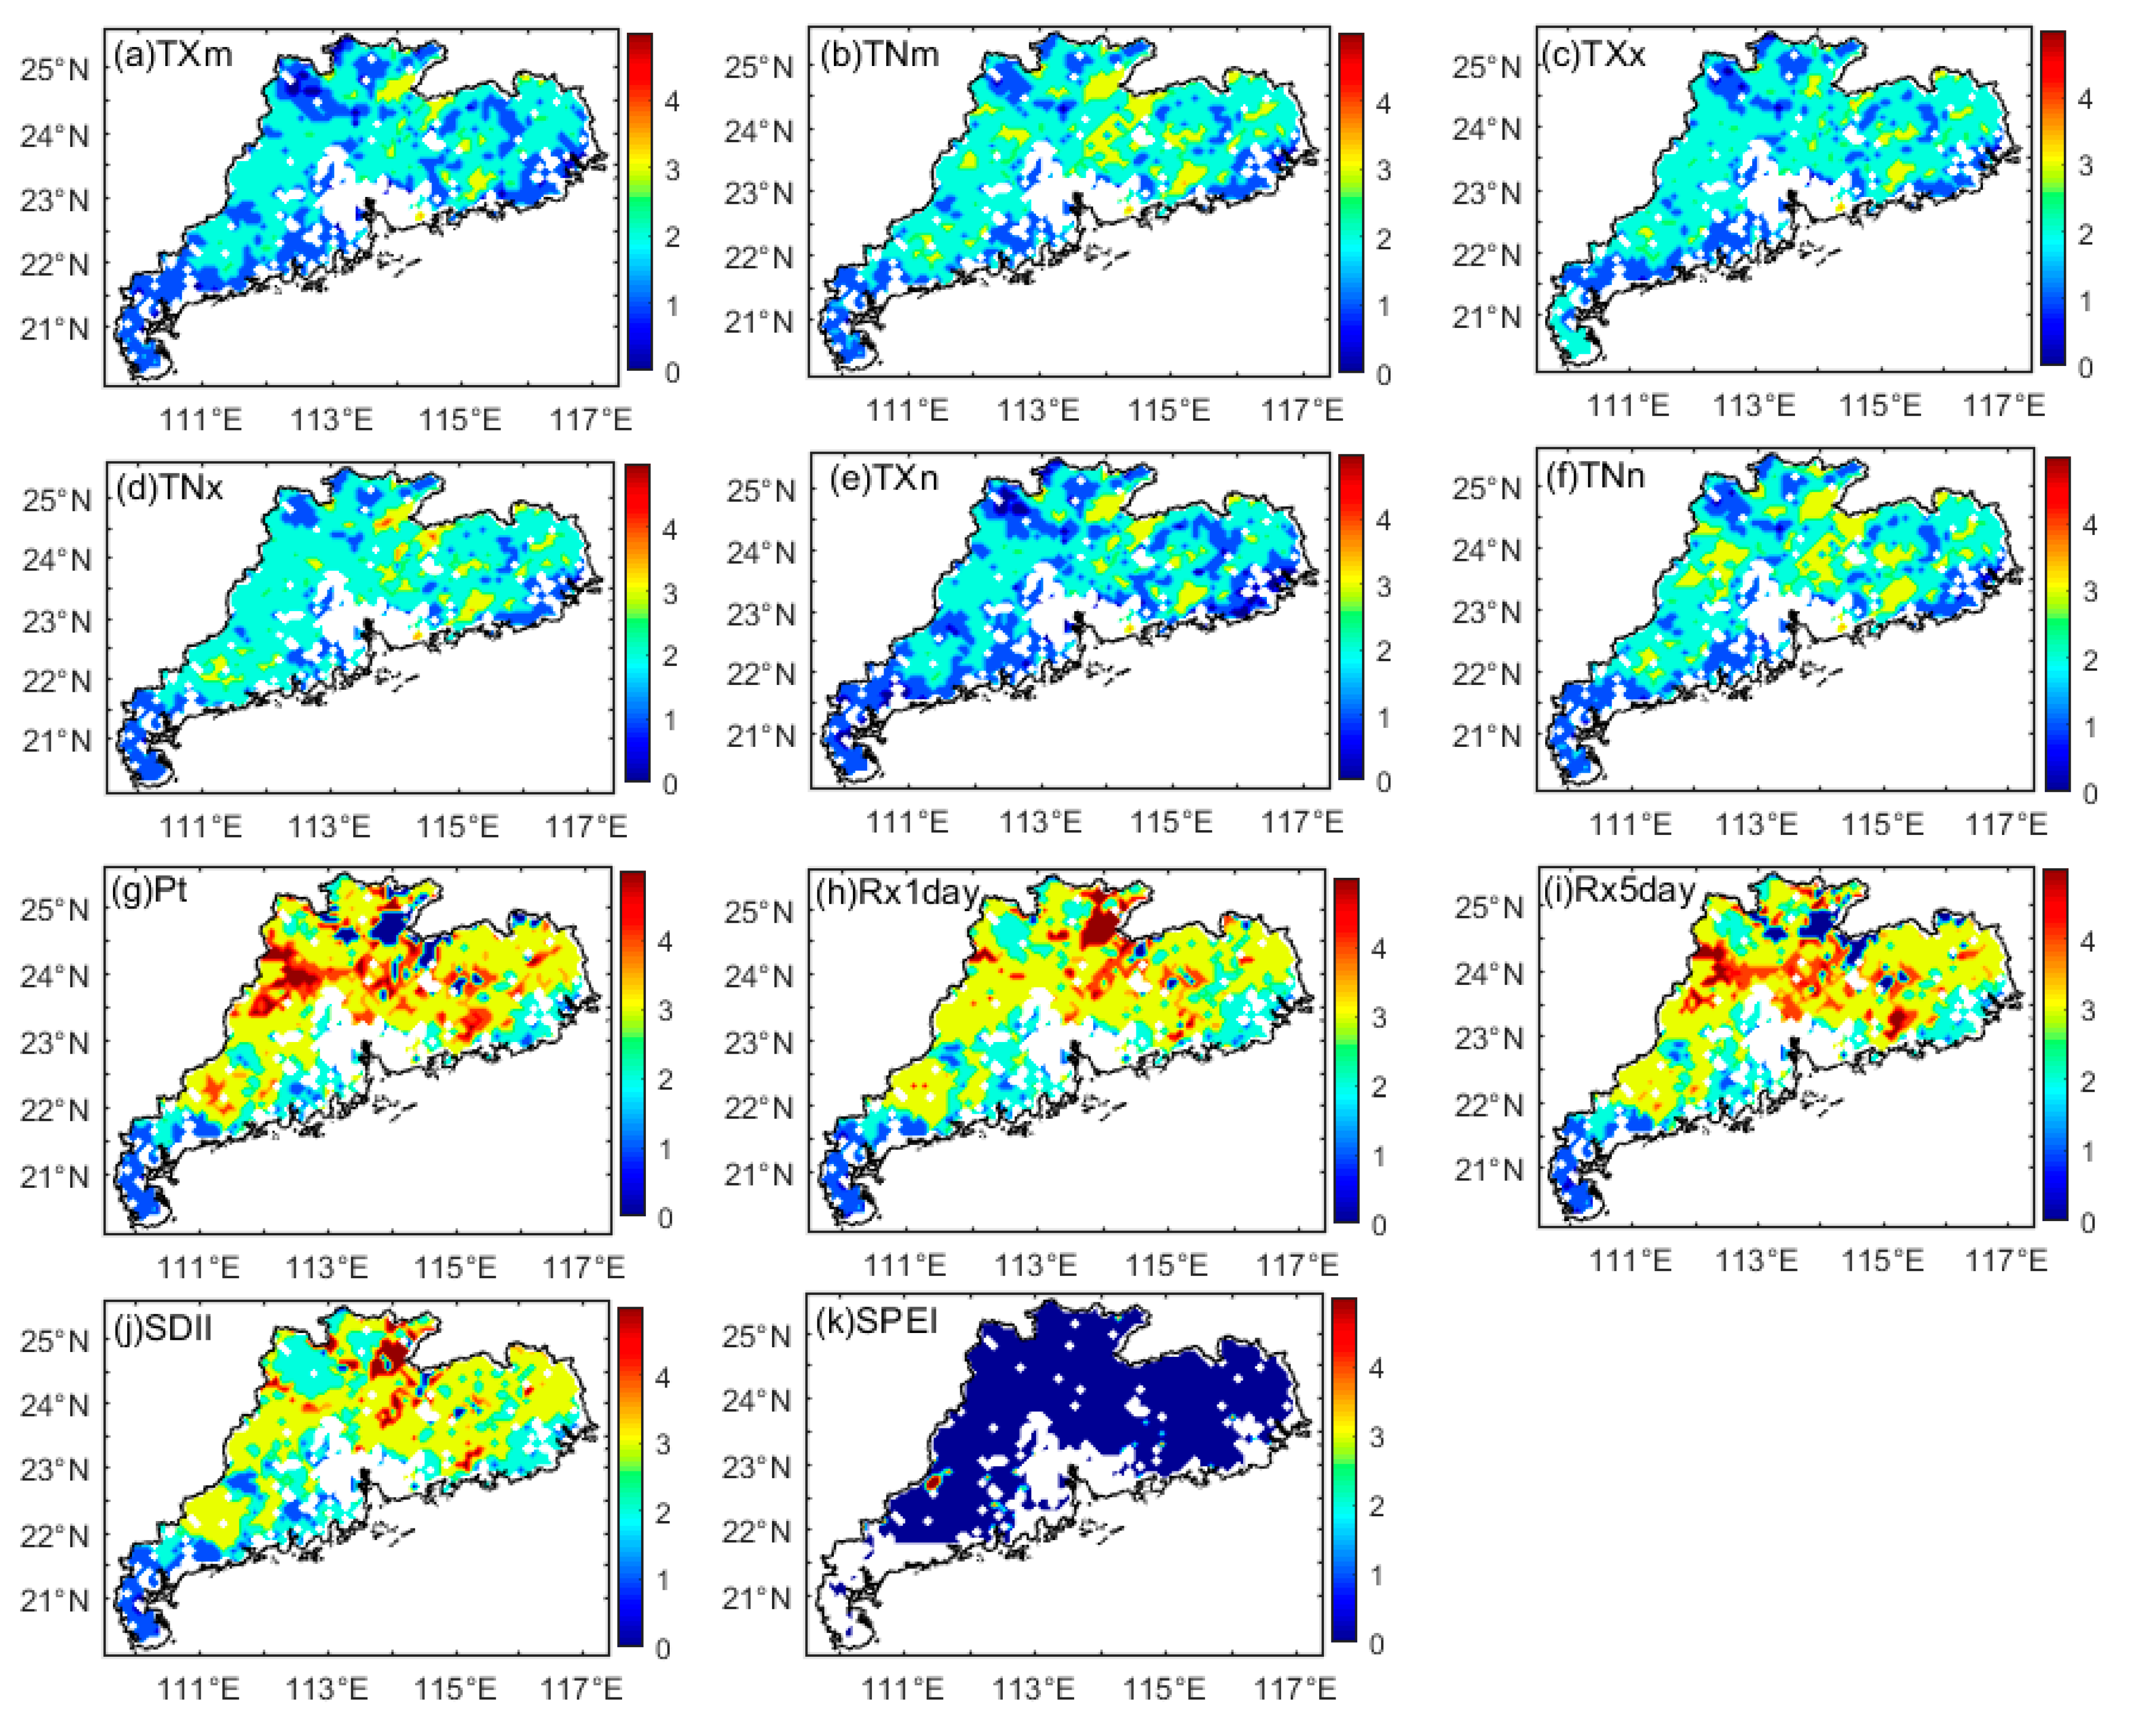
3.1. Variability of Climate Extremes and Vegetation Dynamics

Figure 3 illustrates the regional mean of the monthly drought frequency and the trend rates of each climate index in each month in the whole Guangdong region. The frequencies of drought on the SPEI timescales of 13–24 months are not shown (Figure 3a), as they were similar to the results for the timescales less than 12 months. It is clear that drought has occurred every month and on different timescales over the past 34 years. June, October, and November witnessed a relatively higher frequency of 1-month timescale drought. With regard to the trend rate, the extreme temperatures showed a significant increasing trend in all months except January and December (Figure 3b). The warming rates were higher in February, October, and November. The highest warming rate was 0.124 °C year−1 for TXm in February.
Nevertheless, as for the precipitation extremes in the whole Guangdong region (Figure 3c), only Rx5day experienced a significant decreasing trend in April, with a rate of −1.389 mm year−1. In February, Pt significantly decreased with a rate of −1.933 mm year−1 in the vegetation area. According to the maximum rate of the different timescales SPEI (Figure 3d), the SPEI significantly decreased in February (−0.044 year−1), April (−0.042 year−1), May (−0.037 year−1), March (−0.035 year−1), July (−0.030 year−1), August (−0.030 year−1), and October (−0.026 year−1). This indicates that the frequency of drought has increased in the past few decades. In February and April, the greater warming rate and decreasing precipitation rate may give rise to the relatively stronger drought trend.
With a focus on a monthly scale, Figure 4 investigates the variation of the regional averaged NDVI in different vegetation areas. The NDVI was around 0.6 in all months, and generally higher in the second half of the year than in the first half of the year. Farmlands had the lowest NDVI, whereas forests had the highest in each month. In terms of the variation trends during 1982−2015, the NDVI was relatively stable in June and October, while it showed a significant increase in other months. For all vegetation, the highest greening rate was 0.0028 year−1 in February, followed by 0.0023 year−1 in January, 0.0018 year−1 in August, and 0.0016 year−1 in July and December. In May, September, and November, the NDVI increased at a rate of around 0.0013 year−1. For each type of vegetation, the highest greening rate also occurred in February, peaking at 0.0031 year−1 in the farmland area. Generally, the greening rate of forests was the lowest, while that of farmlands was the highest in each month.

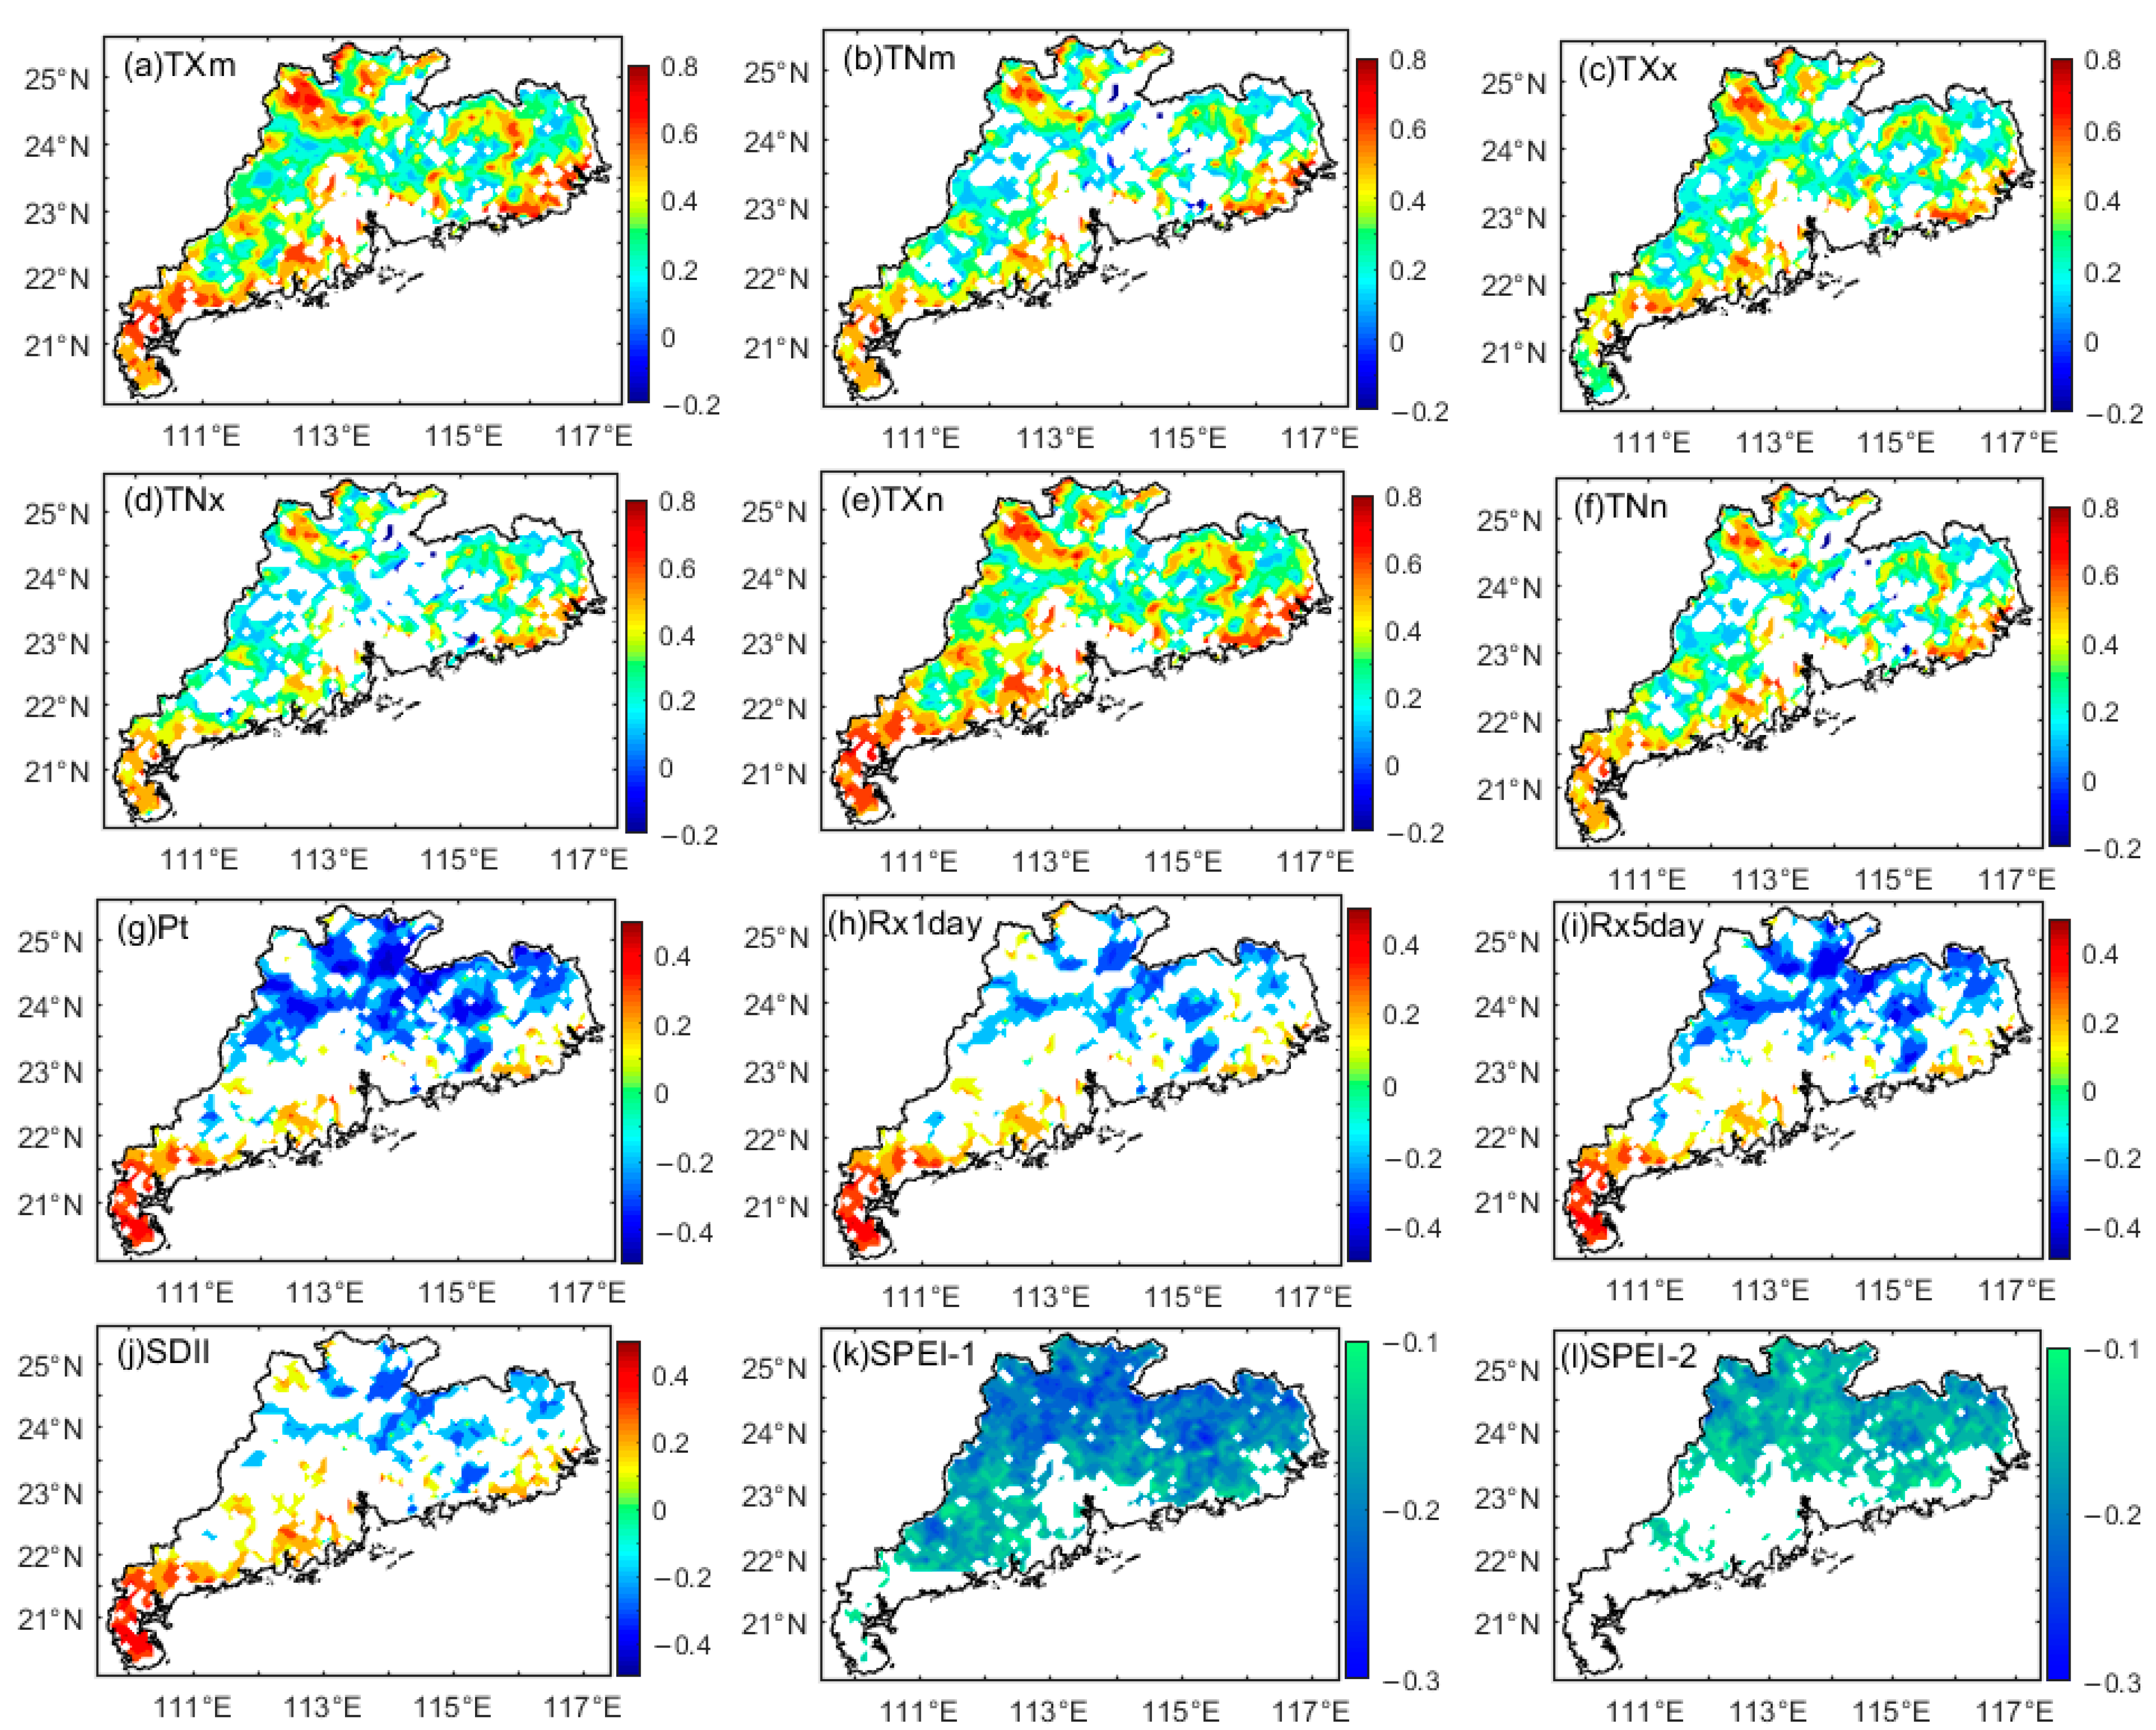
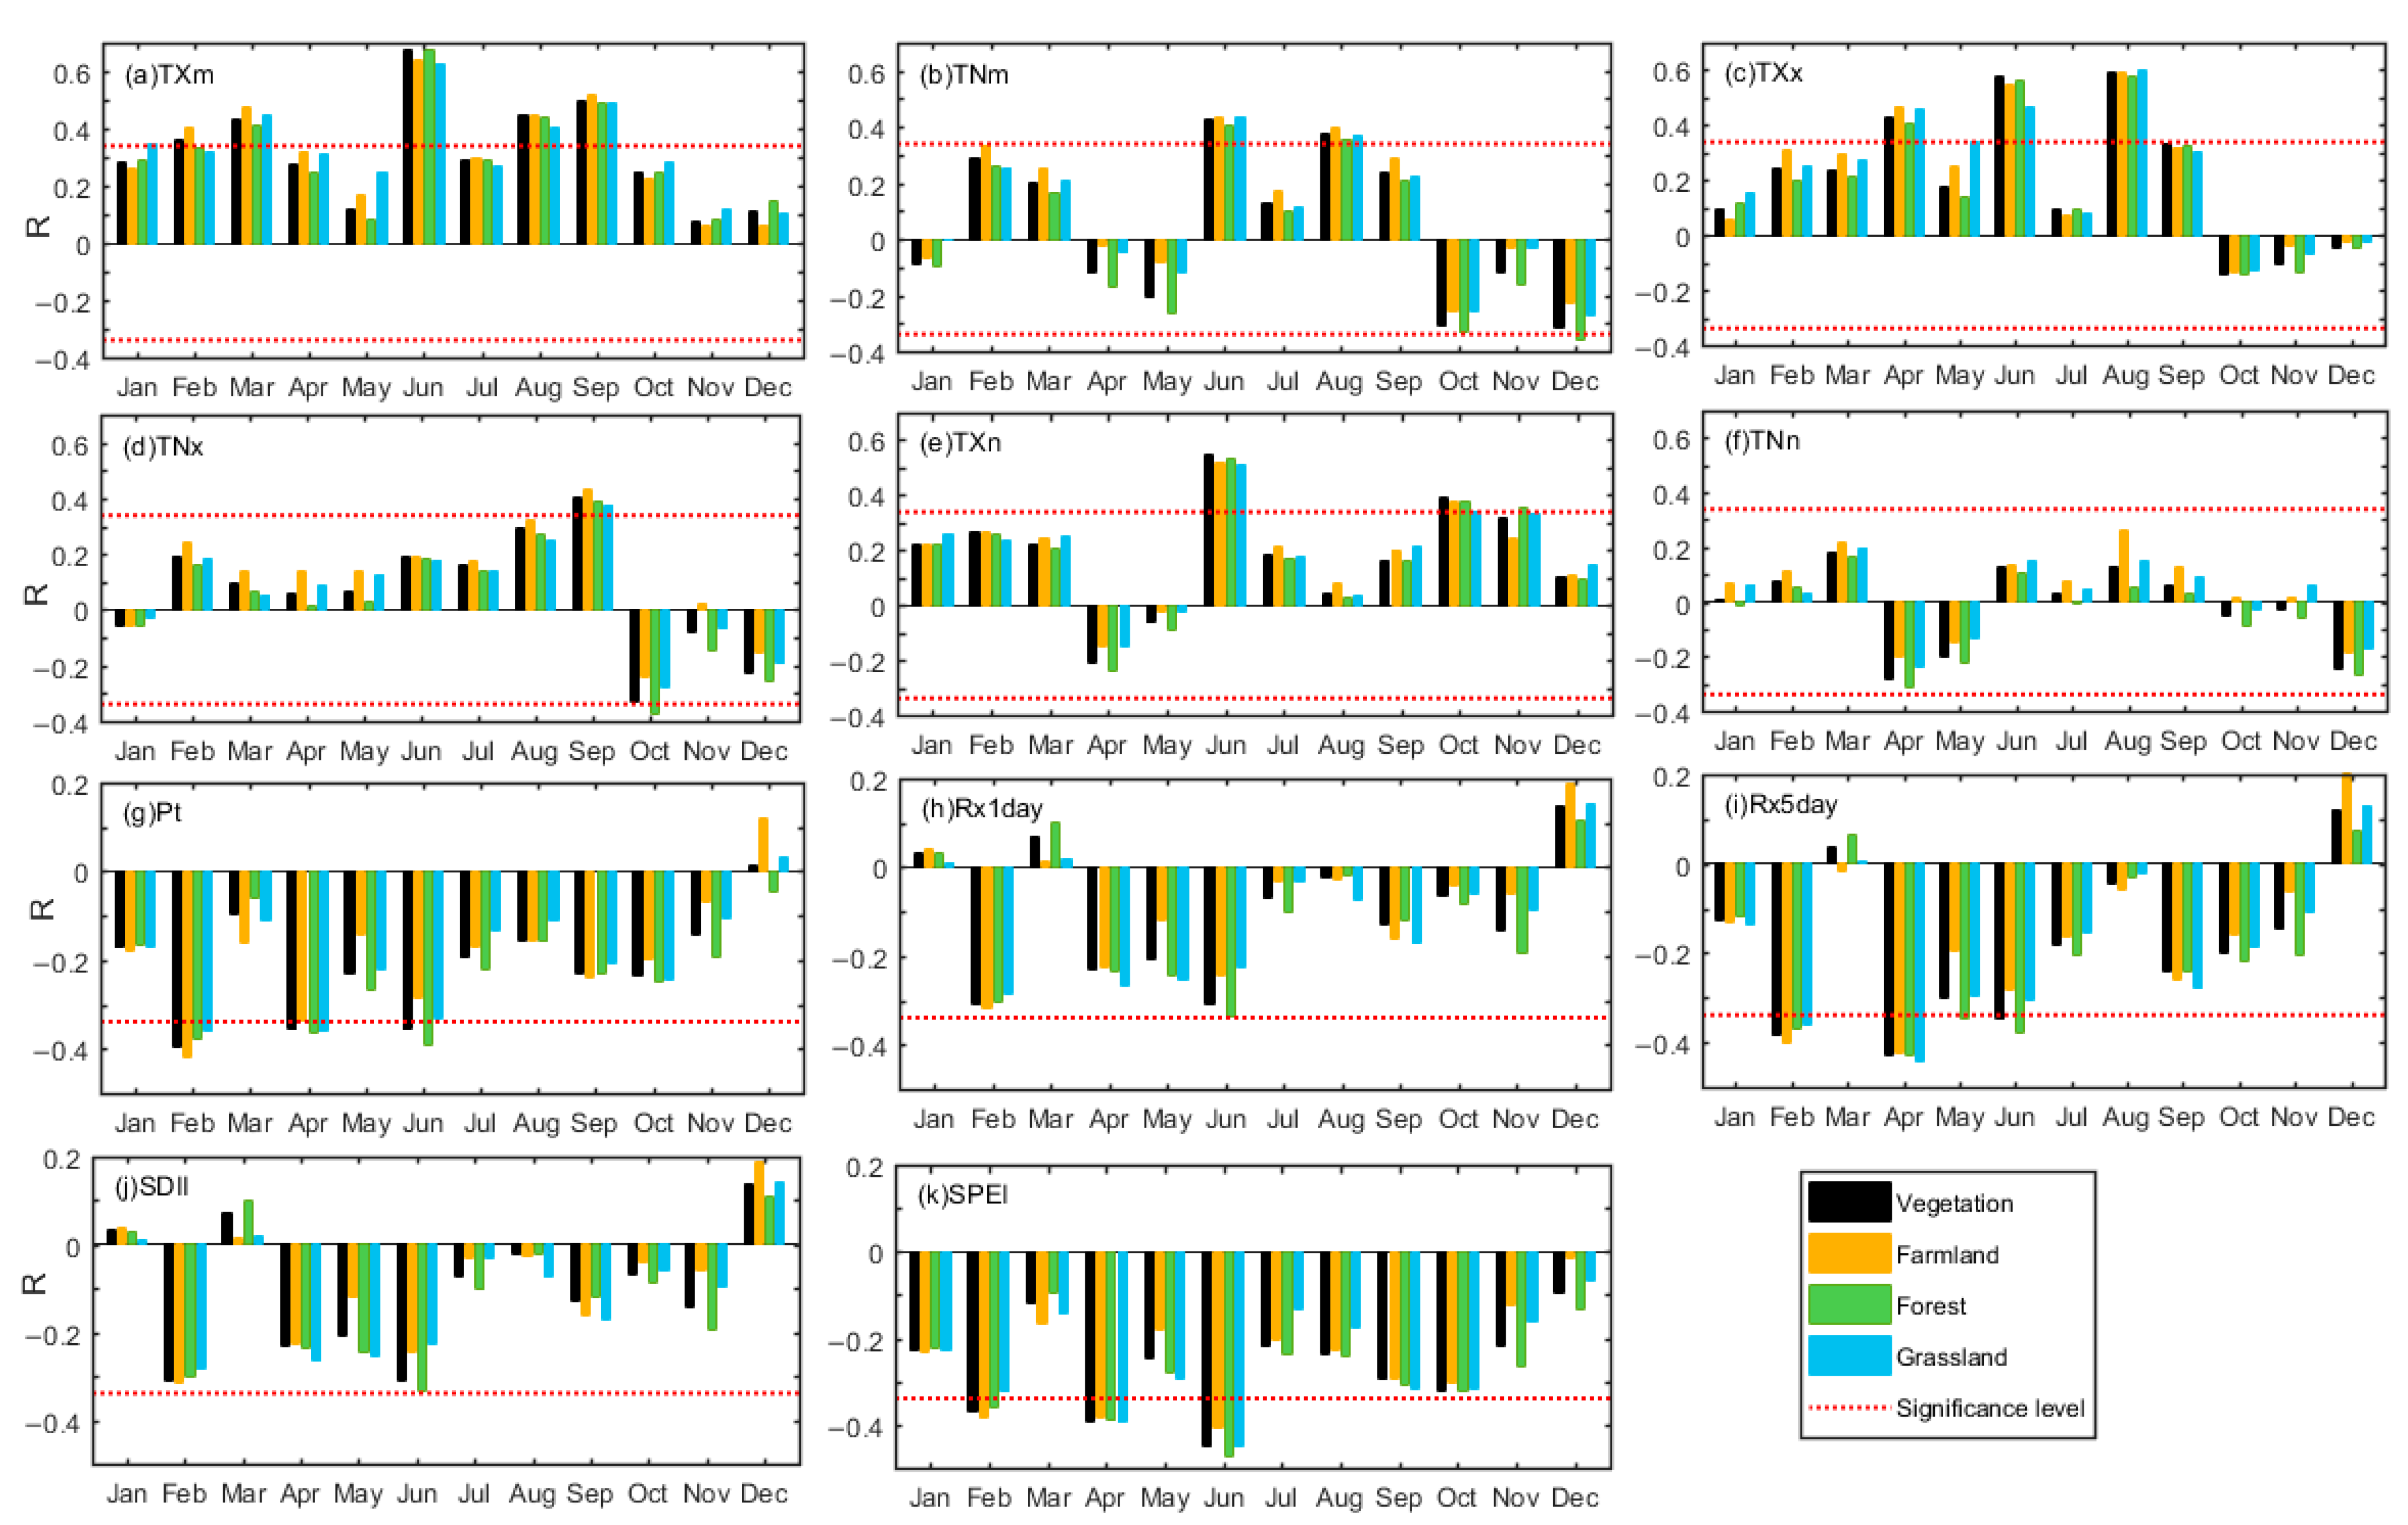
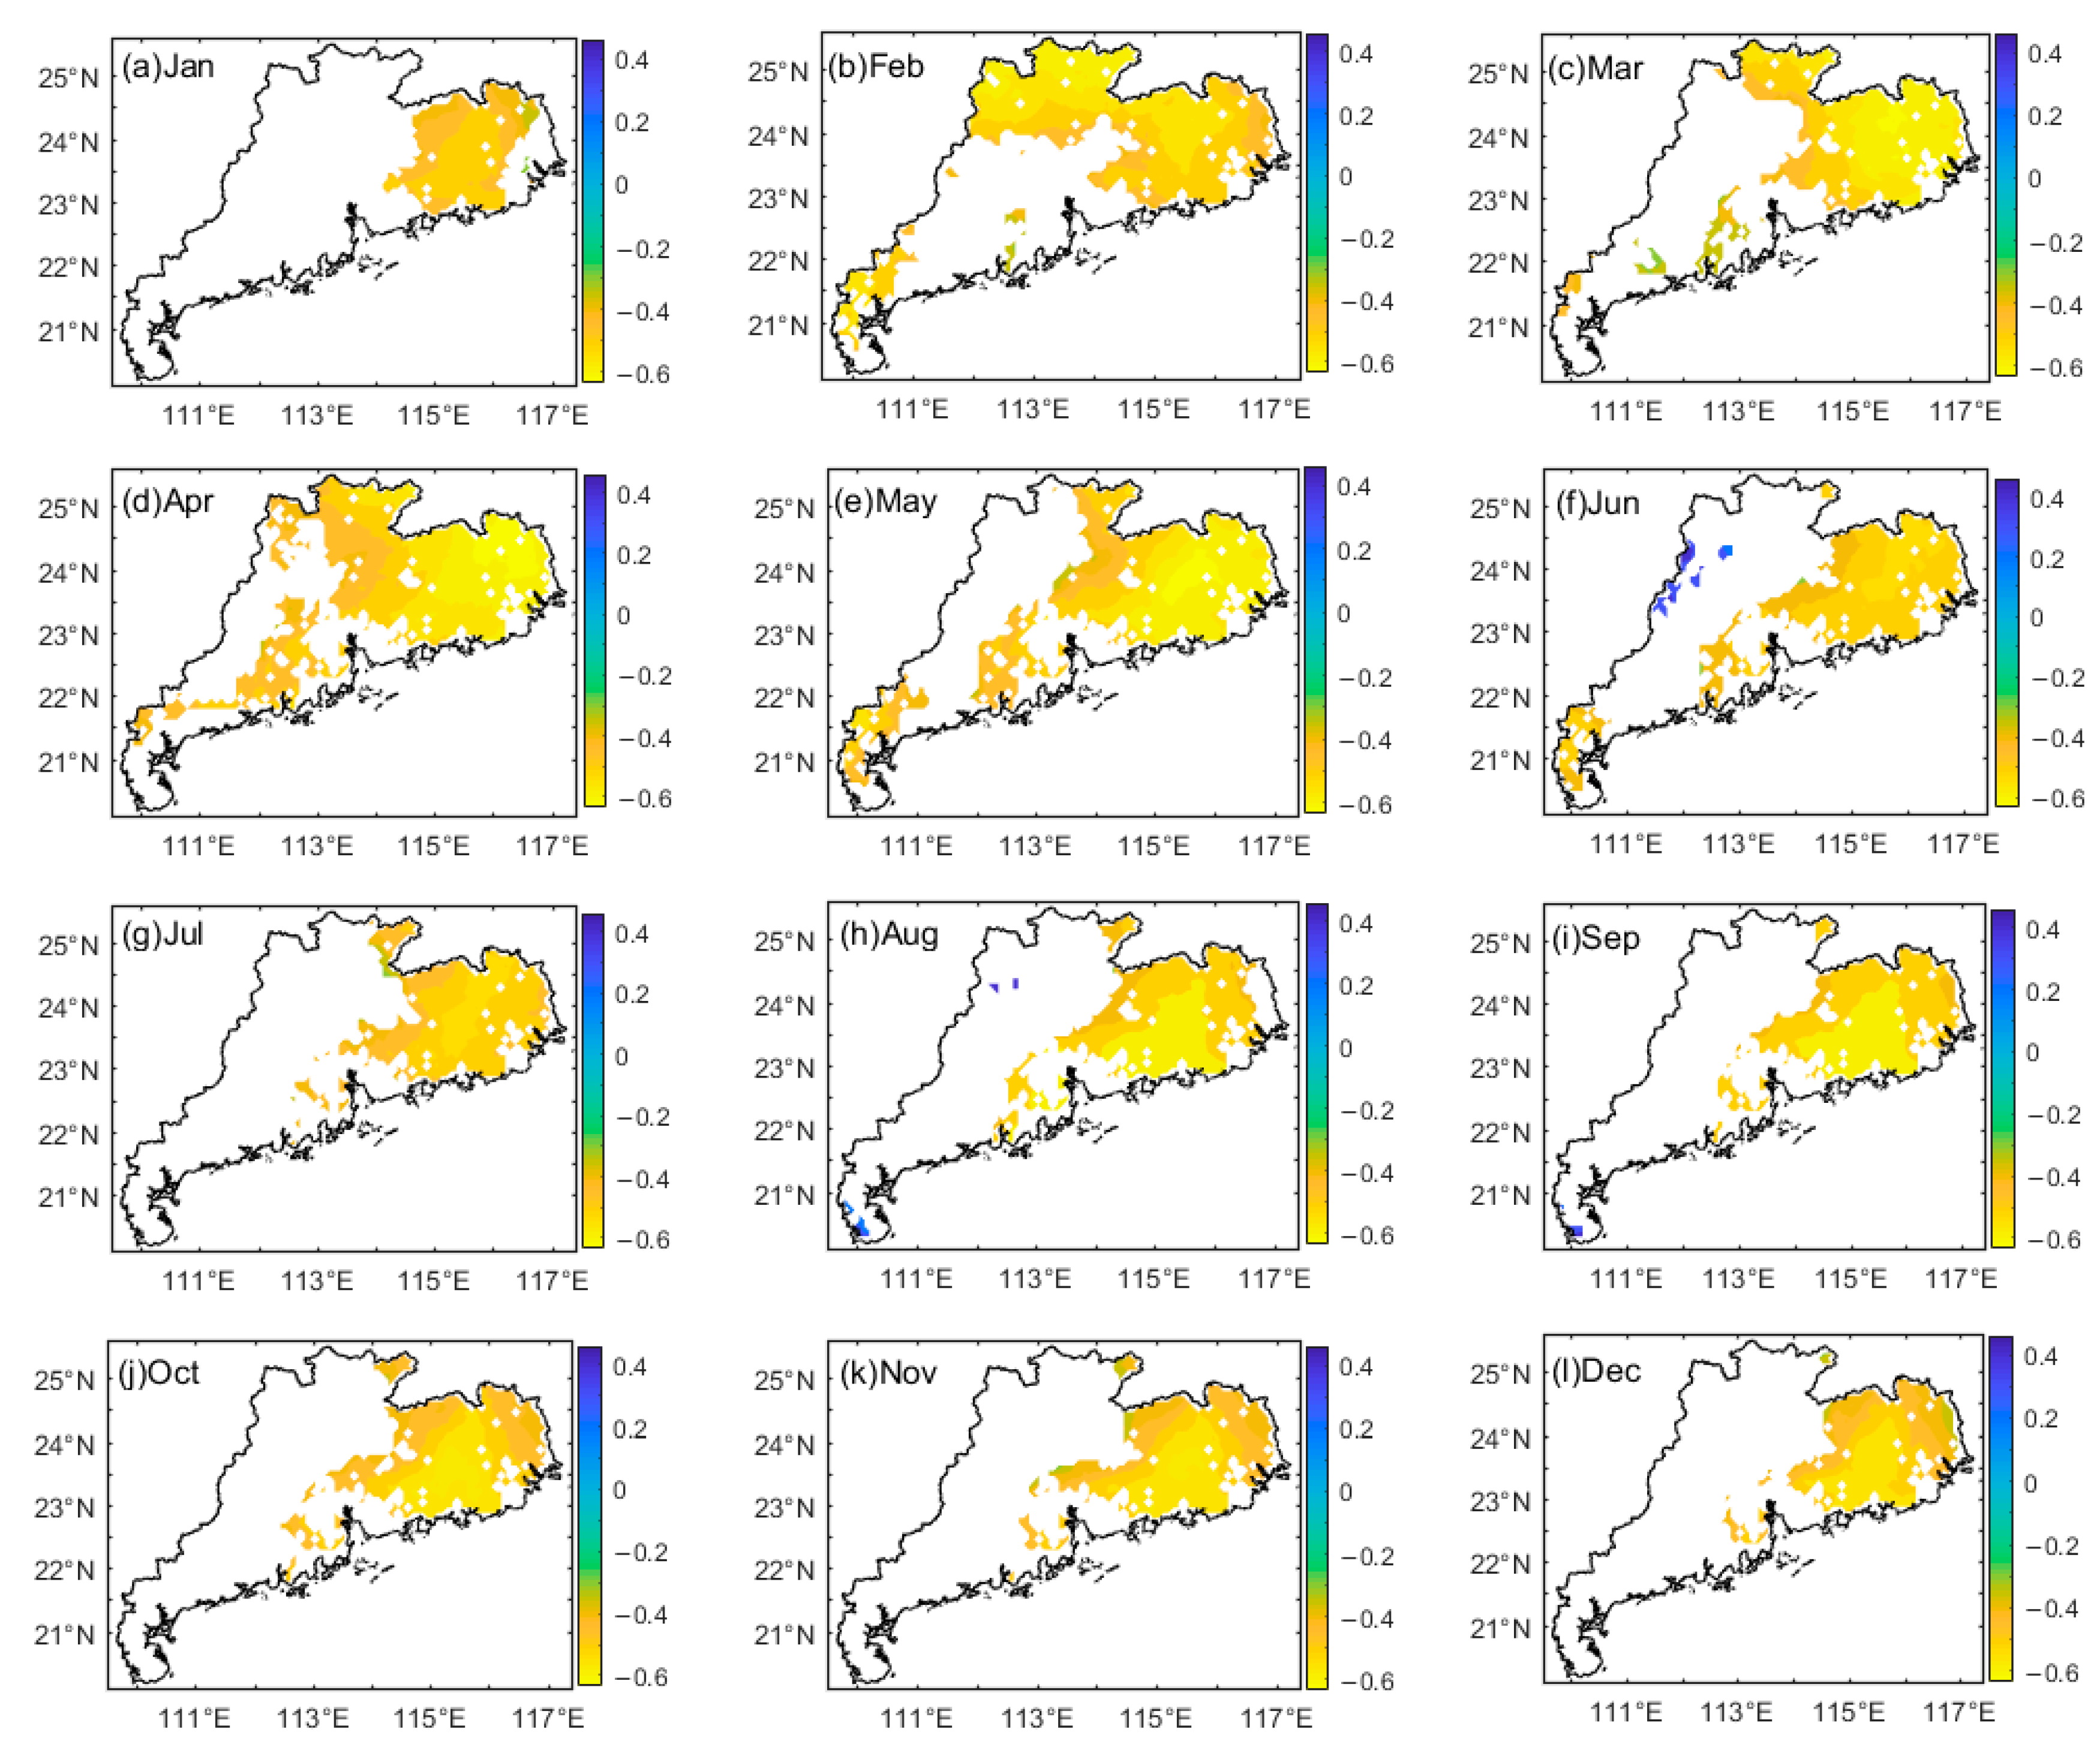
3.2. Correlation between NDVI and Climate Extremes on a Monthly Scale

Figure 5 investigates the spatial distributions of the correlations between the monthly NDVI and each extreme index. The correlations between the monthly NDVI and different temperature indices showed a similar pattern, and roughly 80–95% of the vegetation area passed the significance test for the positive correlations (Figure 5a–f). In some areas, the significant coefficient can be as high as 0.8. Moreover, Wang et al. [55] pointed out that the temperature extremes generally had high rates of increase in most of Guangdong during the past few decades. This indicates that the NDVI increased with the extreme temperature rising in this region.
The spatial patterns of the correlations for the different precipitation indices were similar (Figure 5g–j), but different from those for the temperature indices. The precipitation extremes showed much weaker correlations with the NDVI than the temperature extremes. Approximately 60–75% of the vegetation area passed the significance test for the correlations with the precipitation indices. The significant coefficients showed north–south patterns. The precipitation indices were significantly positively correlated with the NDVI in a few areas of southern Guangdong, while they were strongly negatively correlated with the NDVI in the parts of the northern and northeastern regions. Therefore, the effects of precipitation extremes on vegetation dynamics had an obvious north–south difference, and the northern and northeastern regions were mainly characterized by the inhibitory effect of precipitation extremes on plant growth.
Furthermore, with respect to the drought effect (Figure 5k,l), 90% of the vegetation showed significant and negative correlations with the 1-month timescale SPEI, and approximately 69% of it with the 2-month timescale SPEI. The negative correlations with the 1-month timescale SPEI showed a similar spatial pattern, but stronger magnitudes compared with those of the 2-month scale SPEI. The stronger correlations mostly occurred in northern and northeastern Guangdong. As the timescale of the SPEI increased, the correlations between the NDVI and the SPEI became much weaker. Only half of the vegetation significantly correlated with the 3-month timescale SPEI, around 30% of it with the 4- or 5-month timescale SPEI, and less than 12% with the SPEI on the timescale longer than six months (results not shown). Thus, the influence of the SPEI on vegetation mainly occurred on the short timescale (1–2 months), especially the 1-month timescale. In terms of the correlation between the 1-month timescale SPEI and the NDVI on the regional average, the significant coefficient was approximately –0.21 for all vegetation, with a value of –0.22 for forests and –0.19 for farmlands. The responses of the different vegetation to drought did not show much difference.
Then, based on the regional and monthly average, the correlations between vegetation and different climate extremes were further explored to identify the potentially different effects of climate extremes in different months (Figure 6). For any certain month, once one of the extreme temperature (precipitation) indices showed a significant correlation with the NDVI, this research considers that the temperature (precipitation) extremes were significantly correlated with the NDVI in that month. For each type of vegetation, the correlations varied greatly from January to December. The NDVI was significantly positively correlated with temperature extremes in most months (Figure 6a–f). The significant and positive correlations occurred in February, March, April, June, August, September, October, and November. The coefficient was often higher than 0.4. However, some negative correlations also existed between the NDVI and temperature extremes. In the forest area, the NDVI was significantly and negatively correlated with TNm and TNx in October, and with TNm in December.
Nevertheless, the NDVI only displayed significant and negative correlations with the extreme precipitation indices (Pt, Rx5day) in February, April, and June (Figure 6g–j). Compared with farmlands and grasslands, the forest area was more affected by precipitation extremes in June. With regard to drought, the NDVI was significantly negatively correlated with the 1-month timescale SPEI in February, April, and June (Figure 6k). In June, the correlation was stronger, and the forest area was more affected by drought, with a correlation coefficient close to −0.5. In May and September, the NDVI showed significant and negative correlations with the SPEI on the timescale longer than one month, and the correlation magnitudes were a little weaker compared with those of the 1-month timescale SPEI (results not shown). In addition, there was a significant and positive correlation between the NDVI and the long-timescale SPEI in November. Generally, the magnitudes of correlations between vegetation and climate extremes did not show much difference among the three types of vegetation.

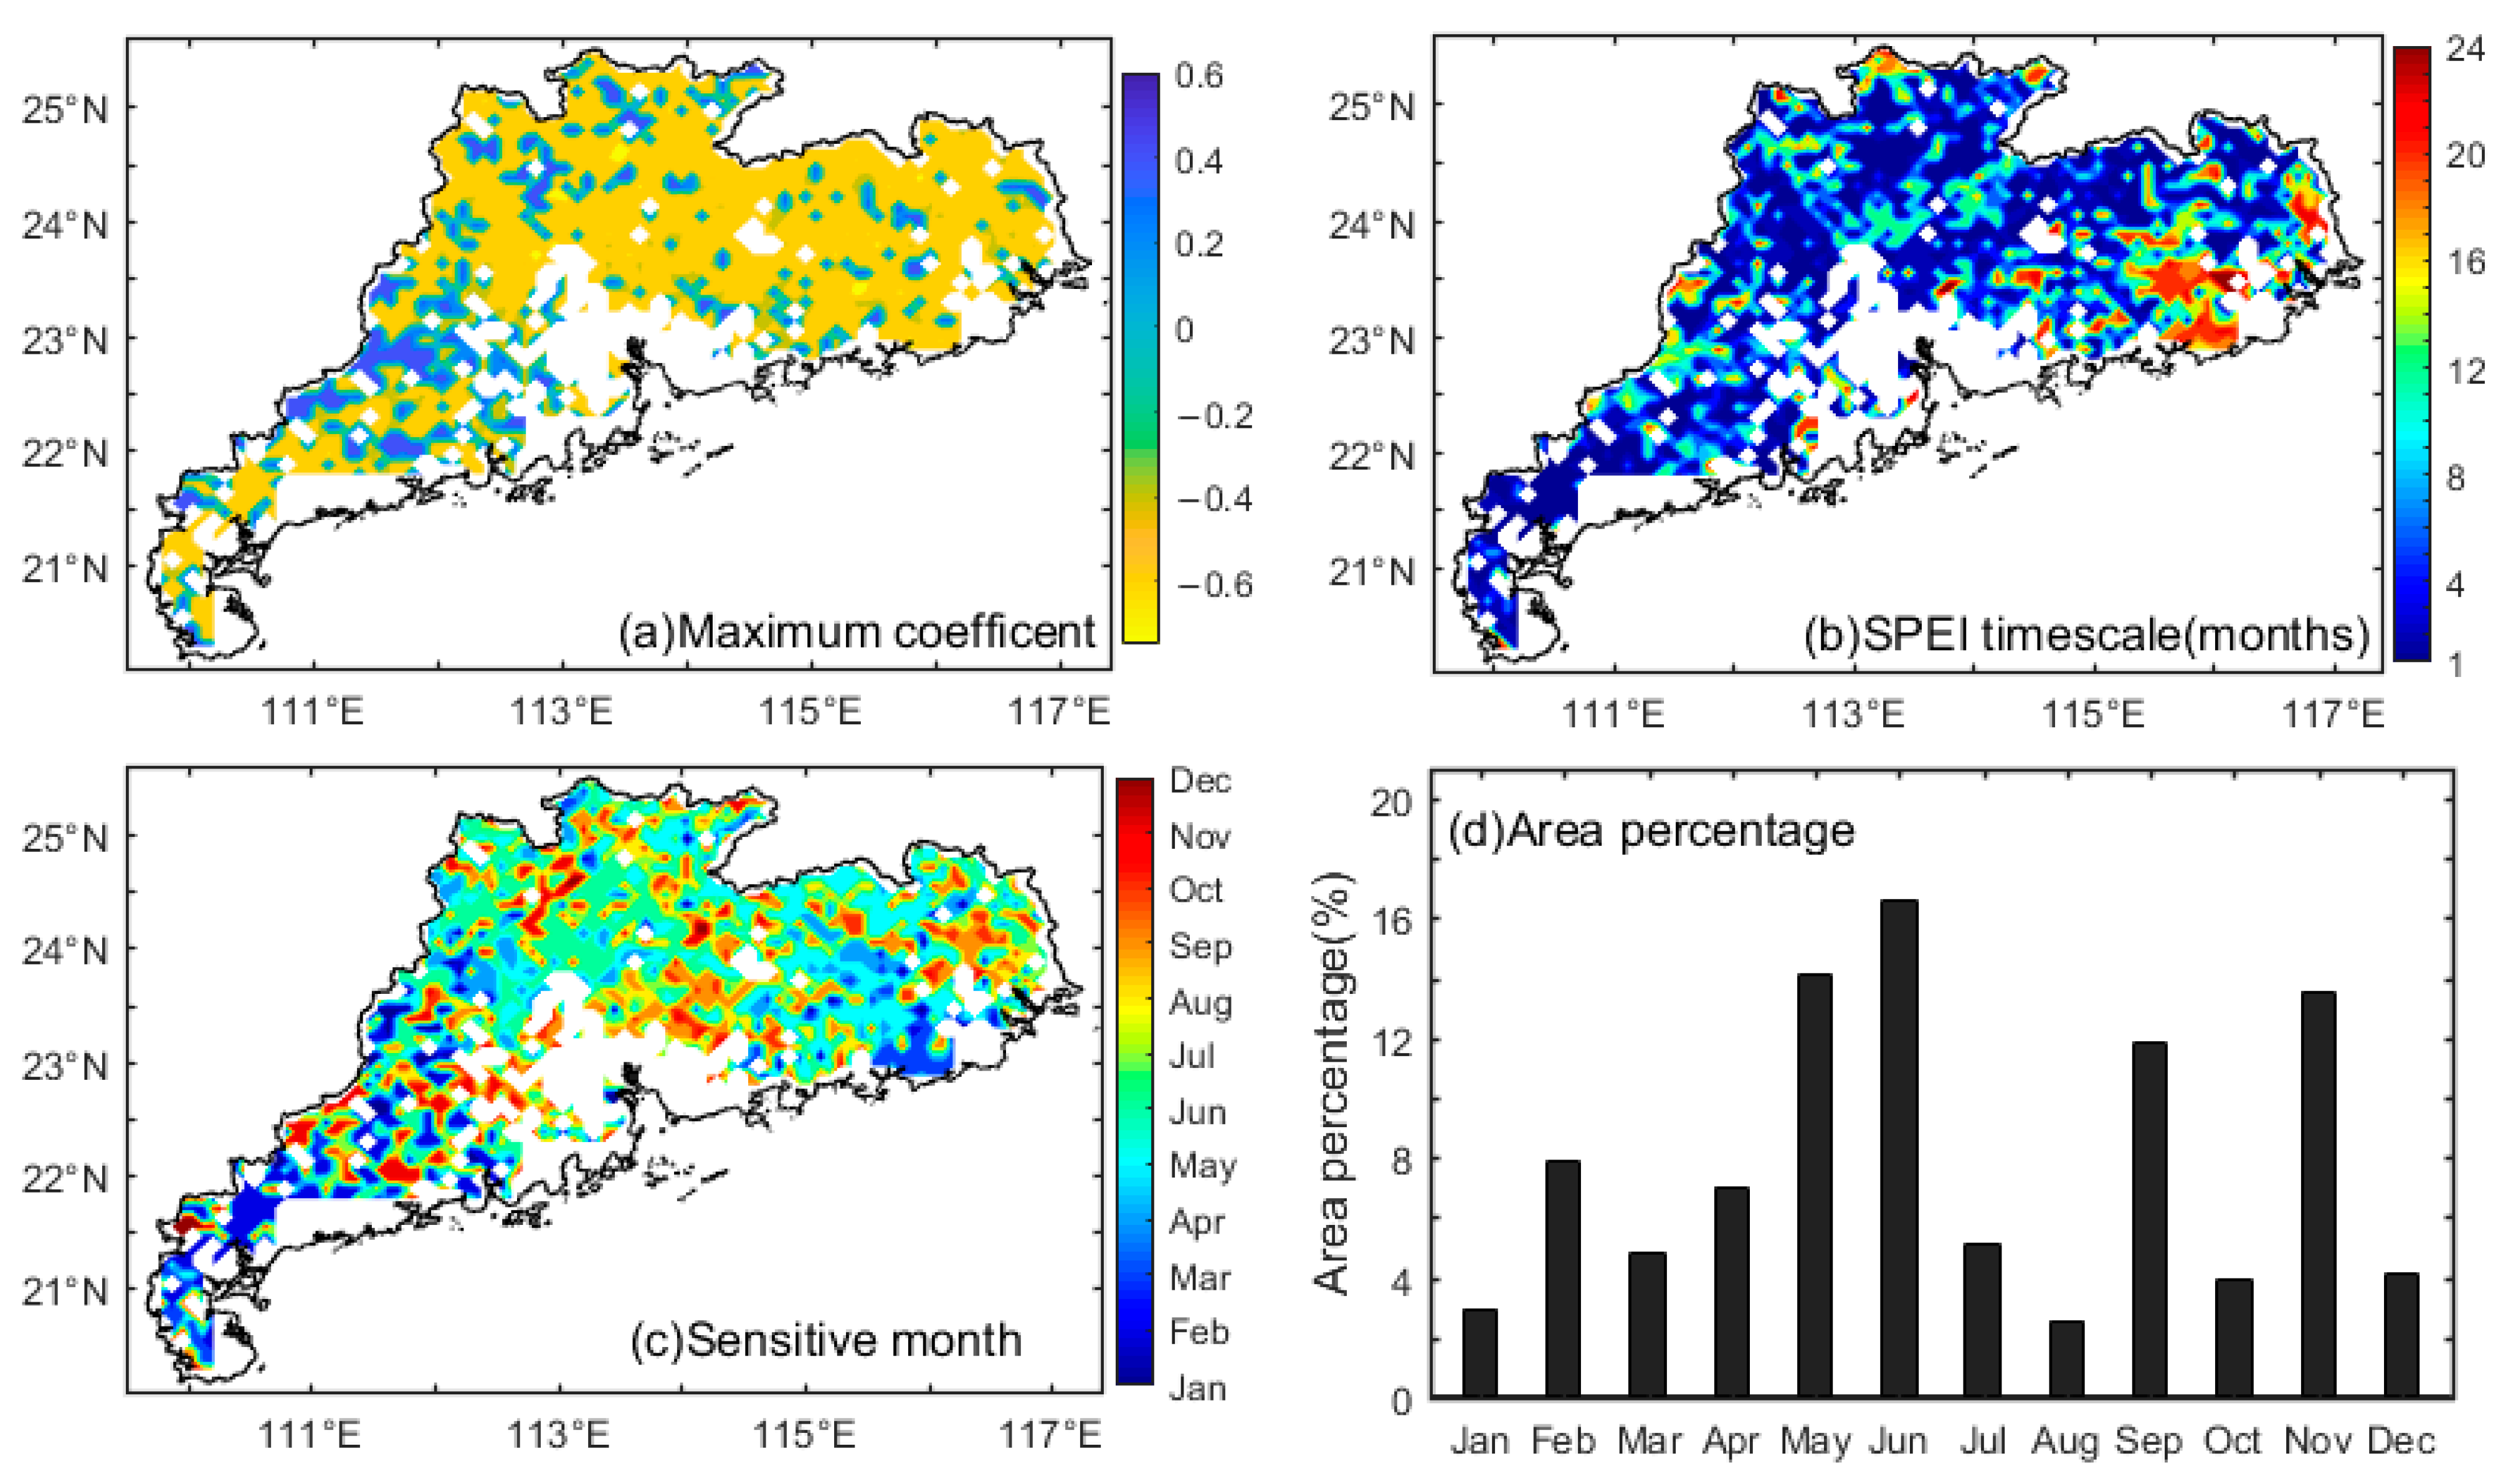
3.3. Sensitivity of Vegetation Responses to Drought

To further explore the strength of drought impact on vegetation, Figure 7a illustrates the spatial distribution of maximum correlation coefficients (Rmax) between the NDVI and the SPEI during 1982–2015. The Rmax was statistically significant in 94.47% of the vegetation area. A total of 73.02% of the vegetation area showed a negative correlation coefficient, whereas only 21.45% of it displayed a positive correlation coefficient. The Rmax value was −0.6 in most vegetation areas, indicating that vegetation was significantly inhibited by drought in Guangdong. The areas with the greater negative correlations were mainly located in northern and northeastern Guangdong, which is similar to the result from Figure 5.
Figure 7b analyzes the dominant timescale of vegetation responses to drought. The vegetation in Guangdong was more sensitive to the short-timescale drought. The proportion of the 1-month timescale was the highest (30.57% of the vegetation area), followed by that of the 2-month timescale (11.27%). The timescales of three months and four months respectively accounted for 6.50% and 4.97%, whereas those of the other longer months (5–24 months) rarely appeared. Thus, the dominant timescale of vegetation responses to drought was 1–2 months.
In addition, the most sensitive month in which vegetation responded to drought had great spatial heterogeneity in Guangdong (Figure 7c,d). The most sensitive month was June which accounted for 16.64% of the vegetation area, and this was followed by May, November, and September respectively making up 14.13%, 13.57%, and 11.83%. However, February and April respectively constituted 7.8% and 7.5%, while the other six months respectively occupied less than 5.0%. Additionally, by comparing the spatial distribution of Rmax with that of the most sensitive months, it can be found that drought in November had a positive impact on vegetation rather than a negative one. Thus, in Guangdong, the most sensitive month of vegetation responses to drought was June, followed by May and September.

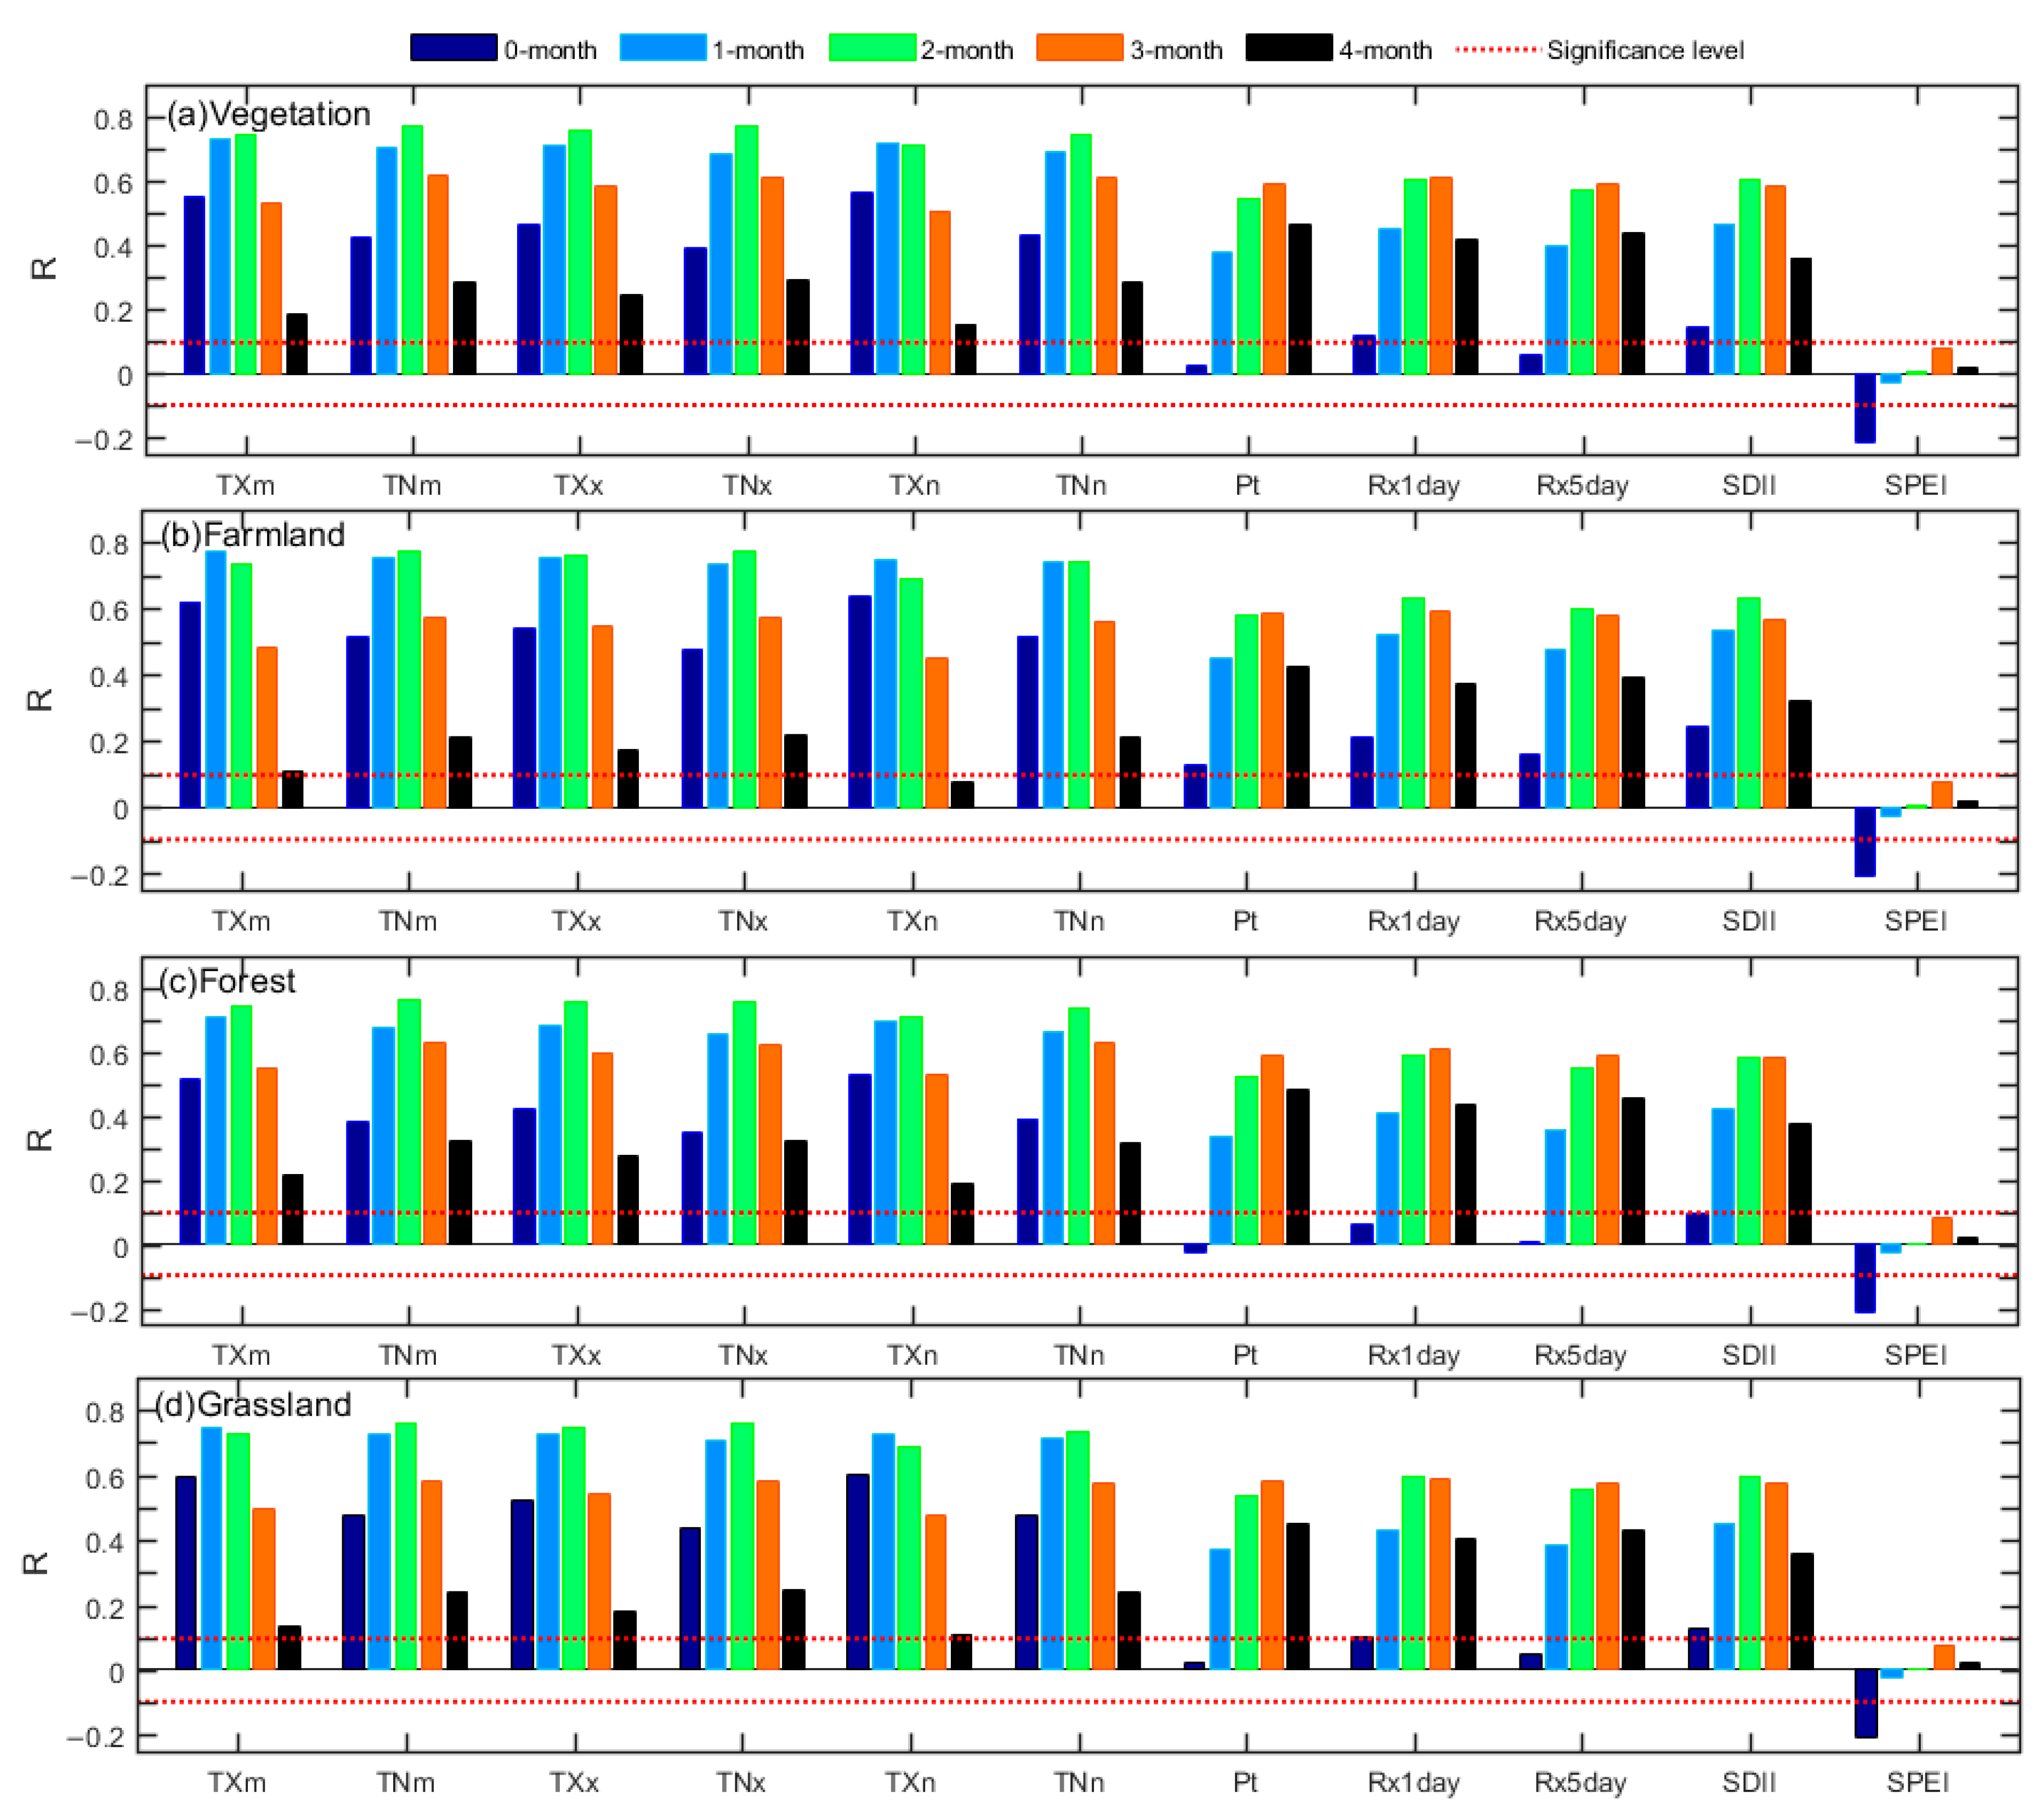
3.4. Time Lags of NDVI Responses to Climate Extremes

Vegetation dynamics usually has delay responses to climate extremes [35,36,37,54,56]. Figure 8 investigates the time-lagged response of the NDVI to the different climate extremes based on the regional mean. The coefficients with the time lag longer than five months were not shown as they were much weaker than those with the shorter time lag. For all vegetation, the coefficients were as high as 0.70 when the NDVI lagged the extreme temperature indices by 1–2 months. Except for TXm and TXn, the time lags of vegetation responses to the temperature indices were mostly two months. The responses of farmlands and grasslands to TXm and TXn displayed a 1-month time lag. With regard to the NDVI responses to precipitation extremes, the coefficients were around 0.60 when the NDVI lagged precipitation extremes by 2–3 months. The time lag for forests and grasslands was mostly three months, whereas it was approximately two months for farmlands. Thus, the response time lag of farmlands to precipitation extremes was one month shorter than that of forests and grasslands. However, the NDVI responses to the SPEI did not show any time lags, indicating that the influence of drought on vegetation occurred quickly in Guangdong.
Figure 9 illustrates the spatial heterogeneity of the time lag to further explore the vegetation’s delayed responses. For the temperature extremes (Figure 9a–f), the vegetation responses with a 2-month lag accounted for the largest part (45.0–63.0% of the vegetation area), and the vegetation responses with a 1-month lag mainly occurred in the parts of the farmland area (20.0–36.0% of the vegetation area). Only 8.0–25.0% of the vegetation showed a time lag of three months. The delayed responses of vegetation to precipitation extremes (Figure 9g–j) were spatially different from those to temperature extremes. The unequal lagged effects of temperature and precipitation extremes particularly occurred in some northern and northeastern regions.
By comparing the distribution of the lag results (Figure 9g–j) with that of land use and land cover classes (Figure 1e), we can vaguely find that the lag time of farmlands to precipitation extremes was shorter than that of the other two vegetation areas. The grids covered by a 3-month delay accounted for 48.0–53.0% of the vegetation area, whereas those with a 2-month delay constituted 15.0–28.0%. The vegetation responses with 4-month and 1-month lags were respectively scattered in a few areas of the central-northern and southwestern regions. However, the vegetation rarely showed delayed responses to drought; in other words, the grids with no time lag accounted for 88.0% of the vegetation area. The asymmetric responses of vegetation to the different climate extremes were distinguished in Guangdong.

4. Discussion

4.1. Variations in Climate Extremes

The SPEI is a good indicator for identifying drought and assessing the intensity and duration of drought [33,42,44]. The multiyear mean SPEI approximately decreased from southwest to northeast (results not shown). According to Figure 3, the trend rates of each climate index were strongly temporal heterogeneous, which highly proves that it is of great significance to carry out the research on a monthly scale. Both the increased rates of extreme temperatures and drought were the highest in February. The SPEI showed a significant drought trend in most months, and the extreme temperatures significantly increased in most corresponding months. The high temperature can enhance evaporation and increase soil drought conditions [57]. Thus, drought in Guangdong is mainly attributed to the increasing extreme temperature. In addition to the great warming rate of extreme temperatures, the significant decrease in precipitation would also contribute to the strong drought trend in February and April.
In order to further explore the spatial distributions of drought variations, Figure 10 illustrates the trend rate of the spatial SPEI, which was calculated by selecting the maximum rates of the SPEI among 24-timescale series (from 1-month to 24-month) in each pixel. The northeastern region and parts of northern Guangdong mostly witnessed a significant decreasing SPEI (in other words, a significant drought trend). In those regions, the trend rate of drought was mostly higher than 0.04 year−1 in many months, with the highest value around 0.06 year−1. The grids with intensified drought accounted for 73.02% of the vegetation area in April, respectively followed by 65.23% in February, 63.0% in May, 53.51% in March, and 46.80% in June. Around 41.0% of the vegetation area showed drought trends in July, August, September, October, and November, but only 35.63% in December and 25.96% in January. By comparing the spatial patterns of the variations of drought and temperature extremes [55], we can find that the vegetation area experiencing drought intensification mostly corresponded well with that suffering from the high increases of temperature extremes. This further clarifies the contribution that the temperature rise made to drought intensification in Guangdong.

4.2. Impact of Climate Extremes on Vegetation Change

Knowledge of vegetation responses to climate extremes is helpful for evaluating the vegetation vulnerability and resilience to climate extremes [24]. Over the past few decades, some parts of Guangdong have suffered from huge anthropogenic activities, such as rapid urbanization, economic development, and population growth [39,40]. The vegetation coverage in Guangdong was affected by local social changes and anthropogenic disturbances, which can weaken the accuracy of the relationship between climate extremes and the NDVI. In order to avoid the impact caused by the above disturbances, this study only considered the vegetation areas with unchanged vegetation types when analyzing the vegetation variation and the effects of climate extremes on vegetation. Thus, the results related to vegetation are reliable.
The vegetation greenness in China presents great northwest–southeast differences (Figure 1a). Highly different from northwestern China, most areas in Guangdong have a high vegetation cover rate. In the vegetation area of Guangdong, the vegetation activity strengthened in most months except June and October during 1982–2015 (Figure 4b), and it positively responded to the increased temperature indices in most months (Figure 6). Extreme temperature has a complex effect on vegetation [25,26]. Although high temperature usually precludes vegetation growth in many areas [26], sufficient precipitation would mitigate the negative effect of the increased high temperatures in South China [37]. Located in southern China, Guangdong had annual precipitation as high as 1780.9 mm in the past 34 years. Therefore, the adverse effect of the rise in extreme temperature rarely occurred in Guangdong, and the increasing extreme temperature promoted plant growth in most months.
The impact of precipitation extremes on vegetation was weaker than that of temperature extremes in Guangdong (Figure 5 and Figure 6), which is similar to that in Guangxi [37]. The vegetation in Guangdong has sufficient water for growth and extreme precipitation is a less important factor affecting vegetation, which differs significantly from that in arid and semi-arid regions where vegetation is sensitive to limited precipitation [26,29,34]. The negative effect of precipitation extremes mainly occurred in the northern and northeastern parts of Guangdong which possesses less precipitation. The decreased extreme precipitation in February and April tended to prevent vegetation growth.
Drought implies a deficit in water availability which differs from the normal level [42]. Vegetation recovery is usually slow after severe damage from drought [8]. Owing to the regulation of precipitation, the correlations between vegetation and drought in humid regions are relatively weaker than those in arid regions of China [29]. However, this study finds that vegetation growth was widely inhibited by drought in Guangdong (Figure 5k,l and Figure 6k). February, April, and June generally witnessed increased extreme temperatures and the adverse effect of precipitation extremes on vegetation, which can well explain the negative effect of drought on vegetation in those months. In addition, on account of the significant drought trend in February and April, the vegetation growth was further greatly restrained in those three months.
Vegetation type can influence the effect of climate extremes on vegetation dynamics [13,58]. For the effect of temperature extremes on vegetation, the correlation magnitudes among the three types of vegetation were slightly different in each month, but the differences were not significant. Except for June, the correlation between precipitation extremes and vegetation activities in each month was basically the same or insignificant for the three types of vegetation. In June, the forest area was more sensitive to extreme precipitation than the other two vegetation areas. In terms of drought impact, the forest area was relatively more affected in June, whereas the farmland area was more influenced in February. Thus, the analysis on a monthly scale clearly reflects the influences of climate extremes on vegetation in different growing periods.

4.3. Sensitivity Analysis of Vegetation Responses to Drought

The physiological response of vegetation to drought determines the resistance and resilience of vegetation to water deficit [8]. Drought conditions may be different when being calculated during different periods. Vegetation responds differently to drought on different timescales [8], and the timescale of drought can highly affect the magnitude of vegetation responses [20,59]. It is necessary to consider drought on different timescales when the effect of drought on vegetation is assessed [29,45].
The timescale of vegetation responses to drought in Guangdong was thoroughly investigated in this study. Figure 5 points out that the influence of drought on vegetation mainly happened on the short timescales (1–3 months), with drought on the 1-month timescale showing the greatest impact on vegetation. According to Figure 5 and Figure 7a, vegetation was significantly inhibited by drought in most vegetation areas of Guangdong, with the greater negative correlations mainly located in northern and northeastern Guangdong. The effect of drought on vegetation in Guangdong highly differs from that in many other regions where drought was positively related to vegetation dynamics [19,20,29,59].
Meanwhile, although the vegetation in humid regions was mostly inclined to respond to long-term drought [8], the vegetation in Guangdong was the most sensitive to drought on timescales of 1–2 months (Figure 7b). The dominant timescale in Guangdong was much shorter than that in many other regions, such as Qiling [20], and the Continental United States [17]. These imply that the vegetation in Guangdong had a rapid response and weak resistance to drought. In addition, although the forest area was generally sensitive to longer-timescale droughts, as the plant roots are mostly long and can reach groundwater [60], this research did not find a tremendously clear difference in the drought timescales among farmlands, forests, and grasslands.
According to Figure 6, February, April, and June witnessed a negative vegetation response to 1-month timescale drought. May and September experienced a similar but weaker vegetation response to drought when the SPEI timescale was longer than one month or even 12 months. Those partly indicate that the vegetation in February, April, and June was more sensitive to short-timescale drought, while the vegetation in May and September was more sensitive to longer-timescale drought. Furthermore, the most sensitive month of vegetation responses to drought in Guangdong was June, closely followed by May and September (Figure 7c,d). According to Qi et al. [20], the vegetation in the Qinling Mountains of China was also the most sensitive to drought in May and June. June and May are the critical periods for vegetation growth in Guangdong, especially for crops, such as rice, vegetables, peanuts, tuber crops, sugar cane, corn, and soybeans. For instance, the rice in June is mostly at the heading and flowering stage, often suffering from high temperatures [61]. Although irrigation can mitigate the adverse effects of drought and other extreme climatic events on rice to some extent, drought often tends to amplify the negative effects of extreme heat on crop production [14]. Thus, the crop growth in those periods will be greatly inhibited.

4.4. Lagged Responses of Vegetation to Different Climate Extremes

The lag of vegetation responses to climate extremes was thoroughly investigated in this study (Figure 8 and Figure 9). The farmland, forest, and grassland areas generally responded to temperature extremes with two months’ time-lag effects, but they showed different lag responses to precipitation extremes. The farmland area responded to extreme precipitation with a lag of two months, one month earlier than the forest and grassland areas. Therefore, the response of forests and grasslands to temperature extremes was one month earlier than that to precipitation extremes, but the farmland area showed a similar time lag to the temperature and precipitation extremes. The time lags in vegetation responses to temperature and precipitation extremes in Guangdong were longer than those in Guangxi and the whole Central Asia [35,37]. The vegetation response to soil moisture typically showed a 1-month time lag [62], which partly explains the lag in vegetation responses to temperature extremes.
Although both the temperature and precipitation extremes showed obvious time-lag effects on vegetation, drought did not have any time-lag effects on vegetation growth in Guangdong. This implies that the responses of vegetation to drought were faster than those to other climate extremes in Guangdong. The farmland, grassland, and forest vegetation responded to drought immediately, without any difference among the three types of vegetation. However, drought has lag effects on vegetation in some other places, such as the Continental United States [17]. The lack of lag in vegetation responses to drought further indicates that drought will generate a great threat to vegetation growth in Guangdong with the increase in extreme temperature.
Overall, the temperature extremes showed the strongest correlation with vegetation dynamics in Guangdong, followed by drought. The increasing extreme temperature promoted plant growth in most months. Nevertheless, drought exerted a negative effect on plant growth in February, April, May, June, and September, and the precipitation extremes made a negative effect in February, April, and June. Although the inhibiting effects of drought and precipitation extremes on vegetation were relatively weaker than the promoting effects of temperature extremes, the inhibiting effects of drought and precipitation extremes should be paid more attention. Based on the categorization of extreme climate effects on vegetation dynamics [26], Guangdong belongs to the heat-promoting and drought-inhibiting compound type.
The monthly scale analysis shows that the responses of vegetation to climate extremes displayed great temporal heterogeneity in different months. Thus, it is an effective approach to understand how vegetation responds to climate extremes in different growing periods. This study can help find effective preventive measures for the protection of the Guangdong ecosystem. Drought can easily reduce vegetation activity and slow plant growth [8]. Appropriate measures, for example, introducing drought-resistant vegetation, should be formulated to reduce the damage caused by drought in February, April, May, June, and September. People can also lessen drought effects on agriculture by using irrigation and film-mulching, especially in June and May. Moreover, this work is particularly important under the background of ongoing global warming. The effect of future drought will almost certainly be worsened by rising temperatures [28]. The future temperature may frequently go beyond the vegetation’s optimum and enhance drought degrees. Prolonged exposure to climate extremes may result in fragile vegetation. People should take precautions against heat threats and related threats in Guangdong.

4.5. Limitations and Uncertainties

Although the GIMMS NDVI data have been proven to be reliable for this kind of study [47], there were some limitations and uncertainties in the study. Firstly, the GIMMS NDVI data are indirect remote sensing data, and their accuracy is limited to the satellite sensor sensitivity [63,64]. There may be some errors in the modeled NDVI because of the influence of the fragmentized terrain and saturated problem [64]. In addition, the differences in the data resolution may lead to weaknesses in the result. There were uncertainties when the climate data were resampled to the spatial resolution of the GIMMS NDVI data. Furthermore, changes in vegetation have feedback to the climate system [3,5], and the vegetation–climate interactions are highly heterogeneous [8,58]. This study did not strictly consider the feedback of vegetation to climate extremes. More information is required to analyze the vegetation–climate interactions in the future. Future work should address these uncertainties to obtain more valuable conclusions.

5. Conclusions

This paper analyzed the impacts of different climate extremes (temperature extremes, precipitation extremes, and drought) on vegetation dynamics on a monthly scale in Guangdong from 1982 to 2015, mainly focusing on vegetation response to drought. The major conclusions are summarized as follows.
(1) Drought showed an increasing trend in most months, corresponding to the increase in extreme temperatures. The stronger trend rates of drought happened in February and April. Except for June and October, the vegetation in other months showed a significant greening trend.
(2) The vegetation dynamics displayed strong and positive correlations with the enchanted temperature extremes in most months. However, it showed great negative correlations with precipitation extremes and 1-month timescale drought in February, April, and June, and with long-timescale drought in May and September. The response of vegetation to drought was the most sensitive in June.
(3) For various timescales, the most significant negative correlation between vegetation and drought mainly occurred on the timescales of one to two months. With a rapid response and weak resistance to drought, the vegetation did not have any time lag. However, the vegetation responded to temperature and precipitation extremes with a time lag of at least two months.
The results promote our insight into the interaction between vegetation and climate and help improve the sustainable use of natural resources and facilitate the implementation of reasonable mitigation measures.

Author Contributions

Conceptualization, L.W. and F.H.; methodology, M.L., L.W. and F.H.; validation, C.Z. and Y.M.; formal analysis, H.C. and K.Z.; investigation, M.L. and L.W.; data curation, L.W. and F.H.; writing—original draft preparation, L.W., F.H. and M.L.; writing—review and editing, L.W., C.Z., Y.M., H.C. and K.Z.; visualization, L.W. and F.H.; supervision, M.L.; project administration, L.W. and F.H.; funding acquisition, L.W. and F.H. All authors have read and agreed to the published version of the manuscript.

Funding

This work was supported by the National Natural Science Foundation of China (Grant No. 42005142) and Compilation of the second South China Regional Climate Change Assessment Report (Grant No. CCSF202012).

Data Availability Statement

All the data are available in the public domain at the links provided in the texts.

Acknowledgments

Thanks to the China Meteorological Administration (CMA) for providing the meteorological data. Thanks to all editors and commenters.

Conflicts of Interest

The authors declare no conflict of interest.

References

  1. Braswell, B.H.; Schimel, D.S.; Linder, E.; Moore, B. The response of global terrestrial ecosystems to interannual temperature variability. Science 1997, 278, 870–872. [Google Scholar] [CrossRef]
  2. Nolan, C.; Overpeck, J.T.; Allen, J.R.; Anderson, P.M.; Betancourt, J.L.; Binney, H.A.; Brewer, S.; Bush, M.B.; Chase, B.M.; Cheddadi, R.; et al. Past and future global transformation of terrestrial ecosystems under climate change. Science 2018, 361, 920–923. [Google Scholar] [CrossRef] [PubMed] [Green Version]
  3. Schlesinger, W.H.; Jasechko, S. Transpiration in the global water cycle. Agric. For. Meteorol. 2014, 189, 115–117. [Google Scholar] [CrossRef]
  4. Jiang, L.; Bao, A.; Guo, H.; Ndayisaba, F. Vegetation dynamics and responses to climate change and human activities in Central Asia. Sci. Total Environ. 2017, 599–600, 967–980. [Google Scholar] [CrossRef]
  5. Cui, L.; Wang, L.; Qu, S.; Singh, R.P.; Lai, Z.; Yao, R. Spatiotemporal extremes of temperature and precipitation during 1960–2015 in the Yangtze River Basin (China) and impacts on vegetation dynamics. Theor. Appl. Climatol. 2019, 136, 675–692. [Google Scholar] [CrossRef]
  6. Silberstein, R.P.; Vertessy, R.A.; Morris, J.; Feikema, P.M. Modelling the effects of soil moisture and solute conditions on long-term tree growth and water use: A case study from the Shepparton irrigation area, Australia. Agric. Water Manag. 1999, 39, 283–315. [Google Scholar] [CrossRef]
  7. Ciais, P.; Reichstein, M.; Viovy, N.; Granier, A.; Ogée, J.; Allard, V.; Aubinet, M.; Buchmann, N.; Bernhofer, C.; Carrara, A.; et al. Europe-wide reduction in primary productivity caused by the heat and drought in 2003. Nature 2005, 437, 529–533. [Google Scholar] [CrossRef]
  8. Vicente-Serrano, S.M.; Gouveia, C.; Camarero, J.J.; Beguería, S.; Trigo, R.; López-Moreno, J.I.; Azorín-Molina, C.; Pasho, E.; Lorenzo-Lacruz, J.; Revuelto, J.; et al. Response of vegetation to drought time-scales across global land biomes. Proc. Natl. Acad. Sci. USA 2013, 110, 52–57. [Google Scholar] [CrossRef] [Green Version]
  9. Rammig, A.; Wiedermann, M.; Donges, J.F.; Babst, F.; Von Bloh, W.; Frank, D.; Thonicke, K.; Mahecha, M.D. Coincidences of climate extremes and anomalous vegetation responses: Comparing tree ring patterns to simulated productivity. Biogeosciences 2015, 12, 373–385. [Google Scholar] [CrossRef] [Green Version]
  10. Choat, B.; Brodribb, T.J.; Brodersen, C.R.; Duursma, R.A.; López, R.; Medlyn, B.E. Triggers of tree mortality under drought. Nature 2018, 558, 531–539. [Google Scholar] [CrossRef]
  11. Pan, N.; Feng, X.; Fu, B.; Wang, S.; Ji, F.; Pan, S. Increasing global vegetation browning hidden in overall vegetation greening: Insights from time-varying trends. Remote Sens. Environ. 2018, 214, 59–72. [Google Scholar] [CrossRef]
  12. Abera, T.A.; Heiskanen, J.; Pellikka, P.; Maeda, E.E. Impact of rainfall extremes on energy exchange and surface temperature anomalies across biomes in the Horn of Africa. Agric. For. Meteorol. 2020, 280, 107779. [Google Scholar] [CrossRef]
  13. Zhang, W.; Wang, L.; Xiang, F.; Qin, W.; Jiang, W. Vegetation dynamics and the relations with climate change at multiple time scales in the Yangtze River and Yellow River Basin, China. Ecol. Indic. 2020, 110, 105892. [Google Scholar] [CrossRef]
  14. Lesk, C.; Coffel, E.; Winter, J.; Ray, D.; Zscheischler, J.; Seneviratne, S.I.; Horton, R. Stronger temperature–moisture couplings exacerbate the impact of climate warming on global crop yields. Nat. Food 2021, 2, 683–691. [Google Scholar] [CrossRef]
  15. Wu, C.; Peng, J.; Ciais, P.; Peñuelas, J.; Wang, H.; Beguería, S.; Andrew Black, T.; Jassal, R.S.; Zhang, X.; Yuan, W.; et al. Increased drought effects on the phenology of autumn leaf senescence. Nat. Clim. Chang. 2022, 12, 943–949. [Google Scholar] [CrossRef]
  16. Sohoulande Djebou, D.C. Bridging drought and climate aridity. J. Arid. Environ. 2017, 144, 170–180. [Google Scholar] [CrossRef]
  17. Zhong, S.; Sun, Z.; Di, L. Characteristics of vegetation response to drought in the CONUS based on long-term remote sensing and meteorological data. Ecol. Indic. 2021, 127, 107767. [Google Scholar] [CrossRef]
  18. Reichstein, M.; Bahn, M.; Ciais, P.; Frank, D.; Mahecha, M.D.; Seneviratne, S.I.; Zscheischler, J.; Beer, C.; Buchmann, N.; Frank, D.C.; et al. Climate extremes and the carbon cycle. Nature 2013, 500, 287–295. [Google Scholar] [CrossRef]
  19. Deng, H.; Yin, Y.; Xiang, H. Vulnerability of vegetation activities to drought in Central Asia. Environ. Res. Lett. 2020, 15, 084005. [Google Scholar] [CrossRef]
  20. Qi, G.; Song, J.; Qi, L.; Bai, H.; Sun, H.; Zhang, S.; Cheng, D. Response of vegetation to multi-timescales drought in the Qinling Mountains of China. Ecol. Indic. 2022, 135, 108539. [Google Scholar] [CrossRef]
  21. You, Q.; Kang, S.; Aguilar, E.; Pepin, N.; Flügel, W.A.; Yan, Y.; Xu, Y.; Zhang, Y.; Huang, J. Changes in daily climate extremes in China and their connection to the large scale atmospheric circulation during 1961–2003. Clim. Dyn. 2011, 36, 2399–2417. [Google Scholar] [CrossRef]
  22. Yu, M.; Li, Q.; Hayes, M.J.; Svoboda, M.D.; Heim, R.R. Are droughts becoming more frequent or severe in China based on the standardized precipitation evapotranspiration index: 1951–2010? Int. J. Climatol. 2014, 34, 545–558. [Google Scholar] [CrossRef] [Green Version]
  23. Xu, X.; Piao, S.; Wang, X.; Chen, A.; Ciais, P.; Myneni, R.B. Spatio-temporal patterns of the area experiencing negative vegetation growth anomalies in China over the last three decades. Environ. Res. Lett. 2012, 7, 035701. [Google Scholar] [CrossRef]
  24. Mulder, C.P.H.; Iles, D.T.; Rockwell, R.F. Increased variance in temperature and lag effects alter phenological responses to rapid warming in a subarctic plant community. Glob. Chang. Biol. 2016, 23, 801–814. [Google Scholar] [CrossRef] [PubMed]
  25. Peng, S.; Piao, S.; Ciais, P.; Myneni, R.B.; Chen, A.; Chevallier, F.; Dolman, A.J.; Janssens, I.A.; Penuelas, J.; Zhang, G.; et al. Asymmetric effects of daytime and night-time warming on Northern Hemisphere vegetation. Nature 2013, 501, 88–92. [Google Scholar] [CrossRef]
  26. Li, S.; Wei, F.; Wang, Z.; Shen, J.; Liang, Z.; Wang, H.; Li, S. Spatial heterogeneity and complexity of the impact of extreme climate on vegetation in China. Sustainability 2021, 13, 5748. [Google Scholar] [CrossRef]
  27. Xu, G.; Zhang, H.; Chen, B.; Zhang, H.; Innes, J.L.; Wang, G.; Yan, J.; Zheng, Y.; Zhu, Z.; Myneni, R.B. Changes in vegetation growth dynamics and relations with climate over China landmass from 1982 to 2011. Remote Sens. 2014, 6, 3263–3283. [Google Scholar] [CrossRef] [Green Version]
  28. Trenberth, K.E.; Dai, A.; Van Der Schrier, G.; Jones, P.D.; Barichivich, J.; Briffa, K.R.; Sheffield, J. Global warming and changes in drought. Nat. Clim. Chang. 2014, 4, 17–22. [Google Scholar] [CrossRef]
  29. Zhang, Q.; Kong, D.D.; Singh, V.P.; Shi, P.J. Response of vegetation to different time-scales drought across China: Spatiotemporal patterns, causes and implications. Glob. Planet. Chang. 2017, 152, 1–11. [Google Scholar] [CrossRef] [Green Version]
  30. Barichivich, J.; Briffa, K.R.; Myneni, R.B.; Osborn, T.J.; Melvin, T.M.; Ciais, P.; Piao, S.; Tucker, C. Large-scale variations in the vegetation growing season and annual cycle of atmospheric CO2 at high northern latitudes from 1950 to 2011. Glob. Chang. Biol. 2013, 19, 3167–3183. [Google Scholar] [CrossRef]
  31. Piao, S.L.; Nan, H.J.; Huntingford, C. Evidence for a weakening relationship between interannual temperature variability and northern vegetation activity. Nat. Commun. 2014, 5, 5058. [Google Scholar] [CrossRef] [PubMed] [Green Version]
  32. Dubovyk, O.; Landmann, T.; Dietz, A.; Menz, G. Quantifying the impacts of environmental factors on vegetation dynamics over climatic and management gradients of Central Asia. Remote Sens. 2016, 8, 600. [Google Scholar] [CrossRef] [Green Version]
  33. Schuldt, B.; Buras, A.; Arend, M.; Vitasse, Y.; Beierkuhnlein, C.; Damm, A.; Gharun, M.; Grams, T.E.; Hauck, M.; Hajek, P.; et al. A first assessment of the impact of the extreme 2018 summer drought on Central European forests. Basic Appl. Ecol. 2020, 45, 86–103. [Google Scholar] [CrossRef]
  34. Liu, Y.; Lei, H. Responses of natural vegetation dynamics to climate drivers in China from 1982 to 2011. Remote Sens. 2015, 7, 10243–10268. [Google Scholar] [CrossRef] [Green Version]
  35. Luo, M.; Sa, C.; Meng, F.; Duan, Y.; Liu, T.; Bao, Y. Assessing extreme climatic changes on a monthly scale and their implications for vegetation in Central Asia. J. Clean. Prod. 2020, 271, 122396. [Google Scholar] [CrossRef]
  36. Wen, Y.; Liu, X.; Yang, J.; Lin, K.; Du, G. NDVI indicated inter-seasonal non-uniform time-lag responses of terrestrial vegetation growth to daily maximum and minimum temperature. Glob. Planet. Chang. 2019, 177, 27–38. [Google Scholar] [CrossRef]
  37. Wang, L.; Hu, F.; Miao, Y.; Zhang, C.; Zhang, L.; Luo, M. Changes in Vegetation Dynamics and Relations with Extreme Climate on Multiple Time Scales in Guangxi, China. Remote Sens. 2022, 14, 2013. [Google Scholar] [CrossRef]
  38. Wu, X.; Hao, Z.; Hao, F.; Zhang, X. Variations of compound precipitation and temperature extremes in China during 1961–2014. Sci. Total Environ. 2019, 663, 731–737. [Google Scholar] [CrossRef]
  39. Zhao, X.; Zhang, Z.; Wang, X.; Zuo, L.; Liu, B.; Yi, L.; Xu, J.; Wen, Q. Analysis of Chinese cultivated land’s spatial temporal changes and causes in recent 30 years. Trans. Chin. Soc. Agric. Eng. 2014, 30, 1–11. (In Chinese) [Google Scholar]
  40. Abbas, S.; Nichol, J.E.; Wong, M.S. Trends in vegetation productivity related to climate change in China’s Pearl River Delta. PLoS ONE 2021, 16, e0245467. [Google Scholar] [CrossRef]
  41. Easterling, D.R.; Alexander, L.V.; Mokssit, A.; Detemmerman, V. CCI/CLIVAR workshop to develop priority climate indices. Bull. Am. Meteor. Soc. 2003, 84, 1403–1407. [Google Scholar]
  42. Slette, I.J.; Smith, M.D.; Knapp, A.K.; Vicente-Serrano, S.M.; Camarero, J.J.; Beguería, S. Standardized metrics are key for assessing drought severity. Glob. Chang. Biol. 2020, 26, e1–e3. [Google Scholar] [CrossRef] [PubMed]
  43. Vicente-Serrano, S.M.; Beguería, S.; Lopez-Moreno, J.I. A Multiscalar Drought Index Sensitive to Global Warming: The Standardized Precipitation Evapotranspiration Index. J. Clim. 2010, 23, 1696–1718. [Google Scholar] [CrossRef] [Green Version]
  44. Schwalm, C.R.; Anderegg, W.R.; Michalak, A.M.; Fisher, J.B.; Biondi, F.; Koch, G.; Litvak, M.; Ogle, K.; Shaw, J.D.; Wolf, A.; et al. Global patterns of drought recovery. Nature 2017, 548, 202–205. [Google Scholar] [CrossRef] [PubMed]
  45. Deng, Y.; Wu, D.; Wang, X.; Xie, Z. Responding time scales of vegetation production to extreme droughts over China. Ecol. Indic. 2022, 136, 108630. [Google Scholar] [CrossRef]
  46. Chua, Z.-W.; Kuleshov, Y.; Watkins, A.B. Drought detection over Papua New Guinea using satellite-derived products. Remote Sens. 2020, 12, 3859. [Google Scholar] [CrossRef]
  47. Zhu, Z.; Bi, J.; Pan, Y.; Ganguly, S.; Anav, A.; Xu, L.; Samanta, A.; Piao, S.; Nemani, R.R.; Myneni, R.B. Global Data Sets of Vegetation Leaf Area Index (LAI)3g and Fraction of Photosynthetically Active Radiation (FPAR)3g Derived from Global Inventory Modeling and Mapping Studies (GIMMS) Normalized Difference Vegetation Index (NDVI3g) for the Period 1981 to 2011. Remote Sens. 2013, 5, 927–948. [Google Scholar]
  48. Tucker, C.J.; Pinzon, J.E.; Brown, M.E.; Slayback, D.A.; Pak, E.W.; Mahoney, R.; Vermote, E.; Saleous, N.E. An extended AVHRR 8-km NDVDI dataset compatible with MODIS and SPOT vegetation NDVI data. Int. J. Remote Sens. 2005, 26, 4485–4498. [Google Scholar] [CrossRef]
  49. Fensholt, R.; Proud, S.R. Evaluation of Earth Observation based global long term vegetation Trends-Comparing GIMMS and MODIS global NDVI time series. Remote Sens. Environ. 2012, 119, 131–147. [Google Scholar] [CrossRef]
  50. Sarmah, S.; Jia, G.; Zhang, A.; Singha, M. Assessing seasonal trends and variability of vegetation growth from NDVI3g, MODIS NDVI and EVI over South Asia. Remote Sens. Lett. 2018, 9, 1195–1204. [Google Scholar] [CrossRef]
  51. Zeng, F.W.; Collatz, G.J.; Pinzon, J.E.; Ivanoff, A. Evaluating and quantifying the climate-driven interannual variability in Global Inventory Modeling and Mapping Studies (GIMMS) Normalized Difference Vegetation Index (NDVI3g) at Global Scales. Remote Sens. 2013, 5, 3918–3950. [Google Scholar] [CrossRef] [Green Version]
  52. Sen, P.K. Estimates of the regression coefficient based on Kendall’s tau. J. Am. Stat. Assoc. 1968, 63, 1379–1389. [Google Scholar] [CrossRef]
  53. Mann, H.B. Nonparametric tests against trend. Econom. J. Econ. Soc. 1945, 13, 245–259. [Google Scholar] [CrossRef]
  54. Wu, D.; Zhao, X.; Liang, S.; Zhou, T.; Huang, K.; Tang, B.; Zhao, W. Time-lag effects of global vegetation responses to climate change. Glob. Chang. Biol. 2015, 21, 3520–3531. [Google Scholar] [CrossRef] [PubMed]
  55. Wang, L.; Hu, F.; Hu, J.; Chen, C.; Liu, X.; Zhang, D.; Chen, T.; Miao, Y.; Zhang, L. Multistage spatiotemporal variability of temperature extremes over South China from 1961 to 2018. Theor. Appl. Climatol. 2021, 146, 243–256. [Google Scholar] [CrossRef]
  56. Wen, Z.; Wu, S.; Chen, J.; Lü, M. NDVI indicated long-term interannual changes in vegetation activities and their responses to climatic and anthropogenic factors in the Three Gorges Reservoir Region, China. Sci. Total Environ. 2017, 574, 947–959. [Google Scholar] [CrossRef]
  57. Yan, H.; Yu, Q.; Zhu, Z.; Myneni, R.B.; Yan, H.; Wang, S.; Shugart, H.H. Diagnostic analysis of interannual variation of global land evapotranspiration over 1982–2011: Assessing the impact of ENSO. J. Geophys. Res. Atmos. 2013, 118, 8969–8983. [Google Scholar] [CrossRef]
  58. Hua, W.; Chen, H.; Zhou, L.; Xie, Z.; Qin, M.; Li, X.; Ma, H.; Huang, Q.; Sun, S. Observational Quantification of Climatic and Human Influences on Vegetation Greening in China. Remote Sens. 2017, 9, 425. [Google Scholar] [CrossRef] [Green Version]
  59. Vicente-Serrano, S.M.; Azorin-Molina, C.; Peña-Gallardo, M.; Tomas-Burguera, M.; Domínguez-Castro, F.; Martín-Hernández, N.; Beguería, S.; El Kenawy, A.; Noguera, I.; García, M. A high-resolution spatial assessment of the impacts of drought variability on vegetation activity in Spain from 1981 to 2015. Nat. Hazards Earth Syst. Sci. 2019, 19, 1189–1213. [Google Scholar] [CrossRef] [Green Version]
  60. Jiang, P.; Ding, W.; Yuan, Y.; Ye, W. Diverse response of vegetation growth to multi-time-scale drought under different soil textures in China’s pastoral areas. J. Environ. Manag. 2020, 274, 110992. [Google Scholar] [CrossRef]
  61. Sun, W.; Huang, Y. Global warming over the period 1961–2008 did not increase high-temperature stress but did reduce low-temperature stress in irrigated rice across China. Agric. For. Meteorol. 2011, 151, 1193–1201. [Google Scholar] [CrossRef]
  62. Chen, T.; De Jeu, R.; Liu, Y.; Van der Werf, G.; Dolman, A. Using satellite based soil moisture to quantify the water driven variability in NDVI: A case study over mainland Australia. Remote Sens. Environ. 2014, 140, 330–338. [Google Scholar] [CrossRef]
  63. Julien, Y.; Sobrino, J.A. Comparison of cloud-reconstruction methods for time series of composite NDVI data. Remote Sens. Environ. 2010, 114, 618–625. [Google Scholar] [CrossRef]
  64. Brantley, S.T.; Zinnert, J.C.; Young, D.R. Application of hyperspectral vegetation indices to detect variations in high leaf area index temperate shrub thicket canopies. Remote Sens. Environ. 2011, 115, 514–523. [Google Scholar] [CrossRef]
Figure 1. The geographic location of the study area, and spatial distribution of meteorological stations and land use land cover classes (LULC). Note: the normalized difference vegetation index (NDVI) data originated from the advanced very-high-resolution radiometer sensors of the National Oceanic and Atmospheric Administration (https://www.nasa.gov/nex (accessed on 1 January 2021)); the digital elevation data and the LULC data were provided by the Resource and Environment Science and Data Center, Chinese Academy of Sciences (https://www.resdc.cn/ (accessed on 10 October 2021)); only the vegetation areas where the vegetation types did not change during 1982–2018 are colored in (e).
Remotesensing 14 05369 g001
Figure 2. Flowchart of this study.
Remotesensing 14 05369 g002
Figure 3. Drought frequency (SPEI ≤ −0.5) under the different timescales SPEI (from 1-month scale to 12-month scale) (a); regional trend rates of extreme temperatures during 1982–2015 (b); regional trend rates of extreme precipitations during 1982–2015 (c); maximum trend rates among the different timescales SPEI during 1982–2015 (d). Note: ‘+’ significant at p < 0.05.
Remotesensing 14 05369 g003
Figure 4. The regional averaged monthly NDVI (a), and its trend rates (unit: 10 × year−1) in each month during 1982–2015 (b). Note: ‘+’ significant at p < 0.05.
Remotesensing 14 05369 g004
Figure 5. Spatial distributions of the correlation coefficients between the monthly NDVI and each extreme index during 1982–2015: (a) TXm (maximum temperature); (b) TNm (minimum temperature); (c) TXx (max TX); (d) TNx (max TN); (e) TXn (min TX); (f) TNn (min TN); (g) Pt (total precipitation); (h) Rx1day (max 1-day precipitation amount); (i) Rx5day (max 5-day precipitation amount); (j) SDII (simple daily intensity index); (k) SPEI-1 (the standardized precipitation evapotranspiration index on the 1-month timescale); and (l) SPEI-2 (the standardized precipitation evapotranspiration index on the 2-month timescale). Note: only the vegetation areas with the correlation passing the 0.05 significance test are colored in the figures.
Remotesensing 14 05369 g005
Figure 6. Correlation coefficients between the regional averaged NDVI and the extreme indices during 1982–2015 in each month. Note: the SPEI on the 1-month timescale in (k).
Remotesensing 14 05369 g006
Figure 7. Spatial distribution of maximum correlation coefficients (Rmax) between the NDVI and the SPEI during 1982–2015 (a); spatial distribution of SPEI timescales for maximum correlation coefficients (b); spatial distribution of the most sensitive month for vegetation responses to drought (c); the area percentage for each sensitive month (d). Note: only the vegetation areas with the correlation passing the 0.05 significance test are colored in the figures.
Remotesensing 14 05369 g007
Figure 8. Correlation coefficients between the regional averaged monthly NDVI and the extreme indices for different time lags during 1982–2015. Note: ‘0-month′ NDVI and extreme indices were collected over the same period; ’1-month’, ’2-month’, ’3-month’, ’4-month’ NDVI lagged the extreme indices by 1–4 months.
Remotesensing 14 05369 g008
Figure 9. Spatial distributions of the time lag of vegetation responses to the different climate extremes. Note: this study conducted seven correlation analyses (namely, 0–6 months), and then superimposed their results to take the maximum value; the numbers 0, 1, 2, 3, and 4 represent the number of lag months; only the vegetation areas with the correlation passing the 0.05 significance test are colored in the figures.
Remotesensing 14 05369 g009
Figure 10. Spatial distributions of the maximum trend rates of the SPEI time series (from 1-month to 24-month) in each month during 1982–2015 (unit: 10 × year−1). Note: only the vegetation areas with the rate passing the 0.05 significance test are colored in the figures.
Remotesensing 14 05369 g010
Table 1. Datasets used in this study.
NameData SourceSpatial Scale
Daily weather dataChina Meteorological Administration
(http://data.cma.cn/, accessed on 15 October 2019)
-
SPEI dataThe Global SPEI database (SPEIbase v2.6) (https://spei.csic.es/database.html, accessed on 15 October 2021)0.5°
LULC dataResource and Environment Science and Data Center, Chinese Academy of Sciences (https://www.resdc.cn/, accessed on 10 October 2021)1 km
Digital Elevation dataResource and Environment Science and Data Center, Chinese Academy of Sciences (https://www.resdc.cn/, accessed on 10 October 2021)250 m
GIMMS NDVI3g dataNational Oceanic and Atmospheric Administration (https://www.nasa.gov/nex, accessed on 1 January 2021)1/12°
(approximately 8 km)
Table 2. Definitions of climate indices in this study.
IndicesIndicator NameDefinitionUnit
TXmMaximum temperatureMonthly mean value of daily maximum temperature°C
TNmMinimum temperatureMonthly mean value of daily minimum temperature°C
TXxMax TXMonthly maximum value of daily maximum temperature°C
TNxMax TNMonthly maximum value of daily minimum temperature°C
TXnMin TXMonthly minimum value of daily maximum temperature°C
TNnMin TNMonthly minimum value of daily minimum temperature°C
PtTotal precipitationMonthly total values of daily precipitationmm
Rx1dayMax 1-day precipitation amountMonthly maximum 1-day precipitationmm
Rx5dayMax 5-day precipitation amountMonthly maximum consecutive 5-day precipitationmm
SDIISimple daily intensity indexTotal precipitation divided by the number of wet days (defined as PRCP ≥ 1.0 mm) in the monthmm day−1
SPEIStandardized precipitation evapotranspiration indexThe difference between monthly precipitation and potential evapotranspiration1
Note: PRCP represents the daily precipitation.
Publisher’s Note: MDPI stays neutral with regard to jurisdictional claims in published maps and institutional affiliations.

