Abstract
The phenological parameters estimated from different data may vary, especially in response to climatic factors. Therefore, we estimated the start of the growing season (SOS) and the end of the growing season (EOS) based on sunlight-induced chlorophyll fluorescence (SIF), the normalized difference vegetation index (NDVI) and the near-infrared reflectance of vegetation (NIRv). The SIF, NDVI and NIRv breakpoints were detected, and the trends and change-points of phenological parameters based on these data were analyzed. The correlations between the phenological parameters and snow-related factors, precipitation, temperature, soil moisture and population density were also analyzed. The results showed that SIF and NIRv could identify breakpoints early. SIF could estimate the latest SOS and the earliest EOS. NDVI could estimate the earliest SOS and the latest EOS. The change-points of SOSSIF were mostly concentrated from 2001 to 2003, and those of SOSNDVI and SOSNIRv occurred later. The change-points of EOSSIF and EOSNIRv were mostly concentrated from 2001 to 2007, and those of EOSSIF occurred later. Differently from the weak correlation with SOSSIF, SOSNDVI and SOSNIRv were significantly correlated with snow-related factors. The correlation between the meteorological factors in the summer and autumn and EOSSIF was the most significant. The population density showed the highest degree of interpretation for SOSNIRv and EOSNDVI. The results reveal the differences and potentials of different remote-sensing parameters in estimating phenological indicators, which is helpful for better understanding the dynamic changes in phenology and the response to changes in various influencing factors.
1. Introduction
Phenology is a sensitive and key feature of the life history of plants. It can reflect how changes in climate affect vegetation growth, improve our understanding of vegetation ecological processes and allow us to quantify the impacts of meteorological changes on terrestrial ecosystems [1].
The Mongolian Plateau, located in arid and semiarid areas, is highly sensitive to climate change [2]. Its temperate continental climate forms large natural pastures [3]. Additionally, the grassland ecosystem of the Mongolian Plateau plays key roles in the carbon cycle in East Asia and globally [4]. The wide availability of low-cost remote sensing data facilitates the study of vegetation ecology on the Mongolian Plateau [5,6]. Previous studies have shown that the normalized difference vegetation index (NDVI) can be used to effectively monitor vegetation phenology [7]. Therefore, NDVI has frequently been used to estimate vegetation phenological parameters in studies of Mongolian Plateau phenology [1,2,8,9]. However, limitations may exist to using only NDVI when retrieving vegetation phenology information for evergreen forests [10,11]. Thus, evaluating the advantages and disadvantages of different types of remote sensing data in retrieving vegetation phenology and using a combination of approaches to obtain detailed observations are very important for high-precision phenology research [12].
In contrast to traditional remote sensing indicators based on changes in vegetation “greenness”, sunlight-induced chlorophyll fluorescence (SIF) can directly reflect the photochemical reactions of plants [13,14]. Additionally, SIF is very sensitive to abiotic stress factors and can be effectively used to monitor vegetation stress [15,16]. SIF has unique technical advantages in the field of monitoring vegetation physiological conditions and changes in the surrounding environment [17,18,19]. Furthermore, it represents a new potential method for monitoring the physiological dynamics of vegetation from space [20].
Specifically, SIF is the energy flux released by plant chlorophyll molecules after absorbing sunlight in the wavelength range of 600–800 nm, which represents less than 5% of the light energy absorbed by plants [21]. Many studies have investigated the SIF products of the Greenhouse Gas Observation Satellite (GOSAT) and Global Ozone Monitoring Experiment-2 (GOME-2), but GOSAT and GOME-2 (GOME-2: 40 × 80 km; GOSAT: 10 km) cannot meet the need for high-accuracy research [22,23]. The SIF products estimated by the Orbital Carbon Observatory-2 (OCO-2) provide a better spatial resolution (1.3 × 2.2 km) than the SIF products of GOSAT and GOME-2 [24]. However, the OCO-2 SIF products with discontinuous OCO-2 still have limitations. Fortunately, Li and Xiao developed a new SIF product based on OCO-2 SIF and meteorological data, called “GOSIF”, with a temporal resolution of 8 days and a spatial resolution of 0.05° [25]. This product has a better temporal and spatial resolution than existing products, and can greatly contribute to research using SIF to monitor vegetation physiology. Previous studies have shown the feasibility of GOSIF for retrieving vegetation phenology [26,27]. However, in arid and semiarid areas of the Mongolian Plateau, the characteristics of vegetation phenology estimated by SIF are not clear. At the same time, whether or not the high sensitivity of SIF to environmental stress has a higher advantage in terms of vegetation phenology also needs further exploration.
A recently developed vegetation index, the near-infrared reflectance of vegetation (NIRv), has the advantages of reducing the number of mixed pixels and minimizing the noise caused by soil pollution [28,29,30]. Previous studies have shown that NIRv can be used to monitor early changes in canopy development in grassland ecosystems. Thus, NIRv, as an index that can effectively reflect the growth status of vegetation, may also have great potential in retrieving vegetation phenology. Simultaneously, the advantages and disadvantages of sensitivity to climate factors are not clear.
Studies on the climatic factors affecting vegetation phenology have considered the effects of temperature, precipitation and soil moisture [31,32,33,34]. However, the effects of snow cover in winter and the snow melting period in spring at the start of the growing season (SOS) cannot be ignored. In addition, the phenological parameters of vegetation based on SIF (GOSIF), NDVI and NIRv and their responses to different climatic factors are also different. Understanding the response of phenological parameters estimated from different data to different climatic factors can enable us to more deeply understand the mechanism by which vegetation is affected by the environment. Concurrently, comparing the sensitivity of phenological parameters to influencing factors can help us to understand the advantages and disadvantages of the phenological retrieval abilities of different types of remote sensing data. The advantage of using different types of phenological parameters is of great value for retrieving phenological parameters with higher accuracy and improving our understanding of the relationship between vegetation phenology and climate factors in the future. The main objectives of this study were as follows:
- To compare the characteristics of vegetation dynamics estimated by SIF, NDVI and NIRv;
- To extract and compare phenological parameters and their dynamics based on SIF, NDVI and NIRv;
- To determine the influence mechanism of snow-related factors on phenological parameters.
2. Materials and Methods
2.1. Study Area
The Mongolian Plateau is located in Central Asia (87°43′–126°04′E, 37°22′–53°23′N) [35], and it is surrounded by high-altitude mountains in the north and is adjacent to the Gobi Desert in the south [36,37]. Affected by the climate, the annual precipitation on the Mongolian Plateau is low, and drought is frequent. The average annual precipitation in most areas is 200 mm, and precipitation mainly occurs from June to August. Windy conditions are prevalent in winter and spring. The average temperature in January is −26 °C, and in July it is 17 °C [38]. The plateau has complex ecological zones, which mainly include meadow steppe, typical steppe, alpine steppe, desert steppe, coniferous forest, broadleaf forest and the Gobi desert (Figure 1). The vegetation-type data used to produce the figure are from the National Atlas of Mongolia. The vegetation map with a scale of 1:1,000,000 was rasterized to 0.083° [39]. Finally, we chose GOSIF, NDVI and NIRv to estimate the vegetation phenological parameters for the Mongolian Plateau.
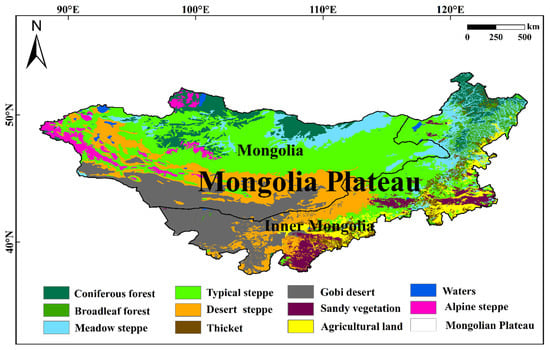
Figure 1.
Land-type distribution map of the Mongolian Plateau.
2.2. Data Sources
2.2.1. Sunlight-Induced Chlorophyll Exposure
Li and Xiao developed a new global SIF data set with high spatiotemporal resolution (0.05° × 0.05°) based on OCO-2, using discrete OCO-2 SIF detection, remote sensing data from the moderate-resolution imaging spectroradiometer (MODIS) and meteorological reanalysis data. Compared with coarse-resolution SIF data aggregated directly from OCO-2 sounding, sunlight-induced chlorophyll exposure (GOSIF) has a higher spatial resolution and longer records, and it provides continuous global coverage [25].
The website used to access GOSIF data is as follows: http://globalecology.unh.edu/data/GOSIF.html (accessed on 3 April 2022).
In this study, we used GOSIF data sets from 2001 to 2020 with a spatial resolution of 0.05° × 0.05° and a temporal resolution of 8 d. To match the temporal resolution of NDVI and NIRv, we synthesized the GOSIF data of 8 days into a data set with a temporal resolution of 16 days, using the maximum-value composite (MVC) method.
2.2.2. MODIS Data Set
The vegetation indices we used included NDVI and near-infrared reflectance (NIR), both of which came from the MOD13A1 product of Terra MODIS version 6.1. The spatial resolution was 500 m, and the temporal resolution was 16 d. The website used to access these data is as follows: https://lpdaacsvc.cr.usgs.gov/appeears/ (accessed on 3 April 2022). NDVI and NIRv are calculated as follows:
where ρ1 is the red reflectance (620–670 nm), ρ2 is the NIR (841–876 nm), and the parameter C was set to 0.08, according to Badgley [29]. In this study, we used NDVI and NIRv data sets from 2001 to 2020. We resampled the spatial resolution of the NDVI and NIRv data (the source data are 500 m) to 0.05° × 0.05°, to match the spatial resolution of GOSIF. (Downsampling of all high-resolution data in this study is realized through the aggregate tool of ArcGIS Pro3.0 software).
We used the daily snow-cover product of MOD10A1 from 2000 to 2020, with a spatial resolution of 500 m. The winter (December of the previous year and January and February of the current year) snow-cover data set (SFC) from 2001 to 2020 was calculated. In addition, we defined the snowmelt date as the period when the snow cover in spring had no value for five consecutive days, and we used Interactive Data Language (IDL, an application program and programming language for data analysis and visualization) to calculate the item-by-item snow-melting-period data set (SMD) from 2001 to 2020. To match the spatial resolution of the phenological data set, SFC and SMD were resampled to 0.05° × 0.05°. The data were acquired from https://www.environment.snu.ac.kr/bess-rad (accessed on 3 April 2022).
2.2.3. Extraction of Vegetation Phenological Parameters
Before extracting the phenological parameters, we discarded the areas with an annual average NDVI < 0.1, because such areas have been identified as unvegetated [40]. Additionally, we masked GOSIF and NIRv with NDVI of the discarded unvegetated area as the template to obtain the GOSIF and NIRv data sets of the discarded unvegetated area. Then, we used double logistic filtering to fit the smooth curve from the time series of the GOSIF, NDVI and NIRv data [41]. The threshold method is usually used to extract phenological vegetation parameters, and it mainly includes the fixed-threshold method and dynamic-threshold method [42,43]. However, the fixed-threshold method has limitations in areas with different land-cover types and soil backgrounds. Therefore, we used a more flexible dynamic-threshold method to extract the phenological parameters for the start of the growing season (SOS), the end of the growing season (EOS) and the length of the growing season (LOS, i.e., LOS = EOS − SOS). The dynamic threshold we selected was 20% [44,45,46]. For example, SOS was defined as the first day of the year that the GOSIF ratio exceeded 0.2 [47]. The GOSIF ratio is calculated as follows:
where GOSIFt is the value of GOSIF at time t and GOSIFmin and GOSIFmax are the minimum and maximum GOSIF values, respectively, in the annual GOSIF time series. The extraction of the above parameters was completed using TIMESAT 3.3 software. The software download website is http://web.nateko.lu.se/timesat/ (accessed on 4 April 2022).
In this study, we used SIF (GOSIF), NDVI and NIRv to extract phenological vegetation information, and obtained the following:
- Phenological parameters based on SIF: SOSSIF, LOSSIF and EOSSIF;
- Phenological parameters based on NDVI: SOSNDVI, LOSNDVI and EOSNDVI;
- Phenological parameters based on NIRv: SOSNIRv, LOSNIRv and EOSNIRv.
2.2.4. ERA5-Land Climate Data Set
ERA5-Land is a reanalysis data set that has a higher resolution than ERA5 and provides conventional longitude and latitude grid data with a spatial resolution of 0.1° × 0.1° (approximately 10 km). We obtained the data set of the average monthly values from 2001 to 2020, and the data were divided into the three types of climate data, as explained below.
We selected the total precipitation in m; the skin temperature, k; and the volume of the soil water layer 1 (0–7 cm) m3/m−3). The meteorological data sets of spring (March to May, PRESpring, TEMSpring, and SWSpring), summer (June to August, PRESummer, TEMSummer, and SWsummer) and autumn (September to November, PREAutumn, TEMAutumn, and SWAutumn) were calculated. To match the spatial resolution of the phenological data, the data were resampled to 0.05° × 0.05°. The website providing detailed descriptions and access to the above ERA-Land climate data is as follows: https://cds.climate.copernicus.eu/cdsapp#!/dataset/reanalysis-era5-land-monthly-means?tab=overview (accessed on 3 April 2022).
2.2.5. Population Density Data
The population density data were obtained from open-space population data and previous research. We obtained the annual population-density data set from 2001 to 2020, with a spatial resolution of 1 km and a final resampling to 0.05° × 0.05°. The data were obtained from https://hub.worldpop.org/geodata/listing?id=77 (accessed on 3 April 2022).
2.2.6. Terrain Data Set
The terrain data were obtained from the Advanced Spaceborne Thermal Emission and Reflection Radiometer (ASTER) Global Digital Elevation Model (GDEM) V1 (https://www.gscloud.cn). Through an image mosaic, we obtained the DEM of the study area with a spatial resolution of 30 m (accessed on 3 April 2022).
2.3. Methods
2.3.1. The BFAST Package
The Breaks for Additive Season and Trend algorithm (BFAST) method was first proposed by Verbesselt in 2010 [48], and was initially used to identify disturbances in time-series models (with trend/season/regressor terms), using remote sensing data. The BFAST algorithm, which is widely applicable for meteorological, hydrological, economic and other fields, employs the parameters of fitted piecewise-linear trends and a seasonal trend model [49]. The formula of BFAST for long time-series is defined as follows:
where t is the time step of a long time-series; Yt is the 16-d SIF from 2001–2020 on the Mongolian Plateau, Tt is the trend component (trend), St is the seasonal component (seasonal), and et is the remainder (remainder). The long-term trend component, Tt, is segmented, has a specific slope (βi) and intercepts (αi) on m + 1 different segments. Thus, there are m breakpoints, τi−1, …, τm, where i = 1, 2, …… m, and we define τ0 = 0 and τm + 1 = n.
Yt = Tt + St + et, t = 1, 2, 3……n
Tt = αi + βit
M = (αi−1 − αi) + (βi−1 − βi)t
The order of magnitude of the breakpoints, M, can be calculated using the slopes αi and intercepts βi of the trend component Tt between ti−1 and ti. To fit the frequency, we define t0 = 0 for tj < t ≤ tj + 1, where j is the breakpoint position, j = 1, … m, with m breakpoints in total; k is the number of harmonic terms; and αj, k and δj,k are the segment-specific amplitude and phase, respectively. In this study, the SIF, NDVI and NIRv values during the growing season (from April to October) on the Mongolian Plateau from 2001 to 2020 were used for breakpoint analysis, and the differences in the vegetation-change trends retrieved from the three types of remote sensing data were evaluated. We also analyzed meadow-steppe, typical-steppe, broadleaf-forest and coniferous-forest data. The main purpose of this part of the study is to evaluate the sensitivity of three types of remote sensing data for retrieving the dynamic changes in vegetation and the ability to capture the dynamic changes in different vegetation types.
2.3.2. Theil–Sen Median Trend Analysis
Theil–Sen median-trend analysis and the Mann–Kendall analysis are effective for assessing the trends of long time-series data. The combination of these methods has the advantages of not requiring the data to obey a certain distribution, and having strong resistance to data errors [50]. Additionally, the Mann–Kendall method provides a significance test of linear trends. The Theil–Sen estimator calculates the median of the SOS data-combination slope as follows:
SSOS > 0 indicates an increasing SOS trend, while a negative value indicates a decreasing SOS trend.
The Mann–Kendall test can determine whether a trend is significant. Similar to the Theil–Sen median trend, this test does not require the sample to obey a certain distribution, and is robust to the presence of a few outliers [51,52].
where SOSi and SOSj represent the SOS in years i and j, respectively; sgn is the signum function; n represents the length of the time series, and the value range of the statistic Z is (−∞, +∞). At a given significance level α, when |Z| > u1−α/2, the changes in the trend are considered significant. We evaluated the significance of a change in the SOS time-series trend at the 0.05 confidence level; thus, we applied α = 0.05 [53]. In this study, we analyzed the trends of SOSSIF, EOSSIF, SOSNDVI, EOSNDVI, SOSNIRv, and EOSNIRv and the phenological parameters of different vegetation-types from 2001 to 2020. At the same time, we compared and evaluated the differences in the trends of the three phenological parameters.
2.3.3. Detection and Analysis of Change-Points of Phenological Parameters
We used the change-point detection tool in ArcGIS Pro3.0 to detect the change points of the three phenological parameters. The change-point detection tool can recognize the time step when some statistical attributes of a time-series change. The tool can detect changes in the average value, standard deviation or slope (linear trend) of continuous variables, and changes in the average value of the counting variables. In this study, we used the slope change of the phenological parameters over 20 years to detect the change points. To prevent all time steps from being detected as change points, one of two constraint types must be applied, using method parameters. Algorithms for the optimal identification of segment neighborhoods (SegNeigh) enable the user to determine the number of change points to be detected, using the number of change-points parameters This option uses the “segment neighborhood” [54] algorithm to find the lowest cost segment among all possible segments with the specified number of changepoints. The optimal detection of changepoints with a linear-computational-cost (PELT) option uses the pruned exact linear Ttme [55,56] algorithm to estimate the number and location of change points.
The idea behind PELT is that for a time step to be detected as a change point, the value of its segmentation cost reduction must be more than the added penalty value. If the cost reduction is less than the increased penalty value, the penalty cost will increase, and the time step will not be detected as a change point. The penalty value used in PELT is determined by the detection-sensitivity-parameter value. The sensitivity is provided in digital form between 0 and 1, where a higher sensitivity will detect more change points by using lower penalty values. For the change in slope (linear trend), a more conservative penalty formula is used:
In this study, we used PELT to detect change points. Because change-point detection based on slope (step size 2) requires conservative control-sensitivity, we finally defined the sensitivity as 0.35. This sensitivity detects one change-point at most.
2.3.4. Pearson Correlation Analysis and Partial Correlation Analysis
The Pearson’s correlation coefficient method can be used to analyze the degree of relatedness between two variables. By calculating the correlation coefficient, R, between the climate factors and SOS and EOS, we determined the relationships between them. The range of potential values of the correlation coefficient is [−1, 1], and the calculation formula is as follows:
where n is the number of years, n = 20 (2001–2020); i and j represent years i and j, respectively; represents the average SOS value over the 20 years from 2001 to 2020, and RSOS,SFC are the correlation coefficients of SOS and SFC. In addition, we used a t-test to test whether the correlation coefficient was significant. A p value < 0.05 indicated a significant correlation.
Partial correlation analysis: In a multifactorial system, the relationship between two factors is inevitably disturbed by other factors. Therefore, excluding the influence of other factors is necessary to obtain a relatively pure relationship between the two variables. Suppose there are k (k > 2) variables x1, x2…xk; then, after excluding the influence of other variables, the correlation coefficient of variables i and j is called the hth-order (h ≤ k − 2) partial correlation coefficient, which is calculated as follows:
where is the partial correlation coefficient of variables i and j, after excluding the influence of other factors. Suppose that there are five variables (k = 4): SOS(S), TEMSpring(T), PRESpring (P) and SWSpring (W). Consequently, the order of the partial correlation coefficient of the variable SOS and TEM is h = 2, and the formula is as follows:
In this study, we conducted a Pearson correlation analysis of three SOS values by SCF and SMD, and then we conducted a partial correlation analysis of spring precipitation, temperature and soil water and three SOS values, and a partial correlation analysis of summer and autumn precipitation, temperature and soil water, on three EOS values.
2.3.5. Path Analysis
Path analysis is an extension of multiple regression analysis. The causal relationship in path analysis is multileveled, and intermediate variables are added between causal variables, which makes the path-analysis model richer and more powerful than the general regression model in describing the actual causal relationship. Thus, path analysis is not a multiple regression equation, but rather a set of multiple regression equations. For example, the equations are as follows:
where … are path coefficients, and … are residuals. The main purpose of path analysis is to test the accuracy and reliability of a hypothetical causal model and to measure the strength of the causal relationship between variables. If a correlation exists between the two variables X and Y in the model, further study is required to determine if a causal relationship exists between them. This may be a direct or indirect relationship, or both. In this study, we assumed that a direct or indirect relationship exists between SMD and SOS. Path analysis can be used to more comprehensively understand the mechanism by which snow removal affects the SOS. For example, SCF and SMD affect SOS directly or through some variables, or some variables affect SOS through SMD. All path designs and path coefficients were calculated using IBM SPSS Amos 25 software.
2.3.6. Geographical-Detector Model
The geographical-detector model can analyze the relationship between factors based on spatial heterogeneity. In this study, the dependent variable Y was the phenological parameter of the Mongolian Plateau, and the independent variable X included natural factors and human factors. The geographical-detector model consists of four detectors: a factor detector, an interaction detector, a risk detector and an ecological detector [57]. In this study, we mainly used the factor detector to determine the explanatory degree of the independent variable to the dependent variable. The scope of interpretation is measured by the metric q [58], which is expressed as follows:
where q is the degree of interpretation of factor X to Y, and the value range of q is [0, 1]. h = 1…, L represents the grade of the independent variable Y or the dependent variable X; and are the variance of Y in layer h and the variance in the entire region, respectively; Nh and N represent the number of layers, h, and the number of cells in the entire area, respectively.
3. Results
3.1. Comparison of Vegetation Trends Based on SIF, NDVI and NIRv
SIF, NDVI and NIRv all have the ability to restore vegetation changes, but their results may vary for vegetation dynamics. To explore the differences in the vegetation dynamics retrieved from the three types of remote-sensing data on the Mongolian Plateau, we used the BFAST package to analyze the SIF, NDVI and NIRv trends, and to explore the breakpoints. Additionally, we analyzed the trends and breakpoints in the meadow steppe, typical steppe, broadleaf forest and coniferous forest, over a large area of the Mongolian Plateau (Figure 2). The results show that the SIF, NDVI and NIRv trends and breakpoints on the Mongolian Plateau were obviously different.
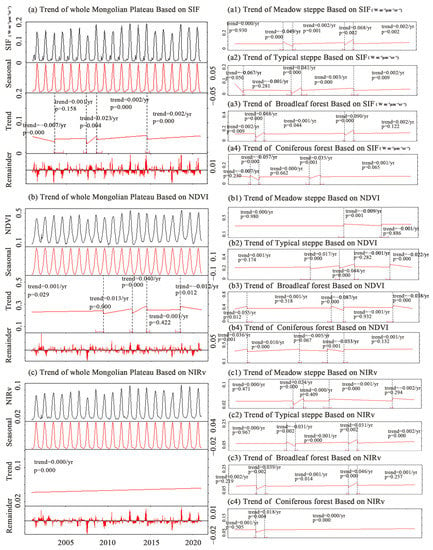
Figure 2.
Vegetation trends and breakpoints retrieved from three types of remote-sensing data: (a–c) Mongolian Plateau results based on SIF, NDVI and NIRv; (a1,b1,c1) meadow-steppe results based on SIF, NDVI and NIRv; (a2,b2,c2) typical-steppe results based on SIF, NDVI and NIRv; (a3,b3,c3) broadleaf-forest results based on SIF and NDVI; (a4,b4,c4) coniferous-forest results based on SIF, NDVI and NIRv.
SIF breakpoints were found on day 225 in 2003, day 145 in 2007, day 225 in 2008 and day 209 in 2014. Moreover, SIF decreased significantly from 2003 to 2007, increased sharply from 2007 to 2008, and increased significantly from 2008 to 2014 and from 2014 to 2020 (Figure 2a). NDVI breakpoints were found on day 161 in 2009, day 305 in 2012, day 193 in 2014 and day 177 in 2018 (Figure 2b). NDVI experienced a continuous surge from 2009, 2012 and 2012 to 2014 and a decline from 2018 to 2020. However, no NIRv breakpoint was detected on the Mongolian Plateau. The comparison showed that the SIF and NDVI breakpoint years overlapped greatly (2007 to 2014), showing significant growth, and the SIF breakpoint years appeared earlier.
In addition, our detection results for different vegetation types were very different. SIF of meadow steppe experienced a sharp increase from 2006 to 2007 and a sharp decrease from 2013 to 2014. Both meadow steppe and forest experienced a sharp increase or a decrease from 2002 to 2007, but NDVI did not detect these changes. The drastic changes in NDVI mostly occurred from 2008 to 2011. During this period, SIF also underwent drastic changes. Therefore, SIF may capture more mutation details than NDVI, especially for mutations within a short period of time that may be caused by human activities. NIRv and SIF were similar, especially in forest areas. Both could detect breakpoints in earlier years, but the NIRv breakpoints occurred later than those for SIF. This result may indicate that SIF and NIRv have more advantages in detecting short-term upheaval.
3.2. Temporal and Spatial Variability of Vegetation Phenological Parameters
In the past 20 years, the SOSNDVI and SOSNIRv values of the Mongolian Plateau have been relatively close, and have not increased significantly, with rates of 0.143 days/year and 0.192 days/year, respectively (Figure 3a). The average values over the past 20 years were 103.6 day and 97.4 day, respectively. The earliest SOS occurred in 2016 and 2013, and the latest SOS occurred in 2006 and 2008. In the past 20 years, SOSSIF was late, with an insignificant increase of 0.038 days/year, and the annual average value was the 132.3nd day. The earliest and latest SOS occurred in 2001 and 2005, respectively, indicating that this difference may be due to the low chlorophyll concentration and weak SIF of the returning vegetation at higher latitudes on the Mongolian Plateau. Concurrently, the earliest and latest years of SOS are breakpoint years.
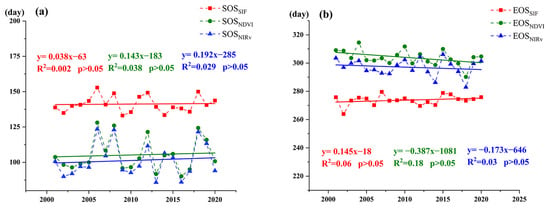
Figure 3.
Temporal variation in phenological parameters of the three vegetation types on the Mongolian Plateau, over 20 years; (a) is the linear trend of the three SOS; (b) is the linear trend of the three EOS.
The EOSNDVI and EOSNIRv values on the Mongolian Plateau are also close, and EOSNDVI is slightly later than EOSNIRv. EOSNDVI and EOSNIRv decreased at the rates of 0.387 days/year and 0.173 days/year, respectively, but not significantly, with mean values of the 303.9nd day and the 297nd day over 20 years. The earliest and latest SOS were in 2001 and 2019, respectively. However, EOSSIF increased at a rate of 0.145 days/year, but not significantly. The average value from the past 20 years was 274nd day, and the earliest and latest EOSs were in 2001 and 2006, respectively. LOSSIF was the shortest, and LOSNDVI was the longest. The three LOSs were 112.3 days, 198.6 days and 195.6 days, respectively.
As shown in Figure 4, the spatial distributions of the three SOS trends in central and eastern Mongolia were similar. Central and eastern Mongolia showed an upward trend, while western Mongolia and central and eastern Inner Mongolia showed a downward trend. However, SOSSIF had a higher significance; 10.29% of pixels passed the significance test (p < 0.05), and the agricultural land in south-central Inner Mongolia and the broadleaf forest in the northeast showed a significant downward trend (Figure 4a).
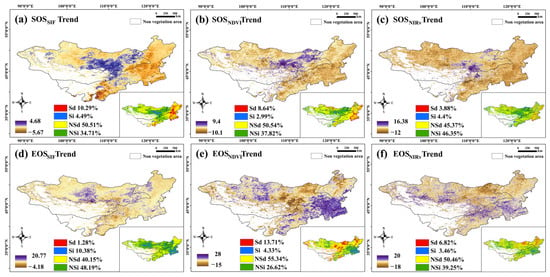
Figure 4.
Comparison of the spatial-distribution trends of the phenological parameters extracted based on SIF, NDVI and NIRv. Sd: significant decrease; Si: significant increase; NSd: nonsignificant decrease; NSi: nonsignificant increase.
Obvious differences were observed among the three EOSs. Approximately 58.57% of the EOSSIF pixels showed an increasing trend that was mainly distributed in the middle of Mongolia and the middle of Inner Mongolia. Approximately 10.38% of the pixels passed the significance test (p < 0.05), and these pixels were distributed in the coniferous forest belt in the middle of Mongolia and on agricultural land and desert steppe in the middle and south of Inner Mongolia (Figure 4d). The growth of EOSNDVI and EOSNIRv in this region was also detected, but it was not significant. Approximately 69.05% of the EOSNDVI pixels showed a decreasing trend, and these pixels, of which 13.71% passed the significance test (p < 0.05), were mainly distributed in the typical steppe belt in the southeast and the meadow steppe belt in the northeast of Mongolia, as well as some coniferous and broadleaf forest-areas in Inner Mongolia. The spatial distribution trend of EOSNIRv was similar to that of EOSNDVI, but the decreasing trend of the coniferous and broadleaf forest belts detected by EOSNIRv was not significant (Figure 4f). However, EOSSIF did not detect significant changes in the forest region. In general, the spatial distribution of the three EOS trends on the Mongolian Plateau was generally consistent, and the difference was mainly reflected in the sensitivity of the trend to different vegetation types.
Figure 5 shows that SOSSIF tends to be significantly delayed by approximately 2 days/100 m of elevation. The difference is that SOSNDVI and SOSNIRv significantly advance at rates of 0.6 days/100 m and 1.3 days/100 m, respectively. EOSSIF and EOSNDVI advanced by approximately 0.9 days/100 m and 0.04 days/100 m, respectively, although the trend for EOSNDVI was not significant. EOSNIRv was significantly delayed by approximately 0.5 days/100 m. As the altitude increased, the change trends of the three phenological parameters varied. Therefore, as the altitude increased, LOSSIF was significantly shorter, LOSNDVI slowly increased, and LOSNIRv was significantly longer.
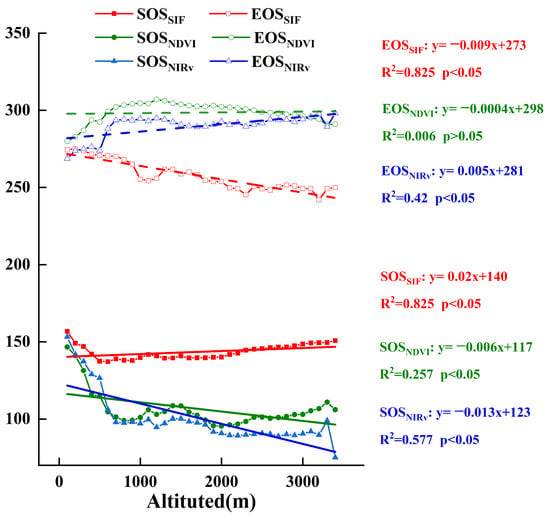
Figure 5.
Characteristics of vegetation phenology changes with altitude.
This may be due to the difference in chlorophyll concentration of different vegetation types, which affects the observation of phenology by NDVI and NIRv, especially in high altitude areas, where the greenness reflectance of forest vegetation is high. SIF can directly express the photosynthesis inflection-point, and may better show the relationship between vegetation phenology and altitude, which also highlights the advantages of SIF in retrieving phenological parameters.
We analyzed the occurrence of the change trend of the vegetation phenological parameters on the Mongolian Plateau over the past 20 years (Figure 6 and Figure 7). The results show that the years that SOSSIF experienced the most changes were 2001 to 2003 and 2016 to 2019. A total of 43.55% and 24.41% of the changes occurred in these two periods, respectively. The years with the least change were from 2011 to 2013, and only 2.24% of the change occurred during this period. The change points were mainly distributed in the broadleaf forest area in northeastern Inner Mongolia, the desert steppe belt in southern Mongolia, and the coniferous forest areas in northern and middle Mongolia (Figure 6a). The decreasing trends of SOSSIF before and after the change accounted for 70.95% and 48.28%, respectively. The increasing trends before and after the change accounted for 21.97% and 51.65%, respectively (Figure 6b,c). This result shows that the change was mainly reflected in the change from the original decreasing trend to the increasing trend, especially in the central and western regions of Mongolia and some regions in southern Inner Mongolia. In northeastern Inner Mongolia, the original increasing trend changed to a decreasing trend.
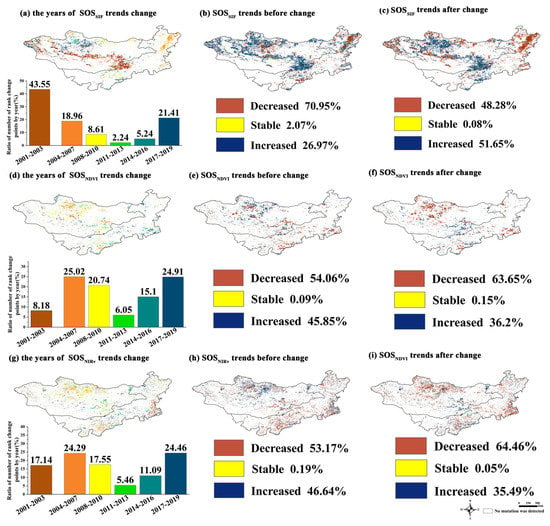
Figure 6.
The years when the SOS trends changed during the past 20 years, and a trend comparison before and after the change: (a,d,g) are the change-points years and the change proportions of SOSSIF, SOSNDVI and SOSNIRv, respectively; (b,c), (e,f) and (h,i) are the trends before and after the changes in SOSSIF, SOSNDVI and SOSNIRv, respectively.
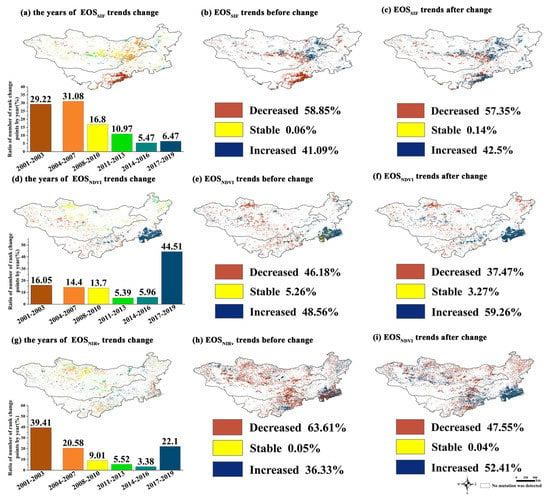
Figure 7.
The years of the EOS change-trends in the past 20 years and a trend comparison before and after the change: (a,d,g) are the years of the change-points and the change proportions of EOSSIF, EOSNDVI and EOSNIRv, respectively; (b,c), (e,f) and (h,i) are the trends before and after the changes of EOSSIF, EOSNDVI and EOSNIRv, respectively.
The years that SOSNDVI experienced the most changes were 2004 to 2007 and 2016 to 2019. A total of 25.02% and 24.91% of the changes occurred in these two periods. The years with the least change were from 2011 to 2013, and only 4.54% of the changes occurred then (Figure 6d). The change points were mainly distributed in the coniferous forest area in northern Mongolia and in central and southern Inner Mongolia. The decreasing trend of SOSNDVI before and after the change accounted for 48.82% and 72.07%, respectively. The proportion of the increasing trend before and after the change was 53.55% and 27.58%, respectively (Figure 6e,f). This result shows that the original increasing trend changed into a decreasing trend, which was mainly distributed in the coniferous forest in northern Mongolia and in the sandy steppe and agricultural land in central Inner Mongolia.
The years that SOSNIRv experienced the most changes were 2017 to 2019 and 2004 to 2007. A total of 24.46% and 24.25% of the changes occurred in these two periods. The years with the least change were from 2011 to 2013, and only 5.46% of the change occurred then (Figure 6g). The change years of SOSSIF and SOSNIRv were relatively close. The distribution was closer to SOSNDVI, and more pixels were detected. The decreasing trend of SOSNIRv before and after the trend-change accounted for 53.17% and 64.46%, respectively. The increasing trend before and after the change accounted for 46.64% and 35.49%, respectively (Figure 6h,i). This result shows that the change was mainly manifested as the original increasing trend changing to a decreasing trend. The change points were mainly distributed in the coniferous forest in northern Mongolia and most areas of Inner Mongolia. The number of change-point pixels detected in the forest area of northeast Inner Mongolia was greater than that of SOSNDVI. In general, the change years of the three SOSs were similar to the BFSAT breakpoint-monitoring years for the three data sources. In terms of the years and the distribution, SOSNDVI and SOSNIRv were closer, and the changes in NDVI occurred later than the changes in SIF and NIRv. SOSSIF was more sensitive to the change in the forest area, and SOSNDVI was more sensitive to the change in the steppe area. SOSNIRv detected the most change points.
In the past 20 years, the years that EOSSIF experienced the most changes were 2004 to 2007 and 2001 to 2003. A total of 31.08% and 29.22% of the changes occurred in these two periods. The years with the least change were from 2014 to 2016, with only 5.47% of changes. The trend change-points were mainly distributed in the grassland belt in eastern Mongolia and the desert steppe in southern Inner Mongolia (Figure 7a). The decreasing trend of EOSSIF before and after the change point accounted for 58.85% and 57.35%, respectively. The proportion of the increasing trend before and after the trend change was 41.52% and 51.66%, respectively (Figure 7b,c). This result shows that the change was mainly reflected in the change from the original decreasing trend to the increasing trend, especially in the central and western regions of Mongolia and in some regions in southern Inner Mongolia. In northeastern Inner Mongolia, the original increasing trend changed to a decreasing trend.
The years in which EOSNDVI experienced the most change were from 2017 to 2019, and 44.51% of the changes occurred during this period. The years with the least change were from 2011 to 2013, with only 5.39% of the change (Figure 7d). This change mainly occurred in the coniferous forest belt in the north of Mongolia and the artificial vegetation area in the middle of Inner Mongolia. The decreasing trend of EOSNDVI before and after the change accounted for 46.18% and 37.47%, respectively. The proportion of the increasing trend before and after the change was 48.56% and 59.26%, respectively (Figure 7e,f). This result shows that the overall trend is from decreasing to increasing. The trends mainly changed in some areas in the middle of Mongolia, and the trends in the sandy steppe and agricultural land in the middle of Inner Mongolia changed from decreasing to increasing. The slope of the decreasing trend in northeastern Inner Mongolia also changed.
The years that EOSNIRv experienced the most changes were 2001 to 2003 and 2016 to 2019, and 39.41% and 22.1% of the changes occurred in these two periods, respectively. The years with the least change in trends were from 2014 to 2016, and only 3.38% of the change occurred during this period (Figure 7g). The year and spatial distribution of the EOSNIRv change points were close to those of EOSNDVI, and EOSNIRv detected more pixels. The decreasing trend of EOSNIRv before and after the change accounted for 63.61% and 47.55%, respectively. The increasing trend before and after the change accounted for 36.33% and 52.41%, respectively (Figure 7h,i). This result shows that the change in the trend was mainly manifested in the change from the original decreasing trend to the increasing trend. The change points were mainly distributed in the coniferous forest in northern Mongolia and in central and southern Inner Mongolia. In addition, the slope of the decreasing trend in the middle of Inner Mongolia changed. In terms of the year and location, EOSSIF and EOSNIRv were closer. The change in EOSNDVI occurred later than that of EOSNDVI and EOSNIRv. EOSNIRv detected the most change points.
3.3. Correlation Analysis between Vegetation Phenological Parameters and Meteorological Factors
The area of snow-cover in winter showed a significant negative correlation with SOSNDVI and SOSNIRv (Figure 8a–c). Approximately 41.56% and 34.87% of the pixels passed the significance test (p < 0.05), and were mainly distributed in most regions of Mongolia and the central region of Inner Mongolia. This indicated that the larger snow-cover area in winter will lead to the advance of the SOS. This is related to the supplementation of snow to soil moisture in spring. However, SOSSIF was not sensitive to the change in the snow-cover area (Figure 8a). This result shows that snow-cover in winter had a significant effect on the advance of the SOS. The spring snow-melting period showed a more significant negative correlation with SOSNDVI and SOSNIRv (Figure 8d–f). Approximately 54.48% and 47.65% of the pixels, respectively, passed the significance test (p < 0.05), and were mainly distributed in most regions of Mongolia and parts of the middle and north of Inner Mongolia. Specifically, the late snowmelt-period may lead to the advance of the SOS; in contrast, if the snowmelt period is relatively early, it will lead to the delay of the SOS. However, SOSSIF was still not sensitive to changes in the snowmelt period (Figure 8a).Therefore, the larger snow-cover in winter and late snow-melting in spring positively contributed to the advance of the SOS. This result shows that snow-melting may play an important role in supplementing soil water and in the supplementation time for the growth of vegetation in spring. However, the mechanism of the snow-cover and the snowmelt period on the SOS is complex and indirect, especially when the soil water is supplemented by melted-snow cover, which plays an important role here; thus, further analysis is needed.
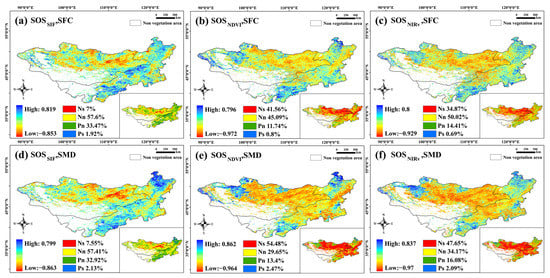
Figure 8.
Spatial distribution of the correlations between winter snow-related climatic factors (SFC, SMD) and the three types of phenological parameters. Note: Ns: significant (p < 0.05) negative correlation; Nn: nonsignificant (p > 0.05) negative correlation; Pn: nonsignificant (p > 0.05) positive correlation; Ps: significant (p < 0.05) positive correlation. The same applies below.
To eliminate the interference between the meteorological factors in spring, we conducted a partial correlation analysis on the precipitation, temperature and soil moisture of the three SOSs (Figure 9). SOSSIF, SOSNDVI and SOSNIRv all showed a positive correlation with PRESpring, and 5.26%, 6.09% and 6.69% of the pixels, respectively, passed the significance test (p < 0.05). Consequently, compared with the other two SOSs, SOSNIRv and PRE were more significant. SOSSIF, SOSNDVI and SOSNIRv showed a negative correlation with TEMSpring. Approximately 11.83%, 12.8% and 8.07%, respectively, of the pixels passed the significance test (p < 0.05); thus, SOSNDVI is highly significant, and mainly distributed in the forest areas in the northeast of Inner Mongolia and the west of Mongolia. SOSSIF, SOSNDVI and SOSNIRv all showed a significant negative correlation with SWSpring. Approximately 20.41%, 24.71% and 17.52%, respectively, of the pixels passed the significance test (p < 0.05) and were mainly distributed in the northern coniferous forest of Mongolia, the eastern meadow steppe and the northeast broadleaf forest of Inner Mongolia. After comparison, the significance of SOSNDVI was the highest. The results show that the effect of spring precipitation on the SOS was relatively small, and due to the decreased precipitation in spring. In addition, the early precipitation in spring may lead to low temperatures, thus delaying the SOS; thus, precipitation and the SOS were positively correlated. In the meantime, the water source for vegetation in spring is mostly from the soil water formed after the melting of snow or frozen soil. Therefore, the temperature and soil moisture in spring showed a high negative correlation with the SOS.
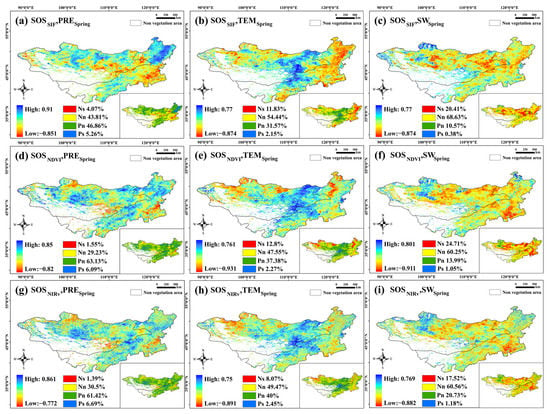
Figure 9.
Spatial distributions of the correlations between temperature (TEMSpring), precipitation (PRESpring), soil moisture (SWSpring) and three types of SOS in (spring).
Due to the complex impact of water and heat synergy on the vegetation in spring, we used the path-analysis method to analyze the direct or indirect effect of the snow-cover area in winter and snow-melting date on SOS under the synergistic effect of spring temperature and soil moisture (the precipitation in spring is small, and the influence is low; thus, no analysis was made). SOSSIF is not sensitive to snow-cover and snowmelt periods. Therefore, in this study, we only analyzed SOSNDVI and SOSNIRv (Figure 10). The results show that a large snow area will delay the snow-melting date. The temperature in spring has a high negative correlation with snow-melting date and soil moisture. Consequently, an increase in temperature may lead to earlier snowmelt. Simultaneously, the advance of the snow-melting date means that the time of soil water supplementation is also advanced. The temperature rise will further lead to the evaporation of soil water and thus be consumed. Hence, the later the snow-melting date is, the higher the amount of soil moisture preserved, which plays an important role in advancing the vegetation rejuvenation period. However, the earlier melting of snow will lead to an increase in evaporation time, and the water eventually stored in the soil will be insufficient to supply vegetation. Moreover, according to the path coefficient, SWSpring has little effect on the SOS, which indicates that the soil moisture content is low during the spring drought. In this period, soil moisture is more important to the supply time of vegetation, which depends on the content of snow and the influence of temperature on snow-melting date. In other words, even if snow-melting supplies much soil water, because the snow-melting date is too early, the soil water is not sufficient for vegetation growth but rather is consumed by evaporation, which means that higher spring soil water may not have the effect of advancing the SOS. This also shows that the path coefficients of SMD and SOS are higher than those of SWSpring. The response of SOSNDVI and SOSNIRv to snow-melting conforms to this mechanism.
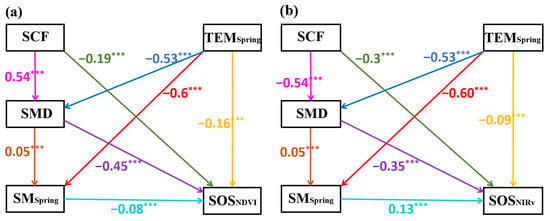
Figure 10.
Path analysis of SOSNDVI (a), and SOSNIRv (b), for each influencing factor. *** indicates that the path coefficient is extremely significant, p < 0.01.
On the Mongolian Plateau, the summer precipitation is positively correlated with the three EOSs, and the spatial distribution is similar; however, EOSSIF is more significant (Figure 11a). A total of 21.19% of the pixels passed the significance test (p < 0.05), and they were mainly distributed in the coniferous forest area in the central part of Mongolia, the eastern border area and the central area of Inner Mongolia. The correlation between the EOS and summer temperature was not significant. The positive correlation areas are mainly distributed in Mongolia and northeastern Inner Mongolia; this may be related to the low temperature at high latitudes (Figure 11b,e,h). The three EOSs showed a negative correlation with soil water in summer, with a similar spatial distribution, and EOSSIF was more significant. A total of 16.44% of the pixels passed the significance test, and they were mainly distributed in southern Inner Mongolia, the meadow steppe belt at the border between central Inner Mongolia and Mongolia, and some forest areas in northeastern Inner Mongolia. The results show that the EOS is delayed by precipitation in summer, and the effect of temperature on the EOS is weak. In addition, too much soil water will lead to the advance of the EOS, and the significant-negative-correlation spatial distribution of EOSSIF and SWSummer overlaps with the positive-correlation spatial distribution of EOSSIF and PRESummer, mainly distributed in the meadow steppe at the border between Inner Mongolia and Mongolia and the forest area in northeastern Inner Mongolia. However, in the coniferous forest region in western Mongolia, precipitation is significantly positively correlated with EOSSIF; meanwhile, in this region, soil water and EOSSIF were not significantly negatively correlated. This shows that the precipitation in western Mongolia is lower than that in central and northeastern Inner Mongolia, and will not lead to excessive soil moisture. The precipitation on the arid and semiarid Mongolian Plateau is mostly concentrated in summer; thus, excessive precipitation will lead to high soil-moisture in areas with high precipitation, which will affect the growth of vegetation. In general, EOSSIF is more sensitive to meteorological factors than EOSNDVI and EOSNIRv.
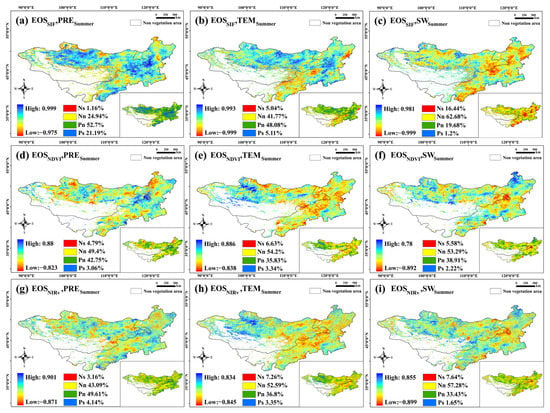
Figure 11.
Spatial distributions of the correlations between temperature (TEMSummer), precipitation (PRESummer), soil moisture (SWSummer) and three types of EOS in summer.
The impact of autumn precipitation on the three EOSs was not significant, which may be due to the low precipitation in autumn (Figure 12a,d,g). TEMAutumn and EOSSIF have a significant positive correlation (Figure 12b). A total of 11.49% of the pixels passed the significance test, mainly distributed in the middle and south of Inner Mongolia, which is mostly sandy vegetation or desert grassland and agricultural land. The first two vegetation types may have strong resistance to drought, while agricultural land may be affected by human irrigation. A 65.17% positive correlation was found between autumn soil-moisture and EOSSIF, and 14.07% of the pixels passed the significance test (p < 0.05), which indicates that soil moisture is most important for vegetation growth in autumn, with less precipitation (Figure 12c). This further explains the negative correlation between soil moisture and EOS in the rainy season. Both EOSNDVI and EOSNIRv are less sensitive to meteorological factors than EOSSIF. This shows that SIF has a stronger feedback ability toward environmental changes.
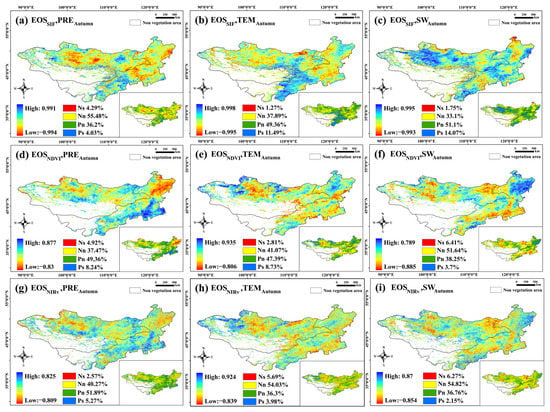
Figure 12.
Spatial distributions of the correlations between temperature (TEMAutumn), precipitation (PREAutumn), soil moisture (SWAutumn) and three types of EOS in (autumn).
3.4. Geographical-Detection Model for SOS and EOS Drivers
From the perspective of spatial differentiation, we analyzed the explanatory power of each factor for the three SOS and EOS. Furthermore, we used the interpretation of the population density on the SOS and EOS to quantify the impact of human activities on the vegetation phenology (Figure 13).
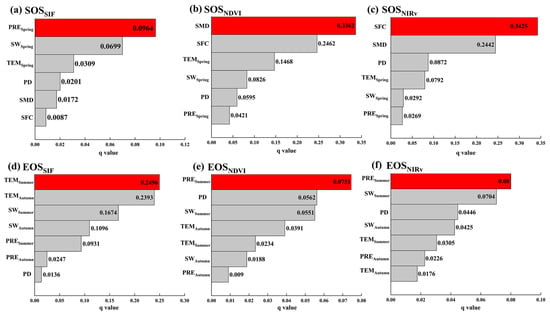
Figure 13.
Interpretations of various influencing factors on SOS and EOS: (a–c) are SOSSIF, SOSNDVI and SOSNIRv, respectively; (d–f) are EOSSIF, EOSNDVI and EOSNIRv, respectively.
According to the results of the factor detector, the factors with the highest interpretation degree (q value) for SOSSIF were PRESpring and SWSpring, with q values of 0.0964 and 0.0699, respectively (Figure 13a). This result shows that the water factor had a high degree of interpretation of SOSSIF in spatial differentiation, but the SFC had the lowest degree of interpretation of SOSSIF among all factors. The factors with the highest interpretation of SOSNDVI were SMD and SFC, and the q values were 0.3362 and 0.2462, respectively (Figure 13b). The degree of interpretation of the population density to SOSNDVI was higher than that of spring precipitation. SFC and SMD were the factors with the highest interpretation of SOSNIRv, with q values of 0.3425 and 0.2442, respectively (Figure 13c). Unlike SOSNDVI, SFC had a higher interpretation of SOSNIRv than SMD. The degree of interpretation of the population density to SOSNDVI was higher than that of spring precipitation, temperature and soil moisture. The results show that all influencing factors had the best explanatory power for SOSNDVI (the highest q value), human activities had the highest explanatory power for SOSNIRv, and SOSSIF had the lowest explanatory power.
The factors with the highest degree of interpretation (q value) for EOSSIF were TEMSummer and TEMAutumn. The q values were 0.2496 and 0.2393, respectively. This result shows that the temperature factor had a high degree of interpretation of EOSSIF in terms of spatial differentiation, but the population density had the lowest degree of interpretation of EOSSIF among all factors. The factors with the highest interpretation of SOSNDVI were PRESummer and PD, and the q values were 0.0751 and 0.0562, respectively. The factors with the highest interpretation of EOSNIRv were PRESummer and SWSummer, and the q values were 0.08 and 0.0704, respectively. The interpretation of the population density to EOSNDVI was higher than that of SWAutumn, TEMSummer, PREAutumn and TEMAutumn. The results show that each influencing factor had the best explanatory power for EOSSIF (the highest q value), human activities had the highest explanatory power for EOSNIRv, and EOSNDVI had the lowest explanatory power.
4. Discussion
At the beginning of the study, we analyzed the SIF, NDVI and NIRv trends and breakpoints. The difference in the three types of data is mainly shown in the sensitivity difference of the breakpoint occurrence time to different vegetation types. The breakpoints detected by SIF and NIRv were later than those detected by NDVI. SIF and NIRv can detect mutations in a short time and add more details of changes in trend. This finding shows that reflecting the advantages and disadvantages of vegetation growth based on the data may lead to some vegetation physiological information being neglected. Therefore, the retrieval of vegetation phenological parameters from singular data may have limitations.
From the perspective of time differentiation, the phenological parameters estimated by NDVI and NIRv were closer, while those estimated by SIF were quite different. In addition, SIF is related to the chlorophyll concentration and directly characterizes photosynthesis. At higher latitudes on the Mongolian Plateau, SIF signals are weak in spring and autumn; thus, the estimated SOS is later, and the EOS is earlier. The difference between NDVI and NIRv is small, and the time trend of EOSSIF is also opposite to that of EOSNDVI and EOSNIRv. This result may be because the phenological changes of different vegetation types are different, and SIF is strongly affected by some vegetation types; thus, the time-trend is different from that of NDVI and NIRv. This finding is related to the difference in the spatial distribution of the phenological trend changes (Figure 4d–f) and the difference in the spatial distribution of the change-points (Figure 7). The relationships between the three phenological parameters and altitude were also different. SOSNDVI and SOSNIRv decrease significantly as the altitude increases. The opposite is true for SOSSIF. At the same time, EOSNIRv increases significantly with elevation, EOSSIF decreases significantly, and NDVI decreases slightly. These results shows that photosynthesis is negatively correlated with altitude, and the duration of vegetation photosynthesis is also shortened with increasing altitude. However, this situation is not necessarily reflected in vegetation greenness. The NDVI and NIRv which were obtained based on spectral reflection do not have this obvious feature. In contrast, the LOS estimated by NIRv increases with elevation, which may be caused by higher chlorophyll concentrations and deeper vegetation colors in high-altitude areas. However, the change in color alone may not directly represent the change in vegetation photosynthesis. For example, the lag in NDVI changes caused by precipitation or temperature has been widely reported [59,60,61]. Vegetation with high greenness may still retain a certain chlorophyll concentration during the EOS. At this moment in time, the activity of photosynthesis-related enzymes is inhibited, due to the decrease in temperature. This may make some difference. SIF directly represents the change in photosynthesis. When photosynthesis is affected by environmental stress, it will immediately show a change in chlorophyll fluorescence. The study of this part still needs to compare and analyze the relationship between phenology and the elevation gradient of different types of vegetation.
In terms of time, the change-point of SOSSIF is earlier than that of SOSNDVI and SOSNIRv (the most change-point is from 2001 to 2003). However, the time of SIF and NIRv is closer (mainly from 2001 to 2003). In addition, in the analysis of EOS change-points, NDVI and NIRv are more similar in time and space. The reason may be that SIF is usually sensitive to changes in forest areas, desert vegetation and agricultural land. NDVI is more sensitive to changes in grassland ecosystems. In addition, the results based on the change-point detection showed that SOSSIF mainly showed a reversal of the decreasing trend to an increasing trend. The opposite was true for SOSNDVI and SOSNIRv. The greenness of the vegetation returned earlier, but photosynthesis was not enhanced and the inflection-point based on the SIF curve was delayed. The early greening of vegetation may not be beneficial to vegetation growth, but lead to a decrease in photosynthetic capacity. Meanwhile, the trend-change of SOSSIF was earlier than that of SOSNDVI and SOSNIRv, which may indicate that SIF can signal the trend-change of vegetation phenology in advance, in terms of the change of phenology.
Additionally, phenological parameters extracted from different observation angles may represent different meanings, and their responses to climate factors may also be different. Because SOSSIF is too late, the correlation between SOSSIF and snow-cover is weak. However, the correlation between the SOS and EOS which were estimated based on SIF and meteorological factors in the spring, summer and autumn, was the most significant. This result shows that the phenological parameters estimated by SIF have the highest sensitivity to environmental changes within a comparison of the three phenological parameters. In general, the impact of environmental factors on vegetation physiology is significant. This may be due to the rapid response of SIF to environmental stress and the advantage of direct characterization of photosynthesis. Reflectivity-based NDVI and NIRv have a certain time-lag in response to environmental changes, which may also be reflected in the extraction of vegetation phenology.
The results also show that the snowmelt period and soil moisture were the most important factors in spring, but their effects on the SOS were very complex. Based on the path-analysis results, the change in the SOS is directly or indirectly caused by multiple factors, or even superposition. The increase in SCF will delay the SMD but also increase the soil water content. The effect of precipitation in spring is less. Therefore, the soil moisture in relatively dry springs may mainly come from the melting supply of snow. The soil moisture content in spring may still not be high overall. Therefore, for the advance of the SOS, the soil moisture must be fully supplied to the spring vegetation instead of being consumed by evaporation. Because the temperature in spring has a strong negative correlation with the snow-melting period and soil moisture, the effect of temperature on the SOS is indirect. This result mainly shows that the temperature causes the SMD to advance and the melted snow to supply soil water prematurely. Simultaneously, the temperature will further lead to the consumption of soil water. During the time interval between the SOS and the snow-melting period, a large amount of soil water will be consumed, and the soil water will not be fully used by growing vegetation. Thus, in a dry spring, the right time for soil water to supply vegetation may be even more important than the total amount of soil water. The delay of the SMD can have critical effects. Of course, soil water is not only supplied by snow; frozen soil is also very important [62,63]. In addition, the positive effect of snow-cover on vegetation is not limited to water supplementation; nitrogen from melted-snow supplementation is also important [64,65,66,67]. The SMD showed a significant correlation with SOSNDVI and SOSNIRv. Additionally, from the perspective of regional differentiation, the interpretation of winter snow cover to SOSNIRv is the highest. The interpretation of EOSNDVI by natural factors in summer and autumn is low, and, except for summer precipitation, the interpretation of SOSNDVI by population-density is high. Moreover, the q value of natural factors and EOSSIF is the highest. Accordingly, NDVI in the Mongolian Plateau may be more suitable for extracting the SOS, and SIF is more suitable for extracting the EOS.
5. Conclusions
We used SIF, NDVI and NIRv to retrieve vegetation changes and detect discontinuities. Based on three types of remote-sensing data, we estimated the phenological parameters of the Mongolian Plateau for 20 years, and conducted a trend analysis and change-point detection. Then, we analyzed the potential impact of meteorological factors in each season and the human factors, on phenological parameters.
The main conclusions of this study are as follows:
- SIF and NIRv can retrieve more details of vegetation dynamics and detect breakpoints earlier than NDVI;
- On the Mongolian Plateau, SOSSIF is the latest, and EOSSIF is the earliest. The time-trends of the phenological parameters estimated based on NIRv and NDVI were similar, and SIF can better express the relationship between altitude and vegetation phenology. The year of main change-points of SOSNDVI and SOSNIRv is later than that of SOSSIF; the change-point of EOSSIF and EOSNIRv is earlier than that of EOSNDVI. The trend change-points of EOSSIF and EOSNIRv were mostly concentrated from 2001 to 2007, and the change-points of EOSNDVI occurred later. The difference in different phenological parameters is mostly due to the difference in the sensitivity of different data to different types of vegetation changes, as well as the different data characteristics;
- The contribution of snow-cover to SOS is mainly shown in the late snow-melting date, which can reduce the evaporation loss of melted snow-cover, and fully supplement the vegetation in the green-returning period as soil water;
- The correlation between spring climate factors and SOSNDVI is most significant. The correlation between summer and autumn meteorological factors and EOSSIF is most significant. From the perspective of spatial differentiation, each influencing factor has the highest degree of interpretation for SOSNDVI and EOSSIF. The population density has the highest interpretation of SOSNDVI and EOSNIRv. On the Mongolian Plateau, NDVI may be more suitable for extracting the SOS, while SIF is more suitable for extracting the EOS. According to the analysis results from different angles, NIRv did not show the most prominent advantages, and SIF is more predictable in the trend analysis of phenology.
Author Contributions
C.E. analyzed the data and wrote the paper. C.E. conceived and designed the experiments. T.B., Y.B. (Yuhai Bao), Y.B. (Yulong Bao), M.Y., Q.L., X.Z. and Y.Z. revised the manuscript. All authors have read and agreed to the published version of the manuscript.
Funding
This study was supported by Early Warning and Information Sharing of Forest and Grassland Fire Risk on the Mongolian Plateau under the Background of Climate Change (Funder: Yuhai Bao; No. 4191101037), Research on Remote Sensing Monitoring and Propagation Path Prediction of Typical Cross-border Disasters in China and Mongolia (Funder: Yuhai Bao; No. 61631011), Research on Monitoring and Early Warning Methods of Black Dzud in Pastoral Areas Based on Daily Snow Products (Funder: Yulong Bao; No. 2021MS04016) and the National Natural Science Foundation of China (Funder: Mei Yong; No. 41867070).
Data Availability Statement
Not applicable.
Acknowledgments
We thank the reviewers for their suggestions, and we are also very grateful to Li and Xiao for sharing their GOSIF data, which were very helpful for our research.
Conflicts of Interest
The authors declare no conflict of interest.
References
- Zhang, G.; Zhang, Y. Green-up dates in the Tibetan Plateau have continuously advanced from 1982 to 2011. Proc. Natl. Acad. Sci. USA 2013, 110, 4309–4314. [Google Scholar] [CrossRef] [PubMed]
- Bao, G.; Chen, J.; Chopping, M.; Bao, Y.; Qin, Z. Dynamics of net primary productivity on the Mongolian Plateau: Joint regulations of phenology and drought. Int. J. Appl. Earth Obs. Geoinf. 2019, 81, 85–97. [Google Scholar] [CrossRef]
- Nandintsetseg, B.; Shinoda, M. Seasonal change of soil moisture in Mongolia: Its climatology and modelling. Int. J. Climatol. 2011, 31, 1143–1152. [Google Scholar] [CrossRef]
- Gang, C.; Zhou, W.; Chen, Y.; Wang, Z.; Sun, Z.; Li, J.; Qi, J.; Odeh, I. Quantitative assessment of the contributions of climate change and human activities on global grassland degradation. Environ. Earth Sci. 2014, 72, 4273–4282. [Google Scholar] [CrossRef]
- Guo, E.; Wang, Y.; Wang, C.; Sun, Z.; Bao, Y.; Mandula, N.; Jirigala, B.; Bao, Y.; Li, H. NDVI Indicates Long-Term Dynamics of Vegetation and Its Driving Forces from Climatic and Anthropogenic Factors in Mongolian Plateau. Remote Sens. 2021, 13, 688. [Google Scholar] [CrossRef]
- Cza, B.; Yan, Y.A.; Wm, C.; Xu, S.A.; Jc, B.; Yr, A.; Tian, X.A.; Yuan, Q.A. RESTREND-based assessment of factors affecting vegetation dynamics on the Mongolian Plateau. Ecol. Model. 2021, 440, 109415. [Google Scholar]
- Zhang, X.; Friedl, M.A.; Schaaf, C.B.; Strahler, A.H.; Hodges, J.C.; Gao, F.; Reed, B.C.; Huete, A. Monitoring vegetation phenology using MODIS. Remote Sens. Environ. 2003, 84, 471–475. [Google Scholar] [CrossRef]
- Miao, L.; Daniel, M.; Cui, X.; Ma, M.; Sylvain, D. Changes in vegetation phenology on the Mongolian Plateau and their climatic determinants. PLoS ONE 2017, 12, e0190313. [Google Scholar] [CrossRef]
- Bao, G.; Jin, H.; Tong, S.; Chen, J.; Du, L. Autumn Phenology and Its Covariation with Climate, Spring Phenology and Annual Peak Growth on the Mongolian Plateau. Agric. For. Meteorol. 2021, 108312. [Google Scholar] [CrossRef]
- Hmimina, G.; Dufrene, E.; Pontailler, J.Y.; Delpierre, N.; Aubinet, M.; Caquet, B.; Grandcourt, A.D.; Flechard, C.; Gross, P.; Heinesch, B. Evaluation of the potential of MODIS satellite data to predict vegetation phenology in different biomes: An investigation using ground-based NDVI measurements. Remote Sens. Environ. 2013, 132, 145–158. [Google Scholar] [CrossRef]
- Wu, C.; Gonsamo, A.; Gough, C.M.; Chen, J.M.; Xu, S. Modeling growing season phenology in North American forests using seasonal mean vegetation indices from MODIS. Remote Sens. Environ. 2014, 147, 79–88. [Google Scholar] [CrossRef]
- Meng, F.; Huang, L.; Chen, A.; Zhang, Y.; Piao, S. Spring and autumn phenology across the Tibetan Plateau inferred from normalized difference vegetation index and solar-induced chlorophyll fluorescence. Big Earth Data 2021, 5, 182–200. [Google Scholar] [CrossRef]
- Zarco-Tejada, P.J.; Morales, A.; Testi, L.; Villalobos, F.J. Spatio-temporal patterns of chlorophyll fluorescence and physiological and structural indices acquired from hyperspectral imagery as compared with carbon fluxes measured with eddy covariance. Remote Sens. Environ. 2013, 133, 102–115. [Google Scholar] [CrossRef]
- Meroni, M.; Rossini, M.; Guanter, L.; Alonso, L.; Rascher, U.; Colombo, R.; Moreno, J. Remote sensing of solar-induced chlorophyll fluorescence: Review of methods and applications. Remote Sens. Environ. 2009, 113, 2037–2051. [Google Scholar] [CrossRef]
- Tubuxin, B.; Rahimzadeh-Bajgiran, P.; Ginnan, Y.; Hosoi, F.; Omasa, K. Estimating chlorophyll content and photochemical yield of photosystem II (Φ PSII ) using solar-induced chlorophyll fluorescence measurements at different growing stages of attached leaves. J. Exp. Bot. 2015, 66, 5595–5603. [Google Scholar] [CrossRef]
- Rahimzadeh-Bajgiran, P.; Tubuxin, B.; Omasa, K. Estimating chlorophyll fluorescence parameters using the joint Fraunhofer line depth and laser-induced saturation pulse (FLD-LISP) method in different plant species. Remote Sens. 2017, 9, 599. [Google Scholar] [CrossRef]
- Joiner, J.; Guanter, L.; Lindstrot, R.; Voigt, M.; Vasilkov, A.; Middleton, E.; Huemmrich, K.; Yoshida, Y.; Frankenberg, C. Global monitoring of terrestrial chlorophyll fluorescence from moderate-spectral-resolution near-infrared satellite measurements: Methodology, simulations, and application to GOME-2. Atmos. Meas. Tech. 2013, 6, 2803–2823. [Google Scholar] [CrossRef]
- Guanter, L.; Aben, I.; Tol, P.; Krijger, J.; Hollstein, A.; Köhler, P.; Damm, A.; Joiner, J.; Frankenberg, C.; Landgraf, J. Potential of the TROPOspheric Monitoring Instrument (TROPOMI) onboard the Sentinel-5 Precursor for the monitoring of terrestrial chlorophyll fluorescence. Atmos. Meas. Tech. 2015, 8, 1337–1352. [Google Scholar] [CrossRef]
- Frankenberg, C.; O’Dell, C.; Berry, J.; Guanter, L.; Joiner, J.; Köhler, P.; Pollock, R.; Taylor, T.E. Prospects for chlorophyll fluorescence remote sensing from the Orbiting Carbon Observatory-2. Remote Sens. Environ. 2014, 147, 1–12. [Google Scholar] [CrossRef]
- Guanter, L.; Zhang, Y.; Jung, M.; Joiner, J.; Voigt, M.; Berry, J.A.; Frankenberg, C.; Huete, A.R.; Zarco-Tejada, P.; Lee, J.-E. Global and time-resolved monitoring of crop photosynthesis with chlorophyll fluorescence. Proc. Natl. Acad. Sci. USA 2014, 111, E1327–E1333. [Google Scholar] [CrossRef]
- Baker, N.R. Chlorophyll fluorescence: A probe of photosynthesis in vivo. Annu. Rev. Plant Biol. 2008, 59, 89–113. [Google Scholar] [CrossRef] [PubMed]
- Sun, Y.; Frankenberg, C.; Jung, M.; Joiner, J.; Guanter, L.; Köhler, P.; Magney, T. Overview of Solar-Induced chlorophyll Fluorescence (SIF) from the Orbiting Carbon Observatory-2: Retrieval, cross-mission comparison, and global monitoring for GPP. Remote Sens. Environ. 2018, 209, 808–823. [Google Scholar] [CrossRef]
- De Smedt, I.; Van Roozendael, M.; Stavrakou, T.; Müller, J.F.; Lerot, C.; Theys, N.; Valks, P.; Hao, N.; Van Der, A.R. Improved retrieval of global tropospheric formaldehyde columns from GOME-2/MetOp-A addressing noise reduction and instrumental degradation issues. Atmos. Meas. Tech. 2012, 5, 2933–2949. [Google Scholar] [CrossRef]
- Sun, Y.; Frankenberg, C.; Wood, J.D.; Schimel, D.; Jung, M.; Guanter, L.; Drewry, D.; Verma, M.; Porcar-Castell, A.; Griffis, T.J. OCO-2 advances photosynthesis observation from space via solar-induced chlorophyll fluorescence. Science 2017, 358, eaam5747. [Google Scholar] [CrossRef] [PubMed]
- Li, X.; Xiao, J. A Global, 0.05-Degree Product of Solar-Induced Chlorophyll Fluorescence Derived from OCO-2, MODIS, and Reanalysis Data. Remote Sens. 2019, 11, 517. [Google Scholar] [CrossRef]
- Ren, P.; Liu, Z.; Zhou, X.; Peng, C.; Xiao, J.; Wang, S.; Li, X.; Li, P. Strong controls of daily minimum temperature on the autumn photosynthetic phenology of subtropical vegetation in China. For. Ecosyst. 2021, 8, 31. [Google Scholar] [CrossRef]
- Li, X.; Fu, Y.H.; Chen, S.; Xiao, J.; Yin, G.; Li, X.; Zhang, X.; Geng, X.; Wu, Z.; Zhou, X. Increasing importance of precipitation in spring phenology with decreasing latitudes in subtropical forest area in China. Agric. For. Meteorol. 2021, 304, 108427. [Google Scholar] [CrossRef]
- Wong, C.; D’Odorico, P.; Arain, M.A.; Ensminger, I. Tracking the phenology of photosynthesis using carotenoid-sensitive and near-infrared reflectance vegetation indices in a temperate evergreen and mixed deciduous forest. New Phytol. 2020, 226, 1682–1695. [Google Scholar] [CrossRef]
- Badgley, G.; Field, C.B.; Berry, J.A. Canopy near-infrared reflectance and terrestrial photosynthesis. Sci. Adv. 2017, 3, e1602244. [Google Scholar] [CrossRef]
- Fernández-Martínez, M.; Yu, R.; Gamon, J.; Hmimina, G.; Peuelas, J. Monitoring Spatial and Temporal Variabilities of Gross Primary Production Using MAIAC MODIS Data. Remote Sens. 2019, 11, 874. [Google Scholar] [CrossRef]
- Sha, Z.; Zhong, J.; Bai, Y.; Tan, X.; Li, J. Spatio-temporal patterns of satellite-derived grassland vegetation phenology from 1998 to 2012 in Inner Mongolia, China. J. Arid Land 2016, 8, 462–477. [Google Scholar] [CrossRef]
- Ren, S.; Ao, Q.; Han, M.; Xin, F.; Tian, J.L. A semi-analytical model for sound propagation in sintered fiber metals. Compos. Part B Eng. 2017, 126, 17–26. [Google Scholar] [CrossRef]
- Luo, M.; Meng, F.; Sa, C.; Duan, Y.; Bao, Y.; Liu, T.; De Maeyer, P. Response of vegetation phenology to soil moisture dynamics in the Mongolian Plateau. Catena 2021, 206, 105505. [Google Scholar] [CrossRef]
- Jeong, S.J.; Chang-Hoi, H.O.; Gim, H.J.; Brown, M.E. Phenology shifts at start vs. end of growing season in temperate vegetation over the Northern Hemisphere for the period 1982–2008. Glob. Chang. Biol. 2011, 17, 2385–2399. [Google Scholar] [CrossRef]
- Peel, M.C.; Finlayson, B.L.; Mcmahon, T.A. Updated world map of the Köppen-Geiger climate classification. Hydrol. Earth Syst. Sci. 2007, 11, 259–263. [Google Scholar] [CrossRef]
- Shi, H.; Gao, Q.; Qi, Y.; Liu, J.; Hu, Y. Wind erosion hazard assessment of the Mongolian Plateau using FCM and GIS techniques. Environ. Earth Sci. 2010, 61, 689–697. [Google Scholar] [CrossRef]
- Liu, Y.; Zhuang, Q.; Chen, M.; Pan, Z.; Tchebakova, N.; Sokolov, A.; Kicklighter, D.; Melillo, J.; Sirin, A.; Zhou, G. Response of evapotranspiration and water availability to changing climate and land cover on the Mongolian Plateau during the 21st century. Glob. Planet. Chang. 2013, 108, 85–99. [Google Scholar] [CrossRef]
- Zhang, X.; Hu, Y.; Zhuang, D.; Qi, Y.; Ma, X. NDVI spatial pattern and its differentiation on the Mongolian Plateau. J. Geogr. Sci. 2009, 19, 403–415. [Google Scholar] [CrossRef]
- Bao, G.; Bao, Y.; Qin, Z.; Xin, X.; Bao, Y.; Bayarsaikan, S.; Zhou, Y.; Chuntai, B. Modeling net primary productivity of terrestrial ecosystems in the semi-arid climate of the Mongolian Plateau using LSWI-based CASA ecosystem model. Int. J. Appl. Earth Obs. Geoinf. 2016, 46, 84–93. [Google Scholar] [CrossRef]
- Jiang, L.; Yao, Z.; Huang, H.Q. Climate variability and change on the Mongolian Plateau: Historical variation and future predictions. Clim. Res. 2016, 67, 1–14. [Google Scholar] [CrossRef]
- Hird, J.N.; McDermid, G.J. Noise reduction of NDVI time series: An empirical comparison of selected techniques. Remote Sens. Environ. 2009, 113, 248–258. [Google Scholar] [CrossRef]
- Richardson, A.D.; Keenan, T.F.; Migliavacca, M.; Ryu, Y.; Sonnentag, O.; Toomey, M. Climate change, phenology, and phenological control of vegetation feedbacks to the climate system. Agric. For. Meteorol. 2013, 169, 156–173. [Google Scholar] [CrossRef]
- Lloyd, D. A phenological classification of terrestrial vegetation cover using shortwave vegetation index imagery. Remote Sens. 1990, 11, 2269–2279. [Google Scholar] [CrossRef]
- Liu, X.; Chen, Y.; Li, Z.; Li, Y.; Zhang, Q.; Zan, M. Driving Forces of the Changes in Vegetation Phenology in the Qinghai–Tibet Plateau. Remote Sens. 2021, 13, 4952. [Google Scholar] [CrossRef]
- Jonsson, P.; Eklundh, L. Seasonality extraction by function fitting to time-series of satellite sensor data. IEEE Trans. Geosci. Remote Sens. 2002, 40, 1824–1832. [Google Scholar] [CrossRef]
- Hufkens, K.; Friedl, M.; Sonnentag, O.; Braswell, B.H.; Milliman, T.; Richardson, A.D. Linking near-surface and satellite remote sensing measurements of deciduous broadleaf forest phenology. Remote Sens. Environ. 2012, 117, 307–321. [Google Scholar] [CrossRef]
- Shao, Y.; Wang, J.; Yan, X. The phenological characteristics of Mongolian vegetation and its response to geographical elements. Geogr. Res. 2021, 40, 3029–3043. [Google Scholar] [CrossRef]
- Verbesselt, J.; Hyndman, R.; Newnham, G.; Culvenor, D. Detecting trend and seasonal changes in satellite image time series. Remote Sens. Environ. 2010, 114, 106–115. [Google Scholar] [CrossRef]
- Verbesselt, J.; Hyndman, R.; Zeileis, A.; Culvenor, D. Phenological change detection while accounting for abrupt and gradual trends in satellite image time series. Remote Sens. Environ. 2010, 114, 2970–2980. [Google Scholar] [CrossRef]
- Fensholt, R.; Langanke, T.; Rasmussen, K.; Reenberg, A.; Prince, S.D.; Tucker, C.; Scholes, R.J.; Le, Q.B.; Bondeau, A.; Eastman, R. Greenness in semi-arid areas across the globe 1981–2007—An Earth Observing Satellite based analysis of trends and drivers. Remote Sens. Environ. 2012, 121, 144–158. [Google Scholar] [CrossRef]
- Lunetta, R.S.; Knight, J.F.; Ediriwickrema, J.; Lyon, J.G.; Worthy, L.D. Land-cover change detection using multi-temporal MODIS NDVI data. Remote Sens. Environ. 2006, 105, 142–154. [Google Scholar] [CrossRef]
- Kendall, M.G. Rank Correlation Methods. Br. J. Psychol. 1990, 25, 86–91. [Google Scholar] [CrossRef]
- Verbesselt, J.; Zeileis, A.; Herold, M. Near real-time disturbance detection using satellite image time series. Remote Sens. Environ. 2012, 123, 98–108. [Google Scholar] [CrossRef]
- Lawrence, A. Algorithms for the optimal identification of segment neighborhoods. Bull. Math. Biol. 1989, 51, 39–54. [Google Scholar]
- Killick, R.; Fearnhead, P.; Eckley, I.A. Optimal detection of changepoints with a linear computational cost. J. Am. Stat. Assoc. 2012, 107, 1590–1598. [Google Scholar] [CrossRef]
- Killick, R.; Eckley, I.A.; Pebesma, E.; Zeileis, A. Changepoint: An R Package for Changepoint Analysis. J. Stat. Softw. 2014, 3, 1–19. [Google Scholar]
- Su, Y.; Li, T.X.; Cheng, S.K.; Wang, X. Spatial distribution exploration and driving factor identification for soil salinisation based on geodetector models in coastal area. Ecol. Eng. 2020, 156, 18. [Google Scholar] [CrossRef]
- Wang, J.F.; Li, X.H.; Christakos, G.; Liao, Y.L.; Zhang, T.; Gu, X.; Zheng, X.Y. Geographical Detectors-Based Health Risk Assessment and its Application in the Neural Tube Defects Study of the Heshun Region, China. Int. J. Geogr. Inf. Sci. 2010, 24, 107–127. [Google Scholar] [CrossRef]
- Zhe, M.; Zhang, X. Time-lag effects of NDVI responses to climate change in the Yamzhog Yumco Basin, South Tibet. Ecol. Indic. 2021, 124, 107431. [Google Scholar] [CrossRef]
- Li, P.; Wang, J.; Liu, M.; Xue, Z.; Bagherzadeh, A.; Liu, M. Spatio-temporal variation characteristics of NDVI and its response to climate on the Loess Plateau from 1985 to 2015. Catena 2021, 203, 105331. [Google Scholar] [CrossRef]
- Ji, L.; Peters, A.J. Lag and seasonality considerations in evaluating AVHRR NDVI response to precipitation. Photogramm. Eng. Remote Sens. 2005, 71, 1053–1061. [Google Scholar] [CrossRef]
- Sturm, M.; Schimel, J.; Michaelson, G.; Welker, J.M.; Oberbauer, S.F.; Liston, G.E.; Fahnestock, J.; Romanovsky, V.E. Winter biological processes could help convert arctic tundra to shrubland. Bioscience 2005, 55, 17–26. [Google Scholar] [CrossRef]
- Li, Y.; Fu, Q.; Li, T.; Liu, D.; Hou, R.; Li, Q.; Yi, J.; Li, M.; Meng, F. Snow melting water infiltration mechanism of farmland freezing-thawing soil and determination of meltwater infiltration parameter in seasonal frozen soil areas. Agric. Water Manag. 2021, 258, 107165. [Google Scholar] [CrossRef]
- Warner, K.A.; Saros, J.E.; Simon, K.S. Nitrogen Subsidies in Glacial Meltwater: Implications for High Elevation Aquatic Chains. Water Resour. Res. 2017, 53, 9791–9806. [Google Scholar] [CrossRef]
- Morse, J.L.; Durán, J.; Groffman, P.M. Soil Denitrification Fluxes in a Northern Hardwood Forest: The Importance of Snowmelt and Implications for Ecosystem N Budgets. Ecosystems 2015, 18, 520–532. [Google Scholar] [CrossRef]
- Harpold, A.A.; Molotch, N.P.; Musselman, K.N.; Bales, R.C.; Kirchner, P.B.; Litvak, M.; Brooks, P.D. Soil moisture response to snowmelt timing in mixed-conifer subalpine forests. Hydrol. Process. 2015, 29, 2782–2798. [Google Scholar] [CrossRef]
- Ambadan, J.T.; Berg, A.A.; Merryfield, W.J.; Lee, W.S. Influence of snowmelt on soil moisture and on near surface air temperature during winter-spring transition season. Clim. Dyn. 2018, 51, 1295–1309. [Google Scholar] [CrossRef]
Disclaimer/Publisher’s Note: The statements, opinions and data contained in all publications are solely those of the individual author(s) and contributor(s) and not of MDPI and/or the editor(s). MDPI and/or the editor(s) disclaim responsibility for any injury to people or property resulting from any ideas, methods, instructions or products referred to in the content. |
© 2022 by the authors. Licensee MDPI, Basel, Switzerland. This article is an open access article distributed under the terms and conditions of the Creative Commons Attribution (CC BY) license (https://creativecommons.org/licenses/by/4.0/).