
Mapping Winter Wheat with Optical and SAR Images Based on Google Earth Engine in Henan Province, China

 , ,
, ,
Abstract
:1. Introduction
2. Study Area and Datasets
2.1. Study Area
2.2. Datasets and Preprocessing
2.2.1. Sentinel Data
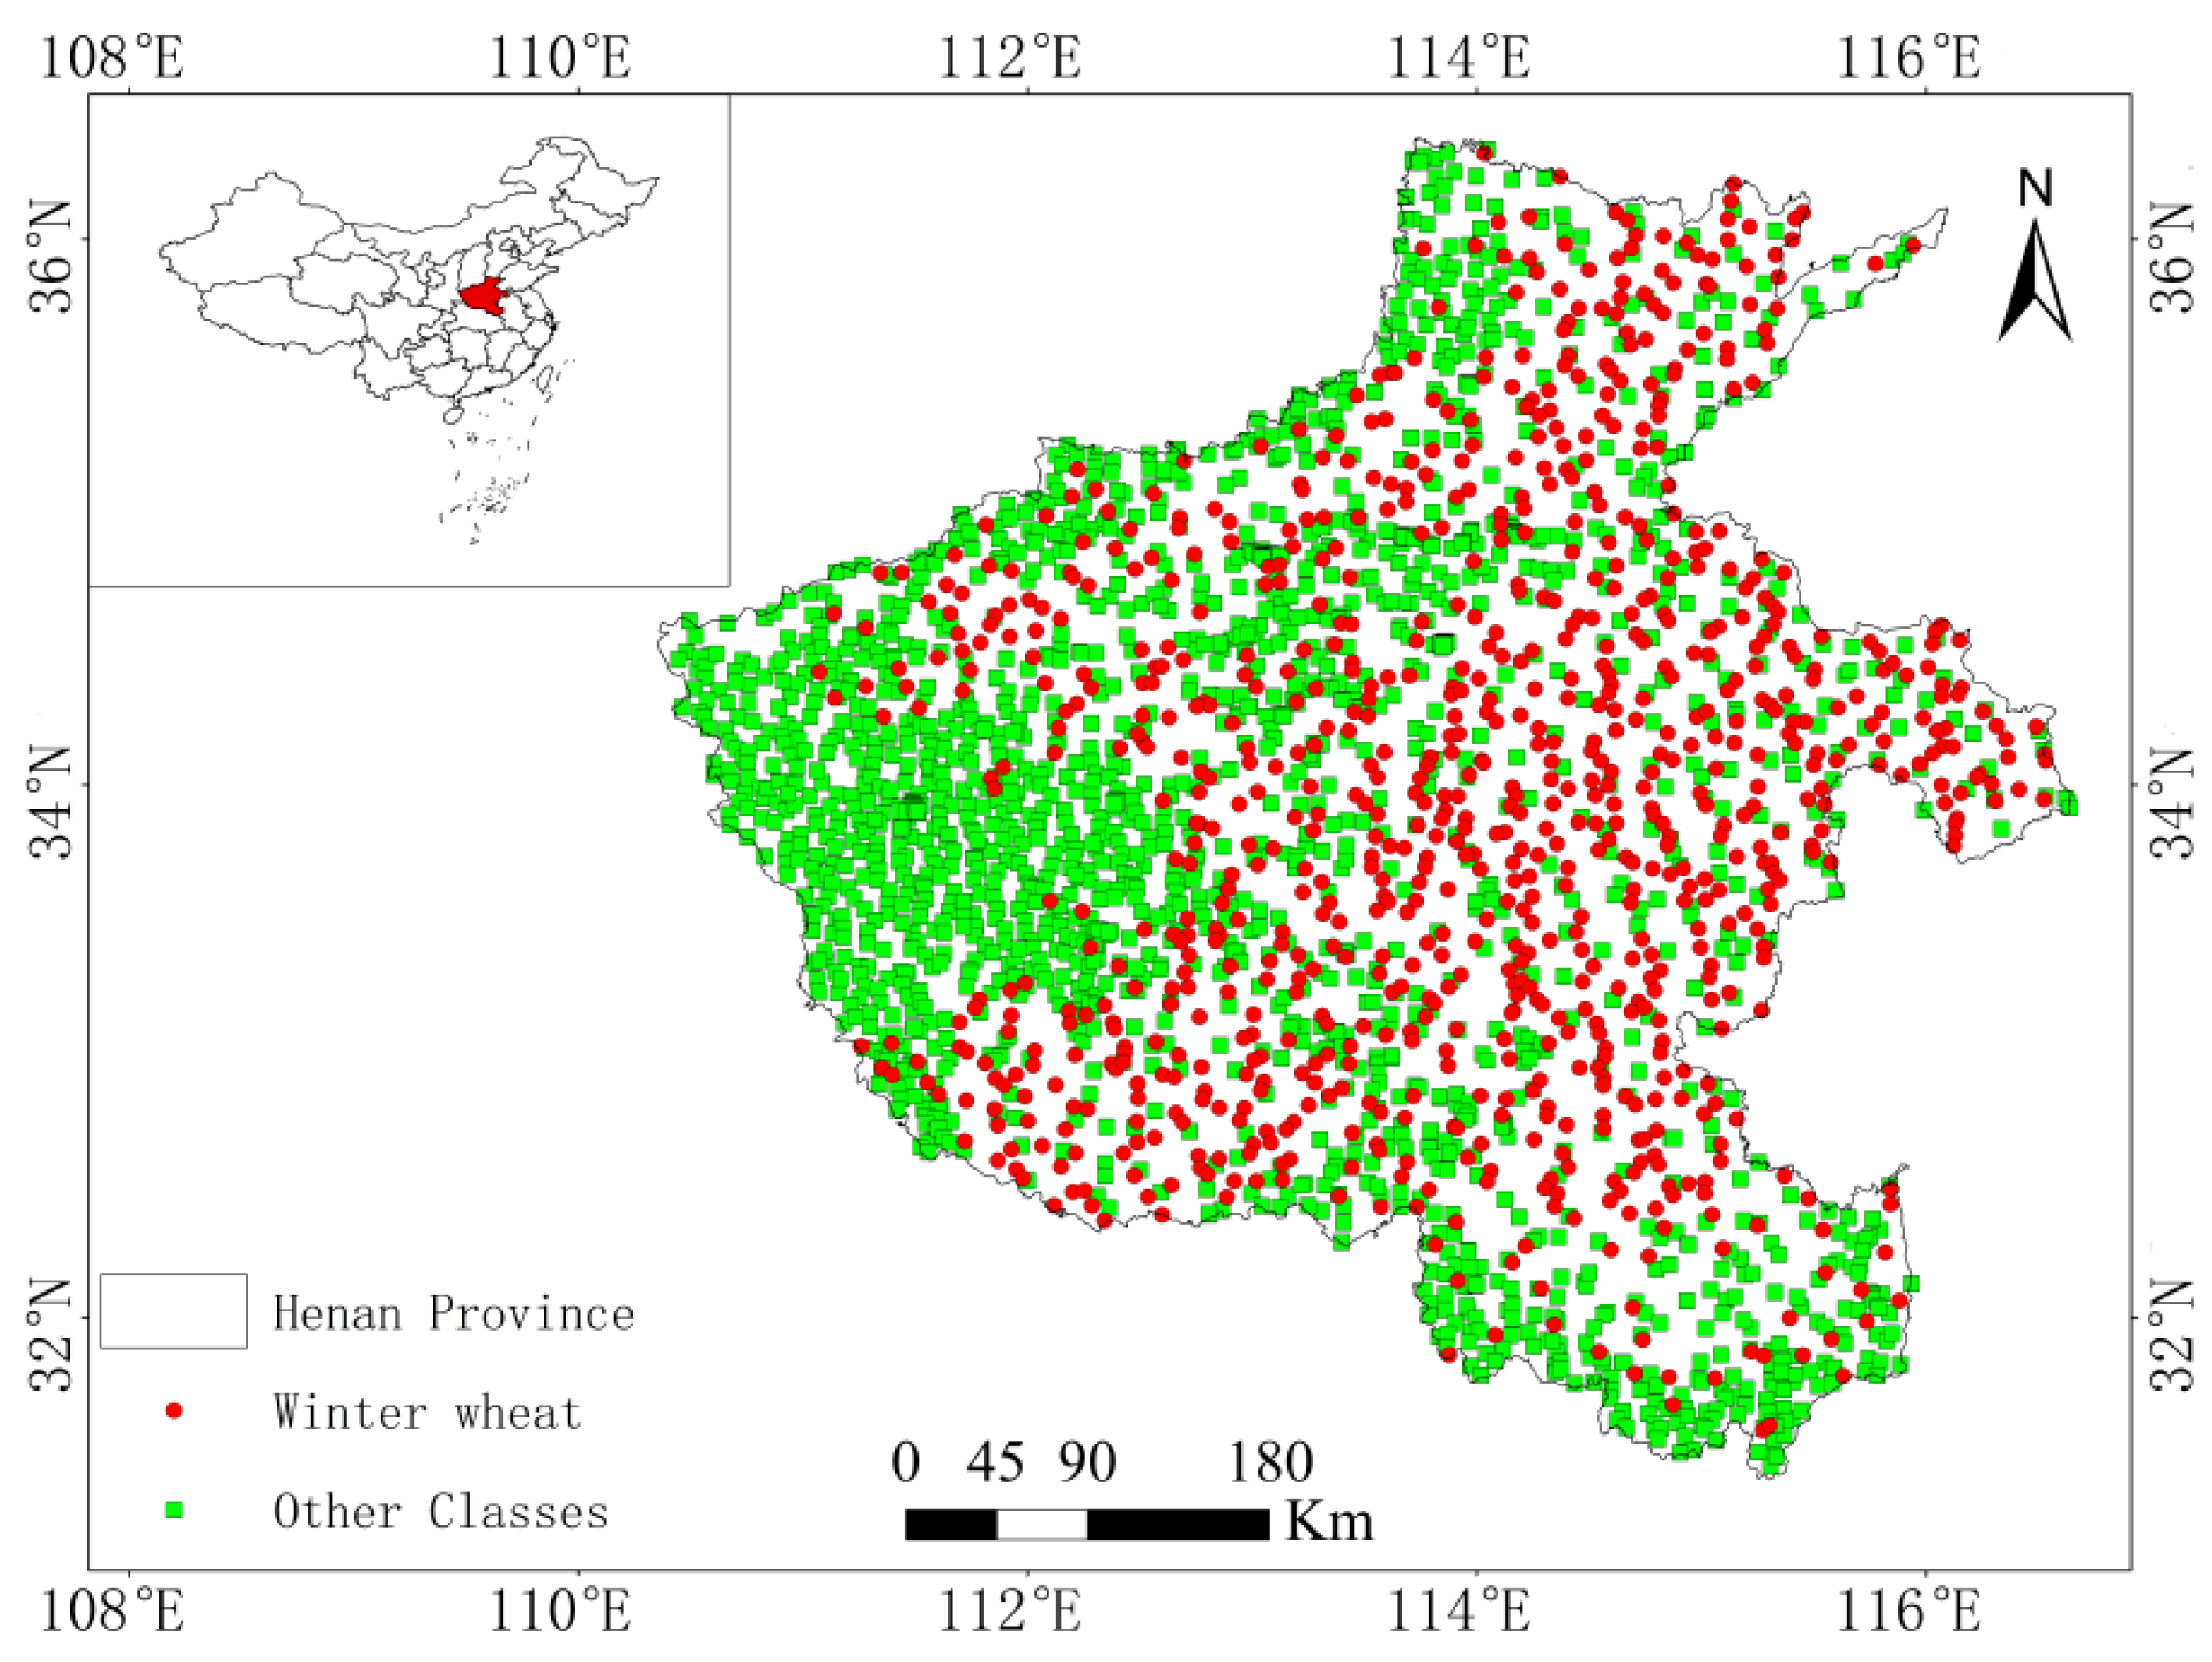
2.2.2. Sample Data
2.2.3. MODIS Data
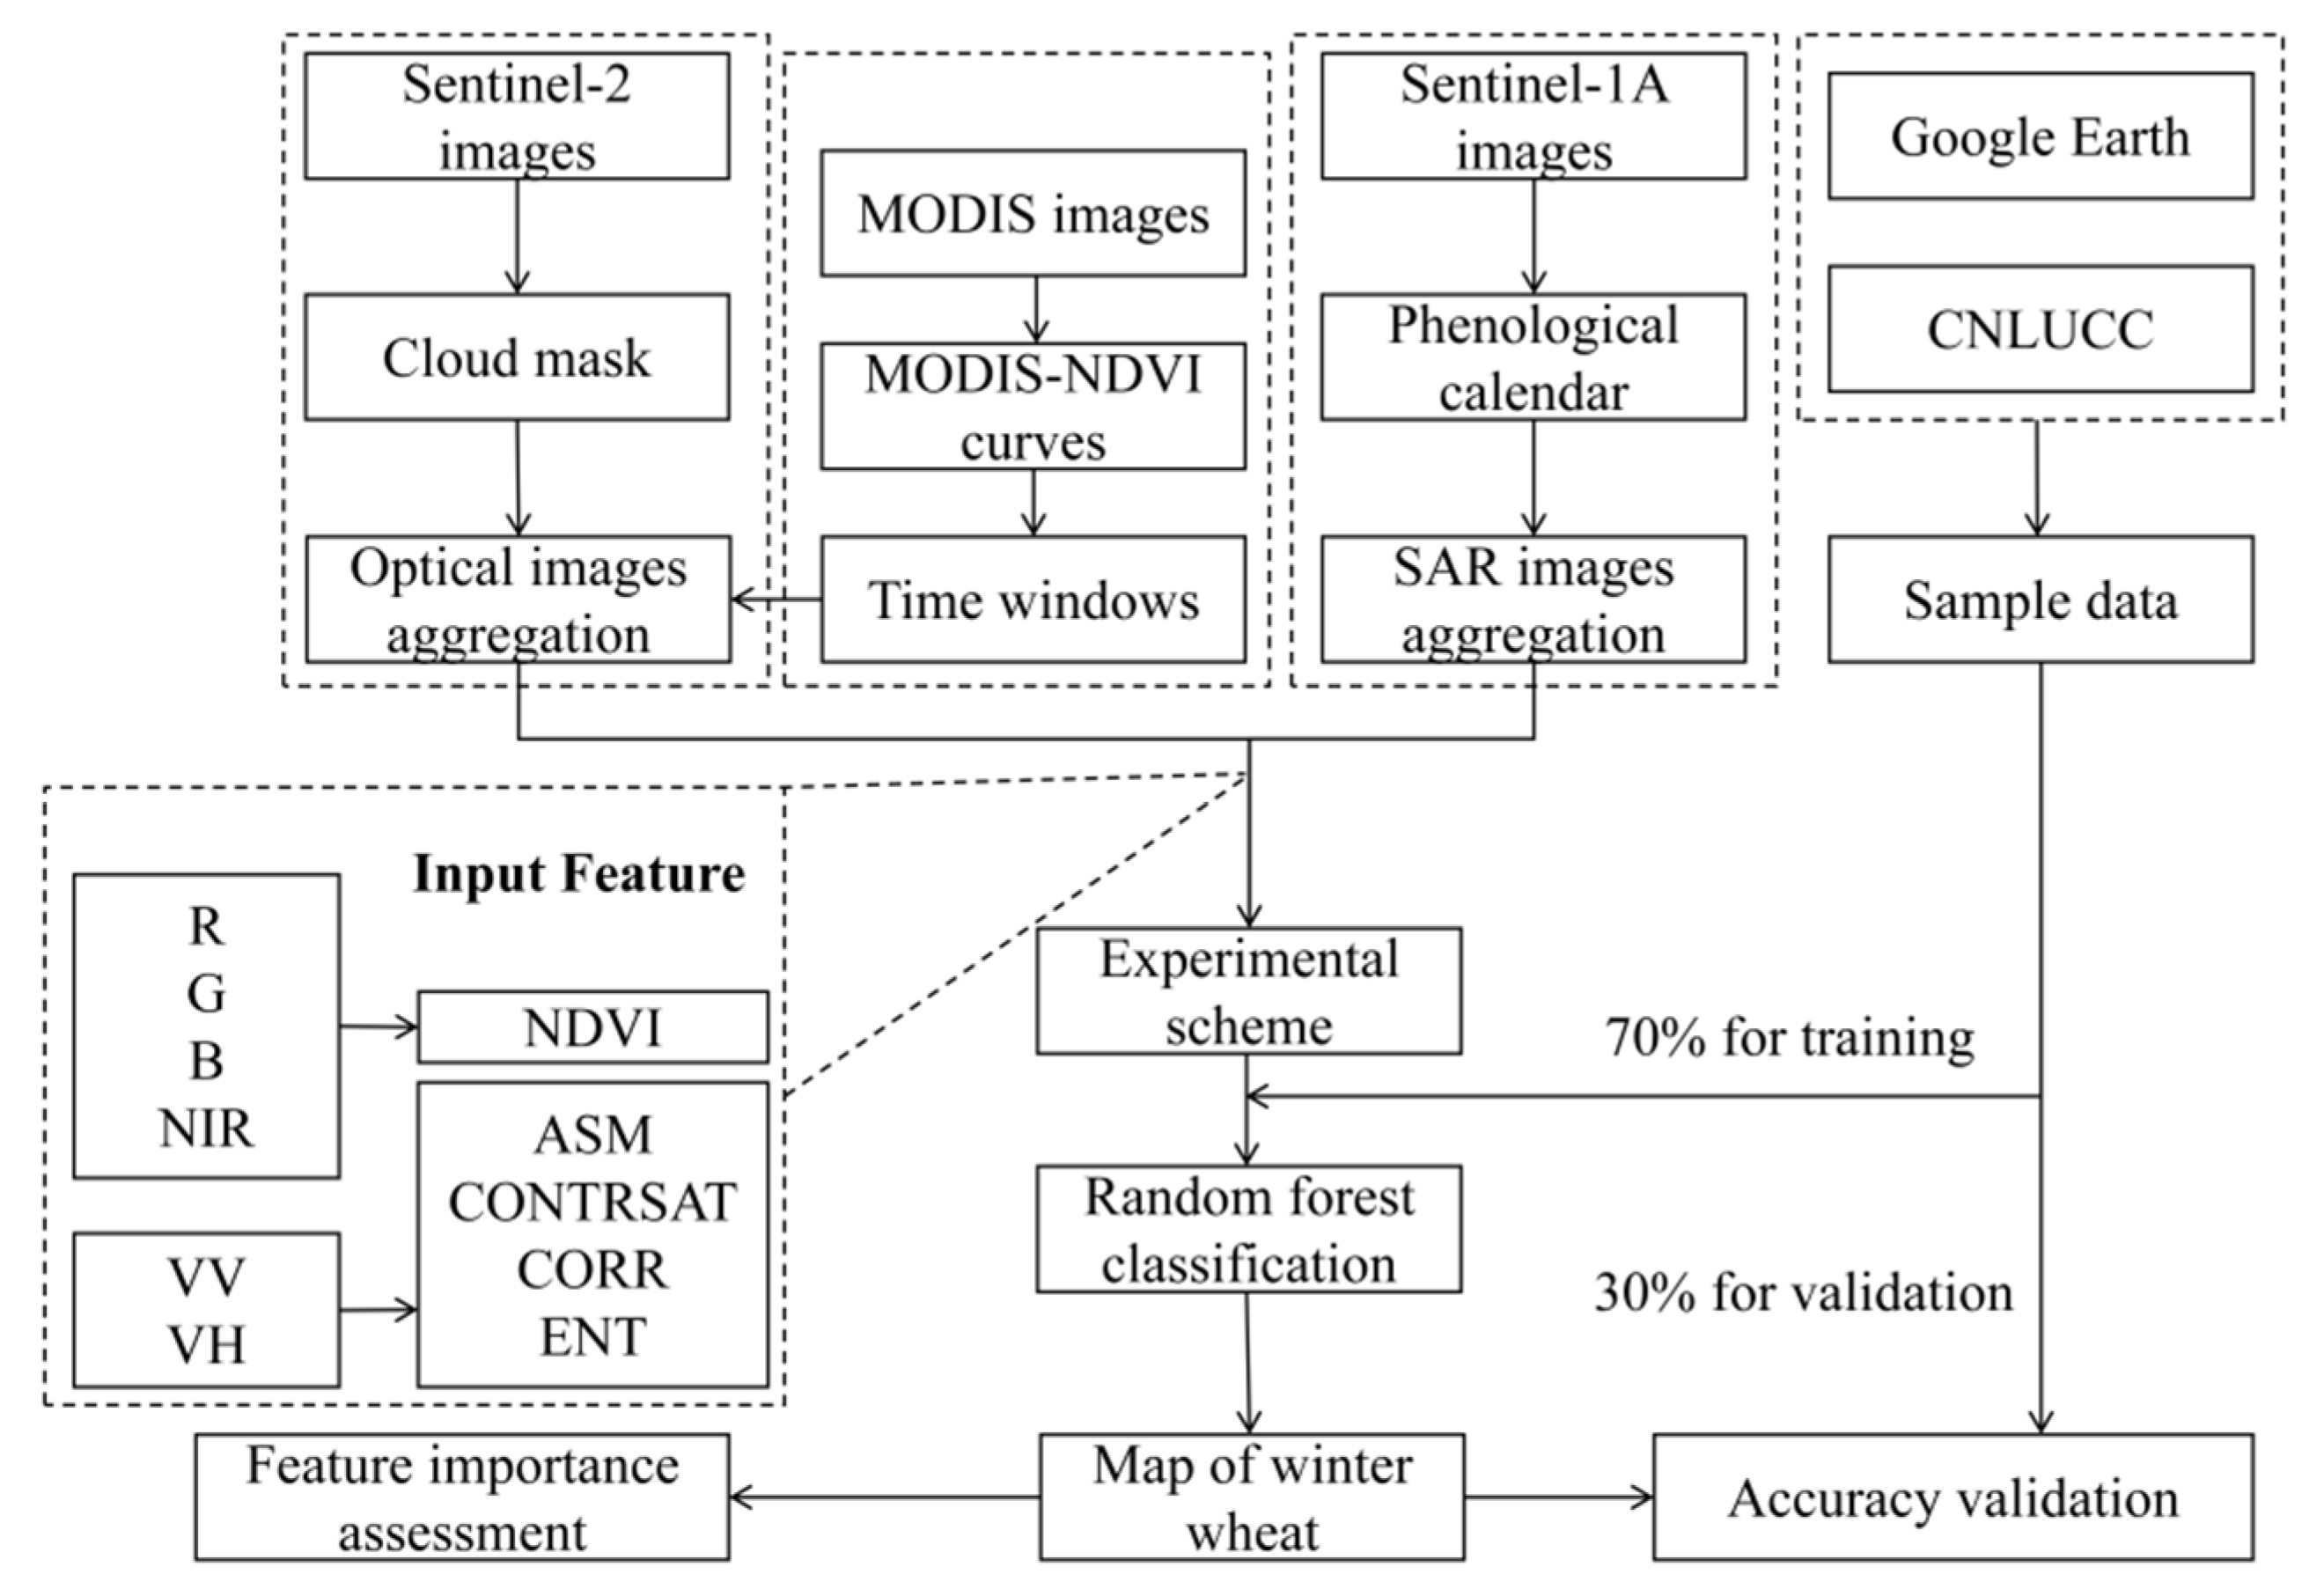
3. Methodology
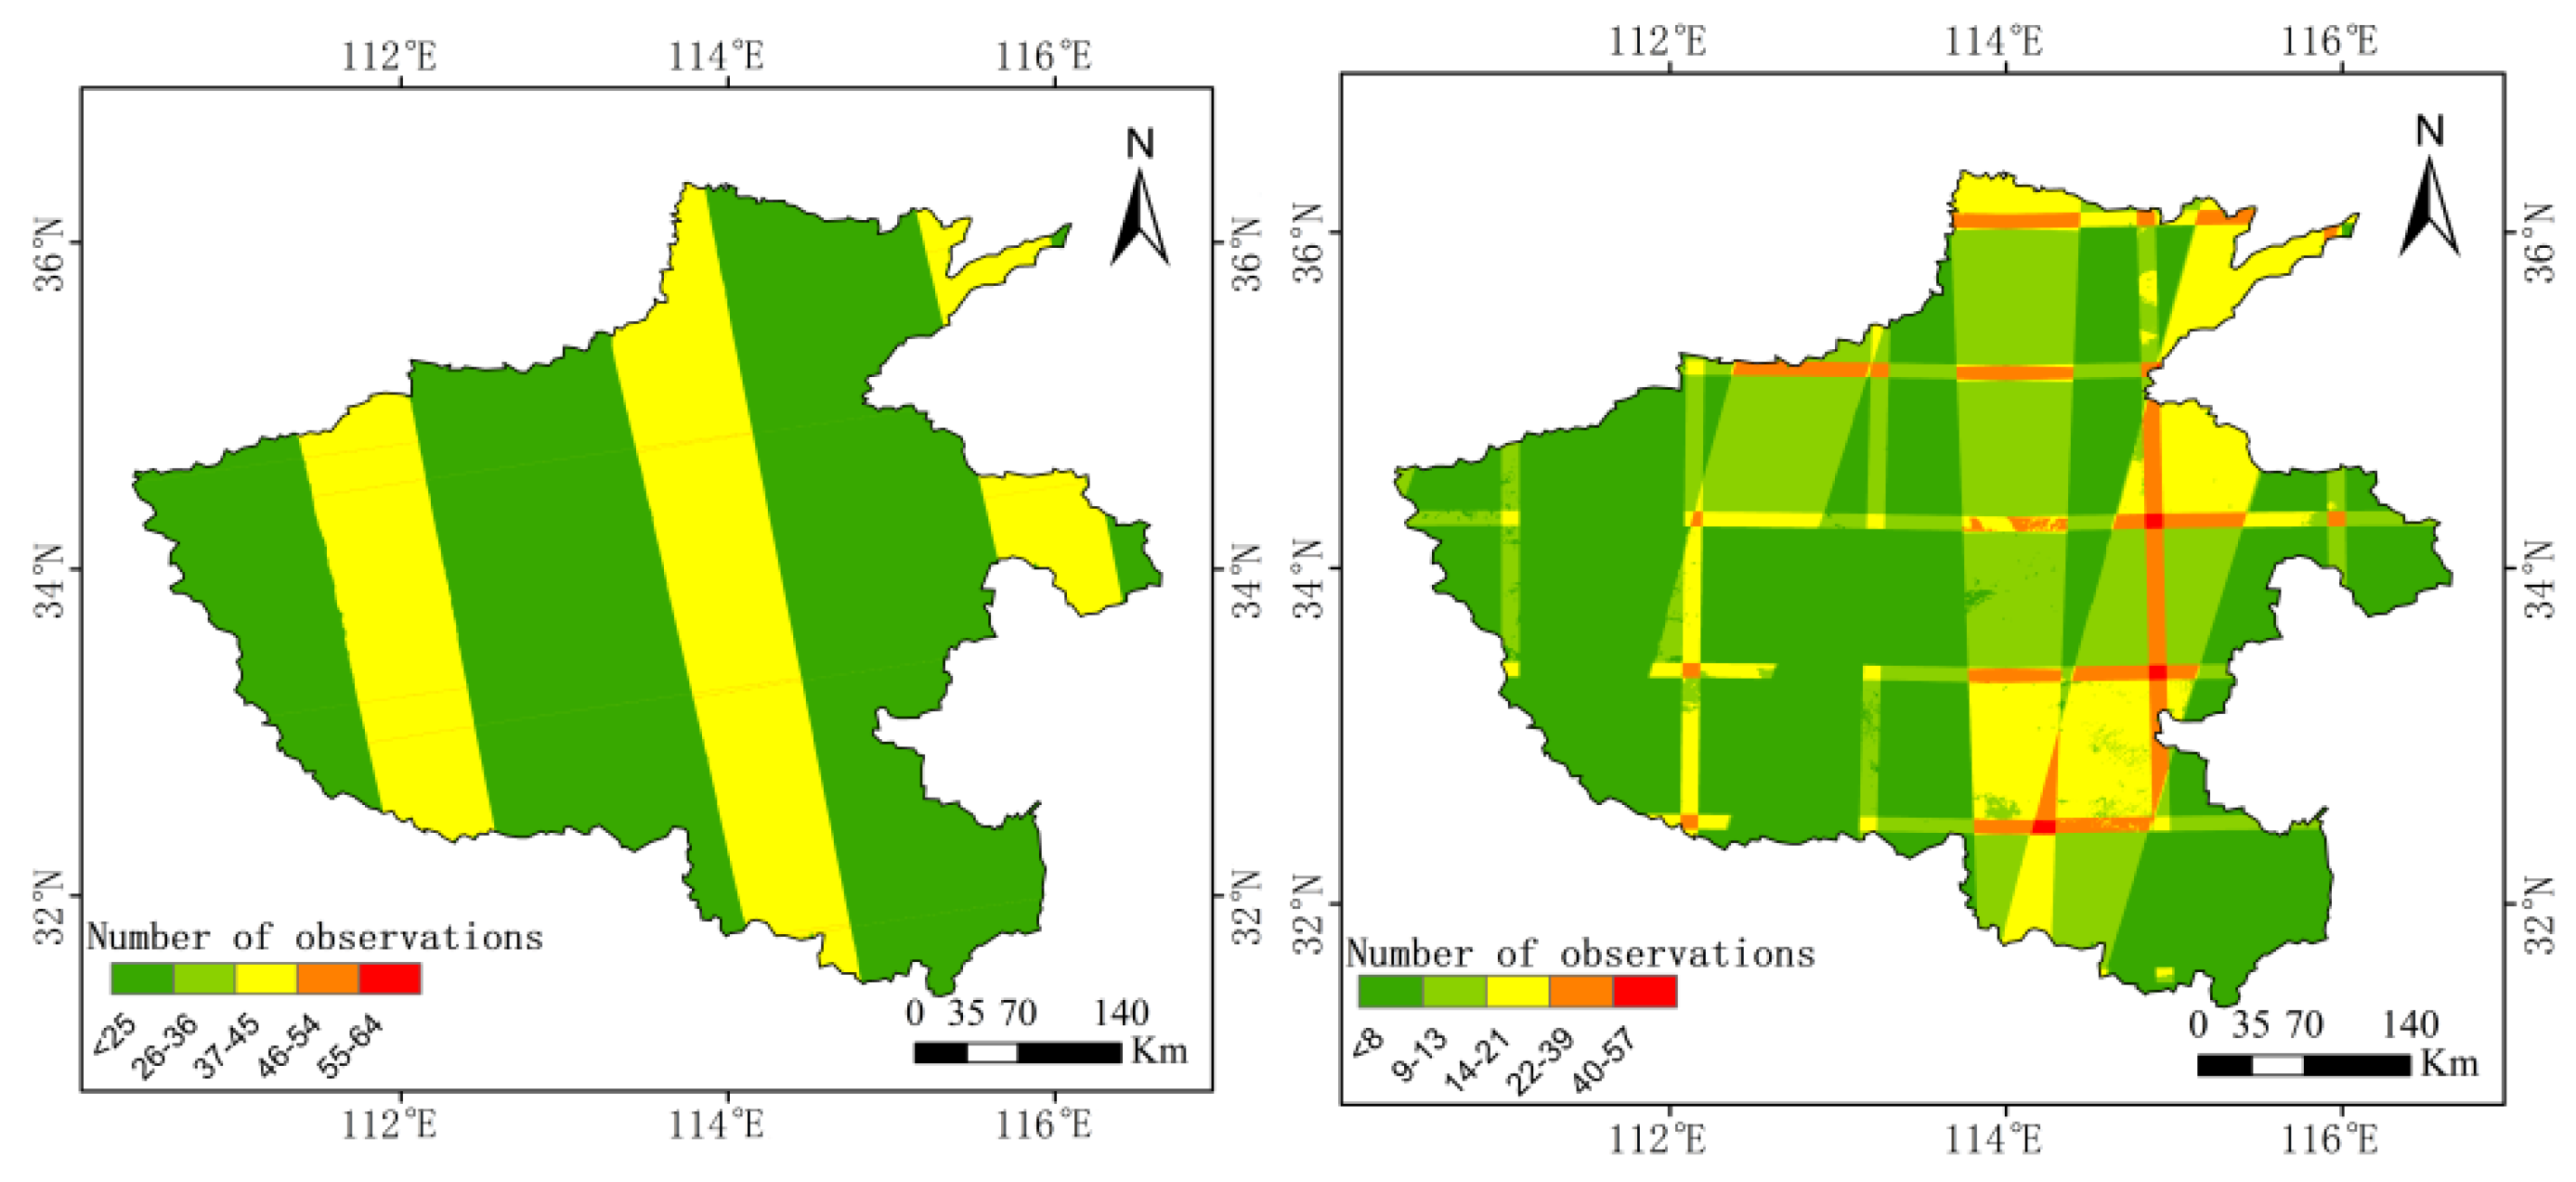
3.1. Image Aggregation Scheme
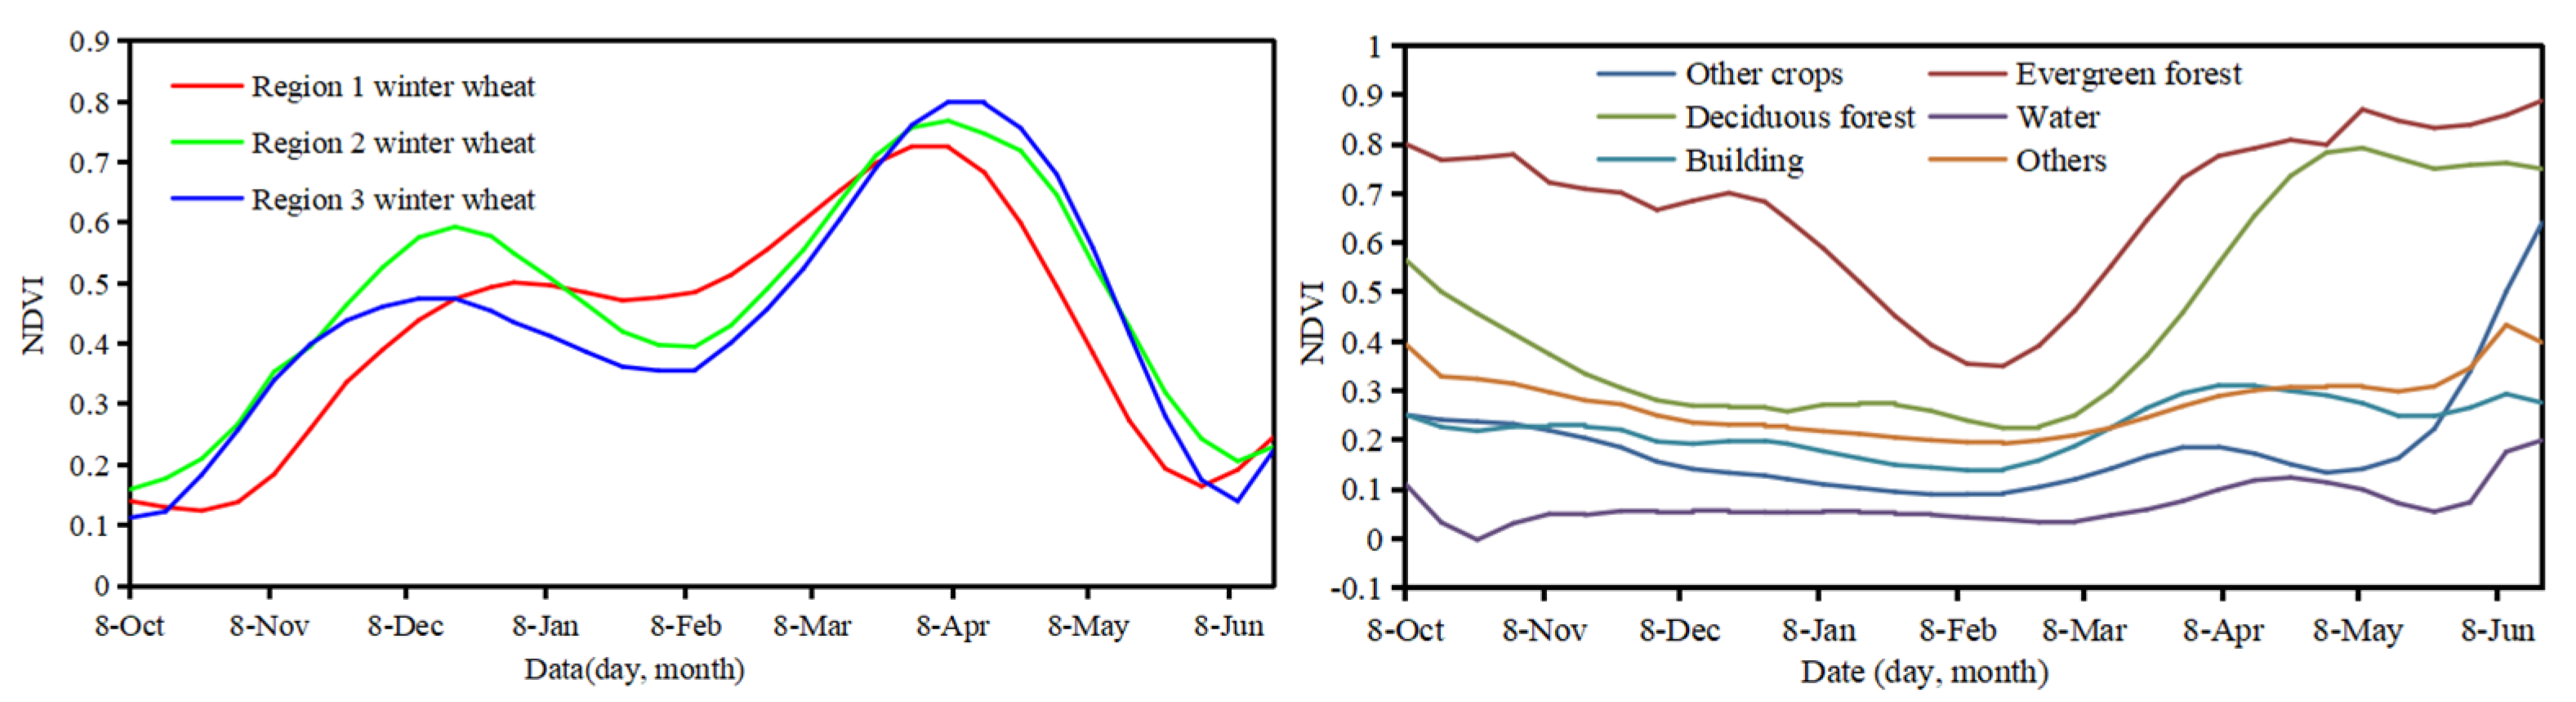
3.1.1. MODIS-NDVI Curves and Aggregation of Sentinel-2 Images
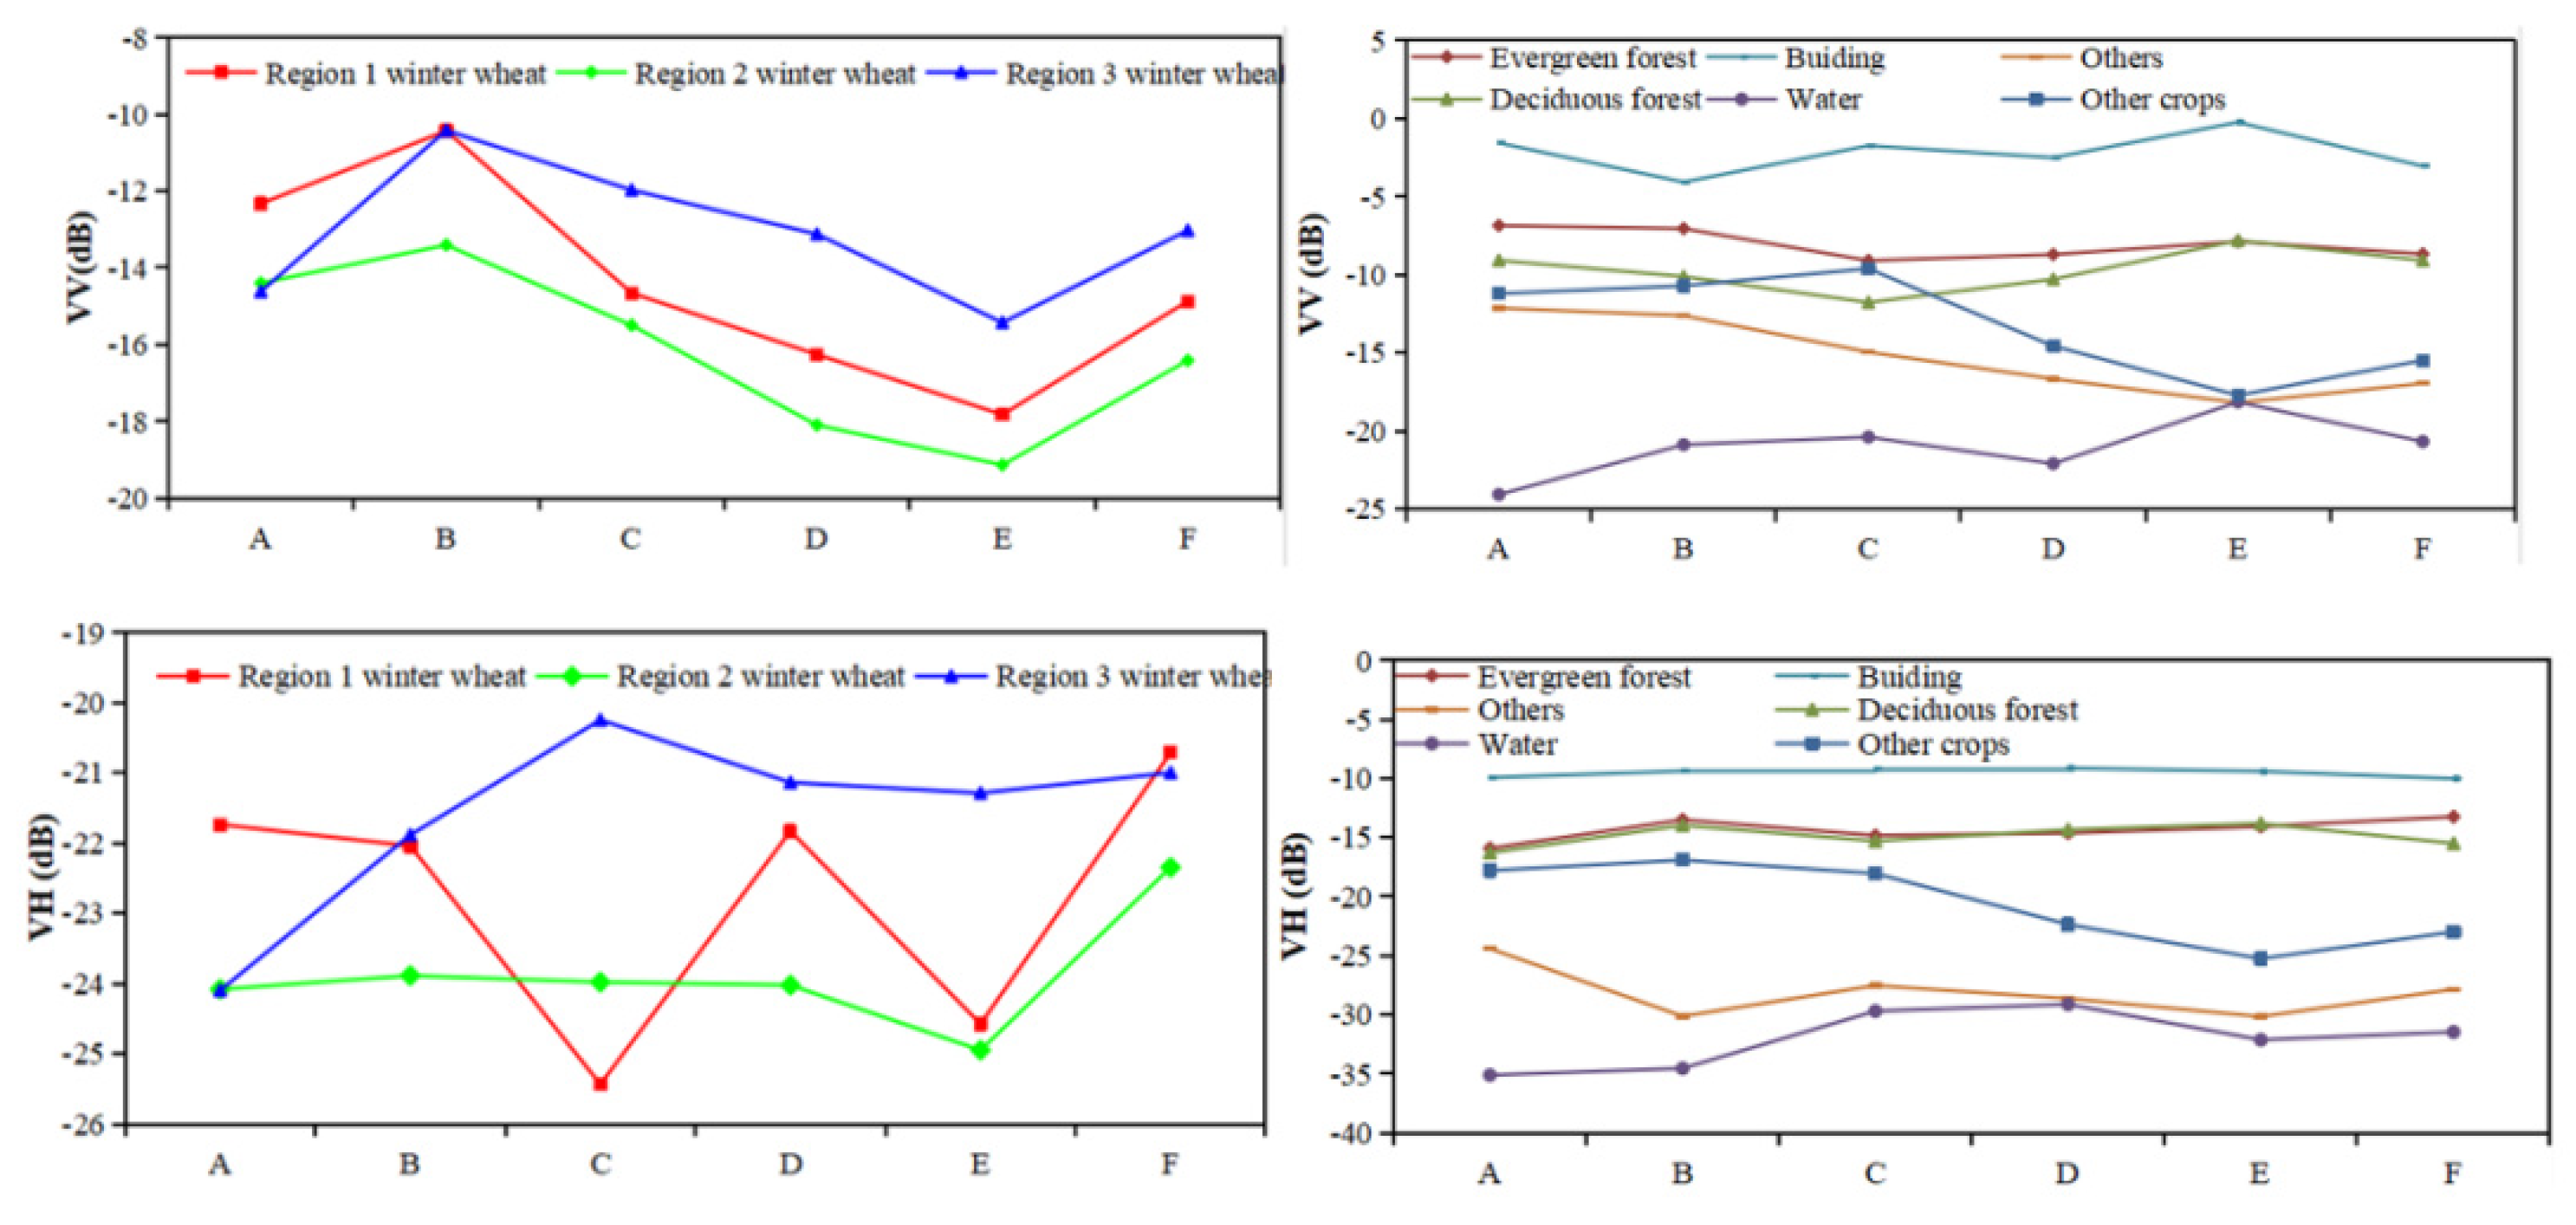
3.1.2. Growth Period of Winter Wheat and Aggregation of Sentinel-1A Images
3.2. Calculation of Feature Variables
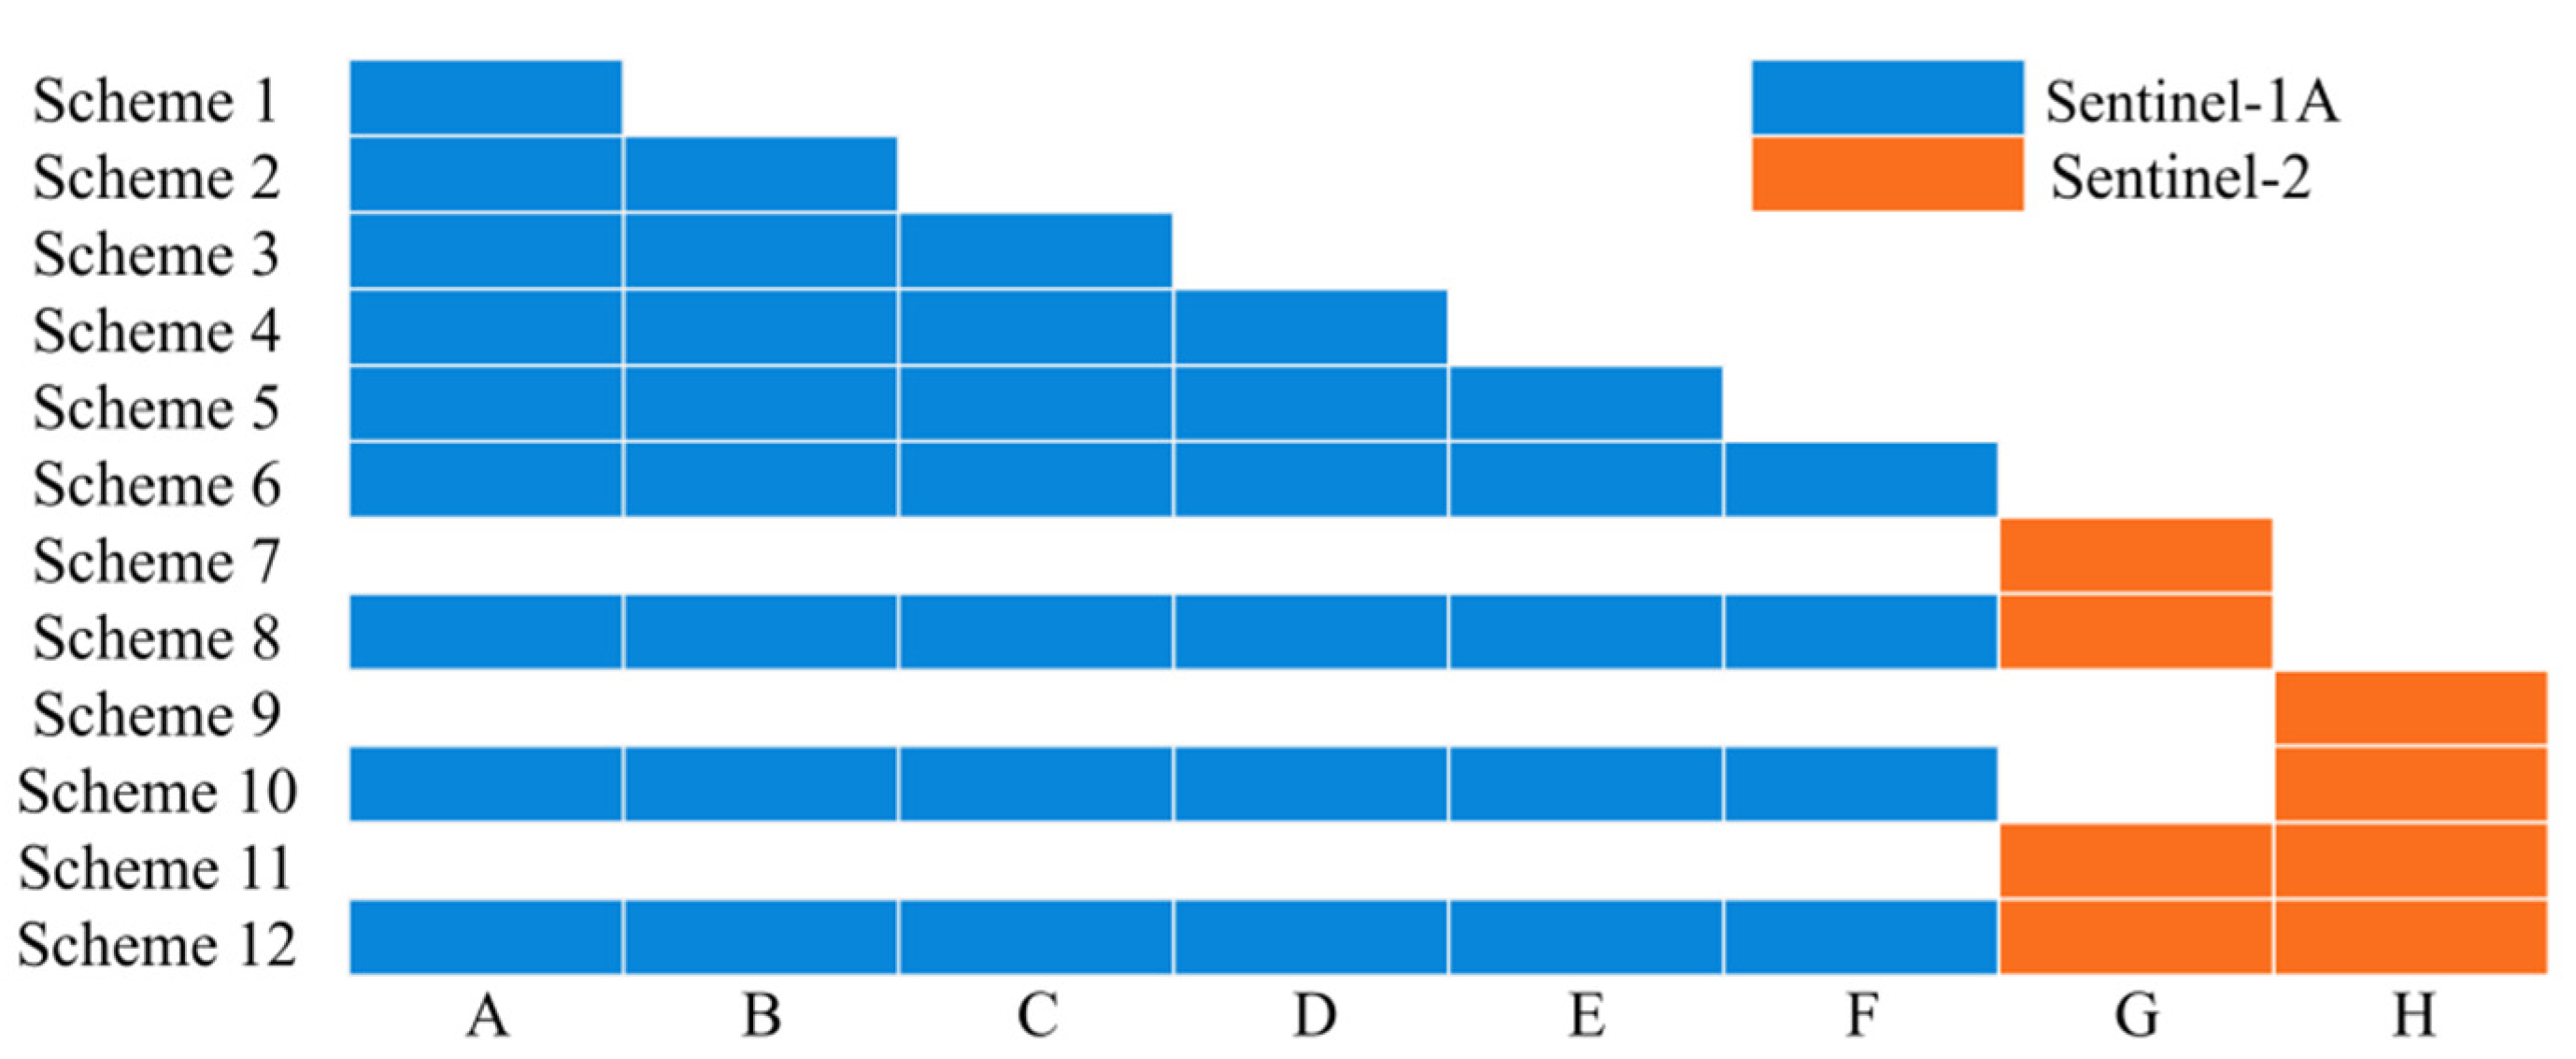
3.3. Experimental Design
3.4. Random Forest Algorithm
3.5. Accuracy Assessment
3.6. Assessment of Feature Variable Importance
4. Results
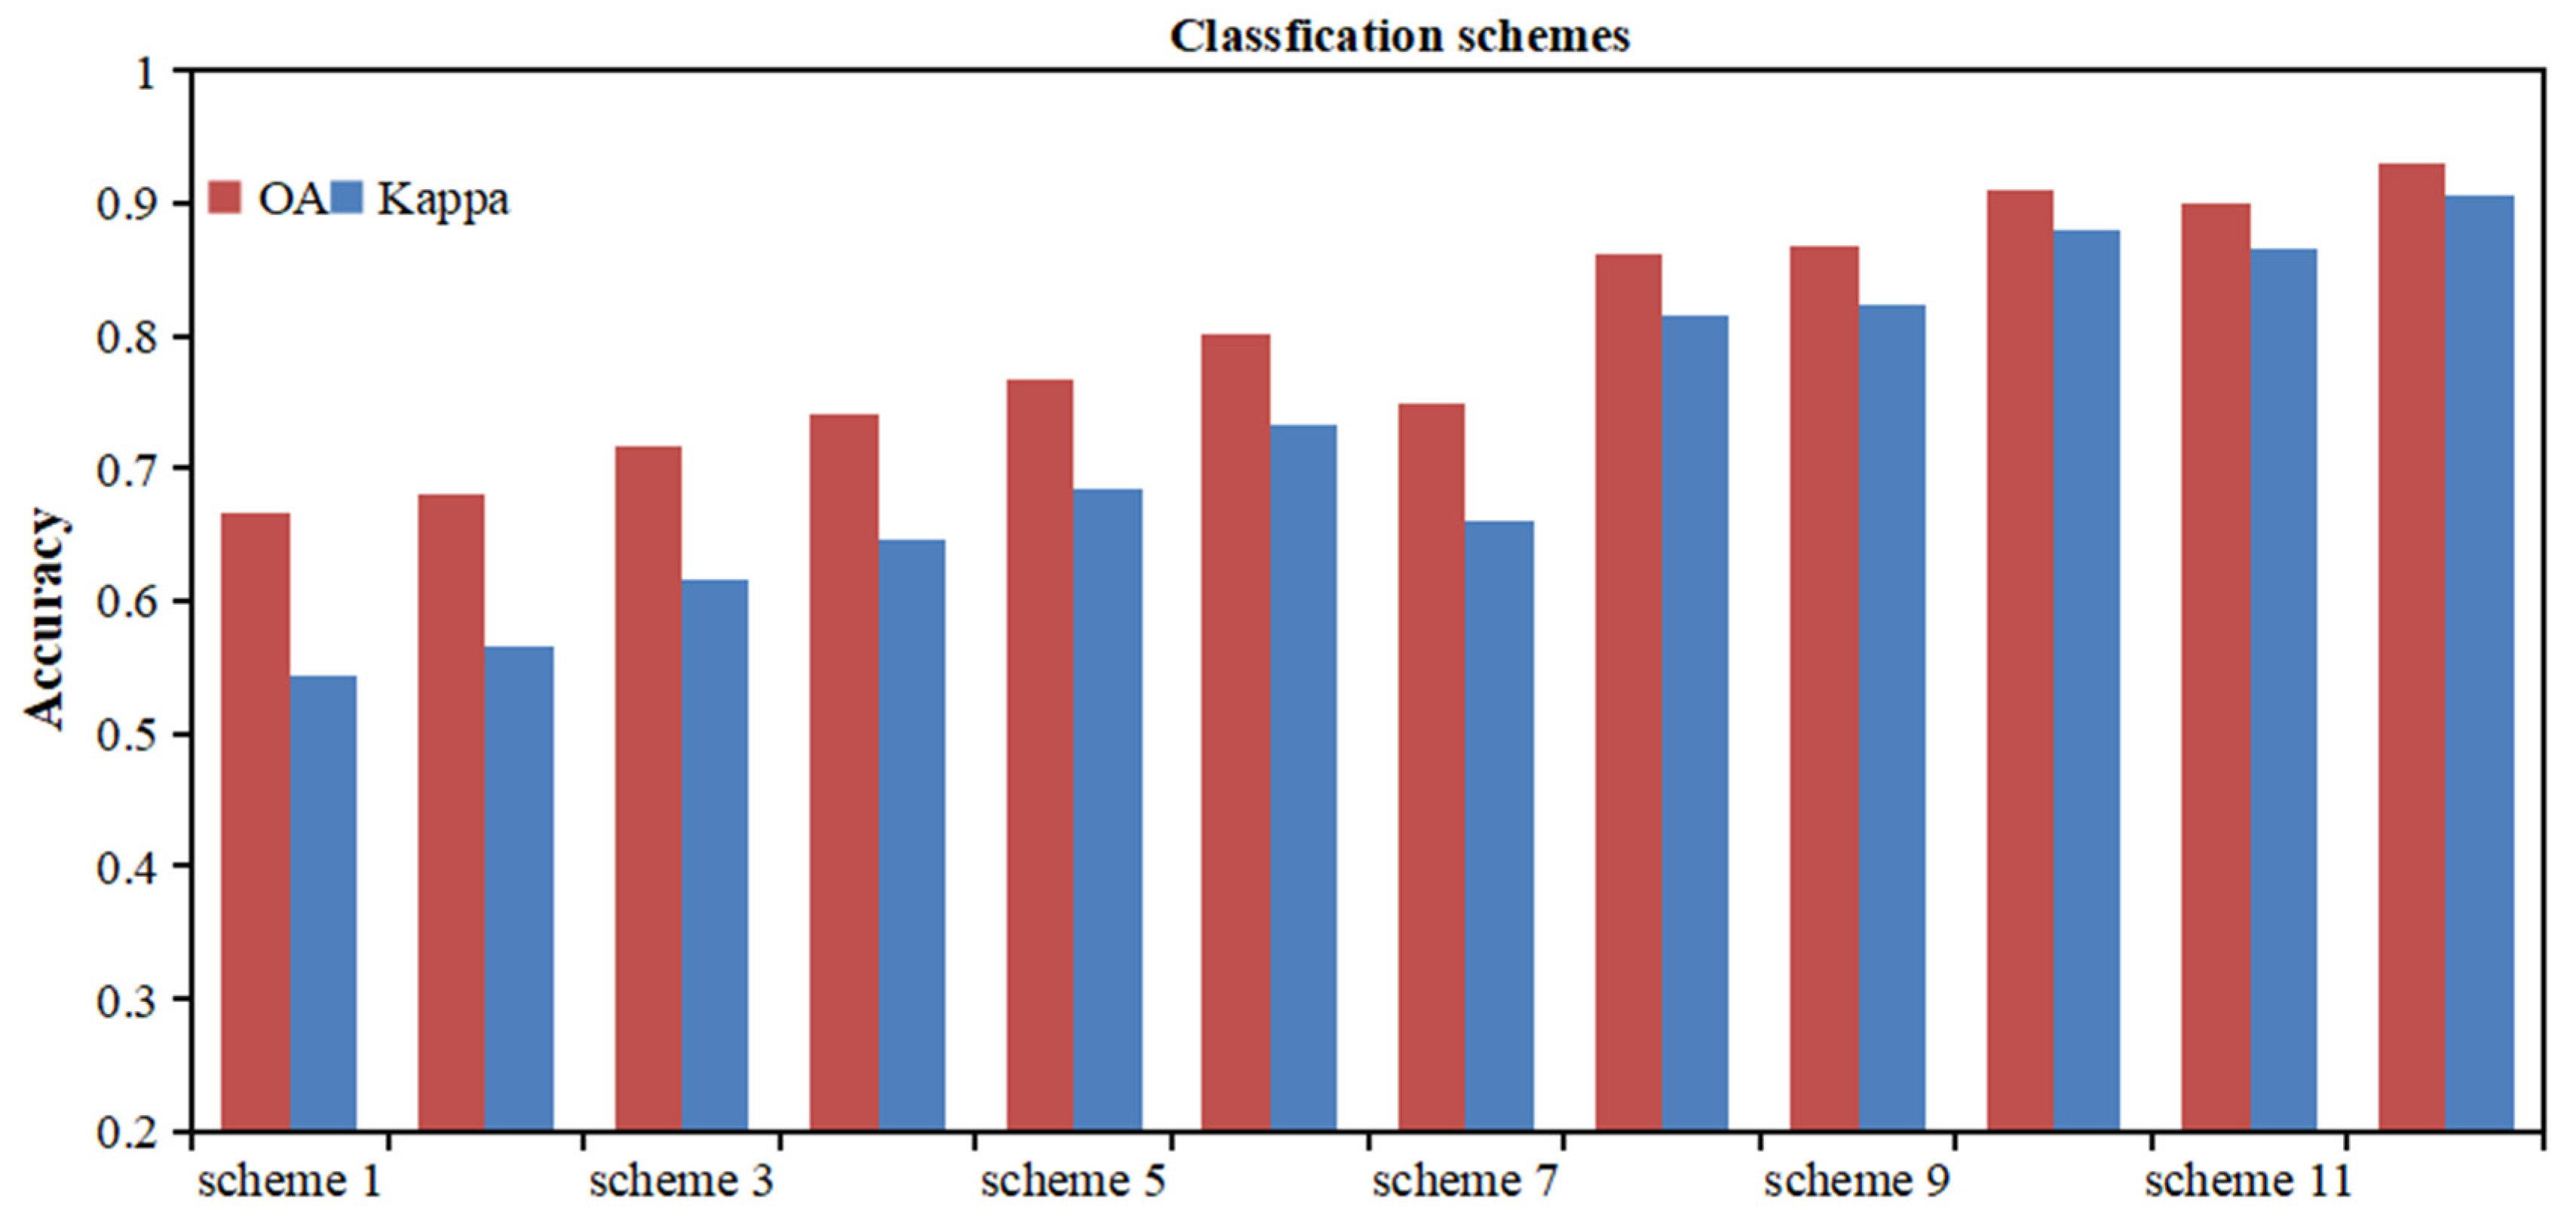
4.1. Accuracy of Experimental Schemes
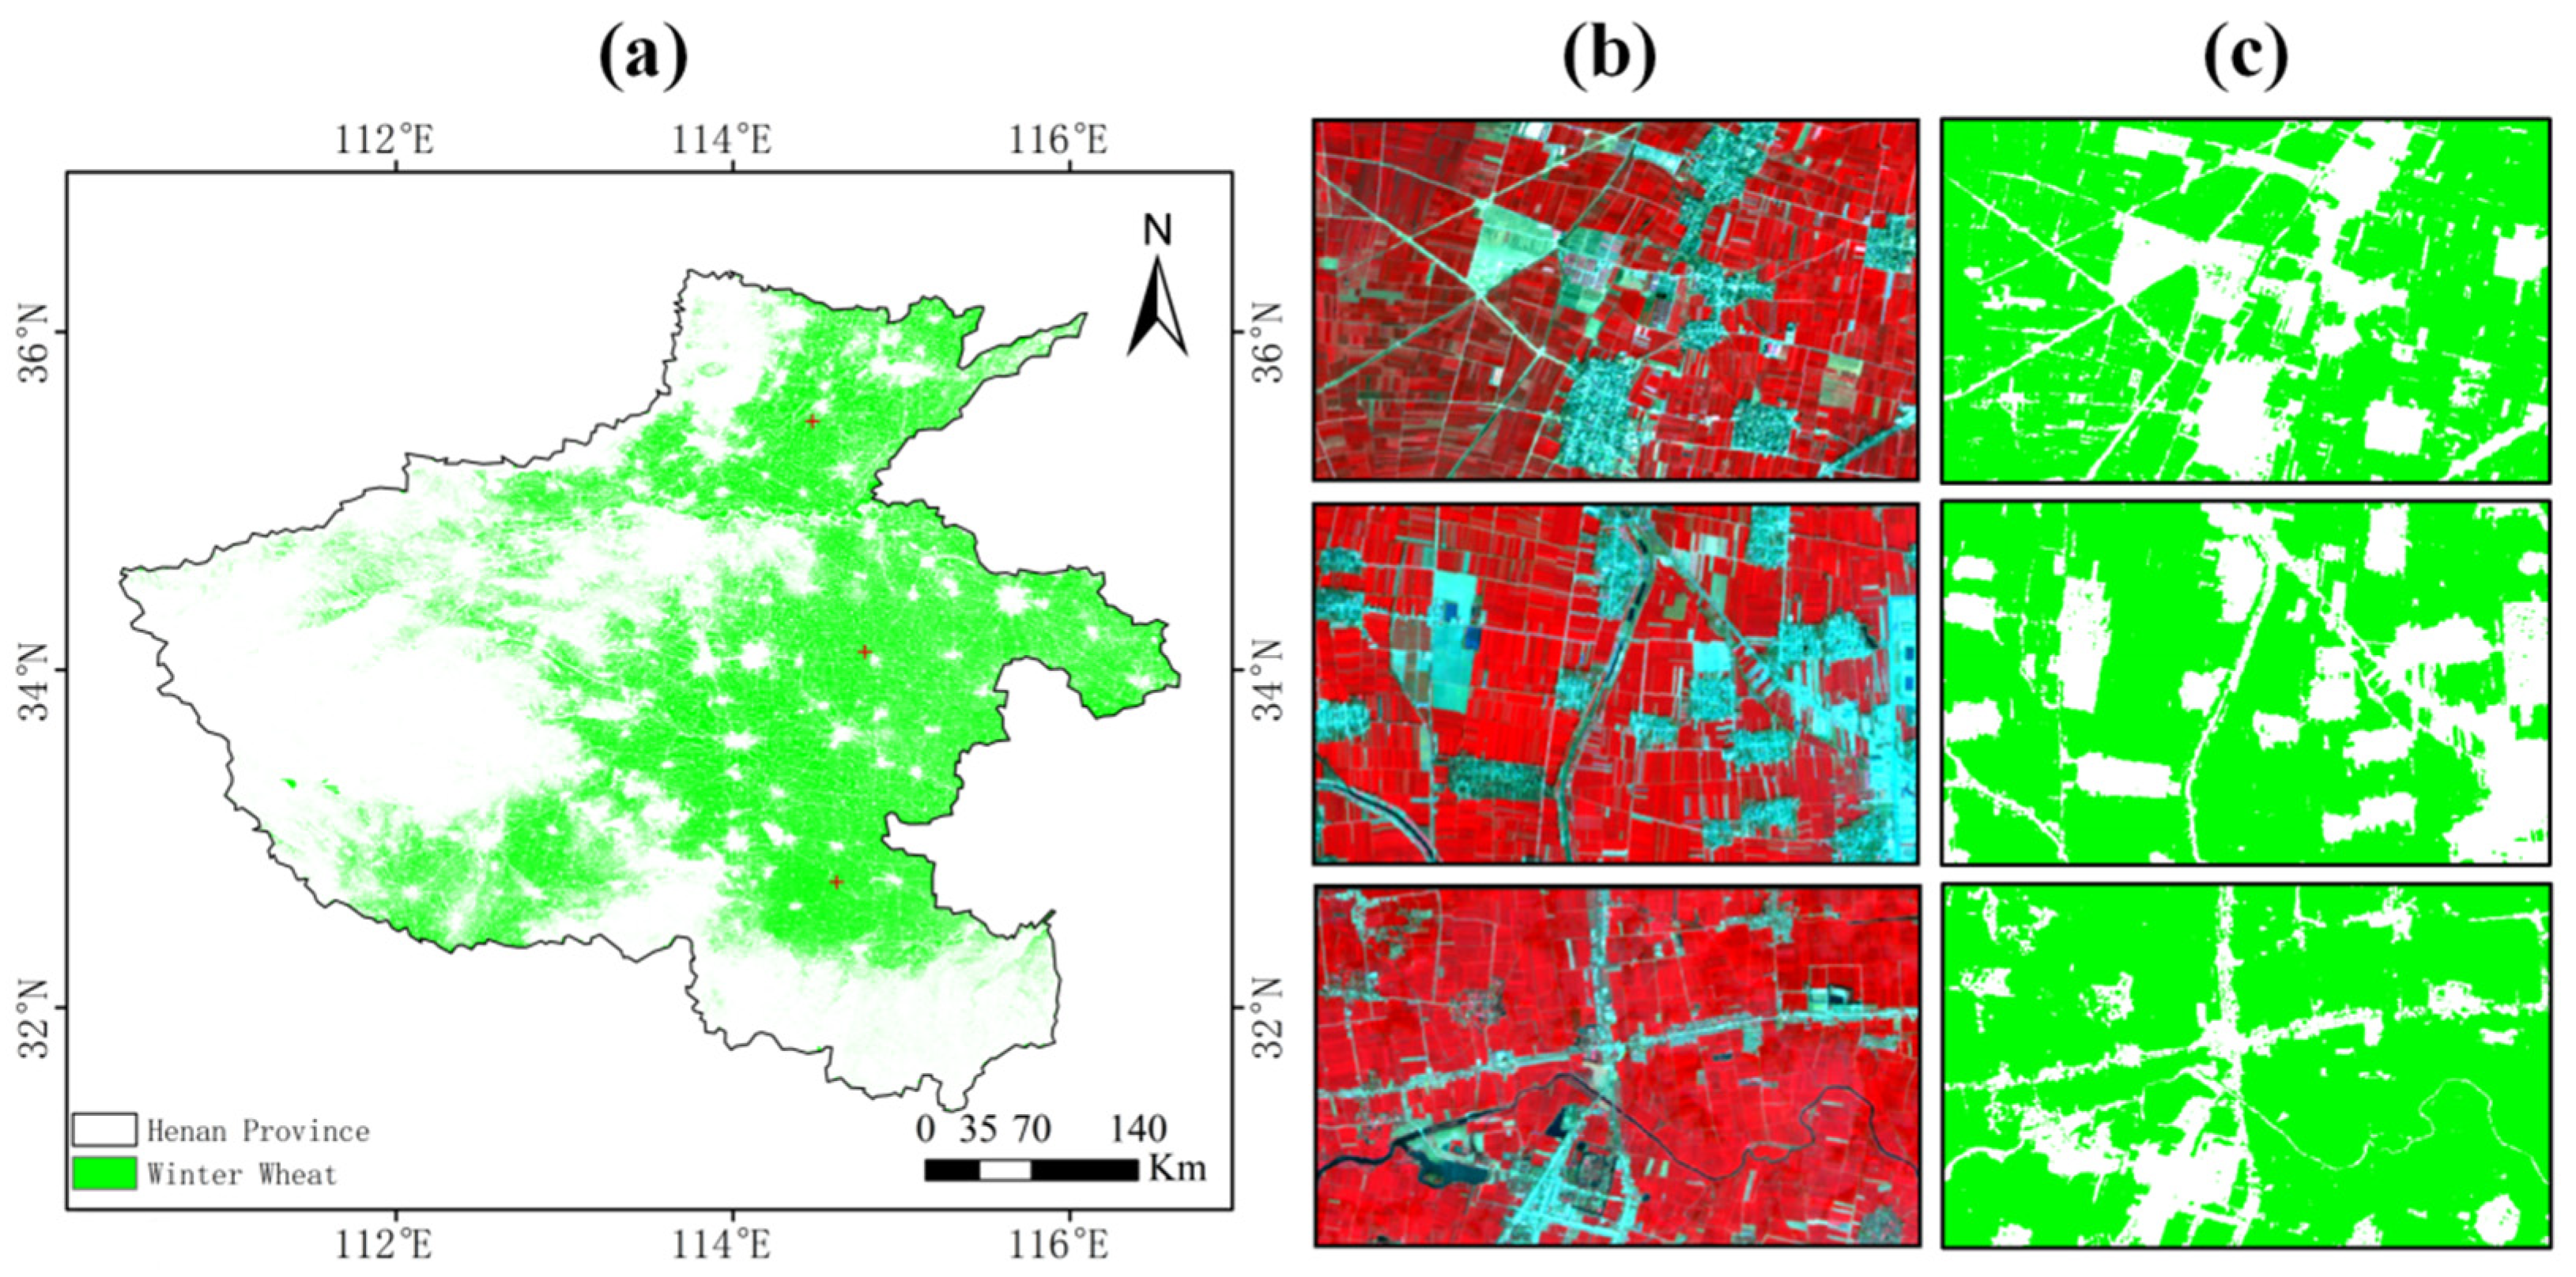
4.2. Mapping Results of Winter Wheat in Henan Province
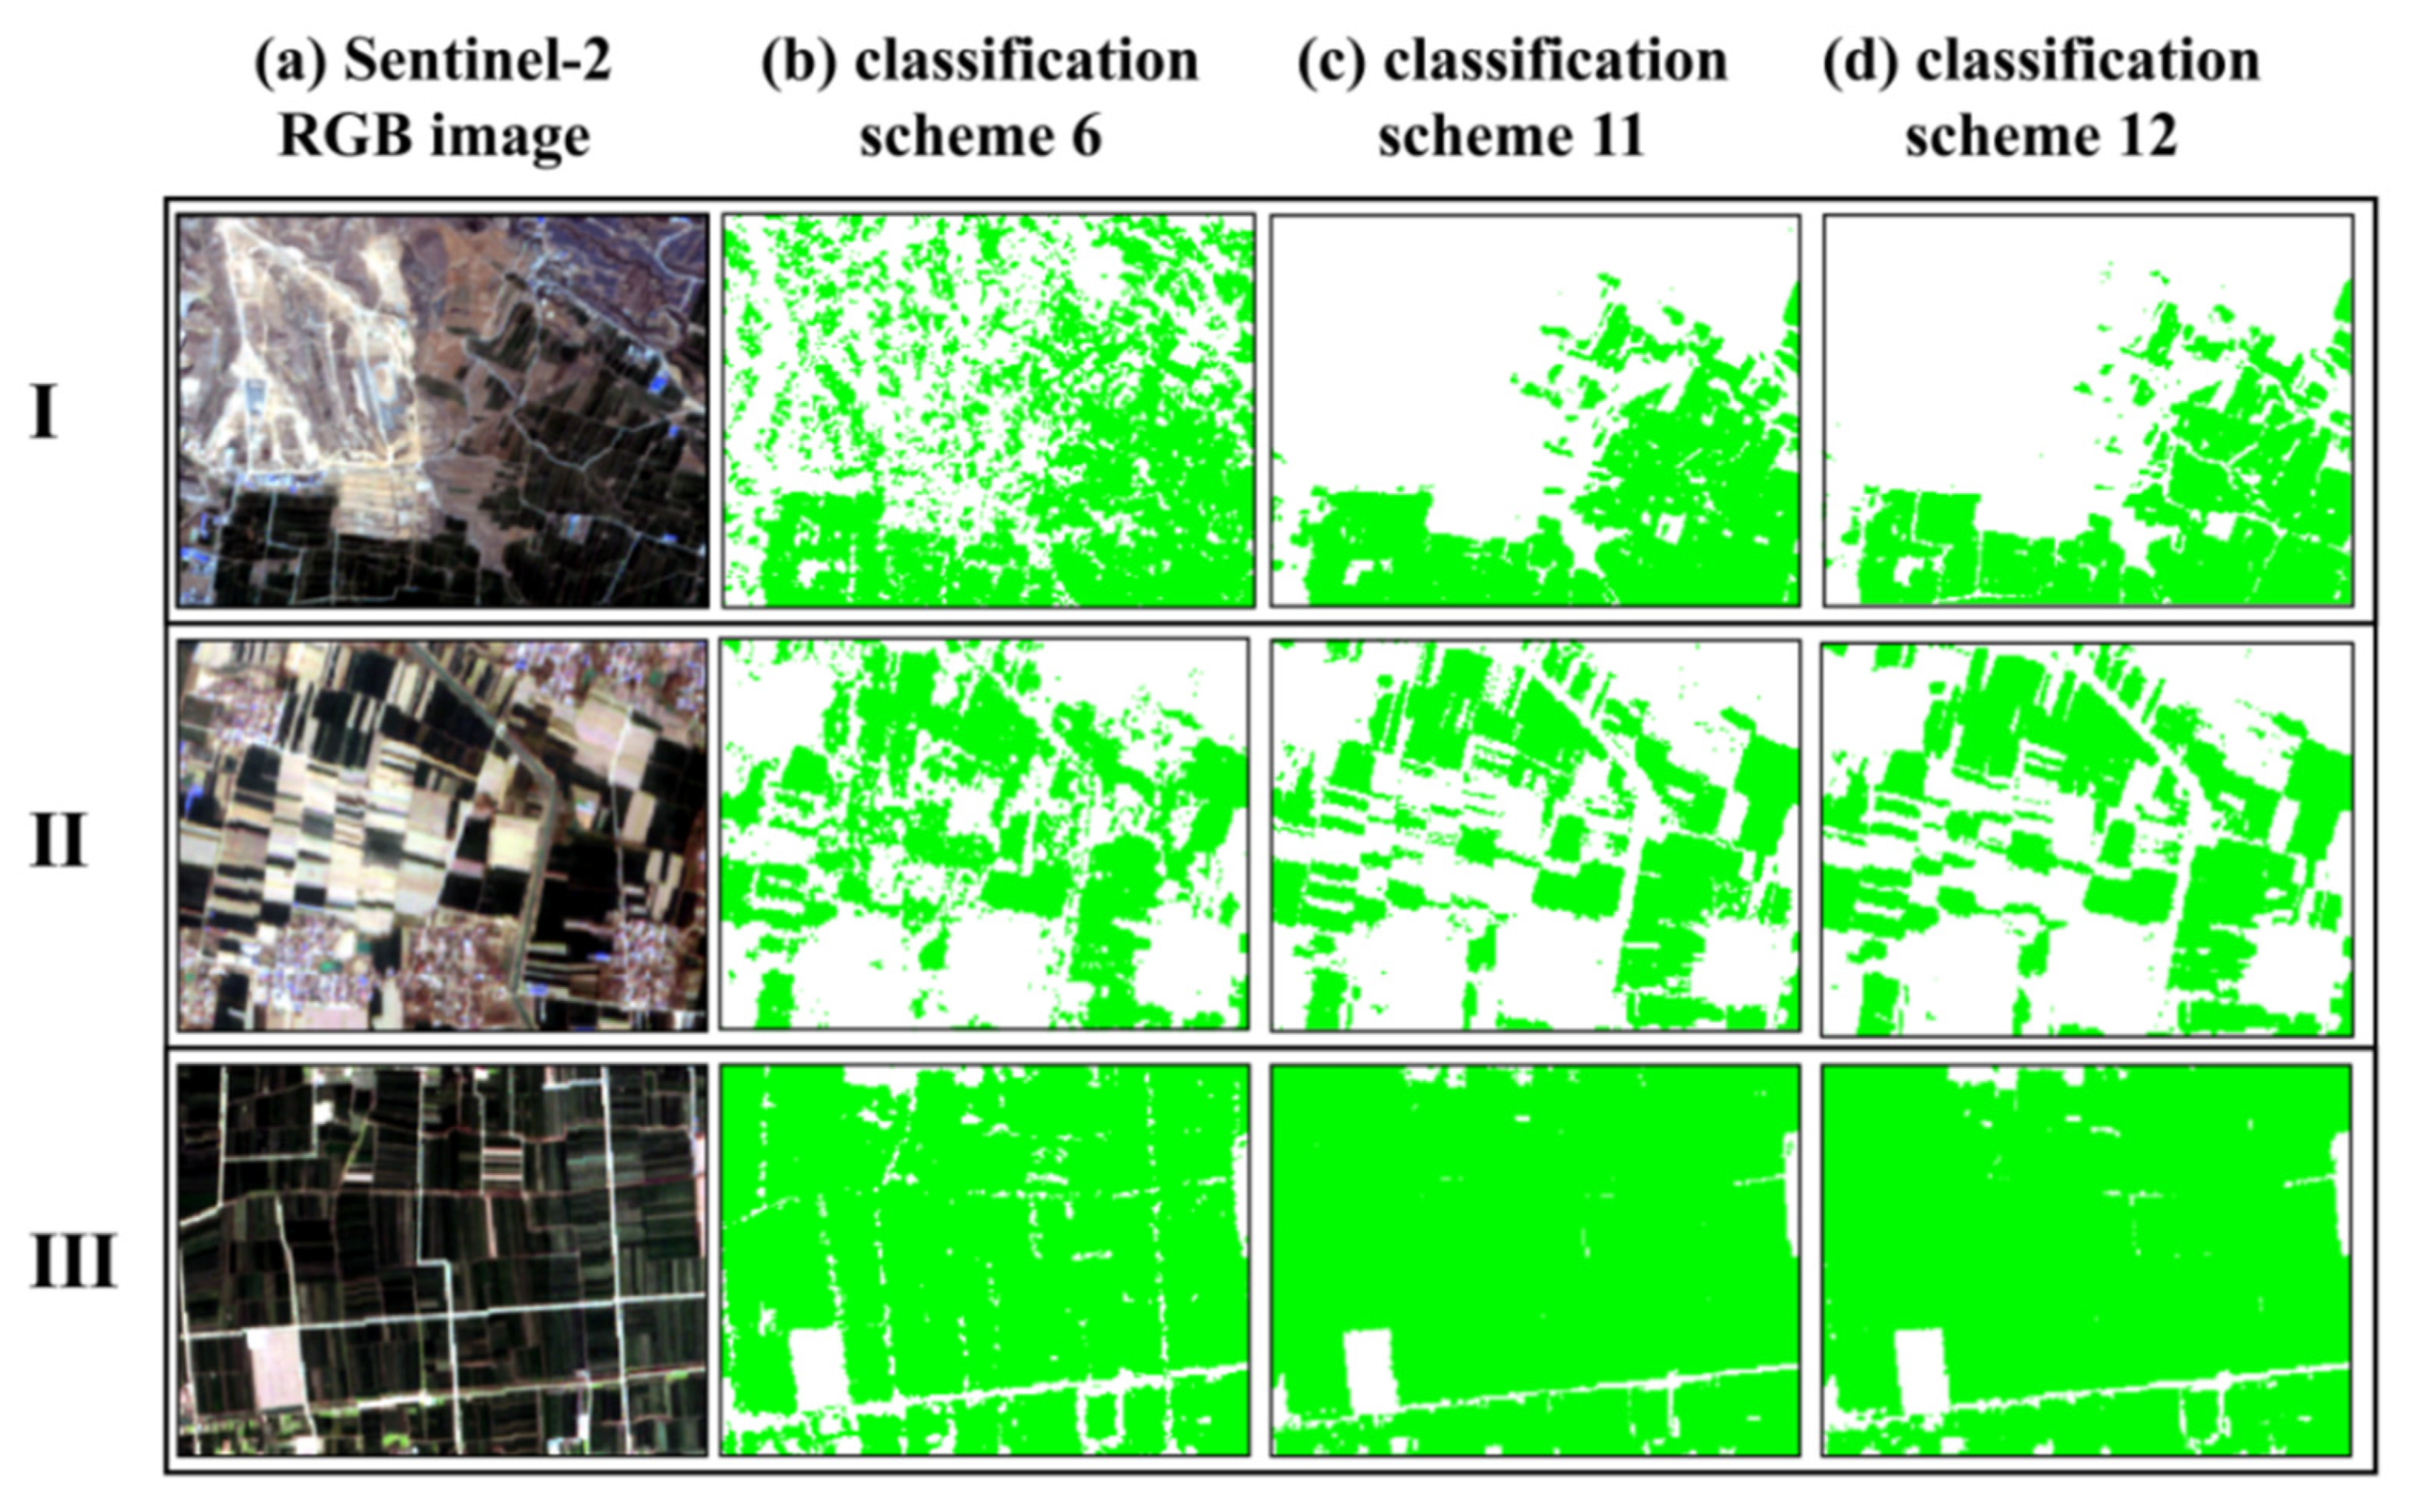
4.3. Comparison of Spatial Details and Quantitative Evaluation
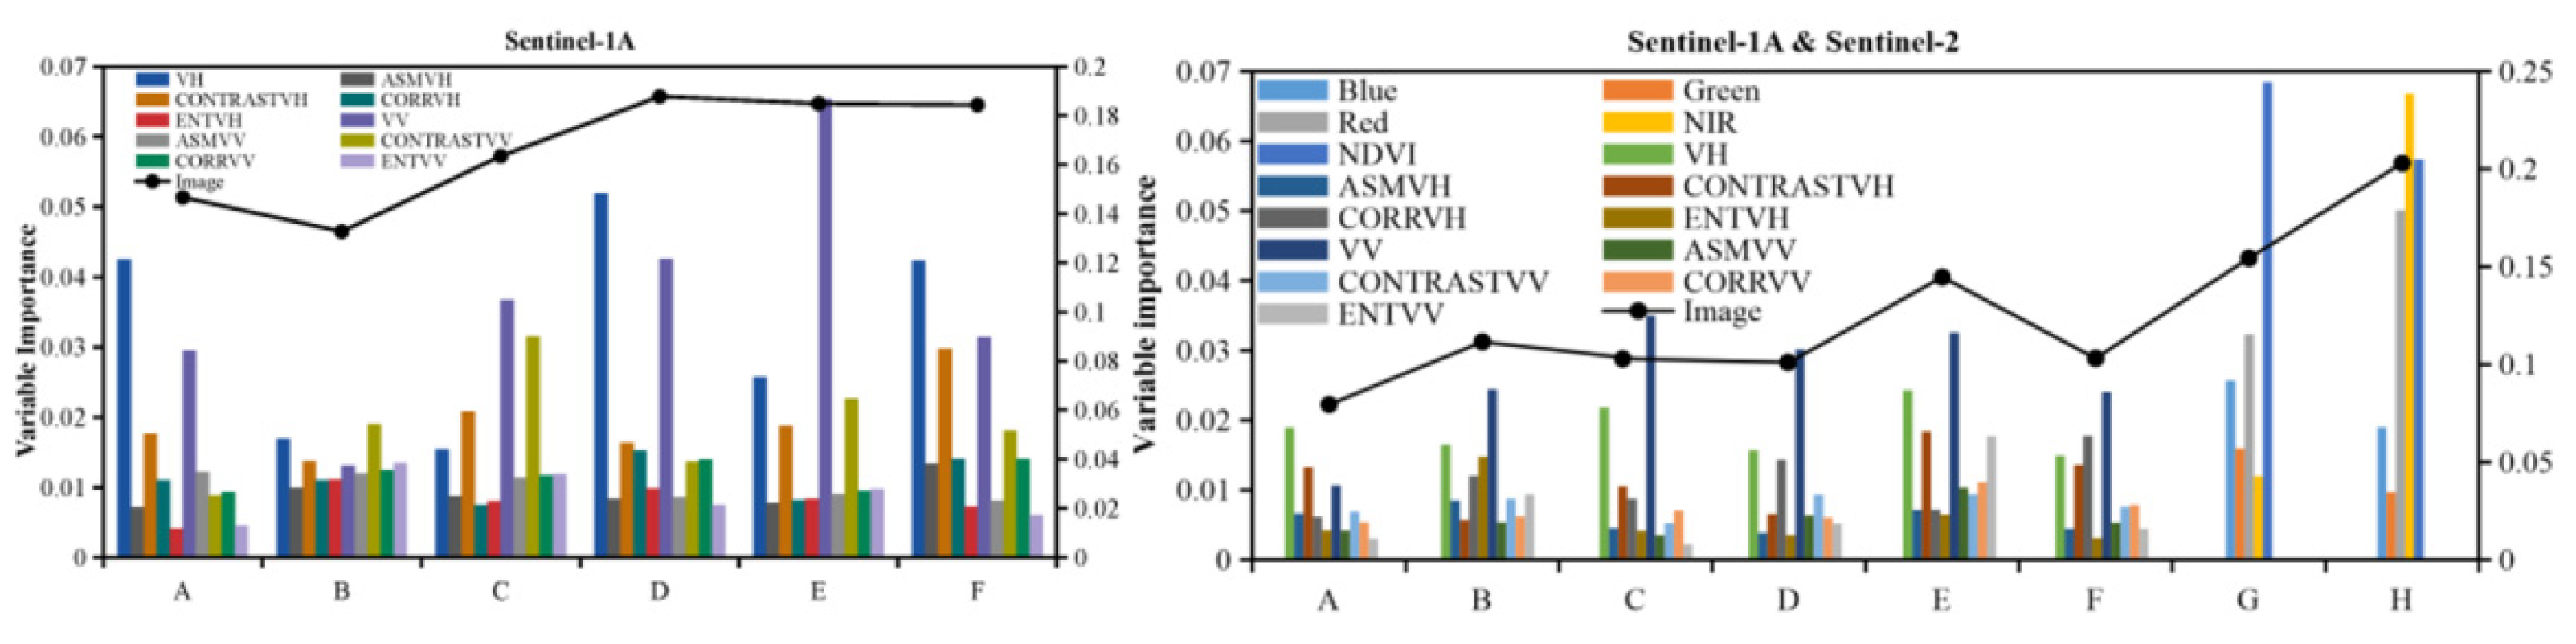
4.4. Feature Variables Importance
5. Discussion
5.1. Image Aggregation Method
5.2. Potential of Using SAR Images of the Full Growth Period to Extract Winter Wheat Acreage
5.3. Advantages of Image Integration for Extraction of Winter Wheat
5.4. Limitations and Prospects
6. Conclusions
Author Contributions
Funding
Institutional Review Board Statement
Informed Consent Statement
Data Availability Statement
Acknowledgments
Conflicts of Interest
References
- Dong, J.; Wu, W.; Huang, J.; You, N.; He, Y.; Yan, H. State of the Art and Perspective of Agricultural Land Use Remote Sensing Information Extraction. J. Geo-Inf. Sci. 2020, 22, 772–783. [Google Scholar]
- Zhou, T.; Pan, J.; Zhang, P.; Wei, S.; Han, T. Mapping Winter Wheat with Multi-Temporal SAR and Optical Images in an Urban Agricultural Region. Sensors 2017, 17, 1210. [Google Scholar] [CrossRef]
- Tiwari, V.; Matin, M.A.; Qamer, F.M.; Ellenburg, W.L.; Bajracharya, B.; Vadrevu, K.; Rushi, B.R.; Yusafi, W. Wheat Area Mapping in Afghanistan Based on Optical and SAR Time-series Images in Google Earth Engine Cloud Environment. Front. Environ. Sci. 2020, 8, 77. [Google Scholar] [CrossRef]
- Friedl, M.A.; Sulla-Menashe, D.; Tan, B.; Schneider, A.; Ramankutty, N.; Sibley, A.; Huang, X. MODIS Collection 5 Global Land Cover: Algorithm Refinements and Characterization of New Datasets. Reomote Sens. Environ. 2010, 114, 168–182. [Google Scholar] [CrossRef]
- Chen, J.; Chen, J.; Liao, A.; Cao, X.; Chen, L.; Chen, X.; He, C.; Han, G.; Peng, S.; Lu, M.; et al. Global Land Cover Mapping at 30 m Resolution: A POK-based Operational Approach. ISPRS J. Photogramm. 2015, 103, 7–27. [Google Scholar] [CrossRef] [Green Version]
- Yang, G.; Yu, W.; Yao, X.; Zheng, H.; Cao, Q.; Zhu, Y.; Cao, W.; Cheng, T. AGTOC: A Novel Approach to Winter Wheat Mapping by Automatic Generation of Training Samples and One-class Classification on Google Earth Engine. Int. J. App. Earth Obs. 2021, 102, 102446. [Google Scholar] [CrossRef]
- Tian, H.; Pei, J.; Huang, J.; Li, X.; Wang, J.; Zhou, B.; Qin, Y.; Wang, L. Garlic and Winter Wheat Identification Based on Active and Passive Satellite Imagery and the Google Earth Engine in Northern China. Remote Sens. 2020, 12, 3539. [Google Scholar] [CrossRef]
- He, Y.; Wang, C.; Chen, F.; Jia, H.; Liang, D.; Yang, A. Feature Comparison and Optimization for 30-M Winter Wheat Mapping Based on Landsat-8 and Sentinel-2 Data Using Random Forest Algorithm. Remote Sens. 2019, 11, 535. [Google Scholar] [CrossRef] [Green Version]
- Dong, J.; Fu, Y.; Wang, J.; Tian, H.; Fu, S.; Niu, Z.; Han, W.; Zheng, Y.; Huang, J.; Yuan, W. Early-season Mapping of Winter Wheat in China Based on Landsat and Sentinel Images. Earth Syst. Sci. Data 2020, 12, 3081–3095. [Google Scholar] [CrossRef]
- Zhang, R.; Wang, S.; Gao, W.; Sun, W.; Wang, J.; Niu, L. Remote-sensing Classification Method of County-level Agricultural Crops Using Time-series NDV. Trans. Chin. Soc. Agric. 2015, 46, 246–252. [Google Scholar]
- Wu, J.; Lv, Y.; Li, C.; Li, Q. Fine Classification of County Crops Based on Multi-temporal Images of Sentinel-2A. Trans. Chin. Soc. Agric. Mach. 2019, 50, 194–200. [Google Scholar]
- Meng, S.; Zhong, Y.; Luo, C.; Hu, X.; Wang, X.; Huang, S. Optimal Temporal Window Selection for Winter Wheat and Rapeseed Mapping with Sentinel-2 Images: A Case Study of Zhongxiang in China. Remote Sens. 2020, 12, 226. [Google Scholar] [CrossRef] [Green Version]
- Gorelick, N.; Hancher, M.; Dixon, M.; Ilyushchenko, S.; Thau, D.; Moore, R. Google Earth Engine: Planetary-scale Geospatial Analysis for Everyone. Remote Sens. Environ. 2017, 202, 18–27. [Google Scholar] [CrossRef]
- Hansen, M.C.; Potapov, P.V.; Moore, R.; Hancher, M. High-Resolution Global Maps of 21st-century Forest Cover Change. Science 2013, 342, 850–853. [Google Scholar] [CrossRef] [Green Version]
- Sun, J.; Di, L.; Sun, Z.; Shen, Y.; Lai, Z. County-Level Soybean Yield Prediction Using Deep CNN-LSTM Model. Sensors 2019, 19, 4363. [Google Scholar] [CrossRef] [PubMed] [Green Version]
- Zhang, W.; Brandt, M.; Prishchepov, A.V.; Li, Z.; Lyu, C.; Fensholt, R. Mapping the Dynamics of Winter Wheat in the North China Plain from Dense Landsat Time Series (1999 to 2019). Remote Sens. 2021, 13, 1170. [Google Scholar] [CrossRef]
- Xu, F.; Li, Z.; Zhang, S.; Huang, N.; Quan, Z.; Zhang, W.; Liu, X.; Jiang, X.; Pan, J.; Prishchepov, A.V. Mapping Winter Wheat with Combinations of Temporally Aggregated Sentinel-2 and Landsat-8 Data in Shandong Province, China. Remote Sens. 2020, 12, 2065. [Google Scholar] [CrossRef]
- Pan, L.; Xia, H.; Zhao, X.; Guo, Y.; Qin, Y. Mapping Winter Crops Using a Phenology Algorithm, Time-Series Sentinel-2 and Landsat-7/8 Images, and Google Earth Engine. Remote Sens. 2021, 13, 2510. [Google Scholar] [CrossRef]
- Pan, L.; Xia, H.; Yang, J.; Niu, W.; Wang, R.; Song, H.; Guo, Y.; Qin, Y. Mapping cropping intensity in Huaihe basin using phenology algorithm, all Sentinel-2 and Landsat images in Google Earth Engine. Int. J. Appl. Earth Obs. Geoinf. 2021, 102, 102376. [Google Scholar] [CrossRef]
- Misra, G.; Cawkwell, F.; Wingler, A. Status of Phenological Research Using Sentinel-2 Data: A Review. Remote Sens. 2020, 12, 2760. [Google Scholar] [CrossRef]
- Jingjian, L.; Hongzhong, L.; Cui, H.; Yuman, S.; Jinsong, C.; Yu, H. Extraction of Early Paddy Rice Area in Lingao County Based on Sentinel-1A Data. Remote Sens. Land Resour. 2020, 32, 191–199. [Google Scholar]
- Khabbazan, S.; Vermunt, P.; Steele-Dunne, S.; Ratering Arntz, L.; Marinetti, C.; van der Valk, D.; Iannini, L.; Molijn, R.; Westerdijk, K.; van der Sande, C. Crop Monitoring Using Sentinel-1 Data: A Case Study from The Netherlands. Remote Sens. 2019, 11, 1887. [Google Scholar] [CrossRef] [Green Version]
- Sun, C.; Bian, Y.; Zhou, T.; Pan, J. Using of Multi-Source and Multi-Temporal Remote Sensing Data Improves Crop-Type Mapping in the Subtropical Agriculture Region. Sensors 2019, 19, 2401. [Google Scholar] [CrossRef] [Green Version]
- Guo, J.; Zhu, L.; Jin, B. Crop Classification Based on Data Fusion of Sentinel-1 and Sentinel-2. Trans. Chin. Soc. Agric. Mach. 2018, 49, 192–198. [Google Scholar]
- Cai, Y.; Lin, H.; Zhang, M. Mapping Paddy Rice by the Object-based Random Forest Method Using Time Series Sentinel-1/Sentinel-2 Data. Adv. Space Res. 2019, 64, 2233–2244. [Google Scholar] [CrossRef]
- Van Tricht, K.; Gobin, A.; Gilliams, S.; Piccard, I. Synergistic Use of Radar Sentinel-1 and Optical Sentinel-2 Imagery for Crop Mapping: A Case Study for Belgium. Remote Sens. 2018, 10, 1642. [Google Scholar] [CrossRef] [Green Version]
- Zhou, T.; Pan, J.; Han, T.; Wei, S. Planting Area Extraction of Winter Wheat Based on Multi-temporal SAR Data and Optical Imagery. Trans. Chin. Soc. Agric. Eng. 2017, 33, 215–221. [Google Scholar]
- Fang, P.; Zhang, X.; Wei, P.; Wang, Y.; Zhang, H.; Liu, F.; Zhao, J. The Classification Performance and Mechanism of Machine Learning Algorithms in Winter Wheat Mapping Using Sentinel-2 10 m Resolution Imagery. Appl. Sci. 2020, 10, 5075. [Google Scholar] [CrossRef]
- Wang, J.; Tian, H.; Wu, M.; Wang, L.; Wang, C. Rapid Mapping of Winter Wheat in Henan Province. J. Geo-Inf. Sci. 2017, 19, 846–853. [Google Scholar]
- Mullissa, A.; Vollrath, A.; Odongo-Braun, C.; Slagter, B.; Balling, J.; Gou, Y.; Gorelick, N.; Reiche, J. Sentinel-1 SAR Backscatter Analysis Ready Data Preparation in Google Earth Engine. Remote Sens. 2021, 13, 1954. [Google Scholar] [CrossRef]
- Muthukumarasamy, I.; Shanmugam, R.S.; Usha, T. Incorporation of Textural Information with SAR and Optical Imagery for Improved Land Cover Mapping. Environ. Earth Sci. 2019, 78, 643. [Google Scholar] [CrossRef]
- Liu, J.; Kuang, W.; Zhang, Z.; Xu, X.; Qin, Y.; Ning, J.; Zhou, W.; Zhang, S.; Li, R.; Yan, C.; et al. Spatiotemporal Characteristics, Patterns, and Causes of Land-use Changes in China Since the Late 1980s. J. Geogr. Sci. 2014, 24, 195–210. [Google Scholar] [CrossRef]
- Liu, X.; Zhai, H.; Shen, Y.; Lou, B.; Jiang, C.; Li, T.; Hussain, S.B.; Shen, G. Large-scale Crop Mapping from Multisource Remote Sensing Images in Google Earth Engine. IEEE J. Sel. Top. Appl. Earth Obs. Remote Sens. 2020, 13, 414–427. [Google Scholar] [CrossRef]
- Wagle, N.; Acharya, T.D.; Kolluru, V.; Huang, H.; Lee, D.H. Multi-Temporal Land Cover Change Mapping Using Google Earth Engine and Ensemble Learning Methods. Appl. Sci. 2020, 10, 8083. [Google Scholar] [CrossRef]
- Felegari, S.; Sharifi, A.; Moravej, K.; Amin, M.; Golchin, A.; Muzirafuti, A.; Tariq, A.; Zhao, N. Integration of Sentinel 1 and Sentinel 2 Satellite Images for Crop Mapping. Appl. Sci. 2021, 11, 10104. [Google Scholar] [CrossRef]
- Qiu, B.; Luo, Y.; Tang, Z.; Chen, C.; Lu, D.; Huang, H.; Chen, Y.; Chen, N.; Xu, W. Winter Wheat Mapping Combining Variations Before and After Estimated Heading Dates. ISPRS J. Photogramm. 2017, 123, 35–46. [Google Scholar] [CrossRef]
- Aguilar, R.; Zurita-Milla, R.; Izquierdo-Verdiguier, E.; de By, R.A. A Cloud-Based Multi-Temporal Ensemble Classifier to Map Smallholder Farming Systems. Remote Sens. 2018, 10, 729. [Google Scholar] [CrossRef] [Green Version]
- Chong, L.; Liu, H.; Lu, L.; Liu, Z.; Kong, F.; Zhang, X. Monthly Composites from Sentinel-1 and Sentinel-2 Images for Regional Major Crop Mapping with Google Earth Engine. J. Integr. Agric. 2021, 20, 1944–1957. [Google Scholar]
- Ghasemi, M.; Karimzadeh, S.; Feizizadeh, B. Urban Classification Using Preserved Information of High Dimensional Textural Features of Sentinel-1 Images in Tabriz. Iran. Earth Sci. Inform. 2021, 14, 1745–1762. [Google Scholar] [CrossRef]
- Tassi, A.; Vizzari, M. Object-Oriented LULC Classification in Google Earth Engine Combining SNIC, GLCM, and Machine Learning Algorithms. Remote Sens. 2020, 12, 3776. [Google Scholar] [CrossRef]
- Yang, H.; Wang, Z.; Bai, J.; Han, H. Winter Wheat Area Extraction Based on Multi-feature Extraction and Feature Selectio. J. Shaanxi Norm. Uni. (Nat. Sci.) 2020, 48, 40–49. [Google Scholar]
- Ma, Z.; Liu, C.; Xue, H.; Li, J.; Fang, X.; Zhou, J. Identification of Winter Wheat by Integrating Active and Passive Remote Sensing Data Based on Google Earth Engine Platform. Trans. Chin. Soc. Agric. Mach. 2021, 52, 195–205. [Google Scholar]
- Wang, J.; Li, K.; Shao, Y.; Zhang, F.; Wang, Z.; Guo, X.; Qin, Y.; Liu, X. Analysis of Combining SAR and Optical Optimal Parameters to Classify Typhoon-Invasion Lodged Rice: A Case Study Using the Random Forest Method. Sensors 2020, 20, 7346. [Google Scholar] [CrossRef] [PubMed]
- Sonobe, R.; Yamaya, Y.; Tani, H.; Wang, X.; Kobayashi, N.; Mochizuki, K.I. Assessing the Suitability of Data from Sentinel-1A and 2A for Crop Classification. GISci. Remote Sens. 2017, 54, 918–938. [Google Scholar] [CrossRef]
- Rei, S.; Nobuyuki, K.; Xiufeng, W.; Hiroshi, T.; Yuki, Y.; Kan-ichiro, M. Crop Classification from Sentinel-2-derived Vegetation Indices using Ensemble Learning. J. Appl. Remote Sens. 2018, 12, 026019. [Google Scholar]
- Dong, Q.; Chen, X.; Chen, J.; Zhang, C.; Liu, L.; Cao, X.; Zang, Y.; Zhu, X.; Cui, X. Mapping Winter Wheat in North China Using Sentinel 2A/B Data: A Method Based on Phenology-Time Weighted Dynamic Time Warping. Remote Sens. 2020, 12, 1274. [Google Scholar] [CrossRef] [Green Version]
- Song, Y.; Wang, J. Mapping Winter Wheat Planting Area and Monitoring Its Phenology Using Sentinel-1 Backscatter Time Series. Remote Sens. 2019, 11, 449. [Google Scholar] [CrossRef] [Green Version]
- Nasrallah, A.; Baghdadi, N.; El Hajj, M.; Darwish, T.; Belhouchette, H.; Faour, G.; Darwich, S.; Mhawej, M. Sentinel-1 Data for Winter Wheat Phenology Monitoring and Mapping. Remote Sens. 2019, 11, 2228. [Google Scholar] [CrossRef] [Green Version]
- Tian, H.; Qin, Y.; Niu, Z.; Wang, L.; Ge, S. Summer Maize Mapping by Compositing Time Series Sentinel-1A Imagery Based on Crop Growth Cycles. J. Indian Soc. Remote Sens. 2021, 49, 2863–2874. [Google Scholar] [CrossRef]
- Xu, L.; Zhang, H.; Wang, C.; Zhang, B.; Liu, M. Crop Classification Based on Temporal Information Using Sentinel-1 SAR Time-Series Data. Remote Sens. 2019, 11, 53. [Google Scholar] [CrossRef] [Green Version]
- Kong, Q.; Li, L.; Xu, K.; Zhu, D. Monitoring Crop Residue Area in Northeast of China Based on Sentinel-1A Data. Trans. Chin. Soc. Agric. Mach. 2017, 48, 284–289. [Google Scholar]
- Gulnur, I.; Mamat, S.; Ma, C. Extraction of Crop Acreage Based on Multi-temporal and Dual-polarization SAR Data. Acta Agron. Sin. 2020, 46, 1099–1111. [Google Scholar]
- Jiang, H.; Li, D.; Jing, W.; Xu, J.; Huang, J.; Yang, J.; Chen, S. Early Season Mapping of Sugarcane by Applying Machine Learning Algorithms to Sentinel-1A/2 Time Series Data: A Case Study in Zhanjiang City, China. Remote Sens. 2019, 11, 861. [Google Scholar] [CrossRef] [Green Version]
- Carrasco, L.; O’Neil, A.W.; Morton, R.D.; Rowland, C.S. Evaluating Combinations of Temporally Aggregated Sentinel-1, Sentinel-2 and Landsat 8 for Land Cover Mapping with Google Earth Engine. Remote Sens. 2019, 11, 288. [Google Scholar] [CrossRef] [Green Version]
- Chen, S.; Useya, J.; Mugiyo, H. Decision-level Fusion of Sentinel-1 SAR and Landsat 8 OLI Texture Features for Crop Discrimination and Classification: Case of Masvingo, Zimbabwe. Heliyon 2020, 6, e05358. [Google Scholar] [CrossRef] [PubMed]
- Zeng, H.; Wu, B.; Wang, S.; Musakwa, W.; Tian, F.; Mashimbye, Z.E.; Poona, N.; Syndey, M. A Synthesizing Land-cover Classification Method Based on Google Earth Engine: A Case Study in Nzhelele and Levhuvu Catchments, South Africa. Chin. Geogr. Sci. 2020, 30, 397–409. [Google Scholar] [CrossRef]
- De Alban, J.D.T.; Connette, G.M.; Oswald, P.; Webb, E.L. Combined Landsat and L-Band SAR Data Improves Land Cover Classification and Change Detection in Dynamic Tropical Landscapes. Remote Sens. 2018, 10, 306. [Google Scholar] [CrossRef] [Green Version]
- You, N.; Dong, J. Examining Earliest Identifiable Timing of Crops Using All Available Sentinel 1/2 Imagery and Google Earth Engine. ISPRS J. Photogramm. 2020, 161, 109–123. [Google Scholar] [CrossRef]
- Lin, J.; Jin, X.; Ren, J.; Liu, J.; Liang, X.; Zhou, Y. Rapid Mapping of Large-Scale Greenhouse Based on Integrated Learning Algorithm and Google Earth Engine. Remote Sens. 2021, 13, 1245. [Google Scholar] [CrossRef]


| Sensor | Band | Wavelength | Resolution | |
|---|---|---|---|---|
| Sentinel data | Sentinel-1A GRD | VV | 10 m | |
| VH | 10 m | |||
| Sentinel-2 MSI | Blue | 490 nm | 10 m | |
| Green | 560 nm | 10 m | ||
| Red | 665 nm | 10 m | ||
| Near-infrared | 842 nm | 10 m |
| Land-Cover Types | Description | Samples |
|---|---|---|
| Winter wheat | Winter wheat during the observation period | 910 |
| Vegetation | Other crops, evergreen forest, deciduous forest, etc. | 900 |
| Water | Rivers, reservoirs, and lakes, etc. | 210 |
| Building | Residential land, roads, etc. | 480 |
| Other | Wasteland, unused land, etc. | 290 |
| Data | Crop Development Period | Image Acquisition Dates | Number of Images |
|---|---|---|---|
| Sentinel-1A | Sowing | 1 October–31 October | 32 |
| Seedling and tillering | 1 November–31 November | 40 | |
| tillering and over-wintering | 1 December–31 January | 80 | |
| over-wintering and reviving | 1 February–31 March | 77 | |
| jointing and heading | 1 April–30 April | 40 | |
| flowering and maturing | 1 May–15 June | 58 | |
| Sentinel-2 | before-wintering | 1 October–30 November | 335 |
| after-wintering | 1 February–20 April | 248 |
| Land-Cover Types | Classification Results | |||||||
|---|---|---|---|---|---|---|---|---|
| Winter Wheat | Vegetation | Buildings | Water | Others | Sum | MA | F1 | |
| Winter wheat | 246 | 10 | 2 | 0 | 1 | 259 | 95.0% | 0.941 |
| Vegetation | 18 | 224 | 1 | 1 | 3 | 248 | 90.7% | 0.905 |
| Buildings | 0 | 5 | 132 | 1 | 3 | 141 | 93.6% | 0.939 |
| Water | 0 | 2 | 0 | 65 | 0 | 67 | 97.0% | 0.970 |
| Others | 0 | 7 | 5 | 0 | 79 | 91 | 86.8% | 0.893 |
| Sum | 264 | 248 | 140 | 67 | 86 | OA = 92.7% | Kappa = 0.902 | |
| UA | 93.2% | 90.3% | 94.3% | 97.0% | 91.9% | |||
Publisher’s Note: MDPI stays neutral with regard to jurisdictional claims in published maps and institutional affiliations. |
© 2022 by the authors. Licensee MDPI, Basel, Switzerland. This article is an open access article distributed under the terms and conditions of the Creative Commons Attribution (CC BY) license (https://creativecommons.org/licenses/by/4.0/).
Share and Cite
Li, C.; Chen, W.; Wang, Y.; Wang, Y.; Ma, C.; Li, Y.; Li, J.; Zhai, W. Mapping Winter Wheat with Optical and SAR Images Based on Google Earth Engine in Henan Province, China. Remote Sens. 2022, 14, 284. https://doi.org/10.3390/rs14020284
Li C, Chen W, Wang Y, Wang Y, Ma C, Li Y, Li J, Zhai W. Mapping Winter Wheat with Optical and SAR Images Based on Google Earth Engine in Henan Province, China. Remote Sensing. 2022; 14(2):284. https://doi.org/10.3390/rs14020284
Chicago/Turabian StyleLi, Changchun, Weinan Chen, Yilin Wang, Yu Wang, Chunyan Ma, Yacong Li, Jingbo Li, and Weiguang Zhai. 2022. "Mapping Winter Wheat with Optical and SAR Images Based on Google Earth Engine in Henan Province, China" Remote Sensing 14, no. 2: 284. https://doi.org/10.3390/rs14020284
APA StyleLi, C., Chen, W., Wang, Y., Wang, Y., Ma, C., Li, Y., Li, J., & Zhai, W. (2022). Mapping Winter Wheat with Optical and SAR Images Based on Google Earth Engine in Henan Province, China. Remote Sensing, 14(2), 284. https://doi.org/10.3390/rs14020284