Article

DSNUNet: An Improved Forest Change Detection Network by Combining Sentinel-1 and Sentinel-2 Images

1
Key Laboratory of State Forestry and Grassland Administration on Forest Resources Management and Monitoring in Southern Area, Changsha 410004, China
2
College of Forestry, Central South University of Forestry and Technology, Hunan Academy of Forestry, Changsha 410004, China
3
Central South Forest Inventory and Planning Institute of State Forestry Administration, Changsha 410004, China
4
Forestry Research Institute of Guangxi Zhuang Autonomous Region, Nanning 530002, China
*
Author to whom correspondence should be addressed.
Remote Sens. 2022, 14(19), 5046; https://doi.org/10.3390/rs14195046
Submission received: 22 August 2022 / Revised: 23 September 2022 / Accepted: 30 September 2022 / Published: 10 October 2022
(This article belongs to the Special Issue Remote Sensing and Smart Forestry)

Abstract

:
The use of remote sensing images to detect forest changes is of great significance for forest resource management. With the development and implementation of deep learning algorithms in change detection, a large number of models have been designed to detect changes in multi-phase remote sensing images. Although synthetic aperture radar (SAR) data have strong potential for application in forest change detection tasks, most existing deep learning-based models have been designed for optical imagery. Therefore, to effectively combine optical and SAR data in forest change detection, this paper proposes a double Siamese branch-based change detection network called DSNUNet. DSNUNet uses two sets of feature branches to extract features from dual-phase optical and SAR images and employs shared weights to combine features into groups. In the proposed DSNUNet, different feature extraction branch widths were used to compensate for a difference in the amount of information between optical and SAR images. The proposed DSNUNet was validated by experiments on the manually annotated forest change detection dataset. According to the obtained results, the proposed method outperformed other change detection methods, achieving an F1-score of 76.40%. In addition, different combinations of width between feature extraction branches were analyzed in this study. The results revealed an optimal performance of the model at initial channel numbers of the optical imaging branch and SAR image branch of 32 and 8, respectively. The prediction results demonstrated the effectiveness of the proposed method in accurately predicting forest changes and suppressing cloud interferences to some extent.

Graphical Abstract

1. Introduction

Change detection is an important task in the remote sensing field, which aims to reveal surface changes in multi-temporal remote sensing data [1]. Forests are important natural resources that play a major role in maintaining the Earth’s ecological environment. As a sub-task of change detection, forest change detection has been widely used in land and resource inventory, deforestation control, and forest management.
Early forest change detection was generally performed using optical images, which have obvious color characteristics, with certain color bands being sensitive to specific changes [2,3]. Currently, optical images are the main data source in the change detection field [4]. However, the quality of optical images is strongly affected by clouds and fog. Moreover, the temporal difference in multi-phase images captured by a sensor may show spectral changes for the same objects [5]. With the development of synthetic aperture radar (SAR) technology, numerous studies have been carried out on SAR image-based forest change detection in recent years [6].
Traditional forest change detection algorithms mainly include algebraic algorithms (e.g., vegetation index difference [7] and change vector analysis [8]), data transformation methods (e.g., principal component analysis [7] and canonical correlation analysis [9]), and classification-based methods [10]. However, to eliminate the differences in sensor data as much as possible, it is necessary to first perform geometric and radiometric corrections of multi-phase images and then construct the change map using algebraic operations or transformations on the multi-phase images. Regardless, the traditional algorithms only use the initial features of an image and usually have low accuracy in forest change detection.
With the rapid development of deep learning algorithms and computer vision in recent years, deep learning algorithms have been used in image classification [11], target detection [12], and semantic segmentation [13], demonstrating excellent performance. Change detection is a special semantic segmentation task that adopts an encoder-decoder structure of semantic segmentation models in the model design. In recent years, a large number of deep learning-based change detection algorithms have been proposed. These algorithms significantly outperform traditional algorithms, and is thus a favored approach in the field of change detection. Accurately extracting change detection has become the focus of several studies, since change detection models are typically based on multiple image inputs. By considering the mainstream multi-temporal change detection algorithms, the deep learning-based algorithms used in change detection can be roughly divided into two main categories regarding the feature extraction stage. The first category performs early fusion (EF), combining bitemporal images as one model input and transforming the change detection task into a semantic segmentation task. The second category adopts Siamese networks, which use two identical separate encoders to extract features from bitemporal images, and then the extracted features of the two Siamese branches are combined in the feature maps at the same scale. The change detection models using Siamese networks were first proposed in 2018 and have been commonly used to design change detection models [14].
Recent research has demonstrated that Siamese neural network-based change detection models are effective at identifying differences between multiple images. These models have, therefore, significantly improved in recent years. F. Rahman et al. designed a Siamese network model based on two VGG16 encoders with shared weights and obtained high change detection accuracy [15]. Y. Zhan et al. used the weighted contrastive loss to train a Siamese network, where variation features were extracted directly from input image pairs, resulting in an improved F1-score [16]. H. Chen et al. designed a self-attention mechanism to capture spatiotemporal correlations at different feature scales and employed it to improve the F1-score [17]. In addition, J. Chen et al. designed a dual attentive fully-convolutional Siamese network (DASNet) based on a dual attention mechanism to reduce noise in change detection results. DASNet performed well in capturing long-range dependencies, showing few noises in changes and high F1-scores [18]. S. Fang et al. designed SNUNet based on the nested U-Net using a deep supervision method, employed a Siamese network structure to extract accurate change graphs, and proposed an integrated channel attention module at the end of the decoder for multi-scale information aggregation. SNUNet achieved state-of-the-art results on the CDD public dataset [19]. With the success of the transformer model in computer vision tasks, this model has also been introduced to the change detection field to improve detection accuracy. The state-of-the-art results were obtained on a public change detection dataset [20].
Many of the advanced methods are based on the Siamese neural network. However, most of the advanced methods use high- or ultra-high-resolution remote sensing images as data sources, which are expensive and unsuitable for detection tasks with continuous and rapid changes. Forest change detection requires timely and accurate detection of forest changes, which is crucial for the rapid response of government departments. Nevertheless, most recent research on forest change detection has focused on low- and medium-resolution remote sensing data. MG. Hethcoat et al. used machine learning-based models to detect low-intensity selective logging in the Amazon region based on Landsat8 data [21]. T. A. Schroeder et al. performed the detection of forest fire and deforestation using the supervised classification of the Landsat8 time series [22]. Whereas W. B. Cohen et al. used an unsupervised classification post-difference approach to detect deforestation in the Pacific Northwest on Landsat8 data [23]. SAR based detection has become the most common method for obtaining accurate forest change detection results with reduced interference from clouds and fog. M. G. Hethcoat et al. used the random forest algorithm to analyze deforestation based on Sentinel-1 time series data [24]. J. Reiche et al. combined dense Sentinel-1 time series with Landsat and ALSO-2 PALSAR-2 to perform real-time near-field tropical forest monitoring [25]. Indeed, with the development of change detection technology, deep learning-based models have begun to be applied to forest change detection tasks. R. V. Maretto et al. improved the traditional U-Net model and applied it to forest change detection based on Landsat-8 OLI data, demonstrating the effectiveness of the improved U-Net model in achieving high forest-change detection accuracy [26]. F. Zhao et al. extracted deforestation areas using the U-Net model and Sentinel-1 time series to process the VV and VH data, providing evidence of the efficiency of SAR data as a data source [5].
Although these methods can be used to effectively identify forest change, the application of advanced change detection algorithms has not been thoroughly explored. In addition, most of the major change detection algorithms have been based on high-resolution optical images, while the combination of low- and medium-resolution optical and SAR data has rarely been considered. This study reviewing the characteristics of the major change detection algorithms and forest change detection tasks proposes a double-Siamese nested U-Net (DSNUNet) model to improve forest change detection accuracy based on the encoder-decoder structure. The encoder included two sets of Siamese branches which were used to extract features from optical and SAR images. Meanwhile, the decoder aggregates the optical and SAR features and restores the scale features. Indeed, DSNUNet was derived from the change detection algorithm named SNUNet-CD. In the proposed model, different feature channel combinations were used to extract effective features from optical and SAR images, as well as to compensate for the differences between these image data. Moreover, to overcome the discrepancies between positive and negative samples in the change detection task, a combination of focal loss and dice loss was used as a loss function of the proposed model. The proposed model was validated using Sentinel-1 and Sentinel-2 data. The results demonstrated the effectiveness of the proposed method in forest change detection in terms of precision, recall, and F1-Score compared to the state-of-the-art methods.
The main contributions of this paper are as follows:
(1) A Siamese network model named DSNUNet was designed to achieve accurate forest change detection by combining optical and SAR images. The DSNUNet model uses optical and SAR image data as inputs directly and outputs the final change map, thus improving the forest change detection performance;
(2) Two sets of Siamese branches with different widths were designed for feature extraction to achieve more effective use of the multi-sensor data. The feature balance of optical and SAR images was performed using different channel combinations. DSNUNet also can be generalized as a general change detection framework for any combination of two kinds of images with information differences.
The code used in this study is open-source, and it can be found on the GitHub link: https://github.com/NightSongs/DSNUNet.
The rest of this paper is organized as follows. Section 2 introduces training data sources and data preprocessing and describes the proposed DSNUNet model. Section 3 presents multiple sets of comparative experiments. Section 4 analyzes the experimental results and provides future research directions. Finally, Section 5 summarizes the paper.

2. Materials and Methods
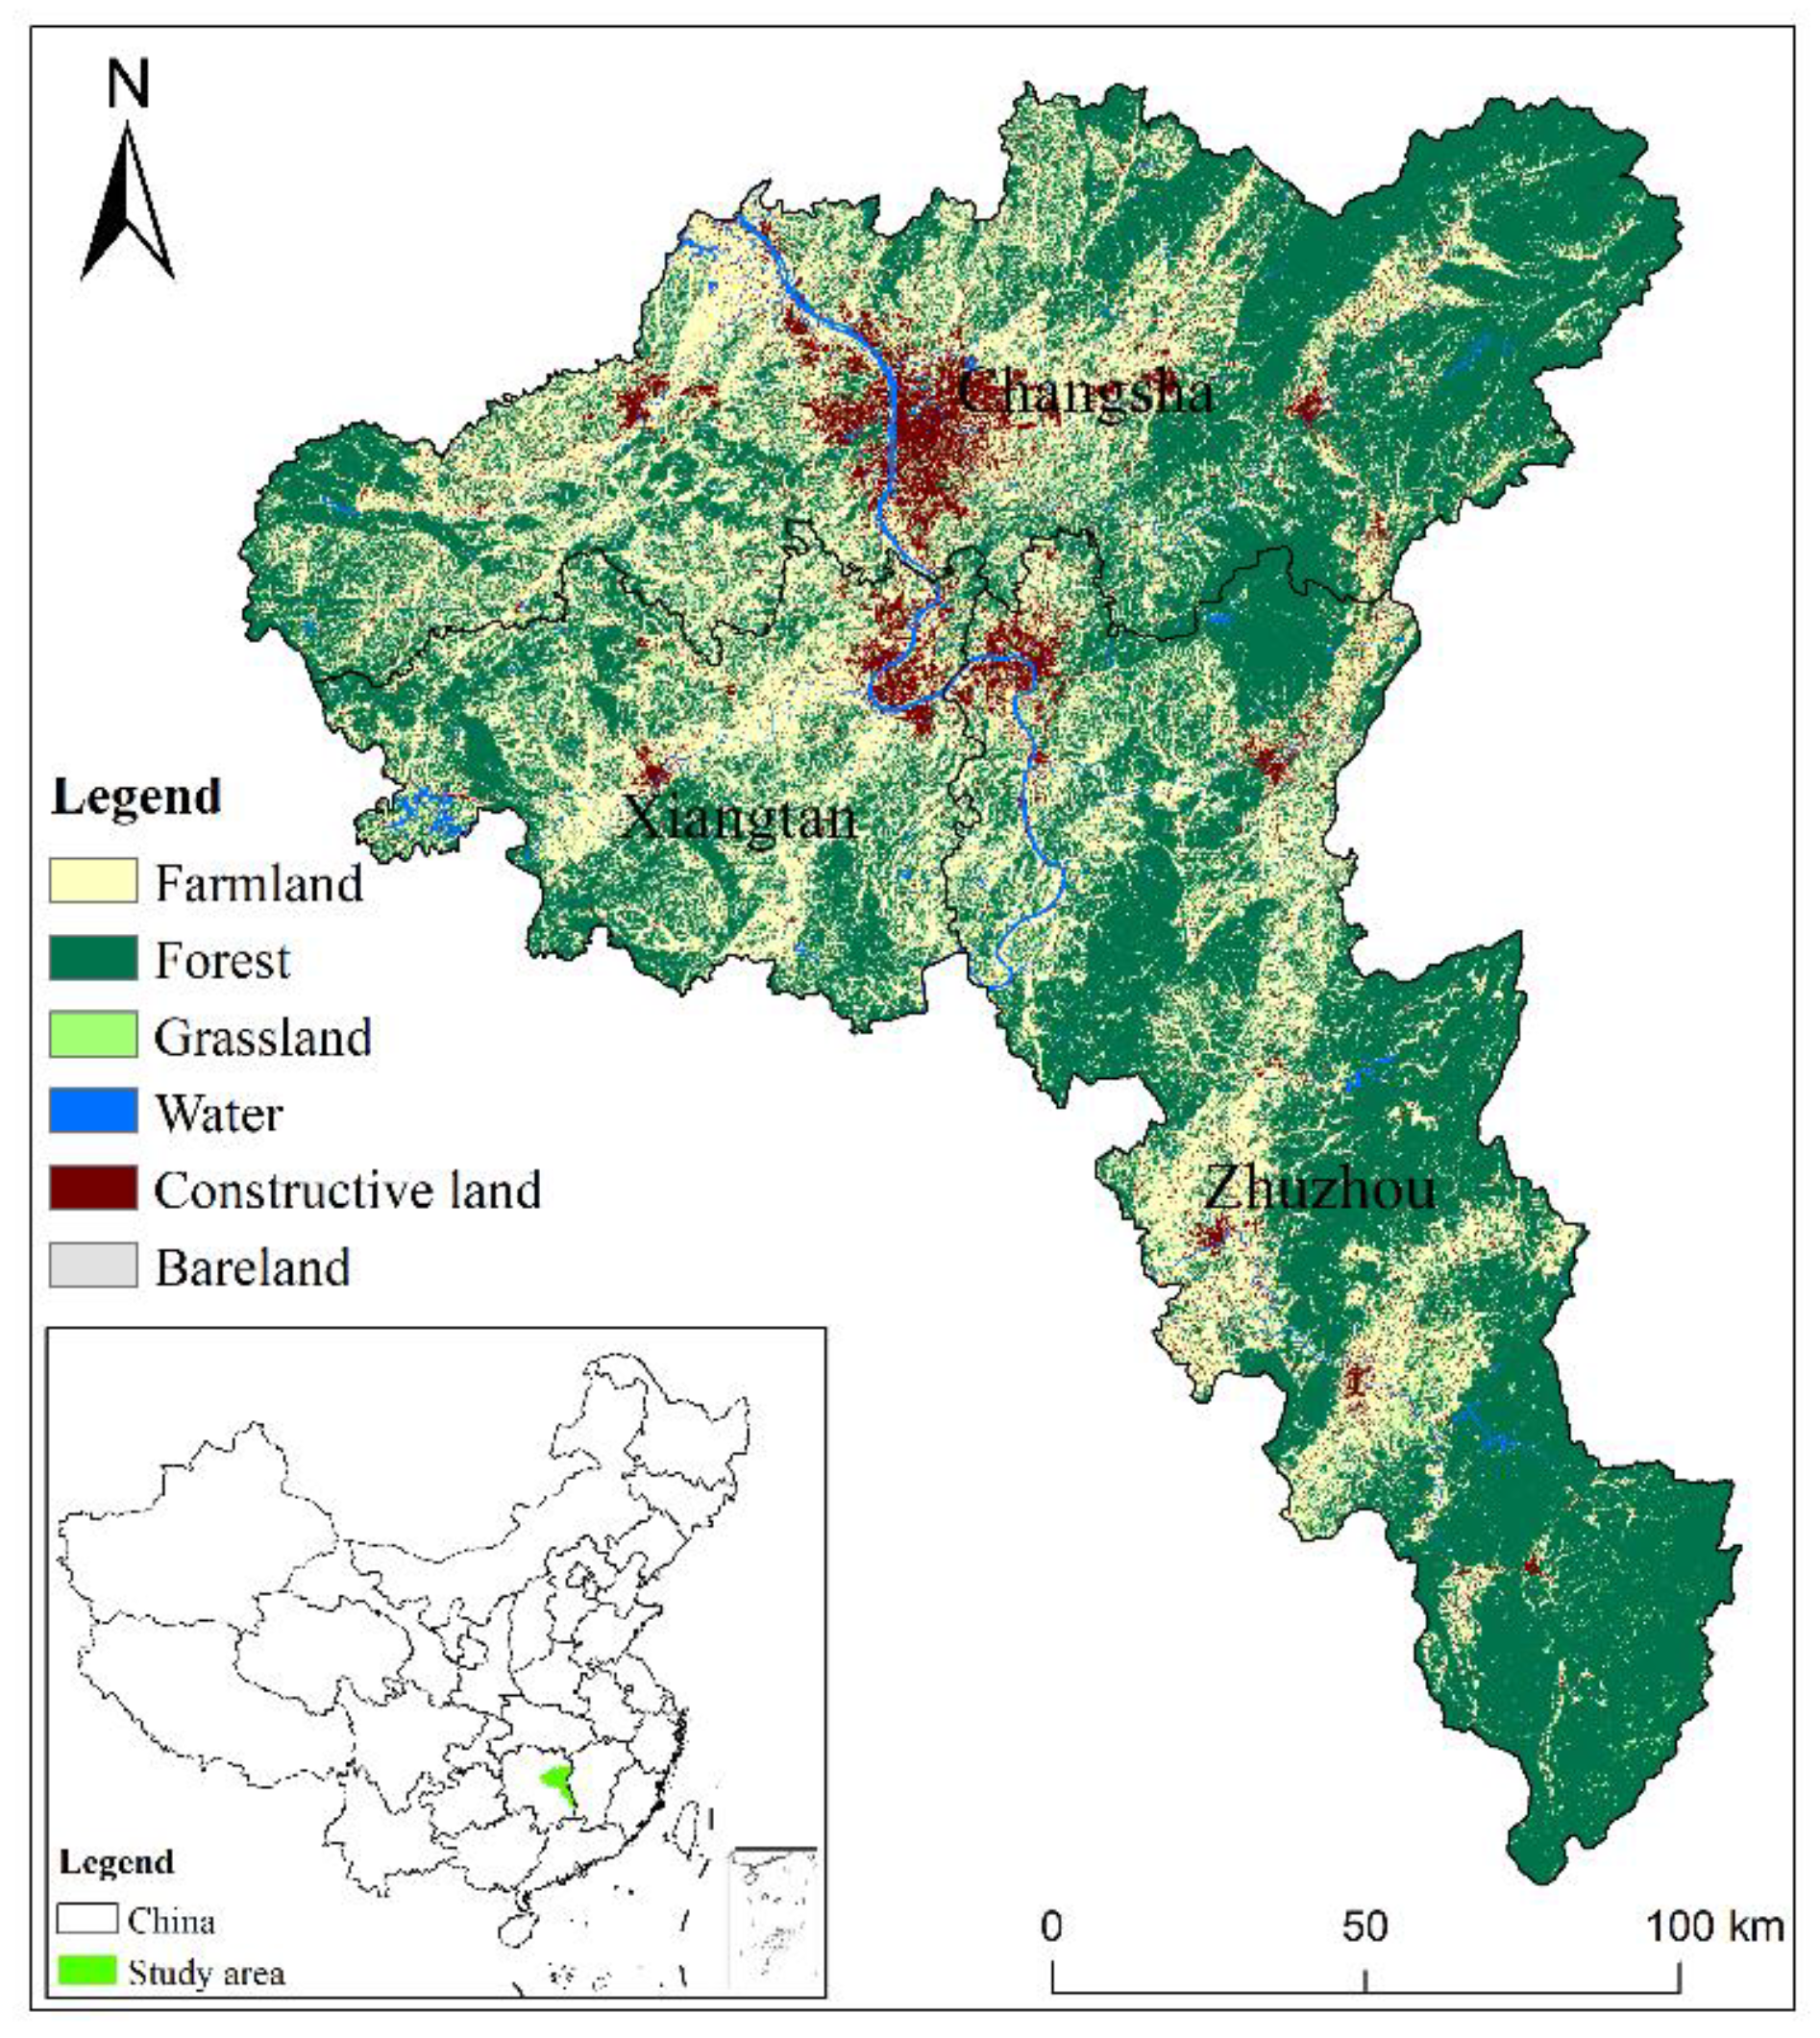
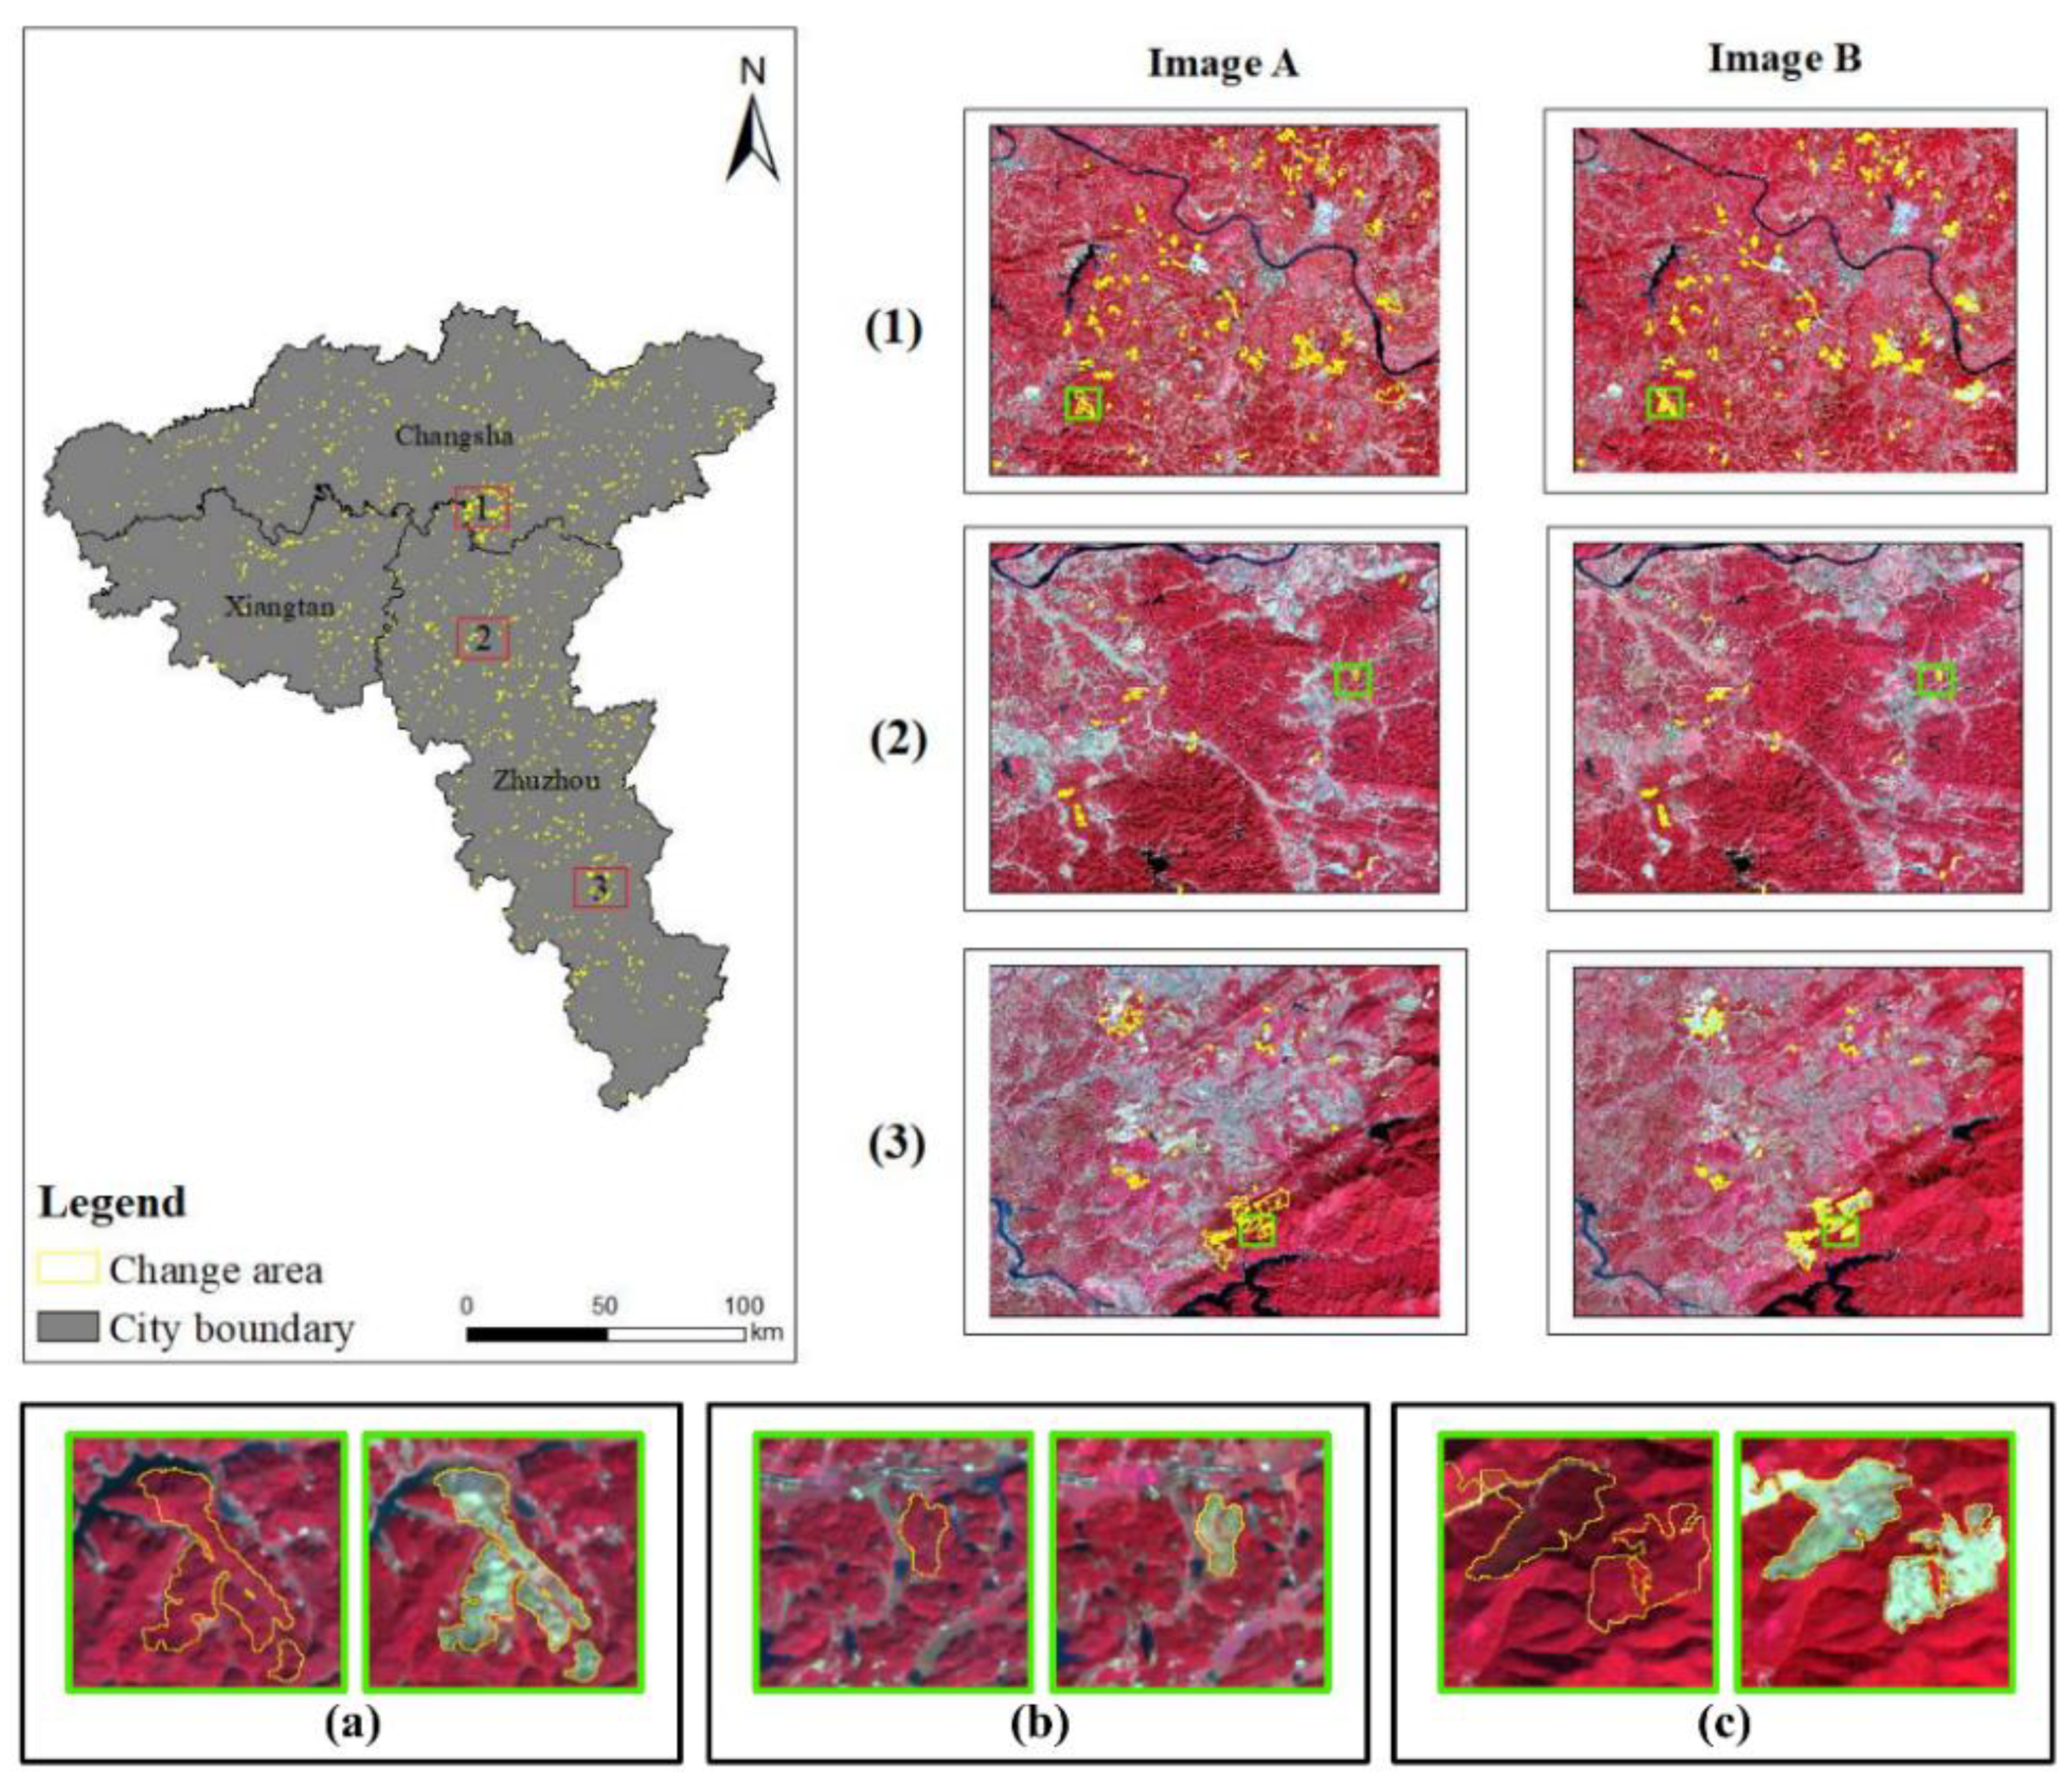
2.1. Study Area

In this study, image data were collected from the Changsha, Zhuzhou, and Xiangtan areas in the central-eastern part of Hunan Province, with coordinates of 26°03′–28°40′N and 111°53′–114°17′E. These areas consist mainly of mountainous and hilly terrain, covering a total area of 2.8 × 10⁵ km2, bordered mostly by forests and cities, making it suitable for forest change detection research. The location of the study area is shown in Figure 1.

2.2. Data Acquisition and Dataset Construction

2.2.1. Acquisition of Optical Image

The optical image data used in this study were the L1C level data collected by the Sentinel-2 satellite. Three bands, namely the NIR, red, and green (color infrared), were selected as RGB inputs of the detection model. The data were collected from the study area in autumn 2020 and 2021 (September to November), then used for the change detection analysis. The mean synthesis was performed on the quarterly image set using the Google Earth Engine (GEE) platform; cloud cover was controlled to below 5%. Table 1 shows the optical image information used in this study.

2.2.2. Acquisition of SAR Image

The SAR image data used in this study were derived from the first-order ground-ranging (GRD) product of Sentinel-1 satellite data. The temporal phase of the SAR data was consistent with the optical image. To reduce the impact of speckles on data quality, the intra-quarter mean synthesis was applied. This process can effectively reduce the speckle noise in SAR data and facilitates alignment with the optical images based on a time scale. The 10-m resolution VV and VH polarizations were used as model inputs. The edge regions were masked, and the radiation-corrected results from the GEE platform were converted to the calibration results in dB using logarithmic scaling according to the following equation:
x d b = 10 × log 10 x ,
where xdb is the final calibration result; x is the original image after platform radiation correction. Table 2 describes the SAR image information used in this study.

2.2.3. Label Annotation and Dataset Construction

In this study, manual annotation of change areas within the study area was performed based on the two synthetic optical images. Indeed, forest change is defined as a loss of forest vegetation caused by human activities and natural disasters, including logging and fire. The annotation was performed in ArcMap, and change areas were stored in a vector format. Finally, a total of 2441 change areas were used to produce the change detection dataset. The change labels used in the experiment are shown in Figure 2.
The image patches can be used in the proposed DSNUNet for forward calculation. The optical and SAR images were cropped according to the bi-time at a resolution size of 256 × 256, and then the overlap rate was set to 0.25. Similarly, change areas obtained from visual interpretation were first converted to raster data, in which 255 and 0 were assigned to change and constant areas, respectively, and then cropped using the same approach. In total, 1951 patch pairs were obtained and used for model training and validation. The data were randomly divided into training, test, and validation datasets according to the ratio of 8:1:1.

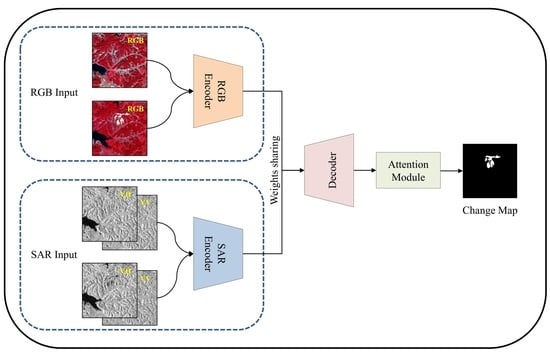
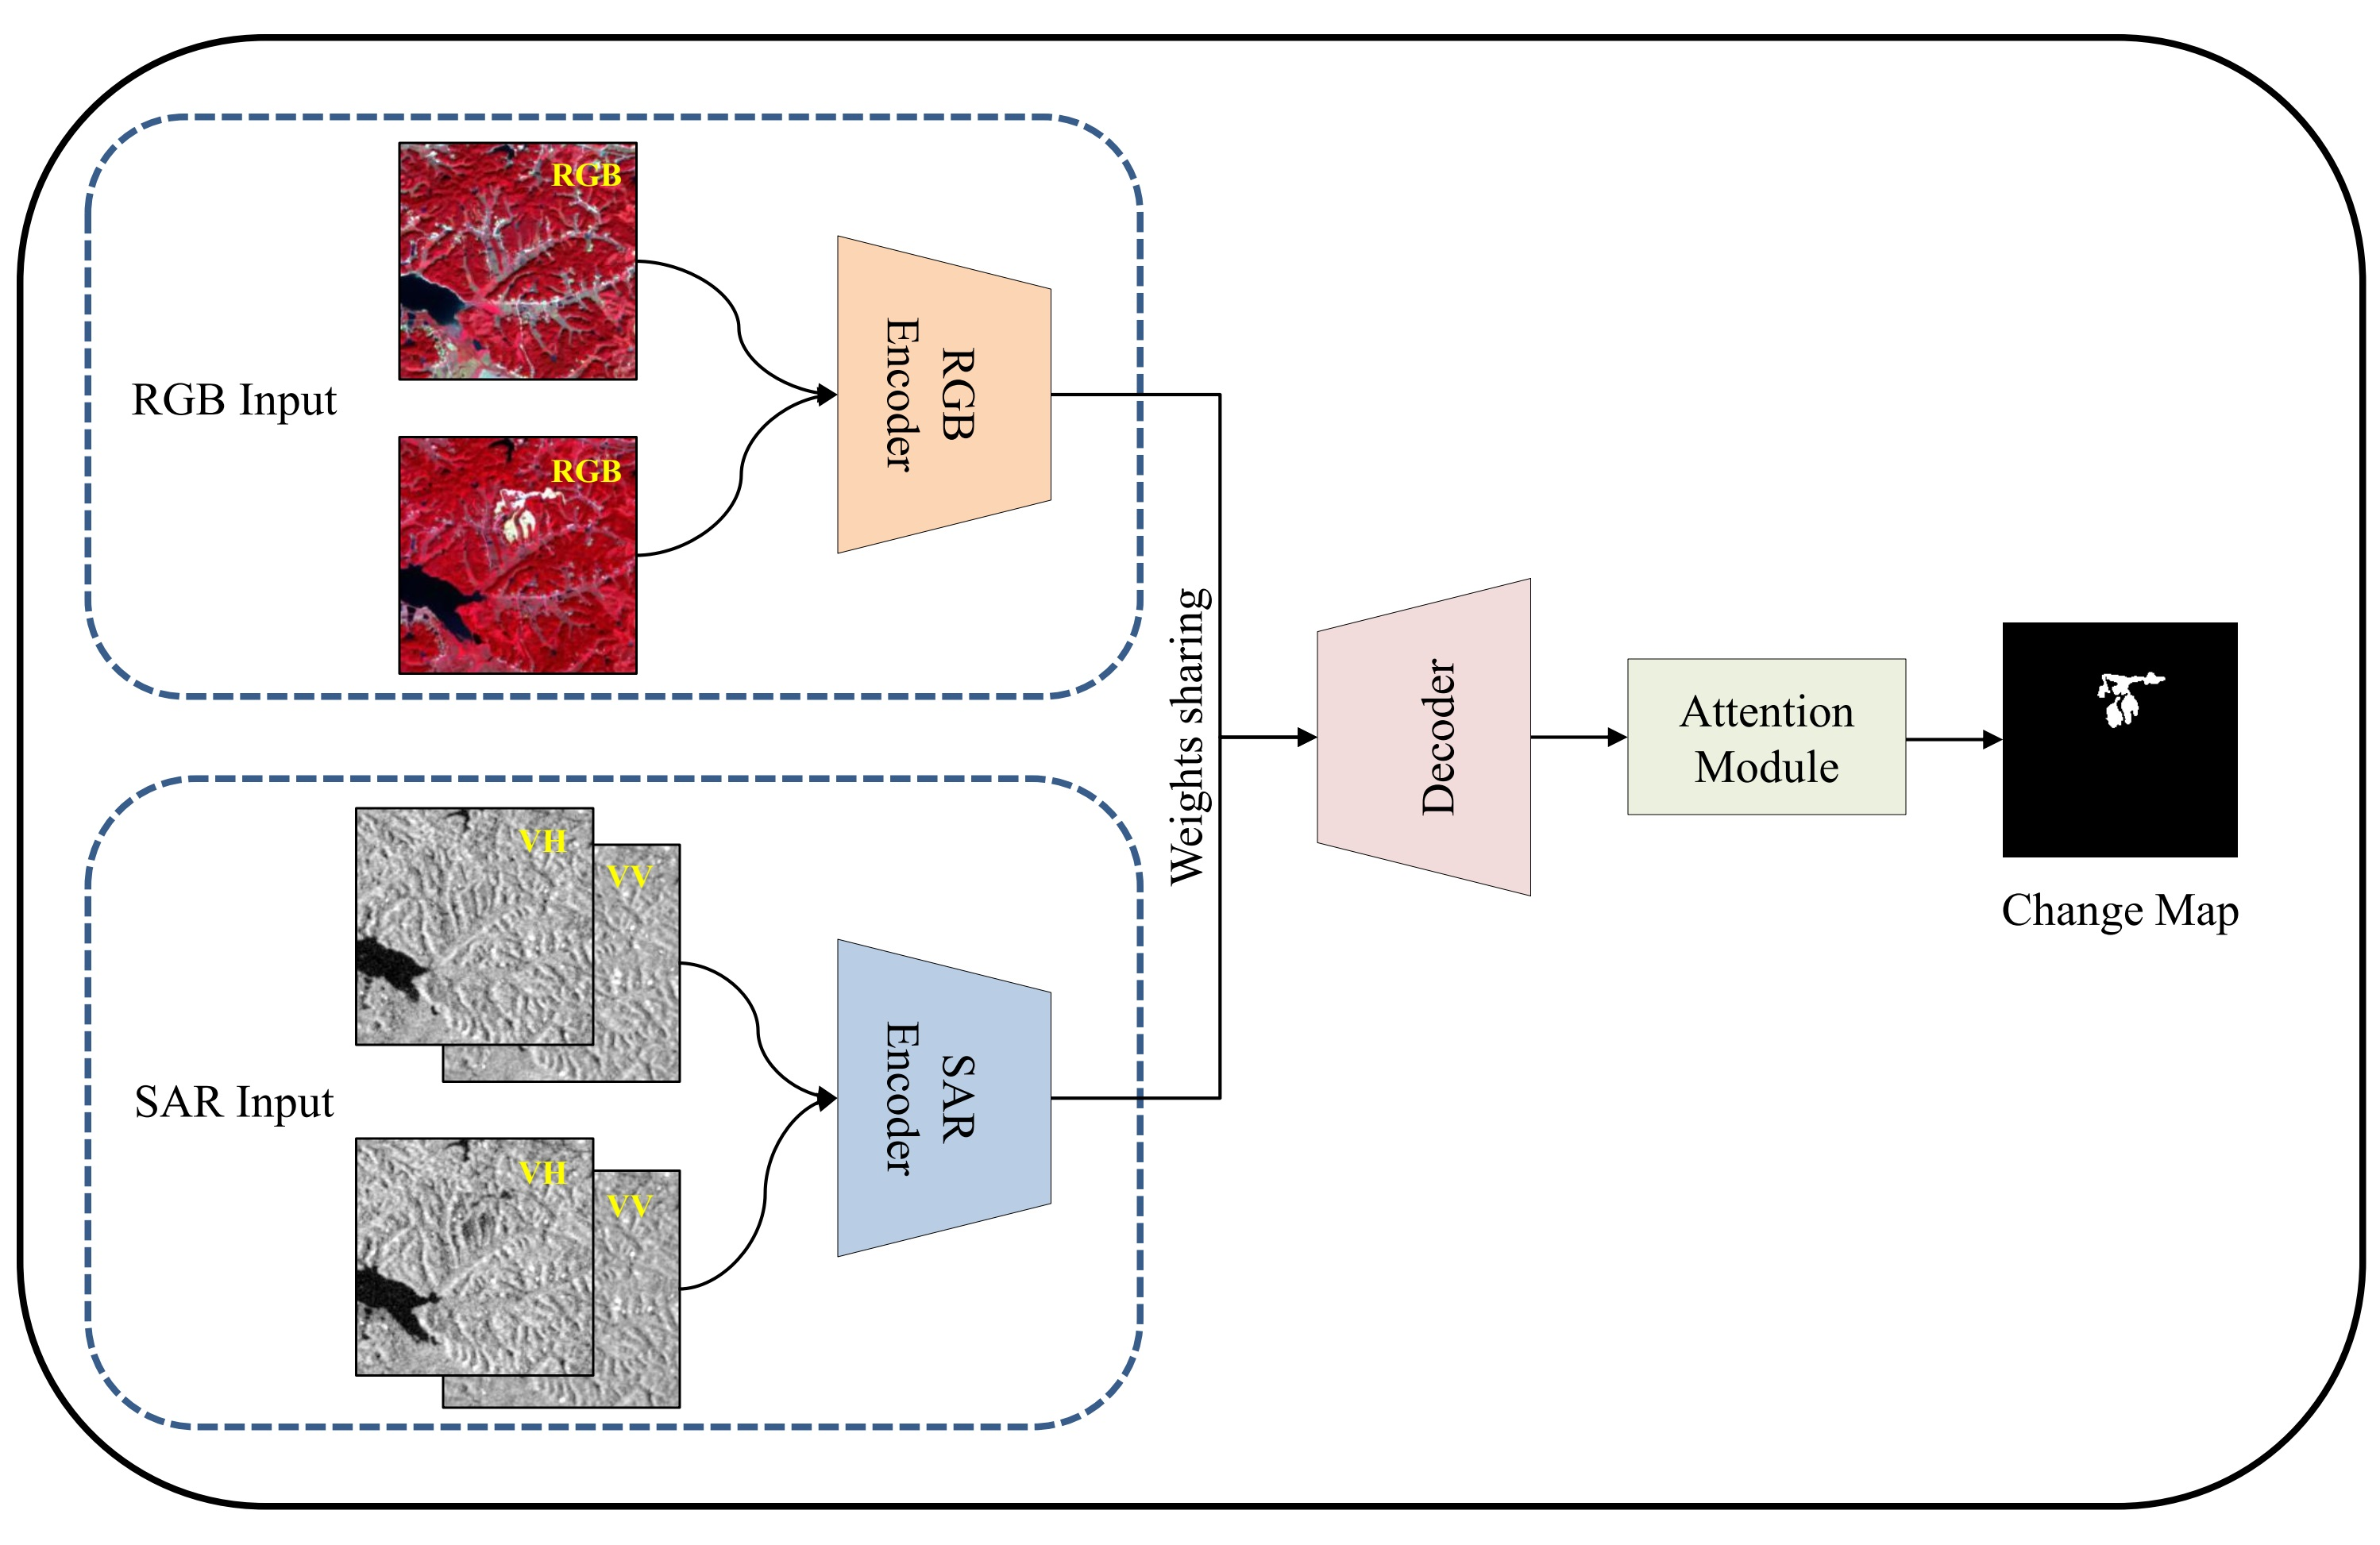
2.3. Model Structure

The proposed DSNUNet is a change detection model based on Siamese networks which uses optical and SAR images jointly to achieve forest change detection. The DSNUNet model is derived from the SNUNet-CD model. The structure of the DSNUNet model is shown in Figure 3. In Figure 3, the left side shows the encoder part used for down-sampling and extracting semantic features while the right side indicates the decoder part used for up-sampling and recovering feature scales. Unlike most change detection models, the DSNUNet model accepts both optical and SAR images (VV+VH) as inputs and can efficiently extract data features from different time phases and modes. Finally, the DSNUNet output is a fine change map.

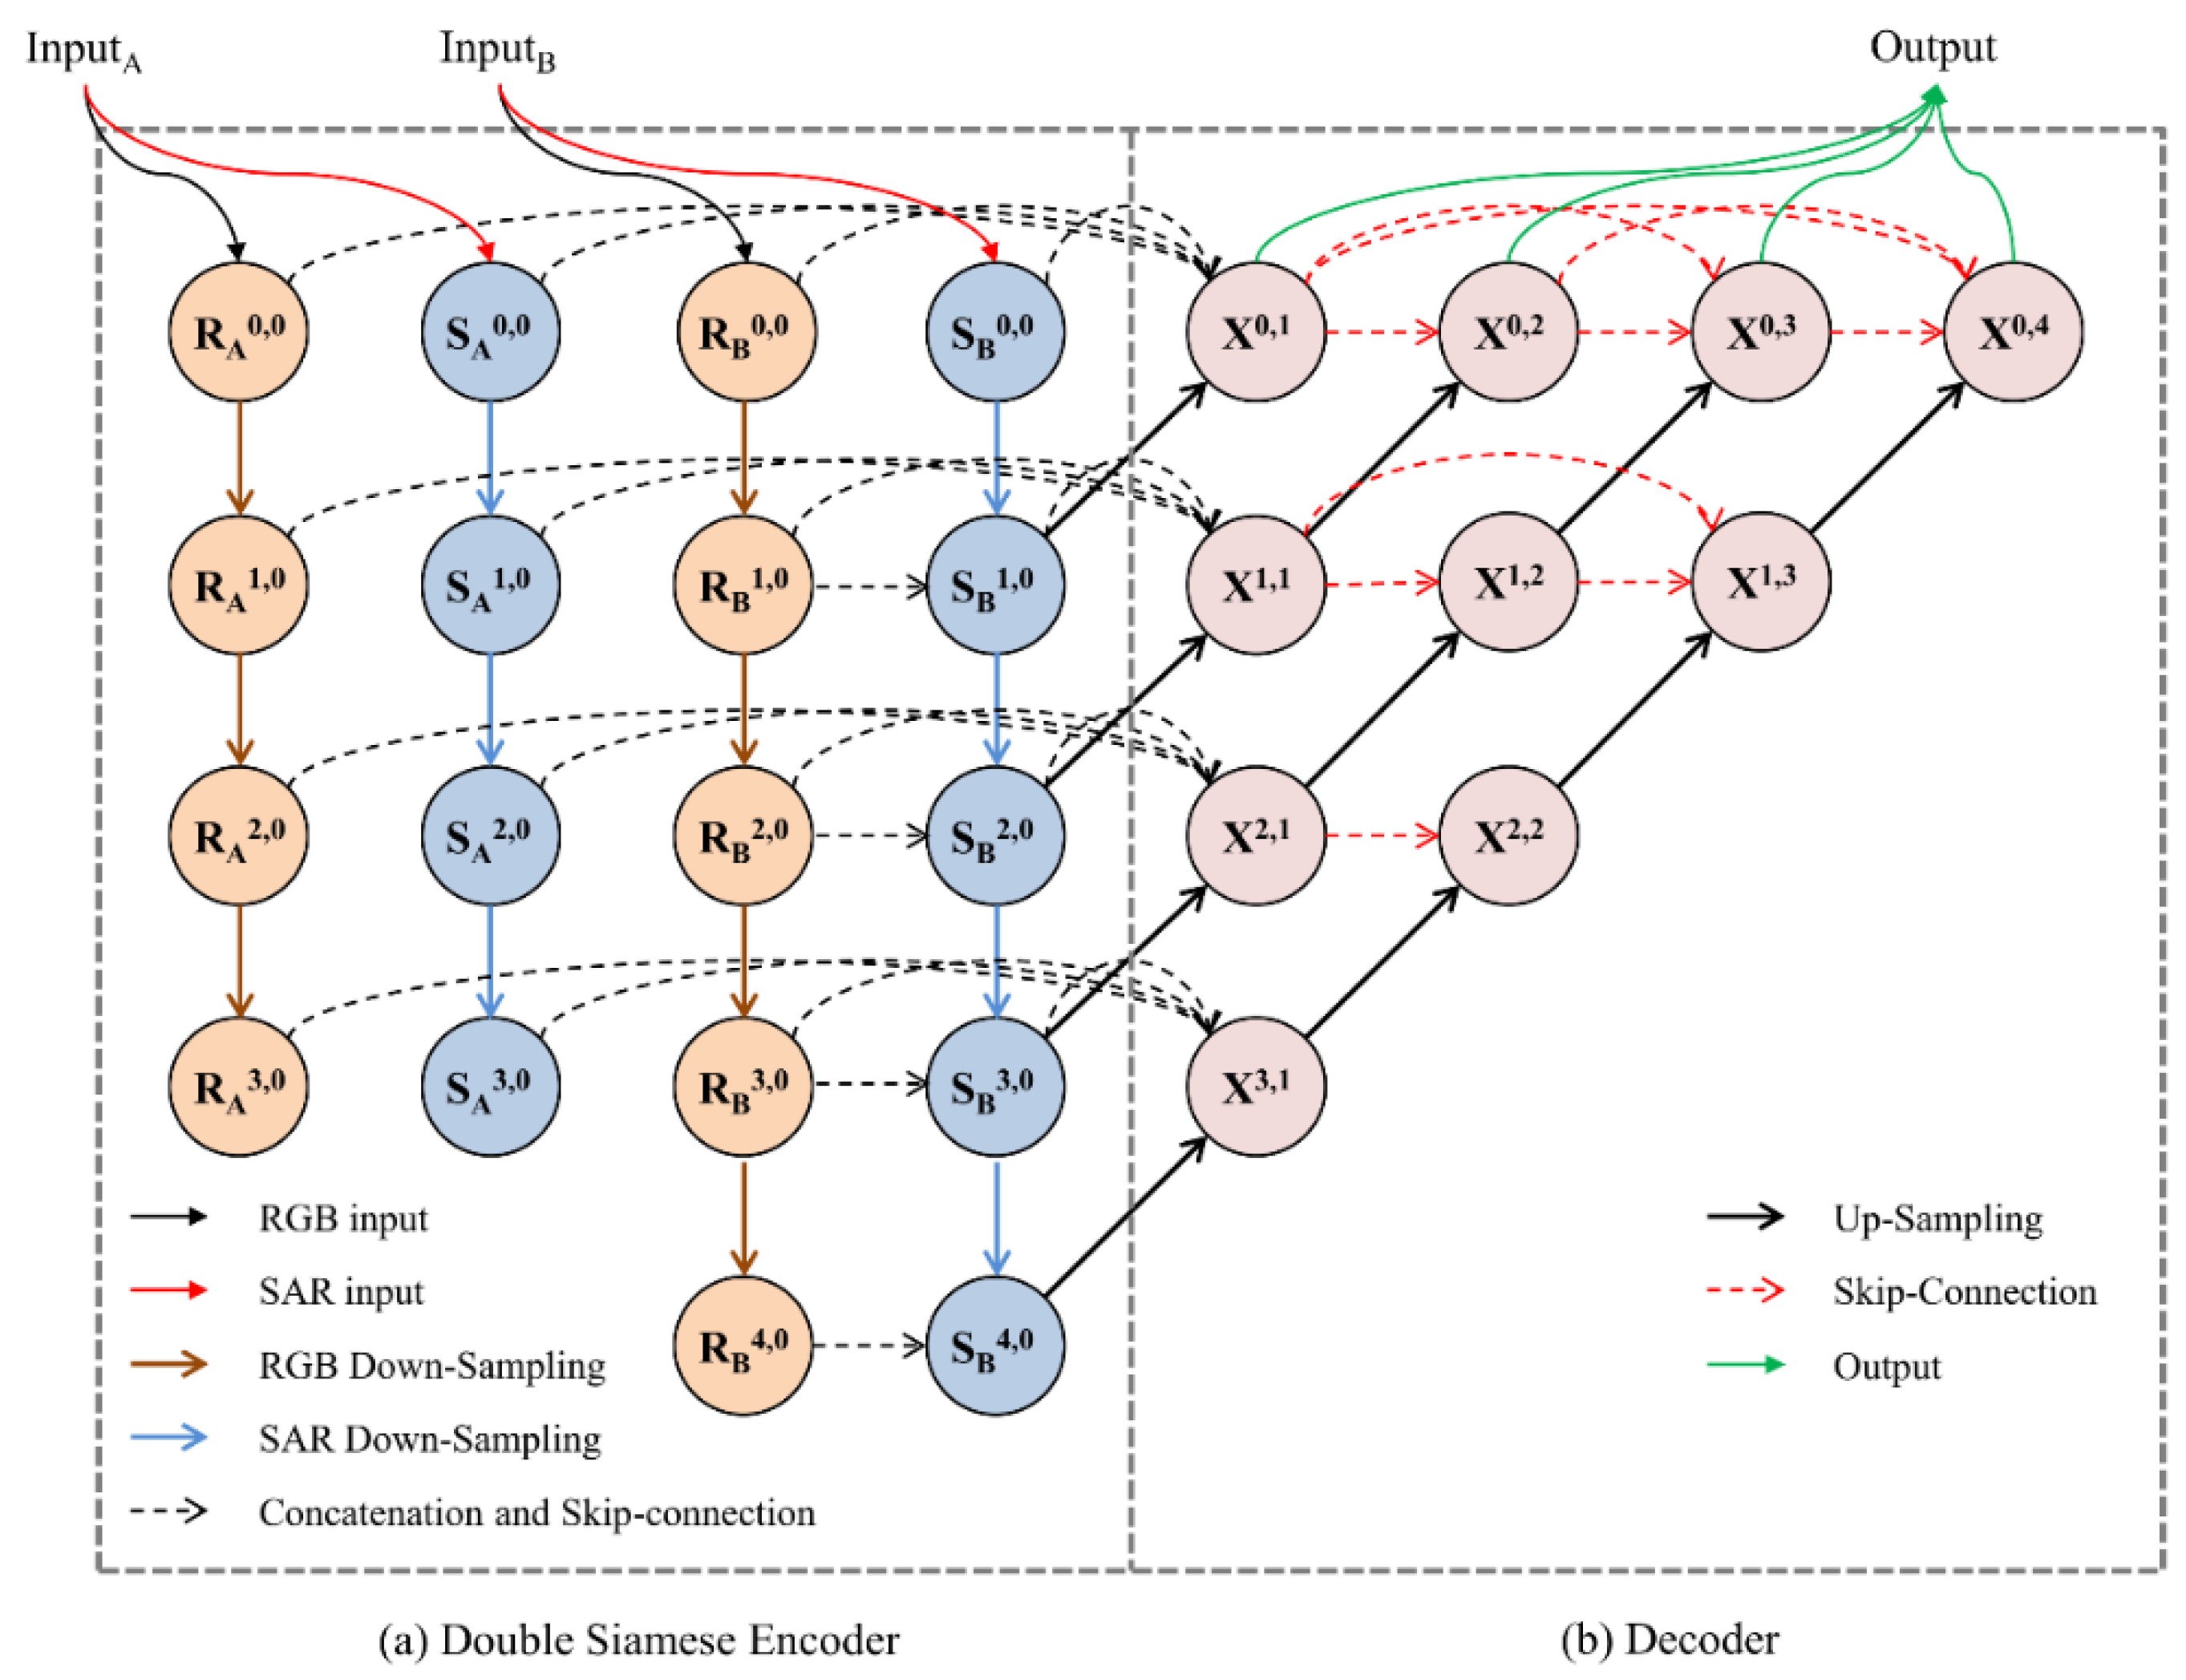
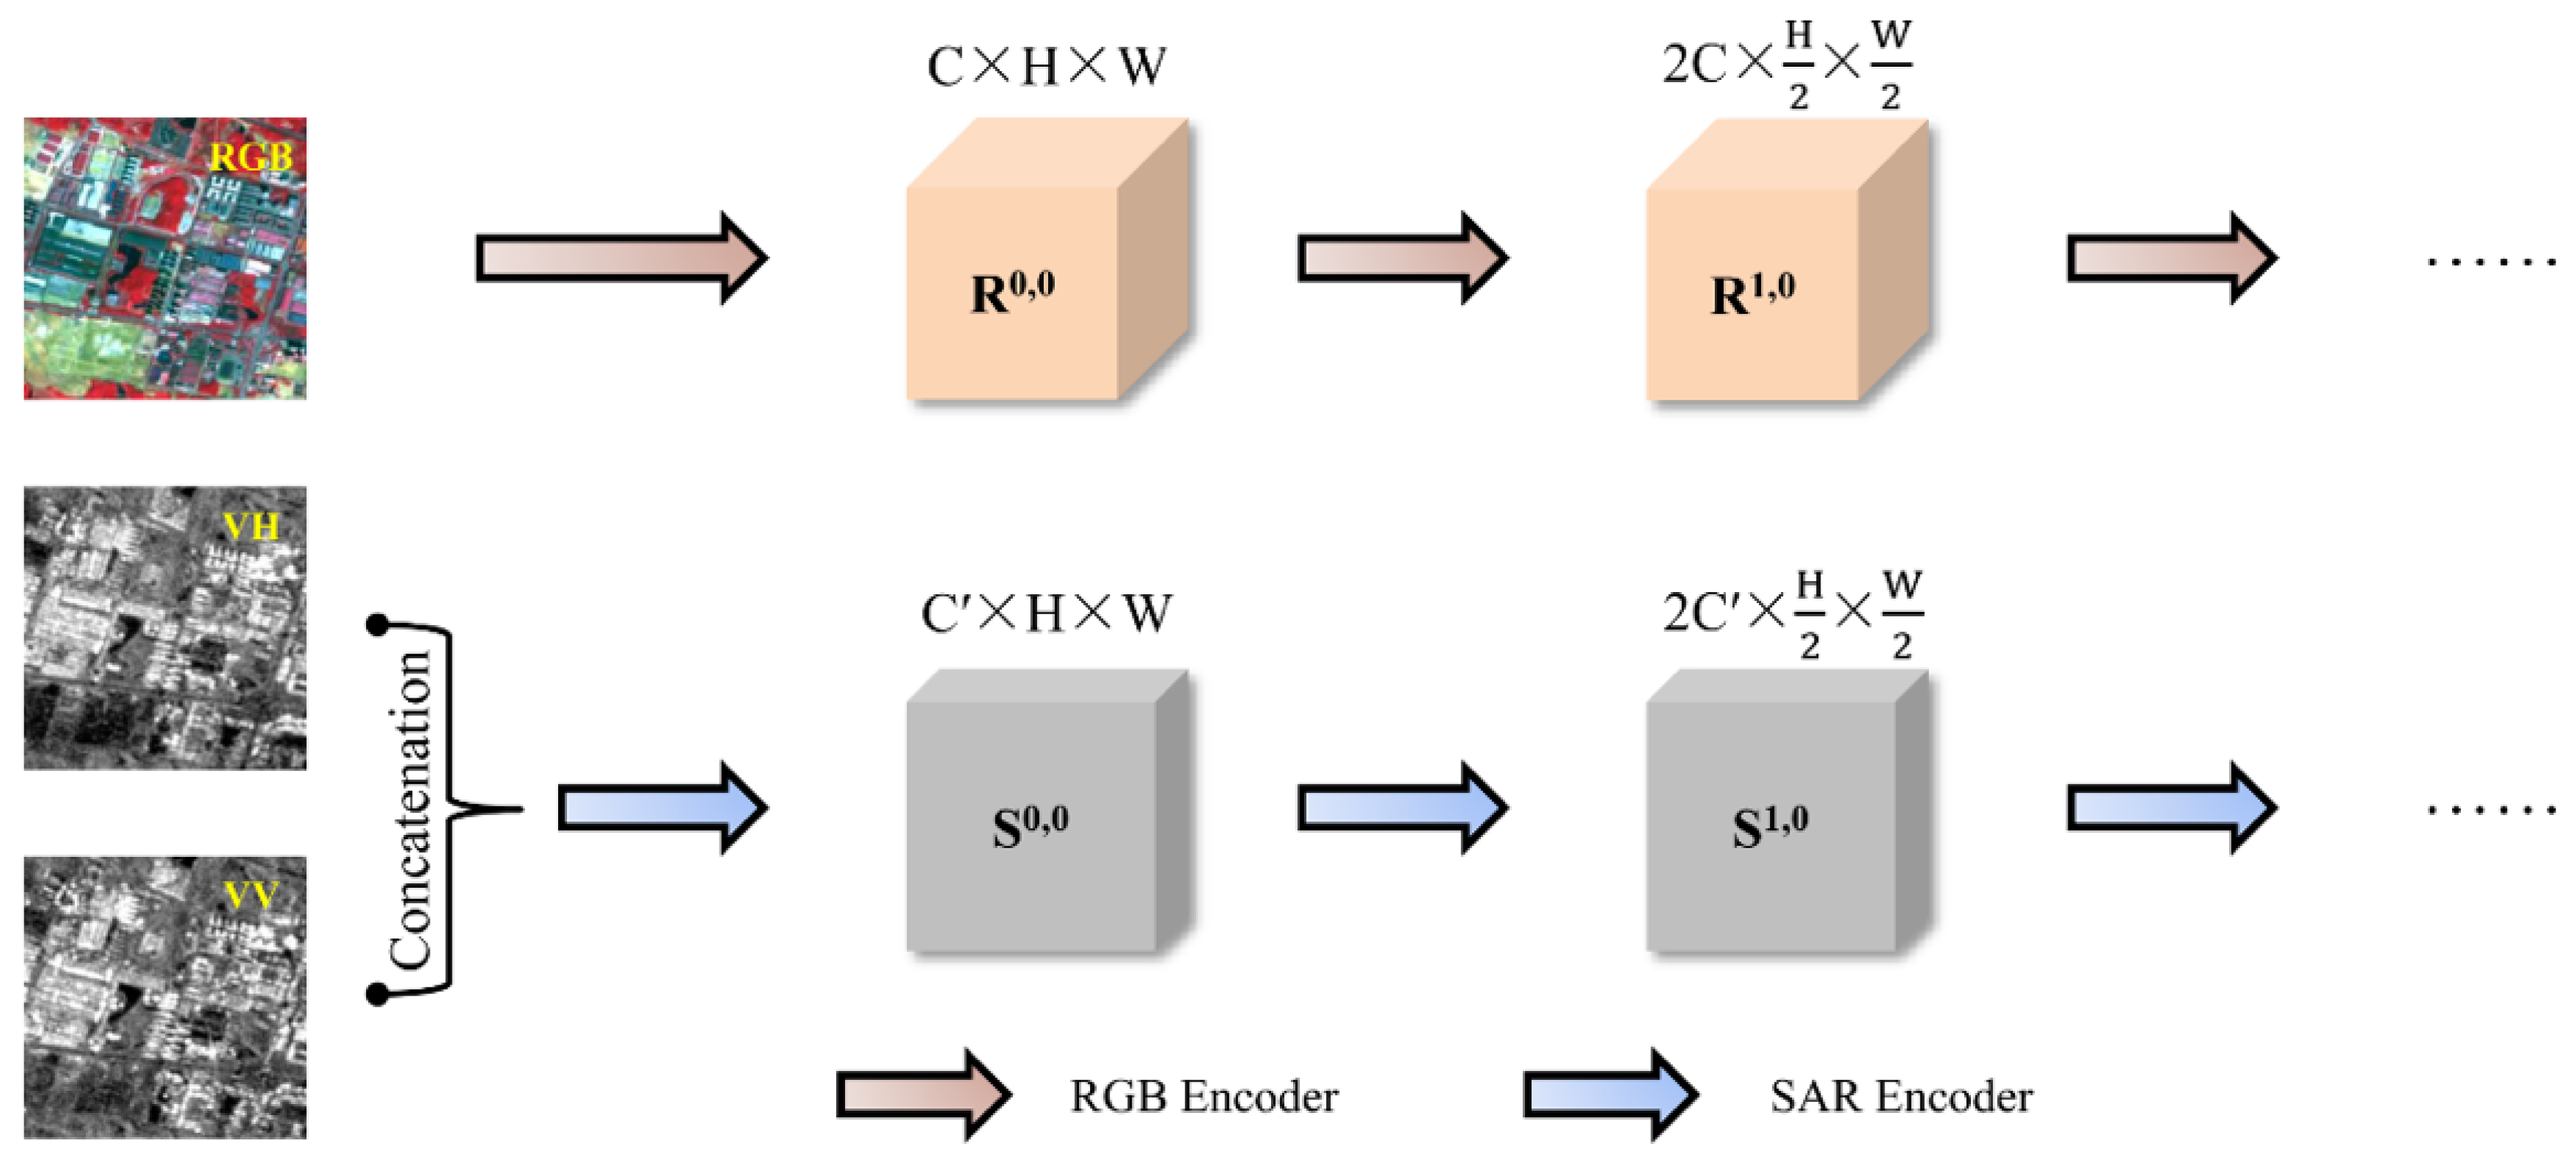
2.3.1. Double Siamese Encoder Structure

Optical and SAR images were obtained using different sensors. The pixel values of optical and SAR images represent the spectral reflectance values and the backscattering coefficients, respectively. To extract differential features from different modal data, two branches are used in the DSNUNet model. An easily overlooked problem in the combined study of optical and SAR data is that optical images have richer semantic features compared to SAR images. In the deep learning field, different channels of features are usually considered as different patterns of features. Therefore, different combinations of convolutional kernels for each of the two types of data were used in this study. Indeed, more complex data use more convolutional kernels to extract more features.
As shown in Figure 4, after using optical images as inputs in the network, primary features were obtained by the initial convolution layer. The number of feature maps’ channels gradually increased while the height and width were gradually halved after multiple down-sampling. VV and VH were inputted to the network as SAR images and stacked along the channel dimension to construct a 2 × H × W feature map. Afterward, a feature extraction backbone with a smaller number of convolution kernels was used to extract feature maps of SAR images. This is the same principle as optical image branching. SAR and optical features of the same level were kept uniform at the spatial scale, ensuring a spatial alignment of different features. By assuming Ri,0 is the feature node set obtained from an optical image and Si,0 is a feature node set obtained from an SAR image, the feature shapes of Ri,0 and Si,0 can be expressed as follows:
R i , 0 = C × H × W i = 0 2 i C × H 2 i × W 2 i i > 0 ,
S i , 0 = C × H × W i = 0 2 i C × H 2 i × W 2 i i > 0 ,
where C and C′ denote the initial channel numbers of the optical and SAR branches, respectively; H and W denote the height and width of an image.

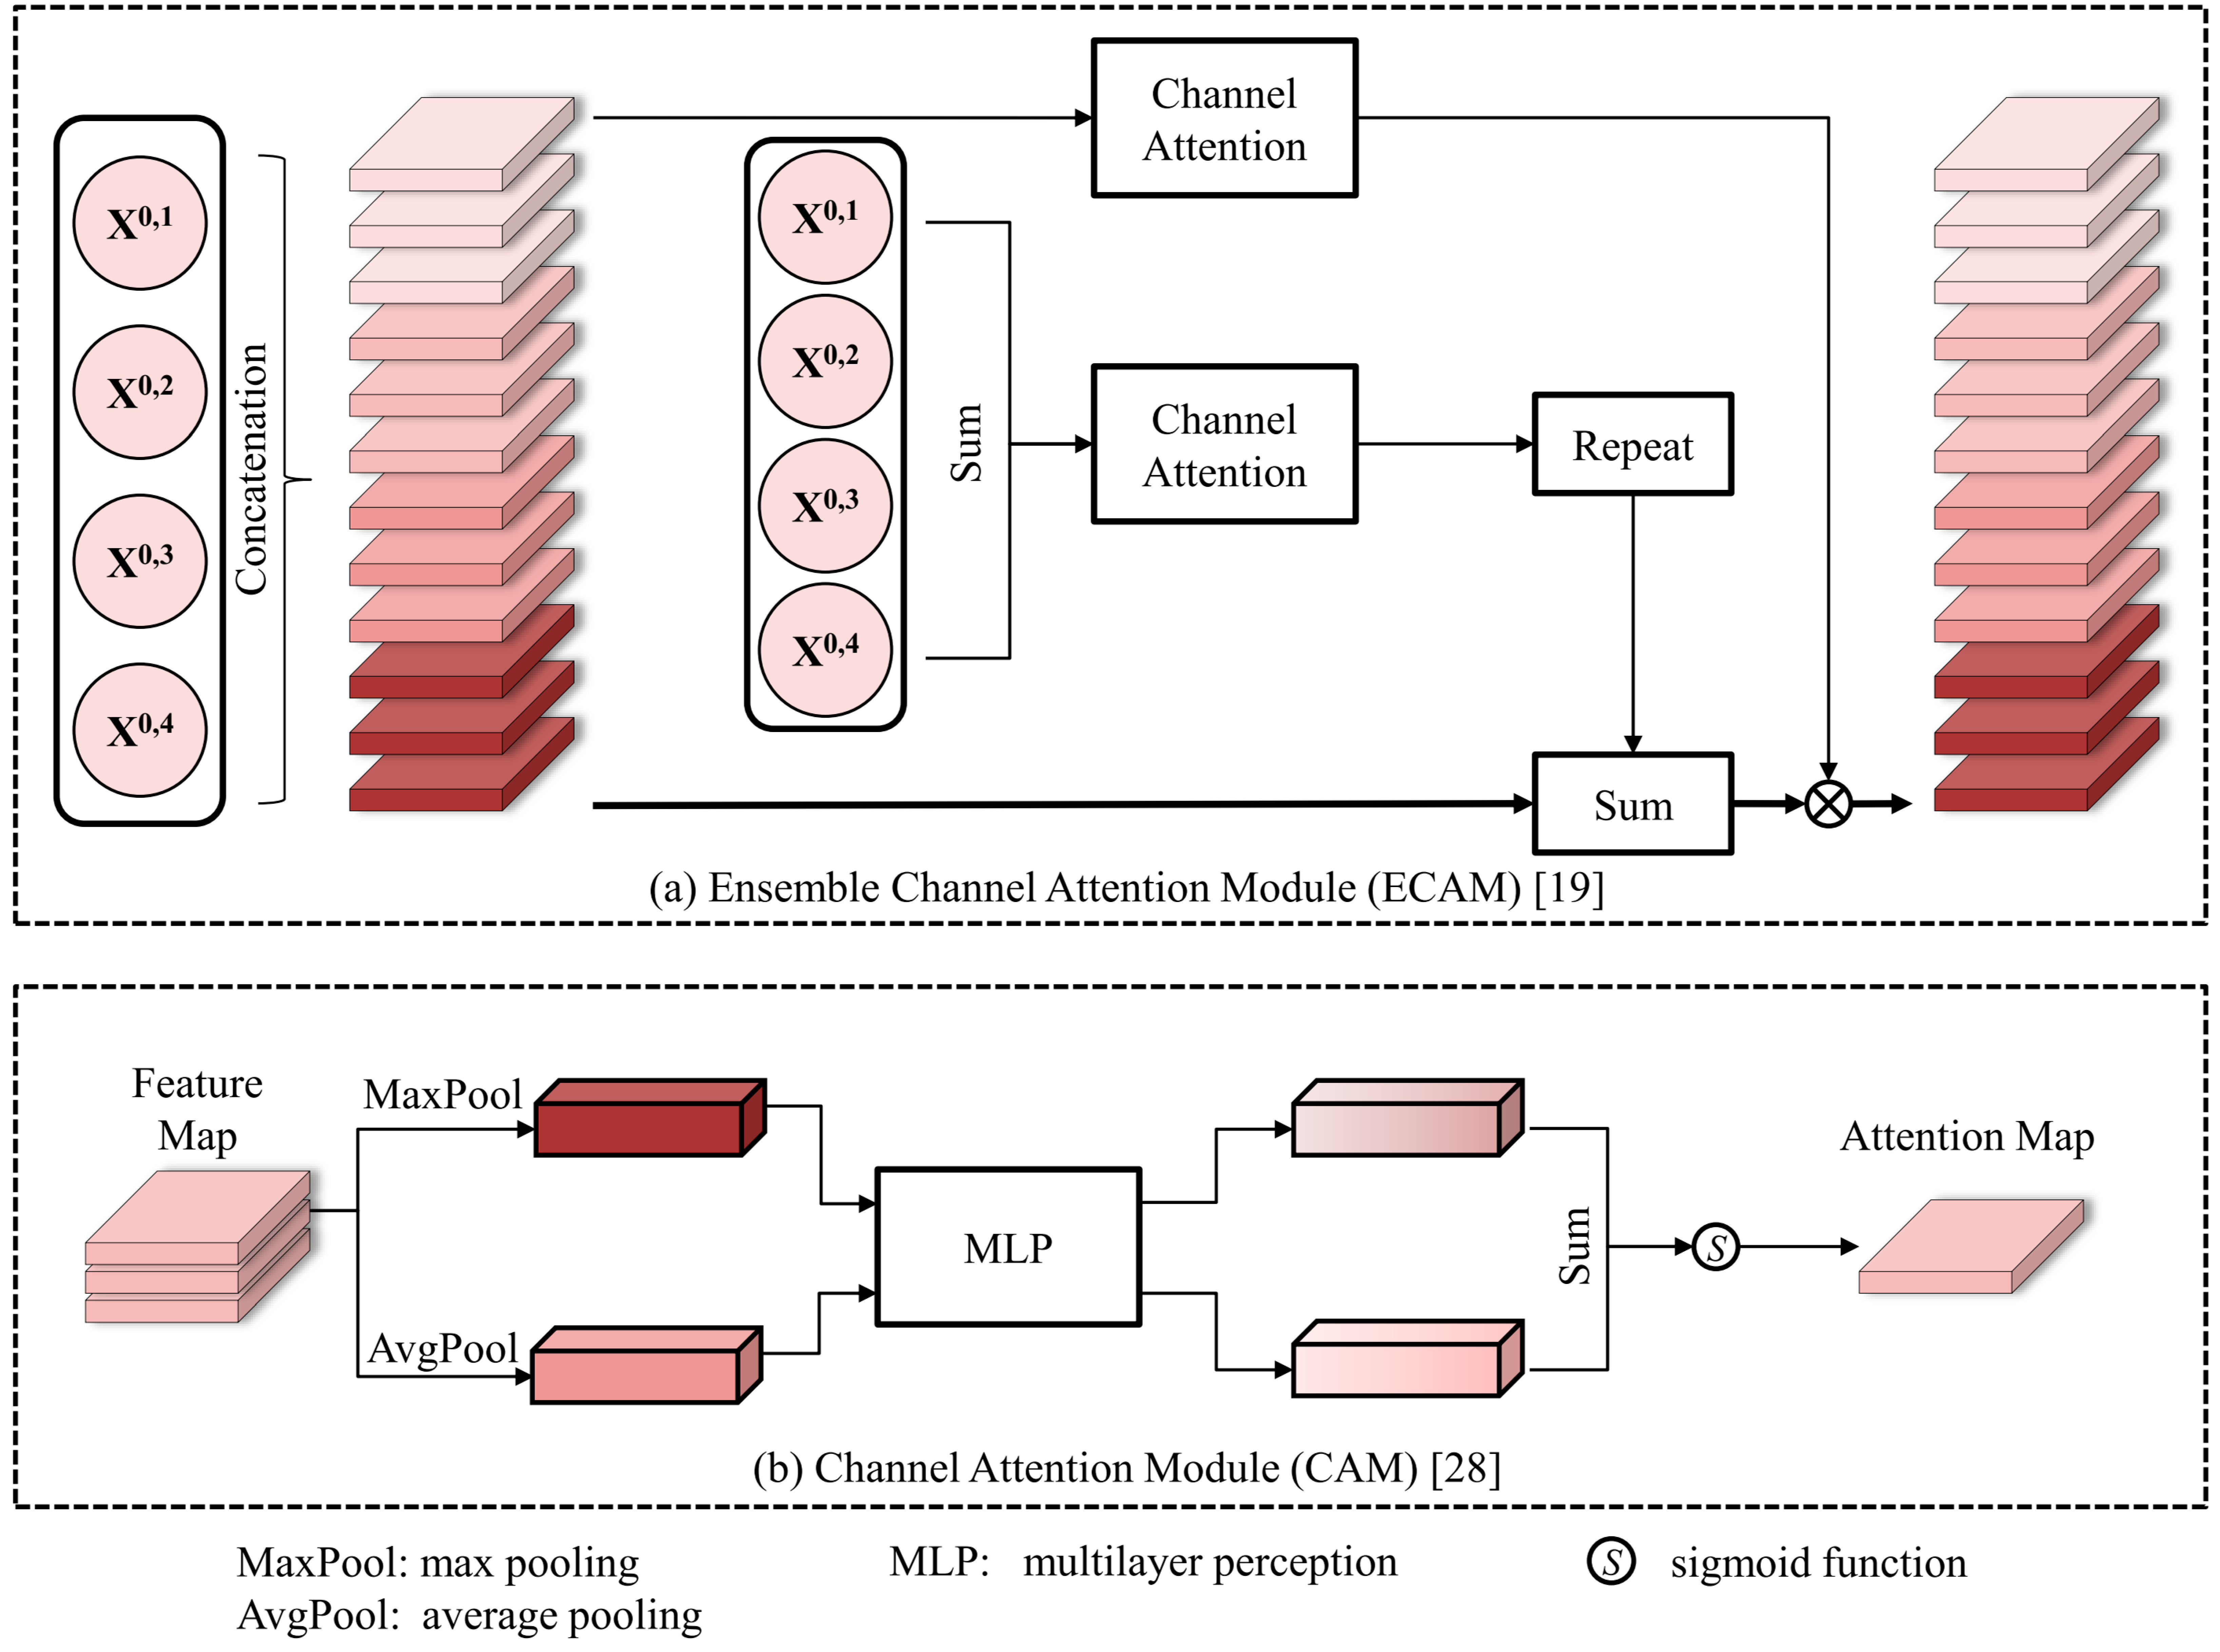
2.3.2. Decoder Structure

Although the DSNUNet encoder consists of two sets of twin branches, the extracted features from branches are independent. To ensure information integrity in the decoder part, the stitching method along the channel dimension was used to concatenate the features of the same level in different branches. The original information was introduced into the encoder and then down-sampled level by level. This processing results in the loss of spatial information used for the localization of features. To merge high-resolution spatial features with low-resolution semantic features, a continuous skip-connections mechanism for information interaction between the encoder and decoder was used in this study.
As shown in Figure 3, after introducing “A” and “B” in the network, different branches for down-sampling were obtained according to the data types. The four features of the same level were combined with the up-sampling results of the lower-level features and transmitted together to the decoder block. Assume Xi,j is a decoder node, Ri,0 is the feature node obtained from an optical image, and Si,0 is the feature node obtained from a SAR image; the calculation process of the decoder node can be expressed as follows:
X i , j = H R A i , 0 , R B i , 0 , S A i , 0 , S B i , 0 , U R i + 1 , j 1 , U S i + 1 , j 1 , j = 1 H R A i , 0 , R B i , 0 , S A i , 0 , S B i , 0 , X i , j 1 , U X i + 1 , j 1 , j > 1
where H denotes the calculation function of the convolution block; U denotes the up-sampling function based on transposed convolution; and [] denotes the splicing operation in the channel dimension.

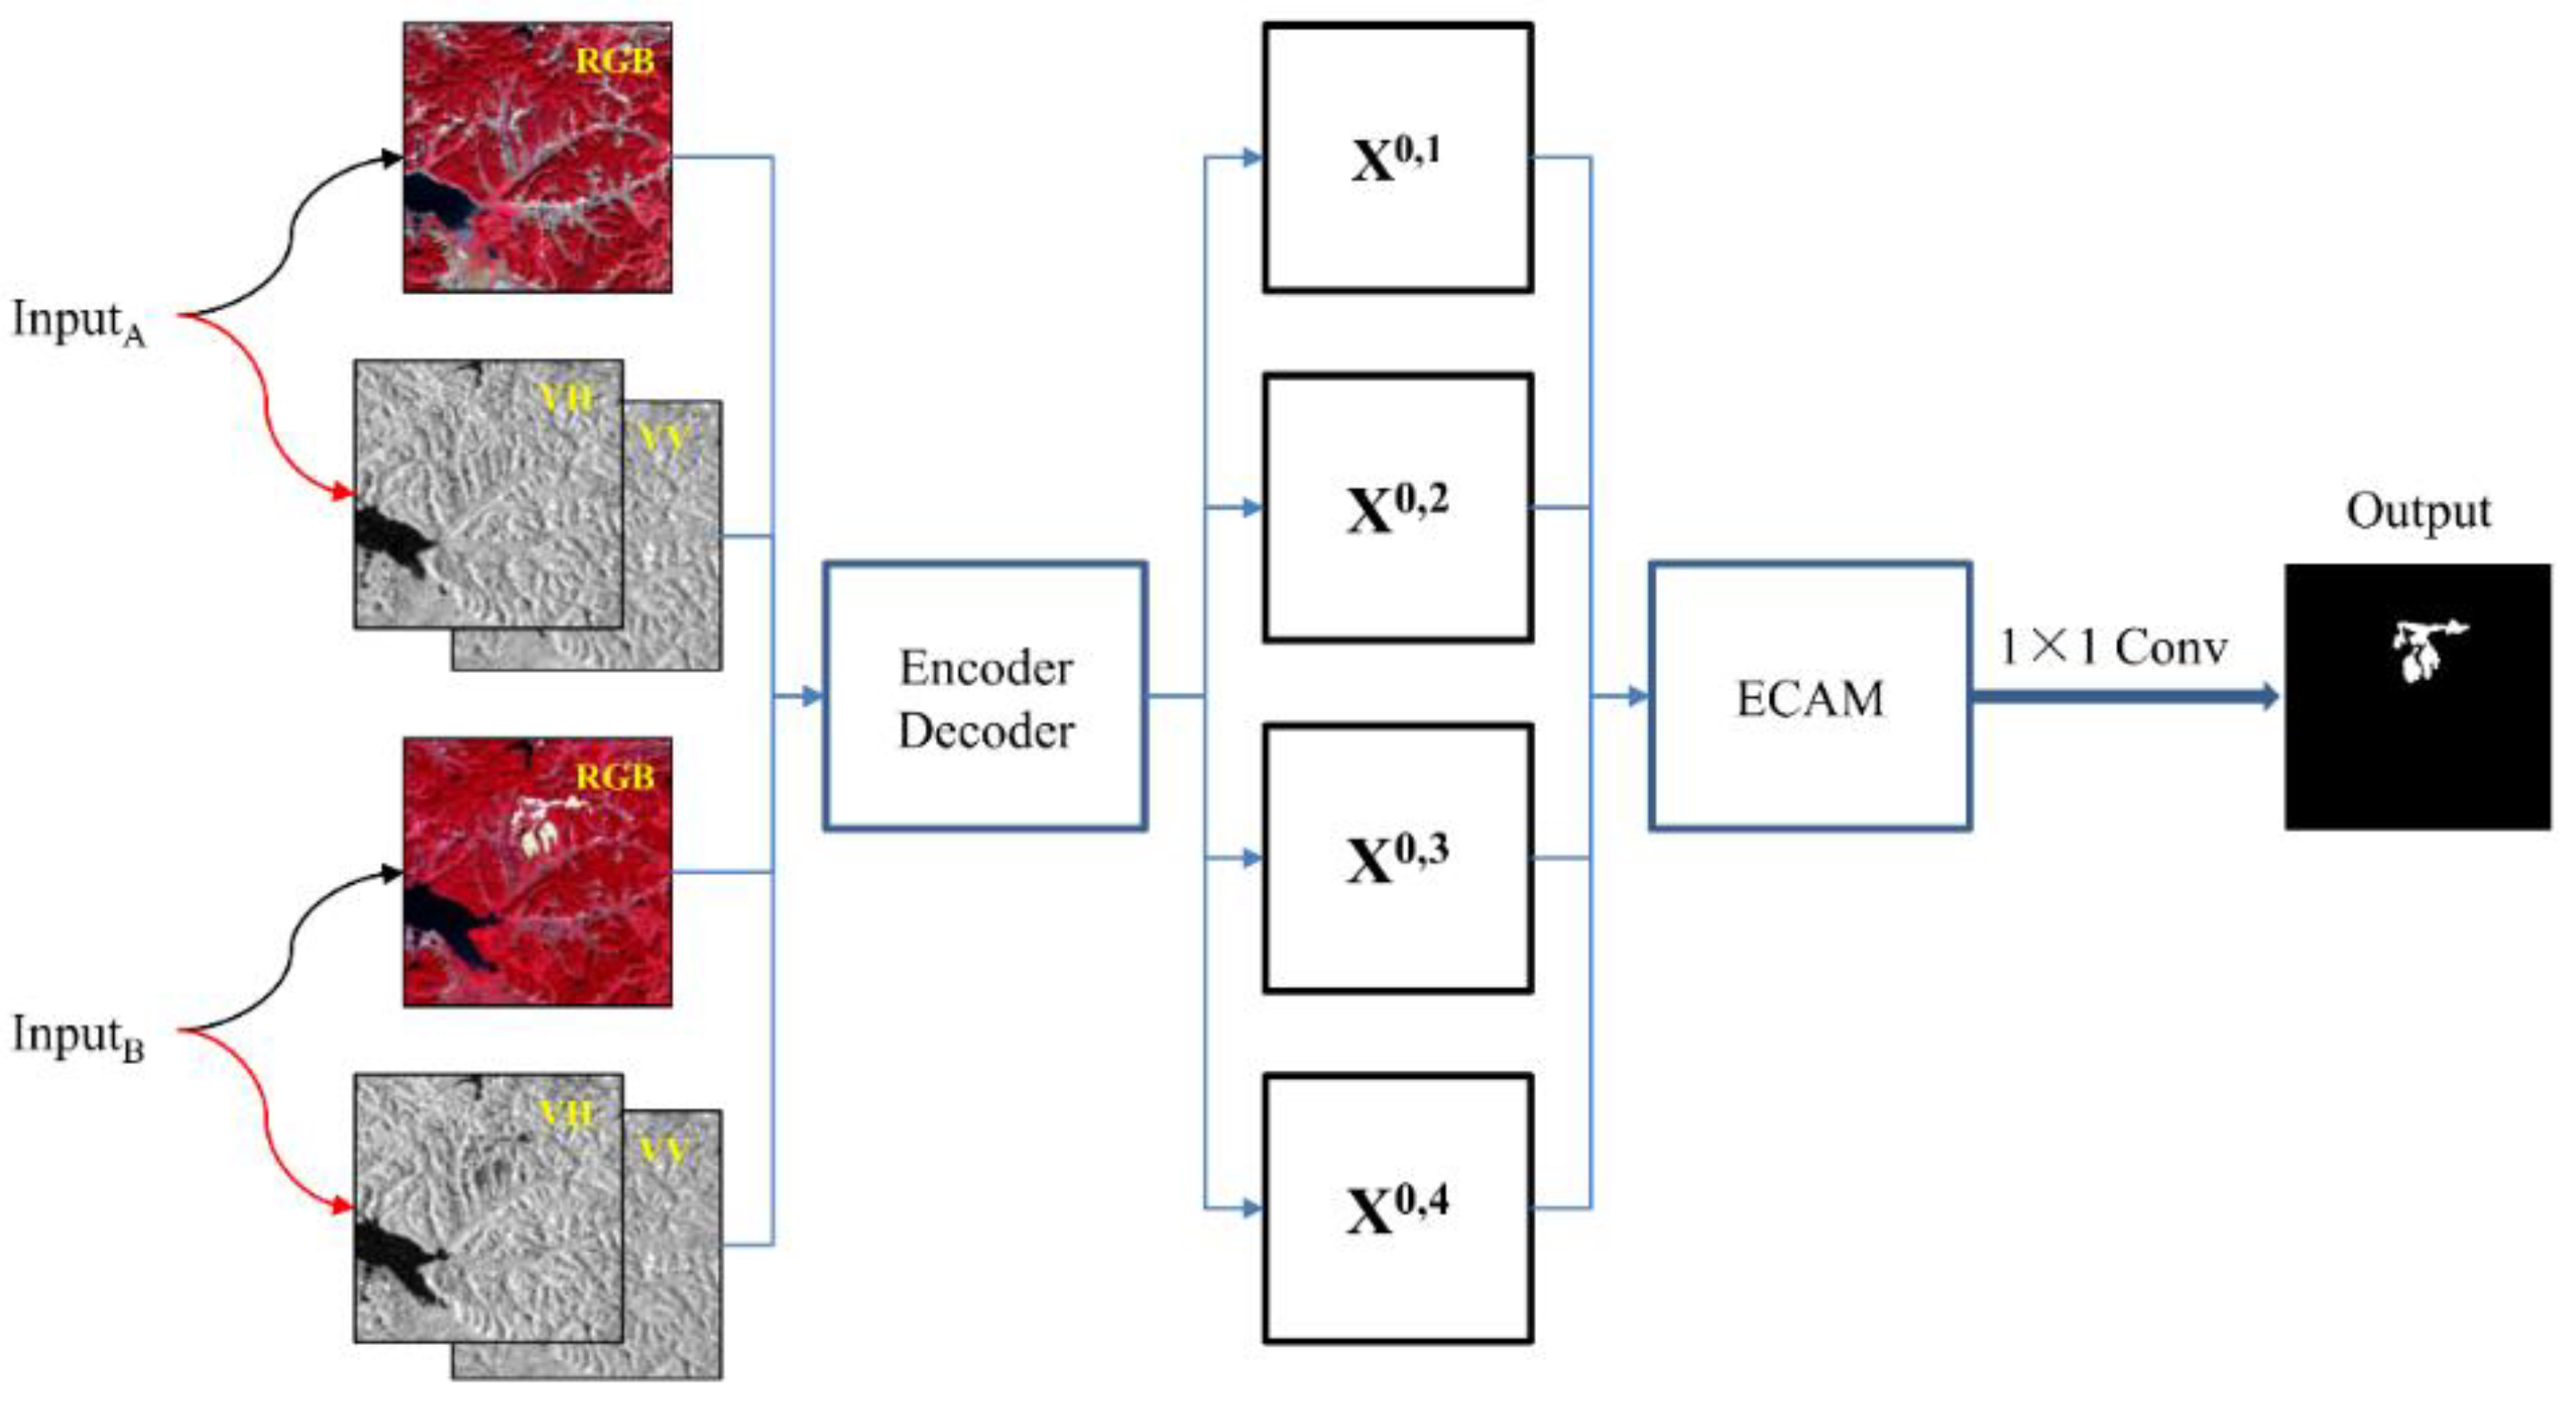
2.3.3. Complete DSNUNet Structure

The DSNUNet, as a variant of the SNUNet-CD model [19], returns four outputs of the same scale as an input image at the end of the network. A common practice was to use the deep supervision method to calculate the loss value of the four outputs separately and backpropagate them to calculate the full gradient [27]. To merge the shallow and deep in SNUNet-CD effectively, an ensemble channel attention (ECAM) block was introduced to select effective features suitable for automatic change detection. ECAM represents an extension of the channel attention (CAM) process [28]. Its structure is shown in Figure 5.
After adding ECAM to the end of the decoder, the pipeline of the DSNUNet is obtained, as shown in Figure 6. After processing the four outputs of the decoder {X0,j, j ∈ {1, 2, 3, 4}} using ECAM to obtain valid fusion features, a 1 × 1 convolutional layer was used to output the final change map.

2.4. Loss Function

Sample imbalance is common in change detection tasks, where the percentage of pixels in a change region is much smaller than that in an invariant region. Therefore, to make the detection model focus more on the change region extraction in training, it is necessary to balance the weights of change and invariant regions when calculating the loss. A hybrid loss function consisting of focal and dice losses is used to improve the change detection performance of a model. The focal loss represents an improved loss function based on the standard cross-entropy loss, which is used to reduce the weights of easily classified samples and improve the model’s focus on change regions [29]. In contrast, the dice loss is a loss function used to balance positive and negative samples in image segmentation, but it can face instability in the training process [30]. The combination of these two loss functions can help improve the segmentation performance and training stability of the model for change region detection. The hybrid loss function is expressed as follows:
L = L focal + L dice   ,
L focal = α ( 1 p ) γ log ( p ) ,
p = p   if   Y = 1 , 1 p   otherwise   ,
L dice   = 1 2 Y softmax ( Y ) Y + softmax ( Y ) ,
where α and γ are hyperparameters used to balance positive- and negative-sample weights. In DSNUNet, α and γ were set to 0.25 and 2, respectively; p is the probability; Y is the ground truth’ Y is the change map of the model output.

2.5. Evaluation Metrics

In change detection tasks, Precision, Recall, and F1-score are commonly used as evaluation metrics to evaluate the detection accuracy of a change region versus an invariant region. Since Precision and Recall are negatively correlated, the F1-score was used to evaluate the model performance in a comprehensive manner. The Precision, Recall, and F1-score are expressed as follows:
P r e c i s i o n = T P T P + F P ,
  R e c a l l = T P T P + F N ,
F 1 = 2 P r e c i s i o n * R e c a l l P r e c i s i o n + R e c a l l ,
where TP denotes the number of change regions correctly predicted by the model; FP is the number of invariant regions incorrectly predicted as change regions; and FN denotes the number of change regions incorrectly predicted as invariant regions.
The computational complexity of different algorithms was compared using the number of parameters (Params) and the number of floating point operations (FLOPs) of the models.

2.6. Implementation Details

The hardware platform used in the experiments consisted of an Intel Core i7-10700KF 16-core processor @ 3.80 GHz (Intel, Santa Clara, CA, USA) and an Nvidia GeForce RTX 3080 graphics card with a 32-GB running memory (Nvidia, Santa Clara, CA, USA). The software included Python and Pytorch as a programming language and deep learning framework, respectively.
The same hyperparameters and training approaches were used in all experiments. Simple data augmentation (random horizontal, vertical flips, and diagonal mirroring) was adopted in the model training phase and test-time augmentation (TTA) in the model testing phase to improve the model prediction performance. The initial learning rate was set to 1 × 10⁻⁴, while decay was set to 1 × 10⁻⁵ at the 50th epoch. The weights of each convolutional layer in DSNUNet were initialized using the KaiMing normalization. To ensure the reproducibility of the model, the same random seeds were used in all experiments. Only the model with increased F1-Score in the validation set was retained in the training phase.

3. Results

The performance of the proposed DSNUNet model was validated using a series of experiments. This section presents the results of the evaluation metrics and several comparison methods, as well as the implementation details.

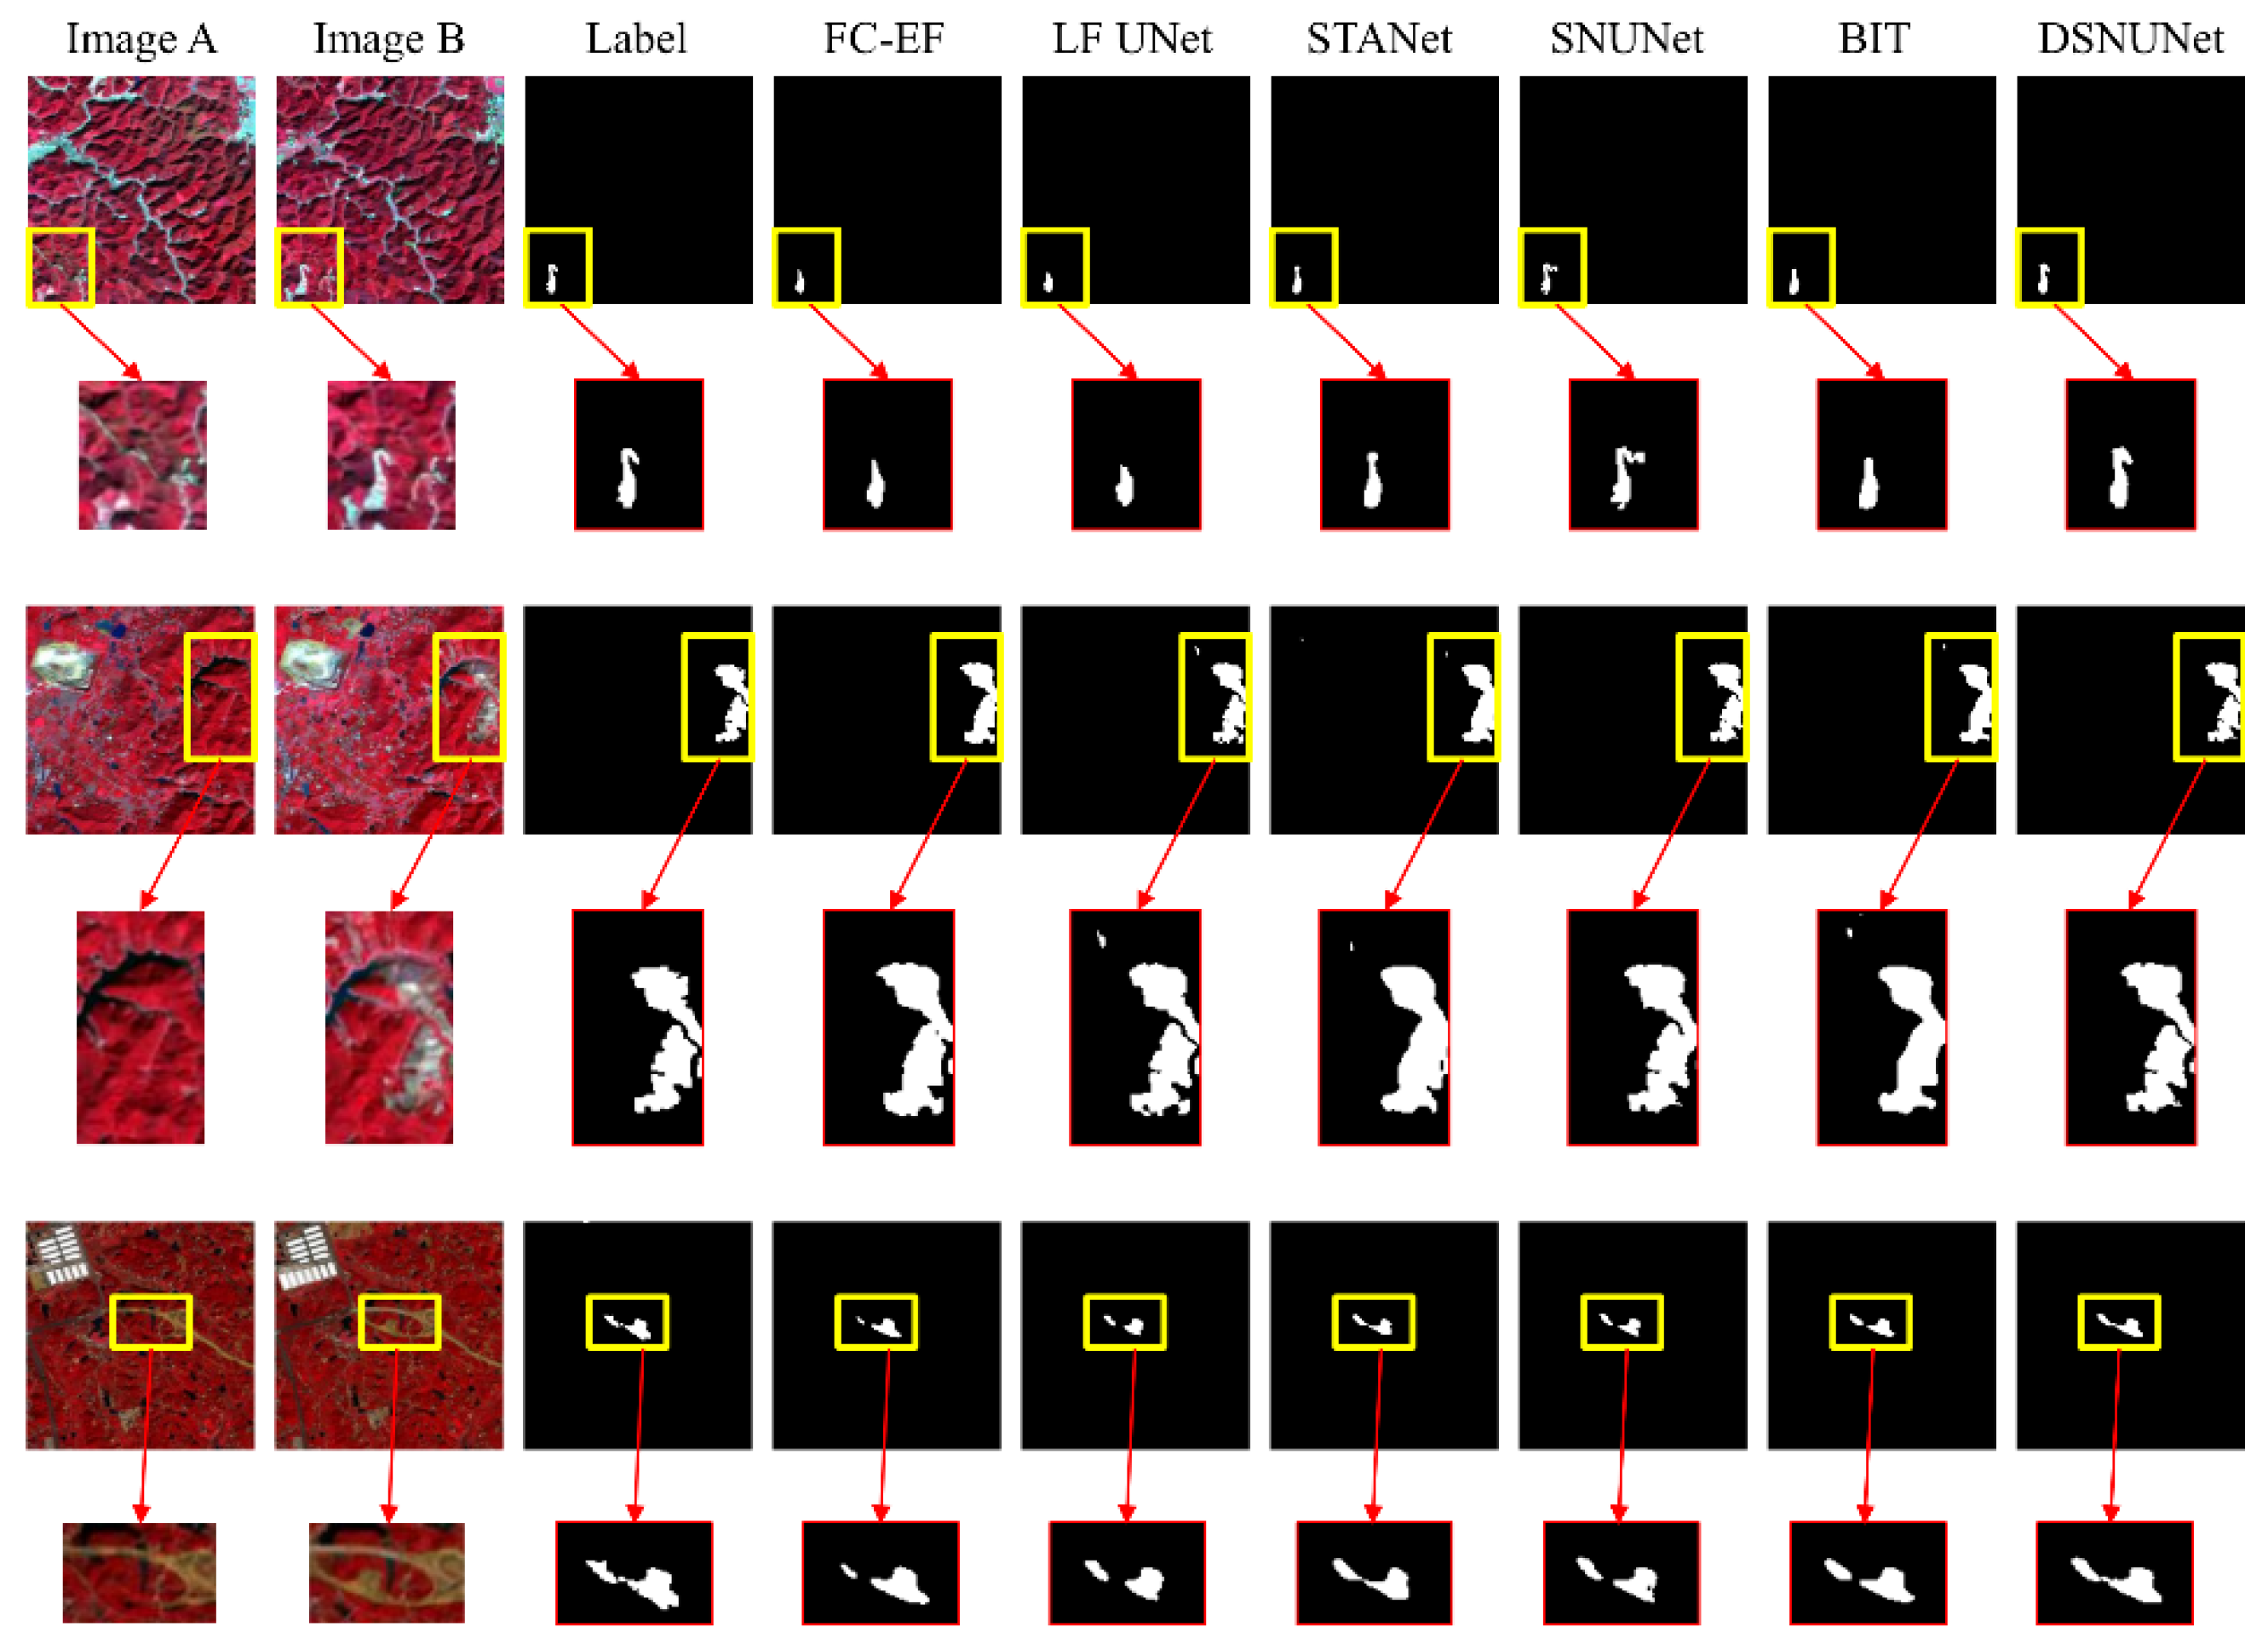
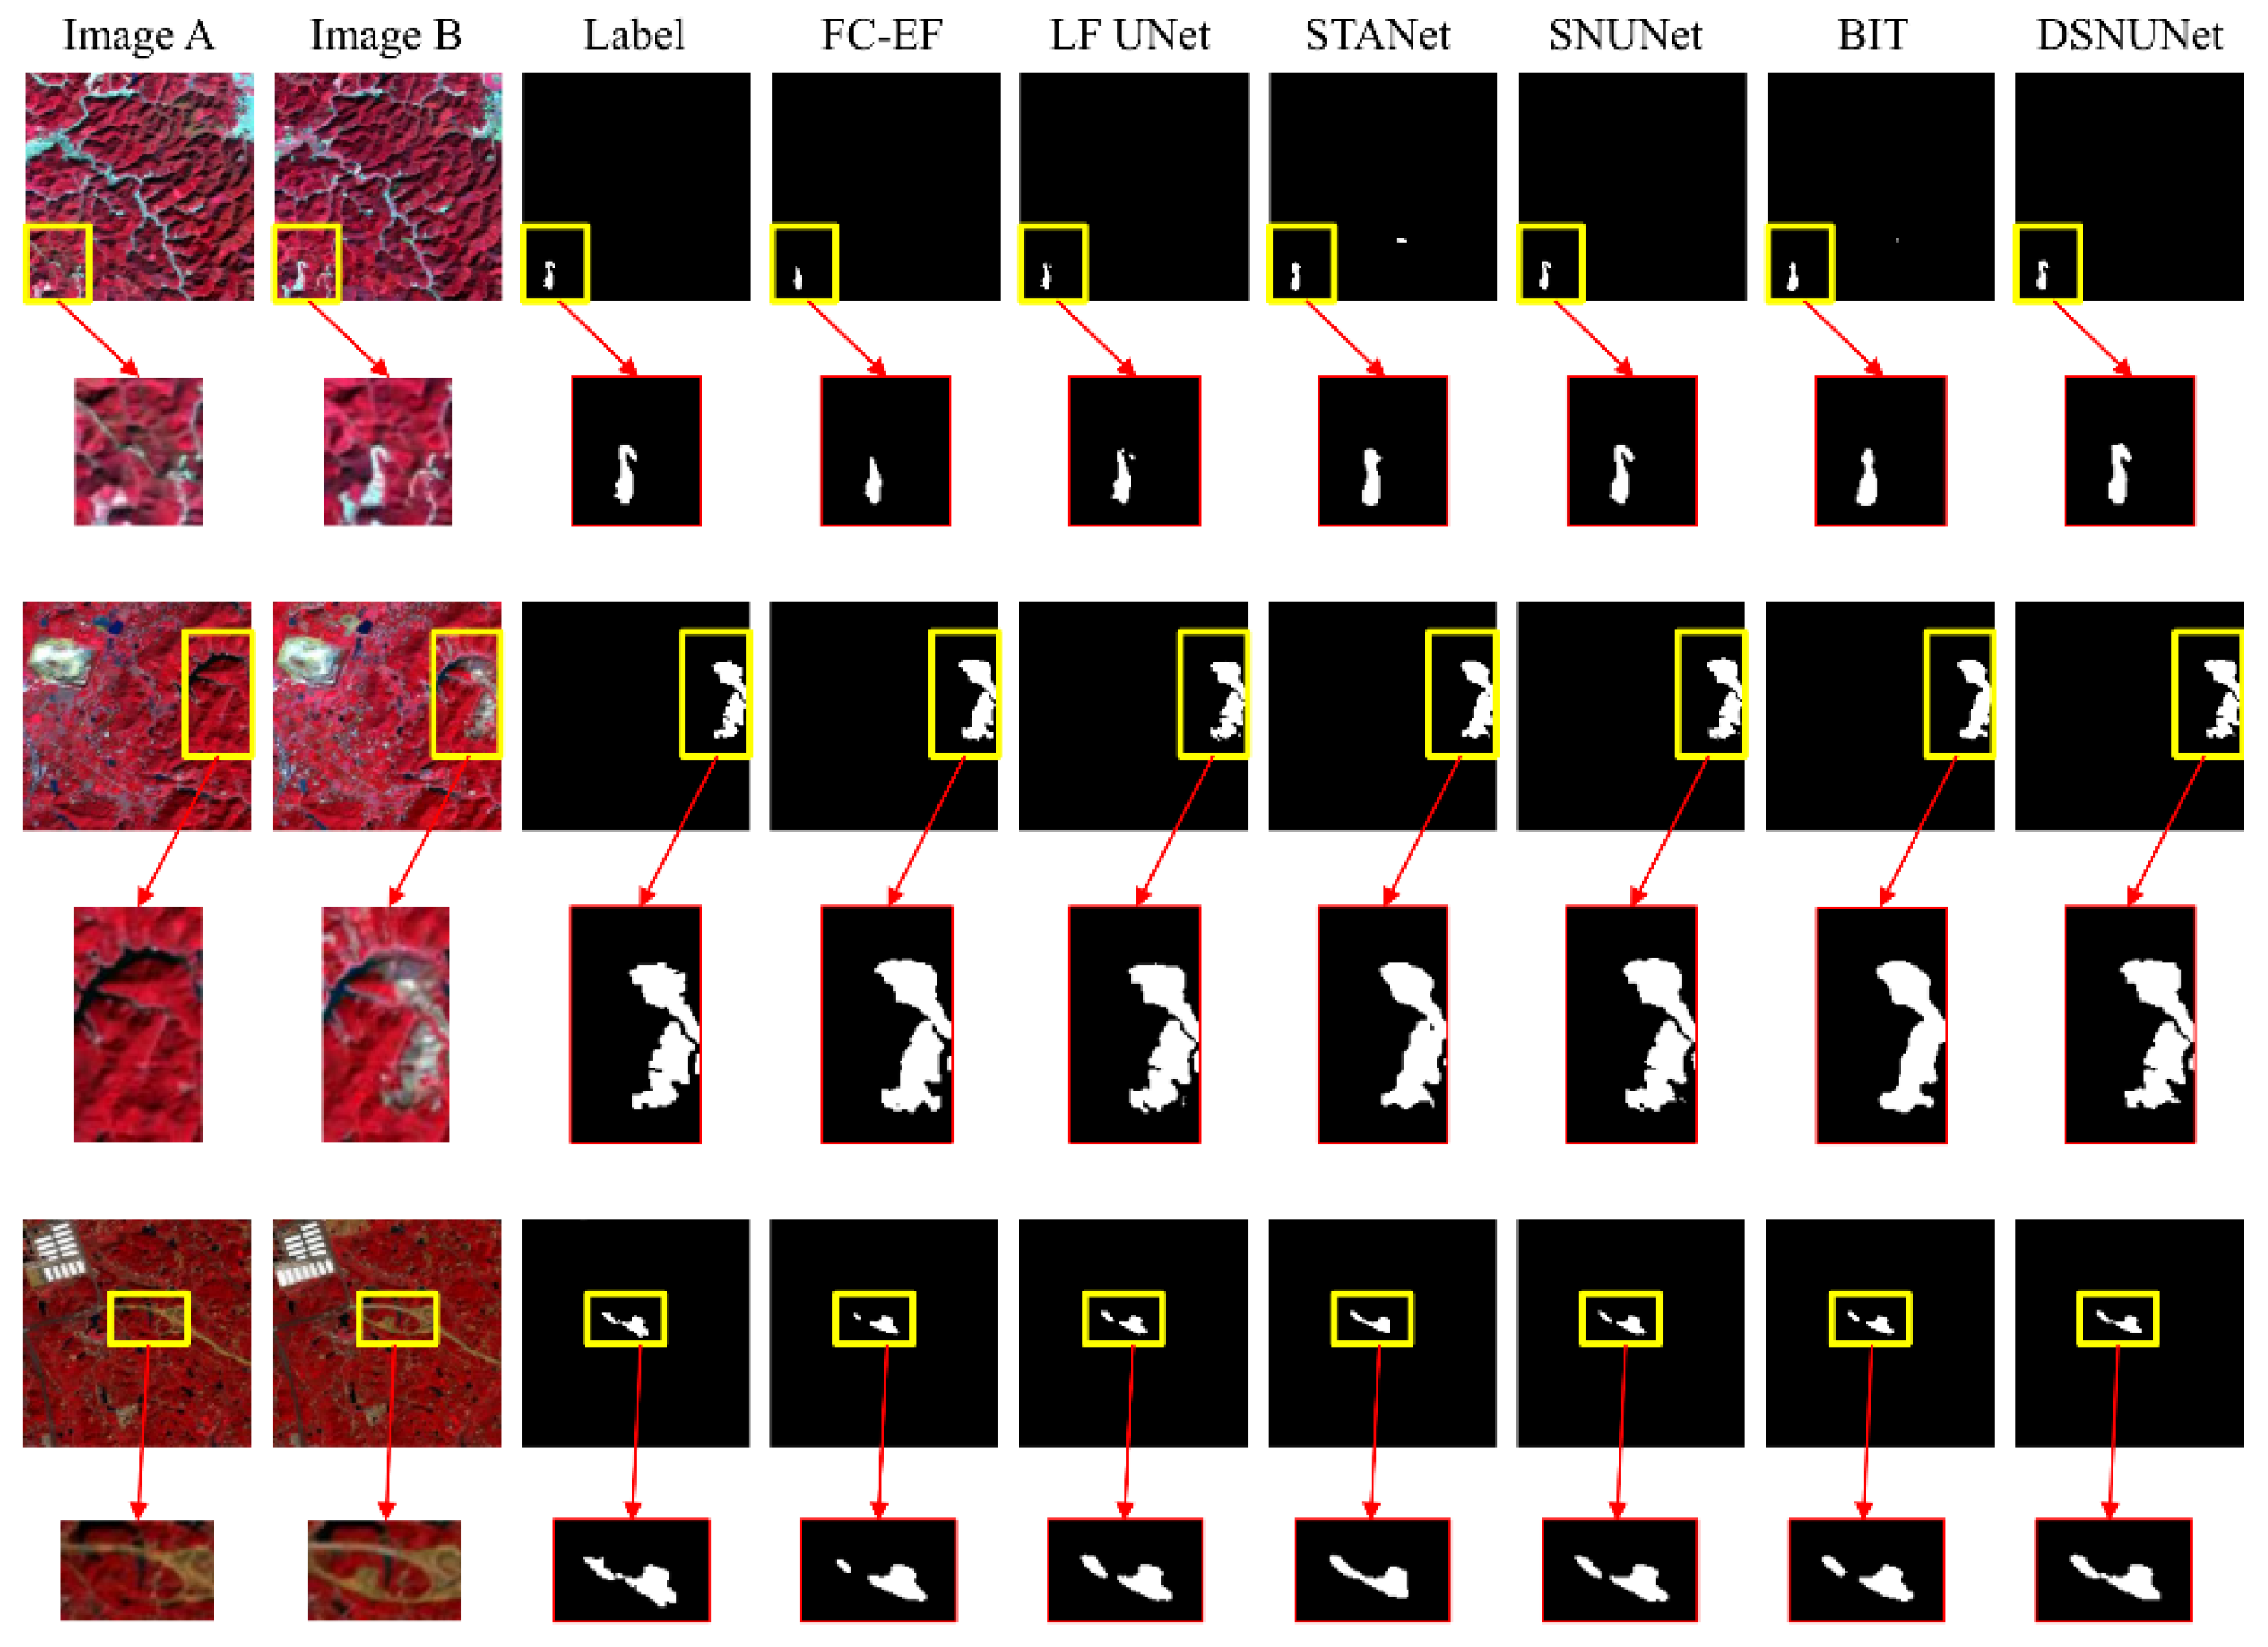
3.1. Comparison of Different Models

To assess the effectiveness of the proposed DSNUNet model, the obtained results were compared with those obtained using different deep learning-based change detection models. First, the change detection results obtained using the DSNUNet model were compared with those obtained using the FC-EF, FC-Siam-Conc, and FC-Siam-Diff models, which are classical models [14]. Next, LF UNet was used for forest change detection, which is an improved UNet deep model for revealing forest changes using Landsat imagery [26]. The attention-based STANet and SNUNet models, which use a spatiotemporal attention module and an integrated channel attention module [17,19], respectively, were then compared with the proposed DSNUNet. It should be noted that the proposed DSNUNet model represents an improved version of SNUNet, where a SAR branch is added to the model structure. Finally, the proposed model was compared with the transformer-based change detection model (BIT) [20]. BIT is an efficient model designed according to the advantages of the transformer model for effectively modeling global information. Previous experiments on high-resolution public datasets have demonstrated that BIT outperforms most traditional convolutional models.
Most of the change detection models have been developed using only optical images; the performance of the proposed DSNUNet model using SAR imagery was compared with other models that are based only on optical imagery information. The accuracy metrics and model complexity of DSNUNet and other models in the test step are presented in Table 3 and Figure 7, where it can be seen that the DSNUNet achieved more accurate results than the other models.
To assess the effectiveness of adding SAR data to the change detection model, the input-side improvements were introduced into the other models. For the input of VV and VH channels in SAR data, the initial convolutional layer parameters of the other models were adjusted to accommodate the SAR data. VV and VH were used as additional bands of an image with an optical image, forming a five-channel input for change feature extraction. The accuracy metrics and model complexity of DSNUNet and other models in the test step incorporating SAR imagery information are presented in Table 4 and Figure 8. The results showed that DSNUNet achieved more accurate results than the other models that incorporated SAR image information.
After adding SAR images to the test data as additional information, the performance of most models was improved to different degrees, indicating that the SAR image data could be helpful in improving the performance of the change detection algorithm. However, DSNUNet still had the advantage in accuracy over the other models. This finding demonstrated that introducing independent SAR image feature extraction branches to the proposed model can effectively improve the information utilization of SAR images by the change detection model.

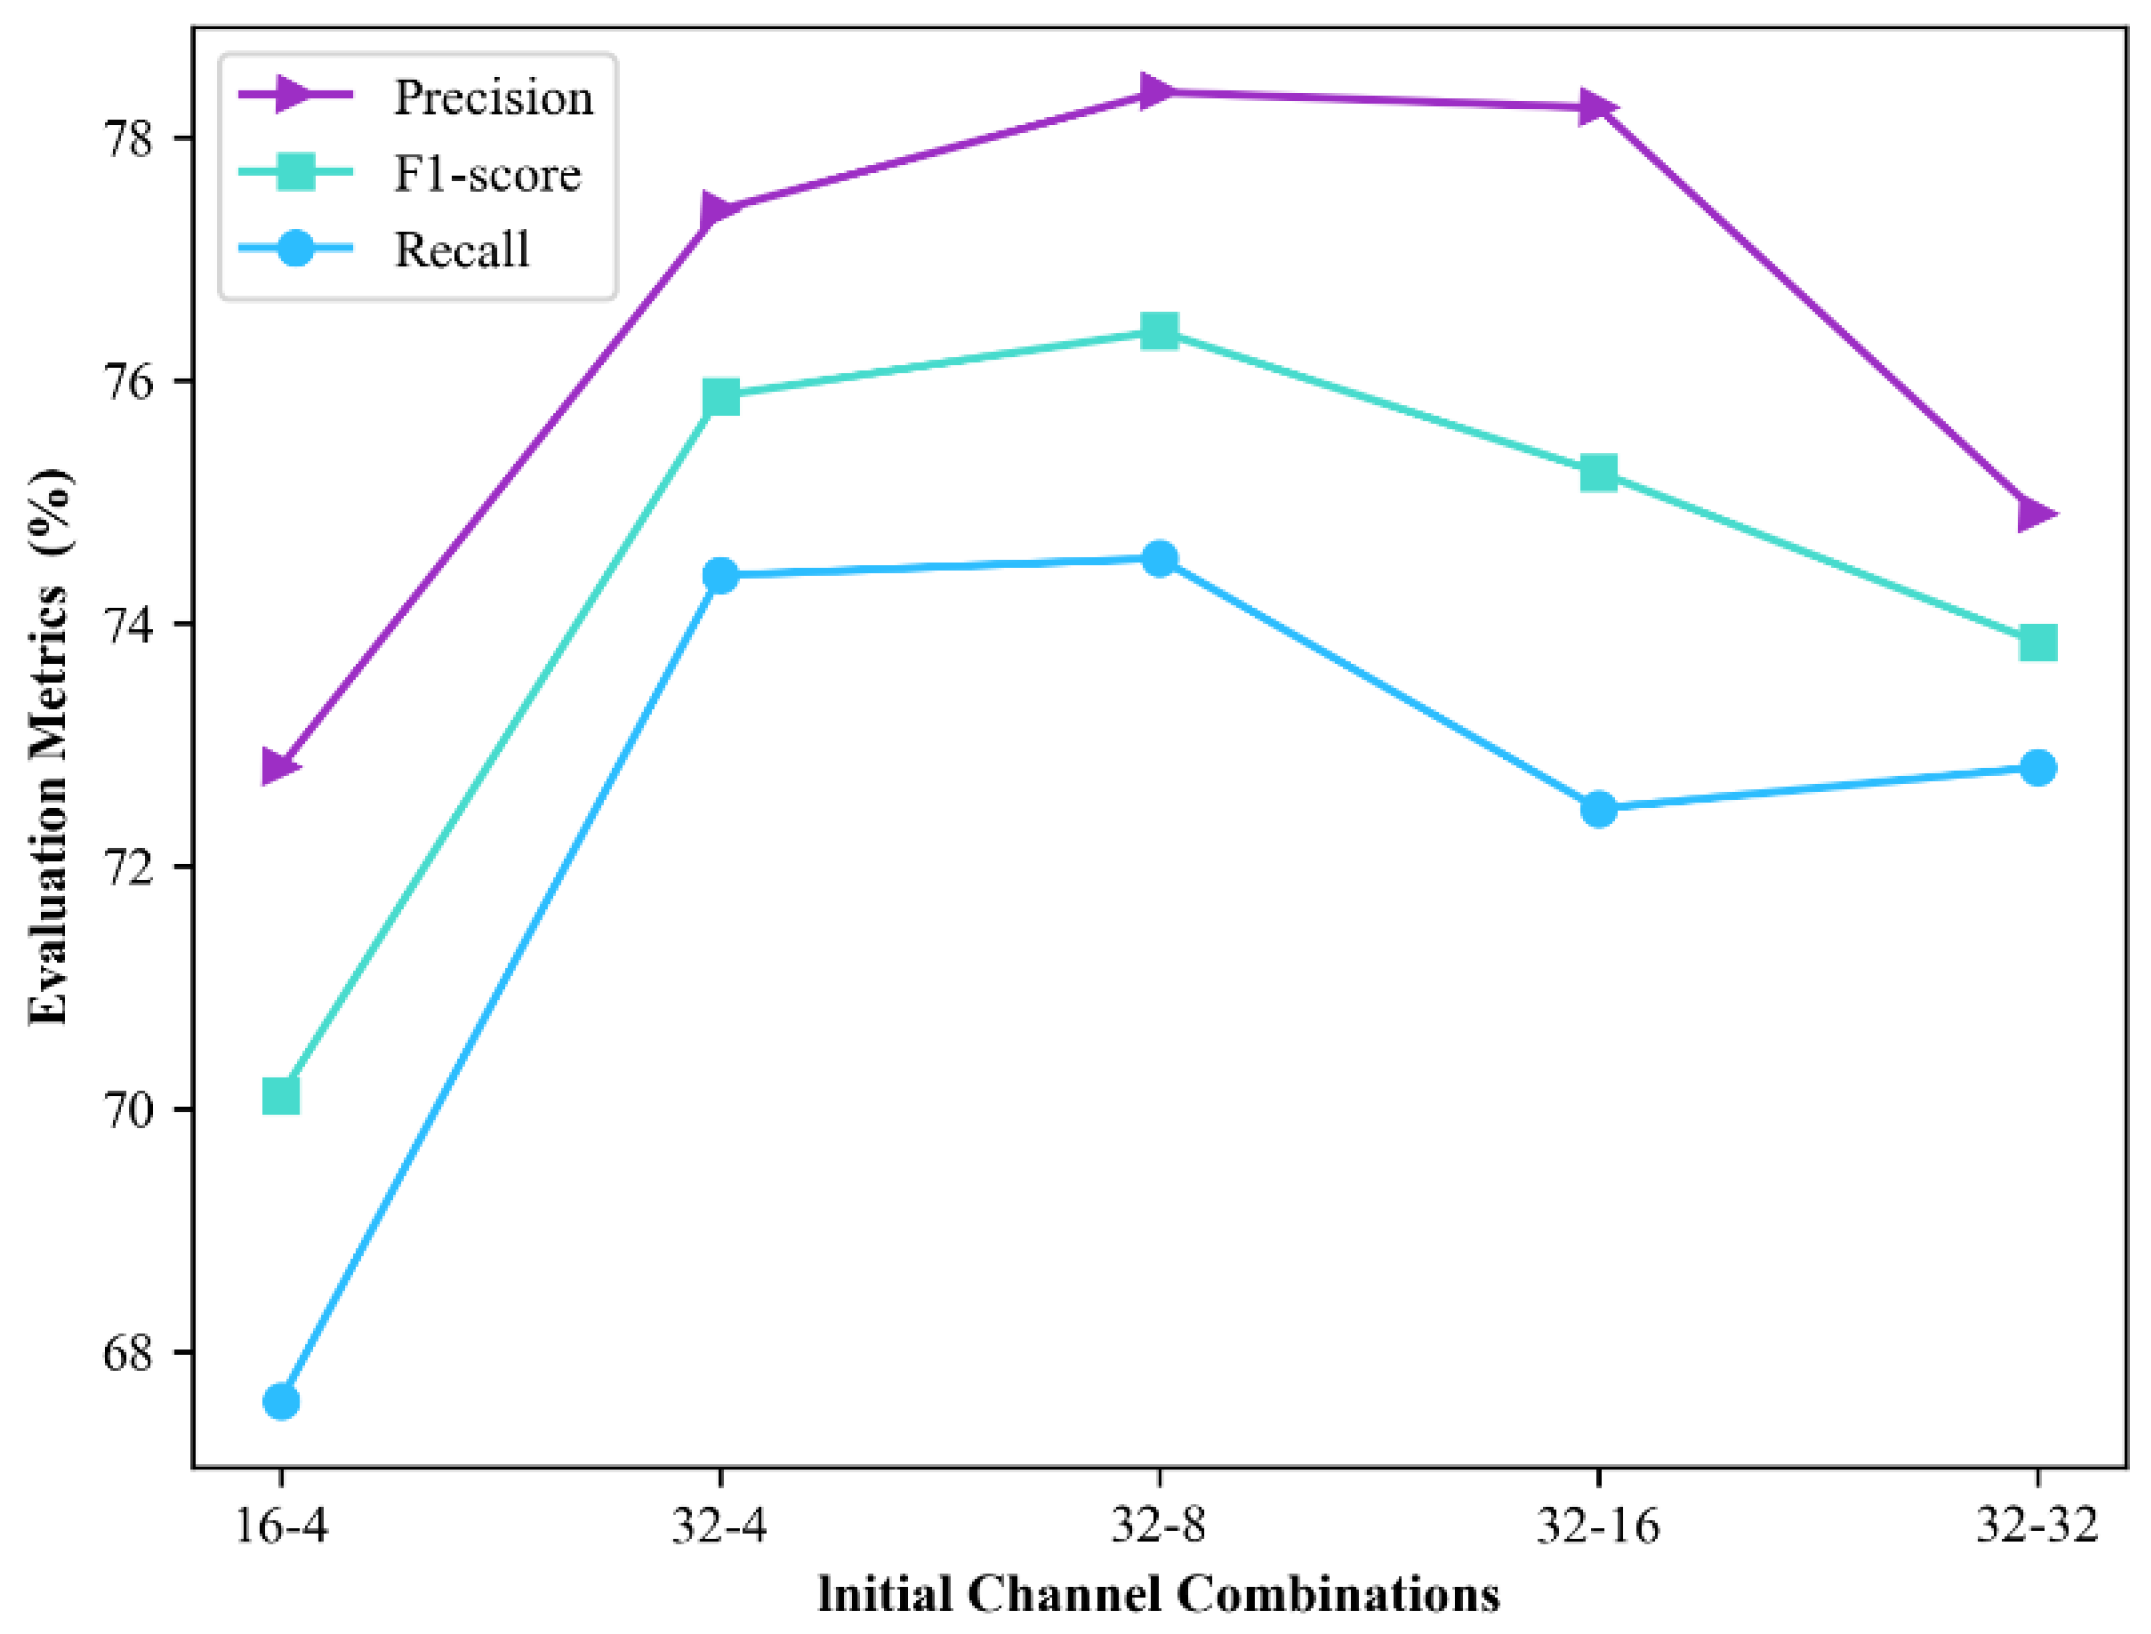
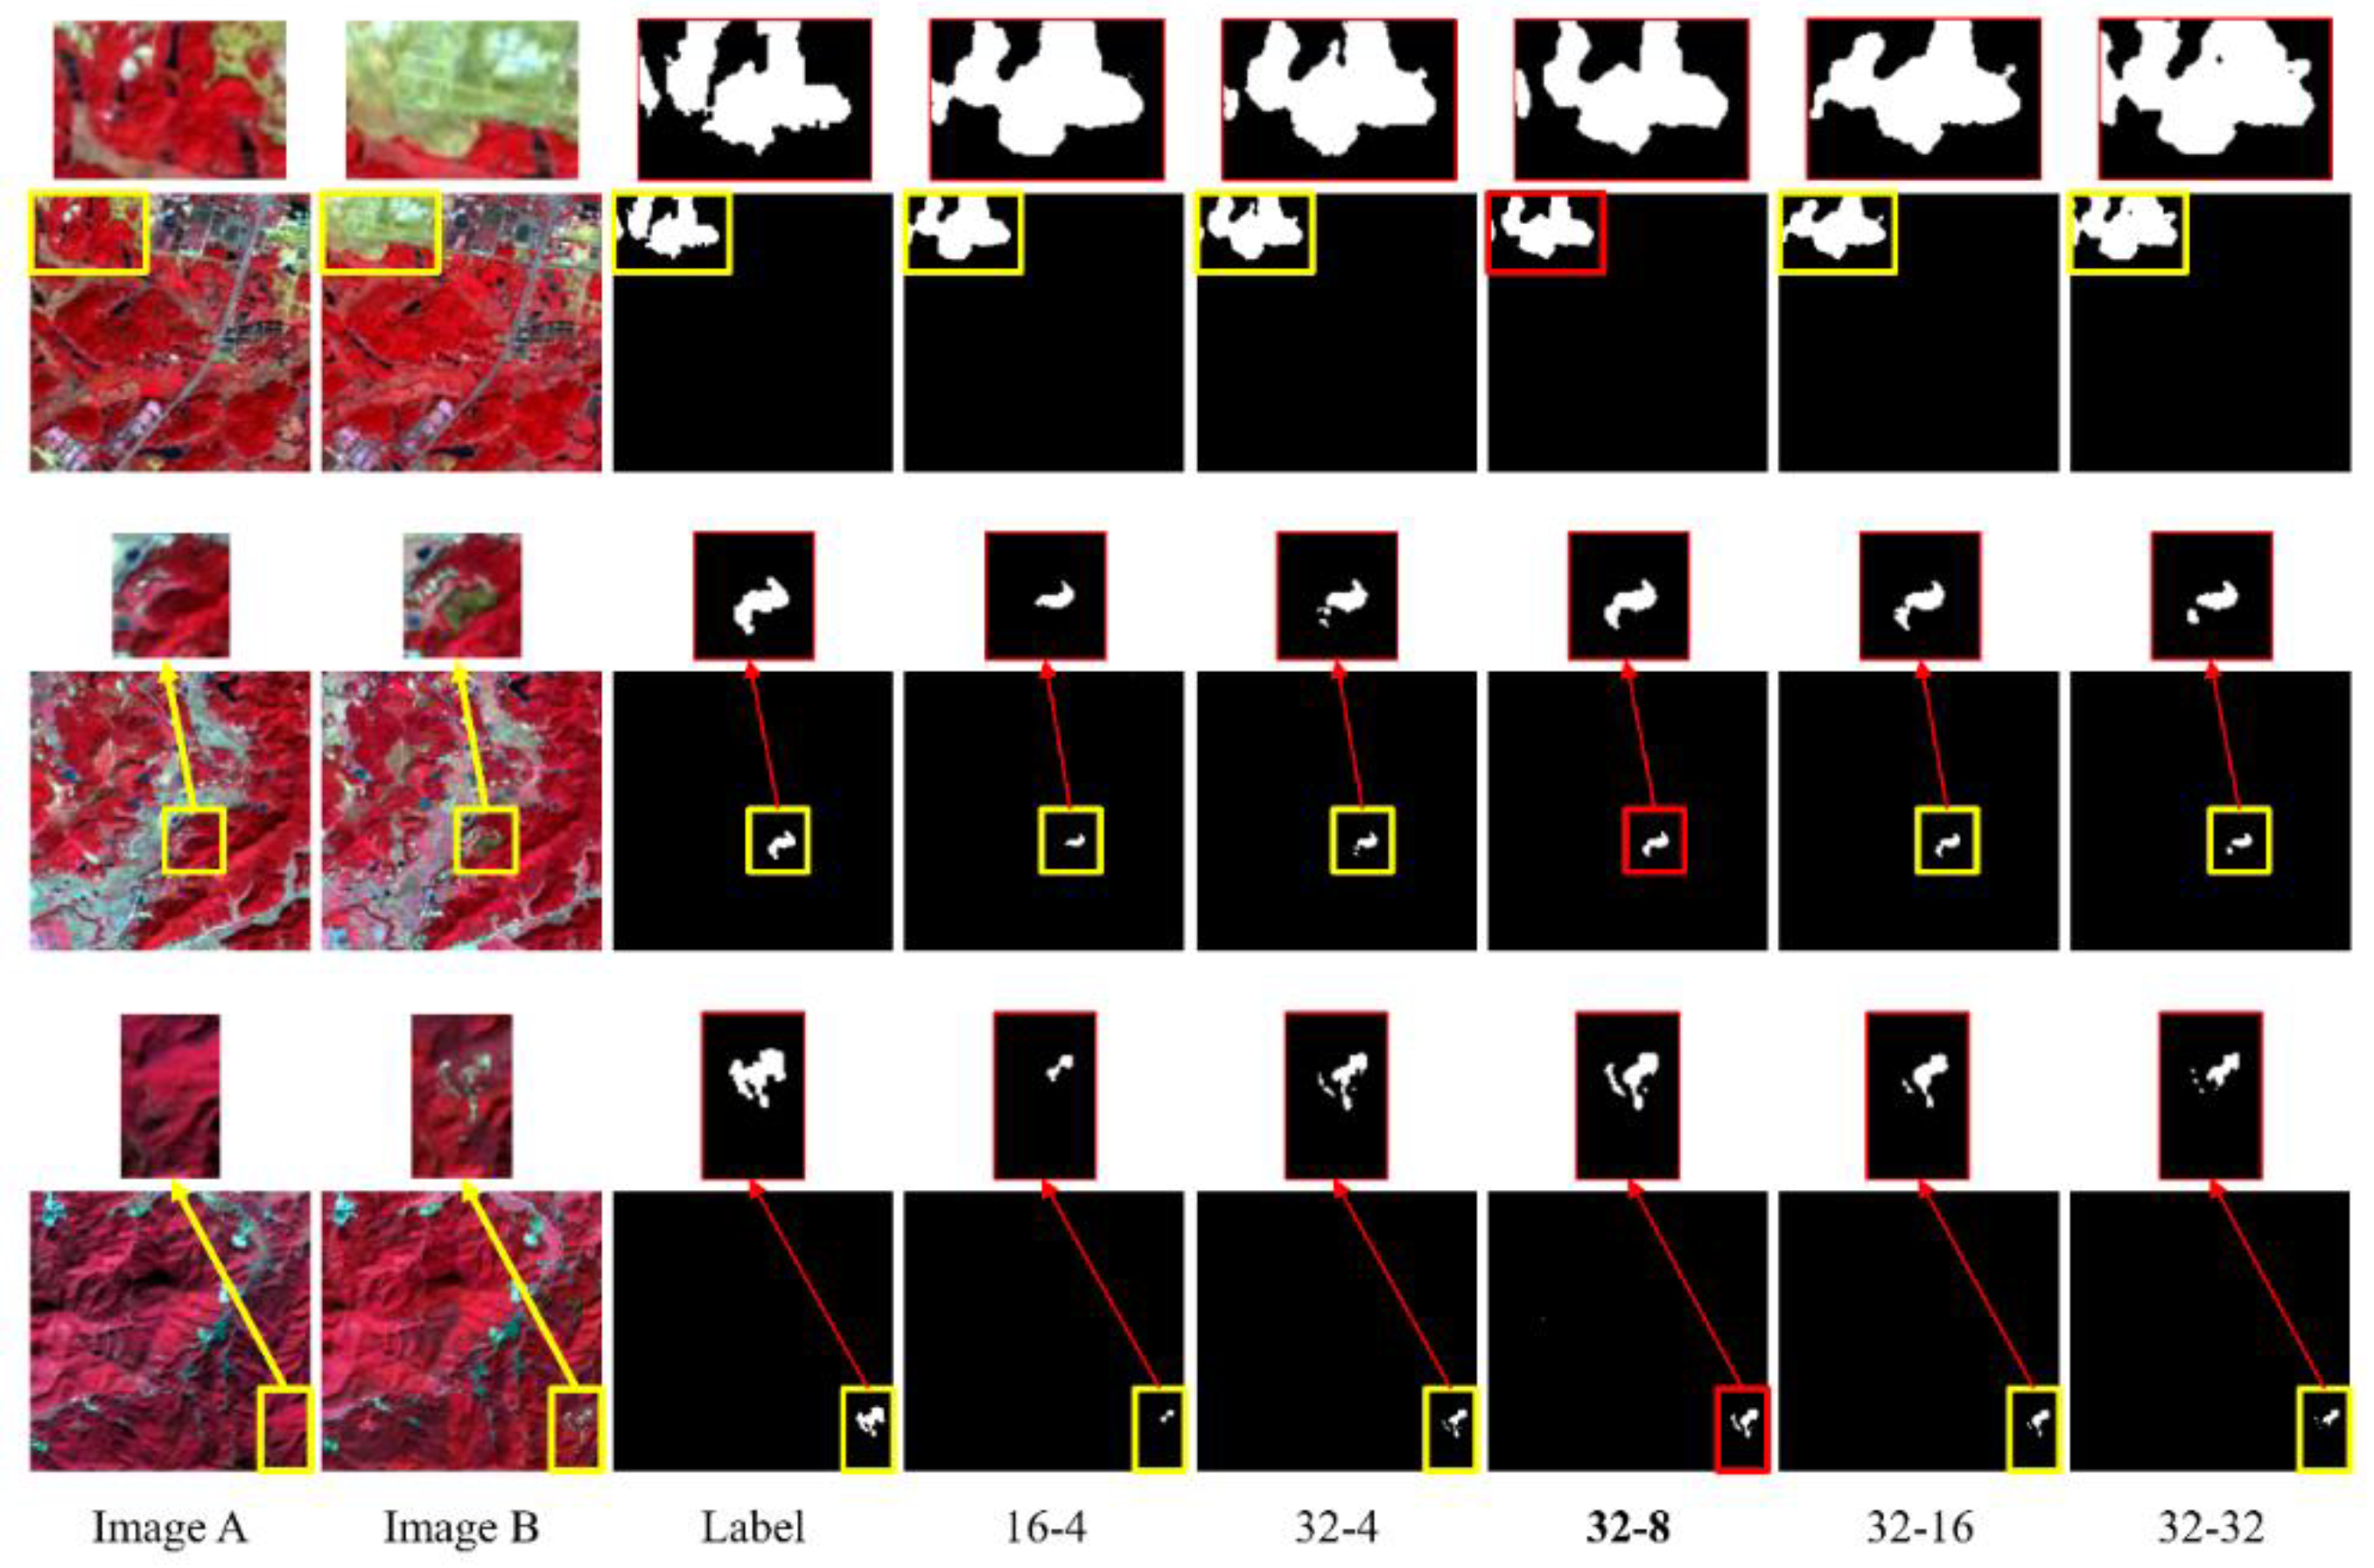
3.2. Comparison of Different Channel Combinations

In model design, a key problem that is often overlooked is the width value of a feature extraction network. Indeed, the feature complexity of optical and SAR images is different. Therefore, extracting the SAR image feature using the same width as for the optical branch may bring redundant features to the SAR branch. Conversely, extracting the optical image features using the same width as for the SAR branch may cause a lack of feature characteristics.
In DSNUNet, different initial channel numbers were set in the encoder for both optical and SAR images. To determine the optimal feature channel combination, several experiments were conducted to assess the performance of DSNUNet using different combinations of initial channel numbers in the two branches. In the two branches, the number of channels of features revealed a lineal increase. The accuracy metrics and model complexity of DSNUNet in the test step for different initial channel number combinations are presented in Table 5.
In terms of accuracy-related metrics, the combination of “32-8” revealed the best performance (78.37% Precision, 74.53% Recall and 76.40% F1-Score). As the number of initial channels of the optical image branch increased, the model performance showed a significant improvement, which was due to the complexity of the optical image features. As the initial channel number of the SAR image branch increased, the model performance improved, reaching an optimal performance at an initial channel number of the SAR image branch of eight, and then the performance decreased with increasing the initial channel number of the SAR image branch, showing redundant branch features. The relationship between the number of initial channels and model performance is shown in Figure 9. The comparison of prediction results obtained in the test step for different channel numbers is shown in Figure 10.

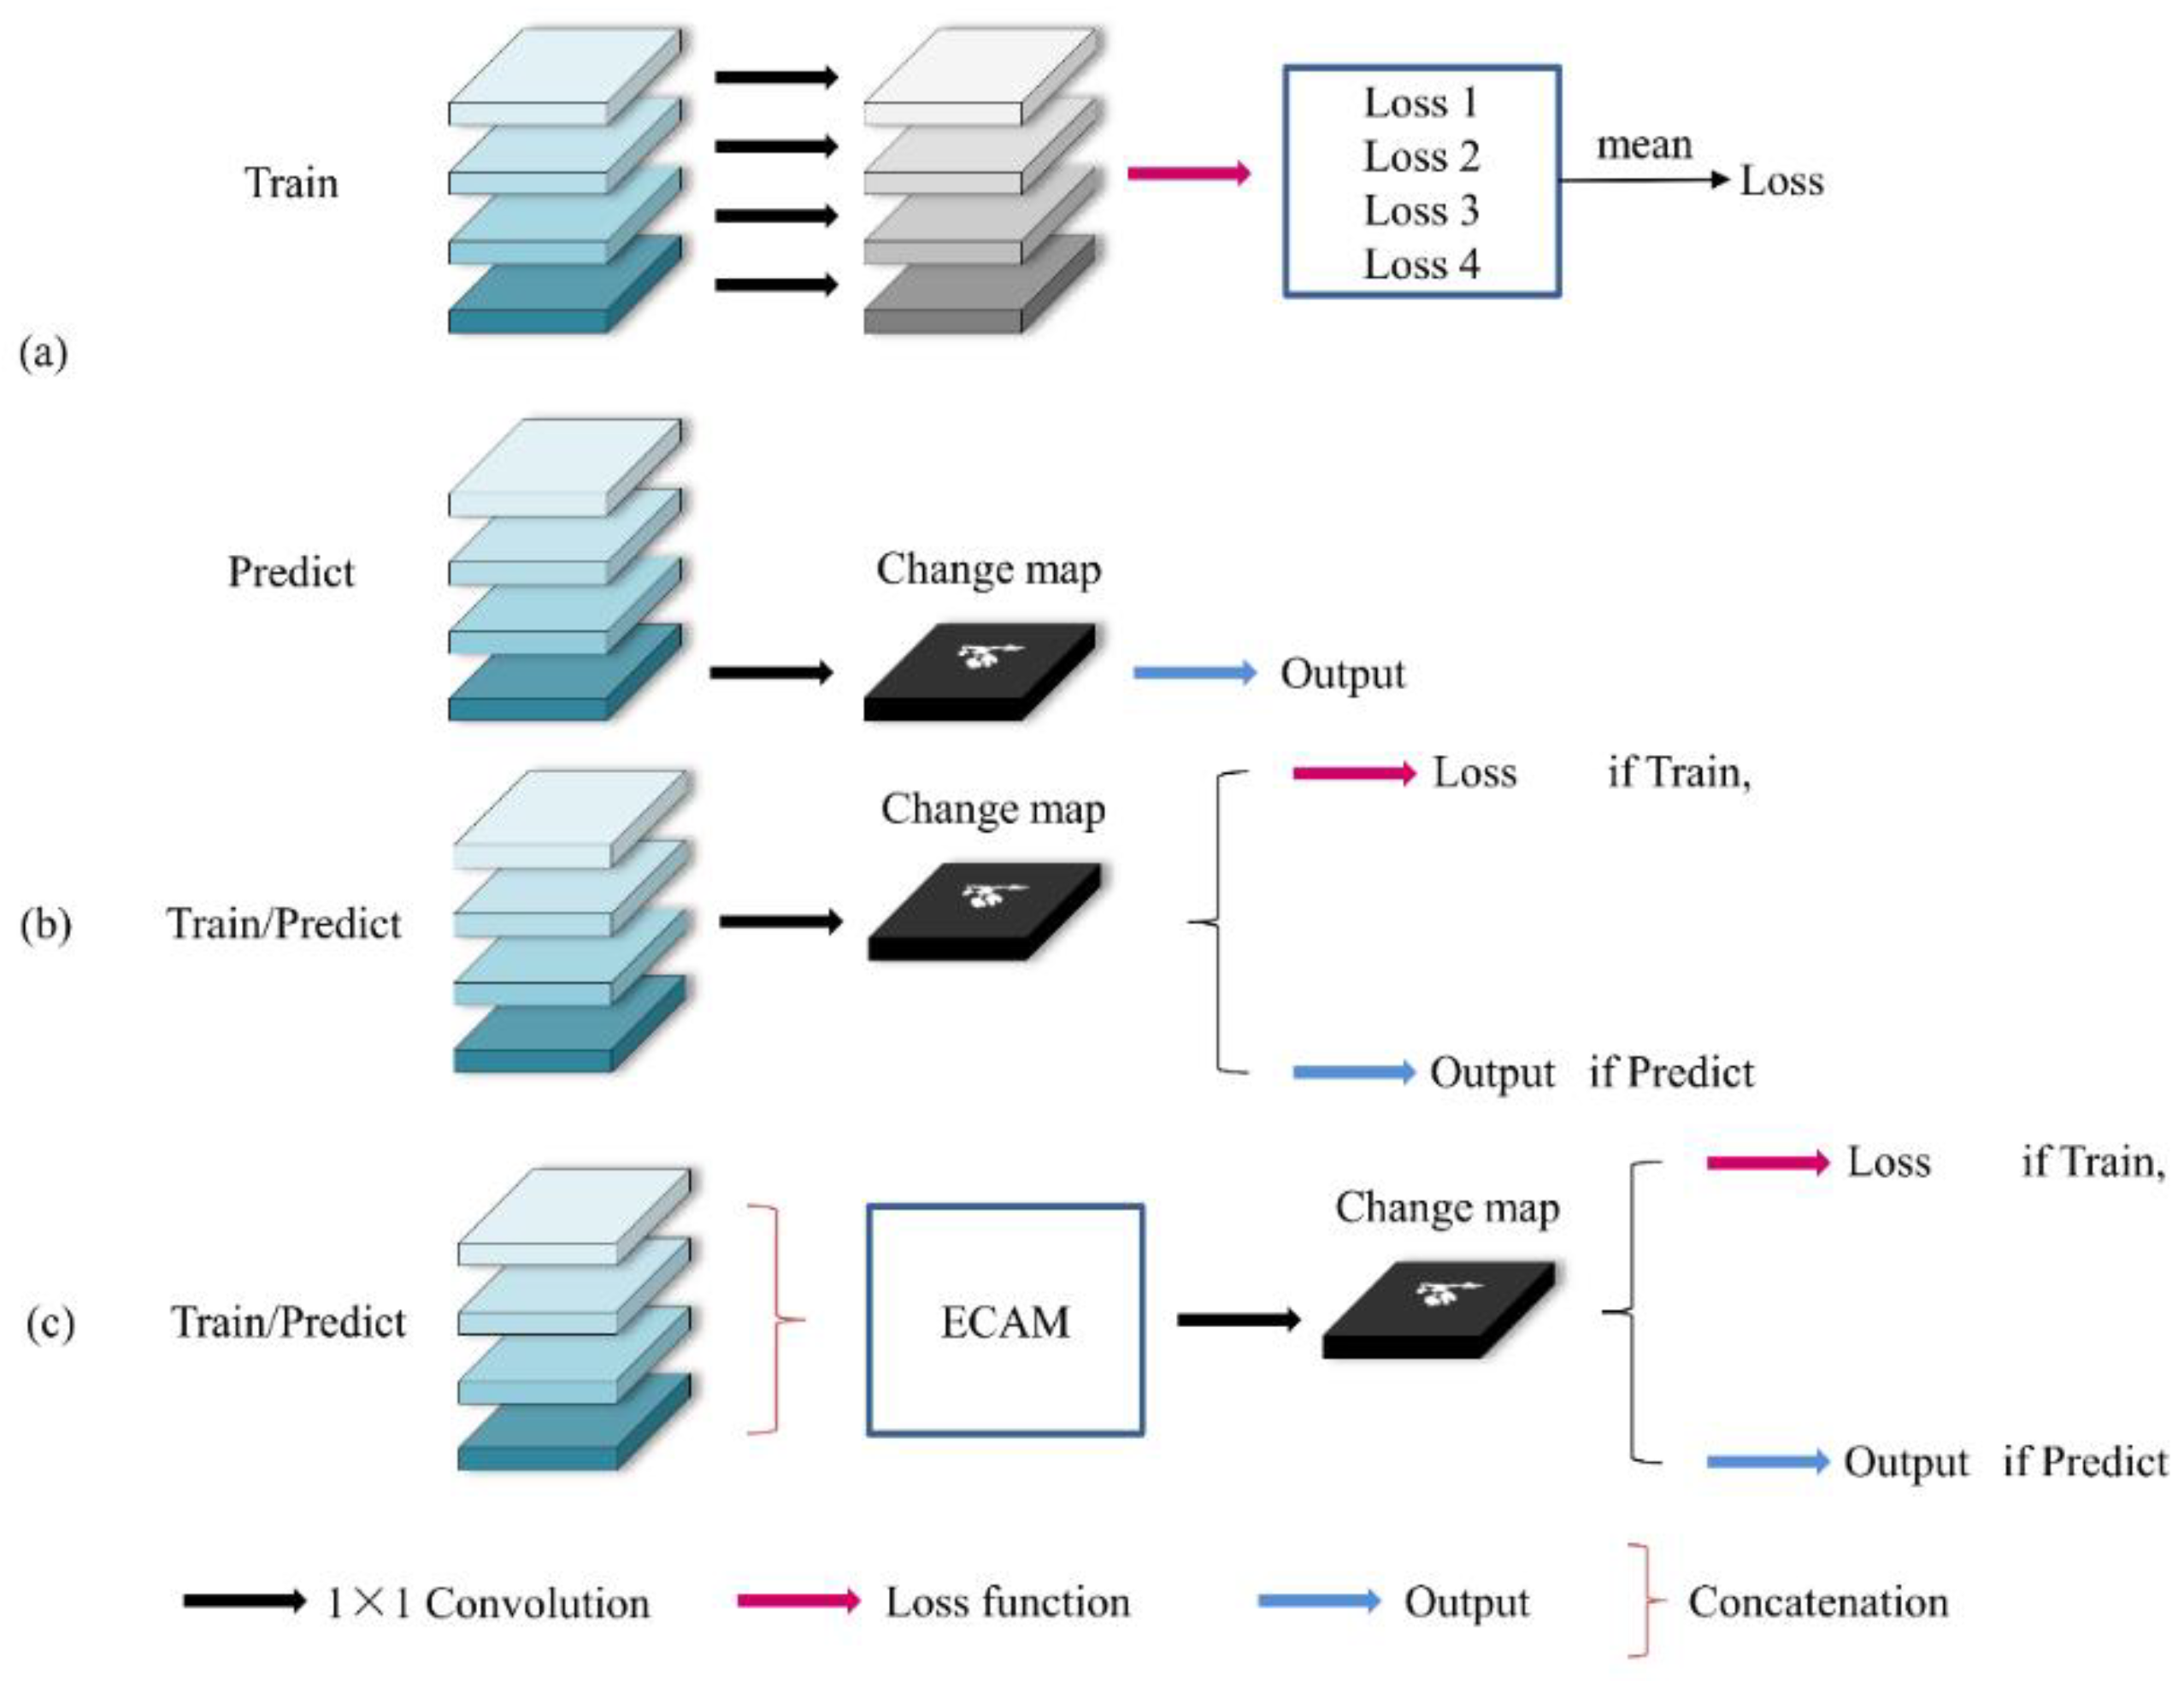
3.3. Comparison of Different Feature Fusion Methods

DSNUNet uses ECAM to perform feature fusion on the four outputs of the decoder. To assess the effectiveness of ECAM, several experiments were conducted to compare different methods of feature aggregation (i.e., deep supervision, 1 × 1 convolution, and ECAM). Deep supervision refers to outputting shallow features during model training to calculate the loss for the purpose of supervising the shallow features of a backbone network. The decoder of DSNUNet was consistent with Nested Unet [27]. Therefore, it was possible to use the feature co-training approach at different scales. However, this method only returns the final single feature map in the prediction phase, while the information on the intermediate feature maps cannot be completely used.
The 1 × 1 convolution is another common approach for a decoder backbone of the Nested Unet, which converts combined features into a final prediction map using a 1 × 1 convolution layer after merging multiple outputs in channel dimensions.
The workflow of different methods in the training and prediction phases is shown in Figure 11. The accuracy metrics of DSNUNet in the test step obtained using different feature fusion methods are reported in Table 6.
The results indicated that using ECAM as a tool for multi-scale feature aggregation could achieve optimal performance. The accuracy results obtained using ECAM were 74.53, 76.40, and 79.18% for Recall, F1-score, and Precision.

4. Discussion

In the first experiment, most change detection models reveal less accurate bounds and more pseudo changes in forest change detection. The SNUNet and DSNUNet models can provide good detection results. However, SAR image-based DSNUNet revealed closer prediction results to the observed data. BIT is a transformed-based change detection model that requires a longer training time and a larger training dataset for training than CNN-based models.
The introduction of SAR image data can provide more accurate forest variation characteristics. According to the obtained results, from Table 3, F1-Score, Recall, and Precision values of DSNUNet were 2.23, 3.62, and 0.63% higher than those obtained using optical images-based SNUNet, respectively (Table 3). However, the information complexities of optical and SAR image data were different. In addition, an effective fusion of multi-source remote sensing data can improve the change detection performance. However, the simple combination of optical and SAR images into multiple channels of input showed a slight improvement in most models. The results revealed higher F1-Score, Recall, and Precision values of DSNUNet than those obtained using optical and SAR image-based SNUNet by 1.65, 0.74, and 2.62%, respectively (Table 4). This is due to the fact that these models prematurely merged different information in the feature initialization step of the input, resulting in the SAR data’s value not being fully used. Therefore, DSNUNet uses two sets of Siamese branches to extract features from optical and SAR images, which can effectively explore the spatial and semantic information of different data and improve detection performance.
In the second experiment, it was found that the proposed model’s performance was optimal at 32 and eight initial channels in the optical and SAR image branch, respectively. DSNUNet using the 32-eight combination revealed Precision, Recall, and F1-Score values of 78.37, 74.53, and 76.40%, respectively. As shown in Figure 9, using several initial channels in the SAR image branch can cause redundancy in information, while selecting a moderate number of initial channels can help to obtain a compromise between the number of parameters and model performance. Figure 12 shows the variation in loss during training of DSNUNet with different initial channel combinations. With the increase of epoch, the loss value shows a gradual decline and tends to be stable, which shows that the DSNUNet model has excellent fitting ability for forest change data.
DSNUNet has stronger tolerance to clouds in images since SAR can provide images with high resolutions, even under cloudy conditions. As shown in Figure 13, the DSNUNet could suppress the pseudo-variation caused by cloud layers more effectively than other models. These cloud-covered images are not involved in the training, indicating that the characteristics of SAR images have resulted in more performant change detection of the model.
The following aspects could be addressed in future studies. First, the proposed model’s structure could be improved. Although DSNUNet uses two sets of branches to obtain different feature combinations, simple splicing has been used to merge information in the decoding stage. Moreover, the number of feature channels can dramatically change during the decoding process, which may cause information losses. Second, the feature extraction backbone of DSNUNet is relatively simple. Therefore, a more complex backbone could be used in the future to improve the model performance. Moreover, an attempt could be made to classify different forest change types for forest change detection, including dominant tree species that have changed and source of change (deforestation or fire). Finally, the increase in the forest area could be extracted to facilitate statistical analyses of related departments.

5. Conclusions

In this paper, a double Siamese network for forest change detection called DSNUNet was proposed. The DSNUNet model can be applied using two types of inputs, namely optical and SAR images. The SAR images, as a common data source in forest change detection, can effectively improve the effectiveness and robustness of a change detection model. Unlike simply combining two types of input images, DSNUNet uses two set coding branches of different widths to extract features from optical and SAR images to effectively use information from different data sources and performs information fusion by convolutional operations in the decoder stage. Compared with other change detection models, the proposed model revealed higher evaluation metrics (Precision, Recall, and F1-Score values of 78.37, 74.53, and 76.40%, respectively). According to the obtained results, DSNUNet can effectively merge the features of optical and SAR images, which is important for improving the performance of forest change detection. For areas that are permanently located in cloud cover, this study helps to improve the efficiency of forest resource surveys.

Author Contributions

J.J. wrote the manuscript and designed the comparative experiments; W.W. and D.M. supervised the study and revised the manuscript; Y.X. and E.Y. revised the manuscript and gave comments and suggestions to the manuscript; J.X. assisted J.J. in designing the architecture and conducting experiments. All authors have read and agreed to the published version of the manuscript.

Funding

This research was funded by the National Natural Science Foundation of China under Grant 32071682 and Grant 31901311; In part by the Project of Central South Inventory and Planning Institute of State Forestry and Grassland Administration “Research on key technologies of large-scale deployable remote sensing-based intelligent forest change monitoring system” Science and Technology Innovation Plan Project of Hunan Provincial Forestry Department under Grant XLK202108-8; and funded by the College Students’ Innovative Entrepreneurial Training Plan Program under Grant QL20220178.

Data Availability Statement

Not applicable.

Conflicts of Interest

The authors declare that they have no conflicts of interest.

References

  1. Lu, D.; Mausel, P.; Brondízio, E.; Moran, E. Change detection techniques. Int. J. Remote Sens. 2004, 25, 2365–2401. [Google Scholar] [CrossRef]
  2. Chen, C.-F.; Son, N.-T.; Chang, N.-B.; Chen, C.-R.; Chang, L.-Y.; Valdez, M.; Centeno, G.; Thompson, C.A.; Aceituno, J.L. Multi-Decadal Mangrove Forest Change Detection and Prediction in Honduras, Central America, with Landsat Imagery and a Markov Chain Model. Remote Sens. 2013, 5, 6408–6426. [Google Scholar] [CrossRef] [Green Version]
  3. Coppin, P.R.; Bauer, M.E. Digital change detection in forest ecosystems with remote sensing imagery. Remote Sens. Rev. 1996, 13, 207–234. [Google Scholar] [CrossRef]
  4. Lu, D.; Li, G.; Moran, E. Current situation and needs of change detection techniques. Int. J. Image Data Fusion 2014, 5, 13–38. [Google Scholar] [CrossRef]
  5. Zhao, F.; Sun, R.; Zhong, L.; Meng, R.; Huang, C.; Zeng, X.; Wang, M.; Li, Y.; Wang, Z. Monthly mapping of forest harvesting using dense time series Sentinel-1 SAR imagery and deep learning. Remote Sens. Environ. 2022, 269, 112822. [Google Scholar] [CrossRef]
  6. Seo, D.K.; Kim, Y.H.; Eo, Y.D.; Lee, M.H.; Park, W.Y. Fusion of SAR and Multispectral Images Using Random Forest Regression for Change Detection. ISPRS Int. J. Geo-Inform. 2018, 7, 401. [Google Scholar] [CrossRef] [Green Version]
  7. Wang, F.; Xu, Y.J. Comparison of remote sensing change detection techniques for assessing hurricane damage to forests. Environ. Monit. Assess. 2010, 162, 311–326. [Google Scholar] [CrossRef]
  8. Nackaerts, K.; Vaesen, K.; Muys, B.; Coppin, P. Comparative performance of a modified change vector analysis in forest change detection. Int. J. Remote Sens. 2005, 26, 839–852. [Google Scholar] [CrossRef]
  9. Yang, J.; Zhou, Y.; Cao, Y.; Feng, L. Heterogeneous image change detection using Deep Canonical Correlation Analysis. In Proceedings of the 2018 24th International Conference on Pattern Recognition (ICPR), Beijing, China, 20–24 August 2018; pp. 2917–2922. [Google Scholar]
  10. Meli Fokeng, R.; Gadinga Forje, W.; Meli Meli, V.; Nyuyki Bodzemo, B. Multi-temporal forest cover change detection in the Metchie-Ngoum Protection Forest Reserve, West Region of Cameroon. Egypt. J. Remote Sens. Space Sci. 2020, 23, 113–124. [Google Scholar] [CrossRef]
  11. Li, S.; Song, W.; Fang, L.; Chen, Y.; Ghamisi, P.; Benediktsson, J.A. Deep Learning for Hyperspectral Image Classification: An Overview. IEEE Trans. Geosci. Remote Sens. 2019, 57, 6690–6709. [Google Scholar] [CrossRef]
  12. Deng, Z.; Sun, H.; Zhou, S.; Zhao, J.; Lei, L.; Zou, H. Multi-scale object detection in remote sensing imagery with convolutional neural networks. ISPRS J. Photogramm. Remote Sens. 2018, 145, 3–22. [Google Scholar] [CrossRef]
  13. Yuan, X.; Shi, J.; Gu, L. A review of deep learning methods for semantic segmentation of remote sensing imagery. Expert Syst. Appl. 2021, 169, 114417. [Google Scholar] [CrossRef]
  14. Daudt, R.C.; Saux, B.L.; Boulch, A. Fully Convolutional Siamese Networks for Change Detection. In Proceedings of the 2018 25th IEEE International Conference on Image Processing (ICIP), Athens, Greece, 7–10 October 2018; pp. 4063–4067. [Google Scholar]
  15. Rahman, F.; Vasu, B.; Cor, J.V.; Kerekes, J.; Savakis, A. Siamese network with multi-level features for patch-based change detection in satellite imagery. In Proceedings of the 2018 IEEE Global Conference on Signal and Information Processing (GlobalSIP), Anaheim, CA, USA, 26–29 November 2018; pp. 958–962. [Google Scholar]
  16. Zhan, Y.; Fu, K.; Yan, M.; Sun, X.; Wang, H.; Qiu, X. Change Detection Based on Deep Siamese Convolutional Network for Optical Aerial Images. IEEE Geosci. Remote Sens. Lett. 2017, 14, 1845–1849. [Google Scholar] [CrossRef]
  17. Chen, H.; Shi, Z. A Spatial-Temporal Attention-Based Method and a New Dataset for Remote Sensing Image Change Detection. Remote Sens. 2020, 12, 1662. [Google Scholar] [CrossRef]
  18. Chen, J.; Yuan, Z.; Peng, J.; Chen, L.; Huang, H.; Zhu, J.; Liu, Y.; Li, H. DASNet: Dual Attentive Fully Convolutional Siamese Networks for Change Detection in High-Resolution Satellite Images. IEEE J. Sel. Top. Appl. Earth Obs. Remote Sens. 2021, 14, 1194–1206. [Google Scholar] [CrossRef]
  19. Fang, S.; Li, K.; Shao, J.; Li, Z. SNUNet-CD: A Densely Connected Siamese Network for Change Detection of VHR Images. IEEE Geosci. Remote Sens. Lett. 2022, 19, 1–5. [Google Scholar] [CrossRef]
  20. Chen, H.; Qi, Z.; Shi, Z. Remote Sensing Image Change Detection With Transformers. IEEE Trans. Geosci. Remote Sens. 2022, 60, 1–14. [Google Scholar] [CrossRef]
  21. Hethcoat, M.G.; Edwards, D.P.; Carreiras, J.M.; Bryant, R.G.; Franca, F.M.; Quegan, S. A machine learning approach to map tropical selective logging. Remote Sens. Environ. 2019, 221, 569–582. [Google Scholar] [CrossRef]
  22. Schroeder, T.A.; Wulder, M.A.; Healey, S.P.; Moisen, G.G. Mapping wildfire and clearcut harvest disturbances in boreal forests with Landsat time series data. Remote Sens. Environ. 2011, 115, 1421–1433. [Google Scholar] [CrossRef]
  23. Cohen, W.B.; Fiorella, M.; Gray, J.; Helmer, E.; Anderson, K. An efficient and accurate method for mapping forest clearcuts in the Pacific Northwest using Landsat imagery. Photogramm. Eng. Remote Sens. 1998, 64, 293–299. [Google Scholar]
  24. Hethcoat, M.G.; Carreiras, J.M.B.; Edwards, D.P.; Bryant, R.G.; Quegan, S. Detecting tropical selective logging with C-band SAR data may require a time series approach. Remote Sens. Environ. 2021, 259, 112411. [Google Scholar] [CrossRef]
  25. Reiche, J.; Hamunyela, E.; Verbesselt, J.; Hoekman, D.; Herold, M. Improving near-real time deforestation monitoring in tropical dry forests by combining dense Sentinel-1 time series with Landsat and ALOS-2 PALSAR-2. Remote Sens. Environ. 2018, 204, 147–161. [Google Scholar] [CrossRef]
  26. Maretto, R.V.; Fonseca, L.M.G.; Jacobs, N.; Körting, T.S.; Bendini, H.N.; Parente, L.L. Spatio-Temporal Deep Learning Approach to Map Deforestation in Amazon Rainforest. IEEE Geosci. Remote Sens. Lett. 2021, 18, 771–775. [Google Scholar] [CrossRef]
  27. Zhou, Z.; Rahman Siddiquee, M.M.; Tajbakhsh, N.; Liang, J. UNet++: A Nested U-Net Architecture for Medical Image Segmentation. In Deep Learning in Medical Image Analysis and Multimodal Learning for Clinical Decision Support; Springer: Cham, Switzerland, 2018; pp. 3–11. [Google Scholar]
  28. Woo, S.; Park, J.; Lee, J.-Y.; Kweon, I.S. CBAM: Convolutional Block Attention Module. In Proceedings of the Computer Vision—ECCV 2018, Munich, Germany, 8–14 September 2018; pp. 3–19. [Google Scholar]
  29. Lin, T.-Y.; Goyal, P.; Girshick, R.; He, K.; Dollár, P. Focal loss for dense object detection. In Proceedings of the IEEE International Conference on Computer Vision, Venice, Italy, 22–29 October 2017; pp. 2980–2988. [Google Scholar]
  30. Milletari, F.; Navab, N.; Ahmadi, S. V-Net: Fully Convolutional Neural Networks for Volumetric Medical Image Segmentation. In Proceedings of the 2016 Fourth International Conference on 3D Vision (3DV), Stanford, CA, USA, 25–28 October 2016; pp. 565–571. [Google Scholar]
Figure 1. Geographic location of the study area.
Remotesensing 14 05046 g001
Figure 2. Example of change labels. The yellow area represents change areas. Images A and B are bitemporal images (acquired in autumn 2020 and 2021). (1), (2), and (3) are examples of partially enlarged annotations. (a), (b), and (c) is are the zoomed change areas in (1), (2) and (3).
Remotesensing 14 05046 g002
Figure 3. The encoder-decoder architecture of DSNUNet. (a) is the encoder structure of DSNUNet, consisting of two sets of Siamese branches; (b) is the decoder structure of Nested UNet.
Remotesensing 14 05046 g003
Figure 4. Feature extraction branch from optical and SAR images.
Remotesensing 14 05046 g004
Figure 5. Attention module used in DSNUNet at the decoder end. (a) is the ECAM module, which is a plain combination of the channel attention mechanism and the ensemble method; (b) is the channel attention module (CAM), modeling the dependencies between channels. In CAM, AvgPool and MaxPool denote average pooling and max pooling operations respectively, MLP denotes a multilayer perception.
Remotesensing 14 05046 g005
Figure 6. The pipeline of the DSNUNet. InputA and InputB are Bitemporal images (i.e., optical and SAR images).
Remotesensing 14 05046 g006
Figure 7. Prediction results of DSNUNet and other models based on optical images.
Remotesensing 14 05046 g007
Figure 8. Prediction results of DSNUNet and other models based on SAR images added to the input.
Remotesensing 14 05046 g008
Figure 9. Relationship between the number of initial channels and model performance.
Remotesensing 14 05046 g009
Figure 10. The results on the test step for different combinations of channel numbers.
Remotesensing 14 05046 g010
Figure 11. The workflow of different methods in the training and prediction phases. (a) the original deep supervision method, which uses multiple prediction maps for joint back-propagation during the training step, but only a single feature map was used for prediction; (b) 1 × 1 convolution-based method that improves the training and prediction disparity in the method (a); (c) ECAM module-based method, which provides fine-grained change maps by weighting the attention of multiple feature maps and performing information aggregation.
Remotesensing 14 05046 g011
Figure 12. Loss change curve of DSNUNet with different initial channel combinations in the training step.
Remotesensing 14 05046 g012
Figure 13. Anti-cloud interference characteristics of the DSNUNet: (a) the original image; (b) the prediction result of the SNUNet; (c) the prediction result of the DSNUNet. The blue and white circles denote the cloud areas and true change areas, respectively. The yellow area is the predicted result of SNUNet and DSNUNet.
Remotesensing 14 05046 g013
Table 1. Optical image sources.
Name of DataDownload SourceSpatial Resolution (m)Time/Synthetic MethodCloud Cover
Sentinel-2 L1CGoogle Earth Engine102020: autumn(Month 9~11)/Medianbelow 5%
2021: autumn(Month 9~11)/Medianbelow 5%
Table 2. SAR image sources.
Name of DataDownload SourceSpatial Resolution (m)Time/Synthetic MethodPolarization
Sentinel-1 GRDGoogle Earth Engine102020: autumn(Month 9~11)/MedianVV, VH
2021: autumn(Month 9~11)/MedianVV, VH
Table 3. Comparison of DSNUNet with other models based on optical images.
ModelParams (M)FlOP (G)Precision (%)Recall (%)F1-Score (%)
FC-Siam-Diff1.359.4066.7163.3965.01
FC-Siam-Conc1.5410.6064.4169.2566.75
FC-EF1.357.1068.6667.4168.03
STANet12.2125.4073.3565.9769.47
BIT11.9116.9470.6970.3670.52
LF UNet9.9546.6477.4267.3672.04
SNUNet *12.03109.7677.7470.9174.17
DSNUNet *13.33119.7678.3774.5376.40
* The initial number of channels of the optical image branch was set to 32 for both SNUNet and DSNUNet; the initial number of channels of the SAR image branch in DSNUNet was set to eight.
Table 4. Comparison of the DSNUNet and other models based on SAR images added to the input.
ModelParams (M)FlOP (G)Precision (%)Recall (%)F1-Score (%)
FC-Siam-Diff1.359.4669.2266.1667.65
FC-Siam-Conc1.5410.6867.2667.1867.22
FC-EF1.357.1869.5367.7868.65
STANet12.2225.8278.7965.0671.27
BIT11.9217.3673.2865.2769.04
LF UNet9.9546.7876.1972.8874.50
SNUNet *12.04109.9075.7573.7974.75
DSNUNet *13.33119.7678.3774.5376.40
* The initial number of channels of the optical image branch was set to 32 for both SNUNet and DSNUNet; the initial number of channels of the SAR image branch in DSNUNet was set to eight.
Table 5. The results of the comparison experiments for different channel number combinations.
Initial Channel Number Combination *Params (M)FlOP (G)Precision (%)Recall (%)F1-Score (%)
16-43.3430.1472.8167.5970.10
32-412.59114.4077.4074.3975.87
32-813.33119.7678.3774.5376.40
32-1615.38132.7478.2472.4775.24
32-3221.78167.5874.9072.8173.84
* The combination in the initial channel numbers is presented in the form of: Optical branch—SAR branch.
Table 6. Accuracy results of DSNUNet for different feature fusion methods.
MethodPrecision (%)Recall (%)F1-Score (%)
Deep supervision79.1869.7174.14
1 × 1 convolution75.3574.0974.71
ECAM78.3774.5376.40
Publisher’s Note: MDPI stays neutral with regard to jurisdictional claims in published maps and institutional affiliations.

