Abstract
The ecological water diversion project (EWDP) in the Tarim River Basin, China, aims to allocate more surface water to downstream reaches to restore the degraded ecosystems. However, seasonal changes in ecological water diversion; the factors (natural and anthropogenic) controlling the ecological water diversion, whether the seasonal delivery of water temporally corresponded to the vegetation’s seasonal water demands; and the benefits of the ecological water diversion through overflowing surface water irrigation are unclear. To address the above issues, this study examines the intra-annual changes and its influencing factors in ecological water diversion (inundation) in the Daliyaboyi Oasis in the lower Keriya River valley within the Tarim Basin, discusses whether the seasonal delivery of water temporally corresponded to the vegetation’s seasonal water demands, and assesses the ecological benefits of overflowing surface water irrigation. Inundation was quantified by digitizing monthly changes in the inundated area from 2000 to 2018 in the oasis using 184 Landsat images. The results demonstrate that seasonal changes in the inundated area varied significantly, with maximum peaks occurring in February and August; a period of minimal inundation occurred in May. Differences in the July/August peak (i.e., July or August) in inundation dominated the inter-annual variations in the inundated area over the 19-year study period. The two peaks in the inundation area were temporally consistent with the vegetation’s seasonal water demand. Local residents have used ecological water to irrigate vegetation in different parts of the oasis during different seasons, an approach that expanded the inundated area. The February peak in the inundated area is closely linked to elevated downstream groundwater levels and the melting of ice along the river. The August peak is related to a peak in runoff from headwater areas. The minimum May value is correlated to a relatively low value in upstream runoff and an increase in agricultural water demand. Thus, natural factors control the intra-annual and inter-annual variations in the inundated area. Humans changed the spatial distribution of the inundated area and enhanced the water’s ecological benefits, but did not alter the correlation between peak periods of inundation and vegetation water demand. The results from this study improve our understanding of the benefits of the EWDP in the Tarim River Basin.
1. Introduction
The Tarim Basin is in the arid inland region of northwestern China which possesses the world’s second largest shifting sand desert [1]. The maintenance of oases in the basin and the growth of its vegetation are strongly dependent on ephemeral streams originating in the surrounding mountains, and on shallow groundwater which is recharged by seasonally variable river flow.
Since 1949 (when the People’s Republic of China was founded), the basin has experienced rapid economic growth and large-scale agricultural activities that have led to the significant exploitation of water resources [2]. In fact, excessive water use in the upper and middle reaches of the Tarim Basin has generated widespread ecological and environmental problems along the lower reaches of the rivers (Figure 1). These problems are primarily related to a lack of irrigation and, subsequently, groundwater declines [3,4,5,6,7,8] that led the Chinese government to invest approximately USD 1.6 billion (RMB 10.7 billion) on an ecological water diversion project (EWDP). This project was intended to allocate sufficient surface water resources to downstream areas of the Tarim River Basin since 2000 to restore and reconstruct degenerated ecosystems [9,10,11]. To assess the effectiveness of the project, researchers have conducted numerous studies focused on a range of related issues [12]. The most commonly addressed topics include: (1) the simulation of flow regulation process inherent in the EWDP [13,14], (2) the dynamic variations in groundwater levels [15,16,17,18,19,20] and geochemistry [21,22,23] caused by the EWDP, and (3) the impact of EWDP on natural vegetation [24,25,26,27,28,29,30,31,32]. These investigations have formed an initial, basic understanding and framework of the effectiveness of the EWDP, and have provided an essential scientific foundation for long-term ecological restoration. However, deficiencies in our understanding remain, including: (1) implementation of the EWDP in the lower reaches of the Tarim River is mainly concentrated in the flood season [12]. However, whether the seasonal delivery of water temporally corresponded to the vegetation’s seasonal water demands during different stages of its life cycle [33] needs to be considered. The ecological effect caused by consistency or inconsistency between the vegetation’s period of water demand and the irrigation period remains unclear. (2) The water delivered downstream by the project mainly comes from the headwaters of mountainous rivers around the Tarim Basin that are primarily fed by the melting of glaciers and snow, and is seasonally affected by natural factors, such as precipitation and temperature, and which therefore flow seasonally [34,35]. Thus, variations in headwater runoff greatly impact the seasonal changes in ecological water diversion. Moreover, the amount of delivered water is particularly affected by anthropogenic water use in midstream regions [11]. The impacts of variations in upstream runoff and midstream human water use on the seasonal changes in ecological water diversion are thus unclear. (3) The current ecological benefits of the EWDP in the downstream Tarim River valley are mainly achieved by elevating groundwater levels through irrigation of the natural vegetation along the river channel [9,36]. However, Deng et al. [12] proposed that human allocations of surface water irrigation in the basin can be enlarged (e.g., building dams or floodgates along various branches of the river) to enhance the ecological benefits of the EWDP. However, the benefits of the ecological water diversion that can be gained by overflowing surface water irrigation in this valley are unclear.
The Keriya River is located on the southern margin of the Tarim Basin [37]. A crucial riparian forest is located along the river in the hinterland of the Taklimakan Desert and prevents the invasion of sand dunes to the river channel [38]. At the terminus of the river is the largest existing primitive natural oasis in the desert hinterland, i.e., the Daliyaboyi Oasis [39]. The Daliyaboyi Oasis represents an ideal location to study seasonal variations and ecological benefits of water diversions because: (1) maintenance of the Daliyaboyi Oasis relies on the remaining surface water discharged from the agricultural area along the middle reaches of the Keriya River. The oasis itself has no modern industry or agriculture. Put differently, the remaining water discharged into the Daliyaboyi Oasis can be regarded as an ecological water diversion because the water is used only to maintain the oasis’s ecosystems. (2) The ecological water diversions in the region occur along several main branches of the Tarim River, which are affected by many natural and anthropogenic factors, making it difficult to observe the seasonal changes in ecological water diversion within the basin as a whole. In contrast, the Keriya River has no tributary channels, but directly delivers water to downstream areas. Moreover, the water delivered to the Daliyaboyi Oasis varies seasonally as a function of the river’s upstream discharge [38,39,40]. Therefore, seasonal variations in ecological water diversions within the oasis can be clearly and completely characterized. In addition, an analysis of whether the seasonal delivery of water coincides with the intra-annual period of the desert vegetation’s water requirements can also be addressed. (3) The Daliyaboyi villagers use primitive dam systems that allow diverted ecological water to be used for the irrigation of natural vegetation in the area. The irrigation is carried out by means of an overflowing surface water irrigation approach [41], and different regions of the vegetation are irrigated during different seasons to achieve ecological benefits. Importantly, the annual amount of ecological water diversion from the Keriya River is approximately 2 × 10⁸ m3 [40], which is half of the Tarim River’s mean annual water conveyance of 4 × 10⁸ m3 (the Keriya River was historically a seasonal tributary of the Tarim River) [36,37]. These combined characteristics allow the Daliyaboyi Oasis to serve as an excellent setting to assess the ecological benefits of the project in the Tarim River Basin.
Inundation usually occurs on floodplains in downstream areas. These serve as the most crucial ecosystems in the river basins, especially in dryland regions [42,43,44,45]. The inundation area is defined herein as the area along the river that is covered by water during the seasonal flood period. These flood waters are mainly used to irrigate the natural vegetation developed on the floodplains. Therefore, we propose a novel approach to using the inundation area as an indicator in order to quantify the amount of natural vegetation that is irrigated, and the benefits of ecological water diversion obtained via overflowing surface water irrigation in the study area (e.g., elevated downstream groundwater levels, area of enlarged coverage of natural vegetation, and increases in vegetation community diversity). Moreover, the inundated area can be visually interpreted and digitized from remotely sensed images, and used to quantify the dynamic variations in the area of natural vegetation that is inundated throughout a year [46,47,48]. Data from the Landsat series of satellites can be used to create a long-term, time series of inundation [49,50,51,52,53,54] at a moderate spatial resolution and a timestep of 8 or 16 days [55,56]. The spatial and temporal resolution of the Landsat data are, therefore, sufficient to capture the monthly variations in the inundation area in the study area (Daliyaboyi Oasis).
The cause of the dynamic variations in inundation within the Daliyaboyi Oasis should be related to the process of runoff changes indicated by the river length (surface runoff) in the lower reaches of the Keriya River to a certain extent (where river length is defined as the length of the channel containing flowing water between the center of Yutian County and the river’s end point in the ephemeral river section) [57]. Wang et al. [57] preliminarily analyzed the influences of the natural factors and anthropogenic disturbances on the seasonal changes (peak and minimum) in river length based on the intra-annual variations in river length in the lower Keriya River from 2000 to 2019. They believed that natural factors are the most significant factors affecting the seasonal variations in river length. However, Wang et al.’s [57] discussion on the March peak in river length was not very clear (i.e., it is caused by groundwater recharge). They also did not analyze the impact of river length changes (surface runoff variations) on the Daliyaboyi Oasis. Thus, the specific research questions addressed in this study are as follows. (1) The seasonal variations in ecological water diversion (inundation area) in the Daliyaboyi Oasis (2000–2018) were established by visual interpretation of remote sensing images, and the factors (natural and anthropogenic) controlling the ecological water diversion (inundation area) were discussed further (i.e., supplemented the influences of groundwater recharge and human activities on the tail oasis). (2) We evaluated the ecological benefits of overflowing surface water irrigation under human regulation (i.e., the ecological impact of surface runoff variations) for the first time. (3) We also addressed the correspondence between the seasonal delivery of ecological water and the vegetation’s seasonal water demands.

Figure 1.
Location of the study area within the Tarim Basin, China. (a) Google Earth image in the Tarim Basin. The map of China was obtained from the website http://bzdt.ch.mnr.gov.cn/ (accessed on 1 January 2019), and the grant number is GS(2020)3183 [57]. (b) The imagery was processed from Landsat 8 operational land imager (OLI) data from 15 June 2016 (band composite is Red (7), Green (5), and Blue (2)) [57], showing the location of the Keriya River catchment.
2. Materials and Methods
2.1. Study Area
The Keriya River originates in the Kunlun Mountains (at altitudes above 6100 m a.s.l.) along the northern margin of the Tibetan Plateau [58] (Figure 1a) and flows from south to north. The Keriya River catchment can be divided into the upstream, midstream, and downstream areas (Figure 1b). Ice and snow occur in the upstream areas, whereas an agricultural oasis is located along the midstream area. The downstream area is characterized by the Daliyaboyi Oasis, a natural oasis [59].
In the upper, mountainous Keriya River catchment, 71% of the Keriya River’s discharge is received from the melting of glaciers and snow [38]. The intra-annual changes of upstream runoff are characterized by a single peak that creates a period of high river flows in July and August [40]. The average annual runoff is 7.58 × 10⁸ m3 (1957–2015), whereas the average annual precipitation is 130.7 mm (1958–2015). The average annual temperature is 9.25 °C (1958–2015), while the average annual evaporation in the upper Keriya River Basin is 1928.5 mm (1986–2015). The middle reaches of the river basin contain the Yutian agricultural oasis [58]. The average annual precipitation within this reach of the basin is 52.56 mm (1961–2019), whereas the average annual temperature is 11.8 °C (1961–2019) [57]. The agricultural sector has the highest intensity of water use within the catchment, and is dominated by surface water irrigation [60]. The Daliyaboyi Oasis (covering approximately 324 km2) [61] is characterized by a hyper-arid climate [59], where the average annual precipitation is less than 10 mm [59]; the average annual temperature is about 11.8 °C (2015–2016) [62]. The river system in the area of the Daliyaboyi Oasis is characterized by a fan-shaped distributary system [39] that traverses a landscape characterized by extensive desert dunes [41]. The vegetation community possesses limited diversity; it is dominant by Populus, Tamarix, and Phragmites australis [63]. Natural vegetation mainly depends on surface water and groundwater for survival [38]. Residents make a living by grazing animals and have built artificial dam and diversion systems to irrigate the natural grasslands [41].
2.2. Datasets
Data Collection
The study area is roughly covered by one path/row (P145/R33) of the Landsat Worldwide Reference System (WRS-2). All Landsat images belong to the standard Level 1 Terrain-corrected (L1T) images. Remote sensing data were obtained from Landsat images (a total of 184 scenes) from 2000 to 2018, including 38 Thematic Mapper (TM) images, 93 Enhanced Thematic Mapper Plus (ETM+) images, and 53 Operational Land Imager (OLI) images (Figure 2). Google Earth images (with the spatial resolution is 0.47 m) were also used (Table 1). All Landsat images were downloaded from the United States Geological Survey. A total of 44 images were unavailable (excessive cloud cover or missing) (Figure 2). In addition, the Landsat 7 scan-line corrector (SLC) was turned off on 31 May 2003, and about 22% of the data in the Landsat enhanced thematic mapper plus (ETM+) images were lost due to the scan gap. Thus, we repaired these ETM+ images using one plug-in.
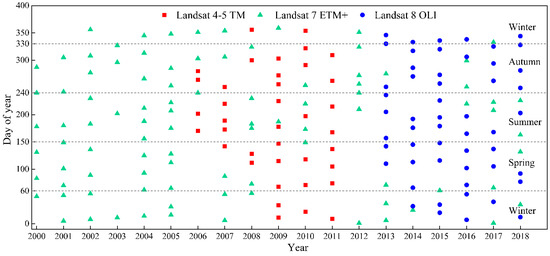
Figure 2.
Temporal distribution (day of year) of Landsat images (Landsat 4–5 TM, Landsat 7 ETM+, and Landsat 8 OLI) from 2000 to 2018 used in this study. Blank regions represent missing remote sensing images.

Table 1.
Characteristics of remote-sensing data used in this study.
2.3. Methods
2.3.1. Geometric Correction
Geometric correction involved a multi-step process. First, one Landsat 8 OLI image was transformed into a common coordinate system, the Universal Transverse Mercator (UTM), World Geodetic System (WGS 84) projection. The system is based on a topographic map (1:100,000) and was created using the ENVI® software version 5.6 (Exelis Visual Information Solutions, Boulder, CO, USA). We then used the topographic map as the reference to geocorrect the Landsat 8 OLI image. The geocorrection was conducted using more than 50 ground control points (GCPs) from the topographic map. A second-order polynomial transform function, as well as a nearest neighbor resampling method, were subsequently used to produce an average Root Mean Square Error (RMSE) of less than 1 pixel [64,65]. Finally, the geometrically corrected Landsat image was used to rectify the other Landsat images using the GCPs, and the average RMSE was less than 1 pixel [57].
2.3.2. Inundation Area Digitization, Verification and Statistical Analysis
The inundation area of floodplains within the Daliyaboyi Oasis was visually recognized on all geometrically corrected images. The inundation area was interpreted and calculated using ArcGIS® software version 10.1 (Environmental Systems Research Institute, Redlands, CA, USA). The relatively high spatial resolution Google Earth images acquired on 25 June 2011 and 16 March 2016, along with two UAV aerial photographs acquired on 7 October 2016, were used to verify the interpretation and digitization of the inundation area boundaries. Our results of interpretations of the Landsat images were consistent with the UAV aerial photographs and Google Earth images (Figure 3). Statistical descriptors of the changes in inundation area (e.g., departure and accumulative departure) were also calculated (Figure 4).
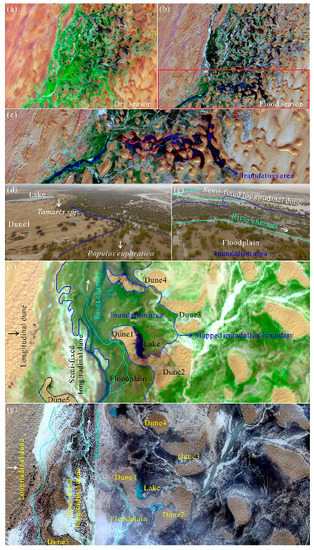
Figure 3.
Images illustrating the extraction and measurement of the inundation area and the utilized data validation process. (a) Landsat image captured on 17 July 2016, showing no flooding; (b) Landsat image captured on 8 December 2016, showing flooding. (c) The red area represents mapped inundation area; (d,e) are UAV aerial photographs captured on 7 October 2016. (f) Landsat image captured on 11 March 2016; (g) Google Earth images acquired on 25 June 2011 and 16 March 2016.
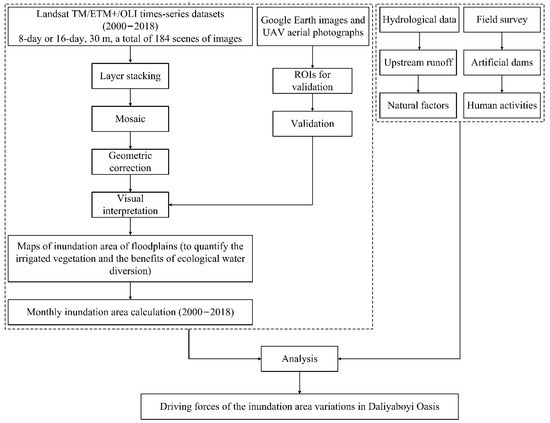
Figure 4.
Schematic workflow of Landsat image processing, inundation area mapping and validation, and driving factor analysis.
2.3.3. Hydrological and Meteorological Data and Field Investigations
Hydrological and meteorological data included monthly and annual streamflow (discharge) (1957–2015), precipitation (1958–2015), temperature (1958–2015), and evaporation (1986–2015) records from mountain hydrological stations along the upper reaches of the Keriya River (Figure 1b). These data were obtained from the Hotan Hydrology and Water Resource Survey Bureau of Xinjiang Uygur Autonomous Region, China. Field investigations concentrated on collecting data pertaining to artificial dams within the Daliyaboyi Oasis, including their locations, year of construction, size (length and height), number, and usage (i.e., the frequency and methods through which their waters were used). Data on midstream agricultural water demand in 2009 were acquired from the Planning Report of Irrigation and Water Conservancy Construction in Yutian County [57]. Although we acquired and quoted only one year of agricultural water demand data within the Yutian Oasis, Wang et al. [57] believed that the inter-annual changes in the agricultural water use were relatively minor during the 19-year study period; therefore, the data for 2009 used in this paper are representative and valid.
3. Results
3.1. Temporal Changes in Inundation Area within the Daliyaboyi Oasis
3.1.1. Inter-Annual Changes
A total of 184 inundation area values from the Daliyaboyi Oasis were acquired from the Landsat images during the 19-year study period (2000–2018). The long-term (19-year) average annual value is 9.70 km2. These values fluctuated around this mean value. The inundated area was below the average value in most years (especially between 2007 and 2009); the minimum value occurred in 2009 (during which a value of zero appeared eight times) (Figure 5a). Departures from an inundation area (Figure 5b) of zero (Y-axis) fluctuated between positive and negative values. The frequency of negative departure values was markedly higher than positive departure values during the period 2000–2009, while positive departures increased after 2009 (especially between 2016 and 2018) (Figure 5b). The cumulative departure curve shows a significant decrease from 2004 to 2009, a mild change from 2010 to 2015, and an obvious increase from 2016 to 2018 (Figure 5b).
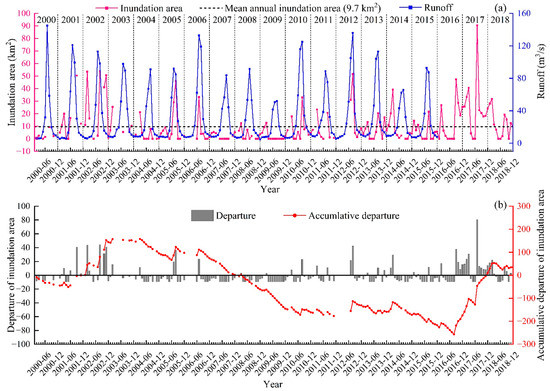
Figure 5.
Observed changes in inundation area (2000–2018) measured within the Daliyaboyi Oasis and upstream runoff (2000–2015) within the Keriya River Basin (a) and departures and accumulative departure from the mean of inundation area between 2000 and 2018 (b). Every tick mark on the horizontal axis (X-axis) represents one month. The zero value means that the streamflow did not traverse the ephemeral section of the river or its reach within the Daliyaboyi Oasis (i.e., there were no overbank flood events that inundated the floodplain).
3.1.2. Intra-Annual Variations and Spatial Distribution
Intra-annual variations in the inundation area in the Daliyaboyi Oasis fluctuated seasonally (Figure 6). Two significant peaks are present, occurring in February/March (i.e., February or March) and July/August. One period of low inundation occurred in May. The annual maximum area of inundation area between 2000 and 2018 occurred 8 times in February/March and 9 times in July/August. The annual minimum in the inundation area appeared 14 times in May. In addition, the inundation area’s annual minimum value was zero, indicating that overbank streamflows did not occur along the intermittent reach of the river and flow into the Daliyaboyi Oasis.
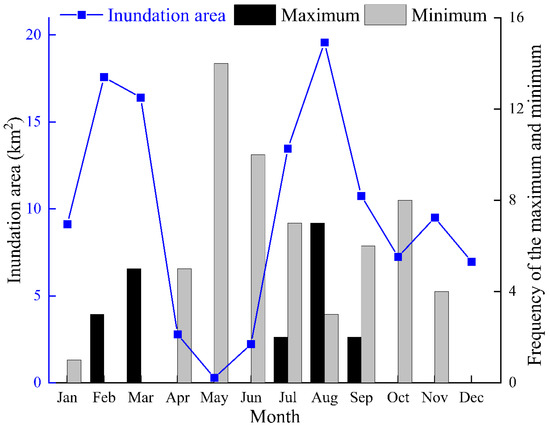
Figure 6.
Intra-annual (seasonal) changes in inundation area between 2000 to 2018 within the Daliyaboyi Oasis located along the downstream reaches of the Keriya River and the frequency with which the minimum and maximum values of inundation were observed; data stratified by month.
Figure 7 shows the spatial distribution of the inundation area (in February/March and July/August) within the Daliyaboyi Oasis for each year between 2000 to 2018. At least part of the Daliyaboyi Oasis was inundated during most years, but the size of these areas fluctuated significantly over the past 19 years (Figure 7). Inundated areas mainly occurred in February–March (especially in 2002, when the inundation area was as high as 53.80 km2) (note that there was a lack of images in 2006 and 2012). The inundation area for the periods 2001, 2003–2005, 2008–2010, and 2015–2016 covered relatively limited areas that were dispersed throughout the Oasis. In contrast, inundation areas in 2007, 2011, 2013, and 2017–2018 were distributed in a concentrated region. The inundation area that occurred in July–August usually consisted of densely distributed larger regions, located mainly in the western (e.g., 2006, 2011, 2015, and 2018) or the eastern (e.g., 2002 and 2005) parts of the Oasis. Inundated areas only occur occasionally in the central part of the oasis during some years (e.g., 2003 and 2013). In July–August of each year between 2000 and 2018, the maximum inundated area in the oasis was 90.50 km2 (occurring in 2017). In a few years (2000, 2003–2004, 2007–2009 and 2016) little or no inundation occurred.
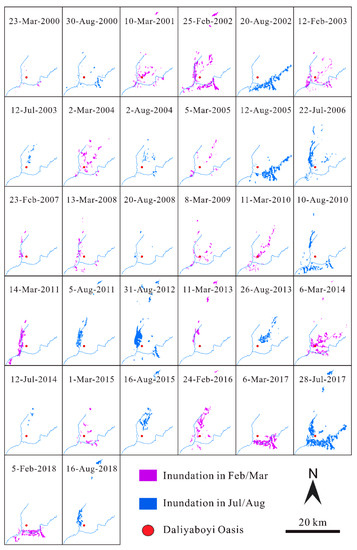
Figure 7.
Variations in the spatial distribution of inundated areas within the Daliyaboyi Oasis during the peak period (February/March and July/August) from 2000 to 2018.
3.2. Downstream Human Regulation
In Daliyaboyi, we investigated 18 large-scale dams located on the river’s main branches of the fan-shaped river system along the southern margin of the oasis (Figure 8a). Villagers opened these dams for irrigation during the flood period, allowing river water to flow down the various branches of the river network within the oasis and to irrigate natural vegetation within the floodplains. In doing so, the inhabitants expanded the areas of inundation within the oasis. The largest dam is L1 (Figure 8b,d), with a length of 20 km. It is mainly used to prevent flooding on residential areas near the Daliyaboyi township government (a site for administrative control of the Daliyaboyi Village). Medium-sized dams include M1–M17 (Figure 8a); they range in length from 0.1 to 5 km. Villagers mainly use them to regulate (prevent) flooding or to distribute the flood waters to inundation areas (which is done through gates cut into the dams). M8 and M9 are constructed on the main tributaries of the oasis (about 900 m away from the township government) (Figure 8c,e). M8 is mainly used for flood control (protecting the residences of the township government); its secondary purpose is to provide irrigation waters, which is achieved by closing the opened gate and then regulating the floodwaters (high surface runoff) to the west of the oasis for summer irrigation. M9 is mainly used for irrigation; it is mainly opened during the autumn flood period (low surface runoff), and the floodwater is distributed to the east part of the oasis. Additionally, we found smaller dams (approximately 1000) with a length of 5–100 m built along the margin of pastures. These dams were used to control the direction of water flow at the end of a flood. The different sized dams that were built in different locations constituted a system that controlled the distribution of ecological water within the Daliyaboyi Oasis.
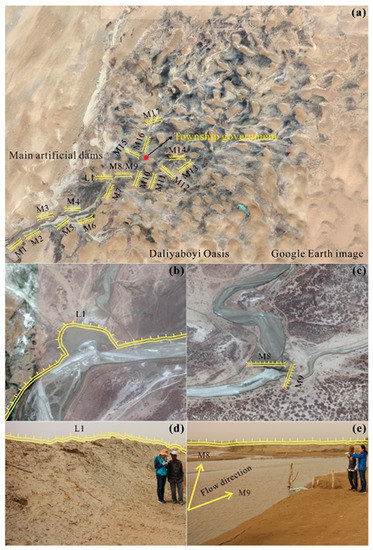
Figure 8.
(a) Distribution of the main artificial dams in the Daliyaboyi Oasis; (b,d) are a Google Earth image and field photograph of the dam at L1, respectively; (c,e) are a Google Earth image and field photograph of the dams at sites M8 and M9, respectively.
4. Discussion
4.1. Factors Controlling Seasonal Variations in Inundation Area
Intra-annual (seasonal) fluctuations in area of inundation within the Daliyaboyi Oasis between 2000 and 2018 were generally constant (Figure 5a), a pattern that clearly reflects the seasonal impact of natural factors.
4.1.1. Peak Values in Inundation Area during July and August
Our data showed that inundation area was significantly positively correlated with upstream runoff (r = 0.51, p < 0.05) from 2000 to 2015. The inundation area consistently increased with rising upstream runoff during the periods of 2000, 2002–2006, 2008, 2010–2013, and 2015. The maximum values of the inundation area and upstream runoff both occurred in July–August in most years (Figure 5a). Furthermore, the minimum value of the inundation area during the 19-year study period occurred in 2009 (values of zero occurred eight times from April to November), the year in which the lowest value of upstream runoff occurred (especially upstream runoff values that occurred in July and August that were surprisingly low) (Figure 5a). Our evidence indicates that the peak values of inundation area that occurred in July/August were mostly dominated by streamflow from headwater areas of the Keriya River catchment. Moreover, this is broadly consistent with Wang et al.’s [57] understanding (viewpoint) of the cause for the peak of river length in the lower Keriya River; that is, midstream agricultural water use did not significantly affect the main peak in the river length or inundation area, whereas the upstream runoff significantly contributed to surface runoff in downstream regions.
Although the inundation area was correlated to upstream runoff, the correlation coefficient between the inundation and upstream runoff (r = 0.51, p < 0.05) was significantly lower than that between the river length and upstream runoff (r = 0.70, p < 0.01) [57]. The inconsistency of the two correlation coefficients indicates that, although both the inundation in the tail of the Daliyaboyi Oasis and the downstream river length are directly linked to the surface runoff within the upper Keriya River, they are not completely consistent. The inconsistency between them may be related to human activities and groundwater recharge in the tail oasis, thus reducing the correlation between the inundation and runoff from mountainous headwater regions. Our viewpoint is well-illustrated by variations in inundation in 2009 within the Daliyaboyi Oasis (Figure 9). In 2009, when summer runoff in headwater regions reached its lowest value during the 19-year study period, the summer floods did not reach the Daliyaboyi Oasis, and no area of the floodplain was inundated (Figure 9). The inundated area unexpectedly occurred in February/March in the Daliyaboyi Oasis (Figure 5a), even though the upstream runoff in winter was significantly lower than in summer (Figure 5a).
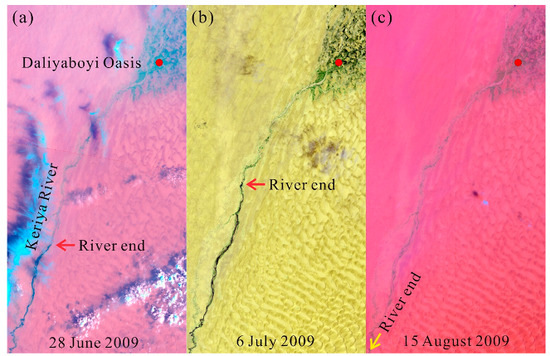
Figure 9.
Landsat images showing the hydrological surface water conditions along the lower Keriya River from June to August 2009. (a–c) are Landsat images captured on 28 June 2009, 6 July 2009, and 15 August 2009, respectively. The three Landsat images show no flood flows into the Daliyaboyi Oasis in the summer of 2009; thus, no inundation occurred.
4.1.2. Peak Values in Inundation Area during February/March
According to Chen [38], variations in the inundated area within the Daliyaboyi Oasis are largely controlled by runoff from mountainous headwater regions. Thus, the inundation area should be smaller when the upstream runoff is low. However, our results show the opposite pattern in February/March; the inundation area of the Daliyaboyi Oasis increased to a significant peak value in February/March (Figure 10), while runoff from the mountains decreased (Figure 10). The peak in the inundation area that occurred in February/March was likely to be consistent with the explanation of Wang et al. [57] for the peak in downstream river length in February/March; that is, the river was likely to be recharged by the groundwater. Wang et al. [57] concluded that from the midstream agricultural oasis in the south to the Daliyaboyi Oasis in the north, the elevation decreases by approximately 200–400 m and such a change in elevation may facilitate the influx of groundwater from upstream reaches on both sides of the river bank to the river. Specifically, during the dry season (December–February) when the river water levels are relatively low, the groundwater is likely to replenish this reach of the river, thereby raising the surface water level of the Daliyaboyi Oasis in February–March. Conversely, during the summer flood season when the groundwater levels are relatively low, the river water will recharge the groundwater system, thereby raising the groundwater level of the Daliyaboyi Oasis during the summer. Furthermore, according to Wang et al. [57], the peak in the inundation area in February/March may also be related to melting ice along the downstream river channels in winter. As air temperatures increase significantly in mid-to-late February, ice along the upper section of the lower reach of the river gradually melts and forms surface meltwater, which may increase surface water flows (levels) along the rivers [57]. As mentioned above in Section 4.1.1, the inundation that occurred in February/March 2009 in the Daliyaboyi Oasis should be related to groundwater recharge.
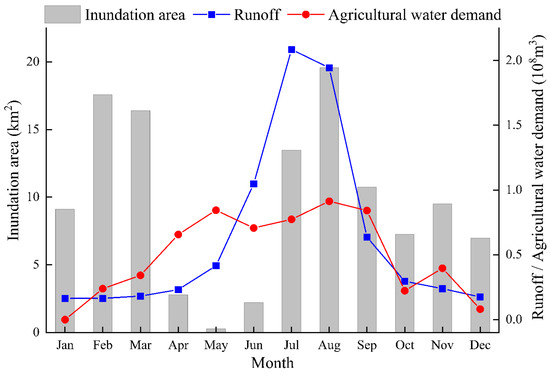
Figure 10.
Intra-annual (seasonal) variations in inundation area within the Daliyaboyi Oasis (19-year average between 2000 and 2018), upstream runoff (16-year mean between 2000 and 2015) and the midstream agricultural water demand (in 2009) in the Keriya River catchment.
4.1.3. The May Minimums in Inundation Area
The area of inundation reaches its lowest values in May. The minimum in the inundation area that occurred in May was probably consistent with the explanation of Wang et al. [57] for the lowest value in downstream river length in June; that is, this decrease was related to a significant decline in streamflow from mountainous headwater regions and the apparent increase in midstream agricultural water demand during this period (Figure 10).
Our data indicate that the inter-annual variations in inundation area per year (between 2000 and 2018) are affected by the peak values in February/March and July/August, as well as the minimum values in May (Figure 11). However, their impacts are different. During the 19-year study period, the July/August peak in the inundation area varied significantly through time; in contrast, variations in the February/March peak and May minimum were relatively minor. The cause of inter-annual variations in inundation is consistent with the argument by Wang et al. [57] for the inter-annual changes in river length; that is, upstream streamflow, midstream agricultural water use, variations in groundwater recharge and levels, and meltwater along downstream river courses all contribute to the inter-annual changes in the inundation area. However, runoff from headwater areas appear to be the dominant control. Moreover, a significantly positive correlation between inundation area and headwater streamflow (r = 0.51, p < 0.05) and the consistency between the inter-annual changes in inundation area and headwater streamflow (Figure 5a), both supported this conclusion. Thus, natural factors in mountainous headwater regions should control the inter-annual and intra-annual variations in inundation area in the Daliyaboyi Oasis.
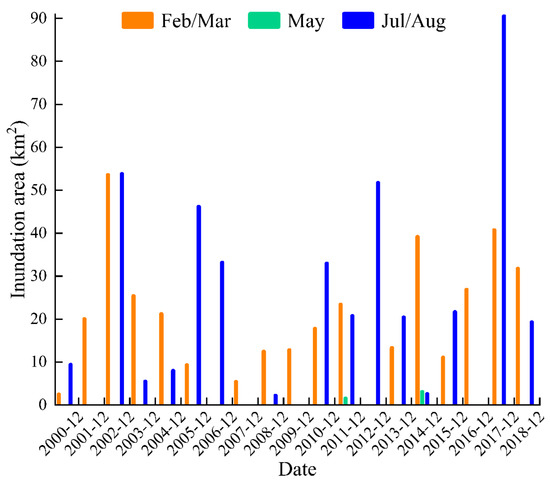
Figure 11.
Observed changes of the peak values in February/March and July/August and the minimum in May in inundation area (2000–2018) measured within the Daliyaboyi Oasis.
4.2. Benefits of the Ecological Water Diversion
Previous studies have shown that the ecological benefits (e.g., elevated downstream groundwater levels, enlarged areas of natural vegetation, increased diversity of community vegetation, and an increased area of the tail lake) of the EWDP along the lower reaches of the Tarim River were mainly achieved by rising groundwater levels to irrigate natural vegetation [11,12]. However, the maximum rise in groundwater levels extended only 1000 m from the river channel. Thus, the area of natural vegetation irrigated, as well as the achieved ecological benefits, were relatively limited. That is, it is difficult to regenerate the riparian vegetation [36], though the degenerated ecosystems have been restored to some extent [11,66,67,68,69]. By contrast, ecological water diversions in the Daliyaboyi Oasis are used for overflowing surface water irrigation. With the help of a widespread network of dams, the vegetation is effectively irrigated throughout the oasis by alternating irrigation of different regions in different seasons. In other words, the villagers only irrigate vegetation in one area at a time. For example, between March 2010 and March 2011, planned irrigation was carried out three times in the Daliyaboyi Oasis. One was in the central region of the oasis in March 2010, one was in the eastern and western regions in August 2010, and the last was in the western region in March 2011. Collectively, the water diversions led to both economic and ecological benefits in the oasis. Economically, the Daliyaboyi residents irrigated about 80,000 hectares of grasslands (which are dominated by Populus, Tamarix, and Phragmites australis) using artificial dam systems, which allowed them to feed 26,000 head of livestock, resulting in a remarkable economic gain (obtained from the Daliyaboyi Township Government). Ecologically, the alternating program of overflowing surface water irrigation largely maintained the desert riparian forests within the Oasis. The riparian forests not only prevent desertification of the Daliyaboyi Oasis, but also protected the ecological security of the midstream Yutian Oasis (Figure 12).
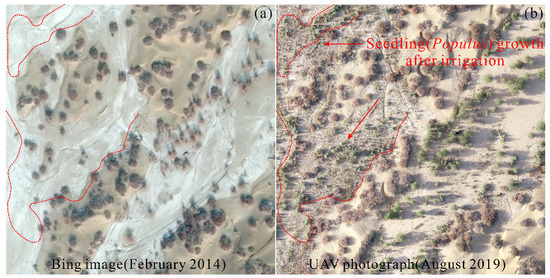
Figure 12.
(a) Bing image captured on February 2014; (b) UAV aerial photograph captured in August 2019, showing the growth of Populus seedlings after flood events that inundated the floodplain.
In addition, we estimated the annual amount of ecological water diversion (river water) that discharged into the Daliyaboyi Oasis. In particular, the average annual runoff in the headwaters of this catchment is 7.58 × 10⁸ m3, and the average annual water consumption in the midstream agricultural oasis is 4.76 × 10⁸ m3 (obtained from the Yutian Water Conservancy Bureau of Xinjiang Uygur Autonomous Region, China). Given the effect of river water leakage (infiltration) and groundwater recharge [38], the annual amount of water that flows into the Daliyaboyi Oasis, and can be used for ecological diversions, should be about 2 × 10⁸ m3 [40].
With advances in water conservation technology, our ability to control water resources will strengthen, and the area of inundation will correspondingly increase. The field investigations by Chen [70] indicate that the streamflow during floods could traverse the ephemeral (intermittent) river section (which is located north of Misalai) (Figure 1b) and reached the area about 70 km north of the township government before the 1960s. However, because dam and irrigation systems are limited in size, number, construction, operation, and management, the inundation area was concentrated in the central region of the Daliyaboyi Oasis during this period [40].
By contrast, seasonal floods can only reach the southern part of the township during the most recent 19 years. The annual seasonal floods in downstream areas are seemly less than that before the 1960s because the ephemeral reach of the lower reaches has retreated at least 70 km to the south [70]. However, with more than 1000 dams of different sizes having been built along river branches in the Daliyaboyi Oasis (Figure 8a), the irrigation system was gradually expanded. Moreover, the inhabitants have organized large-scale irrigation activities which involved more dwellers and some modern machinery since the establishment of Daliyaboyi’s township in 1989, allowing the limited water resources to be more effectively allocated. Thus, the inundation area during the past 19 years (2000–2018) (Figure 5a) is dramatically larger than that before the 1960s [40].
4.3. Relationship between Intra-Annual Changes in Inundation Area and the Period of Vegetation Water Demand
Seasonal flood irrigation plays a crucial role in desert vegetation (dominant species, e.g., Populus, Tamarix, and Phragmites australis) growth in the Daliyaboyi Oasis (Figure 13). More specifically, Phragmites australis begins to germinate between February and March, whereas Tamarix grows new leaves in mid-to-late March [71]. The seed maturation period of Populus and Tamarix is concentrated between June and August [33]. Whether the flood season is consistent with the period of seed dispersal, germination, and seedling growth, is very crucial to the regeneration and development of desert vegetation [33,63,72]. The two peaks in the inundation area in the Daliyaboyi Oasis occurred in February–March and July–August, and were consistent with the period of water demand of the above vegetation (Figure 13). In addition, as mentioned above in Section 4.1, the two significant peaks in inundation area were mostly controlled by natural factors (e.g., headwater streamflow, downstream groundwater inflows, and the melting of ice along the river courses). Human regulation of ecological water diversions was based on the two peaks, but they did not alter the correlation between the two peak periods of inundation area and vegetation water demand. Therefore, the anthropogenic reallocation of surface water only changed the spatial distribution of the inundation area and may enlarge ecological benefits. However, they did not affect the seasonal variations in ecological water diversion.
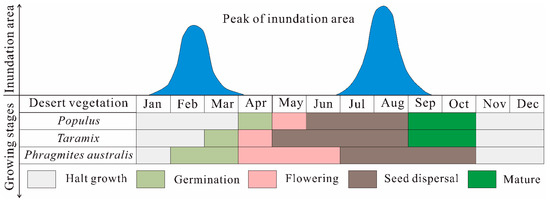
Figure 13.
Peak values in inundation area and growing period of the dominant species (Populus, Tamarix, and Phragmites australis) in the Daliyaboyi Oasis.
5. Conclusions
We digitized and measured the area inundated (i.e., the inundation area) within the floodplain of the Keriya River on 184 Landsat images obtained over a 19-year period (2000–2018) to quantify monthly variations in inundation area within the Daliyaboyi Oasis, located along the lower Keriya River valley. The results demonstrated that (1) the seasonal changes in the inundation area caused marked variations and were characterized by two significant peaks in February (~17.58 km2) and August (~19.57 km2). One significant minimum area of inundation (~0.29 km2) occurred in May; (2) the July/August peak in the inundated area largely dominated inter-annual variation in the inundation area during the 19-year study periods; the occurrence of two main peaks in the inundation area within a year is noteworthy as it was broadly consistent with the desert vegetation’s water demand season; (3) the residence of the Daliyaboyi Oasis used ecological water (surface water) distributed by network of dams to irrigate vegetation in different parts of the oasis during different seasons. Irrigation spatially expanded the area of inundation. We believe that: (1) the February peak in the inundation area was closely linked to elevated downstream groundwater levels and the melting of ice along the river channels (network); (2) the August peak was controlled by the peak values of runoff from headwater areas; and (3) the minimum May value was related to a decrease in upstream runoff and an increase in agricultural water demand. We propose that natural factors control the intra-annual (seasonal) and inter-annual variations in the extent of the inundated area. Human regulation of floodwaters has changed the spatial distribution of the inundation areas, and enlarged its possible ecological benefits; however, they did not alter the correlation between the peak periods of inundation and the vegetation water demand. The results of this study provide a comprehensive understanding of the benefits of the EWDP in the Tarim River Basin. The time series data from the Landsat images (during 2000–2018) used in this study are relatively limited. Other earlier Landsat 1–5 multispectral scanner (MSS) images (from 1972 to 1992, 80 m spatial resolution) and the latest Landsat 9 OLI images (from 2021 to present, 30 m spatial resolution) will help to further improve the long-term temporal variations in the inundation area within the Daliyaboyi Oasis in the past and future.
Author Contributions
Conceptualization, J.W.; methodology, J.W. and D.W.; software, S.L.; formal analysis, Y.G. and J.Z.; investigation, J.W.; data curation, G.L. and S.W.; writing—original draft preparation, J.W. and F.Z.; writing—review and editing, J.W. and F.Z.; supervision, F.Z. and Q.S.; project administration, F.Z.; funding acquisition, F.Z. All authors have read and agreed to the published version of the manuscript.
Funding
This research was funded by the National Natural Science Foundation of China (Grant No. U1178303, U1503381, and U1703237), the Tianshan Cedar Project of Xinjiang Uygur Autonomous Region, China (Grant No. 2017XS21), the Third Xinjiang Scientific Expedition Program (Grant No. 2021xjkk0302), and the National Natural Science Foundation of China (Grant No. 41861053).
Data Availability Statement
Not applicable.
Acknowledgments
We acknowledge the editors and four anonymous reviewers for improving the manuscript. We thank Nurbay Abdusalik, Qianqian Xia, Jinming Yang, Gulaysam Abaydulla, Xuan Li, Jianzong Liu, Hongwei Bian, and Li Chen for their helpful comments on our previous versions of the manuscript.
Conflicts of Interest
The authors declare no conflict of interest.
References
- Sun, J.M.; Liu, T.S. The age of the Taklimakan Desert. Science 2006, 312, 1621. [Google Scholar] [CrossRef] [PubMed]
- Fan, Z.L. Research on the Impacts of Land Utilization to Ecology & Environment in Xinjiang and the Correspondent Countermeasures; Meteorological Press: Beijing, China, 1996; pp. 82–174. [Google Scholar]
- Zhong, W.; Xie, H.B. The preliminary study on historical evolution of man-land relationship in extreme arid area—Taking Tarim Basin as example. J. Xinjiang Univ. Nat. Sci. Ed. 2000, 17, 65–71. [Google Scholar]
- Tang, Q.C.; Zhang, J.B. Water resources and Eco-environment Protection in the Arid Regions in Northwest of China. Prog. Hum. Geogr. 2001, 20, 227–233. [Google Scholar]
- Hamid, Y.; Pan, X.L.; Tashpolat, T.; Ernst, G.; Zhang, F. Water resource development in Tarim Basin and its eco-environmental effects. Resour. Sci. 2002, 24, 48–54. [Google Scholar]
- Chen, Y.N.; Li, W.H.; Xu, H.L.; Liu, J.Z.; Zhang, H.F.; Chen, Y.P. The influence of groundwater on vegetation in the lower reaches of Tarim Basin, China. Acta Geogr. Sin. 2003, 58, 542–549. [Google Scholar]
- Gao, Q.Z. Water resources development and effect on oasis eco-environment at the south edge of Taklimakan Desert. J. Desert Res. 2004, 24, 286–293. [Google Scholar]
- Qian, Y.B.; Fan, Z.L.; Lei, J.Q.; Wu, Z.N. Exploitation of water and land resources and its ecoenvironment issues in Xinjiang of China in recent 50 a. J. Arid Land Resour Environ. 2006, 20, 58–63. [Google Scholar]
- Chen, Y.N.; Zhang, X.L.; Zhu, X.M.; Li, W.H.; Zhang, Y.M.; Xu, H.L.; Zhang, H.F.; Chen, Y.P. Analysis on the ecological benefits of the stream water conveyance to the dried-up river of the lower reaches of Tarim River, China. Sci. China Ser. D Earth Sci. 2004, 47, 1053–1064. [Google Scholar] [CrossRef]
- Yang, G.; Guo, Y.P. The change and prospect of vegetation in the end of the lower reaches of Tarim River after ecological water delivering. J. Desert Res. 2004, 24, 167–172. [Google Scholar]
- Deng, M.J.; Yang, P.N.; Zhou, H.Y.; Xu, H.L. Water conversion and strategy of ecological water conveyance in the lower reaches of the Tarim River. Arid Zone Res. 2017, 34, 717–726. [Google Scholar]
- Deng, M.J.; Zhou, H.Y.; Xu, H.L.; Ling, H.B.; Zhang, P. Research on the ecological operation in the lower reaches of Tarim River based on water conveyance. Sci. Sin. Tech. 2016, 46, 864–876. [Google Scholar]
- Chen, X.; Huang, Y.; Qian, J.; Liu, H.L.; Feng, X.W.; Liu, Y.; Bao, A.M.; Wang, W.S. Simulation analysis on the regulation of overflow ecological water consumption in arid areas. Sci. China Ser. D Earth Sci. 2007, 50, 1–8. [Google Scholar] [CrossRef]
- Huang, Y.; Chen, X.; Qian, J.; Wang, W.S.; Bao, A.M. Eco-gate flood model of Tarim River Basin and its application—A Case study of Canmulik. J. Nat. Resour. 2007, 22, 37–43. [Google Scholar]
- Tursun, K.; Shi, L.; Han, G.H.; Mannisaguli, T. Response of vegetation and desertification to groundwater change due to emergency water supply in lower reaches of Tarim River. J. Desert Res. 2008, 28, 1033–1038. [Google Scholar]
- Ye, Z.X.; Chen, Y.N.; Li, W.H.; Yan, Y.; Wan, J.H. Groundwater fluctuations induced by ecological water conveyance in the lower Tarim River, Xinjiang, China. J. Arid Environ. 2009, 73, 726–732. [Google Scholar] [CrossRef]
- Li, W.H.; Hao, X.M.; Chen, Y.J.; Zhang, L.H.; Ma, X.D.; Zhou, H.H. Response of groundwater chemical characteristics to ecological water conveyance in the lower reaches of the Tarim River, Xinjiang, China. Hydrol. Process. 2010, 24, 187–195. [Google Scholar] [CrossRef]
- Zhang, J.F.; Li, G.M.; Zhang, Y.; Bao, A.M.; Chen, X. Responses of groundwater levels to intermittent water transfer in the lower Tarim River. Chin. J. Geophys. 2012, 55, 622–630. [Google Scholar]
- Chen, Y.N.; Li, W.H.; Xu, C.C.; Ye, Z.X.; Chen, Y.P. Desert riparian vegetation and groundwater in the lower reaches of the Tarim River basin. Environ. Earth Sci. 2015, 73, 547–558. [Google Scholar] [CrossRef]
- Liu, Q.Q.; Gulimire, H.; Su, L.T.; Zhang, Y. Response process of groundwater table to ecological water conveyance in the lower reaches of Tarim River riparian zone. Arid Land Geogr. 2017, 40, 979–986. [Google Scholar]
- Chen, Y.J.; Chen, Y.N.; Li, W.H.; Liu, J.Z.; Chen, Y.P. The reaction of groundwater chemical characteristics to the eco-water conveyance in the lower Tarim River. Acta Geogr. Sin. 2005, 60, 309–318. [Google Scholar]
- Chen, Y.J.; Liu, J.Z.; Chen, Y.N.; Li, X.G.; Zhu, H.Y. Analysis of the relationship between species diversity and hydrologic factors during an interval of intermittent water delivery at the Lower Reaches of Tarim River, China. Acta Ecologi. Sin. 2013, 33, 2212–2224. [Google Scholar] [CrossRef]
- Li, W.H.; Chen, Y.J.; Chen, Y.P.; Huang, X. Effects of ecological stream water transfusion on groundwater level and quality in the lower reaches of the Tarim River. Resour. Sci. 2006, 28, 157–163. [Google Scholar]
- Zhao, Z.Y.; Wang, R.H.; Sun, H.B.; Zhang, H.Z. Assessment of water-recharging based on ecological features of riparian forest in the lower reaches of Tarim River. Chin. Sci. Bull. 2006, 51, 37–42. [Google Scholar] [CrossRef]
- Xu, H.L.; Ye, M.; Li, J.M. Changes in groundwater levels and the response of natural vegetation to transfer of water to the lower reaches of the Tarim River. J. Environ. Sci. 2007, 19, 1199–1207. [Google Scholar] [CrossRef]
- Tao, H.; Gemmer, M.; Song, Y.D.; Jiang, T. Ecohydrological responses on water diversion in the lower reaches of the Tarim River, China. Water Resour. Res. 2008, 44, W08422. [Google Scholar] [CrossRef]
- Deng, X.Y.; Xu, H.L.; Ye, M.; Li, B.L.; Fu, J.Y.; Yang, Z.F. Impact of long-term zero-flow and ecological water conveyance on the radial increment of Populus euphratica in the lower reaches of the Tarim River, Xinjiang, China. Reg. Envir. Chang. 2015, 15, 13–23. [Google Scholar] [CrossRef]
- Bao, A.M.; Huang, Y.; Ma, Y.G.; Guo, H.; Wang, Y.Q. Assessing the effect of EWDP on vegetation restoration by remote sensing in the lower reaches of Tarim River. Ecol. Indic. 2017, 74, 261–275. [Google Scholar] [CrossRef]
- Ling, H.B.; Zhang, P.; Guo, B.; Xu, H.L.; Ye, M.; Deng, X.Y. Negative feedback adjustment challenges reconstruction study from tree rings: A study case of response of Populus euphratica to river discontinuous flow and ecological water conveyance. Sci. Total Environ. 2017, 574, 109–119. [Google Scholar] [CrossRef]
- Ling, H.B.; Xu, H.L.; Guo, B.; Deng, X.Y.; Zhang, P.; Wang, X.Y. Regulating water disturbance for mitigating drought stress to conserve and restore a desert riparian forest ecosystem. J. Hydrol. 2019, 572, 659–670. [Google Scholar] [CrossRef]
- Fu, A.H.; Li, W.H.; Chen, Y.N.; Wang, Y.; Hao, H.C.; Li, Y.P.; Sun, F.; Zhou, H.H.; Zhu, C.G.; Hao, X.M. The effects of ecological rehabilitation projects on the resilience of an extremely drought-prone desert riparian forest ecosystem in the Tarim River Basin, Xinjiang, China. Sci. Rep. 2021, 11, 18485. [Google Scholar] [CrossRef]
- Dou, X.; Ma, X.F.; Huo, T.C.; Zhu, J.T.; Zhao, C.Y. Assessment of the environmental effects of ecological water conveyance over 31 years for a terminal lake in Central Asia. Catena 2022, 208, 105725. [Google Scholar] [CrossRef]
- Huang, P.Y. A study on restricted factor of natural distribution of some desert plants in Xinjiang. J. Arid Land Resour. Environ. 1990, 4, 59–67. [Google Scholar]
- Tang, Q.C. Formation and transformation of runoff in arid regions of China. J. Nat. Resour. 1990, 5, 1–10. [Google Scholar]
- Gao, X.; Ye, B.S.; Zhang, S.Q.; Qiao, C.J.; Zhang, X.W. Glacier runoff variation and its influence on river runoff during 1961–2006 in the Tarim River Basin, China. Sci. China Earth Sci. 2010, 53, 880–891. [Google Scholar] [CrossRef]
- Chen, Y.N.; Wumaierjiang, W.; Aikeremu, A.; Cheng, Y.; Chen, Y.P.; Hao, X.M.; Zhu, C.G.; Wang, Y. Monitoring and analysis of ecological benefits of water conveyance in the lower reaches of Tarim River in recent 20 years. Arid Land Geogr. 2021, 44, 605–611. [Google Scholar]
- Fan, Z.L.; Alishir, K.; Xu, H.L.; Zhang, Q.Q.; Abdumijiti. Changes of Tarim River and evolution of Lop Nur. Quat. Sci. 2009, 29, 232–240. [Google Scholar]
- Chen, H.S. Effect of water in eco-geographic environment of the Keriya River Valley. J. Desert Res. 1988, 8, 38–53. [Google Scholar]
- Zhu, Z.D.; Lu, J.H.; Jiang, W.Z. Study on formation and development of aeolian landform and trend of environmental change at lower reach of the Keriya River, Taklimakan Desert. J. Desert Res. 1988, 8, 1–10. [Google Scholar]
- Fan, Z.L.; Ji, F. The changes of natural environment and the green corridor protection in middle-lower reaches of the Keliya River. Arid Zone Res. 1989, 16–24. [Google Scholar]
- Yang, Y.C. Formation and evolution on Keliya River landforms. Arid Land Geogr. 1990, 13, 37–45. [Google Scholar]
- Kazama, S.; Hagiwara, T.; Ranjan, P.; Sawamoto, M. Evaluation of groundwater resources in wide inundation areas of the Mekong River basin. J. Hydrol. 2007, 340, 233–243. [Google Scholar] [CrossRef]
- Huang, C.Q.; Peng, Y.; Lang, M.G.; Yeo, I.Y.; McCarty, G. Wetland inundation mapping and change monitoring using Landsat and airborne LiDAR data. Remote Sens. Environ. 2014, 141, 231–242. [Google Scholar] [CrossRef]
- Huang, C.; Chen, Y.; Wu, J.P. Mapping spatio-temporal flood inundation dynamics at large river basin scale using time-series flow data and MODIS imagery. Int. J. Appl. Earth Obs. Geoinf. 2014, 26, 350–362. [Google Scholar] [CrossRef]
- Thomas, R.F.; Kingsford, R.T.; Lu, Y.; Cox, S.J.; Sims, N.C.; Hunter, S.J. Mapping inundation in the heterogeneous floodplain wetlands of the Macquarie marshes, using Landsat Thematic Mapper. J. Hydrol. 2015, 524, 194–213. [Google Scholar] [CrossRef]
- Smith, L.C. Satellite remote sensing of river inundation area, stage, and discharge: A review. Hydrol. Process. 1997, 11, 1427–1439. [Google Scholar] [CrossRef]
- Hall, A.; Thomas, R.F.; Wassens, S. Mapping the maximum inundation extent of lowland intermittent riverine wetland depressions using LiDAR. Remote Sens. Environ. 2019, 233, 111376. [Google Scholar] [CrossRef]
- Fuentes, I.; Padarian, J.; Ogtrop, F.V.; Vervoort, R.W. Spatiotemporal evaluation of inundated areas using MODIS imagery at a catchment scale. J. Hydrol. 2019, 573, 952–963. [Google Scholar] [CrossRef]
- Williams, D.L.; Goward, S.; Arvidson, T. Landsat: Yesterday, today, and tomorrow. Photogramm. Eng. Remote Sens. 2006, 72, 1171–1178. [Google Scholar] [CrossRef]
- Chander, G.; Markham, B.L.; Helder, D.L. Summary of current radiometric calibration coefficients for Landsat MSS, TM, ETM+, and EO-1 ALI sensors. Remote Sens. Environ. 2009, 113, 893–903. [Google Scholar] [CrossRef]
- Wulder, M.A.; Masek, J.G.; Cohen, W.B.; Loveland, T.R.; Woodcock, C.E. Opening the archive: How free data has enabled the science and monitoring promise of Landsat. Remote Sens. Environ. 2012, 122, 2–10. [Google Scholar] [CrossRef]
- Wang, J.Z.; Ding, J.L.; Li, G.N.; Liang, J.; Yu, D.L.; Aishan, T.; Zhang, F.; Yang, J.M.; Abulimiti, A.; Liu, J. Dynamic detection of water surface area of Ebinur Lake using multi-source satellite data (Landsat and Sentinel-1A) and its responses to changing environment. Catena 2019, 177, 189–201. [Google Scholar] [CrossRef]
- Wang, J.Z.; Shi, T.Z.; Yu, D.L.; Teng, D.X.; Ge, X.Y.; Zhang, Z.P.; Yang, X.D.; Wang, H.X.; Wu, G.F. Ensemble machine-learning-based framework for estimating total nitrogen concentration in water using drone-borne hyperspectral imagery of emergent plants: A case study in an arid oasis, NW China. Environ. Pollut. 2020, 266, 115412. [Google Scholar] [CrossRef] [PubMed]
- Yang, X.C.; Chen, Y.; Wang, J.Z. Combined use of Sentinel-2 and Landsat 8 to monitor water surface area dynamics using Google Earth Engine. Remote Sens. Lett. 2020, 11, 687–696. [Google Scholar] [CrossRef]
- Roy, D.P.; Ju, J.; Lewis, P.; Schaaf, C.; Gao, F.; Hansen, M.; Lindquist, E. Multi-temporal MODIS–Landsat data fusion for relative radiometric normalization, gap filling, and prediction of Landsat data. Remote Sens. Environ. 2008, 112, 3112–3130. [Google Scholar] [CrossRef]
- Roy, D.P.; Wulder, M.A.; Loveland, T.R.; Woodcock, C.E.; Allen, R.G.; Anderson, M.C.; Helder, D.; Irons, J.R.; Johnson, D.M.; Kennedy, R.; et al. Landsat-8: Science and product vision for terrestrial global change research. Remote Sens. Environ. 2014, 145, 154–172. [Google Scholar] [CrossRef]
- Wang, J.H.; Zhang, F.; Luo, G.M.; Guo, Y.C.; Zheng, J.H.; Wu, S.X.; Keram, Q.; Liu, S.H.; Shi, Q.D. Influence of natural and anthropogenic controls on runoff in the Keriya River, central Tarim Basin, China. PLoS ONE 2022, 17, e0269132. [Google Scholar] [CrossRef]
- Zhou, X.J.; Zhu, F.; Li, S.Q. The formation and evolution of oasis in the Keriya River Valley. Quat. Sci. 1994, 249–255. [Google Scholar]
- Zhou, X.J.; Li, B.S.; Zhu, F.; Wang, Y. The research on the development and evolution of the oasis of Keriya River in the Tarim Basin of Xinjiang. Yunnan Geogr. Environ. Res. 1996, 8, 44–57. [Google Scholar]
- Wei, Y.L. Yutian County Annals; Xinjiang People’s Publishing House: Urumqi, China, 2006; pp. 301–308. [Google Scholar]
- Ni, P.R. History, present situation and evolution prospect of Daliyaboyi Oasis. Arid Zone Res. 1993, 10, 12–18. [Google Scholar]
- Huang, J.J.; Zhang, F.; Shi, Q.D.; Jin, L.L. Variation characteristics for temperature and relative humidity of the natural oasis in the hinterland of the Taklamakan Desert for 2015–2016. J. Xinjiang. Univ. Nat. Sci. Ed. 2019, 36, 267–275. [Google Scholar]
- Tian, Y.Z. Tugayi in the delta the lower reaches of the Keriya River—A natural complex reflecting ecological degradation. J. Desert Res. 1988, 8, 11–25. [Google Scholar]
- Leys, K.F.; Werritty, A. River channel planform change: Software for historical analysis. Geomorphology 1999, 29, 107–120. [Google Scholar] [CrossRef]
- Hughes, M.L.; Mcdowell, P.F.; Marcus, W.A. Accuracy assessment of georectified aerial photographs: Implications for measuring lateral channel movement in a GIS. Geomorphology 2006, 74, 1–16. [Google Scholar] [CrossRef]
- Deng, M.J.; Zhou, H.Y.; Xu, H.L.; Ling, H.B. Regulation of ecological water volume under high-or low-flow in the mainstream area of the Tarim River. Arid Zone Res. 2017, 34, 959–966. [Google Scholar]
- Deng, M.J.; Huang, Q.; Chang, J.X.; Huang, S.Z. Large-scale ecological operation research and practice. J. Hydraul. Eng. 2020, 51, 757–773. [Google Scholar]
- Chen, Y.N.; Chen, Y.P.; Xu, C.C.; Ye, Z.X.; Li, Z.Q.; Zhu, C.G.; Ma, X.D. Effects of ecological water conveyance on groundwater dynamics and riparian vegetation in the lower reaches of Tarim River, China. Hydrol. Process. 2010, 24, 170–177. [Google Scholar] [CrossRef]
- Chen, Y.N.; Chen, Y.P.; Zhu, C.G.; Wang, Y.; Hao, X.M. Ecohydrological effects of water conveyance in a disconnected river in an arid inland river basin. Sci Rep. 2022, 12, 9982. [Google Scholar] [CrossRef] [PubMed]
- Chen, H.S. Ecological environment changes and rational utilization of water resources in the Keriya River Basin. J. Desert Res. 1990, 10, 1–12. [Google Scholar]
- Liu, M.T. Studies on the Tamarix L. of China and Its Extending Utilities; Lanzhou University Press: Lanzhou, China, 1995; pp. 104–121. [Google Scholar]
- Huang, P.Y. Studies of Populus euphratica on the decline and regeneration of the forest lands. J. Xinjiang. Univ. Nat. Sci. Ed. 1984, 97–104. [Google Scholar]
Publisher’s Note: MDPI stays neutral with regard to jurisdictional claims in published maps and institutional affiliations. |
© 2022 by the authors. Licensee MDPI, Basel, Switzerland. This article is an open access article distributed under the terms and conditions of the Creative Commons Attribution (CC BY) license (https://creativecommons.org/licenses/by/4.0/).