Review

LiDAR as a Tool for Assessing Timber Assortments: A Systematic Literature Review

1
Dipartimento di Bioscienze e Territorio, Università degli Studi del Molise, Cda Fonte Lappone s.n.c., 86090 Pesche, Italy
2
Dipartimento di Agricoltura, Ambiente e Alimenti, Università degli Studi del Molise, Via De Sanctis 1, 86100 Campobasso, Italy
*
Author to whom correspondence should be addressed.
Remote Sens. 2022, 14(18), 4466; https://doi.org/10.3390/rs14184466
Submission received: 1 July 2022 / Revised: 14 August 2022 / Accepted: 3 September 2022 / Published: 7 September 2022
(This article belongs to the Special Issue UAV Applications for Forest Management: Wood Volume, Biomass, Mapping)

Abstract

:
Forest ecosystems strongly contribute to the mitigation of climate change impacts through the carbon stored in forests and through harvested wood products, such as sawed wood and furniture, which are obtained from many types of timber assortments. Timber assortments are defined as log sections of specific dimensions (log length and maximum/minimum end diameters), gathered from felled trunks, that have both specific commercial timber utilisation and economic value. However, it is challenging to discriminate and assess timber assortment types, especially within a forest stand before the forest has been harvested. Accurate estimations of timber assortments are a fundamental prerequisite in supporting forest holdings and assisting practitioners in the optimisation of harvesting activities and promoting forest wood chains, in addition to forest policy and planning. Based on the georeferenced points cloud tool, light detection and ranging (LiDAR) is a powerful technology for rapidly and accurately depicting forest structure, even if the use of LiDAR for timber assortments estimation is lacking and poorly explored. This systematic literature review aimed to highlight the state-of-the-art applications of the LiDAR systems (spaceborne; airborne, including unmanned aerial UASs; and terrestrial) to quantify and classify different timber assortment types. A total of 304 peer-reviewed papers were examined. The results highlight a constant increment of published articles using LiDAR systems for forest-related aspects in the period between 2000 and 2021. The most recurring investigation topics in LiDAR studies were forest inventory and forest productivity. No studies were found that used spaceborne LiDAR systems for timber assortment assessments, as these were conditioned by the time and sample size (sample size = ~12 m/~25 m of laser footprint and 0.7 m/60 m of space along the track for ICESat-2, GEDI and time = since 2018). Terrestrial LiDAR systems demonstrated a higher performance in successfully characterising the trees belonging to an understory layer. Combining airborne/UAS systems with terrestrial LiDAR systems is a promising approach to obtain detailed data concerning the timber assortments of large forest covers. Overall, our results reveal that the interest of scientists in using machine and deep learning algorithms for LiDAR processes is steadily increasing.

1. Introduction

Background

Forest ecosystems provide many benefits to society, including economic and environmental benefits; thus, they improve human welfare. Timber is one of the most important products offered by forests and represents 0.7% of the gross domestic product in Europe [1]. Moreover, forests and harvest wood products (i.e., a variety of wood-based products, such as furniture and plywood) are crucial for mitigating climate change due to their carbon content. Exploiting the availability of high-quality timber assortments to supply the forest industry is essential for promoting forest mitigation strategies against climate change. Despite the forest inventory activities providing information about timber production (e.g., aboveground biomass, forest cover, and forest types), the accurate assessment of timber assortment types is challenging and time consuming, and the assessment can often only be carried out using destructive approaches, namely after harvesting operations.
Traditional forest inventory is based on sampling approaches within which certain biometric variables, namely diameter at breast height and tree height, are collected for the sample, which is then processed to predict the timber volume at a larger scale [2]; there is a lack of information about the quality and merchantable use of the available timber, which is barely considered in inventory activities.
Typically, the discrimination, classification, and assessment of timber assortment types through destructive approaches imply: (i) the felling of trees, (ii) the division of each felled tree into log segments, and (iii) the classification of such segments based on geometrical characteristics (i.e., log length, log diameter, and log straightness) and defects (i.e., bark defects) in at least one type of timber assortment (i.e., sawlog, pulpwood, veneer, and fuelwood) [3,4,5,6]. Because it is time consuming and requires qualified staff, alternative remote sensing methods may be helpful for supporting the assessment of timber assortment types, allowing for an accurate estimation of standing trees and a more optimal allocation of revenue for forest owners.
Light detection and ranging (LiDAR) is an active remote sensing technology widely used for depicting forest stand structures (the vertical and horizontal profiles of trees) and other forest inventory variables (Table 1) through georeferenced point clouds. The point cloud is generated by LiDAR sensors, which measure the distance of emitted light to a target [7,8]. In recent decades, LiDAR systems have become crucial and have become increasingly applied in forest inventory activities [9,10]. Additionally, LiDAR systems have been used to assess many aspects of sustainable forest management (SFM), especially forest provision, forest health, forest damage, and forest diversity. The higher accuracy of estimates through LiDAR data collection methods strongly support the development and implementation of SFM and climate-smart forestry strategies [11,12,13].
LiDAR systems can be classified according to three types of scanning, namely satellite, airborne, and terrestrial laser scanning [14,15]. Satellite LiDAR systems are widely used for assessing global forest cover at regional, national, and international scales through widespread measurements [14,16,17]. Spaceborne LiDAR systems allow for the mapping of the aboveground biomass at a global level [18], thus detecting the changes in the forest biomass over time [13]. These systems are found in different LiDAR NASA missions, such as ICESat (Ice, Cloud, and land Elevation Satellite; 2003–2010), ICESat-2 (since 2018), and GEDI (Global Ecosystem Dynamics Investigation; in effect since 2018). The ICESat and GEDI missions record full-waveform LiDAR data, while the ICESat-2 mission records photon-counting LiDAR data. The circular footprint sample size of ICESat and GEDI is ~65 and ~25 m, spaced at ~170 and 60 m intervals along a track, respectively. By contrast, ICESat-2 samples laser footprint segments of ~12 m in diameter, spaced at 0.7 m intervals along a track. ICESat data have allowed remote sensing to determine forest heights and topographic characteristics (https://attic.gsfc.nasa.gov/glas/ (accessed on 10 March 2022)). The combination of ICESat with optical data have also allowed for the estimation of the forest volume and aboveground biomass of different forest types [19,20]. The potential of the ICESat-2 and GEDI missions for determining an assessment of canopy tree height (TH), aboveground biomass (AGB), topography, and carbon cycle has been demonstrated [10,16]. Combining ICESat-2 and GEDI with optical and/or SAR (synthetic aperture radar) allows for the mapping of aboveground biomass at the national level [17], and it also detects the occurrence of disturbance events [13]. A recent study, however, revealed that the ICESat-2 data provided more accurate treetop measurements than GEDI, especially for closed canopy forests. In addition, the calibration and slope of the territory play a crucial role in determining the mensuration accuracy of the ICESat-2 and GEDI data [18,21].
Airborne laser scanning (ALS) is the most suitable group of airborne LiDAR systems for forest inventory and research purposes at local, regional, and national levels [7,9,22,23]. Airborne LiDAR systems also play a key role in forest disturbance detection, where they are able to specifically recognise the symptoms or damage caused by diseases, insects, pests, and fire events [22,23]. The ALS system allows for the remote sensing of tree variables from forests covers at the plot level, supporting both national and international forest inventory and planning activities [7,9,22,23]. Such information, complemented by tree types, was used to assess the habitat quality of large riparian forests [24] and map the tree species composition of mixed forests at the single-tree level [25]. Airborne LiDAR systems have also been used to detect long-term changes in the savanna vegetation of African tropical forests [26] and to evaluate the occurrence of microhabitats in standing trees in multi-layered Mediterranean forests [27]. Terrestrial LiDAR systems, e.g., terrestrial laser scanning (TLS), have allowed for the characterisation of tree health, quantification of forest surface fuel loads, and scheduling of silvicultural activities [28]. Among the ALS systems used for monitoring forest-related aspects at the stand or local level, UAS systems have been one of the most recently used methods [15].
In addition to satellite and airborne LiDAR systems, the interest in using TLS for research has grown due to its automatic, rapid, and realistic representation of a tree structure (i.e., a trunk and branches) at the millimetre level, despite the fact that data collection is time consuming, expensive, and requires well-trained technicians [29,30,31,32]. To facilitate the handling of TLS systems, recent studies have employed alternative terrestrial LiDAR systems, e.g., portable laser scanning (PLS, i.e., using a handheld laser scanner) and mobile laser scanning (MLS, i.e., using a backpack laser scanner). However, compared with TLS systems, the accuracy for these methods are slightly lower with respect to the obtained tree measurements [33,34]. In fact, recent studies [28,35,36,37] have stated that a more detailed reconstruction of deciduous trees (diameter at breast height (DBH) = 61.3–97 cm) using TLS can be carried out through architectural-based methods (i.e., allometric scaling and stem form), which ensure an accurate and realistic quantification of the trunk and branches, supported by tapering curve, branch radii and lengths, and log measurements.
Some studies have employed UAS for forestry applications to collect high-resolution point clouds using aerial vehicles. There has been increased interest in the usage of UAS for research for many reasons, including its high-resolution point density (i.e., detailed description of trees) comparable to TLS point clouds, portability (i.e., being miniaturised airborne equipment), suitability for hosting optical sensors in addition to LiDAR, collection of data in-real time, and limited costs for the operational activities [38,39,40]. However, several researchers have stated that the application of UAS is currently more appropriate for small forest covers and for specific aims (i.e., storm or forest fire events) rather than as a means to support regional and national inventories [30,41,42]. We propose that out of all LiDAR systems, those that are airborne, especially UAS, as well as terrestrial, are most suitable for timber assortment assessment; the acquisition of data using satellite LiDAR systems, despite their potential to cover global forests, is mainly suitable when there are specific time requirements and, moreover, when the sample size is limited [10,14,43,44,45,46,47].
Forest inventory variables (FIVs) and forest productivity variables (FPVs) can be measured using airborne LiDAR systems (i.e., ALS) through two main approaches, namely the area-based approach (ABA) and individual tree detection (ITD) approach [48]. ABA is the most common approach for forest inventory as it provides valid statistical tree measurements (i.e., the diameter at breast height (DBH), TH, basal area (BA), stem volume, AGB, leaf area index (LAI), and plant area index (PAI)) at the plot and stand levels [44,49,50,51]. Unlike the ABA, the ITD approach includes tree measurements (i.e., the taper curve) at a single-tree level, with higher accuracy [52]. ITD-based studies tend to examine pure forest stands rather than mixed forest stands due to the implementation of the approach being affected by occlusion factors from branches to trunks, which are typical of mixed and stratified forests and dense stands [53]. To bypass hindering factors such as canopy closure, recent ITD-based studies have highlighted that this challenge can be tackled through use of a high-resolution point cloud, one that follows a stratification approach, and by utilising unsupervised algorithms for tree detection [54,55,56].
Accurate tree measurements using terrestrial LiDAR systems can be acquired using automatic and semi-automatic 2D layer and 3D methodologies [32]. Some of the algorithms that are most used for modelling tree measurements are embedded in the quantitative structure modelling (QSM), Computree, 3D FOREST, CloudCompare, and OPALS (Orientation and Processing of Airborne Laser Scanning; data available from https://opals.geo.tuwien.ac.at, accessed on 15 July 2022) software [28,47], as well as in the recent LiDAR R packages (i.e., FORTLS) [57]. Considering the high versatility of LiDAR systems, we propose that a well-detailed review based on the progress made in forestry applications using the ALS and TLS systems can support accurate and efficient forest management and planning, with a focus on the most common systems, methods, approaches, algorithms, and forest-related conditions used for the assessment of timber assortment. Furthermore, it can be used for the management of forests under SFM policies at local and landscape level [58].
This systematic literature review aims to describe and discuss what the current state-of-the-art is concerning LiDAR system usage, with respect to quantifying and classifying timber assortments; this review highlights the performance of LiDAR tools and techniques in assessing timber assortments. More precisely, the literature review focuses on describing the LiDAR platforms and systems that are most suitable for assessing timber assortments, highlighting the limitations and performances of the most common methodological approaches (e.g., algorithms and models) from 2000 to 2021. With this study, we attempted to answer these three questions: (i) What is the tendency concerning the use of LiDAR systems for the assessment of timber assortments in the last two decades? (ii) Which forest-related topics are most commonly faced by LiDAR systems worldwide? (iii) Which LiDAR systems can be used for the monitoring of timber assortments?
The methodological approach used to implement the literature review is explained in Section 2, while the results, discussion, and conclusion are presented in Section 3, Section 4 and Section 5, respectively.
Table 1. A description of tree components from the LiDAR (light detection and ranging) systems: ALS (airborne laser scanning), ULS (unmanned laser systems), TLS (terrestrial laser scanning), PLS (portable laser scanning), and GEDI (global ecosystem dynamics investigation). (*) and (**) indicate variables performed while using airborne LiDAR systems studies that use an area-based approach or individual tree approach, respectively [14,28,32,43,44,45,53,57].
LiDAR Systems
Tree MeasurementsAirborne (i.e., ALS, ULS)Terrestrial (i.e., TLS, PLS)Satellite (i.e., GEDI)
1Diameter at breast height *xx-
2Tree height *xxx
3Basal area *xx-
4Tree position and tree crown delineation **xx-
5Tree crown measurements and tree density **xx-
6Tree species composition **xx-
7Stem volume and growing stock volume *xxx
8Aboveground biomass and carbon stock *xxx
9Timber-leaf discrimination -x-
10Stem curve and taper curve **xx-
11Timber assortments (i.e., pulpwood) *xx-
12Stem straightness and stem diameters-x-
13Some vegetation indices (i.e., leaf area index) *xxx
14Leaf area distribution *xxx
15Percent cover and gap fraction *xxx
16Log geometry and wood quality-x-
17Downed dead wood *xx-
18Branch sizes, positions, and orientations-x-
19Harvested trees detection **xxx

2. Methodological Approach

To achieve the aim of this literature review, we implemented a methodological approach based on two steps: paper collection and paper analysis (Figure 1). All papers were stored in a database and subsequently analysed to better describe and discuss the current state-of-the-art usage of LiDAR systems for the quantification and classification of timber assortments.

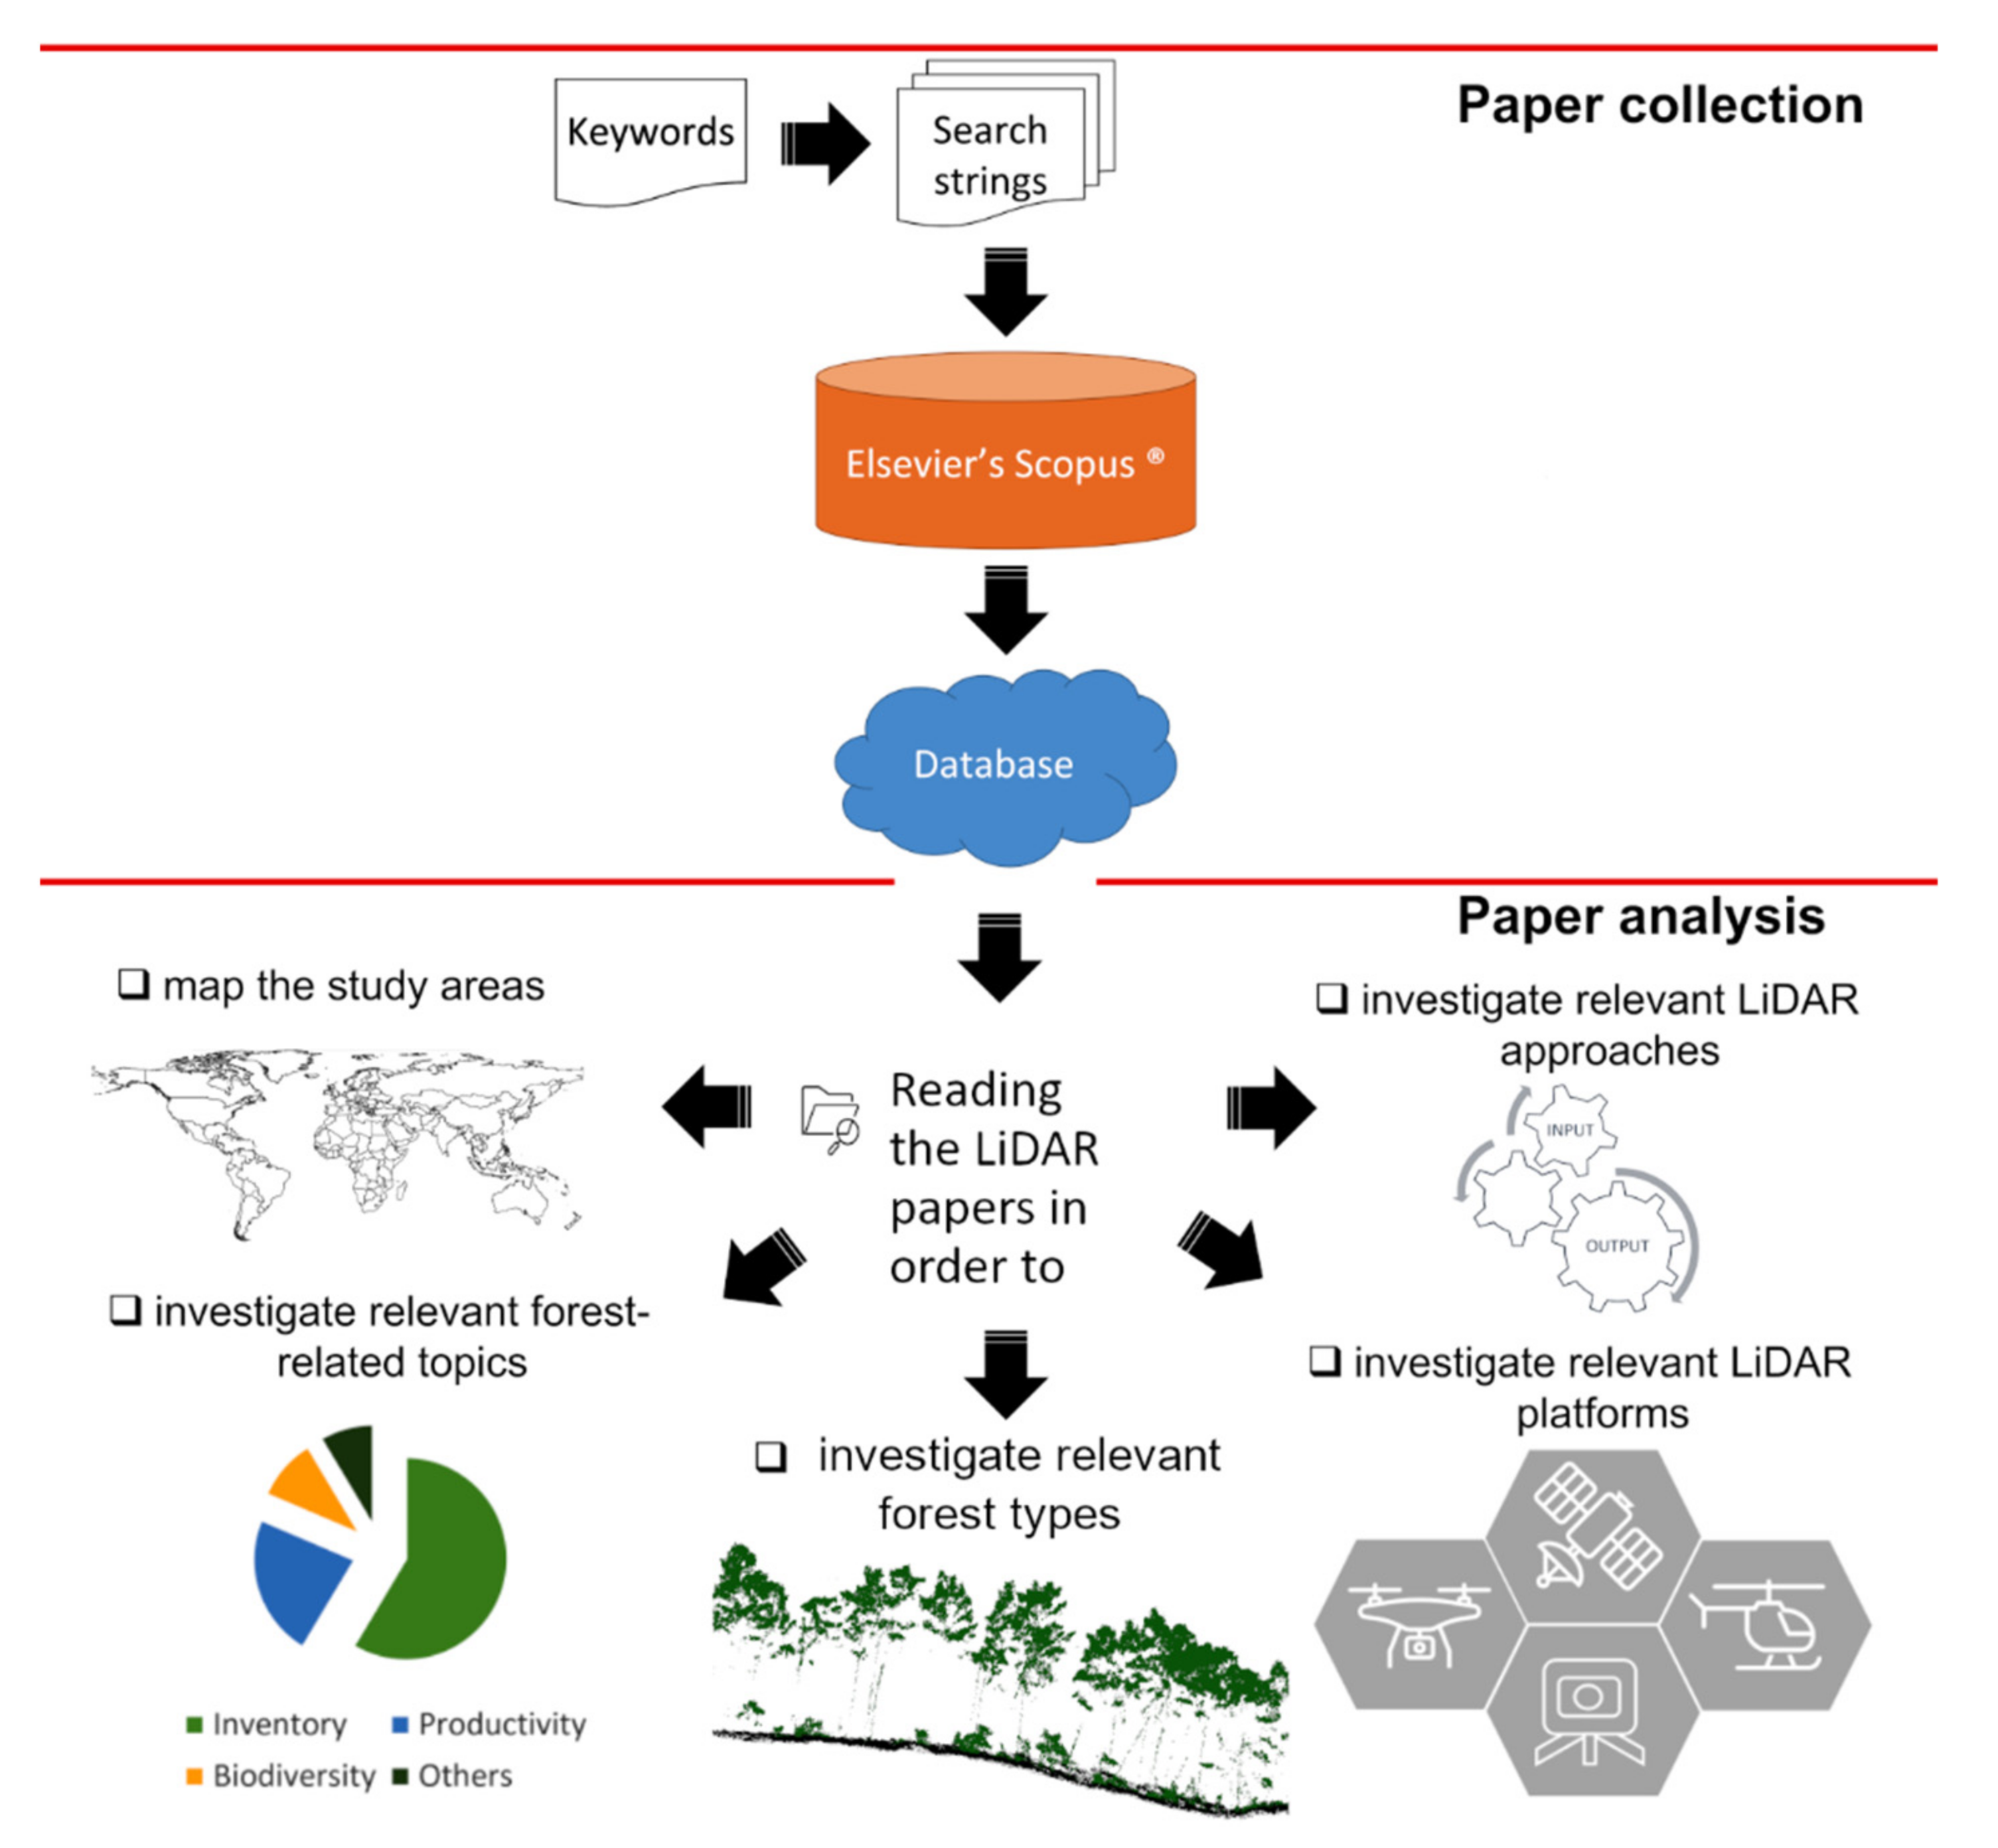
2.1. Paper Collection

To collect peer-reviewed papers focused on the use of LiDAR systems to assess timber assortments, we used ten keywords (Table 2) organised in 12 different search strings (hereafter referred to as codes), within which single (i.e., ‘remote sensing’ and ‘LiDAR’) and composite (i.e., ‘forest* OR woodland’) fixed keywords were considered (Table 3). The items that were considered when searching for papers were ‘article title’, ‘abstract’, and ‘keywords’, stored in Elsevier’s Scopus® engine; we only selected papers written in ‘English’. The time frame of the literature review was customised to range from the early 2000s, when the first studies dealing with LiDAR obtained in this literature review were published [59], to 2021.

2.2. Paper Analysis

We analysed the collected papers to explore: (i) the augmented use of LiDAR systems in forest monitoring and planning worldwide; (ii) the most common forest-related aspects investigated through the use of LiDAR systems; (iii) the estimated performances obtained from different LiDAR systems in terms of their accuracy and standard error, highlighting the most suitable approaches, processes, models, and algorithms.

2.2.1. LiDAR Systems Implementation

For each paper, we extracted the location of the study area to map the geographical distribution of the studies retrieved by the literature review. Moreover, we explored the type of LiDAR system used to carry out the research (e.g., terrestrial, airborne, and satellite), highlighting how the LIDAR data were used in combination with other remote sensing data (Table 4).

2.2.2. What Are the Main Uses of LiDAR for Forest Estimates?

The aims of each paper were precisely determined and classified into six topics:
Inventory (I) includes the papers that used satellite, airborne, and terrestrial LiDAR systems for the estimation of the most common forest inventory variables (e.g., DBH, TH, and BA) over distinct forest types to support forest statistics, reports, and monitoring activities.
Productivity (P) includes the papers that dealt with the assessment of timber productivity in terms of stem volume, AGB, carbon stock, sawlog volume, and pulpwood volume.
Accuracy (A) includes the papers that tested and compared different algorithms, methods, or approaches for improving either the pre-processing or processing of point clouds acquired by LiDAR systems.
Biodiversity (B) includes the papers that used the forest structure reconstructed by LiDAR systems to assess indicators of biodiversity, e.g., the occurrence of bird species, tree species composition, and habitat quality.
Climate change (C) includes the papers that assessed the climate change effects on forest stands, evaluated the health status of forests using LiDAR systems, or mapped the occurrence of disturbing events (i.e., fire, pests, landslides, and drought events).
Review (R) includes the paper reviews found in the database.

2.2.3. Advances in the Methods and Outputs of LiDAR Systems

Finally, we accurately examined all the papers, except those belonging to the ‘R’ cluster, to compare the methodology and the outputs obtained in different forest types and structures (i.e., coniferous, deciduous, and mixed forests). In order to go into depth on the timber assortment evaluation using LiDAR systems, we examined the progress made in LiDAR system applications through a chronological description of the papers from the ‘P’ cluster, paying particular attention to the paper’s aims and methods, approaches, or algorithms.

3. How Are Forest Monitoring and Management Supported by LiDAR Systems?

In this section, we describe the main outputs determined from the literature review, highlighting the advances in the LiDAR system applications, methods, and forest-related topics investigated worldwide.

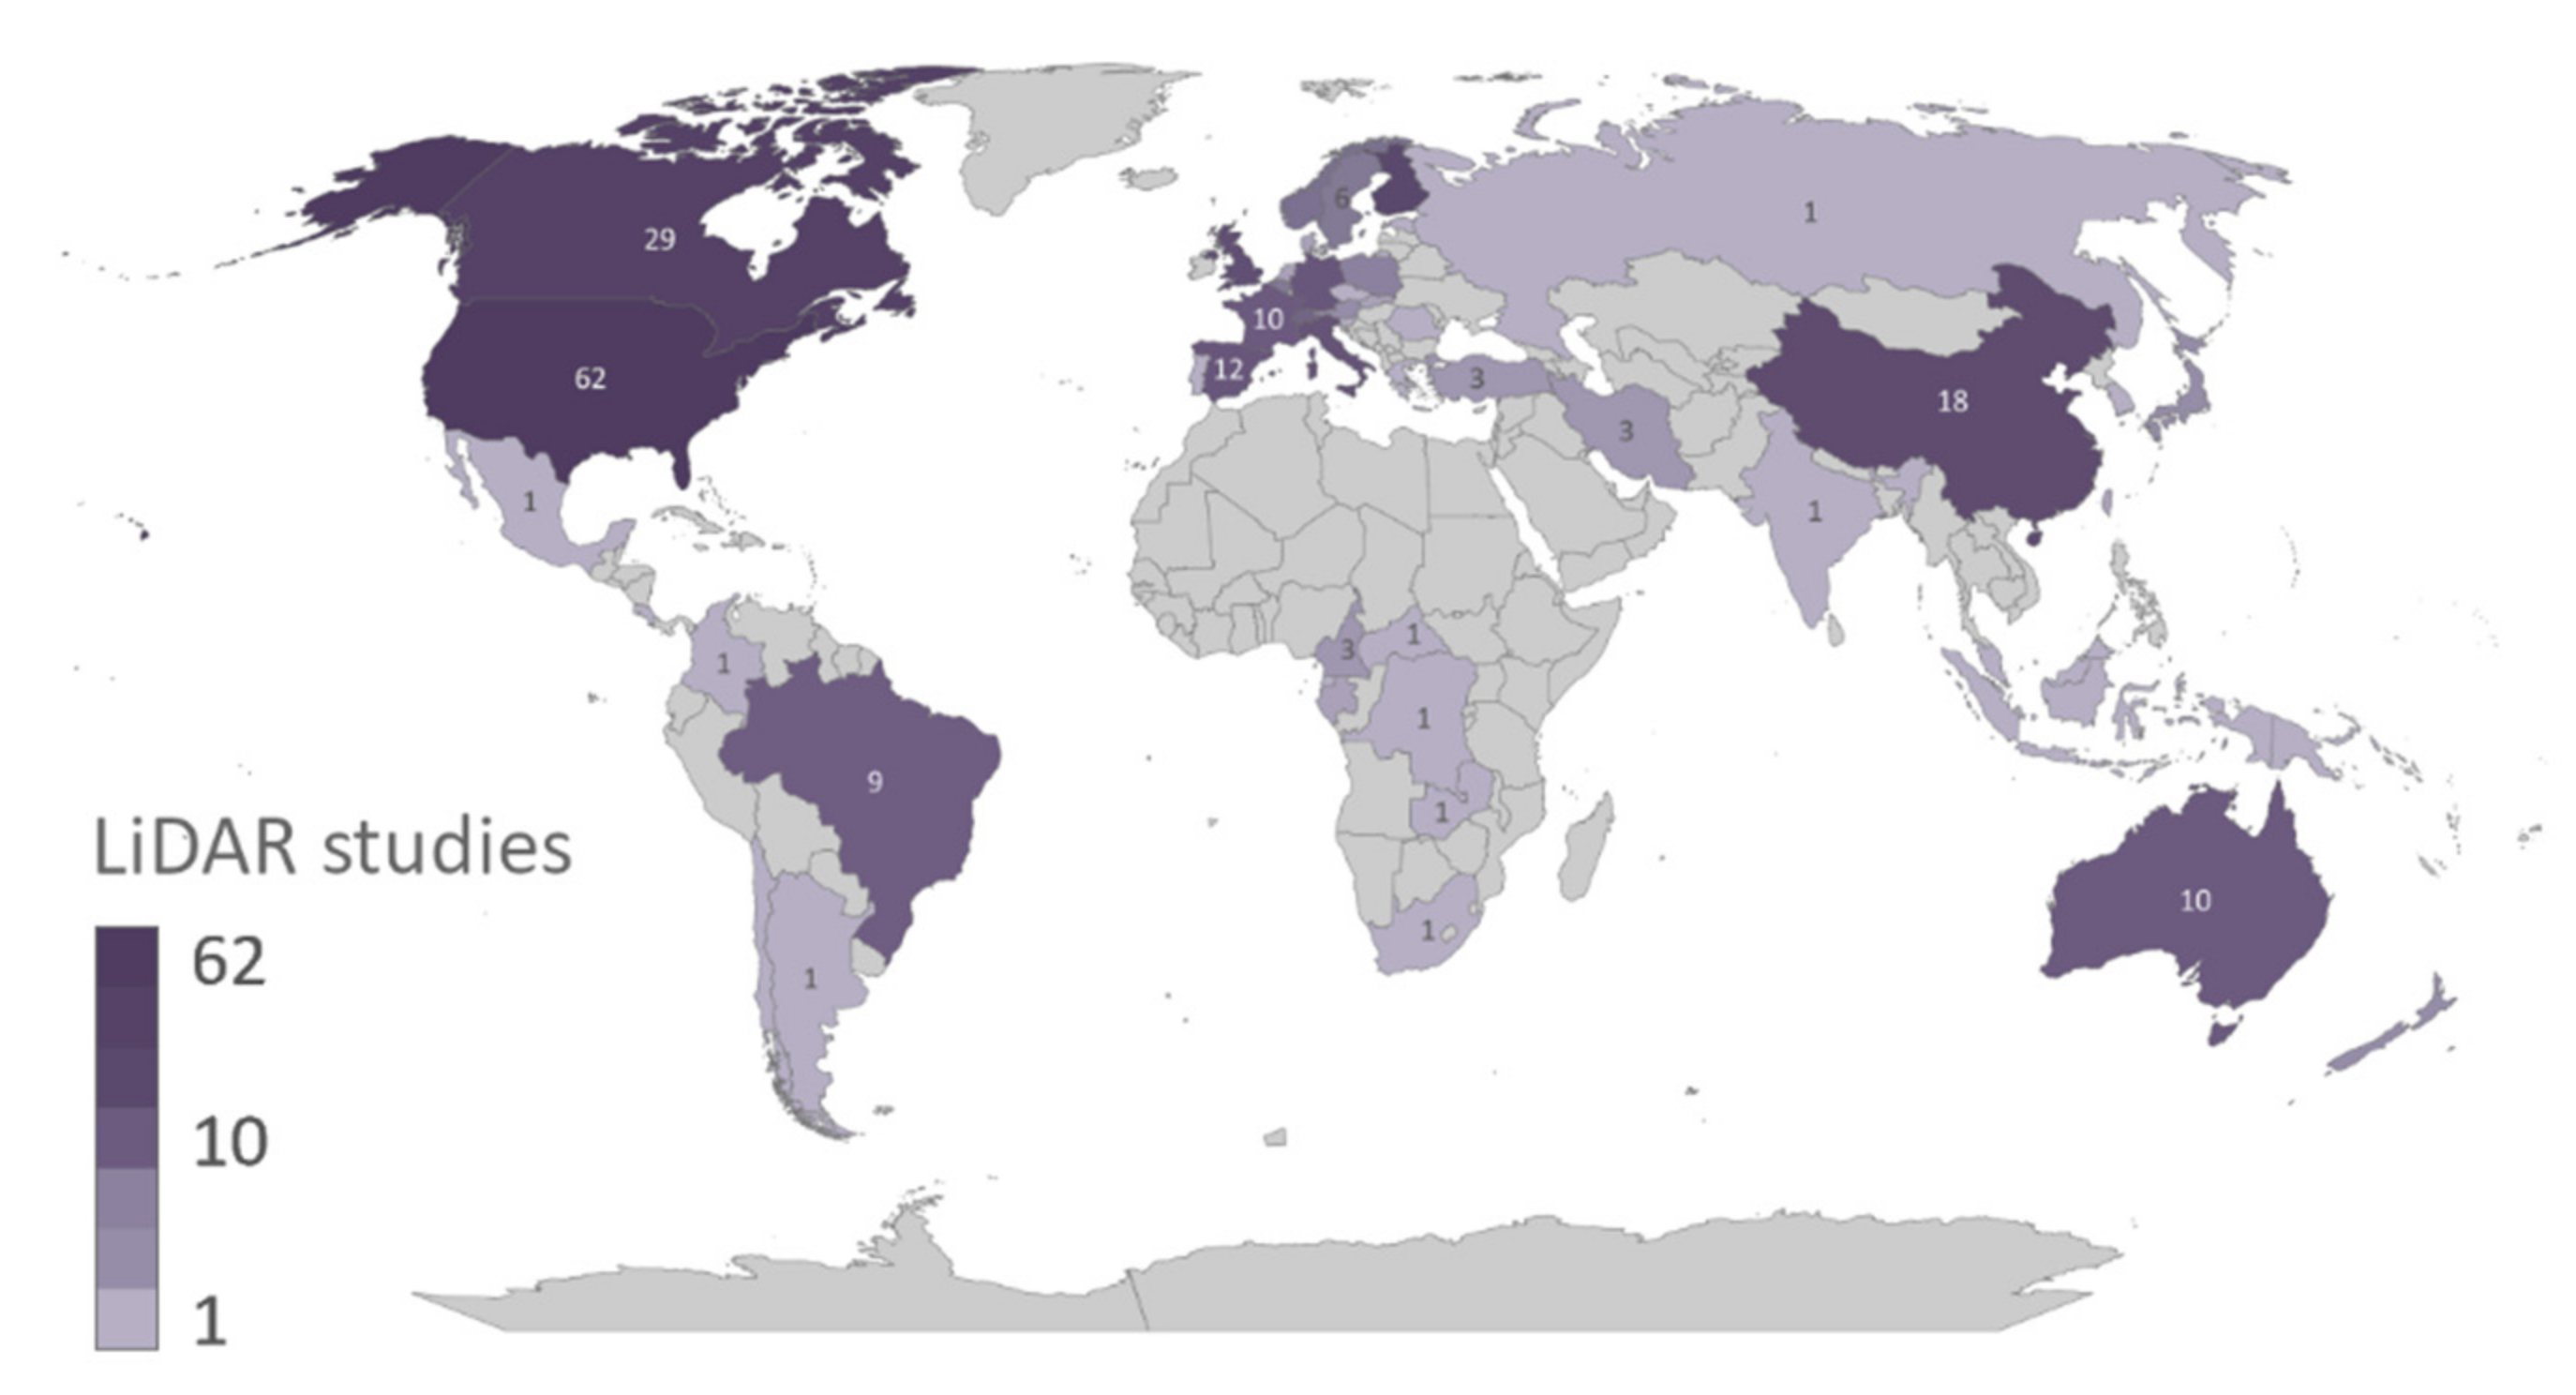
3.1. Literature Review

The 12 codes resulted in the collection of 491 papers, and after a first round of screening, we identified 187 papers that were replicated because of the different codes used for collection. After removing these replicates such that the included papers would only be considered once, we were left with a total of 304 papers that successfully satisfied our queries and were used in this literature review. From the results of the literature review, it can be seen that the number of published papers steadily increased from 2000 to 2021, with a slight decline in publications in the years 2012 and 2013 (Figure 2).
The results highlighted that a more general term, such as ‘forest volume’, was more frequently explored, and one such as ‘timber assortments’ was rarely studied. We observed that six out of twelve codes (i.e., SC2, SC3, SC6, SC7, SC9, and SC10) allowed for the collection of a low number of papers (Table 5), indicating the lack of LiDAR system applications in the assessment of timber assortments. Concerning the most successful codes, namely those that focused on volume estimation, SC12 allowed us to collect 167 papers, followed by the SC11, SC5, and SC4 codes, which identified 84, 82, and 76 papers, respectively. Overall, the keywords that allowed us to obtain a higher number of papers were ‘tree’ and ‘volume’, while ‘assortment*’ and ‘morphology’ led to the least number of papers.

3.2. Advances in LiDAR System Implementations

From a geographical point of view, most of the LiDAR studies were carried out in countries within North America, Europe, and Asia, with the United States accounting for 20.39% (63 studies), Canada accounting for 9.54% (29 studies), Finland accounting for 7.57% (23 studies), and China accounting for 5.92% (18 studies). After Finland, the representation of the five most investigated European countries (i.e., United Kingdom, Italy, Spain, Germany, and France) ranged between 3.29% (10 studies) and 5.59% (17 studies). The most important South American and Oceanian countries chosen by researchers to explore forest productivity topics were Brazil (2.96%; 9 studies) and Australia (3.29%; 10 studies), respectively (Figure 3).
We found that about half of studies combined LiDAR systems with other RS systems (50.9%), while the remaining studies (49.1%) used only LiDAR systems, of which most used airborne LiDAR systems (39.8%), and a lower number of studies focused on terrestrial (8.6%) and satellite (0.7%) LiDAR systems (Figure 4).
The combined use of LiDAR systems and imagery from both airborne and satellite systems (15.8% and 12.8% of the collected studies, respectively) appears to have been very successful in assessing SFM indicators, forest accessibility, and forest health, contributing to fire detection or pest events and supporting forest management and planning.
The results revealed that the GLAS (Geoscience Laser Altimeter System), which is mounted on NASA’s ICESat satellite, and the GEDI were the only two satellite LiDAR systems used for forest monitoring and assessment. Moreover, they were used in combination with satellite images as multispectral bands (i.e., Landsat TM/ETM+, Sentinel-2A), panchromatic bands (e.g., WorldView-2 and WorldView-3), and synthetic aperture radar (i.e., ALOS-2) [60,61].
The literature review highlighted that only in the last few years (2018–2021) has there been an increment in studies (10% ≡ 12 out of 122 papers) focused on the use of UASs for forest inventory issues at the plot level.
Examining the sensors, we found that the most common sensors mounted on the airborne LiDAR systems were from the ‘Leica’, ‘Optech’, and ‘Riegl’ companies, and fewer sensors were from the ‘TopEye’, ‘TopoSys’, ‘SLICER’, and ‘YellowScan’ Mapper companies.
For most studies where terrestrial LiDAR systems were implemented, the most commonly used sensor were ‘Leica’, ‘Ilris-3D’, ‘Optech’, and ‘FARO’, while ‘Zoller + Fröhlich GmbH’, ‘Echidna validation instrument’ (EVI), ‘Trimble TX8’, and ‘ZEB-REVO’, were barely used.

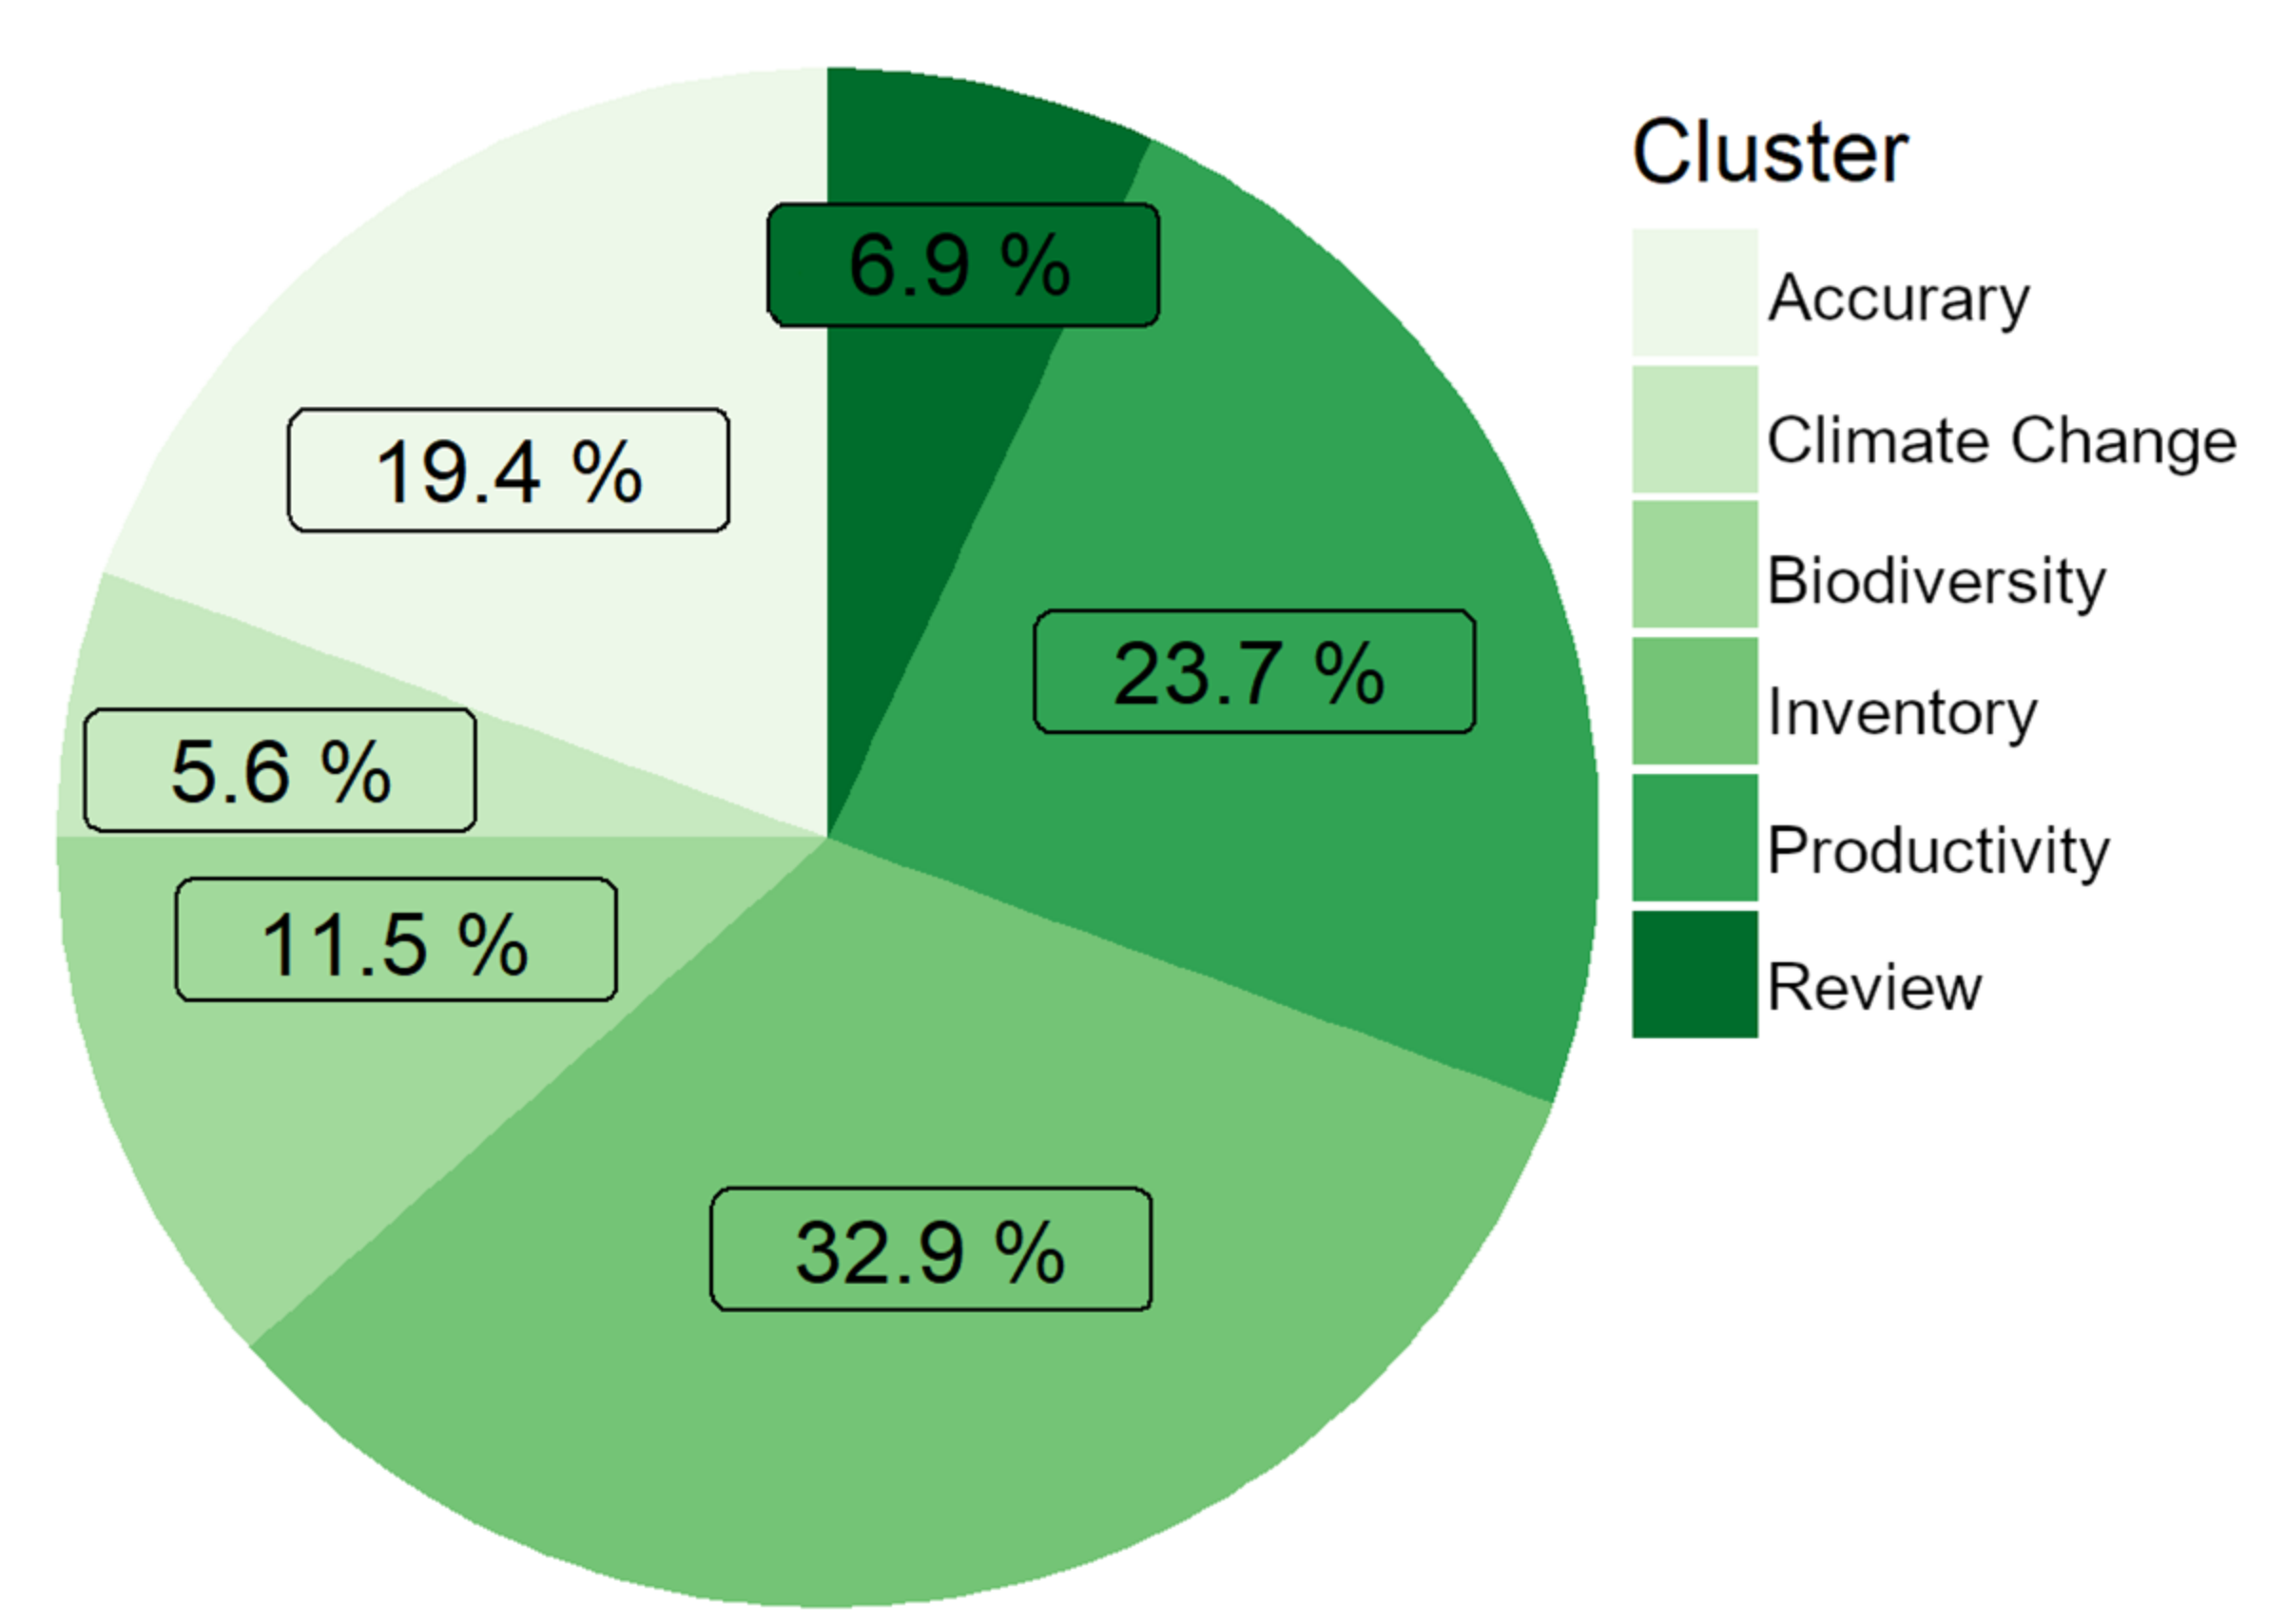
3.3. Forest-Related Topics Explored Using LiDAR Systems

The literature review highlighted that forest inventory and forest productivity topics accounted for more than half of the total published papers, at 32.9% (I) and 23.7% (P), respectively (Figure 5). A considerable number of papers (19.4%; A) focused on the development and testing of novel and robust methods for the handling the data from LiDAR systems through models and statistic fundamentals.
A limited number of studies investigated specific forest-related aspects, such as the habitat quality of individual birds (11.5%; B), the health status of the forest, pre- and post-fire events, and pest/disease recognition (5.6%; C). Finally, narrative studies accounted for one of the less-explored clusters (6.9%).

3.4. Advances in the Methods and Outputs of LiDAR Systems

Regarding the tree species composition, we found that more studies that used LiDAR systems for forest monitoring activities were implemented in mixed forest stands rather than pure forest stands, numbering 155 vs. 128, respectively (Table 6). The studies that focused on pure stands were mainly carried out within conifer stands (86 out of the 128 papers) rather than deciduous forests (42 out of the 128).
More precisely, the studies from clusters ‘A’, ‘B’, ‘C’, and ‘I’ were mainly carried out in mixed forest stands (Figure 6). Contrarily, studies that focused on forest productivity (i.e., the assortment estimation) were mainly carried out within pure forest stands, particularly in conifer forest stands.

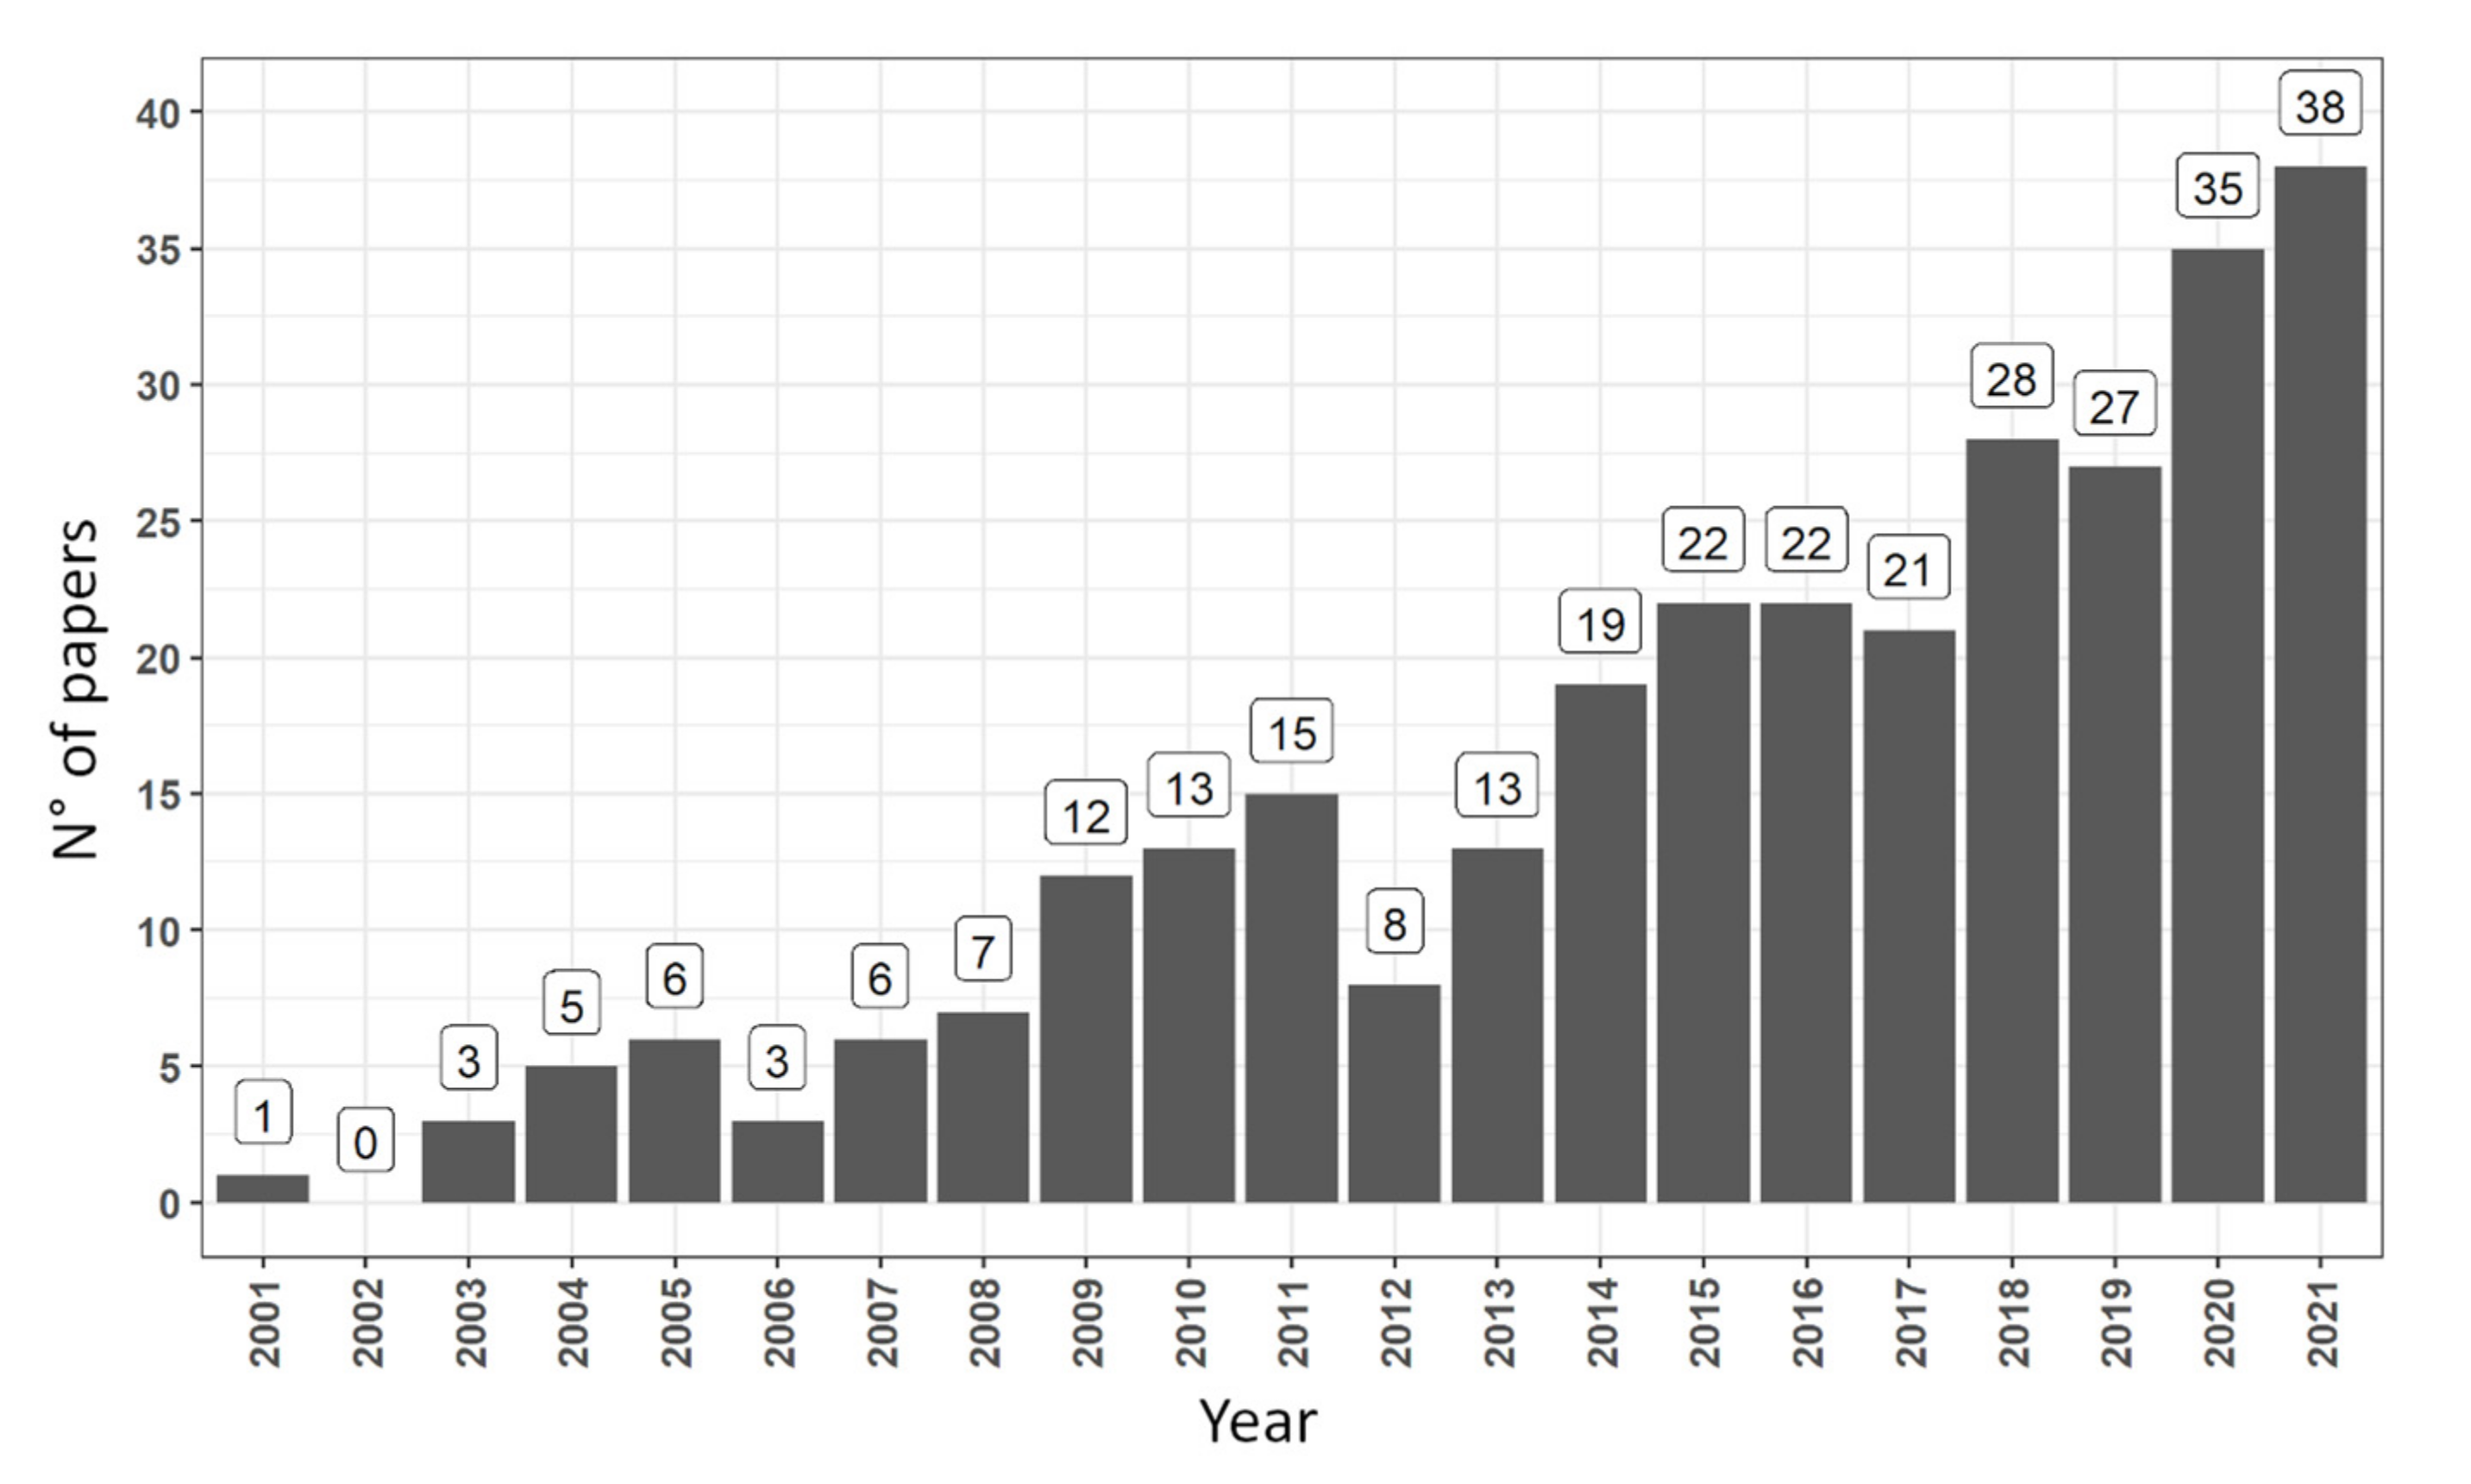
3.5. Diachronic Analysis of LiDAR Implementation

Over the years, significant advancements have facilitated the use of LiDAR systems and data for the assessment of forest-related aspects, particularly for the assessment of forest structure and for the investigation of several tree biometric variables. Overall, from the millimetre to metre scale of detail, the architecture of standing trees can rapidly, automatically, and non destructively be characterised by all three types of LiDAR systems: satellite (i.e., GEDI), airborne (i.e., UAS), and terrestrial (i.e., TLS). Nevertheless, despite satellite LIDAR systems covering a higher surface of forest, airborne LiDAR systems are the most appropriate for assessing forest inventory variables (i.e., TH, AGB, and forest cover) due to the higher accuracy and versatility (i.e., data were used for the assessment of many aspects) at both the local and tree levels. Nonetheless, very accurate information at the tree level—such as stem curve, stem diameters, and stem taper—for which it is essential in order to know the stem form and therefore to support the estimation of timber assortments, can only be obtained through the use of terrestrial LiDAR systems.
Moreover, the integration of data from different LiDAR systems is greatly important, as well as integrating these systems with active/passive remote sensing systems; this integration allows for the enlargement of the range of applicability for LiDAR systems to also cover the evaluation of ecological indicators (i.e., tree species classification), which is otherwise impossible through the use of LiDAR systems only.
One of the most important steps in LiDAR implementation was achieved in the early 2000s when, for the first time, two studies [62,63] developed two robust methods for detecting single trees and demonstrated a higher accuracy than what was obtained through an ABA approach. Both methods used a local maxima filter with a variable window size (LMWS) for detecting dominant trees (~37% of detection rate ‘DR’), and the region growing algorithm and Arboreal Forest Inventory Tools software were used to segment the crown shape of trees [62,63]. In 2007, Chen et al. [64] defined ‘watershed segmentation’ as a promising method that allowed for a more realistic delineation of the tree crown feature and promoted the use of ALS metrics to capture more details of the tree crowns, e.g., ‘canopy geometric volume’.
In 2009, Antonarakis et al. [65] used, for the first time, terrestrial LiDAR systems, namely TLS, to characterise the vertical and horizontal tree canopy structure at a high resolution. The potential for collecting points of the Leica TLS system was 300 m, with a point accuracy equal to 2–4 mm.
Meanwhile, Kim et al. [66] recommended the use of ALS’s intensity as a driver to separate live/dead trees and estimate the AGBs for both. The predicted AGB values for living and dead trees were calculated using ALS intensity metrics through a stepwise regression approach. The results were more accurate for living trees (AGB; R-squared value = 0.76; RMSE’ = 46.1 Mg ha−1) as opposed to dead trees (AGB; R-squared value = 0.62; RMSE = 37.09 Mg ha−1). Meanwhile, Nelson et al. [19] introduced an innovative approach for estimating the stem volume of mixed-species stands, combining the data of the satellite LiDAR system and ICESat/GLAS (i.e., GLA01 and GLA14 GLAS standard products) with MODIS images. The accuracy obtained, which was determined from comparing the predicted stem volume with the observed stem volume from GLAS/MODIS, was 1.1%.
In 2010, machine learning algorithms (i.e., nearest neighbours (NN) and random forest (RF)) were used, for the first time, to estimate the stem volume and AGB of a large managed forest area using data from ALS systems combined with multispectral images [67]. In this study, the modelling approach followed by the NN algorithm used the metrics of ALS systems selected from the genetic algorithm (GA) and stepwise linear regression approach. In 2011, researchers introduced different automatic algorithms to analyse the point clouds acquired by TLS systems in the characterisation of standing trees and to discriminate the timber from leaf points. In particular, Yao et al. [68] introduced an algorithm known as ‘find trunks’, which allowed for the automatic detection and reconstruction of the stem diameter ‘DBH’ and tree position. Moorthy et al. [69] introduced an approach known as ‘cross-sectional slicing’, which is suitable for the characterisation of the tree crown profiles through the division of point clouds into several horizontal slices to predict the TH, stem crown width/height, and stem crown volume. Næsset et al. [50] defined the strengths and weaknesses associated with the use of interferometric synthetic aperture radar (InSAR) as auxiliary data to data derived from ALS systems for AGB estimation at the local level.
Between 2012 and 2013, studies tested the potential of the ALS and PLS systems for different forestry applications, even in tropical forests. For instance, d’Oliveira et al. [49] stated that ALS systems could allow for the tracing of harvesting activities in tropical forests and could assess the impacts of scheduled logging and deforestation activities. Allouis et al. [70] compared the results obtained in predicting the AGB and used both discrete return and full-waveform airborne LiDAR data. The results of the full-waveform data were more accurate than those obtained by discrete return (discrete return: adjusted R-squared = 0.88, mean error = −15% ± 49%, compared with full-waveform: adjusted R-squared = 0.91, mean error = −12% ± 54%). Hosoi et al. [71] highlighted a voxel-based approach (voxel size of 0.13 cm3) which could facilitate the reconstruction of the tree architecture using a PLS system. The stem volume accuracy that was obtained was higher for the stem and large branches (error = 0.5%) than for small branches (error = 34%).
Between 2014 and 2015, Vastaranta et al. [72] demonstrated that modern synthetic aperture radar ‘SAR’ products from the TerraSAR-X mission (~1 m of high-resolution) could be considered as powerful auxiliary data to integrate and support low-resolution ALS systems (~0.5 points per m2 and grid size of 2 m) in the mapping of AGBs at the regional level. Lang et al. [73] ensured that, through machine learning analysis (i.e., the k-NN algorithm), it was possible to assess the timber provision of managed mixed forests by combining ALS systems with low-resolution images (i.e., Landsat-8 OLI). Miller et al. [74] highlighted that the use of hyperspectral images (Nikon D5000, Lens: AF-S NIKKOR 35 mm) represented a suitable and friendly low-cost source to produce 3D tree models, enabling the prediction of stem and branch volumes. Nevertheless, Miller et al. [74] also highlighted that the models failed for very small branches (<0.5 cm), e.g., those located between 20 and 30 cm from the final part of the branches.
Between 2016 and 2017, some studies endeavoured to gain in-depth knowledge on the utility of implementing an ITD approach in different forest stands. In particular, Sačkov et al. [54] proposed an algorithm known as ‘reFLex’ to detect the trees belonging to the understory and overstory layers, which were determined using a stratification approach of the point cloud (average of 30 points m−2). This algorithm was more accurate for dominant (DR = 66%) and codominant (DR = 48%) trees as opposed to intermediate (DR = 18%) and suppressed (DR = 5%) trees. Shinzato et al. [75] that the ITD approach offered a more realistic and accurate prediction of the stem volume than that which was obtained following the application of an ABA approach in plantation stands.
Meanwhile, other studies published their progress in deriving commercial timber products using LiDAR systems. Particularly, Silva et al. [45] stated that the metrics derived from ALS systems could be used to quantify the volume of some assortments from standing pine trees at the plot level through machine learning analysis (i.e., RF), especially with respect to sawlog (adjusted R-squared = 0.95 ± 0.02 and bias = −0.82% ± 2.45%) and pulpwood (adjusted R-squared = 0.91 ± 0.04 and bias = −0.49% ± 2.73%). Yoga et al. [76] confirmed that the combined use of ALS systems with panchromatic images (10 cm of pixel resolution), rather than using only ALS systems, has become crucial for the classification of dead/live trees as well as for the prediction of the merchantable timber volume of dead/live trees.
In 2018, Wilkes et al. [77] studied the key role of the urban forest in fighting climate change and proposed an unsupervised process for detecting trees within urban areas, guaranteeing a better surveillance and combining ALS systems with TLS systems. Meanwhile, Côté et al. [78] introduced an algorithm that was developed in the early 2010s known as ‘L-Architect’, which is suitable for producing surrogate FIVs data from sampling sites using TLS systems with poor reference data. For this algorithm, it is suitable to use the TLS systems’ output data for training purposes to produce surrogate data for ALS systems (the upscaling of TLS using ALS systems).
In 2019, Weinstein et al. [79] proposed a novel approach, based on a deep learning neural networks algorithm, for the detection of deciduous trees (stem position: sensitivity measurement = 0.81, tree crown overlap ‘>50%’: recall = 0.69, precision = 0.61). Meanwhile, Cao et al. [80] was the first to use a UAV LiDAR device, and described it as an interesting tool allowing for the collection of high-resolution data with a reasonable expenditure. On the other hand, Chen et al. [81] revealed that the use of PLS systems could be advantageous, particularly because the collection of data is faster than for other tools, even if the resulting accuracy is slightly lower compared with TLS systems.
In 2020, Socha et al. [82] evaluated the forest site productive index based on metrics derived from ALS systems. However, da Silva et al. [83] suggested that better accuracy could be obtained by particular modelling approaches, such as machine learning, regardless of the quality of the raw LiDAR data.
In 2021, Sanz et al. [84] introduced a stepwise approach to assess the provisioning of timber assortments and their economic value through the combined use of ALS systems with multispectral images. Meanwhile, Li et al. [85] introduced a robust approach to derive stem taper functions for a Larix olgensis forest stand; here, they used a least squares cylinder fitting approach for the detection and measurement of diameters along the stem axis, which represent the input data for calculating the stem tapering of trees. Thereafter, the output stem taper was used for customising stem taper functions.

3.6. The Development of Methods for Assessing Timber Assortments Using LiDAR Systems

In this literature review, we assumed that LiDAR data, particularly data derived from airborne and terrestrial LiDAR systems, could accurately depict the architecture of trees and therefore be used to virtually calculate timber assortment types and volumes. Most of the explored methodological approaches are organised into pre- and post-processing steps.
The pre-processing algorithms include: (i) open-source algorithms (i.e., CloudCompare software, R packages, FUSION v3.50, and Computree®), (ii) commercial software (i.e., LiDAR360, Cyclone 5.5, TerraScan®, and LASTools®), and (iii) open-source software for scientific purposes, i.e., OPALS (the Opals Orientation and Processing of Airborne Laser Scanning data software). However, several LiDAR systems’ companies have already included the pre-processing software in their systems, fostering the implementation of the methodological approach.
Regarding post-processing, the literature review highlights that several algorithms and models can be applied (Table 7). In summary, for post-processing airborne LiDAR data, the methodological approach includes (i) stem detection, (ii) predictor metric selection, and (iii) timber assortment modelling in the case of airborne LiDAR data, while for terrestrial LiDAR data, it includes (i) timber-leaf discrimination, (ii) stem detection, (iii) stem reconstruction, and (iv) assessment of timber assortments.

4. Discussion

4.1. Advances in the Implementation of LiDAR Systems

As expected, most of the studies have been carried out in developed countries, even if a general increase in recent years was observed worldwide. One of the driving factors justifying the wider use of LiDAR systems for the monitoring of forest-related aspects can be found in the huge quantity of data provided by LiDAR sensors, high versatility of data for many usages (i.e., assessing forest cover, forest productivity, and forest structure), and higher accuracy, particularly through the integrated use of LiDAR sensors with other remote sensing products. For these reasons, LiDAR systems have found a large application not only among forest researchers but also among forest owners and technicians, contributing to continuous and improved practicability and accuracy. In fact, purely from the evaluation of forest inventory variables (i.e., TH, DBH, AGB, and timber volume), LiDAR studies have become helpful in assessing ecological indicators (e.g., wooded habitats for birds [91] and tree species composition [25,92]), climate change-related issues (i.e., fire/pest event detection and the loss/gain of forests after windstorm/deforestation events [48,93]) in addition to timber assortments (e.g., [85]).
Moreover, this increase in usage is also supported by the fact that LiDAR systems provide statistically validated and representative tree measurements to support local, regional, and national forest inventories and management alike [9,14,41,94]. Moreover, we observed continuous progress in cost-effectiveness and efficiency in time spent collecting data over the years, and the results further support LiDAR applications. For example, airborne LiDAR systems were two times more profitable than traditional surveys in terms of cost [93], and terrestrial LiDAR (i.e., PLS) systems were less time-consuming than traditional surveys were in collecting data [81]. Nevertheless, the implementation of the systems still require consistent funds, justifying a wider implementation in developed countries or in countries with large forest covers or within a well-established forest chain and timber industry [3,95]. Regarding the funding that was received for the usage of LiDAR systems in forestry applications, the literature review highlighted that most of the explored studies (72.6%) received public funding, of which 29.8% came from national funding, 7.1% and 3.4% came from research institutes and universities, respectively, and 2.1% were funded by Europe. No information about the funders for the remaining 30.2% of the studies was available.
Despite the numerous efforts to simplify the management of the enormous quantity of LiDAR data, a highly specialised staff is still required to take advantage of different LiDAR and remote sensing systems and in handling raw data. This aspect is particularly important for fully exploiting the raw data and for integrating LiDAR data with other remote sensing systems in order to retrieve accurate information from forest stands when LiDAR systems collect low-resolution point clouds [96], for example, when LiDAR systems collect low-density point clouds (<10 points/m2). Often, the integration of data from different RS sensors results in higher accuracy and is particularly advantageous for some forest health-related aspects or upscaling information collected at the local scale (i.e., [97,98]). Moreover, the assessment of assortment variables through the combined use of remote sensing devices has barely been explored. Conversely, the combined use of ALS systems with TLS systems offers an accurate estimation of timber assortments, as well as stem density and distribution within forests [99].
The crucial role played by machine and deep learning algorithms will, over the years, foster the transition from an ABA approach to an ITD approach, thus ensuring the use of LiDAR systems in the qualification and classification of different types of timber assortments of standing trees. The higher versatility of these algorithms has allowed for the implementation of several functions that cover many aspects of timber assortment evaluations (i.e., predicting, upscaling, modelling, classifying, and processing a huge quantity of points).
The advancements in learning algorithms lie in the strategies used for handling LiDAR data. For example, the Random Forest algorithm is a nonparametric approach suitable for processing a huge quantity of LiDAR points through a decision tree approach and select the most explicative LiDAR metrics through a variable importance approach [100]. The k-NN algorithm is also a nonparametric method that assigns an environmental parameter value to every pixel by applying the weighted average of the nearest ‘k’ that is observing parameter values [101]. Despite the countless benefits provided by machine and deep learning algorithms, their use in the estimation of timber assortments is still limited, especially in forests that are characterised by mixed species and a multi-layered canopy structure [45,94]. For this reason, studies using learning algorithms for the assessment of timber assortments have become crucial in calibrating their potential, as they can ensure timely and optimal decisions in forestry applications.

4.2. Advances in LiDAR Methods and Outputs

The data acquired by LiDAR systems provide a non-destructive and immediate means for the reconstruction of forest stands and a three-dimensional reconstruction of trees. From the literature review, we determined that among the three platforms (i.e., satellite, airborne, and terrestrial) that can mount LiDAR sensors, airborne LiDAR sensors were the most used. Overall, the UAS method remains the best system to implement the ABA approach, as it allows for a relatively faster collection of high-resolution point clouds at a low cost and at a local level, even in inaccessible/abandoned forest covers [41,42,92]. In contrast, for the ITD approach, terrestrial laser scanning is the most appropriate tool for deriving accurate information about tree densities and dimensions. Despite the satisfying accuracy highlighted in studies focusing on the assessment of timber assortments, contrasting results are present between pure and mixed tree species stands, as well as between mono-layer and multi-layer stands. The most promising methods for detecting trees in mixed and multi-layered stands (the most challenging types of stands) have used a stratifying approach to divide the point cloud into several layers [54,55,56] and have used machine or deep learning algorithms [56,79]. In addition to detecting trees, the extraction and analysis of metrics derived from airborne LiDAR systems were recently handled by machine and deep learning algorithms (i.e., SVR, Bayesian algorithm, k-NN, and RF) [102]. Compared with airborne LiDAR systems, terrestrial LiDAR systems can produce a detailed tree reconstruction, particularly for trees from the lowest layers (intermediate and suppressed trees). Among the terrestrial LiDAR systems, TLS has become essential for trunk and branch architecture reconstruction [35,36] because it is rarely affected by point positioning errors, unlike PLS and MLS. This issue can be overcome by fusing TLS with MLS/PLS [69]. Nevertheless, the usability of TLS technology is contingent on several aspects, e.g., technical (i.e., point density and spacing), operational (i.e., scan mode), forest structure (i.e., stem density), naturalness elements (i.e., presence of lianas), weather conditions, and terrain conditions (i.e., slope) [31,47,81]. For example, before collecting data, the appropriate depiction of standing trees is ensured by considering the distance between the LiDAR sensor positions and the reference trees, canopy leaf conditions (leaf-off for deciduous trees), and placement of co-registered targets. Moreover, some studies have revealed that the automation of the TLS algorithm and forest structure play an important role in the processing phase [32], even if numerous efforts are still necessary to optimise the accuracy for the quantification of timber assortments.
The current approach for quantifying and classifying the logs from standing trees (using a virtual bucking approach) consists of: (i) timber-leaf discrimination, (ii) stem detection, (iii) stem reconstruction, and (iv) quantification and classification of assortments [47]. Even if several methods for timber-leaf discrimination using geometry-based/intensity principles show high performance, most studies have been carried out in temperate forests rather than Mediterranean or tropical forests [28]. For the detection of trees in 3D points and 2D layers, several powerful approaches are currently available, e.g., cylinder/circle fitting, clustering, and voxel approaches, while for the reconstruction of the stem form, cylinder/circle fitting approaches are being increasingly used [32,75], followed by skeletonisation [103] and voxel-based [71] approaches. Even though few studies offer a comprehensive approach for the deriving of timber assortment data through LiDAR technology, especially in mixed and multi-layered forests, commercial assortment assessments can be obtained using the output from stem reconstruction [45,46,48]. Nevertheless, some studies have proposed novel and manageable terrestrial devices for the assessment of timber assortments, e.g., reconstructing the architecture of one standing tree at a low-cost was possible using numerous photos from a hyperspectral camera [74]; and depicting one part of a tree was possible using an iPhone (<5 m of distance between the device and target surface) [104], even if their use depends on the accuracy level required.

5. Conclusions

This systematic literature review discusses the current state of LiDAR system applications in the assessment of timber assortments. This study outlines the evolution of LiDAR system applications in forest monitoring-related aspects, with a particular focus on the discrimination and quantification of timber assortments. Although most studies have focused on forest inventory and forest productivity aspects, there has been an increasing trend of studies assessing forest ecology aspects such as biodiversity and climate change. Some of the most important hindering factors affecting the use of LiDAR systems in timber assortments were identified as implementation costs, the need for well-trained operators, the lack of standard methodologies, and the availability of funding in some parts or entire continents, e.g., Oceania, South America, and Africa.
We conclude that ALS and UAS are the most appropriate LiDAR systems for the assessment of timber assortments at the plot, local, and regional levels through an area-based approach, while TLS, PLS, and MLS are more appropriate for assessing timber assortments at the plot and tree level, also providing very good accuracy for trees belonging to the understory layers. The main challenge affecting the ALS and UAS systems, as highlighted in the literature review, is tree detection, especially in mixed and heterogeneous forest structures, while the upscaling of measures from TLS, PLS, and MLS represents the main hindering factor, for which further investigations are necessary. To overcome the issue of the applicability of terrestrial LiDAR systems at local and regional levels, there are studies combining airborne with terrestrial LiDAR systems, but standardized approaches to perform this combination are still needed. Since 2010, the use of machine and deep learning algorithms for the processing a huge quantity of points acquired by LiDAR systems has strongly increased.
To date, quantifying and classifying logs using TLS and ALS systems has already been directly tested; however, these studies mostly tested these systems only in pure stands, and have only been recently published [47]. We encourage researchers to investigate this topic using alternative LiDAR systems (i.e., PLS, MLS, and UAS) to fill the gap concerning the monitoring of assortment types, which are very important practices that support national and international policies, such as the Forest Strategy and European Green Deal, as well as optimise the supply for forest chains and renewable energy.

Author Contributions

Conceptualization: C.A. and G.S.; methodology: C.A. and G.S.; validation: C.A. and G.S.; data curation: C.A. and G.S.; writing—original draft preparation: C.A. and G.S.; writing—review and editing: C.A., M.M., B.L. and G.S.; visualization: C.A.; supervision: B.L., G.S.; project administration: M.M. and B.L. All authors have read and agreed to the published version of the manuscript.

Funding

This research received no external funding.

Conflicts of Interest

The authors declare no conflict of interest.

References

  1. State of Europe Forests. Summary for Policy Markers State of Europe’s Forest. In Proceedings of the Ministerial Conference on the Protection of Forests in Europe, Bratislava, Slovakia, 14–15 April 2020; Liasion Unit Bratislava: Bratislava, Slovakia, 2020; Volume 4, pp. 64–75. [Google Scholar]
  2. Fattorini, L. Design-based methodological advances to support national forest inventories: A review of recent proposals. iForest Biogeosciences For. 2015, 8, 6–11. [Google Scholar] [CrossRef]
  3. Kivinen, V.-P. Design and testing of stand-specific bucking instructions for use on modern cut-to-length harvesters. Ph.D. Thesis, University of Helsinki, Helsinki, Finland, 2007. [Google Scholar] [CrossRef]
  4. Togni, M. Classificazione commerciale del legname grezzo tondo: Regole per la classificazione visuale dei tronchi. In Ente Regionale per i Servizi All’Agricoltura e Alle Foreste; West, P.W., Ed.; ERSAF: Lombardia, Italy, 2017; p. 97. [Google Scholar]
  5. West, P.W.; West, P.W. Tree and Forest Measurement, 3rd ed.; Springer: Berlin, Germany, 2009; p. 214. [Google Scholar]
  6. Malinen, J.; Teppo, P.; Harri, K.; Tapio, W.; Erkki, V. Timber assortment recovery models for southern Finland. Balt. For. 2010, 16, 102–112. [Google Scholar]
  7. Næsset, E. Predicting forest stand characteristics with airborne scanning laser using a practical two-stage procedure and field data. Remote Sens. Environ. 2001, 80, 88–99. [Google Scholar] [CrossRef]
  8. Pfeifer, N.; Gorte, B.; Winterhalder, D. Automatic reconstruction of single trees from terrestrial laser scanner data. In Proceedings of the 20th ISPRS Congress, Istanbul, Turkey, 12–23 July 2004; Volume 35, pp. 114–119. [Google Scholar]
  9. Chirici, G.; Giannetti, F.; McRoberts, R.E.; Travaglini, D.; Pecchi, M.; Maselli, F.; Chiesi, M.; Corona, P. Wall-to-wall spatial prediction of growing stock volume based on Italian National Forest Inventory plots and remotely sensed data. Int. J. Appl. earth Obs. geoinformation ITC J. 2019, 84, 101959. [Google Scholar] [CrossRef]
  10. Dubayah, R.; Goetz, S.J.; Blair, J.B.; Fatoyinbo, T.E.; Hansen, M.; Healey, S.P.; Hofton, M.A.; Hurtt, G.C.; Kellner, J.; Luthcke, S.B. The Global Ecosystem Dynamics Investigation. In Proceedings of the AGU Fall Meeting, San Francisco, CA, USA, 15–19 December 2014; p. 07D. [Google Scholar]
  11. Chen, Q. Modeling aboveground tree woody biomass using national-scale allometric methods and airborne lidar. ISPRS J. Photogramm. Remote Sens. 2015, 106, 95–106. [Google Scholar] [CrossRef]
  12. Lin, C.; Thomson, G.; Popescu, S.C. An IPCC-Compliant Technique for Forest Carbon Stock Assessment Using Airborne LiDAR-Derived Tree Metrics and Competition Index. Remote Sens. 2016, 8, 528. [Google Scholar] [CrossRef]
  13. Francini, S.; D’Amico, G.; Vangi, E.; Borghi, C.; Chirici, G. Integrating GEDI and Landsat: Spaceborne Lidar and Four Decades of Optical Imagery for the Analysis of Forest Disturbances and Biomass Changes in Italy. Sensors 2022, 22, 2015. [Google Scholar] [CrossRef]
  14. Beland, M.; Parker, G.; Sparrow, B.; Harding, D.; Chasmer, L.; Phinn, S.; Antonarakis, A.; Strahler, A. On promoting the use of lidar systems in forest ecosystem research. For. Ecol. Manag. 2019, 450, 117484. [Google Scholar] [CrossRef]
  15. Coops, N.C.; Tompalski, P.; Goodbody, T.R.; Queinnec, M.; Luther, J.E.; Bolton, D.K.; White, J.C.; Wulder, M.A.; van Lier, O.R.; Hermosilla, T. Modelling lidar-derived estimates of forest attributes over space and time: A review of approaches and future trends. Remote Sens. Environ. 2021, 260, 112477. [Google Scholar] [CrossRef]
  16. Valbuena, R.; O’Connor, B.; Zellweger, F.; Simonson, W.; Vihervaara, P.; Maltamo, M.; Silva, C.; Almeida, D.; Danks, F.; Morsdorf, F.; et al. Standardizing Ecosystem Morphological Traits from 3D Information Sources. Trends Ecol. Evol. 2020, 35, 656–667. [Google Scholar] [CrossRef]
  17. Silva, C.A.; Duncanson, L.; Hancock, S.; Neuenschwander, A.; Thomas, N.; Hofton, M.; Fatoyinbo, L.; Simard, M.; Marshak, C.Z.; Armston, J.; et al. Fusing simulated GEDI, ICESat-2 and NISAR data for regional aboveground biomass mapping. Remote Sens. Environ. 2021, 253, 112234. [Google Scholar] [CrossRef]
  18. Duncanson, L.; Kellner, J.R.; Armston, J.; Dubayah, R.; Minor, D.M.; Hancock, S.; Healey, S.P.; Patterson, P.L.; Saarela, S.; Marselis, S.; et al. Aboveground biomass density models for NASA’s Global Ecosystem Dynamics Investigation (GEDI) lidar mission. Remote Sens. Environ. 2022, 270, 112845. [Google Scholar] [CrossRef]
  19. Nelson, R.; Ranson, K.; Sun, G.; Kimes, D.; Kharuk, V.; Montesano, P. Estimating Siberian timber volume using MODIS and ICESat/GLAS. Remote Sens. Environ. 2009, 113, 691–701. [Google Scholar] [CrossRef]
  20. Chi, H.; Sun, G.; Huang, J.; Li, R.; Ren, X.; Ni, W.; Fu, A. Estimation of Forest Aboveground Biomass in Changbai Mountain Region Using ICESat/GLAS and Landsat/TM Data. Remote Sens. 2017, 9, 707. [Google Scholar] [CrossRef]
  21. Liu, A.; Cheng, X.; Chen, Z. Performance evaluation of GEDI and ICESat-2 laser altimeter data for terrain and canopy height retrievals. Remote Sens. Environ. 2021, 264, 112571. [Google Scholar] [CrossRef]
  22. Kirkeby, C.; Wellenreuther, M.; Brydegaard, M. Observations of movement dynamics of flying insects using high resolution lidar. Sci. Rep. 2016, 6, 29083. [Google Scholar] [CrossRef]
  23. Smigaj, M.; Gaulton, R.; Suárez, J.C.; Barr, S.L. Canopy temperature from an Unmanned Aerial Vehicle as an indicator of tree stress associated with red band needle blight severity. For. Ecol. Manag. 2019, 433, 699–708. [Google Scholar] [CrossRef]
  24. Riedler, B.; Pernkopf, L.; Strasser, T.; Lang, S.; Smith, G. A composite indicator for assessing habitat quality of riparian forests derived from Earth observation data. Int. J. Appl. Earth Obs. Geoinformation ITC J. 2015, 37, 114–123. [Google Scholar] [CrossRef]
  25. Lindberg, E.; Eysn, L.; Hollaus, M.; Holmgren, J.; Pfeifer, N. Delineation of Tree Crowns and Tree Species Classification From Full-Waveform Airborne Laser Scanning Data Using 3-D Ellipsoidal Clustering. IEEE J. Sel. Top. Appl. Earth Obs. Remote Sens. 2014, 7, 3174–3181. [Google Scholar] [CrossRef]
  26. Cuni-Sanchez, A.; White, L.J.T.; Calders, K.; Jeffery, K.J.; Abernethy, K.; Burt, A.; Disney, M.; Gilpin, M.; Gomez-Dans, J.L.; Lewis, S. African Savanna-Forest Boundary Dynamics: A 20-Year Study. PLoS ONE 2016, 11, e0156934. [Google Scholar] [CrossRef]
  27. Santopuoli, G.; Di Febbraro, M.; Maesano, M.; Balsi, M.; Marchetti, M.; Lasserre, B. Machine Learning Algorithms to Predict Tree-Related Microhabitats using Airborne Laser Scanning. Remote Sens. 2020, 12, 2142. [Google Scholar] [CrossRef]
  28. Calders, K.; Adams, J.; Armston, J.; Bartholomeus, H.; Bauwens, S.; Bentley, L.P.; Chave, J.; Danson, F.M.; Demol, M.; Disney, M.; et al. Terrestrial laser scanning in forest ecology: Expanding the horizon. Remote Sens. Environ. 2020, 251, 112102. [Google Scholar] [CrossRef]
  29. Dassot, M.; Constant, T.; Fournier, M. The use of terrestrial LiDAR technology in forest science: Application fields, Benefits and Challenges The use of terrestrial LiDAR technology in forest science: Application fields, benefits and challenges. Ann. For. Sci. 2011, 68, 959–974. [Google Scholar] [CrossRef]
  30. Liang, X.; Wang, Y.; Pyörälä, J.; Lehtomäki, M.; Yu, X.; Kaartinen, H.; Kukko, A.; Honkavaara, E.; Issaoui, A.E.I.; Nevalainen, O.; et al. Forest in situ observations using unmanned aerial vehicle as an alternative of terrestrial measurements. For. Ecosyst. 2019, 6, 20. [Google Scholar] [CrossRef]
  31. Saarinen, N.; Kankare, V.; Vastaranta, M.; Luoma, V.; Pyörälä, J.; Tanhuanpää, T.; Liang, X.; Kaartinen, H.; Kukko, A.; Jaakkola, A.; et al. Feasibility of Terrestrial laser scanning for collecting stem volume information from single trees. ISPRS J. Photogramm. Remote Sens. 2017, 123, 140–158. [Google Scholar] [CrossRef]
  32. Liang, X.; Hyyppä, J.; Kaartinen, H.; Lehtomäki, M.; Pyörälä, J.; Pfeifer, N.; Holopainen, M.; Brolly, G.; Francesco, P.; Hackenberg, J.; et al. International benchmarking of terrestrial laser scanning approaches for forest inventories. ISPRS J. Photogramm. Remote Sens. 2018, 144, 137–179. [Google Scholar] [CrossRef]
  33. Oveland, I.; Hauglin, M.; Giannetti, F.; Kjørsvik, N.S.; Gobakken, T. Comparing Three Different Ground Based Laser Scanning Methods for Tree Stem Detection. Remote Sens. 2018, 10, 538. [Google Scholar] [CrossRef]
  34. Hyyppä, E.; Yu, X.; Kaartinen, H.; Hakala, T.; Kukko, A.; Vastaranta, M.; Hyyppä, J. Comparison of Backpack, Handheld, Under-Canopy UAV, and Above-Canopy UAV Laser Scanning for Field Reference Data Collection in Boreal Forests. Remote Sens. 2020, 12, 3327. [Google Scholar] [CrossRef]
  35. Lau, A.; Martius, C.; Bartholomeus, H.; Shenkin, A.; Jackson, T.; Malhi, Y.; Herold, M.; Bentley, L.P. Estimating architecture-based metabolic scaling exponents of tropical trees using terrestrial LiDAR and 3D modelling. For. Ecol. Manag. 2019, 439, 132–145. [Google Scholar] [CrossRef]
  36. Disney, M. Terrestrial LiDAR: A three-dimensional revolution in how we look at trees. New Phytol. 2019, 222, 1736–1741. [Google Scholar] [CrossRef] [Green Version]
  37. Reckziegel, R.B.; Mbongo, W.; Kunneke, A.; Morhart, C.; Sheppard, J.P.; Chirwa, P.; du Toit, B.; Kahle, H.-P. Exploring the Branch Wood Supply Potential of an Agroforestry System with Strategically Designed Harvesting Interventions Based on Terrestrial LiDAR Data. Forests 2022, 13, 650. [Google Scholar] [CrossRef]
  38. Jaakkola, A.; Hyyppä, J.; Kukko, A.; Yu, X.; Kaartinen, H.; Lehtomäki, M.; Lin, Y. A low-cost multi-sensoral mobile mapping system and its feasibility for tree measurements. ISPRS J. Photogramm. Remote Sens. 2010, 65, 514–522. [Google Scholar] [CrossRef]
  39. Torresan, C.; Berton, A.; Carotenuto, F.; Di Gennaro, S.F.; Gioli, B.; Matese, A.; Miglietta, F.; Vagnoli, C.; Zaldei, A.; Wallace, L. Forestry applications of UAVs in Europe: A review. Int. J. Remote Sens. 2017, 38, 2427–2447. [Google Scholar] [CrossRef]
  40. Guimarães, N.; Pádua, L.; Marques, P.; Silva, N.; Peres, E.; Sousa, J.J. Forestry Remote Sensing from Unmanned Aerial Vehicles: A Review Focusing on the Data, Processing and Potentialities. Remote Sens. 2020, 12, 1046. [Google Scholar] [CrossRef]
  41. Maltamo, M.; Packalen, P.; Kangas, A. From comprehensive field inventories to remotely sensed wall-to-wall stand attribute data—A brief history of management inventories in the Nordic countries. Can. J. For. Res. 2021, 51, 257–266. [Google Scholar] [CrossRef]
  42. Goodbody, T.R.; Coops, N.C.; Marshall, P.L.; Tompalski, P.; Crawford, P. Unmanned aerial systems for precision forest inventory purposes: A review and case study. For. Chron. 2017, 93, 71–81. [Google Scholar] [CrossRef]
  43. Mulverhill, C.; Coops, N.C.; Hermosilla, T.; White, J.C.; Wulder, M.A. Evaluating ICESat-2 for monitoring, modeling, and update of large area forest canopy height products. Remote Sens. Environ. 2022, 271, 112919. [Google Scholar] [CrossRef]
  44. White, J.C.; Wulder, M.A.; Buckmaster, G. Validating estimates of merchantable volume from airborne laser scanning (ALS) data using weight scale data. For. Chron. 2014, 90, 378–385. [Google Scholar] [CrossRef]
  45. Silva, C.A.; Klauberg, C.; Hudak, A.T.; Vierling, L.A.; Jaafar, W.S.W.M.; Mohan, M.; Garcia, M.; Ferraz, A.; Cardil, A.; Saatchi, S. Predicting Stem Total and Assortment Volumes in an Industrial Pinus taeda L. Forest Plantation Using Airborne Laser Scanning Data and Random Forest. Forests 2017, 8, 254. [Google Scholar] [CrossRef]
  46. Holopainen, M.; Vastaranta, M.; Hyyppä, J. Outlook for the Next Generation’s Precision Forestry in Finland. Forests 2014, 5, 1682–1694. [Google Scholar] [CrossRef] [Green Version]
  47. Alvites, C.; Santopuoli, G.; Hollaus, M.; Pfeifer, N.; Maesano, M.; Moresi, F.V.; Marchetti, M.; Lasserre, B. Terrestrial Laser Scanning for Quantifying Timber Assortments from Standing Trees in a Mixed and Multi-Layered Mediterranean Forest. Remote Sens. 2021, 13, 4265. [Google Scholar] [CrossRef]
  48. Montaghi, A.; Corona, P.; Dalponte, M.; Gianelle, D.; Chirici, G.; Olsson, H. Airborne laser scanning of forest resources: An overview of research in Italy as a commentary case study. Int. J. Appl. Earth Obs. Geoinformation ITC J.G 2012, 23, 288–300. [Google Scholar] [CrossRef]
  49. D’Oliveira, M.V.; Reutebuch, S.E.; McGaughey, R.J.; Andersen, H.-E. Estimating forest biomass and identifying low-intensity logging areas using airborne scanning lidar in Antimary State Forest, Acre State, Western Brazilian Amazon. Remote Sens. Environ. 2012, 124, 479–491. [Google Scholar] [CrossRef]
  50. Næsset, E.; Gobakken, T.; Solberg, S.; Gregoire, T.G.; Nelson, R.; Ståhl, G.; Weydahl, D. Model-assisted regional forest biomass estimation using LiDAR and InSAR as auxiliary data: A case study from a boreal forest area. Remote Sens. Environ. 2011, 115, 3599–3614. [Google Scholar] [CrossRef]
  51. Marselis, S.M.; Tang, H.; Armston, J.D.; Calders, K.; Labrière, N.; Dubayah, R. Distinguishing vegetation types with airborne waveform lidar data in a tropical forest-savanna mosaic: A case study in Lopé National Park, Gabon. Remote Sens. Environ. 2018, 216, 626–634. [Google Scholar] [CrossRef]
  52. Yu, X.; Hyyppä, J.; Holopainen, M.; Vastaranta, M. Comparison of Area-Based and Individual Tree-Based Methods for Predicting Plot-Level Forest Attributes. Remote Sens. 2010, 2, 1481–1495. [Google Scholar] [CrossRef]
  53. Wang, Y.; Hyyppa, J.; Liang, X.; Kaartinen, H.; Yu, X.; Lindberg, E.; Holmgren, J.; Qin, Y.; Mallet, C.; Ferraz, A.; et al. International Benchmarking of the Individual Tree Detection Methods for Modeling 3-D Canopy Structure for Silviculture and Forest Ecology Using Airborne Laser Scanning. IEEE Trans. Geosci. Remote Sens. 2016, 54, 5011–5027. [Google Scholar] [CrossRef]
  54. Sačkov, I.; Santopuoli, G.; Bucha, T.; Lasserre, B.; Marchetti, M. Forest Inventory Attribute Prediction Using Lightweight Aerial Scanner Data in a Selected Type of Multilayered Deciduous Forest. Forests 2016, 7, 307. [Google Scholar] [CrossRef]
  55. Hamraz, H.; Contreras, M.A.; Zhang, J. Vertical stratification of forest canopy for segmentation of understory trees within small-footprint airborne LiDAR point clouds. ISPRS J. Photogramm. Remote Sens. 2017, 130, 385–392. [Google Scholar] [CrossRef]
  56. Alvites, C.; Santopuoli, G.; Maesano, M.; Chirici, G.; Moresi, F.V.; Tognetti, R.; Marchetti, M.; Lasserre, B. Unsupervised algorithms to detect single trees in a mixed-species and multilayered Mediterranean forest using LiDAR data. Can. J. For. Res. 2021, 51, 1766–1780. [Google Scholar] [CrossRef]
  57. Molina-Valero, J.A.; Martínez-Calvo, A.; Villamayor, M.J.G.; Pérez, M.A.N.; Álvarez-González, J.G.; Montes, F.; Pérez-Cruzado, C. Operationalizing the use of TLS in forest inventories: The R package FORTLS. Environ. Model. Softw. 2022, 150, 105337. [Google Scholar] [CrossRef]
  58. Vizzarri, M.; Chiavetta, U.; Santopuoli, G.; Tonti, D.; Marchetti, M. Mapping forest ecosystem functions for landscape planning in a mountain Natura2000 site, Central Italy. J. Environ. Plan. Manag. 2015, 58, 1454–1478. [Google Scholar] [CrossRef]
  59. Wehr, A.; Lohr, U. Airborne laser scanning—an introduction and overview. ISPRS J. Photogramm. Remote Sens. 1999, 54, 68–82. [Google Scholar] [CrossRef]
  60. Ke, Y.; Quackenbush, L.J.; Im, J. Synergistic use of QuickBird multispectral imagery and LIDAR data for object-based forest species classification. Remote Sens. Environ. 2010, 114, 1141–1154. [Google Scholar] [CrossRef]
  61. Clawges, R.; Vierling, K.; Vierling, L.; Rowell, E. The use of airborne lidar to assess avian species diversity, density, and occurrence in a pine/aspen forest. Remote Sens. Environ. 2008, 112, 2064–2073. [Google Scholar] [CrossRef]
  62. Popescu, S.; Wynne, R.H.; Nelson, R.F. Measuring individual tree crown diameter with lidar and assessing its influence on estimating forest volume and biomass. Can. J. Remote Sens. 2003, 29, 564–577. [Google Scholar] [CrossRef]
  63. Maltamo, M.; Eerikäinen, K.; Pitkänen, J.; Hyyppä, J.; Vehmas, M. Estimation of timber volume and stem density based on scanning laser altimetry and expected tree size distribution functions. Remote Sens. Environ. 2004, 90, 319–330. [Google Scholar] [CrossRef]
  64. Chen, Q.; Gong, P.; Baldocchi, D.; Tian, Y.Q. Estimating Basal Area and Stem Volume for Individual Trees from Lidar Data. Photogramm. Eng. Remote Sens. 2007, 73, 1355–1365. [Google Scholar] [CrossRef]
  65. Antonarakis, A.; Richards, K.S.; Brasington, J.; Bithell, M. Leafless roughness of complex tree morphology using terrestrial lidar. Water Resour. Res. 2009, 45, 1–14. [Google Scholar] [CrossRef]
  66. Kim, Y.; Yang, Z.; Cohen, W.B.; Pflugmacher, D.; Lauver, C.L.; Vankat, J.L. Distinguishing between live and dead standing tree biomass on the North Rim of Grand Canyon National Park, USA using small-footprint lidar data. Remote Sens. Environ. 2009, 113, 2499–2510. [Google Scholar] [CrossRef]
  67. Latifi, H.; Nothdurft, A.; Koch, B. Non-parametric prediction and mapping of standing timber volume and biomass in a temperate forest: Application of multiple optical/LiDAR-derived predictors. For. Int. J. For. Res. 2010, 83, 395–407. [Google Scholar] [CrossRef]
  68. Yao, T.; Yang, X.; Zhao, F.; Wang, Z.; Zhang, Q.; Jupp, D.; Lovell, J.; Culvenor, D.; Newnham, G.; Ni-Meister, W.; et al. Measuring forest structure and biomass in New England forest stands using Echidna ground-based lidar. Remote Sens. Environ. 2011, 115, 2965–2974. [Google Scholar] [CrossRef]
  69. Moorthy, I.; Miller, J.R.; Berni, J.A.J.; Zarco-Tejada, P.; Hu, B.; Chen, J. Field characterization of olive (Olea europaea L.) tree crown architecture using terrestrial laser scanning data. Agric. For. Meteorol. 2011, 151, 204–214. [Google Scholar] [CrossRef]
  70. Allouis, T.; Durrieu, S.; Vega, C.; Couteron, P. Stem Volume and Above-Ground Biomass Estimation of Individual Pine Trees From LiDAR Data: Contribution of Full-Waveform Signals. IEEE J. Sel. Top. Appl. Earth Obs. Remote Sens. 2012, 6, 924–934. [Google Scholar] [CrossRef]
  71. Hosoi, F.; Nakai, Y.; Omasa, K. 3-D voxel-based solid modeling of a broad-leaved tree for accurate volume estimation using portable scanning lidar. ISPRS J. Photogramm. Remote Sens. 2013, 82, 41–48. [Google Scholar] [CrossRef]
  72. Vastaranta, M.; Holopainen, M.; Karjalainen, M.; Kankare, V.; Hyyppa, J.; Kaasalainen, S. TerraSAR-X Stereo Radargrammetry and Airborne Scanning LiDAR Height Metrics in Imputation of Forest Aboveground Biomass and Stem Volume. IEEE Trans. Geosci. Remote Sens. 2014, 52, 1197–1204. [Google Scholar] [CrossRef]
  73. Lang, M.; Arumäe, T.; Lükk, T.; Sims, A. Estimation of standing wood volume and species composition in managed nemoral multi-layer mixed forests by using nearest neighbour classifier, multispectral satellite images and airborne lidar data/Puistute liigilise koosseisu ja tüvemahu hindamine k-lähima naabri meetodil mitmerindelistes majandatavates segametsades. For. Stud. 2014, 61, 47–68. [Google Scholar] [CrossRef]
  74. Miller, J.; Morgenroth, J.; Gomez, C. 3D modelling of individual trees using a handheld camera: Accuracy of height, diameter and volume estimates. Urban For. Urban Green. 2015, 14, 932–940. [Google Scholar] [CrossRef]
  75. Shinzato, E.; Shimabukuro, Y.; Coops, N.; Tompalski, P.; Gasparoto, E. Integrating area-based and individual tree detection approaches for estimating tree volume in plantation inventory using aerial image and airborne laser scanning data. iForest-Biogeosciences For. 2017, 10, 296–302. [Google Scholar] [CrossRef]
  76. Yoga, S.; Bégin, J.; St-Onge, B.; Gatziolis, D. Lidar and Multispectral Imagery Classifications of Balsam Fir Tree Status for Accurate Predictions of Merchantable Volume. Forests 2017, 8, 253. [Google Scholar] [CrossRef] [Green Version]
  77. Wilkes, P.; Disney, M.; Vicari, M.; Calders, K.; Burt, A. Estimating urban above ground biomass with multi-scale LiDAR. Carbon Balance Manag. 2018, 13, 10. [Google Scholar] [CrossRef] [PubMed]
  78. Côté, J.-F.; Fournier, R.A.; Luther, J.E.; van Lier, O.R. Fine-scale three-dimensional modeling of boreal forest plots to improve forest characterization with remote sensing. Remote Sens. Environ. 2018, 219, 99–114. [Google Scholar] [CrossRef]
  79. Weinstein, B.G.; Marconi, S.; Bohlman, S.; Zare, A.; White, E. Individual Tree-Crown Detection in RGB Imagery Using Semi-Supervised Deep Learning Neural Networks. Remote Sens. 2019, 11, 1309. [Google Scholar] [CrossRef]
  80. Cao, L.; Liu, K.; Shen, X.; Wu, X.; Liu, H. Estimation of Forest Structural Parameters Using UAV-LiDAR Data and a Process-Based Model in Ginkgo Planted Forests. IEEE J. Sel. Top. Appl. Earth Obs. Remote Sens. 2019, 12, 4175–4190. [Google Scholar] [CrossRef]
  81. Chen, S.; Liu, H.; Feng, Z.; Shen, C.; Chen, P. Applicability of personal laser scanning in forestry inventory. PLoS ONE 2019, 14, e0211392. [Google Scholar] [CrossRef]
  82. Socha, J.; Hawryło, P.; Stereńczak, K.; Miścicki, S.; Tymińska-Czabańska, L.; Młocek, W.; Gruba, P. Assessing the sensitivity of site index models developed using bi-temporal airborne laser scanning data to different top height estimates and grid cell sizes. Int. J. Appl. Earth Obs. Geoinformation ITC J. 2020, 91, 102129. [Google Scholar] [CrossRef]
  83. Da Silva, V.S.; Silva, C.A.; Mohan, M.; Cardil, A.; Rex, F.E.; Loureiro, G.H.; De Almeida, D.R.A.; Broadbent, E.N.; Gorgens, E.B.; Corte, A.P.D.; et al. Combined Impact of Sample Size and Modeling Approaches for Predicting Stem Volume in Eucalyptus spp. Forest Plantations Using Field and LiDAR Data. Remote Sens. 2020, 12, 1438. [Google Scholar] [CrossRef]
  84. Sanz, B.; Malinen, J.; Sirparanta, S.; Peuhkurinen, J.; Leppänen, V.; Melkas, T.; Riekki, K.; Kauranne, T.; Vastaranta, M.; Tokola, T. Integrating Detailed Timber Assortments into Airborne Laser Scanning (ALS)-Based Assessments of Logging Recoveries. Forests 2021, 12, 1221. [Google Scholar] [CrossRef]
  85. Li, D.; Guo, H.; Jia, W.; Wang, F. Analysis of Taper Functions for Larix olgensis Using Mixed Models and TLS. Forests 2021, 12, 196. [Google Scholar] [CrossRef]
  86. Leite, R.; Silva, C.; Mohan, M.; Cardil, A.; Almeida, D.; Carvalho, S.; Jaafar, W.; Guerra-Hernández, J.; Weiskittel, A.; Hudak, A.; et al. Individual Tree Attribute Estimation and Uniformity Assessment in Fast-Growing Eucalyptus spp. Forest Plantations Using Lidar and Linear Mixed-Effects Models. Remote Sens. 2020, 12, 3599. [Google Scholar] [CrossRef]
  87. Leite, R.V.; Amaral, C.H.D.; Pires, R.D.P.; Silva, C.A.; Soares, C.P.B.; Macedo, R.P.; Da Silva, A.A.L.; Broadbent, E.N.; Mohan, M.; Leite, H.G. Estimating Stem Volume in Eucalyptus Plantations Using Airborne LiDAR: A Comparison of Area- and Individual Tree-Based Approaches. Remote Sens. 2020, 12, 1513. [Google Scholar] [CrossRef]
  88. Hauglin, M.; Dibdiakova, J.; Gobakken, T.; Næsset, E. Estimating single-tree branch biomass of Norway spruce by airborne laser scanning. ISPRS J. Photogramm. Remote Sens. 2013, 79, 147–156. [Google Scholar] [CrossRef]
  89. Machimura, T.; Fujimoto, A.; Hayashi, K.; Takagi, H.; Sugita, S. A Novel Tree Biomass Estimation Model Applying the Pipe Model Theory and Adaptable to UAV-Derived Canopy Height Models. Forests 2021, 12, 258. [Google Scholar] [CrossRef]
  90. Lin, Y.-C.; Liu, J.; Fei, S.; Habib, A. Leaf-Off and Leaf-On UAV LiDAR Surveys for Single-Tree Inventory in Forest Plantations. Drones 2021, 5, 115. [Google Scholar] [CrossRef]
  91. Broughton, R.K.; Bellamy, P.E.; Hill, R.A.; Hinsley, S.A. Winter habitat selection by Marsh TitsPoecile palustrisin a British woodland. Bird Study 2014, 61, 404–412. [Google Scholar] [CrossRef]
  92. Zhao, Y.; Zeng, Y.; Zheng, Z.; Dong, W.; Zhao, D.; Wu, B.; Zhao, Q. Forest species diversity mapping using airborne LiDAR and hyperspectral data in a subtropical forest in China. Remote Sens. Environ. 2018, 213, 104–114. [Google Scholar] [CrossRef]
  93. Kelly, M.; Di Tommaso, S. Mapping forests with Lidar provides flexible, accurate data with many uses. Calif. Agric. 2015, 69, 14–20. [Google Scholar] [CrossRef]
  94. Vastaranta, M.; Saarinen, N.; Kankare, V.; Holopainen, M.; Kaartinen, H.; Hyyppä, J.; Hyyppä, H. Multisource Single-Tree Inventory in the Prediction of Tree Quality Variables and Logging Recoveries. Remote Sens. 2014, 6, 3475–3491. [Google Scholar] [CrossRef]
  95. Siipilehto, J.; Lindeman, H.; Vastaranta, M.; Yu, X.; Uusitalo, J. Reliability of the predicted stand structure for clear-cut stands using optional methods: Airborne laser scanning-based methods, smartphone-based forest inventory application Trestima and pre-harvest measurement tool EMO. Silva Fenn. 2016, 50. [Google Scholar] [CrossRef]
  96. Wulder, M.A.; White, J.C.; Nelson, R.F.; Næsset, E.; Ørka, H.O.; Coops, N.C.; Hilker, T.; Bater, C.W.; Gobakken, T. Lidar Sampling for Large-Area Forest Characterization: A Review. Remote Sens. Environ. 2012, 121, 196–209. [Google Scholar] [CrossRef] [Green Version]
  97. Proietti, R.; Antonucci, S.; Monteverdi, M.C.; Garfì, V.; Marchetti, M.; Plutino, M.; Di Carlo, M.; Germani, A.; Santopuoli, G.; Castaldi, C.; et al. Monitoring spring phenology in Mediterranean beech populations through in situ observation and Synthetic Aperture Radar methods. Remote Sens. Environ. 2020, 248, 111978. [Google Scholar] [CrossRef]
  98. Lu, D.; Chen, Q.; Wang, G.; Liu, L.; Li, G.; Moran, E. A survey of remote sensing-based aboveground biomass estimation methods in forest ecosystems. Int. J. Digit. Earth 2016, 9, 63–105. [Google Scholar] [CrossRef]
  99. Kankare, V.; Vauhkonen, J.; Tanhuanpää, T.; Holopainen, M.; Vastaranta, M.; Joensuu, M.; Krooks, A.; Hyyppä, J.; Hyyppä, H.; Alho, P.; et al. Accuracy in estimation of timber assortments and stem distribution—A comparison of airborne and terrestrial laser scanning techniques. ISPRS J. Photogramm. Remote Sens. 2014, 97, 89–97. [Google Scholar] [CrossRef]
  100. Breiman, L. Random forests. Mach. Learn. 2001, 45, 5–32. [Google Scholar] [CrossRef]
  101. Maselli, F.; Chiesi, M.; Montaghi, A.; Pranzini, E. Use of ETM+ images to extend stem volume estimates obtained from LiDAR data. ISPRS J. Photogramm. Remote Sens. 2011, 66, 662–671. [Google Scholar] [CrossRef]
  102. Ortiz-Reyes, A.D.; Valdez-Lazalde, J.R.; De Los Santos-Posadas, H.M.; Ángeles-Pérez, G.; Paz-Pellat, F.; Martínez-Trinidad, T. Inventory and cartography of forest variables derived from LiDAR data: Comparison of methods. Madera Y Y Bosques 2015, 21, 111–128. [Google Scholar]
  103. Bremer, M.; Rutzinger, M.; Wichmann, V. Derivation of tree skeletons and error assessment using LiDAR point cloud data of varying quality. ISPRS J. Photogramm. Remote Sens. 2013, 80, 39–50. [Google Scholar] [CrossRef]
  104. Mokroš, M.; Mikita, T.; Singh, A.; Tomaštík, J.; Chudá, J.; Wężyk, P.; Kuželka, K.; Surový, P.; Klimánek, M.; Zięba-Kulawik, K.; et al. Novel low-cost mobile mapping systems for forest inventories as terrestrial laser scanning alternatives. Int. J. Appl. Earth Obs. Geoinformation ITC J. 2021, 104, 102512. [Google Scholar] [CrossRef]
Figure 1. The workflow of the methodological approach implemented in this literature review. LiDAR is light detection and ranging. One search string consists of four single or composite keywords.
Remotesensing 14 04466 g001
Figure 2. The trend of the published papers in the timeframe 2000–2021. The labels above the bars indicate the number of papers per year.
Remotesensing 14 04466 g002
Figure 3. The LiDAR (light detection and ranging) studies. The figure shows the geographical distribution on a worldwide scale of the studies (expressed in absolute number) that focused on forest ecosystems.
Remotesensing 14 04466 g003
Figure 4. The frequency of papers based on the LiDAR (light detection and ranging) systems and on the integrated use of LiDAR with other remote sensing applications.
Remotesensing 14 04466 g004
Figure 5. The frequency of papers according to the six explored clusters.
Remotesensing 14 04466 g005
Figure 6. LiDAR studies and the mixture of forest stand. The stacked bar graph shows the forest type within each topic. ‘A’, ‘C’, ‘B’, ‘I’, and ‘P’ are the accuracy, climate change, biodiversity, inventory, and productivity clusters, respectively.
Remotesensing 14 04466 g006
Table 2. Descriptions of the keywords used to search through the LiDAR literature. The terms and definitions were found in two sources: (a) https://www.sciencedirect.com/topics (accessed on 15 January 2022) and (b) http://www.fao.org/forestry/FRA2015/ (accessed on 15 January 2022). The asterisk symbol * was added to search word that has multiple spelling variations, allowed to search for different word endings (e.g., Merchant or Merchantable).
Description of the Keywords
KeywordDescriptionSource
1Remote sensing (RS)It is the science that remotely captures information from the Earth’s surface for many scopes (i.e., forest monitoring).(a)
2LiDARIt is a technology suitable for depicting vertical and horizontal canopy profiles through georeferenced points, performed by measuring the distance of an emitted and backscattered light from the LiDAR sensor and tree.(a)
3Forest or Woodland‘Forest’ is land covered by more than 0.5 ha of trees that can reach a minimum of 5 m of height, and land which possesses a canopy cover of more than 10%. ‘Woodland’ is land covered by more than 0.5 ha of trees that can reach 5 m of height at maturity, which also possess a canopy cover of 5–10%; or land covered by a combined cover of shrubs, bushes, and trees with a canopy cover above 10%.(b)
4Timber or Wood‘Timber’ and ‘wood’ are some of the most important goods provided by forests, and they play an important role in the wood supply chain.(a)
5Stem or Branch‘Stem’ is the aboveground trunk of a vascular plant with similar anatomical properties, while ‘branch’ is the woody part of the tree arising from a trunk.[5]
6Hardwood or Softwood‘Hardwood’ is commonly associated with deciduous stands (denser wood), while ‘softwood’ is often associated with coniferous stands (less dense wood).(a)
7TreeIt indicates a tall plant that is composed of a trunk and branches. Moreover, it is a principal component of both forest and woodland areas.(b)
8Quality or Assortment‘Quality’ groups physical and chemical characteristics widely used for classifying wood based on specific wood features; the ‘assortment’ term is often used to characterize the log of trees according to a merchantable approach.(b)
9MorphologyThis represents the physical form and external structure of trees. This word allowed us to collect papers that considered the morphology of the tree as objective.(a)
10Volume or Merchant *These words allowed us to collect papers that considered the wood in forest productivity and the commercial terms as the target.[5]
Table 3. Literature review codes. The advanced description of codes (SC) used to search the LiDAR (Light Detection and Ranging) literature. Fixed keywords are indicated in italics. The asterisk symbol * was added to search word that has multiple spelling variations, allowed to search for different word endings (e.g., forest or forestry).
AbbreviationCode
SC1remote AND sensing *; lidar; forest * OR woodland; timber OR wood AND quality
SC2remote AND sensing *; lidar; forest * OR woodland; timber OR wood AND assortment *
SC3remote AND sensing *; lidar; forest * OR woodland; timber OR wood AND morphology
SC4remote AND sensing *; lidar; forest * OR woodland; timber OR wood AND volume
SC5remote AND sensing *; lidar; forest * OR woodland; stem OR branch AND volume
SC6remote AND sensing *; lidar; forest * OR woodland; stem OR branch AND morphology
SC7remote AND sensing *; lidar; forest * OR woodland; hardwood OR softwood AND merchant *
SC8remote AND sensing *; lidar; forest * OR woodland; tree AND morphology
SC9remote AND sensing *; lidar; forest * OR woodland; tree AND merchant *
SC10remote AND sensing *; lidar; forest * OR woodland; tree AND assortment *
SC11remote AND sensing *; lidar; forest * OR woodland; tree AND quality
SC12remote AND sensing *; lidar; forest * OR woodland; tree AND volume
Table 4. Twenty types of combinations involving LiDAR (light detection and ranging) systems for forest monitoring. (*) represents studies without a system mentioned within their ‘Materials and Methods’ sections. ID indicates the progressive number of LiDAR system combinations.
LiDAR Systems
IDDescriptions
1No specified systems *
2Only terrestrial LiDAR systems
3Only airborne LiDAR systems
4Only satellite LiDAR systems
5Only terrestrial images
6Only airborne images
7Only satellite images
8Combination of terrestrial with airborne LiDAR systems
9Combination of terrestrial with satellite LiDAR systems
10Combination of terrestrial LiDAR systems with airborne images
11Combination of airborne LiDAR systems with airborne images
12Combination of airborne LiDAR systems with satellite images
13Combination of satellite LiDAR systems with satellite images
14Combination of terrestrial LiDAR systems with terrestrial images
15Combination of airborne LiDAR systems with terrestrial images
16Combination of terrestrial LiDAR systems with satellite images
17Combination of airborne LiDAR systems with airborne and satellite images
18Combination of satellite images with airborne and satellite LiDAR systems
19Combination of airborne images with terrestrial and airborne LiDAR systems
20Combination of terrestrial images with terrestrial and airborne LiDAR systems
Table 5. Paper collection. The selected papers (304) are referred to as unduplicated papers.
Paper Collection
AbbreviationN° collected papers
SC122
SC23
SC36
SC476
SC582
SC611
SC76
SC829
SC92
SC103
SC1184
SC12167
Sub-total491
N° duplicated papers187
Total304
Table 6. Forest type. The papers from cluster ‘R’ (paper review) were excluded from this analysis.
Forest TypeN° PapersTotal
Pure Coniferous86128
Pure Deciduous42
Mixed155155
Total283
Table 7. The list of potential methodologies for the assessment of timber assortments using LiDAR (light detection and ranging) systems: ALS (airborne laser scanning); UAS (unmanned aerial systems); TLS (terrestrial laser scanning); PLS (portable laser scanning); ABA (area-based approach); ITD (individual tree approach); FIVs (forest inventory variables); DBH (diameter at breast height); TH (tree height); and 2-dimensional or 3-dimensional methodologies (2D and 3D methodologies).
Literature Review
LiDAR SystemsType of ApproachTree MeasurementsModellingReference
ALSABATimber assortments volume (i.e., sawlogs, pulpwood, grade A butt logs, and small-diameter logs)k-most similar neighbour (K-MSN), species-specific taper curve models[84]
ALSABATimber merchantable volume (i.e., sawlogs, and pulpwood)‘randomForest’ R package[44,45]
ALSITDFIVs (i.e., TH, DBH, AGB)Ordinary linear fixed-effects models (‘lme4’ R package); ‘FindTreeCHM’, ‘ForestCAS’ and ‘CrownMetrics’ functions embedded in ‘rLiDAR’ packages[86]
ALSABA vs. ITDFIVs (i.e., stem volume)Artificial neural network, random forest, support vector machine, linear and Gompertz models, and recursive feature elimination.[87]
ALSABAFIVs (i.e., stem volume)FUSION/LDV, principal component analysis (PCA), multiple linear regression, machine learning algorithms (‘randomForest’, ‘yaImpute’, ‘e1071’, ‘nnet’ R packages)[83]
ALSITDFIVs (i.e., stem volume and BA)Multiple linear regression model[64]
ALSITDSingle tree branch biomassRandom Forests and Linear least squares in stepwise linear regression[88]
UASITDFIVs (i.e., AGB)‘grid_metrics’ and ‘find_trees’ functions embedded in the ‘lidR’ R package[89]
UASITDTree detectionMethod developed by Lim et al. ([90]), peak detection on 2D layers[90]
TLS2D and 3D methodologiesStem position and FIVs (i.e., DBH)‘find trunks’ algorithm[68]
TLS2D and 3D methodologiesFIVs (i.e., DBH) for surrogate plots, number of branches, tree crown measurements, total knot surface, and stem taper‘L-Architect’ algorithm, PlantGL python-based library[78]
TLS2D and 3D methodologiesTree crown measurements and FIVs (i.e., TH)cross-sectional slicing[69]
TLS2D and 3D methodologiesStem volume, stem curve, and FIVs (i.e., TH)Cylinder-fitting algorithm, Huber’s formula[31]
TLS and PLS2D and 3D methodologiesStem curve and stem volume, stem position, and FIVs (i.e., DBH)LiDAR360 software and six different taper equations, processed by nonlinear mixed models[81,85]
PLS2D and 3D methodologiesTimber volume for stems and small/large branches (±1 cm of ϕ)Voxel-based approach (0.5 m3 of threshold)[71]
Publisher’s Note: MDPI stays neutral with regard to jurisdictional claims in published maps and institutional affiliations.

