Abstract
Forage grass is very important for food security. The development of artificial grassland is the key to solving the shortage of forage grass. Understanding the spatial distribution of forage grass in alpine regions is of great importance for guiding animal husbandry and the rational selection of forage grass management measures. With its powerful computing power and complete image data storage, Google Earth Engine (GEE) has become a new method to address remote sensing data collection difficulties and low processing efficiency. High-resolution mapping of pasture distributions on the Tibetan Plateau (China) is still a difficult problem due to cloud disturbance and mixed planting of forage grass. Based on the GEE platform, Sentinel-2 data and three classifiers, this study successfully mapped the oat pasture area of the Shandan Racecourse (China) on the eastern Tibetan Plateau over 3 years from 2019 to 2021 at a resolution of 10 m based on cultivated land identification. In this study, the key phenology windows were determined by analysing the time series differences in vegetation indices between oat pasture and other forage grasses in the Shandan Racecourse, and monthly scale features were selected as features for oat pasture identification. The results show that the mean Overall Accuracy (OA) of Random Forest (RF) classifier, Support Vector Machine (SVM) classifier, and Classification and Regression Trees (CART) classifier are 0.80, 0.69, and 0.72 in cultivated land identification, respectively, with corresponding the Kappa coefficients of 0.74, 0.58, and 0.62. The RF classifier far outperforms the other two classifiers. In oat pasture identification, the RF, SVM and CART classifiers have high OAs of 0.98, 0.97, and 0.97 and high Kappa values of 0.95, 0.94, and 0.95, respectively. Overall, the RF classifier is more suitable for our research. The oat pasture areas in 2019, 2020 and 2021 were 347.77 km2 (15.87%), 306.19 km2 (13.97%) and 318.94 km2 (14.55%), respectively, with little change (1.9%) from year to year. The purpose of this study was to explore the identification model of forage grass area in alpine regions with a high spatial resolution, and to provide technical and methodological support for information extraction of the forage grass distribution status on the Tibetan Plateau.
1. Introduction
China is a populous country with a population of 1.4 billion. Food safety has always been its top priority. In the past 30 years, the dietary structure of Chinese residents has undergone tremendous changes, mainly manifested in the reduction in ration consumption and the increase in consumption of animal products such as meat, eggs, and milk. However, China is still unable to provide all residents with high-quality and safe meat, eggs, milk and other livestock products [1,2]. Therefore, the safety of forage is crucial to food safety [3,4]. Moreover, China is still strengthening the production of rations and ignoring the supply of animal forage. The development of artificial grassland is the key to solving the shortage of forage [2]. To date, the proportion of animal husbandry output value in agriculture in the country is still very low compared with that in developed countries [5]. In countries such as Australia and New Zealand, and in European countries with developed animal husbandry industries, artificial grassland accounts for more than 50% of the total grassland area [6]. An important measure for the sustainable development of animal husbandry in the future is to establish intensively managed artificial grassland.
Artificial grassland is an artificial herbaceous plant community established by adopting production technology measures similar to those of crop planting. Suitable and excellent grass species are selected for planting, irrigation and fertilization, aiming at producing high-quality and high-yield forage grass. This process is an important part of the grassland animal husbandry system, which can supplement the shortage of natural grassland and solve the imbalance between the supply and demand of grass and livestock caused by seasonal changes. The forage that is produced can be used as silage, fodder, semidry silage or hay. Therefore, the establishment of artificial grassland is an important measure to develop an intensive grassland animal husbandry system and implement ecological restoration and reconstruction measures and sustainable development strategies. Oat pasture has the advantages of high sugar content, good palatability and high fiber content, is rich in protein and of high quality and has high feed value [7]. Known as the “Roof of the World” and the “Third Pole”, the Tibetan Plateau an important grassland animal husbandry base in China and the largest natural grazing land in China [8]. The Zhangye Shandan Racecourse which belongs to the Tibetan Plateau has a cool climate and fertile soil, with ideal conditions for plateau forage grass growth. It is a good area for plateau green feed production and processing, and has produced a high-quality oat pasture base of the Shandan Racecourse brand [7].
Understanding the spatial distribution of artificial grassland is of great importance for guiding animal husbandry practices and rationally selecting forage management and cultivation measures. However, traditional methods such as statistical reports and sampling surveys consume considerable manpower and material resources, and are inefficient and inaccurate. Emerging remote sensing technology provides the possibility of extracting information on the planting area and yield of artificial grassland in large areas [9]. With the rapid development of remote sensing technology, there are an increasing number of remote sensing recognition algorithms for crops and forages, which can be roughly divided into two categories. The first category is the traditional visual interpretation algorithm, which is time-consuming and labor-intensive, so it is not suitable for large area data acquisition. The second is machine learning algorithms, including classic machine learning methods that have emerged with remote sensing technology, such as automatic classification algorithms, maximum likelihood and iterative self-organizing data analysis. There is also a new generation of machine learning methods developed in recent years, such as random forests (RFs), convolutional neural networks and other methods. Machine learning models are data-driven, and their methods of automatically retrieving and interpreting data are flexible and can be used for any training task. Deep learning algorithms such as convolutional neural networks and fully convolutional neural networks are difficult to popularize in large-scale crop area extraction due to their time-consuming data processing and high requirements regarding the number of samples [10]. Some of the spectral bands in Sentinel-2 data have a higher spatial resolution (10 m) than MODIS data and Landsat-8 data. In the case of dual satellites, the temporal resolution is also higher than that of MODIS data and Landsat-8 data, only five days [11,12]. Many studies have shown that Sentinel-2 data can be used for area identification and yield estimation of small-scale crops [13,14,15,16].
At present, research on crop information extraction around the world is relatively mature. Most of the studies are based on Gao Fen (GF) data, Sentinel data and Landsat data, using RF, support vector machine (SVM), neural network and other methods to extract crop information. Huang et al. [9] calculated the normalized difference vegetation index (NDVI), enhanced vegetation index (EVI), normalized difference water index (NDWI) and wide dynamic range vegetation index (WDRVI) based on GF-1 wide field view (WFV) data and used a random forest classification algorithm to extract corn and soybean planting areas in Heihe city, Nenjiang County, Heilongjiang Province. Based on TerraSAR-X data, Sonobe et al. [17] compared the recognition effects of three classification algorithms, a decision tree, support vector machine and random forest, on various crops in Hokkaido, Japan. The results showed that the support vector machine method had the highest recognition accuracy. Based on Landsat-8 and Sentinel-1 data, Kussul et al. [18] used four methods, random forest, evolutionary neural network, one-dimensional neural network, and two-dimensional neural network methods, to classify and map summer crops in Ukraine. The results showed that the accuracy based on the two-dimensional neural network was the highest, reaching 94.60%. Based on Sentinel-1 and Sentinel-2 data, Cai et al. [19] used an object-based random forest method to obtain rice planting distribution information in the Dongting Lake wetland with an accuracy higher than 95%. Based on Landsat-8 data, Lv et al. [20] used the object-oriented Classification and Regression Tree (CART) decision tree classifier and random forest classifier to identify four main crops, wheat, corn, melon and sunflower, in Qitai County, Xinjiang. The random forest classifier had an accuracy of 94.50%. Guo et al. [21] fused GF-1, Landsat-8 OLI, and Sentinel-2 images based on the data conversion method to obtain the NDVI time series data set mainly based on GF-1. They extracted the spatial distribution information of multicrop barley and oat artificial grassland through the step-by-step elimination method. The accuracy was as high as 96.52%. Based on Landsat-8 and GF-1 remote sensing image data, Bai et al. [22] selected six different classification methods to identify crops in Shawan County, Xinjiang. The results showed that the support vector machine classification method had the highest accuracy, and the overall accuracy (OA) of Landsat-8 imagery (91.22%) was slightly higher than that of GF-1 imagery (88.23%). Saltykov et al. [23] used artificial neural networks to identify mixed forests, boreal forests and grasslands in Krasnoyarsk based on Sentinel-2 satellite images, and the results showed that neural networks could be used as classifiers on Sentinel-2 images.
However, there are few studies on information extraction for artificial grasslands, with studies mainly focusing on alfalfa. Liu et al. [24] constructed NDVI time series based on GF-1 data, used the threshold method to gradually eliminate interfering objects, and realized the extraction of the spatial distribution information of dry alfalfa in Linxi County. Ren et al. [25] used the NDVI summation method and the NDVI difference summation method to extract the information of intensive alfalfa artificial grassland in the Arukorqin Banner based on multitemporal Landsat 8 data. Based on GF-1 WFV and Sentinel-2 remote sensing images, Bao et al. [26] constructed an NDVI data set for alfalfa in Jinchang city, Gansu Province, and combined the variation in spectral reflectance of alfalfa with the growth period to extract the spatial distribution information of alfalfa lineages there.
The Google Earth Engine (GEE) (https://earthengine.google.com/, accessed on 10 July 2022). is a cloud computing platform dedicated to processing satellite imagery data and other Earth observation data. It not only stores complete Earth observation satellite image data, and environmental and socioeconomic data but also provides enough computing power to process these data. It is becoming a new way to address the remote sensing data collection difficulties and low processing efficiency. However, there are few studies on the classification of forage grassland in alpine regions based on the GEE platform. The existing studies are mainly based on the GEE cloud platform, using different classification methods to identify crops. For example, Ni et al. [27] developed an enhanced Sentinel-2 image-based phenological feature composite method (Eppf-CM), based on the GEE platform. They obtained a rice map with the highest accuracy (0.98) in Northeast China. Chong et al. [28] used the GEE and Sentinel-1/2 images combined with an RF classifier to generate a crop distribution map in Heilongjiang Province, with an OA of 89.75%. He et al. [29] used Sentinel-1/2 images on the GEE platform to map the distribution and cultivation intensity of rice in the Changsha, Zhuzhou and Xiangtan regions, and the overall accuracy reached 81%. Based on Landsat 8, the GEE platform and the improved phenology and pixel-based paddy rice mapping (PPPM) algorithm, Dong et al. [30] identified Asian rice in Northeast China and drew a 30-m rice map with an accuracy of 92%. Jin et al. [11] used the GEE to map field conditions, maize conditions, and maize yields for the 2017 main maize season in Kenya and Tanzania.
However, the above research has the following problems. (1) Although crop identification research has been carried out on a large scale, the classification of artificial grasslands, especially annual forage grass (such as oat pasture), in alpine regions is still difficult. (2) Few studies have focused on the relationship between cultivated land identification and forage grass identification accuracy, whether for crop or forage classification. (3) A major difference between forage grass and other ground objects is that the growth cycle of the former has a clear artificial rhythm. By analyzing the key phenological windows of forage grass, screening distinguishable time series images rather than single phase images, and using a short-period vegetation index as a classification feature, the identification of forage grass species will be easier. (4) Due to external disturbances such as mixed planting of forages and cloud cover, high-precision identification of forage grass in small areas in alpine regions is challenging.
The Tibetan Plateau is an ecologically fragile area. At present, there are few studies on the layout and construction of artificial grasslands on the Tibetan Plateau. Many studies have been carried out on the characteristics, stability, sustainability and management techniques of artificial grasslands on the Tibetan Plateau. In this study, the GEE platform, Sentinel-2 Multi Spectral Instrument (MSI) remote sensing data, and RF, SVM, and CART classifiers are used to produce annual oat pasture maps in the Shandan Racecourse from 2019 to 2021 at 10 m spatial resolution based on cultivated land identification. The main work includes the following aspects: (1) data preprocessing (cloud mask and maximum value synthesis); (2) feature selection; (3) cultivated land identification; (4) oat pasture identification; and (5) accuracy evaluation and validation. The results of this study can provide technical and methodological support for the estimation of the status and development potential of artificial grasslands on the Tibetan Plateau.
2. Materials and Methods
2.1. Overview of the Study Area
The Shandan Racecourse is located in the hinterland of the Qilian Mountains (Northeastern Tibetan Plateau), and has a natural endowment of natural ecological resources. It is in an arid and semiarid area, with an annual average temperature of 0.2 °C. It has a short frost-free period, generally 100 days, and an altitude of 2376–4412 m (Figure 1). It is the largest racecourse in the world, with a total area of 2192 km2. With the change in business strategy, in recent years, the Shandan Racecourse has relied on excellent grade oat pasture grass that contains 6.93% crude protein, 28.44% acid detergent fiber, 46.50% neutral detergent fiber, 32.82% carbohydrates, and 9.29% water content. A high-quality oat pasture base is derived from grass, which has a good reputation in major pastures and breeding bases across the country and shows good development momentum [7].
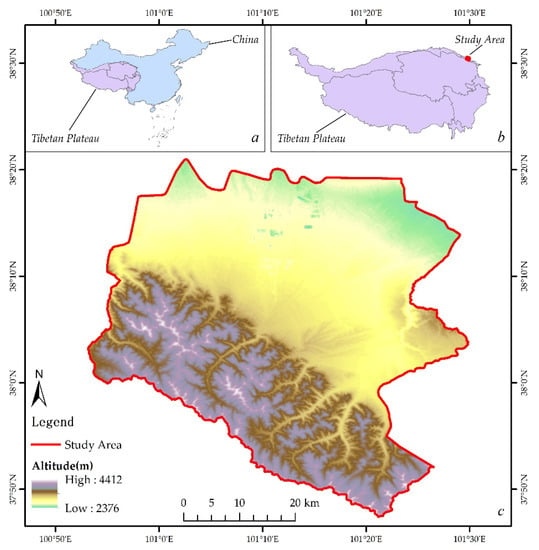
Figure 1.
Overview of the study area ((a) represents the location of the Tibetan Plateau in China, (b) represents the location of the study area in the Tibetan Plateau, and (c) represents the altitude map of the study area).
2.2. Sentinel-2 Imagery
Sentinel-2 is a wide-swath, high-resolution, multispectral imaging mission supporting Copernicus land monitoring studies that includes the monitoring of vegetation, soil and water cover, as well as the observation of inland waterways and coastal areas. The optical sensor of the Sentinel-2 satellite is called the MSI. It consists of two satellites, Sentinel 2A and Sentinel 2B, whose orbits differ by 180°. The time resolution of each satellite is 10 days, and the two satellites can achieve a return visit time of five days.
Sentinel-2 includes Level 1C data and Level 2A data. In contrast with 1C data, 2A data correspond to an image that has been atmospherically corrected, so it has more realistic color levels, is sharper, and has higher brightness and contrast. This study uses the Sentinel-2 MSI and Level-2A data provided by the GEE, which includes 12 spectral bands of different resolutions, as well as the QA60 band we use to exclude clouds and other undesirable observations (Table 1).

Table 1.
Spectral bands from Sentinel-2 data.
2.3. Main Workflow
The overall workflow of this study is shown in Figure 2, which is mainly divided into two parts: cultivated land identification and oat pasture identification. The specific workflow is as follows:
- (a)
- Cultivated land is identified to exclude non-cultivated land areas. (1) The Sentinel 2 data are cloud masked and max composited; (2) suitable features are selected; (3) training and validation data are obtained; (4) the features and training samples are put into the RF, SVM and CART classifiers for classification; and (5) accuracy evaluation is performed.
- (b)
- Oat pasture identification is carried out based on cultivated land identification. (1) The Sentinel 2 data are cloud masked, smoothed by the Savitzky-Golay (SG) filter and max composited. (2) By comparing the time series differences in vegetation indices between oat pasture and other forage grasses, key phenological periods (June, September, October) are extracted. Next, the suitable features are determined. (3) Training and validation data are obtained. (4) The obtained cultivated land results are masked to remove non-cultivated land areas. Next, the features and training samples are put into the RF, SVM and CART classifiers for classification. (5) Accuracy evaluation is performed.
These aspects are introduced in the following Methods section.
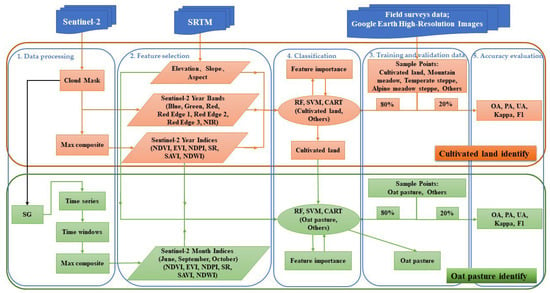
Figure 2.
Workflow for cultivated land identification and oat pasture identification.
2.4. Feature Selection
2.4.1. Cultivated Land Identification Feature Selection
Before oat pasture identification, we first identified the cultivated land in the study area. After many tests, we finally selected three types of features that can clearly distinguish cultivated land from non-cultivated land areas to identify cultivated land. Figure 3 shows the feature mean difference between cultivated land and other areas in 2019–2021. Figure 3 shows the features we choose are very different for cultivated land and non-cultivated land. Since cultivated land basically does not change within a year, the features we choose here are all in units of years. (1) First, we selected seven Sentinel-2 spectral bands (Blue, Green, Red, Red Edge 1, Red Edge 2, Red Edge 3 and NIR). (2) In addition, we also selected five vegetation indices, the NDVI, EVI, Normalized difference phenology index (NDPI), Sample Ratio (SR), Soil adjusted vegetation index (SAVI) and one water body index, the Normalized difference water index (NDWI). The equations are shown in Table 2. We used the maximum synthetic Sentinel-2 image to calculate the index data for each year from 2019 to 2021 as features. (3) Finally, since the cultivated land should be relatively regular and flat, we also selected the elevation, slope and aspect data as features [30,31]. There are 16 abovementioned features (Blue, Green, Red, Red Edge 1, Red Edge 2, Red Edge 3, NIR, NDVI, EVI, NDPI, SR, SAVI, NDWI, elevation, slope, and aspect) in total, and they will be used to identify cultivated land in the Shandan Racecourse.
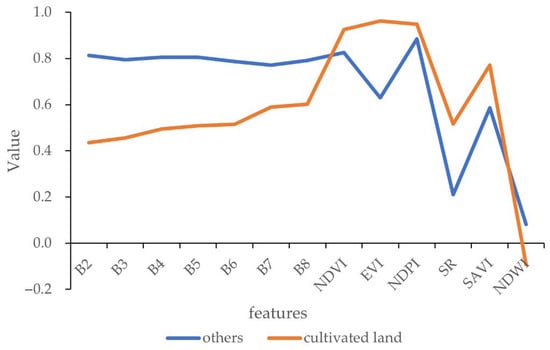
Figure 3.
Mean feature difference between cultivated land and other areas in 2019–2021 (Note: For visual effect, the SR in the Figure is the value after being reduced 50 times).

Table 2.
Index data used in this study (Note: Near infrared (NIR), Red (R), Blue (B), G (Green)).
2.4.2. Oat Pasture Identification Feature Selection
Based on the identification of cultivated land, we identified oat pasture in the Shandan Racecourse. Annual NDVI, EVI, NDPI, SR, SAVI, NDWI, elevation, slope and aspect data that performed well in cropland identification were selected.
Remote sensing time series images are widely used to extract key phenological periods of crops, and then identify crops [38,39,40]. We carried out a 2019–2021 time series curve analysis of the five vegetation indices (NDVI, EVI, NDPI, SR and SAVI) of oat pasture and other forages (barley, highland barley and broad bean) on the racecourse (Figure 4 and Figure 5). In Figure 4 and Figure 5, we marked June 1 and November 1 with black dotted lines each year for easy observation. The vegetation index of oat pasture is smaller than that of other forages in June but larger than that of other forages in September and October, which is consistent with what we know about local oat pasture growing the most in September and October. June, September and October are the months in which oat pasture differ from other forages. Therefore, in addition to the above features, we also selected the monthly NDVI, EVI, NDPI, SR, and SAVI in June, September and October as separate features, with a total of 24 features (NDVI, EVI, NDPI, SR, SAVI, NDWI, elevation, slope, aspect, ndvi_06 (NDVI in June), ndvi_09 (NDVI in September), ndvi_10 (NDVI in October), evi_06 (EVI in June), evi_09 (EVI in September), evi_10 (EVI in October), ndpi_06 (NDPI in June), ndpi_09 (NDPI in September), ndpi_10 (NDPI in October),sr_06 (SR in June), sr_09 (SR in September), sr_10 (SR in October), savi_06 (SAVI in June), savi_09 (SAVI in September) and savi_10 (SAVI in October)). These monthly vegetation index data were calculated from Sentinel-2 images for the month after the maximum synthesis.
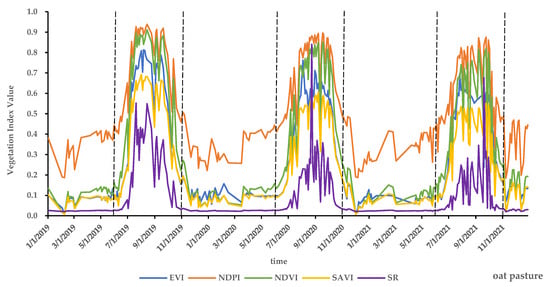
Figure 4.
Time series curves of the oat pasture vegetation index (provided by Sentinel-2).
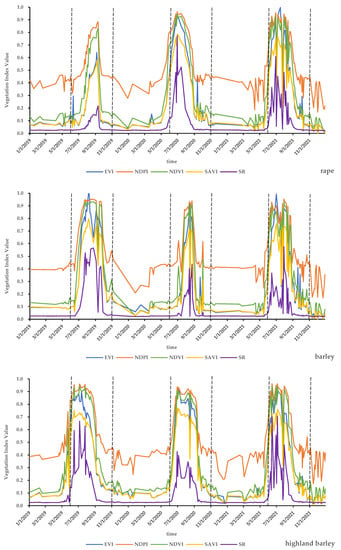
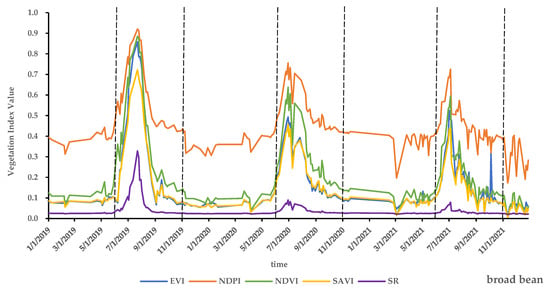
Figure 5.
Time series curves of other forage grass vegetation indices (provided by Sentinel-2; the four Figures represent the vegetation index values of rape, barley, highland barley and broad bean).
Note that there may be no data areas in the monthly vegetation index data after cloud masking. For this, we used SG filtering to smooth and fill the vegetation index data in the study area [41].
2.5. Ground Truth Data for Training and Validation
The training and validation data for this study were obtained from the measured data and the Sentinel-2 images provided by the GEE. For cultivated land identification, our goal is to distinguish cultivated areas from non-cultivated areas. To obtain better cultivated land identification results, we divided the study area into five categories (cultivated land, mountain meadow, others, temperate steppe, and alpine meadow steppe) and extracted the cultivated land area for follow-up research. We generated a total of 977 sample points by measured data and visual interpretation of Sentinel-2 high-definition images, including 356 cultivated land sample points, 72 alpine meadow grassland sample points, 234 mountain meadow grassland sample points, 62 temperate grassland sample points and 253 other sample points scattered outside the above categories. The number of sampling points also depends on the area occupied by each category. Figure 6 is the distribution map of cultivated land identification sample points. The five types of sample points are represented by different colors, and the typical areas of each type are shown in the form of subsets (Figure 6a–e). The same sample data were used for the identification of cultivated land in 2019, 2020 and 2021, as there was little change in the amount of cultivated land in the racecourse from year to year.
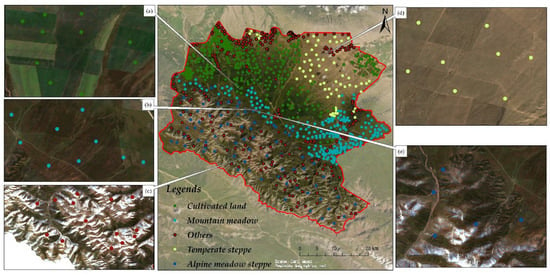
Figure 6.
Cultivated land identification sample points ((a–e) represents show subsets in which samples containing cultivated land, mountain meadow, others, temperate steppe and alpine meadow steppe are found).
With cultivated land identification, we carried out oat pasture identification, and the goal was to classify the area identified as cultivated land into two categories—oat pasture and others. For the selection of sample points for oat pasture identification, we selected Sentinel-2 images from 15 September–15 October in 2019, 2020, and 2021 to obtain sample sites for oat pasture and other forages. This is due to the large difference in the growth of oat pasture and other forages during this period, as seen from the comparison of the attached drawings a and b in Figure 7, Figure 8 and Figure 9. Combined with the measured data, we generated three groups of sample point data for 2019, 2020 and 2021 (Figure 7, Figure 8 and Figure 9). Among them, there were 504 oat pasture sample points and 374 other sample points in 2019; 433 oat pasture sample points and 274 other sample points in 2020; and 601 oat pasture sample points and 309 other sample points in 2021.
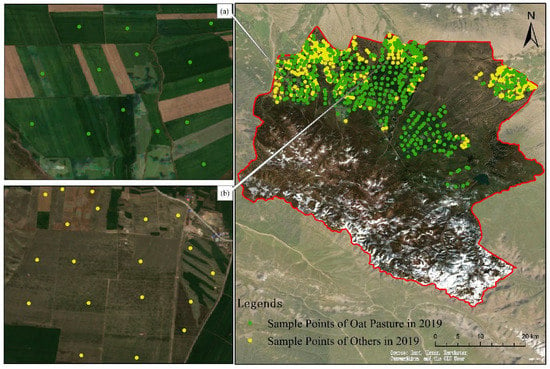
Figure 7.
Oat pasture identification sample points in 2019 ((a,b) represents show subsets in which samples containing oat pasture and others are found).
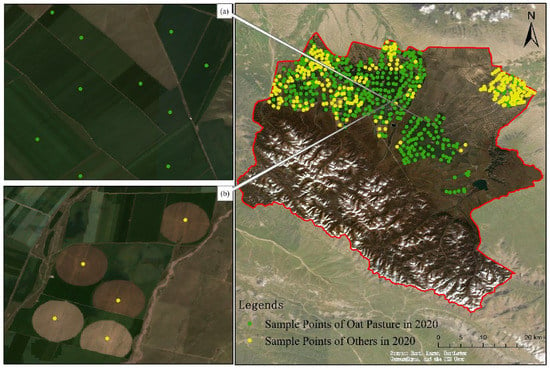
Figure 8.
Oat pasture identification sample points in 2020 ((a,b) represents show subsets in which samples containing oat pasture and others are found).
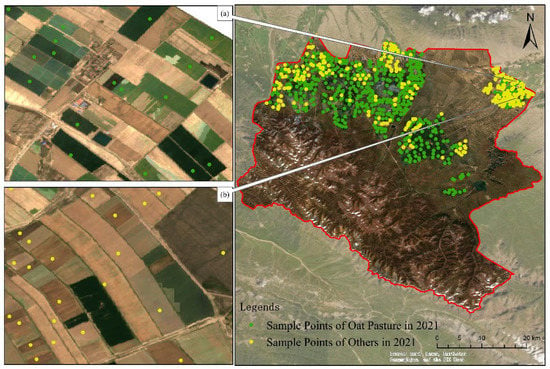
Figure 9.
Oat pasture identification sample points in 2021 ((a,b) represents show subsets in which samples containing oat pasture and others are found).
2.6. Classifiers
We used the RF, SVM and CART classifiers for both cultivated land and oat pasture classification. The real data set was divided into two parts: a training set (80%) and a validation set (20%). The SVM aims to separate two kinds of samples by an optimal separating hyperplane so that the two kinds of samples have the best robustness and the strongest generalization [42]. The Decision Tree (DT) algorithm usually obtains and designs classification rules through professional knowledge, mathematical statistics and machine learning algorithms and then classifies images according to these rules [43]. In this study, we used the CART algorithm. As with the SVM, the CART parameter is set to default. The RF adopts the idea of ensemble learning, which can combine “n” decision trees and produce the final result through their voting. The RF has high calculation accuracy, requires less model training, and can determine the relative importance of variables in the model. It has low sensitivity to the number and quality of training samples, which can avoid data overfitting, so it is widely used in crop identification [29,44]. To choose the number of decision trees in the classifier, we tested 10 trees, 30 trees, 50 trees, 100 trees, 300 trees and 500 trees. Finally, we chose 500 trees, which had the highest accuracy. Other parameters, such as minleafPopulation, variablesPerSplit, bagFraction and seed are set by default. Furthermore, the RF, SVM and CART classifiers are all achievable in the GEE [45,46,47].
2.7. Accuracy Verification
Two different methods were used to evaluate the identification results of cultivated land and oat pasture. First, through the confusion matrix, the overall accuracy (OA) (Equation (1)), producer accuracy (PA) (Equation (2)), user accuracy (UA) (Equation (3)), Kappa coefficient (Equation (4)) and F1-score (Equation (5)) were obtained. All five equations are further detailed in Congalton [48]. In addition, our results were compared with real images, and our results were verified by real map data.
where n is the total number of columns of the confusion matrix, and N is the total number of samples used for verification; Xii is the number of correct classifications of the upper crop-type sample in the ith row and ith column of the confusion matrix; and Xi+ and X+i are the total number of crop-type samples in row i and column I, respectively.
3. Results
3.1. Feature Importance Evaluation
Table 3 shows the three-year average importance ranking of the respective features in cultivated land identification and oat pasture identification from 2019 to 2021, of which 16 features are used in cultivated land identification and 24 features are used in oat pasture identification. In the identification of cultivated land, the feature with the best performance is Elevation (983.10), followed by vegetation index (533.18–639.83), slope (593.44) and aspect (508.56). The performance of single-band reflectance is relatively general, and there is little difference between spectral bands (427.48–472.40), among which the Red edge 3, NIR and Green bands perform better. In the identification of oat pasture, the best-performing feature was the NDVI in September (74.70). The five vegetation indices in September and October have the top ten importance (49.73–74.70), followed by the elevation and June vegetation indices (32.23–38.35). Index data on an annual scale performed well (27.46–34.98). The aspect and slope performance are not good (22.08 and 16.73). Some features are used in both cultivated land identification and oat pasture identification, such as Elevation, Slope, Aspect and annual scale index data (NDVI, EVI, NDPI, SR, SAVI, and NDWI). Although these features are very important for cultivated land identification, they are not as important as the monthly scale vegetation index data in the identification of a specific forage species, oat pasture.

Table 3.
Rank of feature importance.
We took the proportion of feature importance as the contribution of the feature and present Figure 10 and Figure 11. As seen from Figure 10, except for the relatively high contribution rate of Elevation (11.31%), the contributions of other features are not much different. There was no significant difference between the contribution rates of features in 2019, 2020, and 2021.
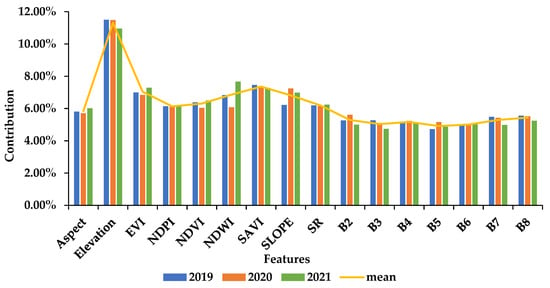
Figure 10.
Contribution rates of the 16 features for cultivated land identification to the identification results, including the results from 2019, 2020, and 2021 and the average of these three years.
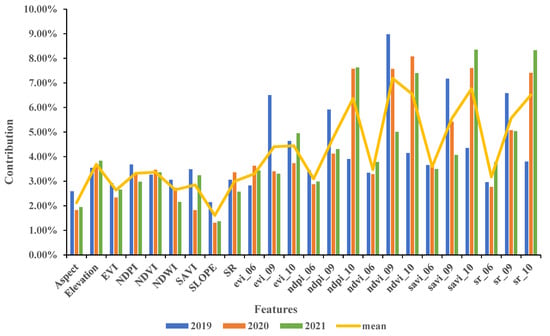
Figure 11.
Contribution rates of the 24 features for oat pasture identification to the identification results, including the results from 2019, 2020, and 2021 and the average of these three years.
Figure 11 clearly shows that the five vegetation indices in September and October performed the best (4.40–7.18%), and their contribution rate reached more than half of the total (58.12%). In contrast with cultivated land identification, the contribution of features in different years in oat pasture identification is quite different. It is obvious that the most important features in 2019 are the five vegetation indices in September, while the most important features in 2020 and 2021 are the five vegetation indices in October, which may be related to the harvest time of the year.
3.2. Accuracy Evaluation
As shown in Table 4, our accuracy evaluation of cultivated land identification and oat pasture identification results includes five metrics: OA, PA, UA, Kappa, and F1. Regardless of the recognition of cultivated land or oat pasture, the accuracy of the RF classifier was the highest. The 2019, 2020 and 2021 cultivated land identification accuracy evaluation results of the RF show that the mean OA is 0.80 (0.79, 0.81, and 0.81); the PA values are 0.89, 0.90, and 0.96; the UAs are 0.85, 0.81, and 0.83; the mean Kappa coefficient is 0.74 (0.71, 0.75, and 0.75); and the F1-scores are 0.87, 0.85, and 0.89, respectively. The accuracy of cultivated land identification results in 2021 is the highest. The 2019, 2020 and 2021 oat pasture identification accuracy evaluation results of the RF show that the mean OA is 0.98 (0.97, 0.97, and 0.99); the PAs are 1.00, 0.96 and 0.99; the UAs are 0.95, 0.98 and 1.00; the mean Kappa coefficient is 0.95 (0.94, 0.93, and 0.99); and the F1-scores are 0.97, 0.97, and 0.99, respectively. Similar to the cultivated land identification results, the oat pasture identification results in 2021 still had the highest accuracy. In all three years, the identification results of oat pasture were more accurate than those of cultivated land.

Table 4.
Accuracy of cultivated land identification and oat pasture identification.
However, in cultivated land identification, the SVM and CART classifiers have a large gap with the RF, with mean OAs of 0.69 and 0.72, respectively (0.67, 0.73, and 0.68; 0.71, 0.75, and 0.71). However, the SVM and CART are not inferior to RF in oat pasture identification, with mean OAs of 0.97 and 0.97 (0.97, 0.97, and 0.97; 0.95, 0.97, and 0.98).
3.3. Cultivated Land Identification Results
For cultivated land identification, we combined the four categories (mountain meadow, temperate steppe, alpine meadow steppe and others) except cultivated land into others. Since the RF classifier has the best recognition and the highest accuracy, we output the results of the identification of racecourse cultivated land in 2019, 2020 and 2021 based on the RF classifier (Figure 12). The identification results for cultivated land in the three years are relatively similar, and the results have a high consistency with the cultivated land distribution of the high-definition images. This identification result provides a good basis for the subsequent identification of oat pasture. The identified areas of cultivated land in 2019, 2020 and 2021 were 449.91 km2 (20.53%), 448.43 km2 (20.46%), and 463.17 km2 (21.13%), respectively. Among them, the cultivated area in 2021 is the largest. The annual change in cultivated land is not large (0.6%). There is no large-scale actual change in cultivated land in the three years, so the identification results are more credible.
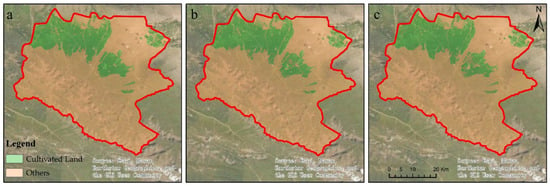
Figure 12.
Cultivated land identification results ((a–c) represents the cultivated land identification results of 2019, 2020 and 2021, respectively).
3.4. Oat Pasture Identification Results
Based on the identification of cultivated land, we carried out the identification of oat pasture in the racecourse. We divided the racecourse into two categories: oat pasture and others. Similarly, we output the result obtained with the RF as the classifier. The results are shown in Figure 13, including the results from 2019 (Figure 13a), 2020 (Figure 13b), and 2021 (Figure 13c). After calculation, the oat pasture areas in 2019, 2020 and 2021 were 347.77 km2 (15.87%), 306.19 km2 (13.97%) and 318.94 km2 (14.55%), respectively. The distribution area of oat pasture was the largest in 2019, and the difference did not exceed 1.9%. Oat pasture is the most widely planted forage in the racecourse, which is also in line with the actual local situation.
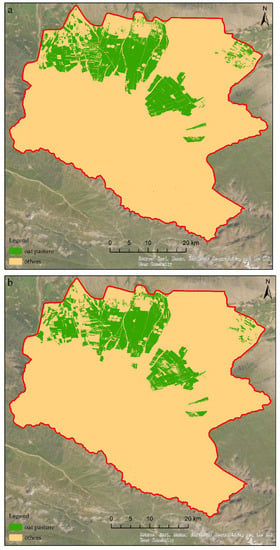
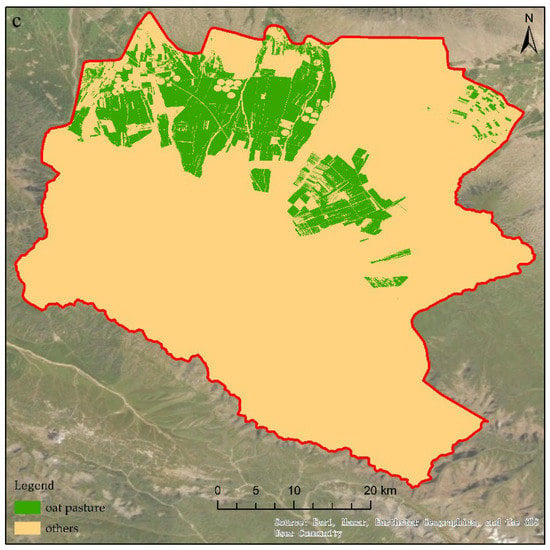
Figure 13.
Oat pasture identification results ((a–c) represents the oat pasture identification results of 2019, 2020 and 2021, respectively).
In addition, to verify the authenticity of our results, we also compared them with high-definition images (10 m) obtained by the GEE. We selected six areas to display each year (Figure 14, Figure 15 and Figure 16, where A, B, C, D, E, and F display high-definition images and a, b, c, d, e, and f display our results), where a, b, c, and d are random regions where the positions change from year to year, while e and f are regions with fixed positions. These areas can reflect different cultivated land conditions. In 2019, 2020 and 2021, our results can distinguish oat pasture from other forages. Our results are highly consistent with the real situation.
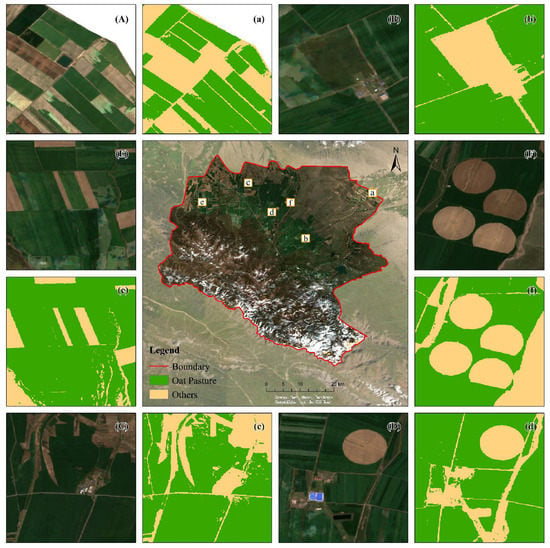
Figure 14.
Comparison of the 2019 racecourse oat pasture identification results and actual images with a spatial resolution of 10 m. The main image in the middle is the image map of the study area, where a–f are the positions of the six display areas; (A–F) in the subsets represent the true color composition of the six display areas and (a–f) represent the classified outcome.
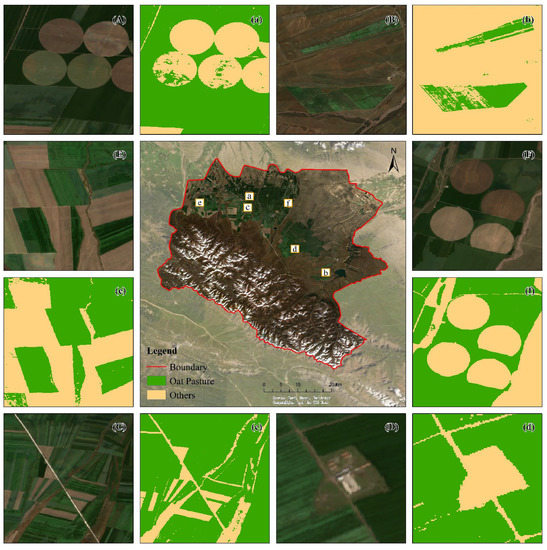
Figure 15.
Comparison of the 2020 racecourse oat pasture identification results and actual images with a spatial resolution of 10 m. The main image in the middle is the image map of the study area, where a–f are the positions of the six display areas; (A–F) in the subsets represent the true color composition of the six display areas and (a–f) represent the classified outcome.
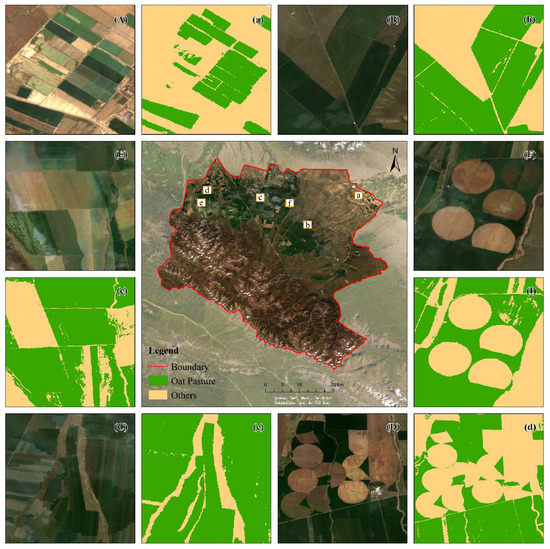
Figure 16.
Comparison of the 2021 racecourse oat pasture identification results and actual images with a spatial resolution of 10 m. The main image in the middle is the image map of the study area, where a–f are the positions of the six display areas; (A–F) in the subsets represent the true color composition of the six display areas and (a–f) represent the classified outcome.
4. Discussion
4.1. Reliability of the Sentinel-2 Data
In contrast with general land classification, small-area forage identification is based on images of different phases in the same growing season to distinguish between different forages. In addition, there is missing data due to clouds and other disturbances, which requires high spatial and temporal resolution. Data and methods to exclude cloud interference or fill in missing images are important [49].
At present, the selection of remote sensing data for crop identification is limited to Sentinel-1, Sentinel-2 and Landsat data [50,51]. Sentinel-2 data have a temporal resolution of five days and a spatial resolution of 10 m and were the best choice for our research. There are also studies that prove that Sentinel-2 data are superior to other types of remote sensing data in the identification of some crops [29,52].
With the interference of clouds, Sentinel-2 images with short time intervals have missing data. This situation is inevitable. We also encountered this problem when using the monthly-scale vegetation index feature in our study. Of course, MODIS data can fill in the missing vegetation index data, but the 250 m spatial resolution of MODIS data is unacceptable in the identification of forage grass in small areas. SG filtering has better performance in this regard. It can reconstruct, smooth and enhance the vegetation index time series [41,53].
4.2. Classification Accuracy Evaluation
In cultivated land identification, the mean OAs of the RF, SVM, and CART classifiers are 0.80, 0.69, and 0.72, respectively; the Kappa coefficients are 0.74, 0.58, and 0.62, respectively. The performance of the RF is better than that of the other two classifiers. In oat pasture identification, the RF, SVM and CART classifiers have high OAs of 0.98, 0.97, and 0.97 and high Kappa values of 0.95, 0.94, and 0.95, respectively. In our study, the RF has a good performance in both cultivated land identification and oat pasture identification, while the SVM and CART are more suitable for oat pasture identification. By comparison, the RF algorithm has a high calculation accuracy and short model training time and can determine the relative importance of variables in the model. At the same time, this algorithm has low sensitivity to the number and quality of training samples, and is widely used in crop identification [44].
Although few studies on the identification of forage grass have been carried out, research on the classification of land types and crops is mature. Hu et al. [54] had an OA of 89% for crop classification in the Hetao Irrigation District in 2020 based on Sentinel-1/2 and an RF classifier with 300 trees. Kushal, KC et al. [55] showed that the OA of the four types of cover crops in the Maumee River was 75%, and the Kappa coefficient was 0.63 based on Landsat and an RF classifier for 2008–2019. The OA of the winter wheat map of Jiangsu Province drawn by Yang et al. [56] based on Sentinel-2 was 0.93. Tian et al. [57] used Sentinel-1/2 to identify the corn field scale in Hebei Province, and the OA was 0.90.
Compared with previous studies, our oat pasture classification accuracy is relatively high, which is mainly due to the following reasons: (1) the collection of real data and the selection of characteristic variables are theoretically supported; (2) before classifying oat pasture, we carried out cultivated land identification, and classified oat pasture based on cultivated land, which may improve our classification accuracy of oat pasture; and (3) the classification results of oat pasture only include two categories (oat pasture and others), and this classification method has high precision.
The recognition accuracy of our cultivated land is slightly lower than that of Ganbaatar et al. [58] (93.7%) and Cao et al. [59] (92.82%), mainly due to the low accuracy of temperate grasslands, alpine meadow grasslands and others in cultivated land classification. Table 5 shows the confusion matrix of cultivated land classification in 2019–2021, as well as the UA and PA for each category. The cultivated land category has higher UA (0.83) and PA (0.92). The above three categories have many misclassifications, resulting in low OA.

Table 5.
Confusion matrix and accuracy of cultivated land identification in 2019–2021 (cl: cultivated land, tg: temperature grasslands, mmg: mountain meadow grasslands, ag: alpine meadow grasslands).
4.3. Feature Selection Methods
The selection of feature variables has an important impact on the classification results and the efficiency of machine learning algorithms [52]. For the feature selection of cultivated land identification, altitude, slope and aspect are selected, which are important for cultivated land identification [30,53]. In addition, as shown in Figure 3, the features with large differences between cultivated land and other land objects are selected, which can distinguish cultivated land from other areas to the greatest extent and improve the accuracy of our results.
The selection of features in oat pasture identification is relatively complicated. First, we selected six annual index data and elevation, slope, and aspect data features that perform well in cultivated land identification, but these features alone cannot distinguish oat pasture from other forages. Therefore, by analyzing the interannual changes in the vegetation index of oat pasture and other forages from 2019 to 2021, we found that June, September, and October were the months with large differences in the growth of oat pasture and other forages. Therefore, we finally added the monthly NDVI, EVI, NDPI, SR, and SAVI data in June, September, and October. The addition of this time series feature helped us to determine the differences between forages well, which is similar to the results of Luo et al. [28]. Among the features identified by oat forage, some of the features are from the identification of cultivated land, and some are from the monthly scale vegetation index we selected according to the key phenological period. Our results show that the recognition accuracy of oat pasture is much higher than that of cultivated land, which may be due to the selection of time series features. The contribution rate obtained by the importance also confirms the value of the monthly-scale vegetation index features to the classification results. Figure 11 shows that the five vegetation indices in September and October performed the best (4.40–7.18%), and their contribution rate reached more than half of the total (58.12%).
4.4. Limitations and Prospects
High-resolution images inevitably cause noise in the results. Although we tried to use SG filtering to smooth time series images, the noise problem still exists in our results. Due to our research needs, Sentinel-2 data are theoretically the most suitable data choice for our study, but it is undeniable that we did not try to use other data such as Landsat, Sentinel-1 and GF-1 data. Some studies found that the classification results of multiple data combinations were better. Chakhar et al. [60] found that the combination of Sentinel-1 and Sentinel-2 data had higher accuracy, and Blickensdorfer et al. [61] found that combining Sentinel-1, Sentinel-2 and Landsat 8 data can increase the OA by 6% to 10% compared to single sensor approaches. Perhaps these data can provide us with more precise results. This is an important challenge for future research. In follow-up research, we will expand the research area and identify various types of forage grass, hoping to provide method support for the area identification of forage grass on the Tibetan Plateau.
5. Conclusions
Based on the GEE platform, Sentinel-2 data and three classifiers, this study successfully mapped the oat pasture area of the Shandan Racecourse over 3 years from 2019 to 2021 at a resolution of 10 m after cultivated land identification. This study uses three classifiers based on machine learning algorithms, the RF, SVM, and CART classifiers. The mean OA of the RF, SVM, and CART classifiers in cultivated land identification are 0.80, 0.69, and 0.72, respectively; the Kappa coefficients are 0.74, 0.58, and 0.62. The RF far outperforms the other two classifiers. In oat pasture recognition, RF, SVM and CART all have high OA and Kappa, respectively, 0.98, 0.97, 0.97; 0.95, 0.94, 0.95. Taken together, RF is more suitable for our research. The research results show that the identified areas of cultivated land in 2019, 2020 and 2021 were 449.91 km2 (20.53%), 448.43 km2 (20.46%), and 463.17 km2 (21.13%), respectively, and the interannual variation in cultivated land was small (0.6%). The oat pasture areas in 2019, 2020 and 2021 were 347.77 km2 (15.87%), 306.19 km2 (13.97%) and 318.94 km2 (14.55%), respectively, with little change (1.9%) from year to year. In the identification of cultivated land, the feature with the best performance is elevation (11.31%). In the identification of oat pasture, the best-performing feature is the NDVI in September (7.18%), and the five vegetation indices in September and October have the top ten contribution rates. For annual oat pasture, it is important to identify key phenological periods through time series analysis to select the most suitable features. This study confirms the ability of the GEE platform, Sentinel-2 data and RF classifier to estimate the area of annual forage in alpine regions. The method used in this study can be used to identify the area of forage on the Tibetan Plateau. The results of this study can provide technical and methodological support for estimating the status and development potential of artificial grasslands on the Tibetan Plateau.
Author Contributions
Conceptualization, R.W., Q.F. and T.L.; methodology, R.W.; software, Z.J. and K.M.; validation, Q.F. and T.L.; formal analysis, R.W.; investigation, Z.J. and Z.Z.; resources, Q.F. and T.L.; data curation, Q.F.; writing—original draft preparation, R.W.; writing—review and editing, R.W. and Q.F.; visualization, Q.F.; supervision, Q.F.; project administration, Q.F. and T.L.; funding acquisition, Q.F. and T.L. All authors have read and agreed to the published version of the manuscript.
Funding
This research was funded by Consulting Project of the Engineering Academy of China: 2022-HZ-09; Consulting Project of the Engineering Academy of China: 2021-HZ-5; The earmarked fund for CARS (CARS-34).
Data Availability Statement
Not applicable.
Conflicts of Interest
The authors declare no conflict of interest.
References
- Fang, J.; Jing, H.; Zhang, W. Greet to the era that grass-based livestock husbandry will become half of our country’s modern agriculture. China Sci. Bull. 2018, 63, 1615–1618. [Google Scholar]
- Fang, J.; Jing, H.; Zhang, W.; Gao, S.; Duan, Z.; Wang, H.; Zhong, J.; Pan, Q.; Zhao, K.; Bai, W.; et al. The concept of “grass-based livestock husbandry” and its practice in Hulun Buir, Inner Mongolia. China Sci. Bull. 2018, 63, 1619–1631. [Google Scholar] [CrossRef]
- Ren, J. Sanlu milk powder incident was a direct consequence of ignored prataculture. Pratacultural Sci. 2009, 26, 1. [Google Scholar]
- Ren, J.; Chang, S. Using grassland agricultural systems to ensure the food security. Chin. J. Grassl. 2009, 31, 3–6. [Google Scholar]
- Sun, J.; Liu, Z.; Zhong, J.; Wang, T.; Wang, X.; Sun, C.; Gao, S.; Pan, Q. Exploration of the stereo development mode of ecological grass-based livestock husbandry in Yunnan-Guizhou Plateau: An example from the Yongshan County, Yunnan Province. Pratacultural Sci. 2022, 39, 381–390. [Google Scholar]
- Duan, C.; Shi, P.; Zhang, X.; Zong, N. Suitability analysis for sown pasture planning in an alpine rangeland of the northern Tibetan Plateau. Acta Ecol. Sin. 2019, 39, 5517–5526. [Google Scholar]
- Qian, S. Development status and countermeasures of oat hay industry in Shandan racecourse. Mod. Agric. Sci. Technol. 2017, 233+237. [Google Scholar]
- Han, L.; Shang, Z.; Ren, G.; Wang, Y.; Ma, Y.; Li, X.; Long, R. The response of plants and soil on black soil patch of the Qinghai-Tibetan Plateau to variation of bare-patch areas. Acta Prataculturae Sin. 2011, 20, 1. [Google Scholar]
- Huang, J.; Hou, Q.; Su, W.; Liu, J.; Zhu, D. Mapping corn and soybean cropped area with GF-1 WFV data. Trans. Chin. Soc. Agric. Eng. 2017, 33, 164–170. [Google Scholar]
- Ji, F.; Liu, J.; Wang, L. Summary of remote sensing algorithm in crop type identification and its application based on Gaofen satellites. Chin. J. Agric. Resour. Reg. Plan. 2021, 42, 254–268. [Google Scholar]
- Jin, Z.; Azzari, G.; You, C.; Di Tommaso, S.; Aston, S.; Burke, M.; Lobell, D.B. Smallholder maize area and yield mapping at national scales with Google Earth Engine. Remote Sens. Environ. 2019, 228, 115–128. [Google Scholar] [CrossRef]
- Gu, X.; Zhang, Y.; Sang, H.; Zhai, L.; Li, S. Research on crop classification method based on Sentinel-2 time series combined vegetation index. Remote Sens. Technol. Appl. 2020, 35, 702–711. [Google Scholar]
- Jin, Z.; Azzari, G.; Burke, M.; Aston, S.; Lobell, D.B. Mapping smallholder yield heterogeneity at multiple scales in Eastern Africa. Remote Sens. 2017, 9, 931. [Google Scholar] [CrossRef]
- Jain, M.; Srivastava, A.K.; Balwinder, S.; Joon, R.K.; McDonald, A.; Royal, K.; Lisaius, M.C.; Lobell, D.B. Mapping smallholder wheat yields and sowing dates using micro-satellite data. Remote Sens. 2016, 8, 860. [Google Scholar] [CrossRef]
- Burke, M.; Lobell, D.B. Satellite-based assessment of yield variation and its determinants in smallholder African systems. Proc. Natl. Acad. Sci. USA 2017, 114, 2189–2194. [Google Scholar] [CrossRef]
- Lambert, M.-J.; Traore, P.C.S.; Blaes, X.; Baret, P.; Defourny, P. Estimating smallholder crops production at village level from Sentinel-2 time series in mali’s cotton belt. Remote Sens. Environ. 2018, 216, 647–657. [Google Scholar] [CrossRef]
- Sonobe, R.; Tani, H.; Wang, X.; Kobayashi, N.; Shimamura, H. Parameter tuning in the support vector machine and random forest and their performances in cross- and same-year crop classification using TerraSAR-X. Int. J. Remote Sens. 2014, 35, 7898–7909. [Google Scholar] [CrossRef]
- Kussul, N.; Lavreniuk, M.; Skakun, S.; Shelestov, A. Deep learning classification of land cover and crop types using remote sensing data. IEEE Geosci. Remote Sens. Lett. 2017, 14, 778–782. [Google Scholar] [CrossRef]
- Cai, Y.; Lin, H.; Zhang, M. Mapping paddy rice by the object-based random forest method using time series Sentinel-1/Sentinel-2 data. Adv. Space Res. 2019, 64, 2233–2244. [Google Scholar] [CrossRef]
- Lu, Y.; Fan, Y.; Wu, H.; Peng, T.; Huangfu, B.; He, M. Study on extracting crop planting information by object-oriented method—Taking Qitai County of Xinjiang as example. Shandong Agric. Sci. 2020, 52, 137–143. [Google Scholar]
- Guo, M.; Liu, T.; Han, P.; Dong, J.; Niu, J. Discriminating data of spatial distribution of artificial grassland based on multi-source satellite remote sensing date fusion. Chin. J. Grassl. 2019, 41, 53–62. [Google Scholar]
- Bai, X.; Wu, H.; Lu, Y.; Fan, Y. Identification of crop species in Shawan County based on Landsat8 and GF-1 remote sensing images. Shandong Agric. Sci. 2020, 52, 156–162. [Google Scholar]
- Saltykov, M.; Yakubailik, O.; Bartsev, S. Identification of vegetation types and its boundaries using artificial neural networks. In Proceedings of the International Workshop on Advanced Technologies in Material Science, Mechanical and Automation Engineering (MIP)-Engineering, Krasnoyarsk, Russia, 4–6 April 2019. [Google Scholar]
- Liu, T.; Han, P.; Guo, M.; Dong, J.; Ren, J.; Tian, W.; Li, Y.; Niu, J. Extracting spatial distribution of rainfed artificial alfalfa grassland based on multi-temporal remote sensing data. Chin. J. Grassl. 2018, 40, 56–63. [Google Scholar]
- Ren, H.; Dong, J.; Li, X.; Niu, J.; Zhang, X. Extraction artificial alfalfa grassland information using Landsat8 remote sensing data. Chin. J. Grassl. 2015, 37, 81–87+120. [Google Scholar]
- Bao, X.; Wang, Y.; Feng, Q.; Ge, J.; Hou, M.; Liu, C.; Gao, X.; Liang, T. Spatial distribution extraction of alfalfa based on Sentinel-2 and GF-1 images. Trans. Chin. Soc. Agric. Eng. 2021, 37, 153–160. [Google Scholar]
- Ni, R.; Tian, J.; Li, X.; Yin, D.; Li, J.; Gong, H.; Zhang, J.; Zhu, L.; Wu, D. An enhanced pixel-based phenological feature for accurate paddy rice mapping with Sentinel-2 imagery in Google Earth Engine. ISPRS J. Photogramm. Remote Sens. 2021, 178, 282–296. [Google Scholar] [CrossRef]
- Luo, C.; Liu, H.; Lu, L.; Liu, Z.; Kong, F.; Zhang, X. Monthly composites from Sentinel-1 and Sentinel-2 images for regional major crop mapping with Google Earth Engine. J. Integr. Agric. 2021, 20, 1944–1957. [Google Scholar] [CrossRef]
- He, Y.; Dong, J.; Liao, X.; Sun, L.; Wang, Z.; You, N.; Li, Z.; Fu, P. Examining rice distribution and cropping intensity in a mixed single- and double-cropping region in South China using all available Sentinel 1/2 images. Int. J. Appl. Earth Obs. Geoinf. 2021, 101, 102351. [Google Scholar] [CrossRef]
- Dong, J.; Xiao, X.; Menarguez, M.A.; Zhang, G.; Qin, Y.; Thau, D.; Biradar, C.; Moore, B., III. Mapping paddy rice planting area in northeastern Asia with Landsat 8 images, phenology-based algorithm and Google Earth Engine. Remote Sens. Environ. 2016, 185, 142–154. [Google Scholar] [CrossRef]
- Zhang, X.; Wu, B.; Ponce-Campos, G.E.; Zhang, M.; Chang, S.; Tian, F. Mapping up-to-date paddy rice extent at 10 m resolution in China through the integration of optical and synthetic aperture radar images. Remote Sens. 2018, 10, 1200. [Google Scholar] [CrossRef]
- Tucker, C.J. Red and photographic infrared linear combinations for monitoring vegetation. Remote Sens. Environ. 1979, 8, 127–150. [Google Scholar] [CrossRef]
- Liu, H.Q.; Huete, A. A feedback based modification of the NDVI to minimize canopy background and atmospheric noise. IEEE Trans. Geosci. Remote Sens. 1995, 33, 814. [Google Scholar] [CrossRef]
- Jordan, C.F. Derivation of leaf-area index from quality of light on the forest floor. Ecology 1969, 50, 663–666. [Google Scholar] [CrossRef]
- Marsett, R.C.; Qi, J.; Heilman, P.; Biedenbender, S.H.; Watson, M.C.; Amer, S.; Weltz, M.; Goodrich, D.; Marsett, R. Remote sensing for grassland management in the arid Southwest. Rangel. Ecol. Manag. 2006, 59, 530–540. [Google Scholar] [CrossRef]
- Wang, C.; Chen, J.; Wu, J.; Tang, Y.; Shi, P.; Black, T.A.; Zhu, K. A snow-free vegetation index for improved monitoring of vegetation spring green-up date in deciduous ecosystems. Remote Sens. Environ. 2017, 196, 1–12. [Google Scholar] [CrossRef]
- Gao, B.C. NDWI—A normalized difference water index for remote sensing of vegetation liquid water from space. Remote Sens. Environ. 1996, 58, 257–266. [Google Scholar] [CrossRef]
- Jiang, T.; Liu, X.; Wu, L. Method for mapping rice fields in complex landscape areas based on pre-trained convolutional neural network from HJ-1 A/B data. ISPRS Int. J. Geo Inf. 2018, 7, 418. [Google Scholar] [CrossRef]
- Torbick, N.; Chowdhury, D.; Salas, W.; Qi, J. Monitoring rice agriculture across Myanmar using time series Sentinel-1 assisted by Landsat-8 and PALSAR-2. Remote Sens. 2017, 9, 119. [Google Scholar] [CrossRef]
- Nguyen, D.B.; Clauss, K.; Cao, S.; Naeimi, V.; Kuenzer, C.; Wagner, W. Mapping rice seasonality in the Mekong Delta with multi-year Envisat ASAR WSM data. Remote Sens. 2015, 7, 15868–15893. [Google Scholar]
- Tuvdendorj, B.; Zeng, H.; Wu, B.; Elnashar, A.; Zhang, M.; Tian, F.; Nabil, M.; Nanzad, L.; Bulkhbai, A.; Natsagdorj, N. Performance and the optimal integration of Sentinel-1/2 time-series features for crop classification in Northern Mongolia. Remote Sens. 2022, 14, 1830. [Google Scholar] [CrossRef]
- Burges, C.J. A tutorial on support vector machines for pattern recognition. Data Min. Knowl. Discov. 1998, 2, 121–167. [Google Scholar] [CrossRef]
- Wang, M.; Liu, Z.; Baig, M.H.A.; Wang, Y.; Li, Y.; Chen, Y. Mapping sugarcane in complex landscapes by integrating multi-temporal Sentinel-2 images and machine learning algorithms. Land Use Policy 2019, 88, 104190. [Google Scholar] [CrossRef]
- Ma, Z.; Liu, C.; Xue, H.; Li, J.; Fang, X.; Zhou, J. Identification of wheat by integrating active and passive remote sensing data based on Google Earth Engine platform. Trans. Chin. Soc. Agric. Mach. 2021, 52, 195–205. [Google Scholar]
- Hassan, F.; Safdar, T.; Irtaza, G.; Khan, A.U.; Kazmi, S.M.H.; Murtaza, F. Urbanization change analysis based on SVM and RF machine learning algorithms. Int. J. Adv. Comput. Sci. Appl. 2020, 11, 591–601. [Google Scholar] [CrossRef]
- Shaharum, N.S.N.; Shafri, H.Z.M.; Ghani, W.A.W.A.K.; Samsatli, S.; Al-Habshi, M.M.A.; Yusuf, B. Oil palm mapping over Peninsular Malaysia using Google Earth Engine and machine learning algorithms. Remote Sens. Appl.-Soc. Environ. 2020, 17, 100287. [Google Scholar] [CrossRef]
- Bar, S.; Parida, B.R.; Pandey, A.C. Landsat-8 and Sentinel-2 based forest fire burn area mapping using machine learning algorithms on GEE cloud platform over Uttarakhand, Western Himalaya. Remote Sens. Appl.-Soc. Environ. 2020, 18, 100324. [Google Scholar] [CrossRef]
- Congalton, R.G. A review of assessing the accuracy of classifications of remotely sensed data. Remote Sens. Environ. 1991, 37, 35–46. [Google Scholar] [CrossRef]
- Shelestov, A.; Lavreniuk, M.; Kussul, N.; Novikov, A.; Skakun, S. Exploring Google Earth Engine platform for big data processing: Classification of multi-temporal satellite imagery for crop mapping. Front. Earth Sci. 2017, 5, 17. [Google Scholar] [CrossRef] [Green Version]
- Felegari, S.; Sharifi, A.; Moravej, K.; Amin, M.; Golchin, A.; Muzirafuti, A.; Tariq, A.; Zhao, N. Integration of Sentinel 1 and Sentinel 2 satellite images for crop mapping. Appl. Sci. 2021, 11, 10104. [Google Scholar] [CrossRef]
- Salinero-Delgado, M.; Estevez, J.; Pipia, L.; Belda, S.; Berger, K.; Paredes Gomez, V.; Verrelst, J. Monitoring cropland phenology on Google Earth Engine using gaussian process regression. Remote Sens. 2022, 14, 146. [Google Scholar] [CrossRef]
- You, N.; Dong, J. Examining earliest identifiable timing of crops using all available Sentinel 1/2 imagery and Google Earth Engine. ISPRS J. Photogramm. Remote Sens. 2020, 161, 109–123. [Google Scholar] [CrossRef]
- Xiao, W.; Xu, S.; He, T. Mapping paddy rice with Sentinel-1/2 and Phenology-, object-based algorithm—A implementation in Hangjiahu plain in China using GEE platform. Remote Sens. 2021, 13, 990. [Google Scholar] [CrossRef]
- Hu, Y.; Zeng, H.; Tian, F.; Zhang, M.; Wu, B.; Gilliams, S.; Li, S.; Li, Y.; Lu, Y.; Yang, H. An interannual transfer learning approach for crop classification in the Hetao Irrigation district, China. Remote Sens. 2022, 14, 1208. [Google Scholar] [CrossRef]
- Kushal, K.C.; Zhao, K.; Romanko, M.; Khanal, S. Assessment of the spatial and temporal patterns of cover crops using remote sensing. Remote Sens. 2021, 13, 2689. [Google Scholar]
- Yang, G.; Yu, W.; Yao, X.; Zheng, H.; Cao, Q.; Zhu, Y.; Cao, W.; Cheng, T. AGTOC: A novel approach to winter wheat mapping by automatic generation of training samples and one-class classification on Google Earth Engine. Int. J. Appl. Earth Obs. Geoinf. 2021, 102, 102446. [Google Scholar] [CrossRef]
- Tian, F.; Wu, B.; Zeng, H.; Zhang, X.; Xu, J. Efficient identification of corn cultivation area with multitemporal synthetic aperture radar and optical images in the Google Earth Engine cloud platform. Remote Sens. 2019, 11, 629. [Google Scholar] [CrossRef]
- Ganbaatar, G.; Lee, K.-S. Classification of crop lands over Northern Mongolia using multi-temporal Landsat TM data. Korean J. Remote Sens. 2013, 29, 611–619. [Google Scholar] [CrossRef]
- Cao, X.; Chen, X.; Zhang, W.; Liao, A.; Chen, L.; Chen, Z.; Chen, J. Global cultivated land mapping at 30 m spatial resolution. Sci. China Earth Sci. 2016, 59, 2275–2284. [Google Scholar] [CrossRef]
- Chakhar, A.; Hernandez-Lopez, D.; Ballesteros, R.; Moreno, M.A. Improving the accuracy of multiple algorithms for crop classification by integrating Sentinel-1 observations with Sentinel-2 data. Remote Sens. 2021, 13, 243. [Google Scholar] [CrossRef]
- Blickensdoerfer, L.; Schwieder, M.; Pflugmacher, D.; Nendel, C.; Erasmi, S.; Hostert, P. Mapping of crop types and crop sequences with combined time series of Sentinel-1, Sentinel-2 and Landsat 8 data for Germany. Remote Sens. Environ. 2022, 269, 112831. [Google Scholar] [CrossRef]
Publisher’s Note: MDPI stays neutral with regard to jurisdictional claims in published maps and institutional affiliations. |
© 2022 by the authors. Licensee MDPI, Basel, Switzerland. This article is an open access article distributed under the terms and conditions of the Creative Commons Attribution (CC BY) license (https://creativecommons.org/licenses/by/4.0/).