Article

Multi-Scale Feature Aggregation Network for Water Area Segmentation

1
Collaborative Innovation Center on Atmospheric Environment and Equipment Technology, B-DAT, Nanjing University of Information Science and Technology, Nanjing 210044, China
2
College of Information Science and Technology, Nanjing Forestry University, Nanjing 210037, China
*
Author to whom correspondence should be addressed.
Remote Sens. 2022, 14(1), 206; https://doi.org/10.3390/rs14010206
Submission received: 8 December 2021 / Revised: 29 December 2021 / Accepted: 30 December 2021 / Published: 3 January 2022
(This article belongs to the Special Issue Semantic Interpretation of Remotely Sensed Images)

Abstract

:
Water area segmentation is an important branch of remote sensing image segmentation, but in reality, most water area images have complex and diverse backgrounds. Traditional detection methods cannot accurately identify small tributaries due to incomplete mining and insufficient utilization of semantic information, and the edge information of segmentation is rough. To solve the above problems, we propose a multi-scale feature aggregation network. In order to improve the ability of the network to process boundary information, we design a deep feature extraction module using a multi-scale pyramid to extract features, combined with the designed attention mechanism and strip convolution, extraction of multi-scale deep semantic information and enhancement of spatial and location information. Then, the multi-branch aggregation module is used to interact with different scale features to enhance the positioning information of the pixels. Finally, the two high-performance branches designed in the Feature Fusion Upsample module are used to deeply extract the semantic information of the image, and the deep information is fused with the shallow information generated by the multi-branch module to improve the ability of the network. Global and local features are used to determine the location distribution of each image category. The experimental results show that the accuracy of the segmentation method in this paper is better than that in the previous detection methods, and has important practical significance for the actual water area segmentation.

1. Introduction

In remote sensing images, the river region is an important landmark, with important practical significance in water resources investigation, water management of the region, flood monitoring and water resources’ protection planning [1]. Increasing attention has been paid to research into river detection. Therefore, the accurate segmentation of rivers is the first step in this research. Traditional segmentation methods mainly include methods based on threshold, edge, active region and support vector machines, etc. Zhu et al. [2] used filtering and morphological methods, combined with a regional growth algorithm, to detect changes in river areas. However, this algorithm is an iterative method, which has large time and space costs and is not universal. Sun [3] proposed a new algorithm for river detection in Synthetic Aperture Radar (SAR) images, which extracted edges in the wavelet domain and combined water areas through ridge tracking. The edge detection results first obtains the wavelet transform data on the adjacent scale, and then approximates these by using their spatial correlation. This algorithm improves the detection effect of river edges to a certain extent, but the parameter setting of this method is greatly affected by artificial influences and the operating efficiency is still low. McFeeters [4] proposed the Normalized Difference Water Index (NDWI) method, which uses the near-infrared light and green light of the image to boost image features and then performs accurate segmentation. Since the ratio calculation can eliminate the influence of topographical factors, it can remove all kinds of shadows, but the results obtained by this method are extremely susceptible to environmental influences. Singh [5] proposed a new technology that combines strength and texture information for effective area classification, combined with Neighborhood-based Membership Ambiguity Correction (NMAC) and Dynamic Sliding Window Size Estimation (DSWSE), which removes most pixel level noise and smoothes the boundary between adjacent regions. However, this can also be disturbed by noise. In addition, many parameters need to be set manually, meaning that the results are greatly affected by humans. Zhang [6] proposed a support vector machine (SVM) method that weakens and enhances the edge features, which can minimize errors. However, this method was more difficult to train when the amount of data was too large, the boundary results extracted by this algorithm are still very rough, and the accuracy needs to be improved. In sum, the abovementioned methods have many problems, such as a large manual input, high requirements for data processing, poor generalization performance, and inaccurate river information.
With the continuous application of convolutional networks, an increasing number of deep learning explorations are being carried out. In 2006, Hinton proposed the deep learning method. The back propagation algorithm is used to train the network to improve the effect of the model [7]. When the convolutional network was first developed, it was generally used for image level classification. The main idea is to input the picture into the network to continuously convolve and pool, and then the features are extracted. Finally, the probability of each category is produced in the output layer, and the highest category is the final result. However, these models cannot segment more precise details, and the classification objects are limited. The traditional model of small tributaries cannot meet the accuracy requirements. To solve these problems, some scholars have proposed a network for the pixel-level classification of images. This network can correspond between the pixels in the image and the labels, which can extract more detailed information than the classification network. In 2014, the semantic segmentation network, full revolution network (FCN) [8], was proposed. This can realize the pixel level classification of images, which is a qualitative leap and improves the efficiency of image classification. However, it ignores the relationship between pixels, and the results are not accurate enough and are sensitive to image details. Ref. [9] proposed a semantic segmentation network SegNet composed of an encoding structure and a decoding structure, which retains detailed information of the image by storing the position index in the pooling process, but the training time is long and the efficiency is low. Ronneberger [10] proposed a UNET semantic segmentation network, which spliced features in dimensions during the upsampling process, continuously integrated features, obtained richer feature information, and achieved precise segmentation tasks. However, simply splicing image features cannot restore the rich features of the image, and it is easy to generate redundant information. In 2017, Ciecholewski [11] proposed a watershed segmentation method based on morphology, which improves the segmentation quality by maximizing the average contrast to merge regions, but the segmentation details are not perfect, and misjudgments may occur. In 2016, Sghaier [12] proposed an algorithm based on local texture measurement and global knowledge related to the shape of the target object, but the algorithm will lose some detailed information. In 2017, Zhao [13] designed a Pyramid Scene Analysis Network (PSPNET), which aggregated contexts in different regions, made use of different receptive fields, and combined local and global clues to enrich and enhance the extracted feature information. Shamsolmoali [14] proposed a new multi-patch feature pyramid network (MPFP-Net) architecture, which divides small blocks into subsets of class associations, and the small blocks are related to each other to enhance the relevance of the small blocks. This contains bottom-up and horizontal connections, and integrates features of different scales to improve the accuracy of the model. However, in complex waters and dark waters, it is impossible to accurately identify the scope and boundaries of the waters. The Deep Feature Extraction module proposed in this paper carries out an attention design in the fusion process of features of different scales, and further optimizes the features to better mine information. Shamsolmoali [15] proposed the rotation equivariant feature image pyramid network, which reduces the amount of pyramid parameters, but, for complex backgrounds, it cannot capture location information. When the river boundary is similar to the surrounding environment, it will make misjudgements. In this paper, position attention is introduced in the Deep Feature Extraction module, and, in order to strengthen the model’s segmentation of edge effects, we introduce strip convolution to refine the edge. Shamsolmoali [16] proposed a feature pyramid (FP) network, which improves the performance of the model by extracting effective features from each layer of the network to describe objects of different scales, but we propose a stripe for the edge’s convolution. In addition, a new fusion module is designed to integrate the information to achieve precise segmentation of the water area. In 2020, Hoekstra [17] proposed an algorithm that combines IRGS segmentation and supervised pixel-by-pixel RF marking, which improves the accuracy of segmentation, but reduces the efficiency of segmentation. In 2020, Sghaier [18] proposed the Separable Residual SegNet Network for Water Areas Segmentation, which improves the ability of network features by quoting residual blocks, but when the background is complex, the edges cannot be accurately identified and the edges are not smooth.
Although previous remote sensing image segmentation algorithms have a good performance, because the extraction of semantic features adopts the down-sampling method in the convolutional neural network, it is easy to lose details in the feature extraction stage, which can easily cause problems such as inaccurate segmentation results and blurred edges. Many methods have been proposed to improve model performance, among which the fusion of high-level and low-level features proved to be effective [19]. The traditional feature restoration method is a simple fusion of high-level features and low-level features, does not focus on edge features and is committed to the overall image segmentation, so it cannot accurately segment the river in the complex background, and consequently the small tributaries cannot be identified. In this work, a new water segmentation model, called a multi-scale feature aggregation network, is proposed to solve these issues. This network extracts features from remote sensing images by down-sampling, then extracts and optimizes advanced features, and finally generates segmentation results by up-sampling. In terms of deep feature extraction, 3 × 3 , 5 × 5 , and 7 × 7 convolutions are used to form a pyramid to integrate information at different scales, which can accurately integrate contextual information at adjacent scales. To evade the loss of global and channel semantic information, the attention mechanism and 1 × 3 , 3 × 1 convolution are used to locate the global information and spatial information, and solve the problem of identifying the small tributaries of the river. In the upsample part, two modules are used. Firstly, to provide richer semantic information to the up-sampling module, the features fused by the fusion module at different scales are provided to the up-sampling module. In the upsample module, the high-level features obtain long-term dependence through the attention module to compensate for the information loss in the downsample process, and this can reduce the interference of the complex background on the recognition task, and then multiply the features obtained by the fusion module and gradually upsample. The module deeply excavates image information at different scales, and uses high-level features to guide low-level features to better restore high-definition images. This paper makes four contributions:
1
A Deep Feature Extraction module is proposed. In the last stage of down-sampling, context adjacent scales are integrated, and global and location information is extracted, so as to obtain more effective information and optimize context learning.
2
A multi-branch aggregation network is proposed to enhance the communication abilities of the two channels through different-scale guidances. By capturing different scale feature representations, it can enhance the interconnection and merge the two types of element representations, which can provide more detailed information for image restoration.
3
A Feature Fusion Upsample module is proposed to optimize the high-level features, enhance the pixel information and spatial position at the edge of the background, use the long-term dependence, eliminate useless information, guide the low-level features, obtain new features, and then guide the new features with the original high-level features.
4
A high-resolution, remote-sensing image segmentation network is proposed, which uses the feature extraction network and three additional modules for segmentation tasks.
The rest of this article is organized as follows. In the Section 2, we introduce the original intention of the model and a brief introduction. In the Section 3, we introduce the main structure of the model, including backbone, Deep Feature Extraction module (DFE), multi-branch aggregation module (MBA) and Feature Fusion Upsample module (FFU). In the Section 4, we introduce the details of the experiment, including the collection of datasets, the setting of hyperparameters, ablation experiments, the comparative analysis of different models, and the generalization performance analysis of the models. Finally, the model of this article is summarized, and future research directions are proposed.

2. Method

After the continuous development of deep convolutional network, its application in the field of computer vision has achieved remarkable results. However, due to the complexity and diversity of the background, rich details and spatial information, many traditional networks cannot achieve accurate water area segmentation. To more accurately recover the segmented images, it is essential to effectively use contextual information to optimize information. However, the simple information combination of traditional models cannot fulfill the detection demands of small tributaries and edges in waters. In response to the above problems, a new water area segmentation model was proposed to solve these difficulties. The backbone network of this model is ResNet [20]. The overall composition of the network is shown in Figure 1, which, respectively, consisted of the backbone network, the Deep Feature Extraction (DFE) module, the multi-branch aggregation (MBA) module and the Feature Fusion Upsample (FFU) module.
Next, the structure of the multi-scale feature aggregation network will be explained in detail, and then the three modules, DFE, MBA and FFU, will be disassembled for analysis.

3. Network Structure
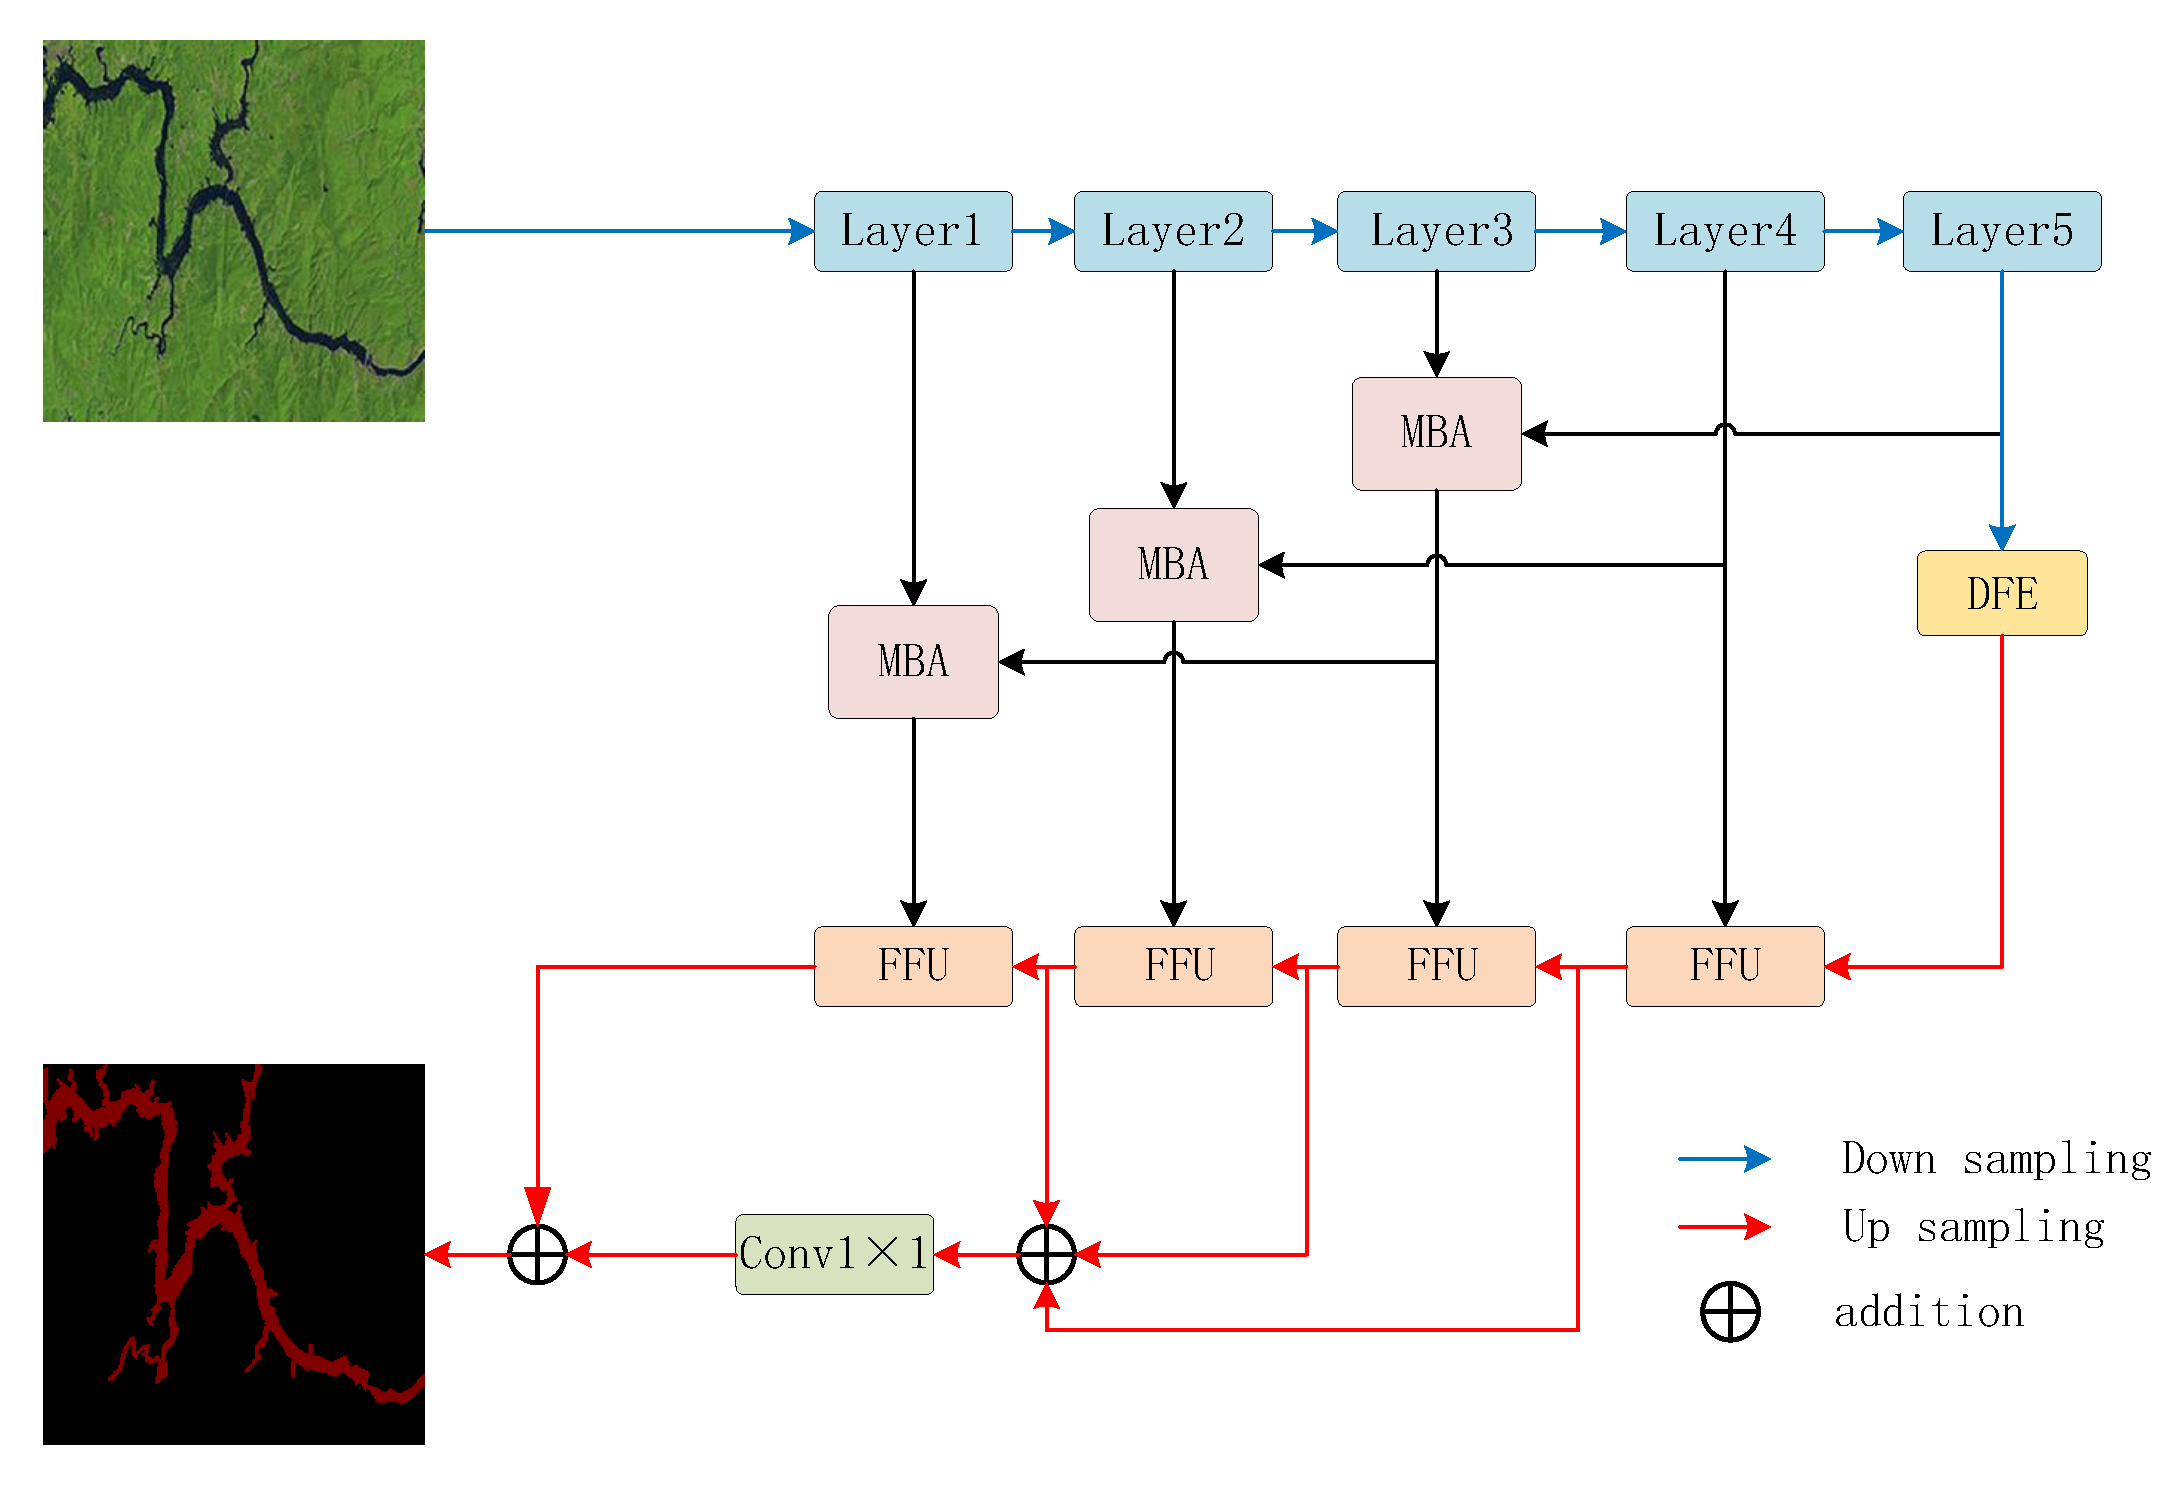
A new type of semantic segmentation network is proposed in this work, which can lessen the interference of the water segmentation background and achieve the fine segmentation of small tributaries. Figure 1 shows the specific structure of the network. In the process of model building, the backbone network used for information extraction is ResNet, and this paper proposes a DFE module, whose function is to capture multi-scale contextual information and extract accurate dense features at the end of the downsampling. Secondly, MBA module is proposed, which can enhance the communication ability of two channels through different scale guidance. By capturing different scale feature representations, it can enhance the interconnection and fusion of two types of feature representations, to provide more useful features for the up-sampling process. Finally, in the decoding stage, this paper proposes a module that continuously integrates features of different scales, and obtains rich features through mutual fusion and guidance. The low-level features provide more accurate spatial positioning; meanwhile, the high-level features enhance the long-term dependence of information and provide more accurate category consistency judgments. The recovery of low-level features relies on the continuous guidance and optimization of high-level features to make up for the serious loss of low-level feature information; the image undergoes four up-sampling modules to gradually fuse the feature information, and continuously restore the detailed information of the image, which greatly heightens the performance of the model.

3.1. Backblone

The selection of the backbone network is very important in the segmentation task. The appropriate backbone network can better extract the feature information of the image to achieve fine segmentation. Typical convolutional neural networks include DenseNet [21], VGGNet [22], MobileNet [23], ResNet, Inception [24] and ShuffleNet [25]. In the water segmentation process, it is extremely important to extract the high-precision feature information of the image. To solve the gradient disappearance caused by too many convolutional layers, the error propagates backward, so this paper uses ResNet as the backbone to extract different levels of deep semantic features. The mathematical expression of the residual unit is as follows:
x l + 1 = W l + 1 σ ( W l x l ) + x l ,
where x l is the input vector of the l th residual unit; x l + 1 represent the output vector of the ( l + 1 ) th residual unit; the function σ ( · ) represents ReLu function, W l and W l + 1 represent weight matrices; the specific residual structure is shown in Figure 2.
ResNet50 extracts detailed information of different scales through continuous downsampling, and finally obtains the output feature map of 1/32 of the input image. The specific parameters are shown in Table 1.

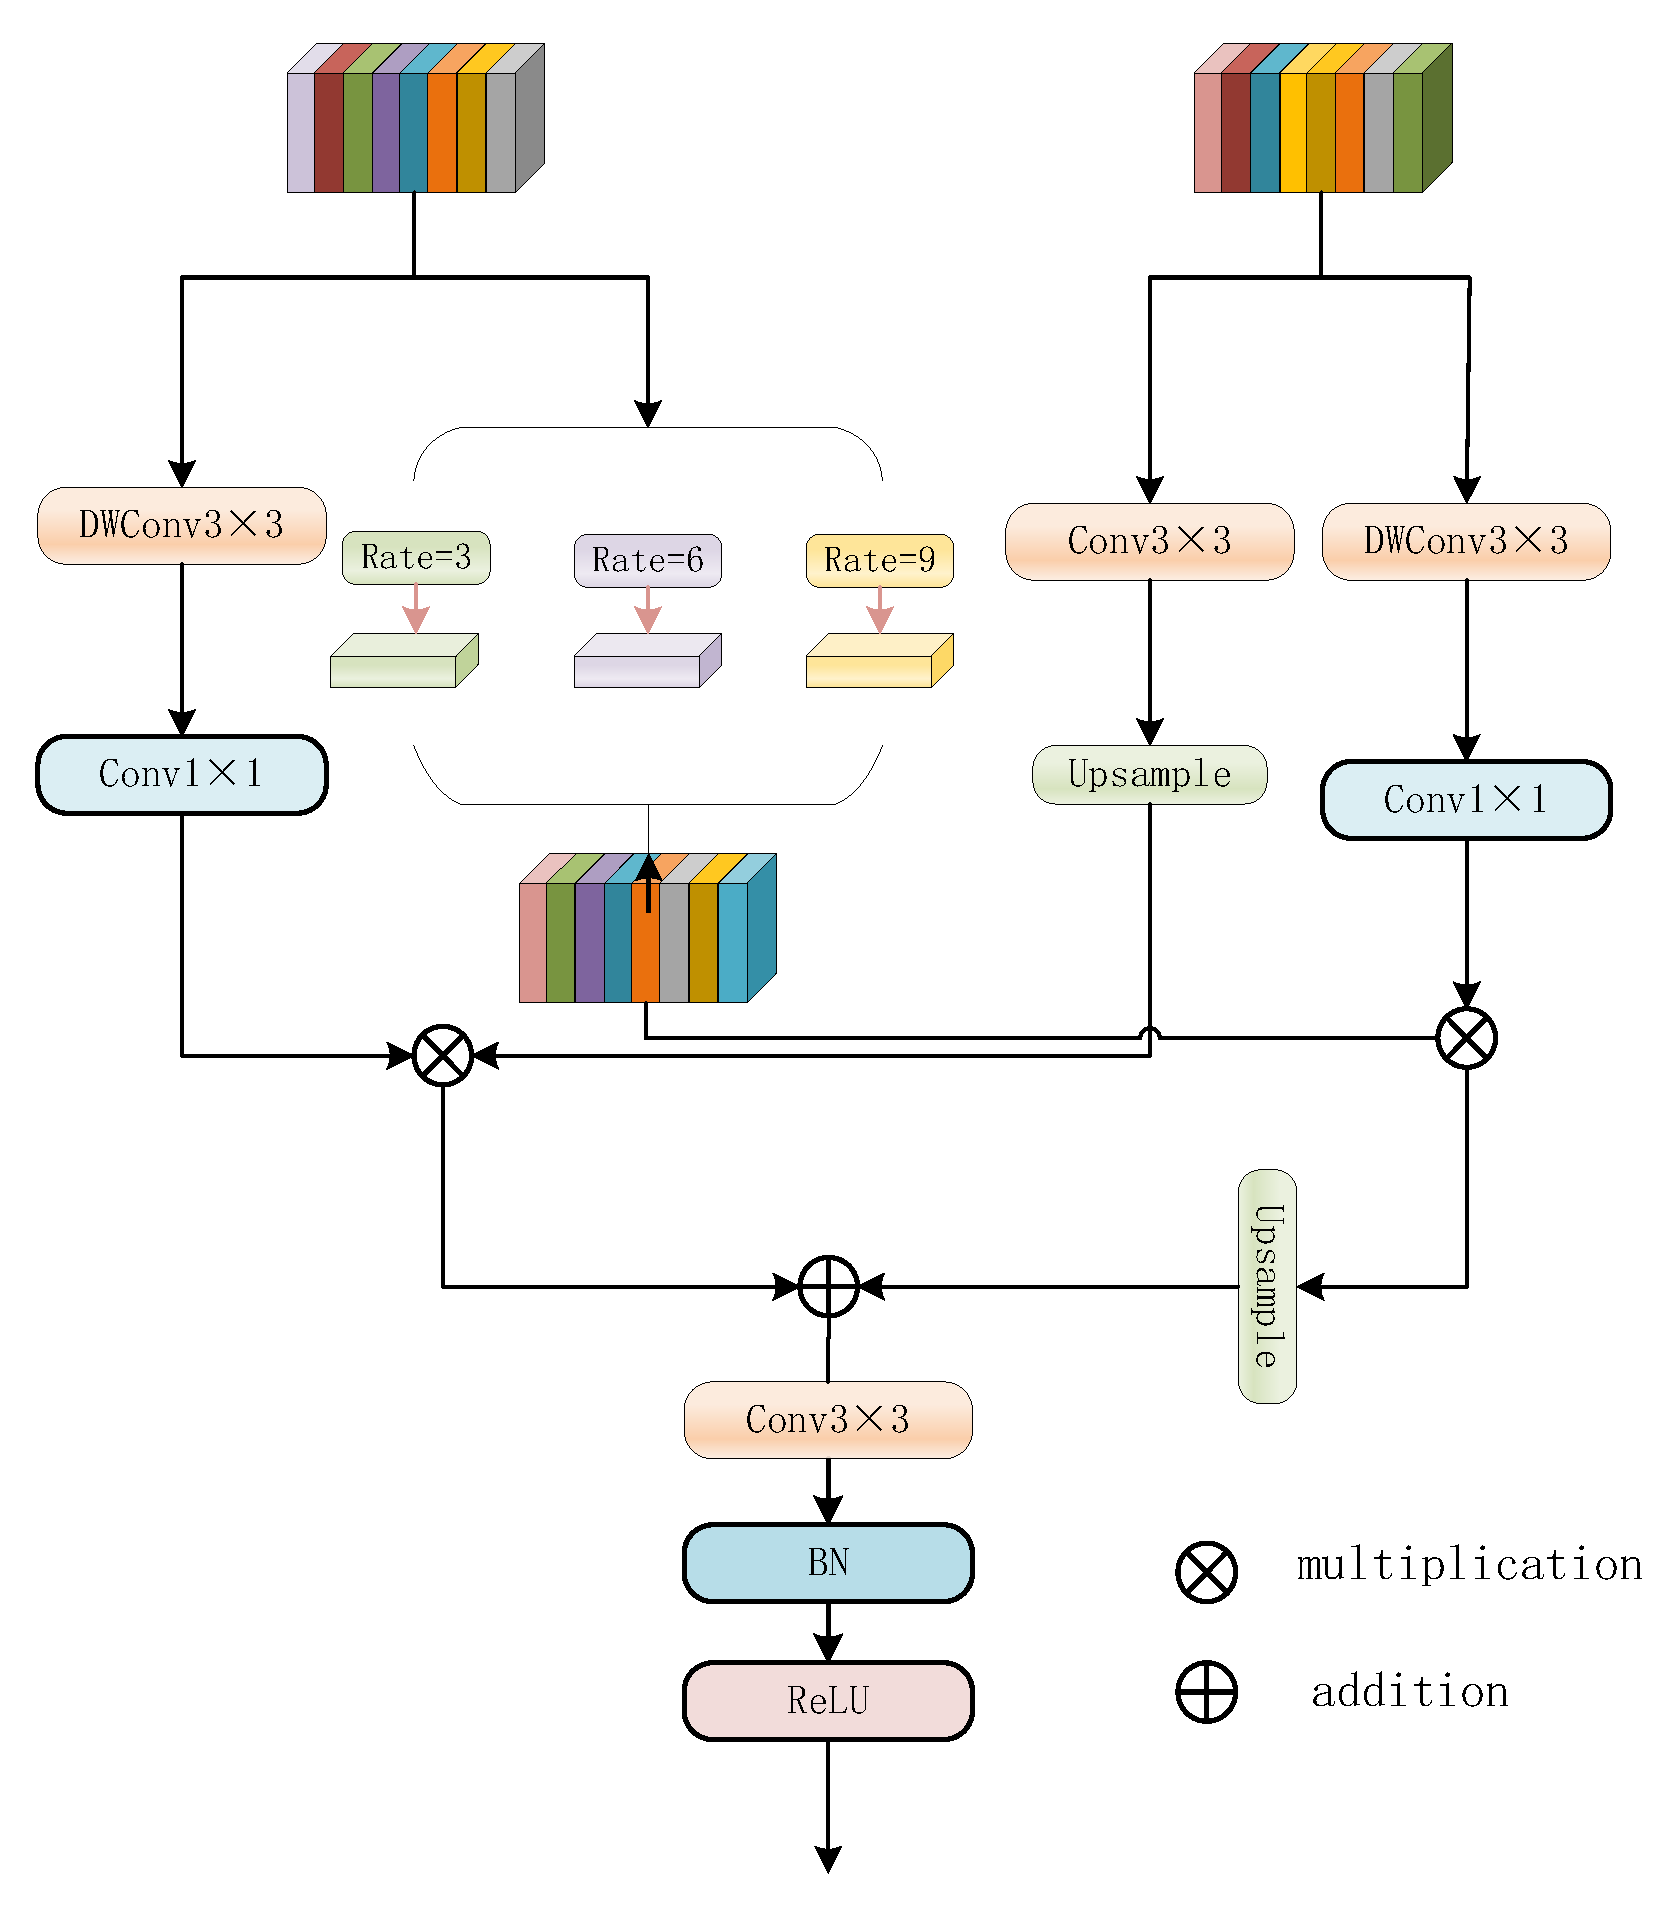
3.2. Deep Feature Extraction Module

In the water body segmentation task in the actual environment, it is very difficult to identify the small tributaries, especially in the complex background. Therefore, to better perform the recognition task, this work proposes a deep feature extraction module that can perform deep mining of deep features. It can obtain features of different scales, and focus on edge information on the basis of ensuring global information, which is essential for optimizing the accuracy of segmentation boundaries. Besides, the simple acquisition and stacking of different scales will lose pixel information location. In order to achieve more fine-edge segmentation, the dependence between features can not be ignored [26]. This paper used attention to strengthen the interdependence between feature information. Therefore, this paper designs a depth feature extraction module, which is divided into three branches. One branch is a pyramid structure composed of the convolution of different scales, which is used to mine different scales and deep features, and the other branch is composed of a designed attention mechanism. It can strengthen the selection of features, use positional attention and spatial attention to capture useful information, weaken useless information, and enhance the effectiveness of information. The last branch consists of 1 × 3 and 3 × 1 strip convolutions. As there are many small branches in the water area and it is difficult to identify, the strip convolution in this paper can improve the edge detection effect, and the combination of the whole module is essential for the algorithm. Figure 3 shows its specific composition.
In the module design, we obtain information of different scales, avoiding loss of information as much as possible, and use the convolution of 3 × 3 , 5 × 5 and 7 × 7 in the pyramid structure; because the size of deep features is small, we can use the larger convolution kernel without causing too much calculation loss. Using the pyramid structure to integrate the features of three different scales can more accurately integrate the information of different scales, reduce the influence of complex backgrounds on tributary segmentation, and more accurately locate the river. However, although the receptive field will increase with the expansion of the convolution kernel, the actual receptive field cannot reach the theoretical level, which is not enough to capture the global and channel semantic information. Therefore, the attention module is used to multiply the feature graph, combined with different scales to weigh the weight. The attention mechanism [27,28] has been shown to be helpful in numerous deep-learning-related tasks, such as image classification [29], image change detection [30], image segmentation [31,32]. This is an attention model that simulates the human brain. When we look at the environment, although we focus on the whole picture, when we look deeply, our eyes will only focus on a small part, that is, our attention to the whole picture is weighted. The attention mechanism works just like this. The commonly used attention model structures include the SE module [33], CBAM module [34] and SK module [35]. Their main working principle is to learn feature weights through loss calculation, filter and manipulate information, and enhance the connection of information by scaling channel information. This article uses this to capture cross-channel information, as well as direction perception and location perception information, which can help the model more accurately locate and identify the target of interest to achieve fine segmentation of the river. The attention part encodes the channel relationship and long-range dependence relationship through accurate position information. For input X, first use the pooling kernel of size ( H , 1 ) and ( 1 , W ) to encode along the horizontal coordinate and numerical coordinate direction. Finally, the output with channel height h and width w is:
z c h = 1 W 0 i W x c ( h , i ) ,
z c w = 1 H 0 i W x c ( j , w ) ,
where w is the width, j is the jth position pixel of the cth channel with width w, h is the height, i is the ith position pixel of the cth channel with height h and c is the cth channel. After these two transformations, the attention module captures the long-range dependence of the two spaces while ensuring accurate position information, and then cascades the two feature maps using shared 1 × 1 convolution. The feature map f containing the direction information of these two spaces can be obtained by transformation.
f = σ ( F ( [ z h , z w ] ) ) ,
where σ is the non-linear activation function, h is the height, w is the height. Divided f into two separate tensors f h R C / r × H and f w R C / r × W along the spatial dimension, r represents the lower sampling ratio, and then f h and f w are transformed to the same channel number as the input through two 1 × 1 convolved with F h and F w , thus obtaining:
g h = σ ( F h ( f h ) ) ,
g w = σ ( F w ( f w ) ) .
Then, the weight of attention is determined by g h and g w , and finally output:
g c ( i , j ) = x c ( i , j ) × g v h ( i ) × g c w ( j ) .
The obtained output is multiplied by the pyramid output to redistribute the weight, optimize information of different scales, remove redundant information and obtain spatial information. In addition, the spatial information extracted by 1 × 3 and 3 × 1 convolution from the input is added to the reconstructed feature map for further detail optimization. The experiment shows that this module has a important impact on the location and acquisition of small tributaries.

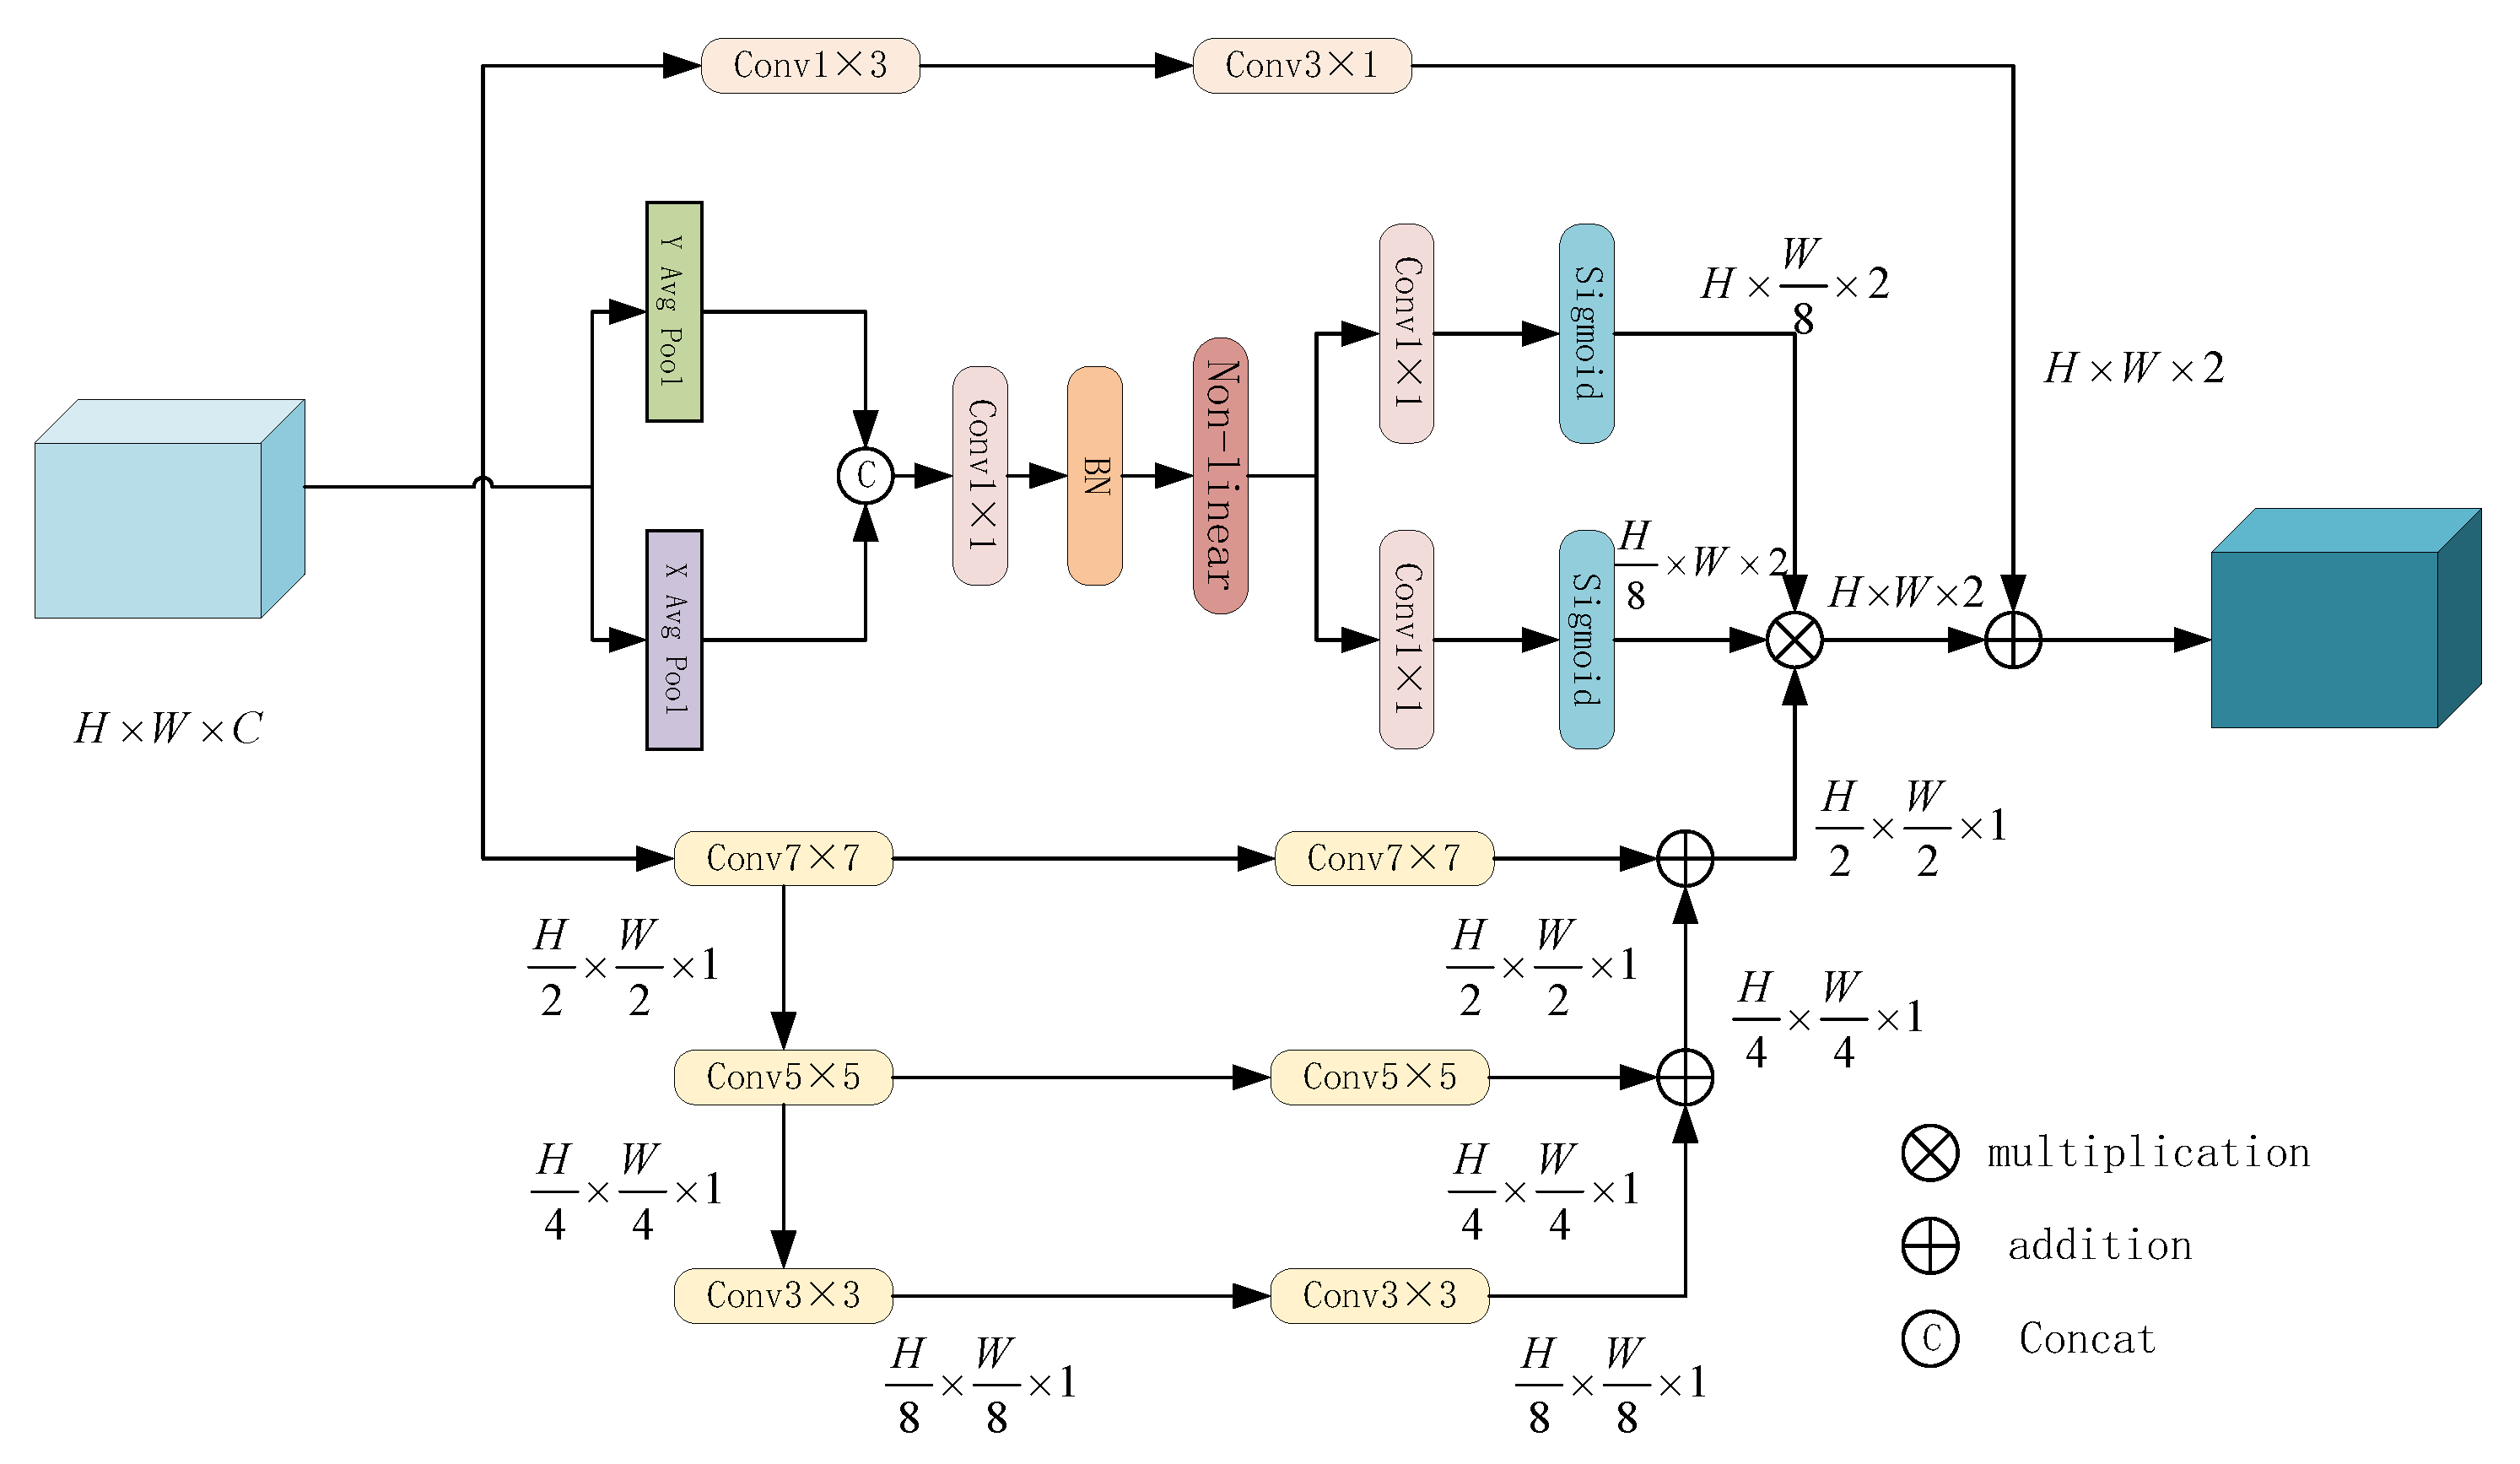
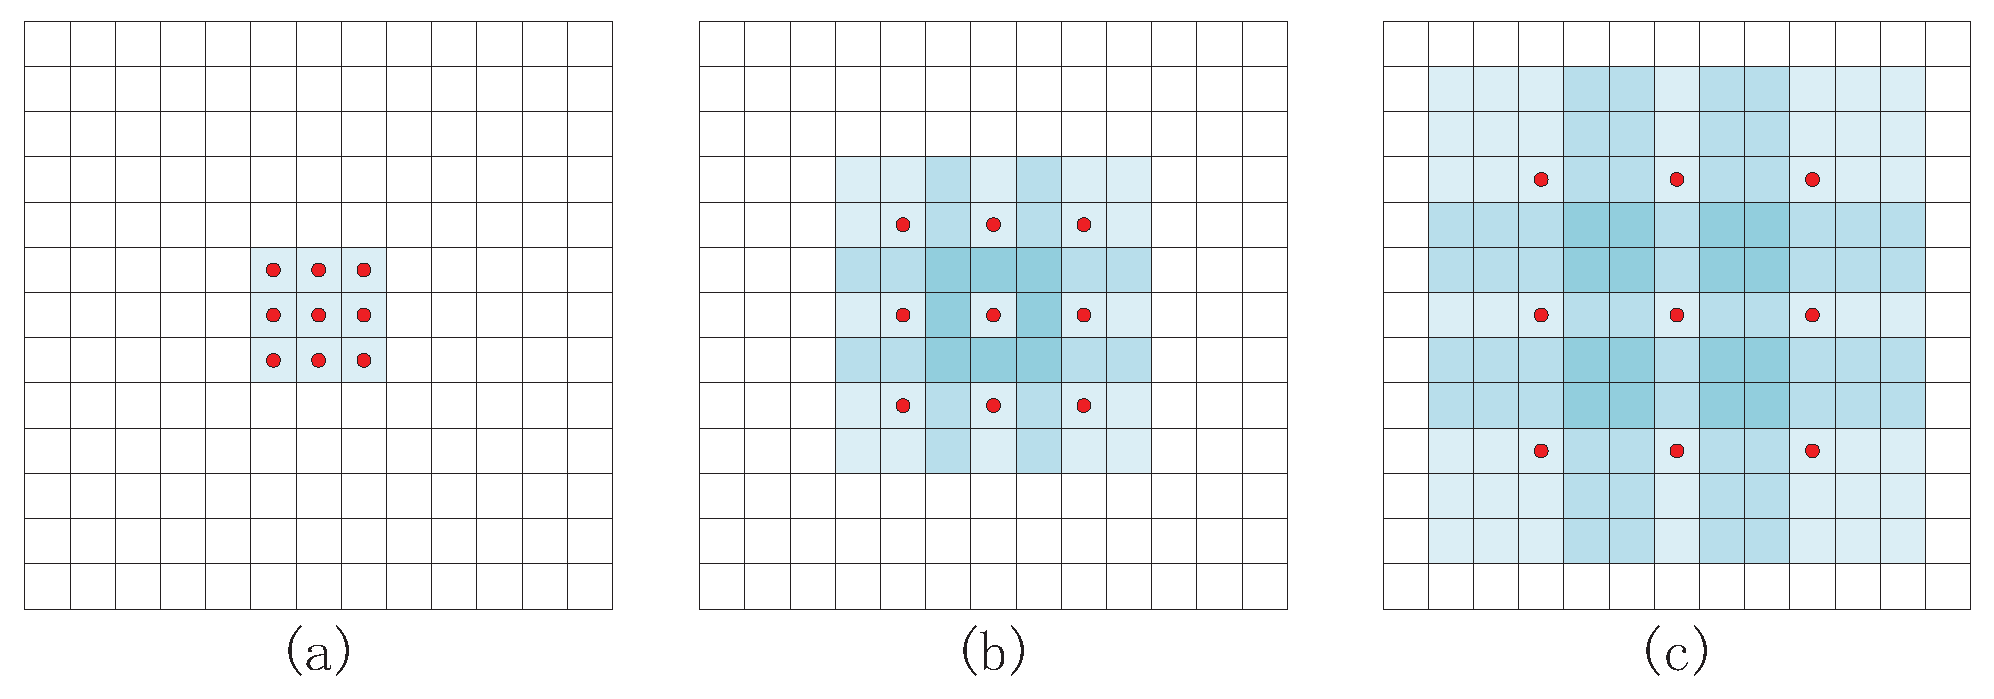
3.3. Multi-Branch Aggregation Module

To meet the small segmentation requirements of complex background tributaries in the water area segmentation task, a variety of feature information needs to be fused, so multiple channels need to be fused for operation. However, simply combining the two different scales will result in a loss in the diversity of the two kinds of information. Therefore, this paper designed a multi-branch aggregation module to enhance the communication abilities of the two channels through different scale guidance. By capturing different scale features, it is possible to enhance the interconnection and merge the two types of feature representation.
In terms of computational loss reduction, the depth-separable convolution is used in the first stage of two-branch feature extraction. This operation cannot only reduce the parameters more than the ordinary convolution, it can also change the traditional way of considering the channel and region at the same time. In another branch of low-level features, a hole convolution pyramid is used to obtain information. The use of hole convolution in the field of image segmentation improves the overall accuracy of the model [36]. Hole convolution can greatly perceive the field, but no additional parameters are added. By increasing the receptive field to enhance the context information, the accuracy of the segmentation boundary can be improved. The size of the convolution expansion in the hole convolution is represented by the dilation factor, and the expanded convolution kernel has a larger receptive field. Deprived of information loss due to pooling, as the sensing field of the convolution core expands, the output of each convolution can contain as much information as possible. As shown in Figure 4, the three figures represent the receptive field of the hole convolution with different expansion coefficients. When the expansion coefficient is 3, the overall receptive field is 121, and the effect is the same as when using an 11 × 11 convolution kernel. From this, we can conclude that the receptive field increases significantly with the increase in the expansion coefficient under the condition that the parameters remain unchanged. The expression of the receptive field changing with the expansion factor is as follows:
R d = ( 4 × d 1 ) 2 ,
where d represents the expansion factor, and R d represents the receptive field under the d expansion factor.
In this work, we use dilated convolutions with expansion rates of 3, 6, and 7 to extract multi-scale contextual information from a multi-branch aggregation network, which greatly reduces the loss of text information. The specific structure is shown in Figure 5. Experiments show that the detection effect of small tributaries was significantly improved after the information optimization of this module.

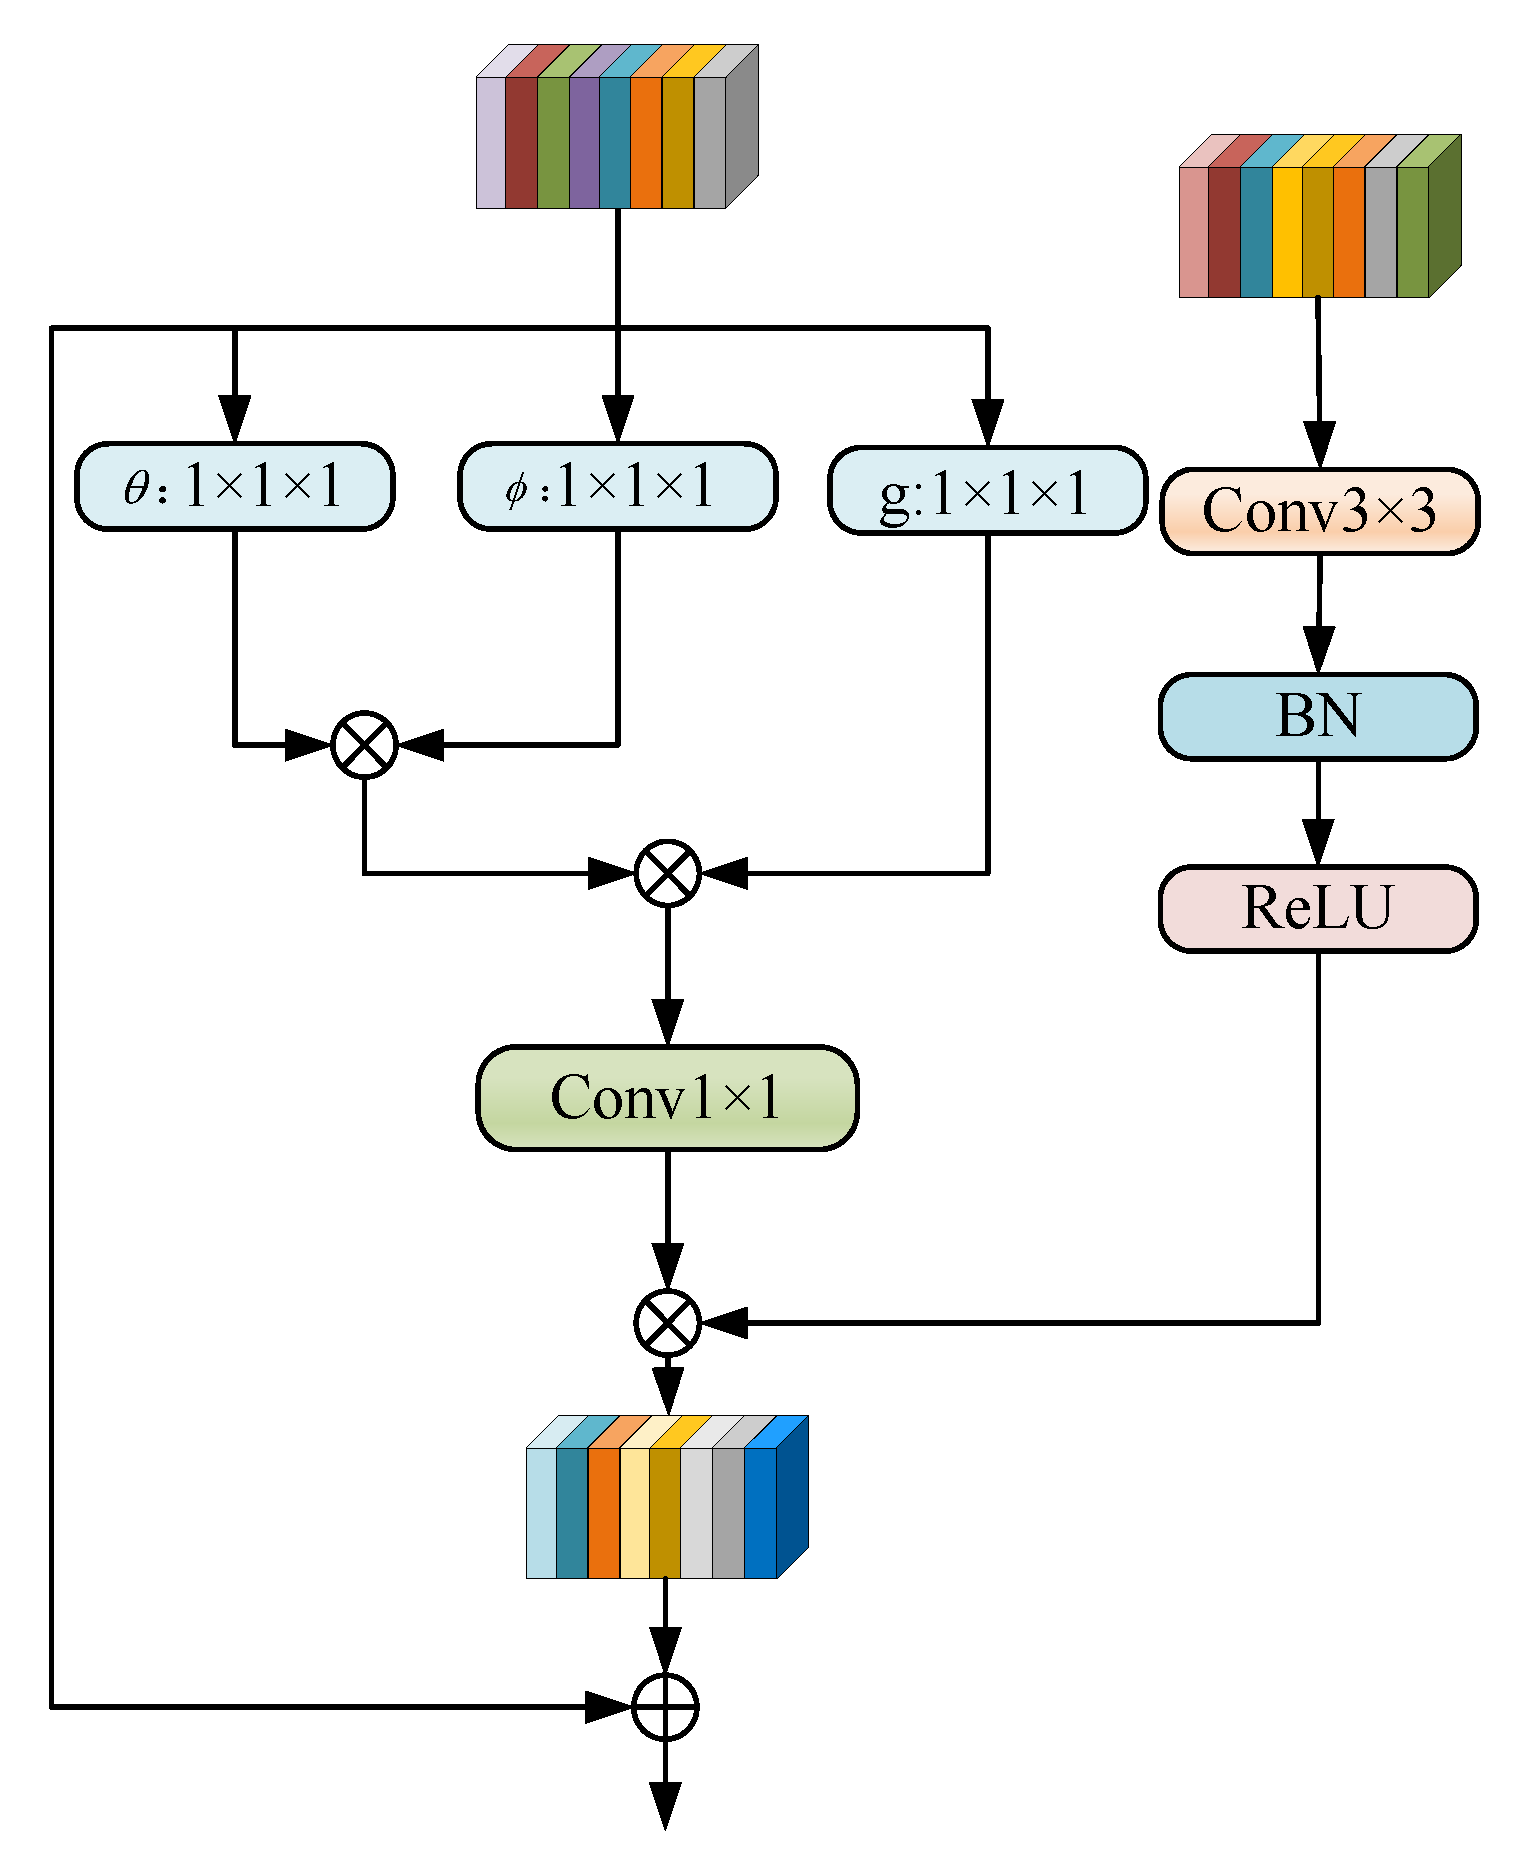
3.4. Feature Fusion Upsample Module

In this paper, an encoding and decoding network is proposed. Four upsample modules are used to complete up-sampling feature fusion and recovery step by step. The Feature Fusion Upsample model mainly guides low-level features twice through high-level features, and provides them with high-level semantic features to obtain the latest semantic features. It has a high effect for the detection of river tributaries in complex background, and an effective role in the location of small tributaries.
The up-sampling process is essential to form a clear high-resolution image. A simple decoder is not enough to obtain a clear object boundary, and lacks feature information for different scales. This paper proposes an up-sampling module that can deeply mine and use contextual information. To obtain more accurate detailed features, rich, high-level features are used to provide weighted parameters for low-level features. In addition, in the low-level feature branch, not only is the semantic information of downsampling used, but the semantic information optimized by the multi-branch aggregation module proposed in this paper, which can provide more detailed characteristic information for the realization of small tributary segmentation. Figure 6 shows its overall structure.
The module first uses a convolution operation to change the number of channels of low-level features. In the deep feature operation stage, after the input is convolved with three 1 × 1 × 1 convolutions of W g , W θ and W ϕ , the number of channels is reduced by half, which reduces the burden of calculation, and then the size of the W θ and W ϕ outputs is changed, the output W θ is transposed and the output W ϕ is matrix-multiplied to calculate the similarity. The softmax operation is performed on the last dimension. This process is equivalent to position attention; it mainly finds the normalized correlation coefficient of each pixel in the characteristic image and other images in the picture. Finally, the value of the element in the ith row and jth column in the (N, N) matrix is the correlation between the pixel at position i and the pixel at position j in the figure, and then we perform the same operation on the thematrix with the (N, N) matrix and multiply it again. The output obtained in this way is the feature map considering the global information. Each position value of the output is the weighted average of all other positions. The softmax function operation can further highlight the commonality, and then adjust the output to be the same as the input through 1 × 1 convolution. This output is multiplied with low-level features, and finally high-level features and weighted low-level features are added and gradually upsampled. In terms of effect, this module enhances the pixel information and spatial position at the edge of the background, uses long-term dependencies, weakens or eliminates useless information, can identify small tributaries and smooth edge information, and can adapt to different widths and complex water segmentation tasks.

4. Experiment

4.1. Datasets

4.1.1. Water Segmentation Dataset

The data in this paper come from high-resolution remote sensing images selected from Landsat8 satellites and Google Earth (GE). Landsat8 carried Operational Land Imager (OLI) and Thermal Infrared Sensor (TIRS) into the sky on 11 February 2013. The OLI land imager has a total of 11 bands. True color synthesis is carried out through 4, 3 and 2 bands, and standard false-color synthesis for vegetation-related monitoring is carried out through 5, 4 and 3 bands. To make the model more suitable for application requirements and reduce the requirements of hardware conditions, most of the image acquisition equipment includes lack of sensors in other bands; as a result, the datasets produced in this paper are mainly natural true color images formed by the combination of 4, 3, and 2 bands. The satellite images of Ge were mainly provided by QuickBird commercial satellite and earthsat. GE global landscape images on the effective resolution of at least 100 m, usually in the form of 30 m, and ngle of elevation is about 15 km, but, for some places that need more precision, such as some scenic spots and buildings that require attention, it will provide a more accurate resolution, of about 1 m and 0.6 m accuracy, and the viewing angles are about 500 m and 350 m, respectively.
To enhance the authenticity of the data, we used a wide range of distribution, and in terms of river selection, we chose rivers with different widths and colors, and small, rugged rivers. Meanwhile, to ensure that the model can maintain a good performance in different scenarios, we use driver areas with a complex surrounding environment, including forests, cities, hills, and farmland. Some of the images that were collected by the river are shown in Figure 7. The average size of the Landsat8 satellite image was 10,000 × 10,000 pixels, and the Google Earth image was intercepted as 4800 × 2742 pixels, which was cut to 256 × 256 for model training. We obtained 12,840 training sets and 3480 test sets for the experiment.
A great deal of experimental data is essential for the training of neural networks, but the data acquisition process is more complicated. Therefore, when there are few training samples, the model is prone to overfitting, so we performed enhancement operations on the data [37]. Therefore, this paper enhances the data by translation, flipping and rotation.

4.1.2. Cloud and Cloud Shadow Dataset

The generalized dataset used in this paper is the cloud and cloud shadow dataset, which is collected from Google Earth (GE) and annotated manually. The dataset is composed of high-definition remote sensing images that were randomly collected by professional meteorological experts in Qinghai, Yunnan, Qinghai, Qinghai-Tibet Plateau and Yangtze River Delta. To fully test the processing capacity of the model in this task, we selected multiple groups of high-resolution cloud images with different shooting angles and heights, and ensured the diversity of the image background. We captured the background remote sensing images of water area, forest land, farmland, city and desert to ensure the richness of images. We cut the intercepted image with 4800 × 2742 pixels to the size of 224 × 224 . After screening, we obtained 1916 images, and then expanded the data through translation, flipping and rotation to obtain 9580 images, among which there were 7185 training sets and 2395 verification sets, as shown in Figure 8, which lists some examples of the datasets in this article.

4.1.3. LandCover Dataset

To further verify the performance of the model in the water domain segmentation task, we used the LandCover dataset [38]. This dataset includes images selected from aerial photos of 216.27 square kilometers of land in Poland (a Central European country). Four kinds of objects were manually labelled: building (red), woodland (green), water body (grey), and background (black), which is called ground truth. The dataset had 33 images with a resolution of 25 cm (about 9000 × 9500 px) and 8 images with a resolution of 50 cm (about 4200 × 4700 px). Due to the water area task, this article processed the dataset. We cropped the picture to a size of 256 × 256 , set the rest of the categories as the background, and retained the water as the segmentation category, water (red), background (black). Finally, the large-scale pictures with only background were eliminated, and 3666 training sets and 754 training sets were obtained. A part of the dataset is shown in Figure 9.

4.2. Implementation Details

All experiments in this article were performed on a computer equipped with GEFORCE RTX 3070 and Intel Core i5. The operating system used is Windows 10, and the basic framework is pytorch. In this paper, when the original remote sensing image was input, the output image of the current network was counted by forward propagation. The cross-entropy loss function was used to calculate the error between the output image and the label, and the obtained error was transmitted back to the network through the chain rule. The adaptive moment estimation (Adam) optimizer updated the network parameters in back propagation [39]. The Adam optimizer uses the exponential decay rate with a coefficient of 0.9 to control the weight distribution (momentum and current gradient), and used the exponential decay rate with a coefficient of 0.999 to control the effect of the square of the previous gradient. In addition, the Adam optimizer chose a high momentum of 0.99 and avoided the divisor from zero. For the selection of learning strategies, including “fixed” strategy, “stepping” strategy, “ploy” strategy, etc. Previous work [40] shows that the “ploy” strategy is a better method in the experiment. When training samples, the starting learning rate of the network model was 0.001, the number of samples selected for one training was 4, and the iteration was 300.

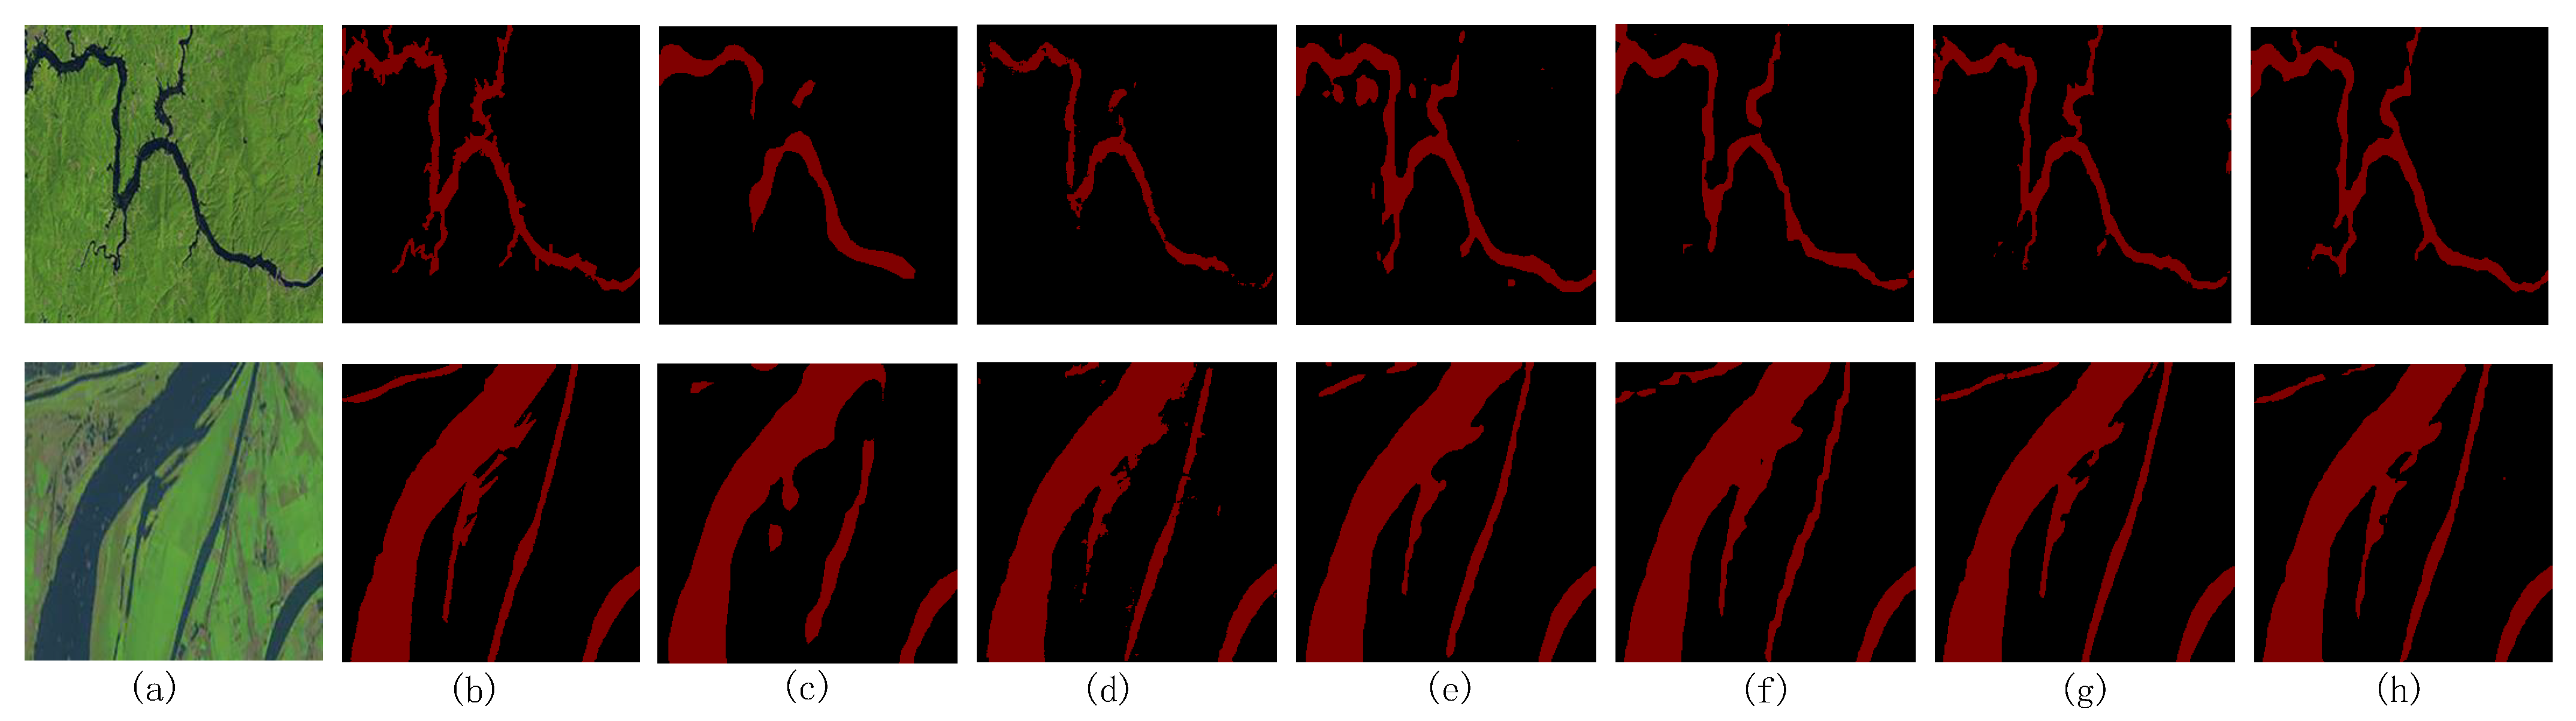
4.3. Ablation Experiment

In the ablation experiment, by deleting part of the network structure, the effect of each module on the overall model was tested. In the ablation experiment, the feature extraction network in this paper is ResNet. In this part, we used Mean Intersection over Union (mIOU) as the indicator of the evaluation model. When all the modules are combined, the performance of the structure can be fully brought into play. The specific parameters are shown in Table 2.
For the ablation of the up-sampling module, the up-sampling module uses high-level features to guide low-level features twice, firstly instructing the formation of new features, and then further instructing the formed features to obtain optimized feature information. This has a high effect on the detection of river tributaries against a complex background, and it an effective role in the location of small tributaries. From the results shown in Table 2, we know that through the feature fusion upsample module, the model performance mIOU increased from 90.94% to 94.57%.
Aiming to ablate the depth feature extraction module, to solve the loss of information that results from continuous downsampling, the deep features are better optimized, further capture multi-scale context information, and enhance the global and channel semantic information. The proposed depth feature extraction module can be used for information recovery and different scales of information acquisition. From the results shown in Table 2, the deep feature extraction module improves the overall performance mIOU by 0.44%.
For the ablation of the MBA module, we used the semantic information of two branches at different scales to aggregate, to obtain a richer feature map as a branch of upsampling, which can more effectively restore remote sensing images. From the results shown in Table 2, we can see that the performance of the deep feature extraction module proposed in this paper further improved the model mIOU by 0.93%.

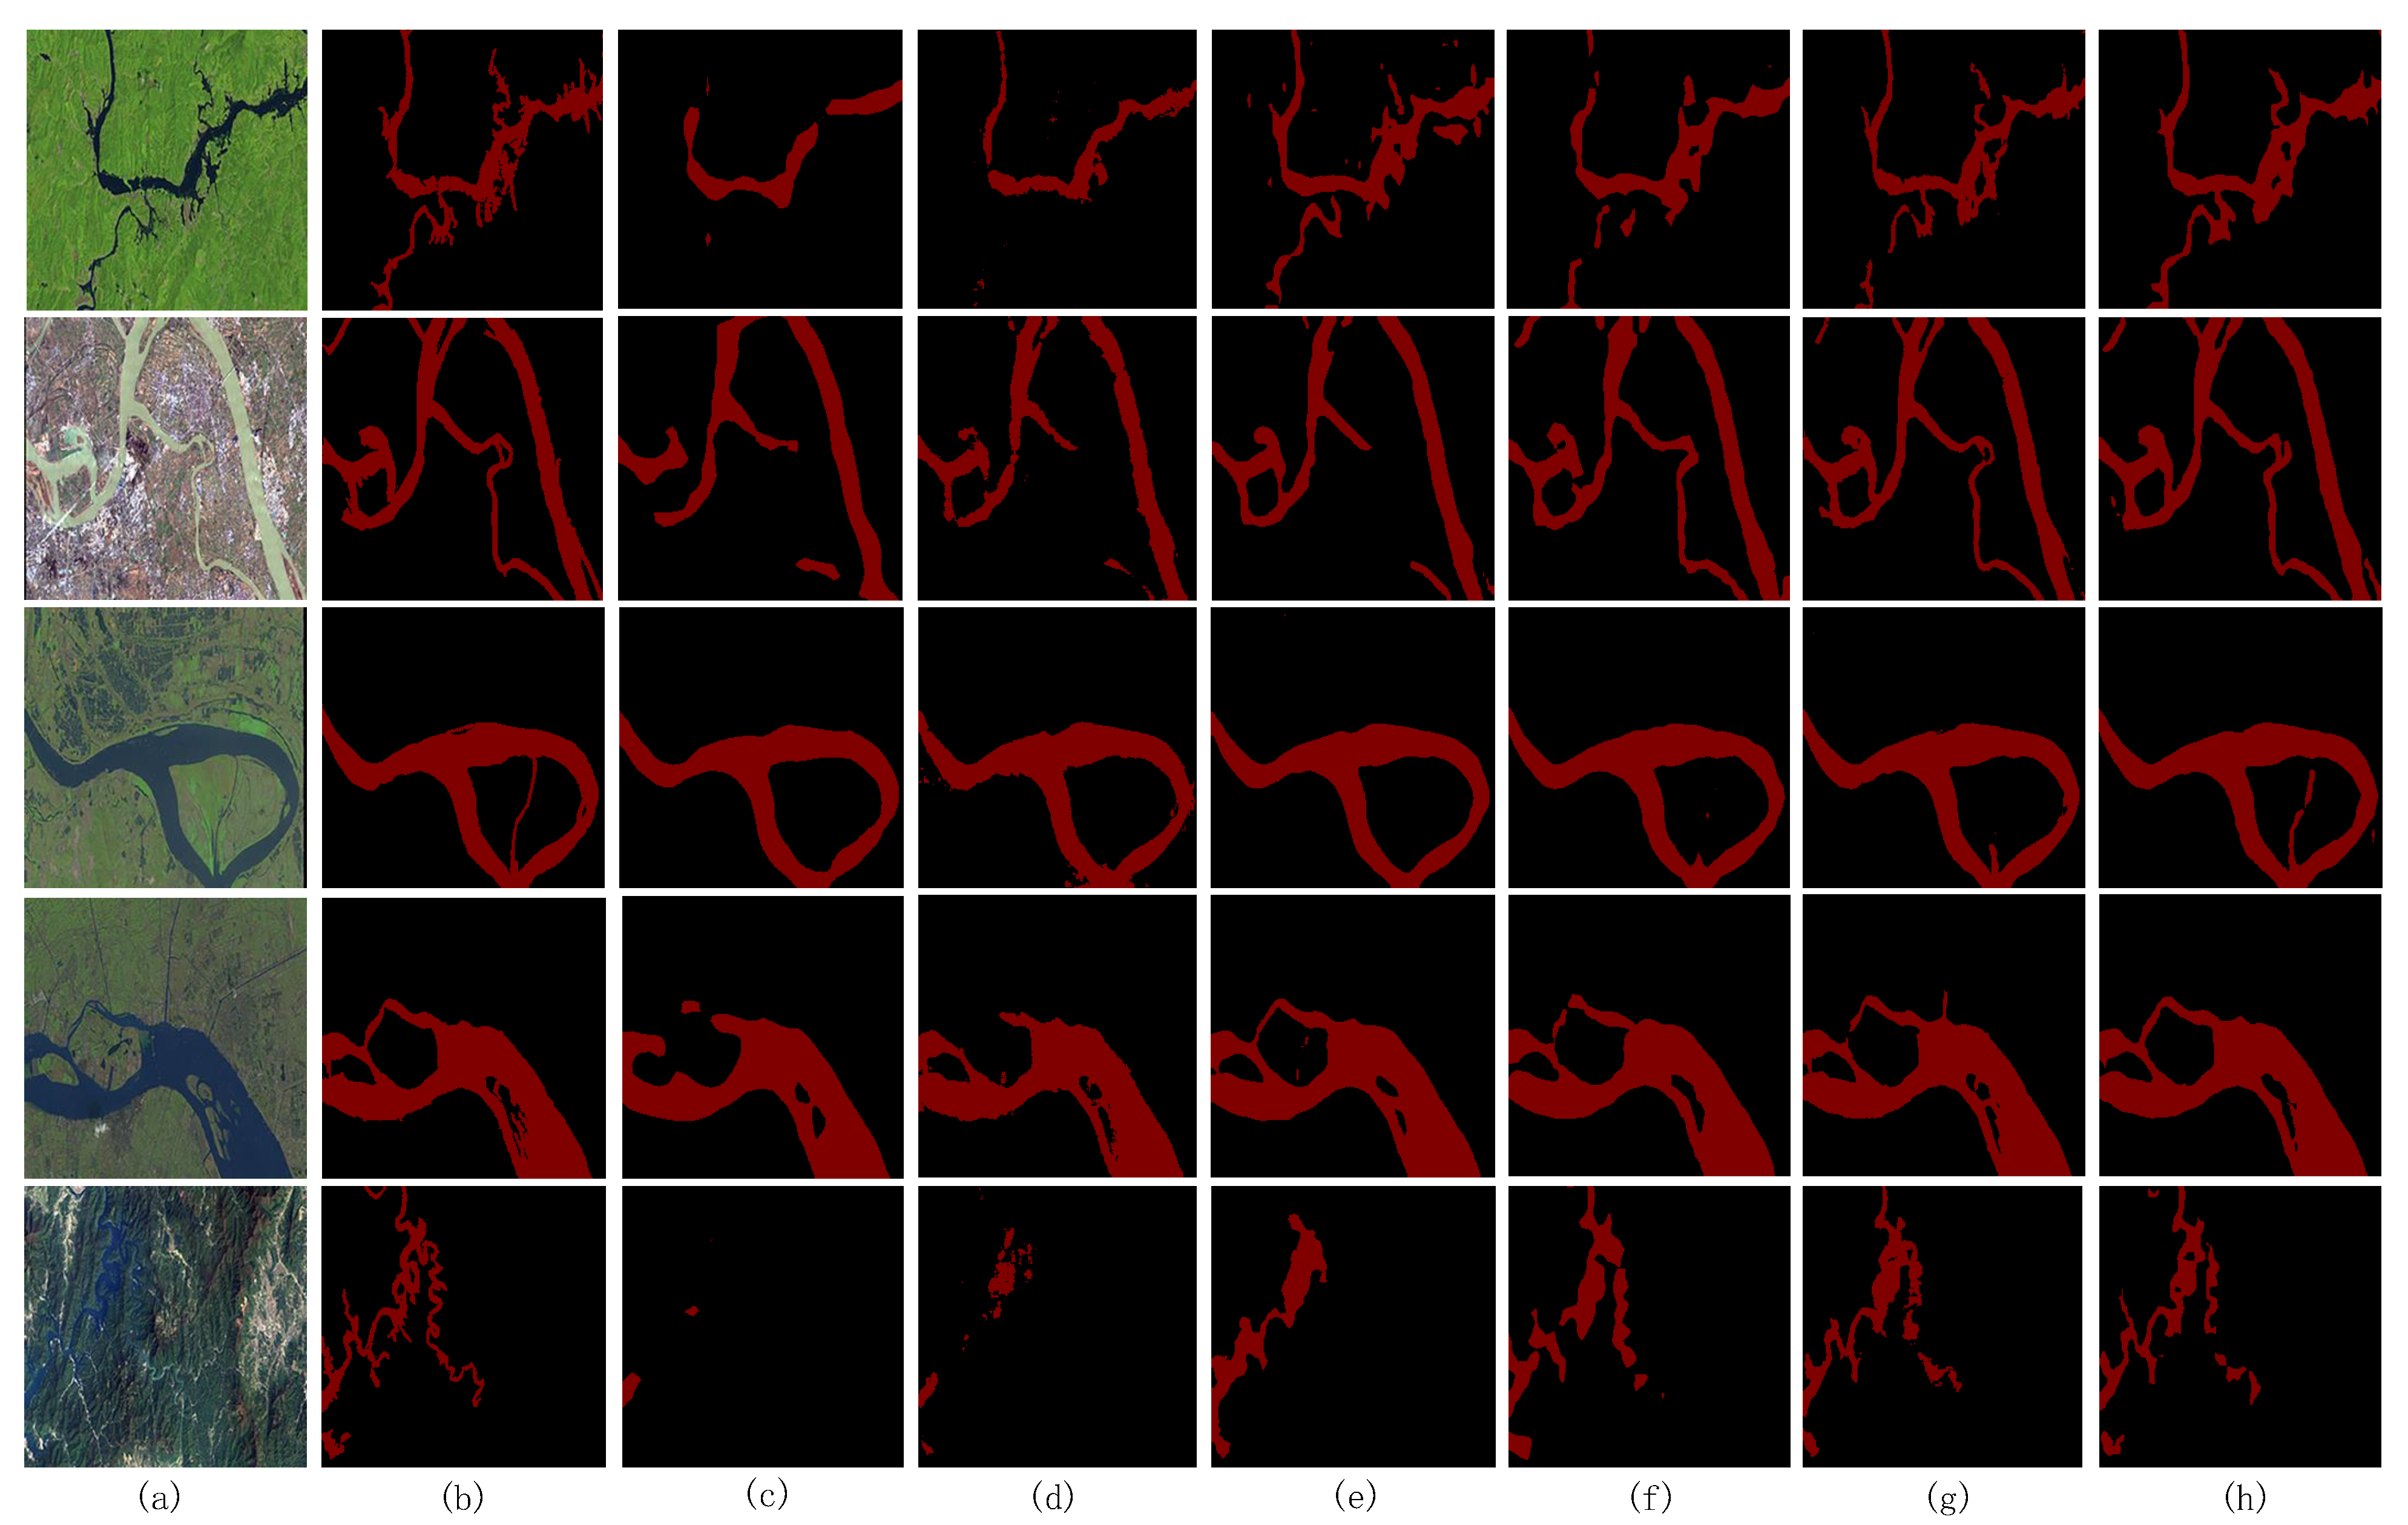
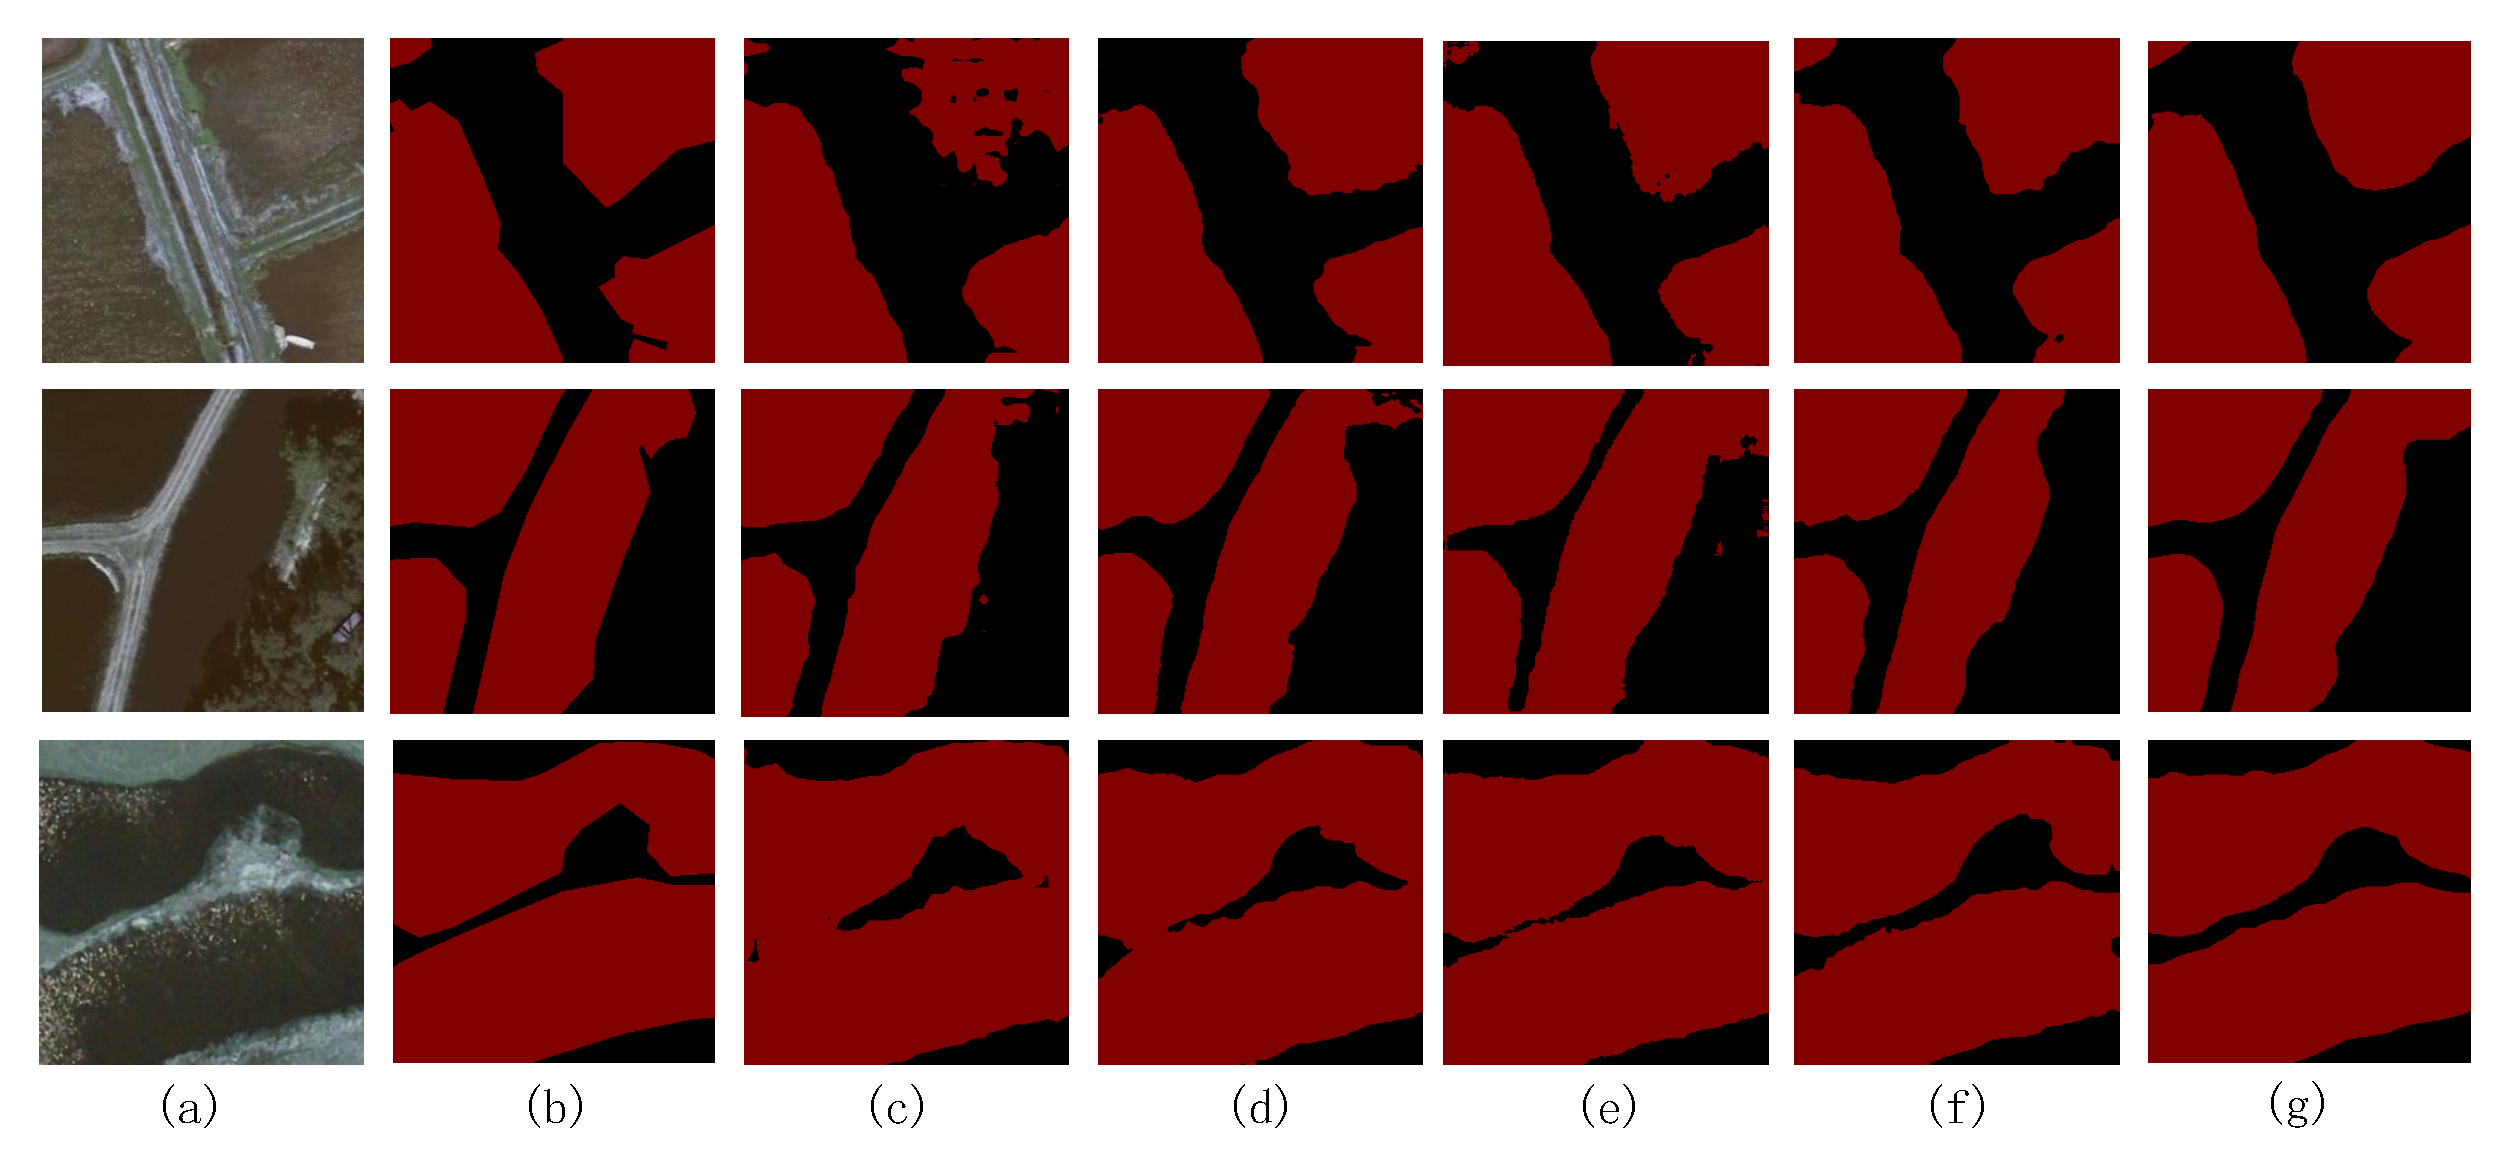
4.4. Comparative Experiment with Other Networks

In the comparative experiment, to fully test the performance of this model, we compared the existing semantic segmentation network with this method. This paper selects floating point operations (FLops), Training time (T), the harmonic average of P and R, F1, the mean pixel accuracy MPA, and the mean intersection over Union Miou as evaluation indicators to comprehensively test the performance of the model; the specific parameters are shown in Table 3.
As shown in Table 3, the comparison results of different methods under the same experimental environment revealed that, among the Flops and Training Time indicators, PANnet and DFNnet have smaller Flops, and PANnet and BiSeNet’s Training Time is small, but its accuracy is low. Compared with other models, our model still maintains a high performance and high accuracy, even with relatively low Flops and Training Time. In addition, it can be seen that our proposed algorithm performed better than the current excellent segmentation method in the other five indicators. In all networks, the performance of FCN8sAtOnce model is the worst according to these indicators. With the continuous improvements in the model, the indicators of other models have increased, but these indexes are still lower than in the model proposed in this work.
The data in Table 3 show that the method in this paper can achieve high-precision segmentation of water body datasets. Figure 10 shows the test results of the test images on different algorithms, where black represents the default background and red represents the water area. It can be found that FCN8sAtOnce and Segnet cannot identify the detailed information of the river, and the outline of the river is rough. Deeplabv3+ has improved the details, but there are false detections. PSPNet and UNnet can identify some tributaries, but still cannot meet the fine requirements. The deep feature extraction module is used to further obtain multi-scale semantic information, and enhance spatial and channel information, which is of great benefit to the improvement in model performance. The multi-branch aggregation module enhances the communication capabilities of the two channels through different guidance scales, and enhances the interconnection and fusion of the two types of element representations, which can capture richer semantic information for upsampling. The FFU module restores the position of each pixel through high-level features and guides the recovery of low-level features, which is very important for similar object recognition and recognition in complex backgrounds. By effectively detecting the waters, this method can solve the problem wherein small waters cannot be detected with complex backgrounds and cannot be accurately identified. It performs well in different scenarios, thereby achieving better detection results.
We compared the segmentation effects of different methods on small water images, and the specific effects are shown in Figure 11. This article selects five examples to show the effect of segmentation. It can be observed that the method proposed in this article is more accurate in the segmentation of waters, especially in the segmentation of small tributaries. Compared with other depth models, the segmentation effect of FCN8Satonce and Segnet models is relatively rough, with incomplete edge information acquisition and an excessive loss of information in the feature extraction stage. As can be seen from Figure 11, these two models have poor segmentation effect on tributaries, failing to identify small streams, and relatively rough edges. Deeplabv3+ has slightly improved this effect, and its edge processing is more delicate, but the recognition of small tributaries still cannot be accurately achieved. Compared with the above models, PSPNet can segment the outline of the water body, but when there are many river branches and the river channel is complicated, PSPNet cannot completely segment the first group of river channels and small branches. UNnet is a classic two-classification network. It further improves the segmentation effect of the image. It obtains a smoother segmentation edge, but the processing of details still needs to be improved. For each group of graphics, there are cases of missed detection, and a misjudgment occurred in the fourth group of image segmentation. The proposed model algorithm can accurately identify the river boundary, and still has a strong detection ability in the face of small tributaries. The experimental results show that the effect of the model proposed in this work is very superior, which fully proves the importance and effectiveness of the module.
In order to further confirm whether the segmentation effect of the model can be maintained in complex situations, as shown in Figure 12, we selected remote sensing images of water with a complex background that were difficult to distinguish for the model test. When faced with remote sensing images with a lot of complex background noise, the FCN8sAtOnce, Segnet and Deeplabv3+ models had very poor effects, and there was very serious missed detection. Compared with the first three effects, the segmentation effect of PSPNet was improved. It can detect the contours of some rivers, but its loss information was still too great: there were faults inside the river, and some small branches could not be identified. The edge information of the image segmented by UNet was relatively complete, but the recognition effect of the whole water area was not good. In the first group of images, the river segmentation was intermittent, information loss was increased, and the more hidden rivers could ot be identified. The above model adapted to the task of water segmentation in a difficult environment. The algorithm proposed in this paper, by optimizing the deep features, continuously upsampled the information that was obtained by the multi-branch aggregation module and the optimized information to restore high-definition remote sensing images, and could handle the task of water segmentation in different situations and scenes.

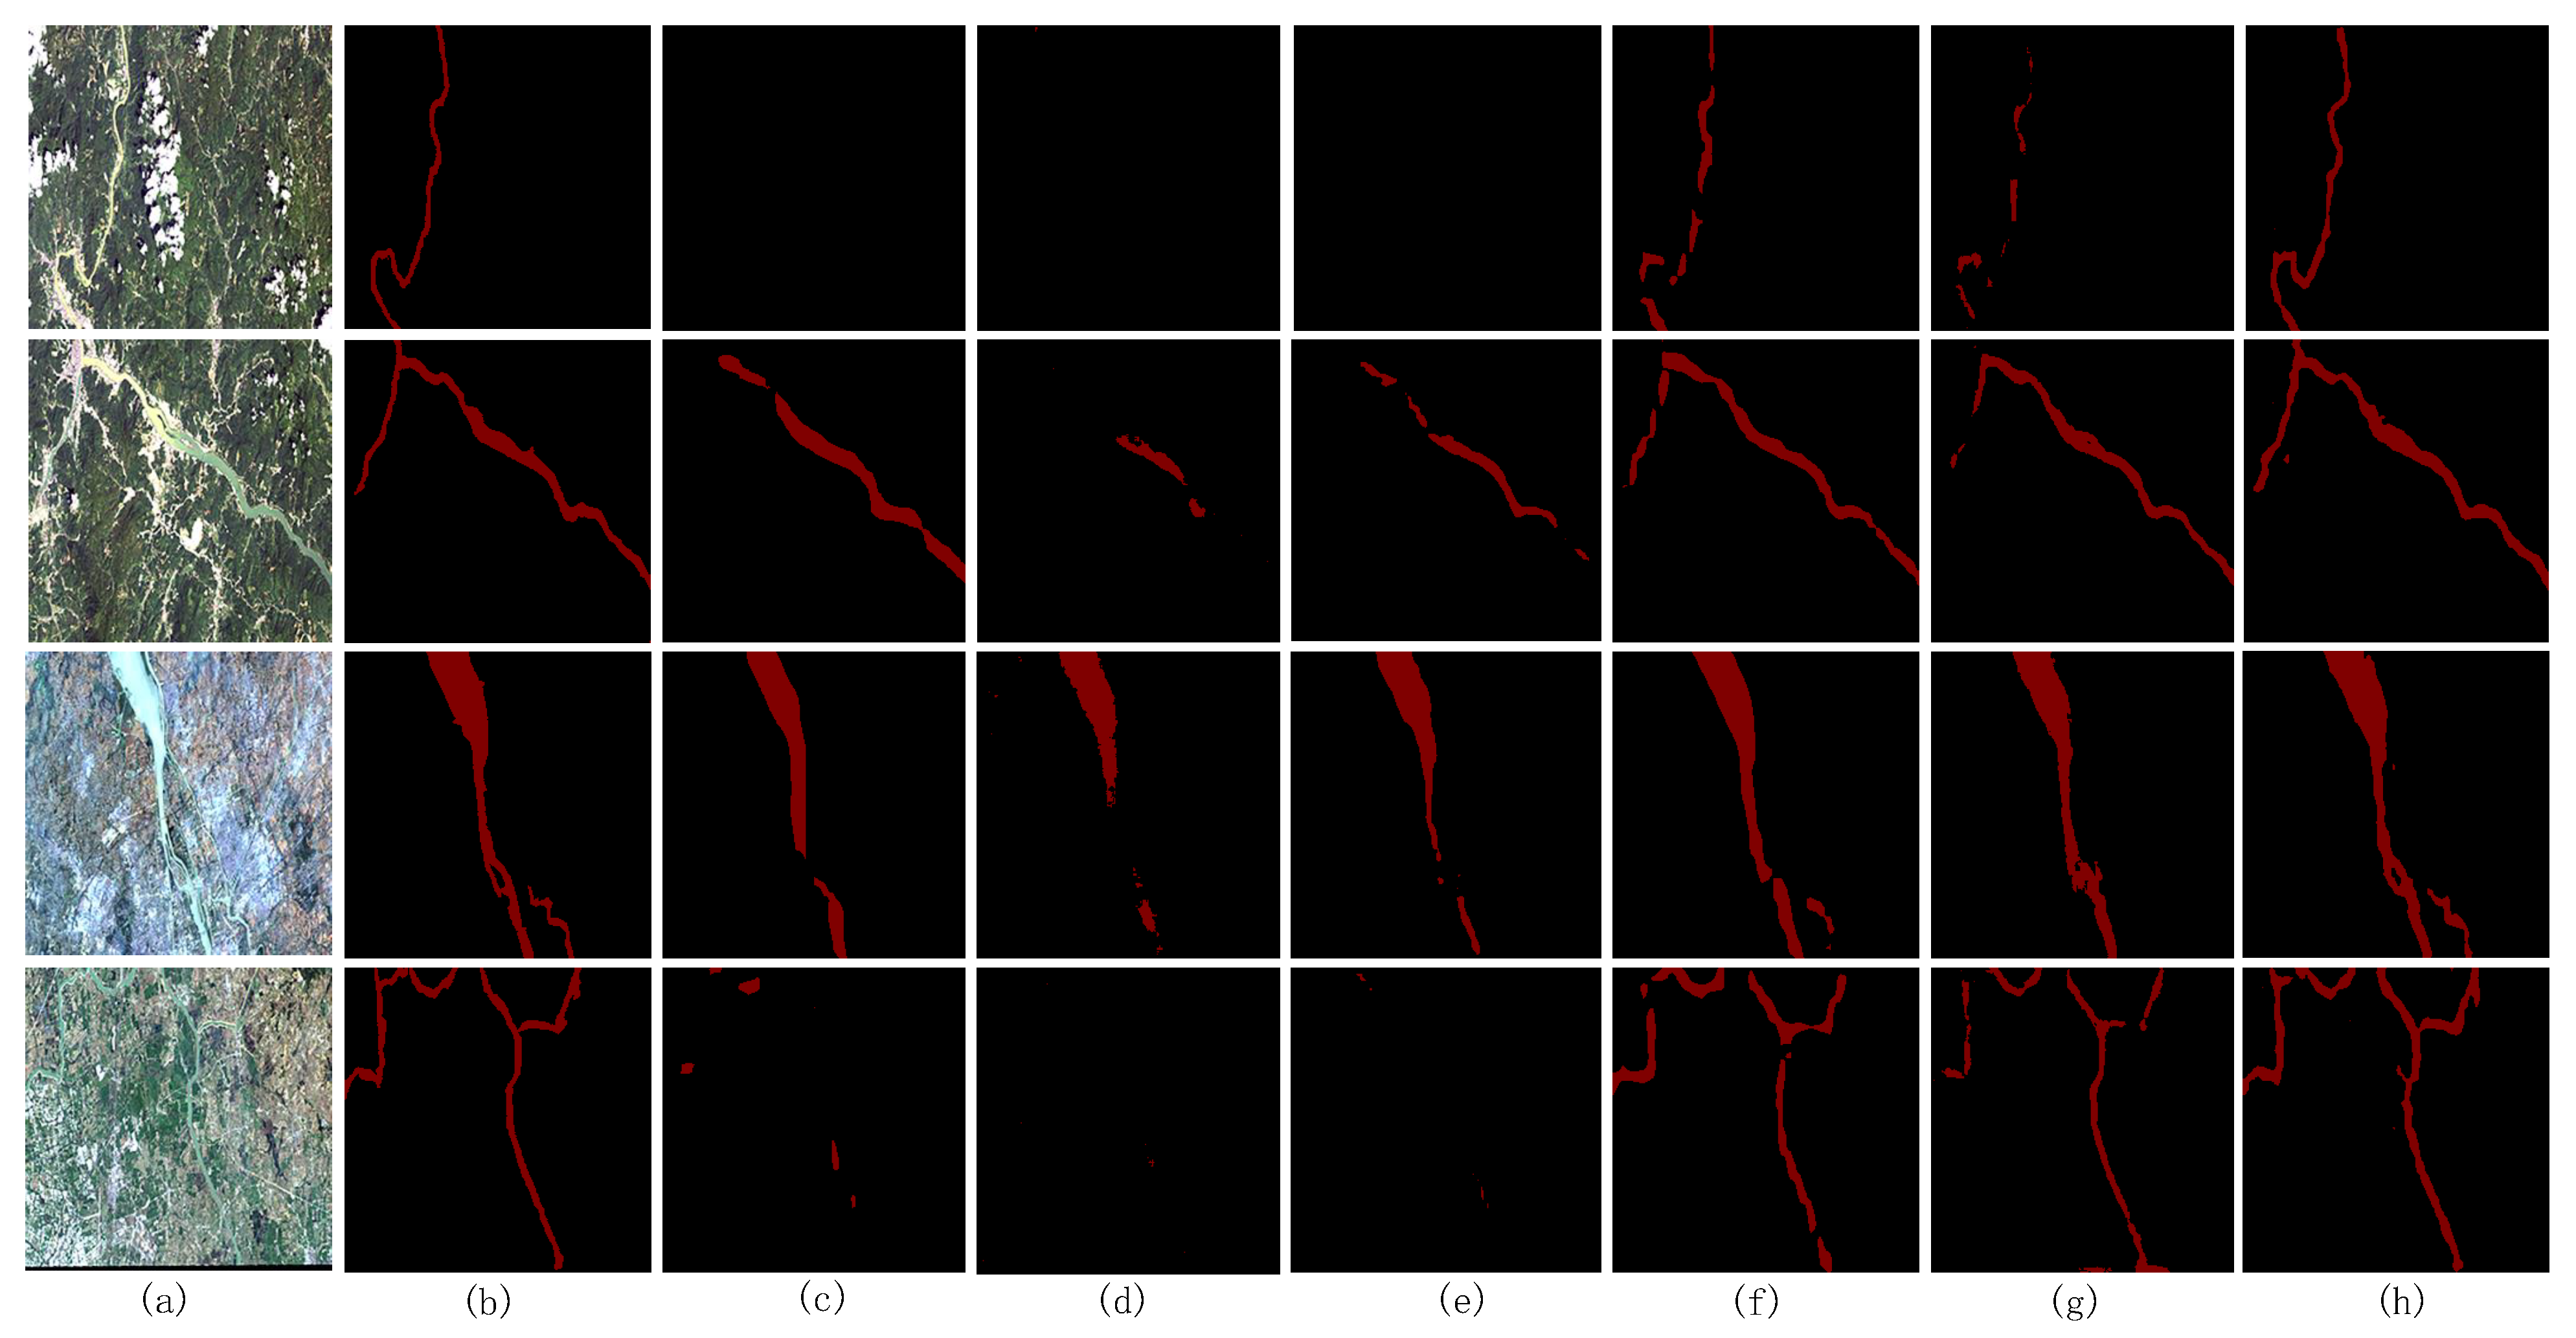
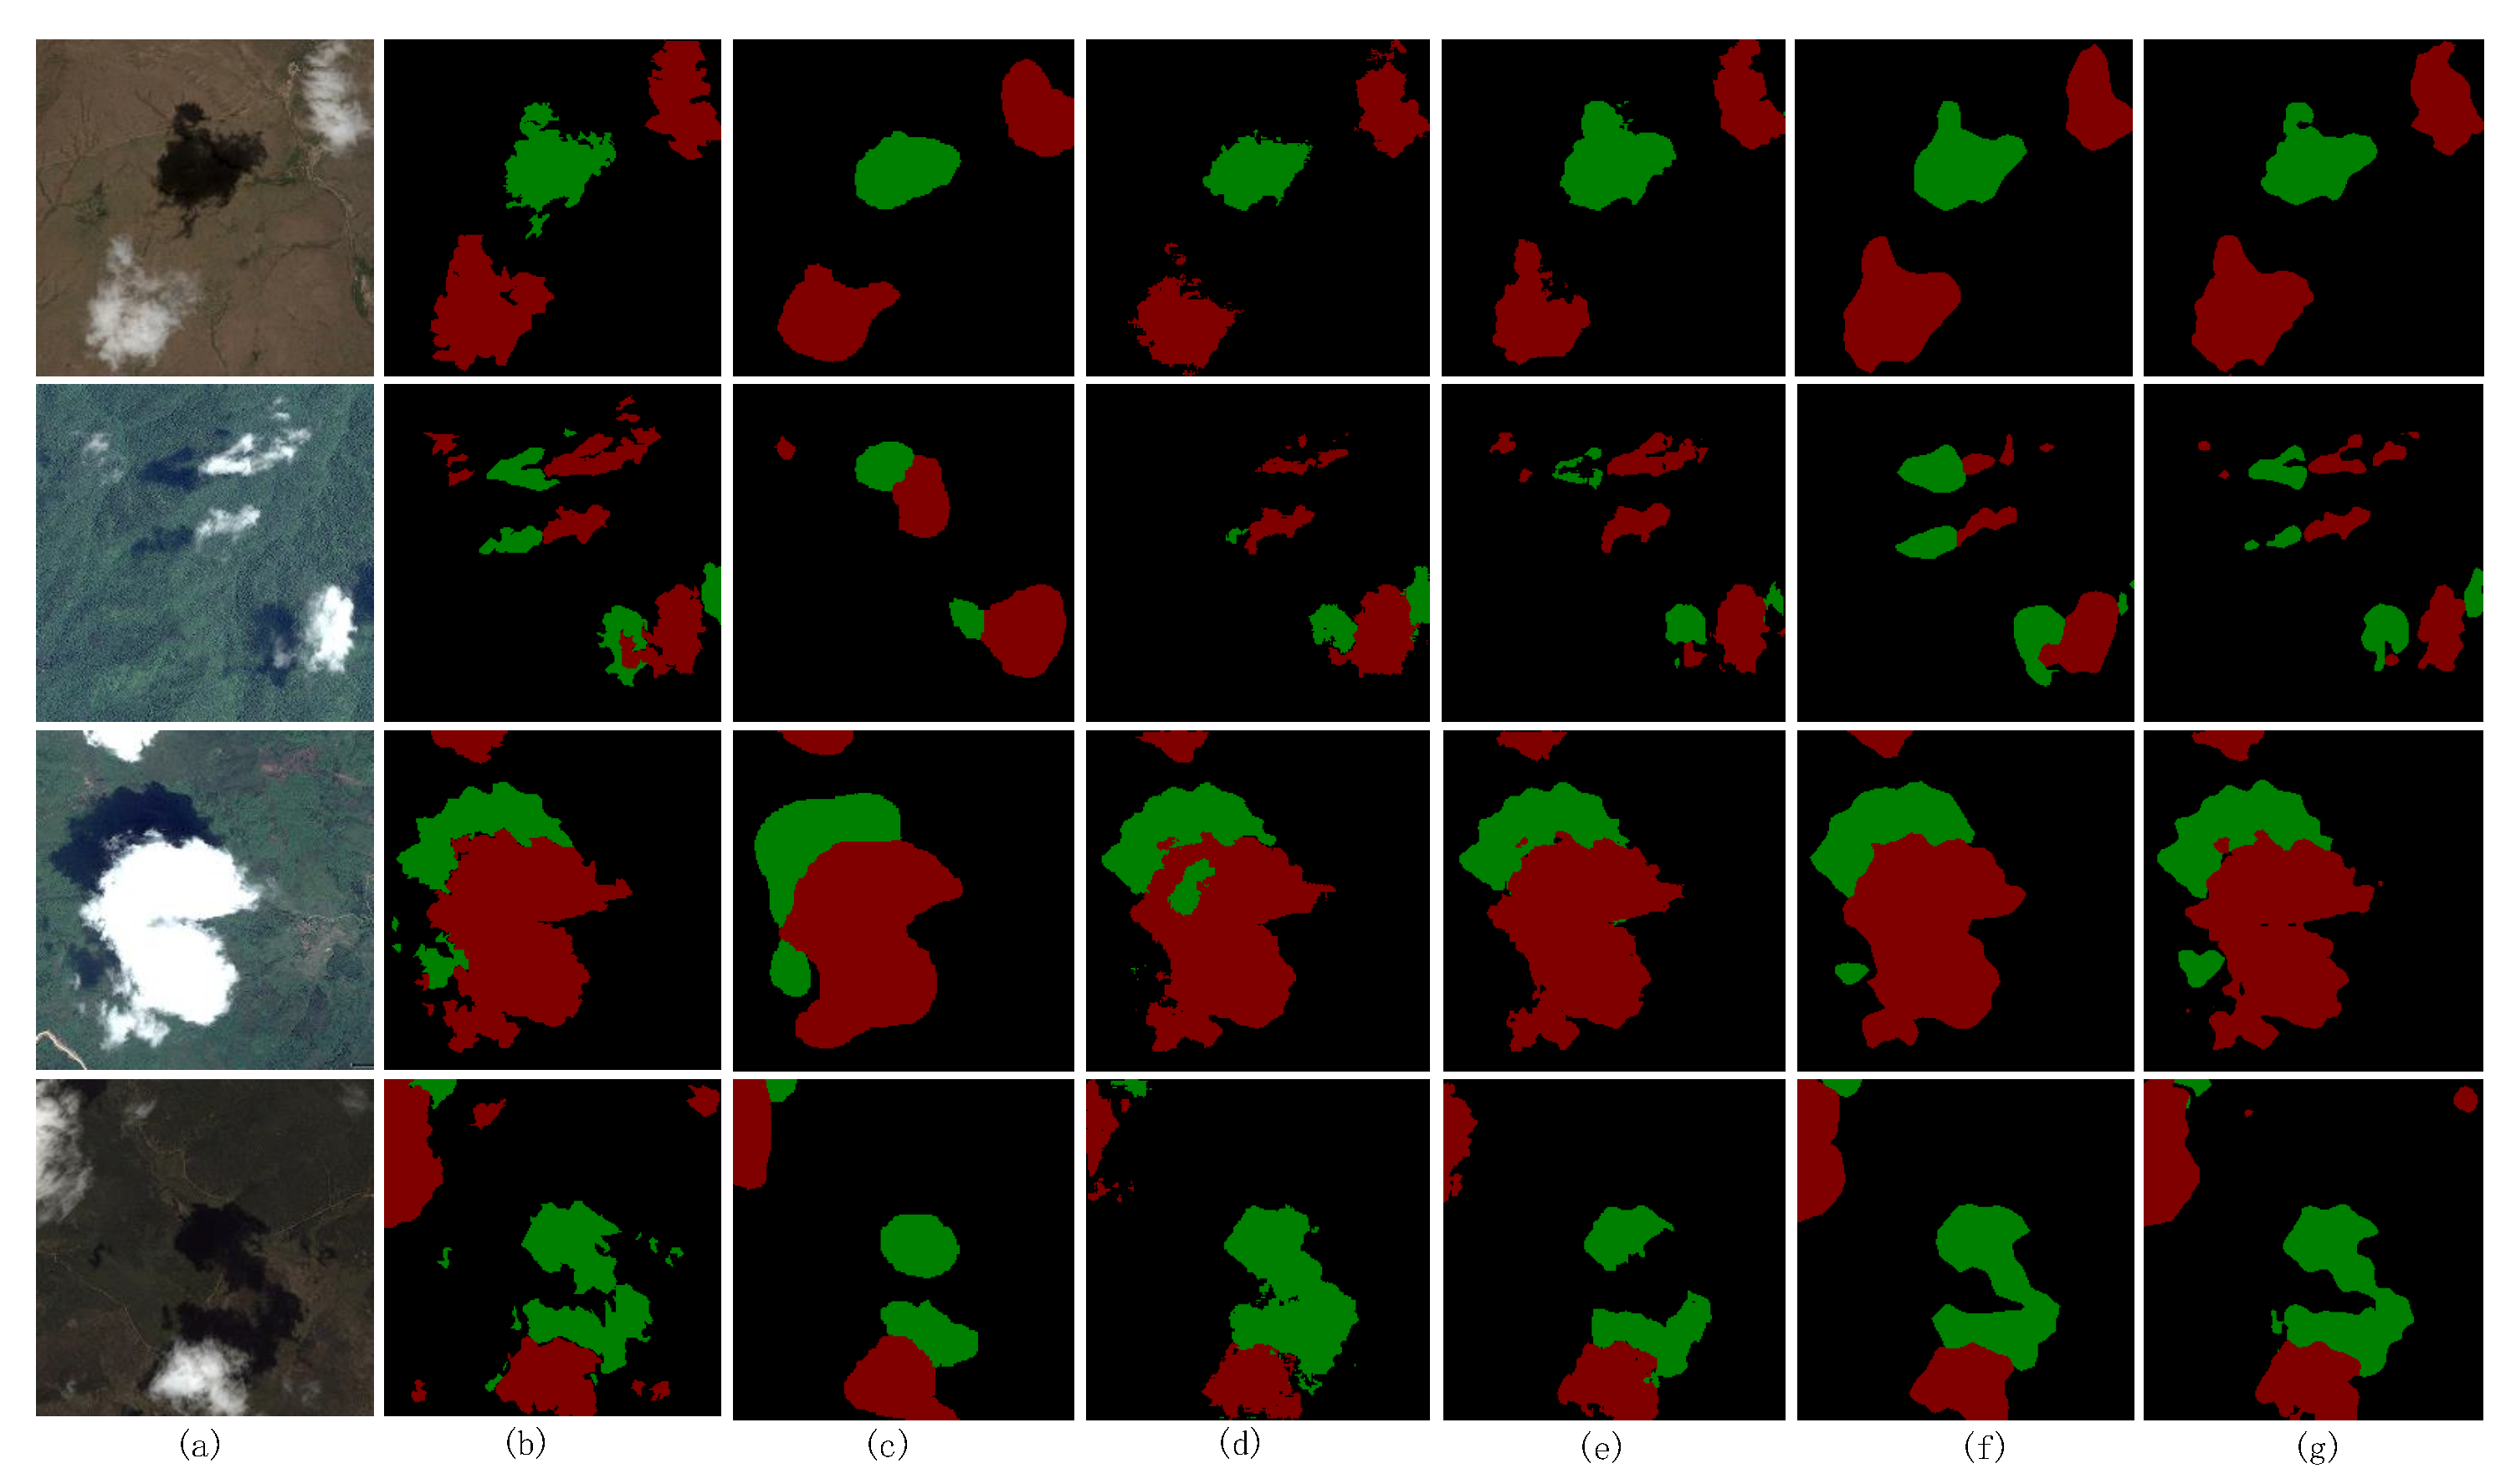
4.5. Generalization Experiment

4.5.1. Cloud and Cloud Shadow Dataset

To fully test whether the algorithm has the same segmentation performance in different tasks, our algorithm was evaluated on a cloud and cloud shadow dataset to verify that it can not only deal with two classification tasks, such as river segmentation, but also segment multiple types of tasks. We used Mean Intersection over Union (mIOU), the mean pixel accuracy (MPA) and pixel accuracy (PA) as evaluation indicators to assess the performance of the algorithm on the dataset. The comparison between this algorithm and other models on three indexes shows that the impression of this algorithm is better than that of other models. The specific comparison is shown in Table 4.
Figure 13 shows the segmentation influence of different models on the dataset. From the figure, we can see that FCN8sAtOnce and Segnet can only distinguish the outline of the image, and lose too much detailed information. The segmentation of details by UNET is improved, but, as shown in the third group, there are more missed detection cases. The effect of PSPNet further improves the segmentation effect, but the detection of edges is not clear enough, and the detection of thin clouds will be missed. As this model can fully extract detailed information, and the depth feature extraction module optimizes context information, it provides better global features for the feature fusion upsample module for continuous upsampling, so this article has better results in terms of detail processing, cloud and cloud shadow detection.

4.5.2. LandCover Dataset

To further verify the generalization ability of the model proposed in this paper, our algorithm will be evaluated in a landcover dataset to verify its excellent performance in water segmentation. We used the Mean Intersection over Union (mIOU), the Mean pixel Accuracy (MPA) and pixel accuracy (PA) as evaluation indicators to assess the performance of the algorithm on the dataset. The comparison between this algorithm and other models on three indexes shows that the impression of this algorithm is better than other models. The specific comparison is shown in Table 5.
Figure 14 shows the segmentation effect of different models on the dataset. From the figure, we can see that DenseASPP, UNet and MSRNet will have different situations of misdetection and missed detection, a lack of processing of edge information, and the segmentation edge is too rough. The segmentation effect of Deeplabv3+ was further improved, but, for the second set of pictures, there was a missed detection. In addition, the segmented edges were still a bit rough and there were tooth marks. Compared with the algorithm proposed in this paper, it can not only better segment the river region, but achieve a smooth and noise-free segmentation boundary, which fully reflects the usefulness of the algorithm model in this paper.

5. Conclusions

In remote sensing images, the river area is an important landmark, which has important practical significance in the surveying of water resources, flood monitoring and water resources’ protection planning. A multi-scale feature aggregation algorithm is proposed in this article to better deal with water segmentation tasks. The algorithm used the advantages of convolutional neural networks in feature extraction, and downsampling feature extraction was performed using ResNet network to obtain features at different levels. In this algorithm, the deep feature extraction module was used to obtain rich context information, aggregate spatial information and semantic information, and the multi-branch aggregation module was used for two-channel information communication to provide rich pixel information for the recovery of up-sampling information. Then, in the up-sampling process, the low-level feature branches fused by the Feature fusion upsample module are optimized by the high-level feature guidance, which is very important for the location of information during remote sensing image restoration. Compared with the existing segmentation algorithms, the method in this paper obtained better segmentation accuracy. This method has strong anti-interference and recognition abilities. The river can be accurately located, and the small tributaries in the complex environment are still finely divided with smoother edges. However, the algorithm in this paper still has some shortcomings. When the color of the river is similar to the forest and the light is not strong, the detection of the edge of the river will appear scattered. Although the accuracy of our algorithm was improved, the number of parameters was not effectively improved, and the accuracy may fluctuate when used in other tasks. In the future, to obtain better applications, we should reduce the weight of the model and relieve the training pressure. We could consider optimizing the backbone network, changing the convolution kernel or the convolution type, and even continuing to select a lighter network. In addition, the MBA model can be optimized, the connection mode can be changed, or the pyramid with an appropriate void rate can be selected for adjustment. In addition, for follow-up research, a lighter attention mechanism can be added to the backbone network to enhance its feature extraction abilities. In addition to the above methods, readers can also refer to relevant papers and some of the most advanced methods to continue to improve the algorithm.

Author Contributions

M.L.: Conceptualization, Methodology, Writing—original draft. K.H.: Conceptualization, Supervision, Software, Writing—review & editing. M.X.: Funding acquisition, Writing—review and editing. H.L.: Formal analysis, Validation. All authors have read and agreed to the published version of the manuscript.

Funding

This work is supported by the National Natural Science Foundation of PR China (42075130).

Institutional Review Board Statement

Not applicable.

Informed Consent Statement

Informed consent was obtained from all subjects involved in the study.

Data Availability Statement

The data and the code of this study are available from the corresponding author upon request.

Conflicts of Interest

The authors declare no conflict of interest.

References

  1. Verma, U.; Chauhan, A.; MM, M.P.; Pai, R. DeepRivWidth: Deep learning based semantic segmentation approach for river identification and width measurement in SAR images of Coastal Karnataka. Comput. Geosci. 2021, 154, 104805. [Google Scholar] [CrossRef]
  2. Zhu, L.; Zhang, J.Q.; Pa, L. River change detection based on remote sensing image and vector. In Proceedings of the First International Multi-Symposiums on Computer and Computational Sciences (IMSCCS’06), Hangzhou, China, 20–24 June 2006; pp. 188–191. [Google Scholar]
  3. Sun, J.Q.; Mao, S.Y. River detection algorithm in SAR images based on edge extraction and ridge tracing techniques. Int. J. Remote Sens. 2011, 32, 3485–3494. [Google Scholar] [CrossRef]
  4. McFeeters, S.K. The use of the Normalized Difference Water Index (NDWI) in the delineation of open water features. Int. J. Remote Sens. 1996, 17, 1425–1432. [Google Scholar] [CrossRef]
  5. Singh, P.K.; Sinha, N.; Sikka, K.; Mishra, A.K. Texture information-based hybrid methodology for the segmentation of SAR images. Int. J. Remote Sens. 2011, 32, 4155–4173. [Google Scholar] [CrossRef]
  6. Zhang, H.; Jiang, Q.G.; Xu, J. Coastline extraction using support vector machine from remote sensing image. J. Multim. 2013, 8, 175–182. [Google Scholar]
  7. Hinton, G.E.; Salakhutdinov, R.R. Reducing the dimensionality of data with neural networks. Science 2006, 313, 504–507. [Google Scholar] [CrossRef] [Green Version]
  8. Long, J.; Shelhamer, E.; Darrell, T. Fully convolutional networks for semantic segmentation. In Proceedings of the IEEE Conference on Computer Vision and Pattern Recognition, Boston, MA, USA, 7–12 June 2015; pp. 3431–3440. [Google Scholar]
  9. Badrinarayanan, V.; Kendall, A.; Cipolla, R. Segnet: A deep convolutional encoder-decoder architecture for image segmentation. IEEE Trans. Pattern Anal. Mach. Intell. 2017, 39, 2481–2495. [Google Scholar] [CrossRef] [PubMed]
  10. Ronneberger, O.; Fischer, P.; Brox, T. U-net: Convolutional networks for biomedical image segmentation. In International Conference on Medical Image Computing and Computer-Assisted Intervention, Proceedings of the 18th International Conference, Munich, Germany, 5–9 October 2015; Springer: Cham, Switzerland, 2015; pp. 234–241. [Google Scholar]
  11. Ciecholewski, M. River channel segmentation in polarimetric SAR images: Watershed transform combined with average contrast maximisation. Expert Syst. Appl. 2017, 82, 196–215. [Google Scholar] [CrossRef]
  12. Sghaier, M.O.; Foucher, S.; Lepage, R. River extraction from high-resolution SAR images combining a structural feature set and mathematical morphology. IEEE J. Sel. Top. Appl. Earth Obs. Remote Sens. 2017, 10, 1025–1038. [Google Scholar] [CrossRef]
  13. Zhao, H.S.; Shi, J.P.; Qi, X.J.; Wang, X.G.; Jia, J. Pyramid scene parsing network. In Proceedings of the IEEE Conference on Computer Vision and Pattern Recognition, Honolulu, HI, USA, 21–26 July 2017; pp. 2881–2890. [Google Scholar]
  14. Shamsolmoali, P.; Chanussot, J.; Zareapoor, M.; Zhou, H.Y.; Yang, J. Multipatch Feature Pyramid Network for Weakly Supervised Object Detection in Optical Remote Sensing Images. IEEE Trans. Geosci. Remote Sens. 2021, 1–13. [Google Scholar] [CrossRef]
  15. Shamsolmoali, P.; Zareapoor, M.; Chanussot, J.; Zhou, H.Y.; Yang, J. Rotation Equivariant Feature Image Pyramid Network for Object Detection in Optical Remote Sensing Imagery. arXiv 2021, arXiv:2106.00880. [Google Scholar] [CrossRef]
  16. Shamsolmoali, P.; Zareapoor, M.; Zhou, H.Y.; Wang, R.L.; Yang, J. Road Segmentation for Remote Sensing Images Using Adversarial Spatial Pyramid Networks. IEEE Trans. Geosci. Remote Sens. 2021, 59, 4673–4688. [Google Scholar] [CrossRef]
  17. Hoekstra, M.; Jiang, M.Z.; Clausi, D.A.; Duguay, C. Lake Ice-Water Classification of RADARSAT-2 Images by Integrating IRGS Segmentation with Pixel-Based Random Forest Labeling. Remote Sens. 2020, 12, 1425. [Google Scholar] [CrossRef]
  18. Weng, L.G.; Xu, Y.M.; Xia, M.; Zhang, Y.H.; Liu, J.; Xu, Y.Q. Water areas segmentation from remote sensing images using a separable residual segnet network. ISPRS Int. J. Geo-Inf. 2020, 9, 256. [Google Scholar] [CrossRef]
  19. Lin, T.Y.; Dollár, P.; Girshick, R.; He, K.M.; Hariharan, B.; Belongie, S. Feature pyramid networks for object detection. In Proceedings of the IEEE Conference on Computer Vision and Pattern Recognition, Honolulu, HI, USA, 21–26 July 2017; pp. 2117–2125. [Google Scholar]
  20. Tsotsos, J.K. Analyzing vision at the complexity level. Behav. Brain Sci. 1990, 13, 423–445. [Google Scholar] [CrossRef]
  21. Huang, G.; Liu, Z.; Van Der Maaten, L.; Weinberger, K.Q. Densely connected convolutional networks. In Proceedings of the IEEE Conference on Computer Vision and Pattern Recognition, Honolulu, HI, USA, 21–26 July 2017; pp. 4700–4708. [Google Scholar]
  22. Simonyan, K.; Zisserman, A. Very deep convolutional networks for large-scale image recognition. arXiv 2014, arXiv:1409.1556. [Google Scholar]
  23. Howard, A.G.; Zhu, M.L.; Chen, B.; Kalenichenko, D.; Wang, W.J.; Wey, T.; Andreetto, M.; Adam, H. Mobilenets: Efficient convolutional neural networks for mobile vision applications. arXiv 2017, arXiv:1704.04861. [Google Scholar]
  24. Szegedy, C.; Liu, W.; Jia, Y.Q.; Sermanet, P.; Reed, S.; Anguelov, D.; Erhan, D.; Vanhoucke, V.; Rabinovich, A. Going deeper with convolutions. In Proceedings of the IEEE Conference on Computer Vision and Pattern Recognition, Boston, MA, USA, 7–12 June 2015; pp. 1–9. [Google Scholar]
  25. Zhang, X.Y.; Zhou, X.Y.; Lin, M.X.; Sun, J. Shufflenet: An extremely efficient convolutional neural network for mobile devices. In Proceedings of the IEEE Conference on Computer Vision and Pattern Recognition, Salt Lake City, UT, USA, 18–23 June 2018; pp. 6848–6856. [Google Scholar]
  26. Wang, Z.W.; Xia, M.; Lu, M.; Pan, L.L.; Liu, J. Parameter Identification in Power Transmission Systems Based on Graph Convolution Network. IEEE Trans. Power Deliv. 2021. [Google Scholar] [CrossRef]
  27. Tsotsos, J.K. A Computational Perspective on Visual Attention; MIT Press: Cambridge, MA, USA, 2011. [Google Scholar]
  28. Bello, I.; Zoph, B.; Vaswani, A.; Shlens, J.; Le, Q.V. Attention augmented convolutional networks. In Proceedings of the IEEE/CVF International Conference on Computer Vision, Seoul, Korea, 27–28 October 2019; pp. 3286–3295. [Google Scholar]
  29. Ge, S.; Wang, C.; Jiang, Z.W.; Hao, H.Z.; Gu, Q. Dual-input attention network for automatic identification of detritus from river sands. Comput. Geosci. 2021, 151, 104735. [Google Scholar] [CrossRef]
  30. Song, L.; Xia, M.; Jin, J.; Qian, M.; Zhang, Y.H. SUACDNet: Attentional change detection network based on siamese U-shaped structure. Int. J. Appl. Earth Obs. Geoinf. 2021, 105, 102597. [Google Scholar] [CrossRef]
  31. Qu, Y.; Xia, M.; Zhang, Y.H. Strip pooling channel spatial attention network for the segmentation of cloud and cloud shadow. Comput. Geosci. 2021, 157, 104940. [Google Scholar] [CrossRef]
  32. He, K.; Zhang, X.; Ren, S.; Sun, J. Deep residual learning for image recognition. In Proceedings of the IEEE Conference on Computer Vision and Pattern Recognition, Las Vegas, NV, USA, 27–30 June 2016; pp. 770–778. [Google Scholar]
  33. Hu, J.; Shen, L.; Sun, G. Squeeze-and-excitation networks. In Proceedings of the IEEE Conference on Computer Vision and Pattern Recognition, Salt Lake City, UT, USA, 18–23 June 2018; pp. 7132–7141. [Google Scholar]
  34. Woo, S.; Park, J.; Lee, J.Y.; Kweon, I.S. Cbam: Convolutional block attention module. In Proceedings of the European Conference on Computer Vision (ECCV), Munich, Germany, 8–14 September 2018; pp. 3–19. [Google Scholar]
  35. Li, X.; Wang, W.H.; Hu, X.L.; Yang, J. Selective kernel networks. In Proceedings of the IEEE/CVF Conference on Computer Vision and Pattern Recognition, Long Beach, CA, USA, 15–20 June 2019; pp. 510–519. [Google Scholar]
  36. Xia, M.; Zhang, X.; Weng, L.; Xu, Y. Multi-stage feature constraints learning for age estimation. IEEE Trans. Inf. Forensics Secur. 2020, 15, 2417–2428. [Google Scholar] [CrossRef]
  37. Xia, M.; Wang, K.; Song, W.Z.; Chen, C.L.; Li, Y.P. Non-intrusive load disaggregation based on composite deep long short-term memory network. Expert Syst. Appl. 2020, 160, 113669. [Google Scholar] [CrossRef]
  38. Boguszewski, A.; Batorski, D.; Ziemba-Jankowska, N.; Zambrzycka, A.; Dziedzic, T. Landcover. ai: Dataset for automatic mapping of buildings, woodlands and water from aerial imagery. arXiv 2020, arXiv:2005.02264. [Google Scholar]
  39. Kingma, D.P.; Ba, J. Adam: A method for stochastic optimization. arXiv 2014, arXiv:1412.6980. [Google Scholar]
  40. Chen, L.C.; Papandreou, G.; Kokkinos, I.; Murphy, K.; Yuille, A. Deeplab: Semantic image segmentation with deep convolutional nets, atrous convolution, and fully connected crfs. IEEE Trans. Pattern Anal. Mach. Intell. 2017, 40, 834–848. [Google Scholar] [CrossRef]
  41. Chen, L.C.; Zhu, Y.K.; Papandreou, G.; Schroff, F.; Adam, H. Encoder-decoder with atrous separable convolution for semantic image segmentation. In Proceedings of the European conference on computer vision (ECCV), Munich, Germany, 8–14 September 2018; pp. 801–818. [Google Scholar]
  42. Li, H.C.; Xiong, P.F.; An, J.; Wang, L. Pyramid attention network for semantic segmentation. arXiv 2018, arXiv:1805.10180. [Google Scholar]
  43. Dang, B.; Li, Y.S. MSResNet: Multiscale Residual Network via Self-Supervised Learning for Water-Body Detection in Remote Sensing Imagery. Remote Sens. 2021, 13, 3122. [Google Scholar] [CrossRef]
  44. Yu, C.Q.; Wang, J.B.; Peng, C.; Gao, C.X.; Yu, G.; Sang, N. Learning a discriminative feature network for semantic segmentation. In Proceedings of the IEEE Conference on Computer Vision and Pattern Recognition, Salt Lake City, UT, USA, 18–23 June 2018; pp. 1857–1866. [Google Scholar]
  45. Yu, C.Q.; Wang, J.B.; Peng, C.; Gao, C.X.; Yu, G.; Sang, N. Bisenet: Bilateral segmentation network for real-time semantic segmentation. In Proceedings of the European Conference on Computer Vision (ECCV), Munich, Germany, 8–14 September 2018; pp. 325–341. [Google Scholar]
  46. Yang, M.; Yu, K.; Zhang, C.; Li, Z.W.; Yang, K.Y. Denseaspp for semantic segmentation in street scenes. In Proceedings of the IEEE Conference on Computer Vision and Pattern Recognition, Salt Lake City, UT, USA, 18–23 June 2018; pp. 3684–3692. [Google Scholar]
  47. Zhang, Z.L.; Lu, M.; Ji, S.P.; Yu, H.F.; Nie, C.H. Rich CNN Features for Water-Body Segmentation from Very High Resolution Aerial and Satellite Imager. Remote Sens. 2021, 13, 1912. [Google Scholar] [CrossRef]
Figure 1. Multi-scale Feature Aggregation network. The ResNet-50 is used to extract features of different levels. The deep feature extraction module (DFE) can obtain multi-scale features and pay attention to global and local edge information. The multi-branch aggregation module (MBA) is used to enhance the interconnection and integrate the two types of feature representation, and the feature fusion upsample module (FFU) is used to complete feature fusion and location recovery.
Remotesensing 14 00206 g001
Figure 2. Residual structure. x l is the input vector of residual unit. W l and W 2 represents weight matrices. F ( x ) is residual mapping.
Remotesensing 14 00206 g002
Figure 3. Deep Feature Extraction module.
Remotesensing 14 00206 g003
Figure 4. Schematic diagram of different expansion factors. (a) The expansion factor is 1 1 (b) is the convolution kernel with expansion factor of 2 (c) is the convolution kernel with expansion factor of 3. The red dot represents the 3 × 3 convolution kernel. Blue represents the receptive field of hole convolution. Dark colors represent overlapping receptive fields, and light colors represent normal conditions.
Remotesensing 14 00206 g004
Figure 5. Multi-branch Aggregation module. DWConv is depthwise conv, which is used to reduce calculation parameters. Rate stands for void rate.
Remotesensing 14 00206 g005
Figure 6. Feature Fusion Upsample module. 1 × 1 × 1 means 1 × 1 × 1 convolutions.BN is the batch normalization layer.
Remotesensing 14 00206 g006
Figure 7. Partial sample display of water area dataset.
Remotesensing 14 00206 g007
Figure 8. Partial sample display of cloud and cloud shadow dataset.
Remotesensing 14 00206 g008
Figure 9. Partial display of LandCover Dataset.
Remotesensing 14 00206 g009
Figure 10. The comparison experiments of water domain segmentation. (a) Image; (b) label; (c) FCN8sAtOnce; (d) Segnet; (e) Deeplabv3+; (f) PSPNet; (g) UNet; (h) Our model.
Remotesensing 14 00206 g010
Figure 11. The comparison of different methods for segmentation of small water images. (a) Image; (b) label; (c) FCN8sAtOnce; (d) Segnet; (e) Deeplabv3+; (f) PSPNet; (g) UNet; (h) Our model.
Remotesensing 14 00206 g011
Figure 12. The comparison of different methods with complex background noise. (a) Image; (b) label; (c) FCN8sAtOnce; (d) Segnet; (e) Deeplabv3+; (f) PSPNet; (g) UNet; (h) Our model.
Remotesensing 14 00206 g012
Figure 13. (a) Image; (b) label; (c) FCN8sAtOnce; (d) Segnet; (e) UNet; (f) PSPNet; (g) Our model.
Remotesensing 14 00206 g013
Figure 14. (a) Image; (b) label; (c) DenseASPP; (d) Unet; (e) MSRNet; (f) Deeplapv3+; (g) Our model.
Remotesensing 14 00206 g014
Table 1. ResNet detailed parameter settings.
Layer NameImputKernel SizeStrideOutput
Layer1 256 × 256 × 3 7 × 7 c o n v
3 × 3 c o n v
2 64 × 64 × 64
   Layer2    64 × 64 × 64 1 × 1 , 64 3 × 3 , 64 1 × 1 , 256 × 3    2    64 × 64 × 256
   Layer3    64 × 64 × 256 1 × 1 , 128 3 × 3 , 128 1 × 1 , 512 × 4    2    32 × 32 × 512
   Layer4    32 × 32 × 512 1 × 1 , 256 3 × 3 , 256 1 × 1 , 1024 × 6    2    16 × 16 × 1024
   Layer5    16 × 16 × 1024 1 × 1 , 512 3 × 3 , 512 1 × 1 , 2048 × 3    2    8 × 8 × 2048
Table 2. Comparison of the effects of different modules on the model.
MethodmIOU (%)
ResNet5090.94
ResNet50 + FFU94.57
ResNet50 + FFU + DFE95.01
ResNet50 + FFU + DFE + MBA95.94
Table 3. Comparison results of different algorithms.
MethodFLops (GMac)T (s)P (%)R (%)F1 (%)MPA (%)mIOU (%)
FCN8sAtOnce 73.35 73 94.7492.2693.4895.3291.89
Deeplabv3+ [41] 64.92 76 96.2892.7594.4895.8193.09
SegNet 42.48 43 95.9393.1694.5295.9593.13
PANnet [42] 5.73 29 96.9492.2794.5495.6793.17
MSResNet [43] 31.94 53 94.91 94.54 94.73 97.46 93.35
DFNnet [44] 7.81 45 95.9393.5894.7496.1693.38
BiSeNet [45] 15.24 26 96.8894.0195.4296.5294.21
PSPNet 46.07 56 97.5394.1295.8096.6894.68
UNet 40 41 96.9894.7095.8396.8894.70
DenseASPP [46] 38.71 91 96.2395.4995.8697.1594.73
MEcnet [47] 46.04 105 97.67 94.64 95.45 96.13 95.01
Ours 29.43 56 98.0795.6296.8397.5195.94
Table 4. Comparison of evaluation indexes of different models in cloud and cloud shadow dataset.
MethodPA (%)MPA (%)mIOU (%)
FCN8sAtOnce93.1391.0284.39
SegNet93.3091.5384.70
DFNnet93.9992.6086.20
UNet94.1892.8486.43
PSPNet94.1992.1886.76
Ours94.4693.1387.28
Table 5. Comparison of evaluation indexes of different models in LandCover dataset.
MethodPA (%)MPA (%)mIOU (%)
SegNet 94.93 94.38 89.97
BiSeNet 95.64 95.38 91.35
PAN 96.07 95.69 92.15
DenseASPP 96.11 95.85 92.24
UNet 96.17 95.58 92.35
MSResNet 96.20 96.04 92.43
Deeplabv3+ 96.23 95.84 92.45
Ours 96.45 96.12 92.89
Publisher’s Note: MDPI stays neutral with regard to jurisdictional claims in published maps and institutional affiliations.

