Abstract
The landscape visual effect of a city, which is generated by its long-term development, is an important index in city planning. In this study, we build a quantitative evaluation and remote sensing estimation scheme of landscape visual effect. The study contains two main steps. First, utilizing the Elo rating system and in situ sampled panoramic pictures, the quantitative assessment of the city landscape visual effect was carried out. Then, the landscape visual effect estimation model was built and applied to Landsat remote sensing image to generate the spatial distribution of landscape visual effect in Zhengzhou city, 2017. At last, the effect of different combination of land use and elevation to the landscape visual effect was discussed. The results showed the following: (1) the Elo rating system is an effective method to quantitatively evaluate the city landscape visual effect; (2) the landscape visual effect remote sensing estimation model had a good performance, with the mean absolute percentage error (MAPE) and root mean square error (RMSE) of the model are less than 0.05 and 80, respectively; (3) the landscape visual effect score of Zhengzhou city, 2017, was high in the southwest and low in the northeast; (4) different land use situation and average surface elevation had a complex influence on the landscape visual effect.
1. Introduction
The urban landscape is formed by the mutual combination and influence of landscape materials [1]. Individuals have different subjective perceptions about the overall image of the landscape. How to improve people’s visual experience with the urban landscape has become very important in urban planning and design. Therefore, urban landscape visual effect has become an essential consideration in urban planning [2]. With China’s economic development, urban appearance and urban landscape have been greatly improved. Yet, there are still certain issues. “Beauty” has many definitions from the perspective of landscape aesthetics. Visual quality lacks unified definitions and standards [3]. As a result, the assessment of the urban landscape visual effect has attracted attention. Some experts and scholars put forward corresponding assessment indicators to quantitatively evaluate the visual effect of the urban landscape. Yang et al. [4] have stated that the visual perception of an urban landscape image contains three parts, namely, visual hierarchy, visual plate, and visual color. Niu et al. [5] reported that the urban skyline is mainly affected by indicators of tortuosity, real vision, and sense of hierarchy. Zhang [6] postulated that the urban contour is affected by nine factors, namely, the rhythm, identification, and fluctuation of the contour, the material, facade, and shape of architectural form, and the hierarchy, patch, and color of visual perception. Another popular way of evaluating visual effect is using surveys to find the connection between the substantive attribute of urban landscape space and the mass response [3].
The current assessment methods of urban landscape visual effect are quantitative or qualitative. Quantitative research is mainly based on the assessment indicator systems that been proposed by experts and scholars [7,8,9,10,11,12]. These studies have solid theoretical foundations, yet they are difficult to localize. The visual features beyond those indicators cannot be properly discussed. Meanwhile, qualitative methods are primarily social surveys with good locality [9,13,14]. However, these methods are difficult to quantify. When the comparison across different regions is needed, the effectiveness of these methods will be quite limited. This makes these methods not conducive to wide applications. Consequently, the assessment of the urban landscape visual effect is currently limited to verbal description. In urban planning, it is difficult to find a simple and reasonable standard to assess the current design, especially on a large scale (such as a city).
So, in urban landscape visual effect assessing missions, two questions need to be asked. The first one is: does an effective and objective method to assess landscape visual effect exist? If so, the second question is: how can this method be applied to assess the visual effect of the whole study area? To answer these questions, the Elo rating system [15,16] was used to quantify the subjective complex perceptions of landscape vision through a simple competitive comparison method, based on field collected samples. The Elo rating system was firstly applied to assess landscape visual effect by Goodspeed [17]. The research suggested that Elo rating system could inspire a new generation of visual assessment research. Furthermore, combined with machine learning and remote sensing technology, a remote sensing estimation model of urban landscape visual effect was developed in order to obtain the spatial distribution of the landscape visual effect. In addition, the urban landscape visual effect was spatialized. The proposed theoretical frame for the quantitative assessment of the urban landscape visual effect could provide present and reliable data to support urban design and urban landscape evolution research.
The two primary aims of this study are as follows: (1) to quantitatively evaluate the visual effect based on the Elo rating system and in situ collected panoramic pictures; (2) to build the statistical model from remote sensing parameters (land use map and evaluation map) to the visual effect scores yielded from step (1). Finally, obtain the visual effect map of the study area.
2. Data and Method
2.1. Overview of the Study Area
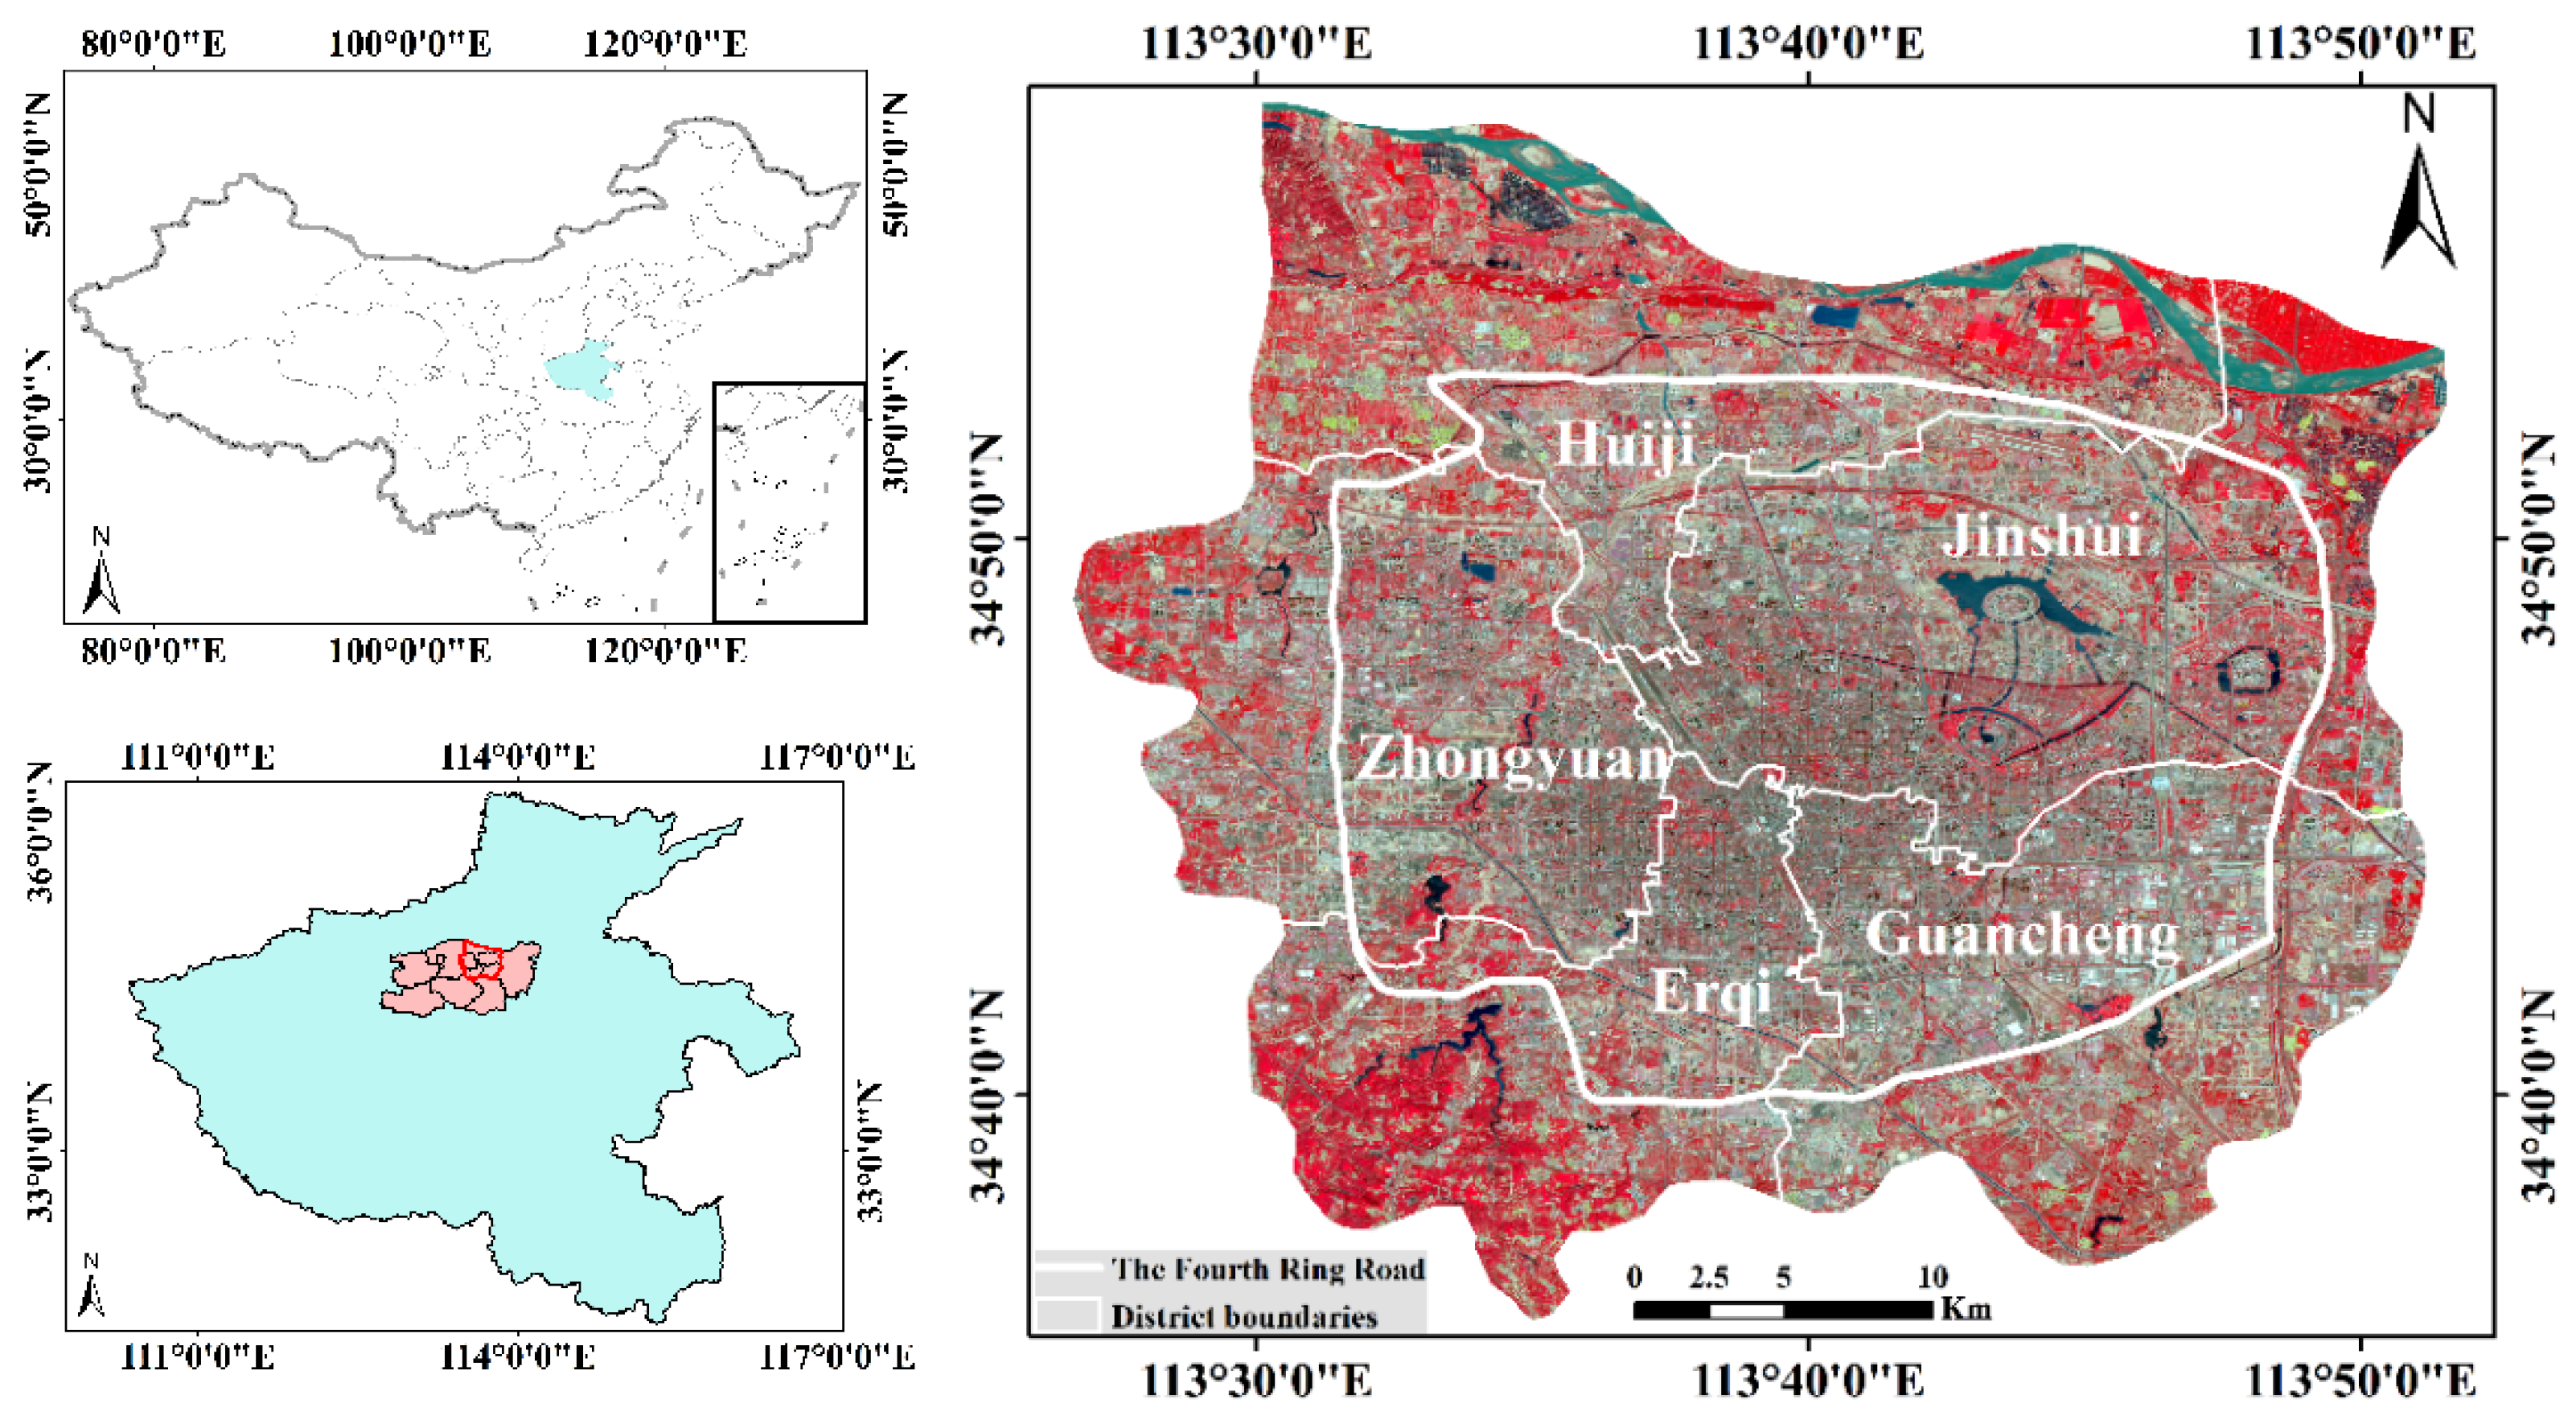
Zhengzhou is the capital of Henan Province, a key central city in Central China and the core city of the Central Plains Economic Zone (Figure 1), which is located in the south of the North China Plain, at the lower reaches of the Yellow River, and north of central Henan Province. There are six districts, namely, Zhongyuan, Erqi, Jinshui, Huiji, Guancheng, and Shangjie. Zhengzhou has developed rapidly in recent years. There are great differences between the new and old urban areas in terms of the concept and spatial distribution of construction projects. In addition, there are significant differences in the landscape visual effect.
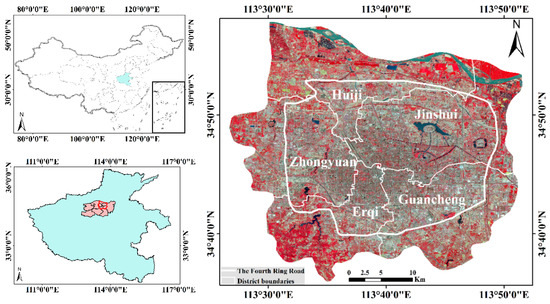
Figure 1.
Location of the study area.
2.2. Introduction to Research Methods
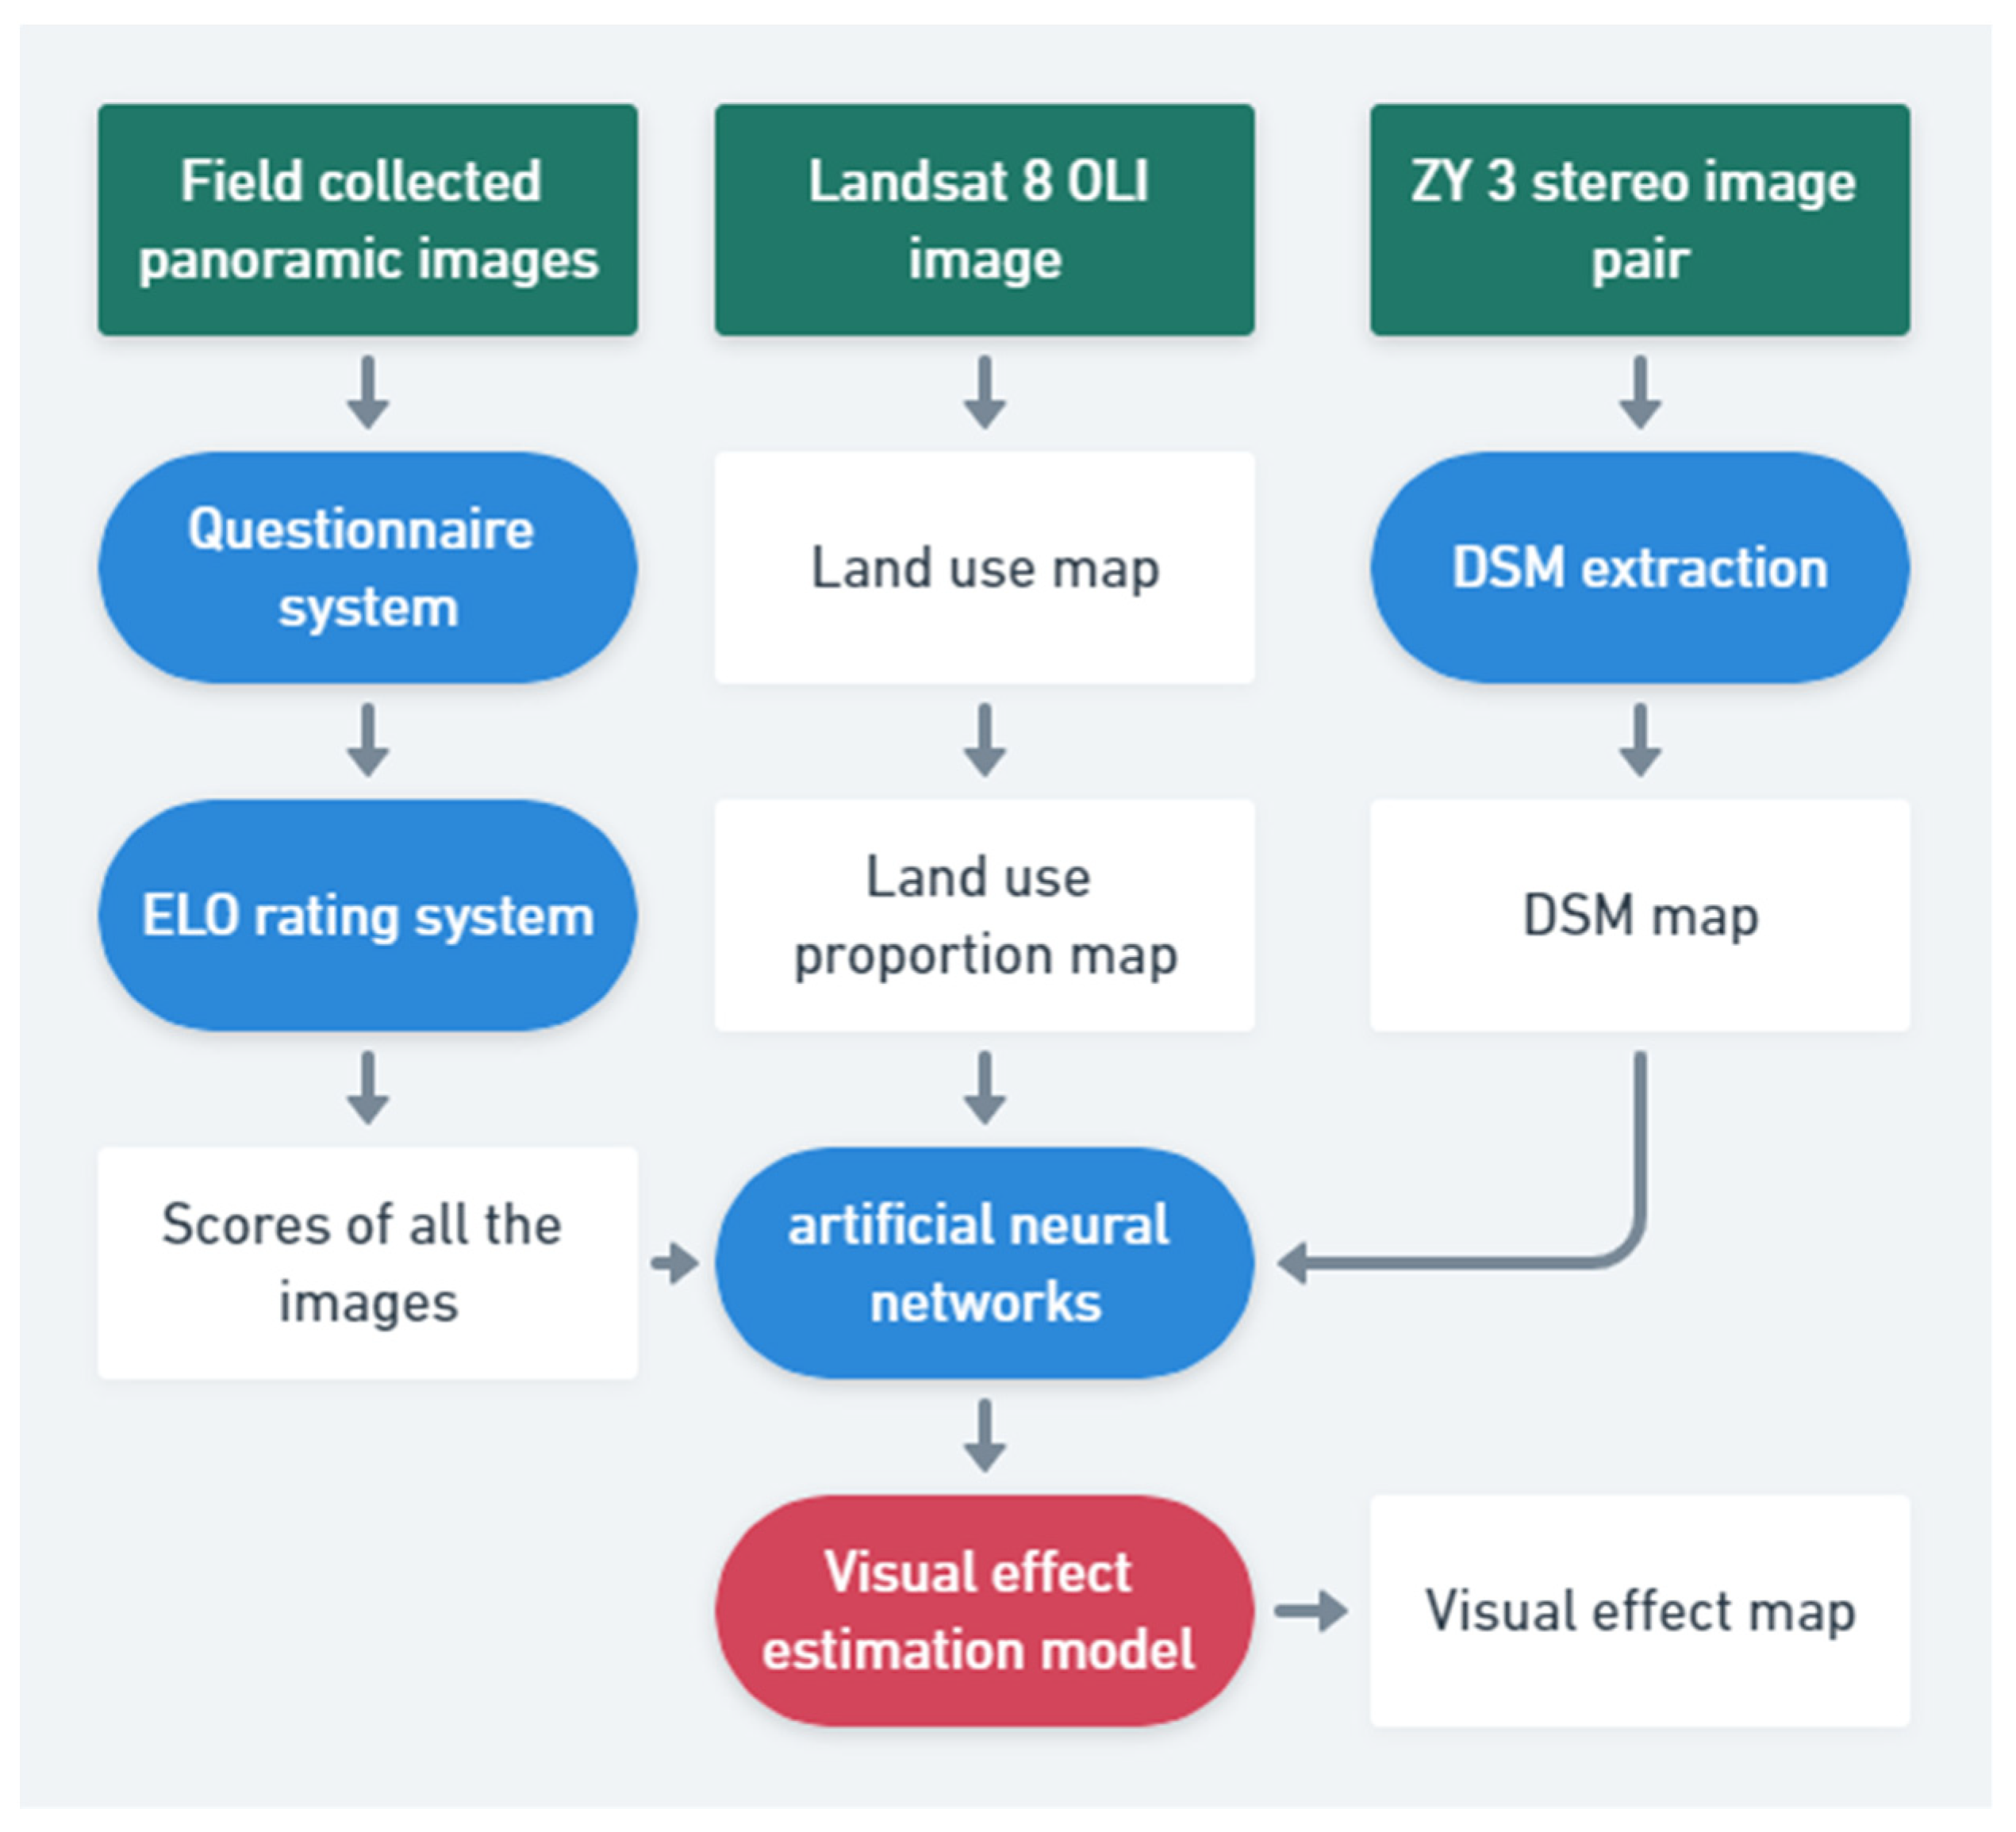
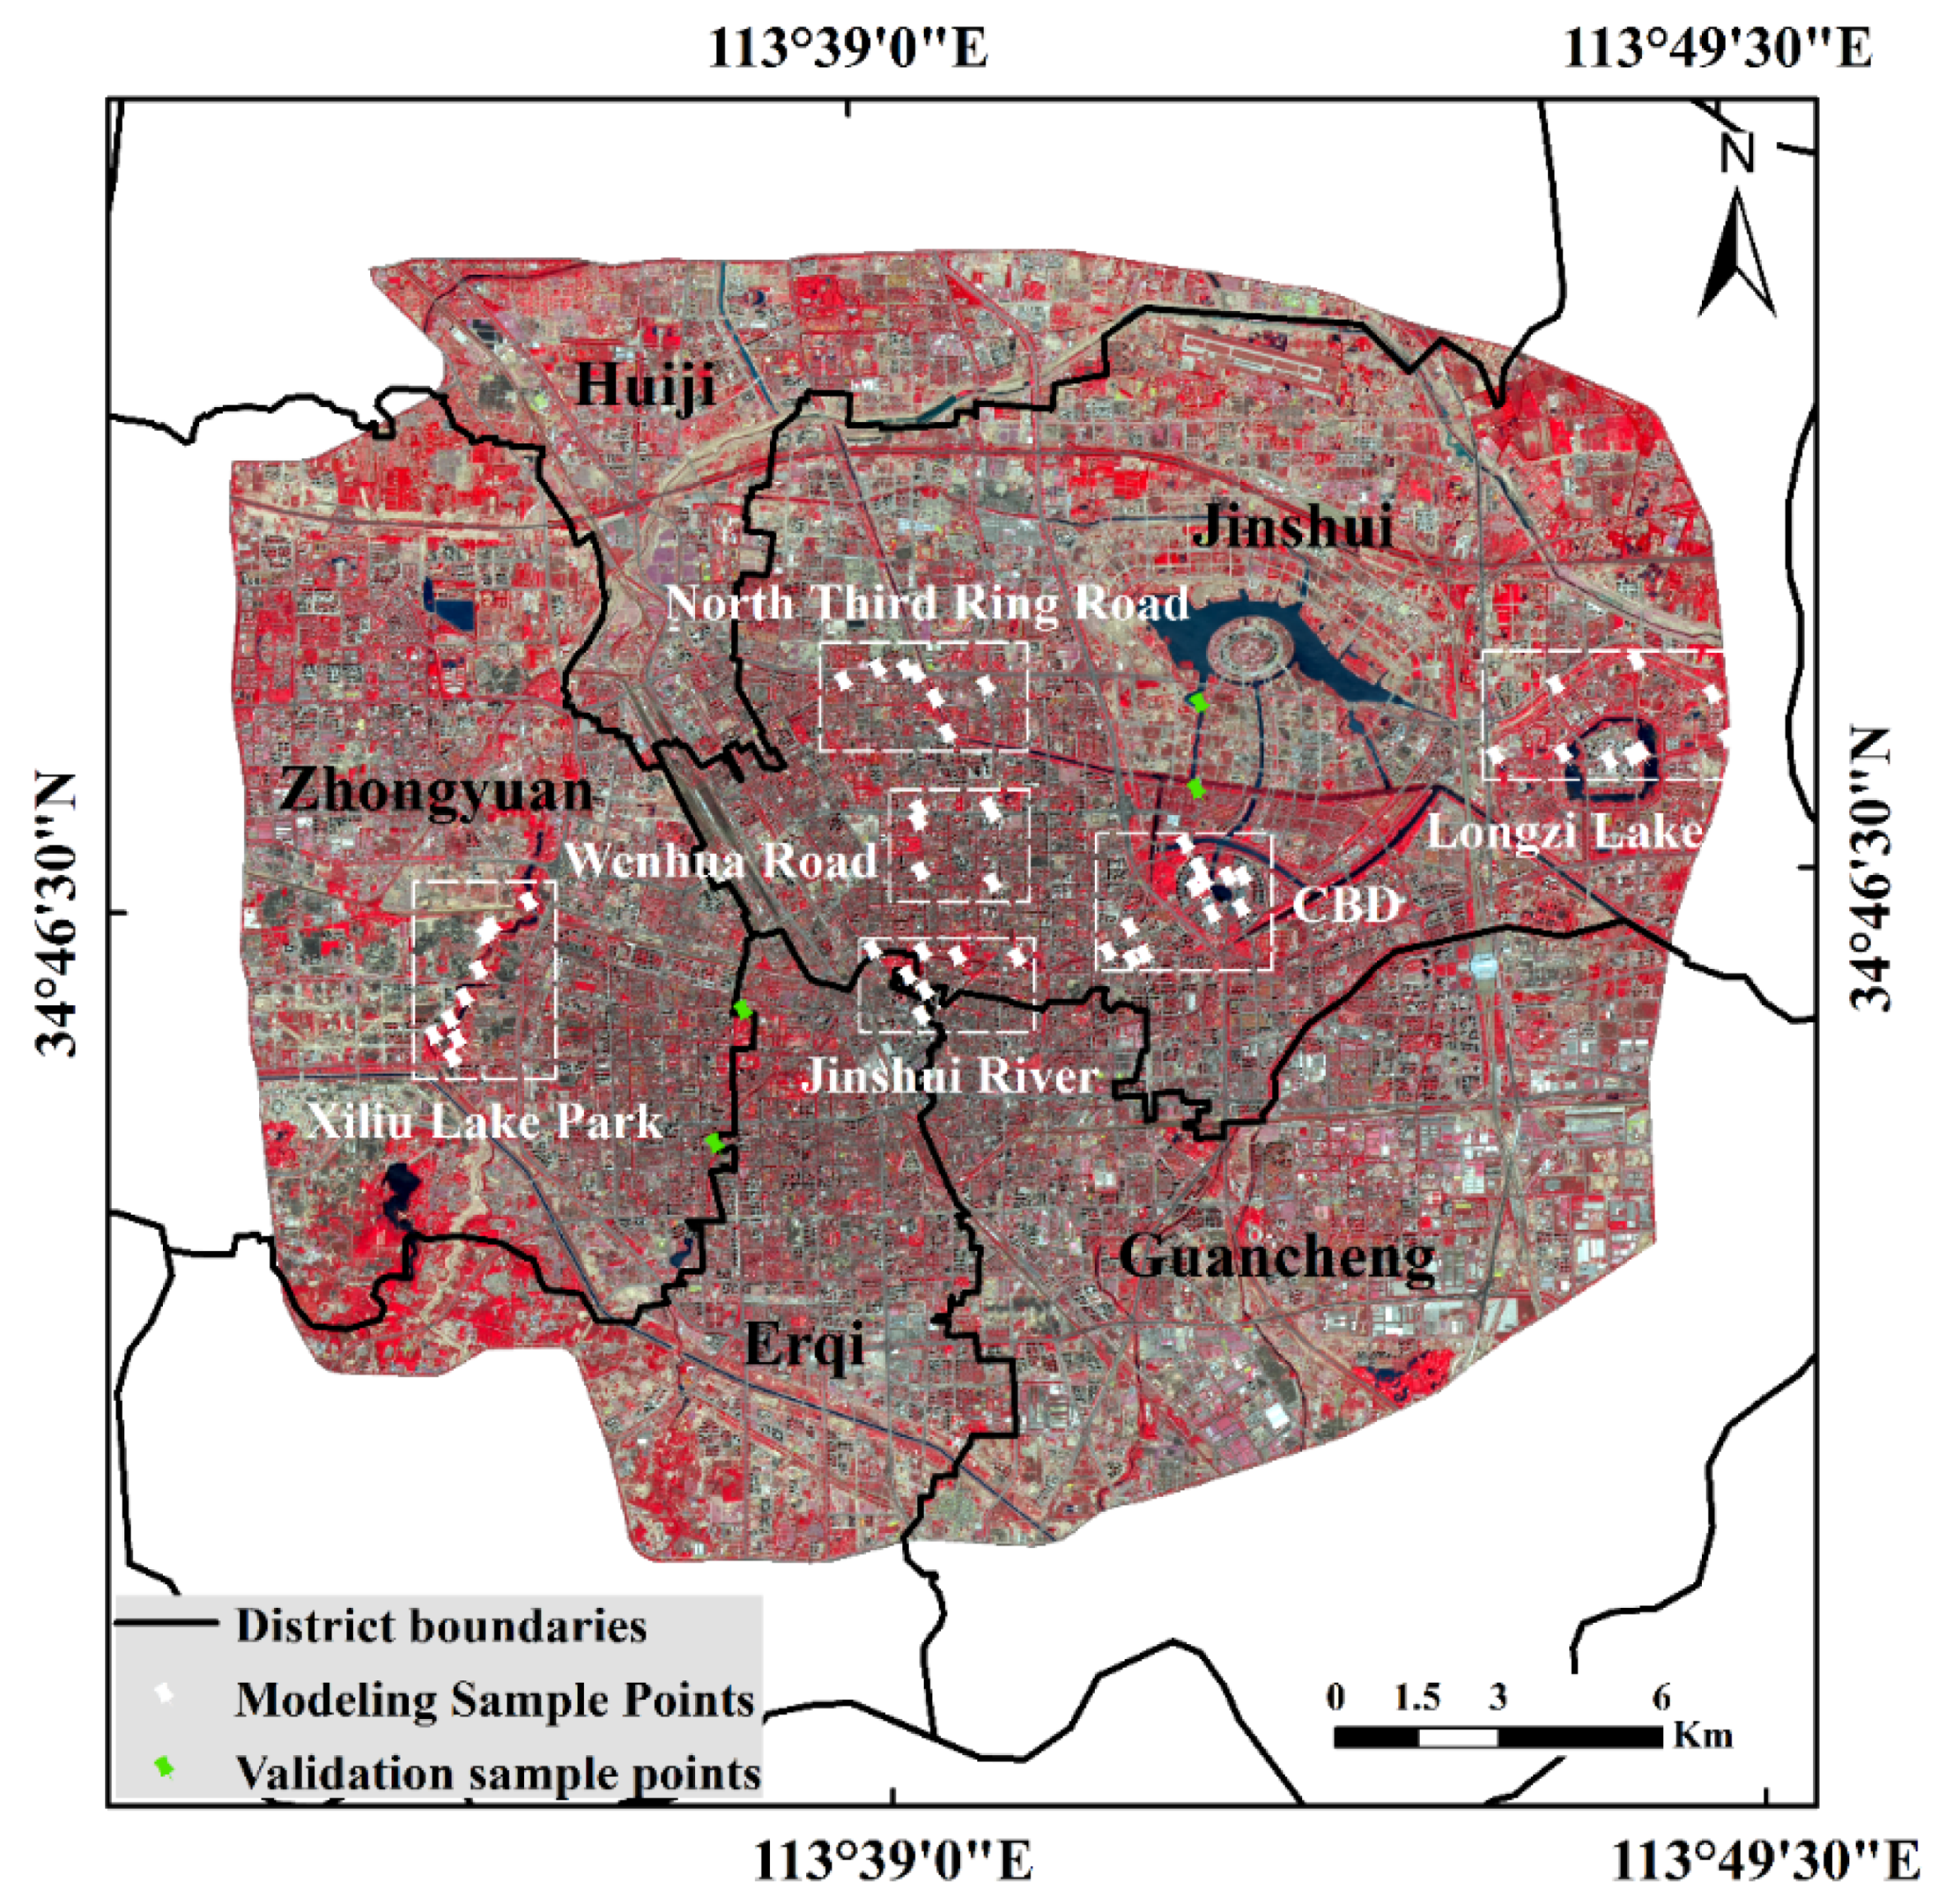
The proposed method contains two main steps (Figure 2). First, 50 panoramic images collected at representative regions in Zhengzhou (within the Fourth Ring Road) (Figure 3). In these regions, Wenhua Road, Jinshui River, and the North Third Ring Road are located in the old town region. Xiliu Lake Park is in the suburbs region. The central business district (CBD) and Longzi Lake are located in the new town area. Different construction period and planning concepts caused their different landscape visual effects. The pictures were sorted in pairs (1225 different combinations) as the image pool. In each questionnaire, 25 image pairs were randomly picked from the pool to simulate the competing process of different images. Fillers just need to pick a better one in the current pair and the next pair will be automatically generated subsequently by the questionnaire system. This simplified questionnaire filling process will help to retain the objectiveness of the results. After the questionnaire survey was carried out (1157 results were returned until 31 March 2018), using the questionnaire survey results, the panoramic images were scored through the Elo questionnaire system to obtain the quantitative assessment results of the landscape visual effect.

Figure 2.
Technology roadmap.

Figure 3.
Spatial distribution of sampling stations.
Then, the remote sensing estimation model of the landscape visual effect was constructed. Utilizing the Landsat 8 Operational Land Imager (OLI) images from 8 April 2017, the current land use map of Zhengzhou municipal districts in 2017 was obtained through the maximum likelihood supervised classification method that was integrated in ENVI 5.2 software. The performance of the classification was carried out using confusion matrix (the results are in Section 3.2.1). There are two reasons for choosing the image from 8 April 2017. Firstly, the questionnaire was sent and collected in 2017. Then, one important input variable of the proposed remote sensing model is vegetation proportion. This is the image with the best quality in the summer of 2017. Furthermore, the land use situation within a certain sight distance of the sampling point was obtained. In addition, the digital surface model (DSM) was extracted using the ZiYuan-3 (ZY3) stereo image pairs. To unify the spatial scale of DSM and classification image, the yielded DSM image was resampled from 4 m to 30 m through a bilinear resampling method. Before model training, the DSM data and classification image around each sample were standardized to [0, 1] using the “mapminmax” function in Matlab in order to avoid the quantity difference. Based on the assumption that the visual effect of a specific point is comprehensively affected by its surrounding landscape, the land use map and DSM within a certain visual range of the sampling point was used in the estimation model as independent variables. Finally, an artificial neural network (ANN) model was developed to estimate the landscape visual effect from those variables.
2.3. Data Acquisition and Processing
2.3.1. Acquisition of Panoramic Images
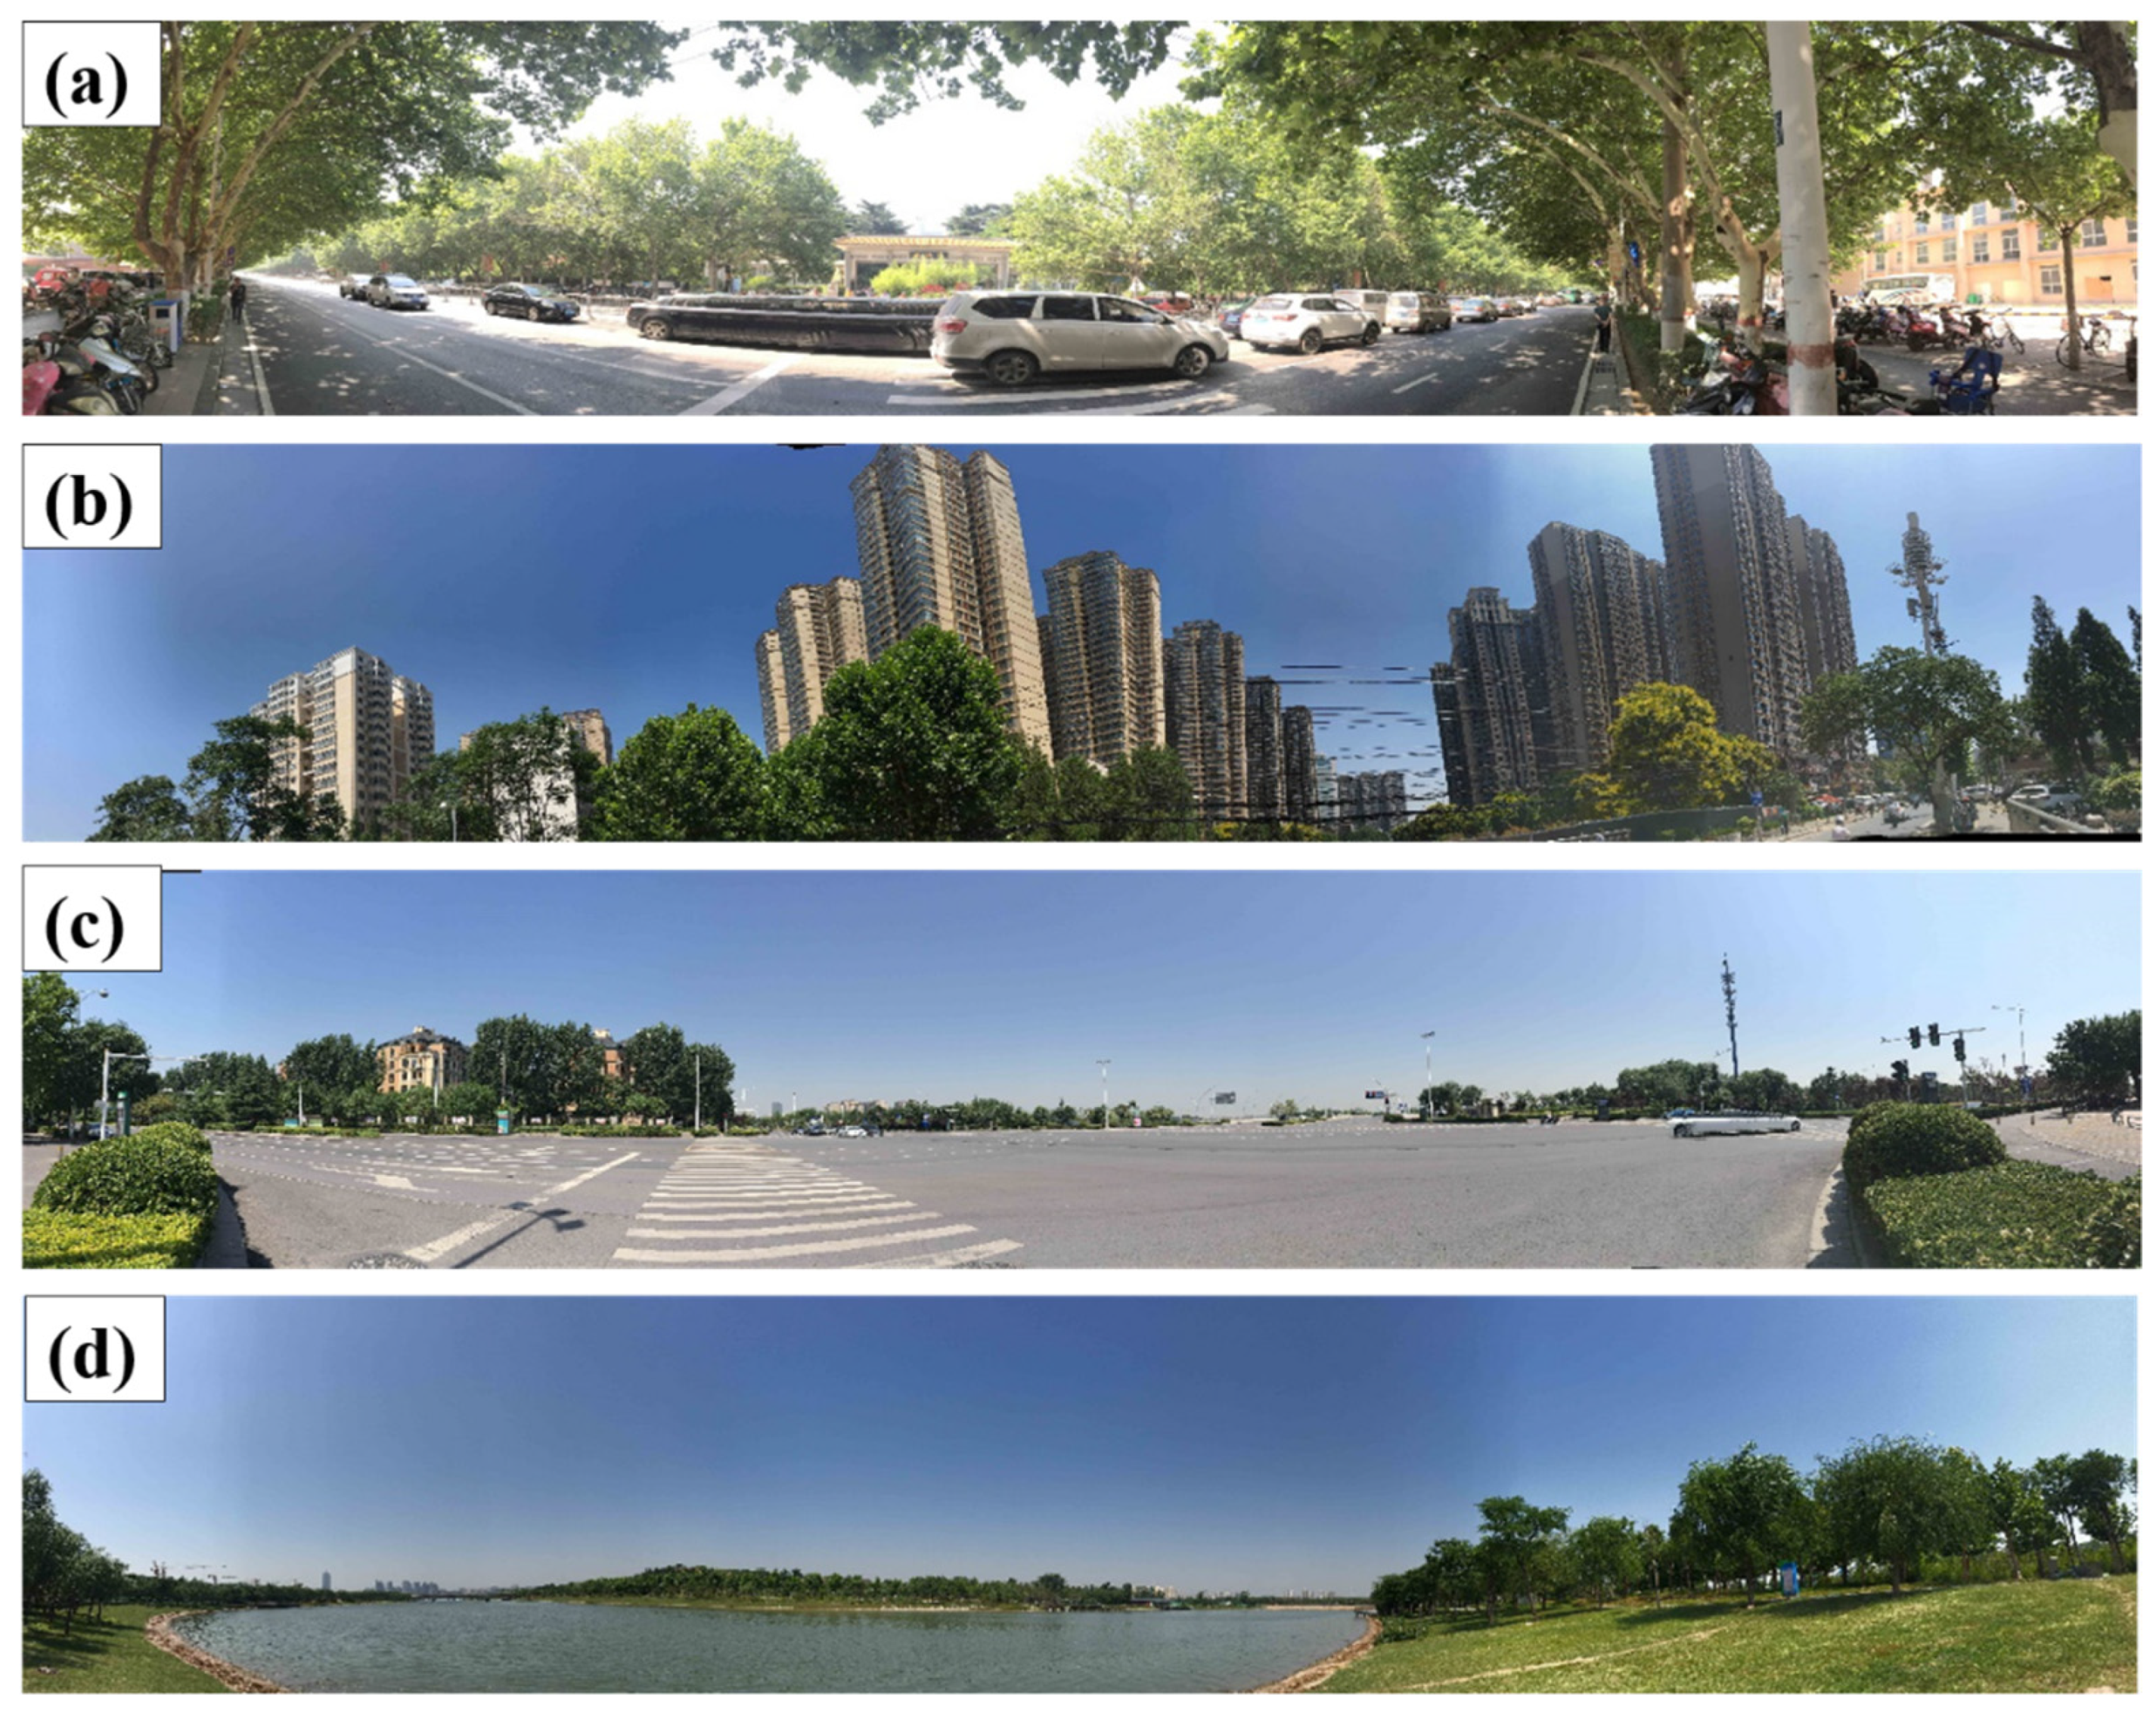
In the study, a panoramic image at each sampling point was collected to comprehensively reflect the landscape visual effect at this point. There are 50 points distributed in Zhengzhou (Figure 3) on 19 September 2017, 26 September 2017, 31 October 2017, 10 March 2018, 11 March 2018, and 17 March 2018, and they were used in training and validating the model. Furthermore, 4 independent verification samples were collected on 11 and 12 June 2018. The clearly visible faces in the photos were coded. The spatial distribution of sampling points is shown in Figure 3. In terms of spatial distribution, to ensure the representativeness of the sampling, the points traverse the urban area of Zhengzhou and are distributed in both new and old urban areas.
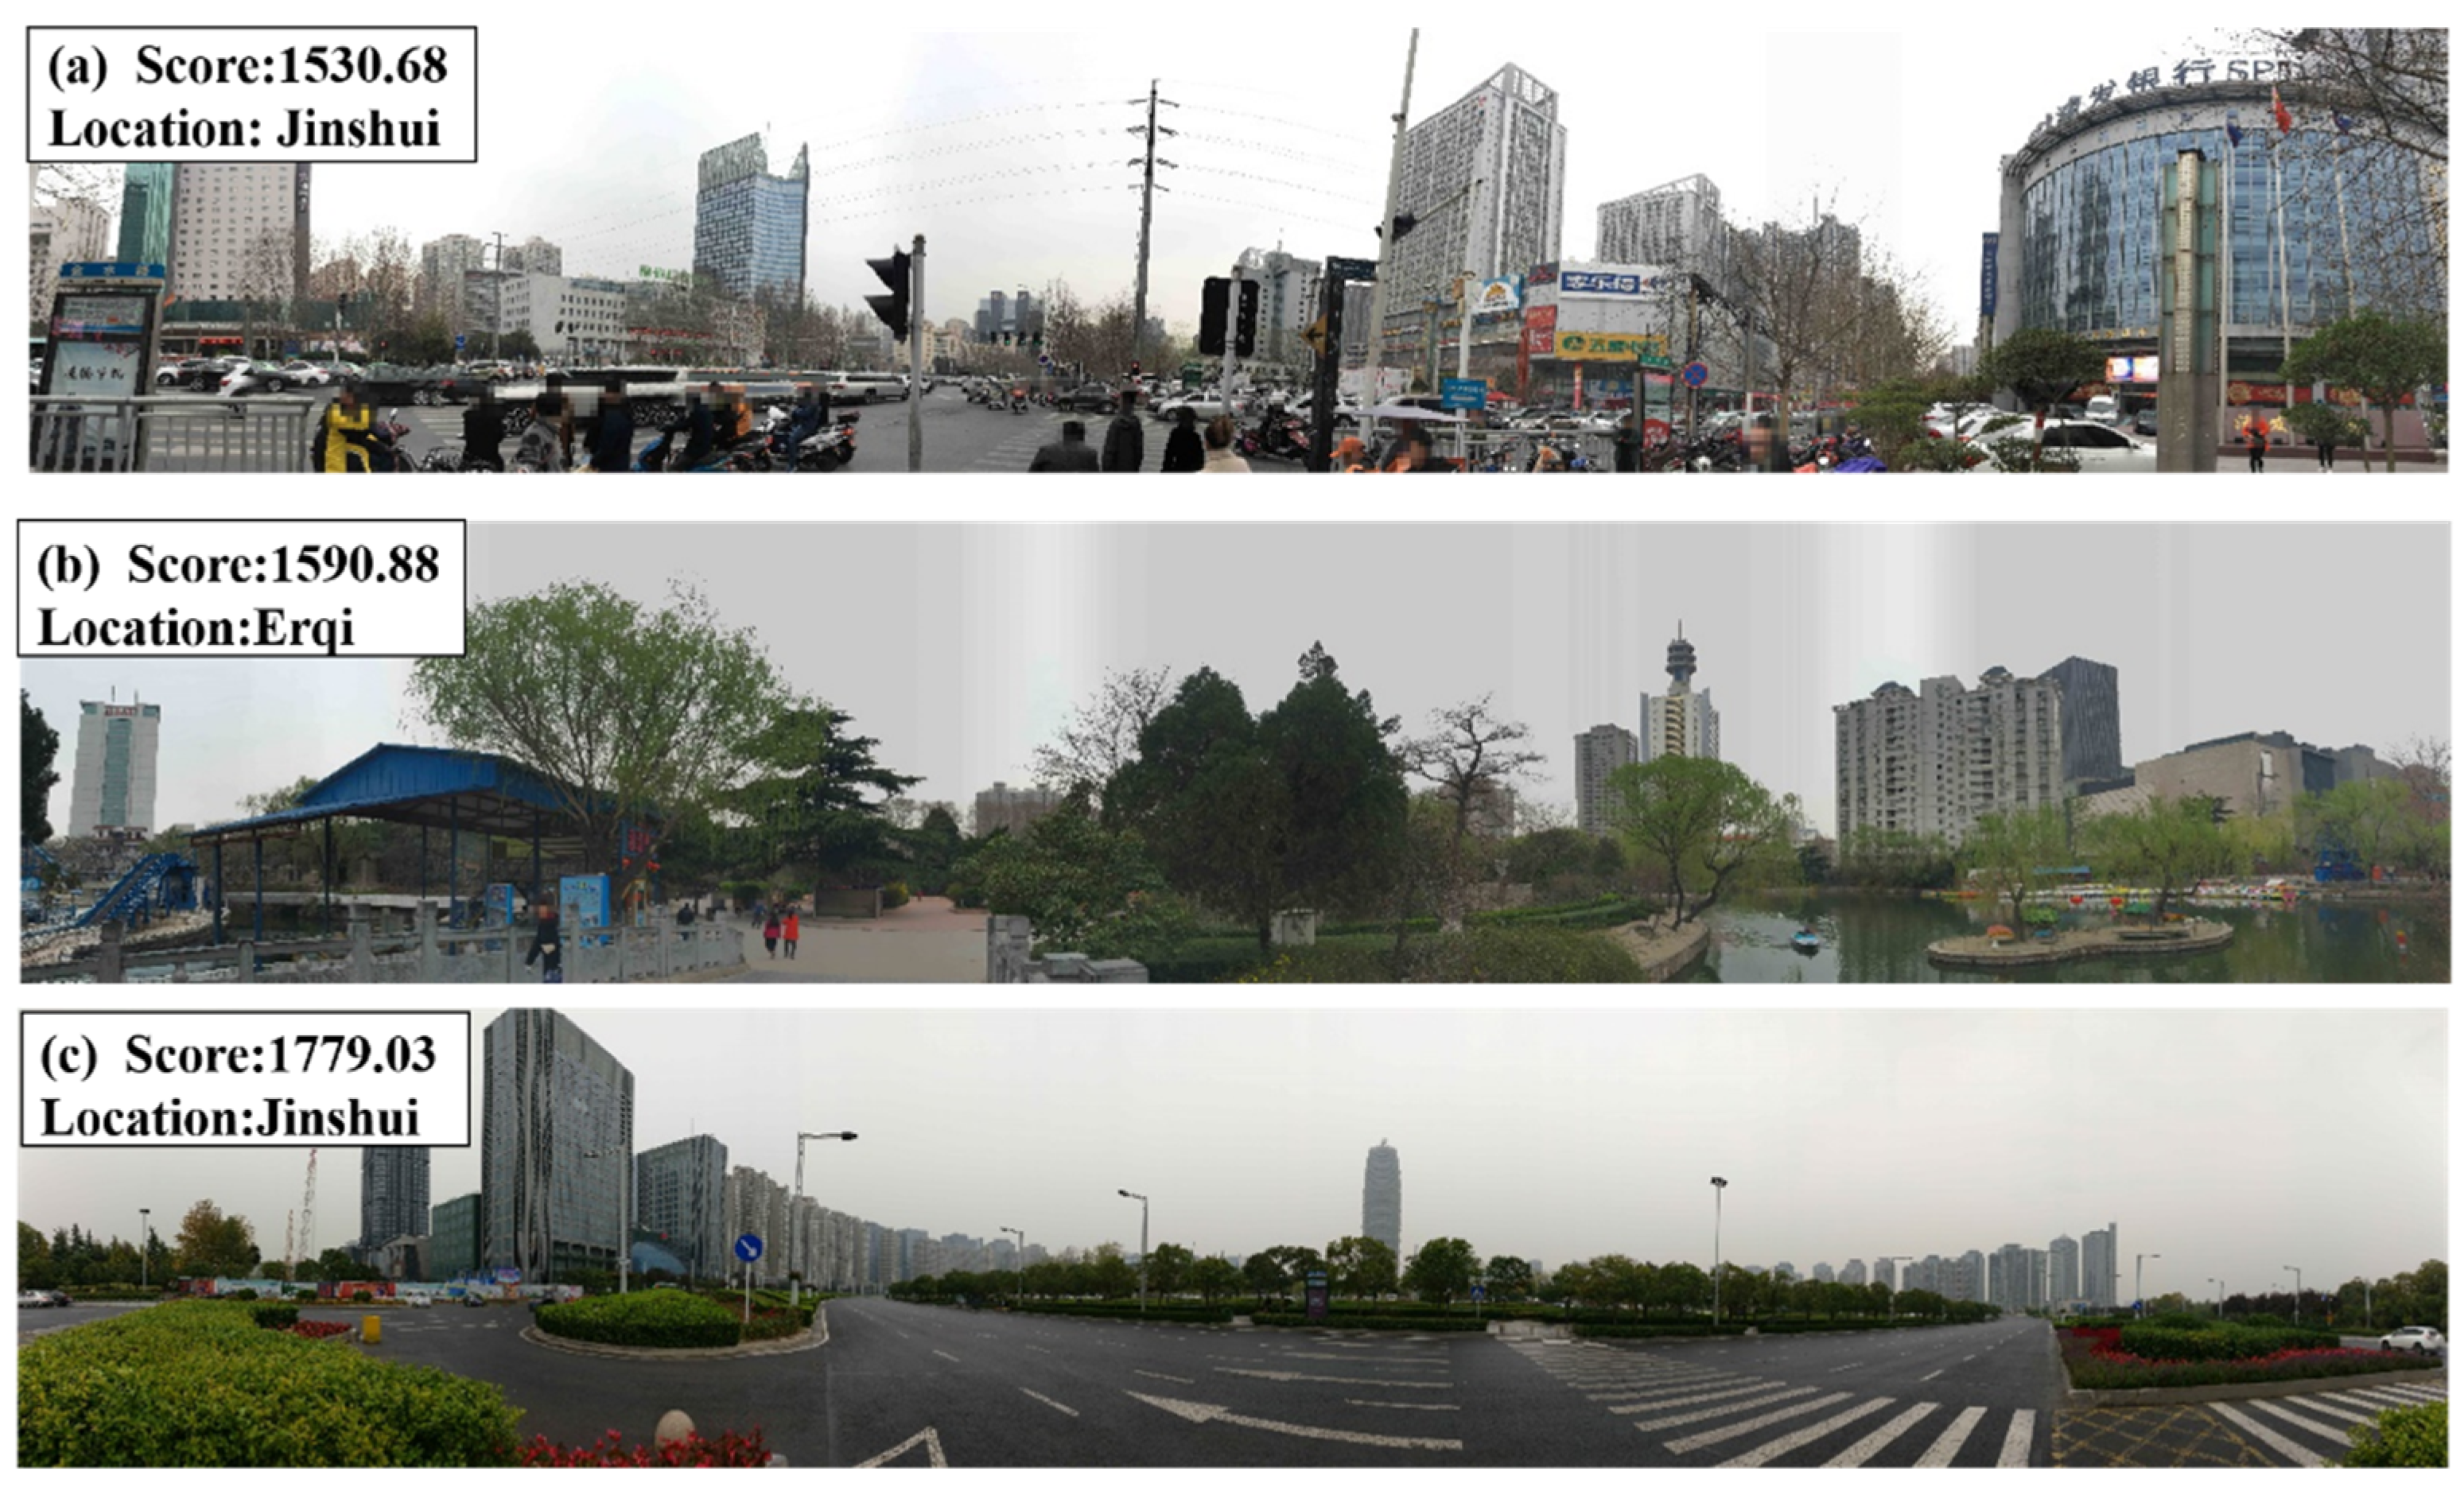
Figure 4 shows some representative images. Figure 4a was collected in the city center with dense high-rise buildings. Dominated by high-rise buildings, the view displays a small sky area. In addition, there is little green vegetation and the visual effect is poor. Figure 4b was collected from the city park surrounded by high-rise buildings. However, there is a large area of green vegetation. The sky area is large. The overall vision is effectible. Figure 4c was collected in the CBD located in a well-planned new district with spacious roads and dense vegetation. Although there are many high-rise buildings, the visible sky area is large, and the visual effect is good.

Figure 4.
Typical panoramic pictures. (a), (b), and (c) were collected in Jinshui, Erqi, and Jinshui, respectively.
To quantitatively describe sky area and vegetation area, artificial segmentation was carried out for the panoramic pictures. Additionally, proportions of sky and vegetation were calculated.
2.3.2. Landsat8 OLI Images and Classification
The Landsat8 OLI data of Zhengzhou on 8 April 2017 were selected for radiometric calibration. The Fast Line-of-sight Atmospheric Analysis of Hypercubes (FLAASH) module, integrated in the ENVI 5.1 software, was then used for atmospheric correction. Furthermore, the vector file of Zhengzhou was used to extract the mask from the remote sensing images.
Considering the classification accuracy and image characteristics, Landsat8 OLI images were divided into four types: vegetation, construction land, water, and unused land (Table 1). Google Earth was used to help identify the surface object type during samples collection. Generally, 34 vegetation samples, 30 artificial surface samples, 32 water samples, and 25 unused land samples were collected over the whole image. Then, the maximum likelihood method was used to classify the image. The majority analysis method was used to remove small fragments.

Table 1.
Typical image patches of different classes.
2.3.3. Surface Elevation Data
The DSM was extracted through ENVI 5.1 by using the front and back views of the ZY3 stereo satellite image pairs, including 450 connection points with a mean square error of 5.69 (Figure 5).
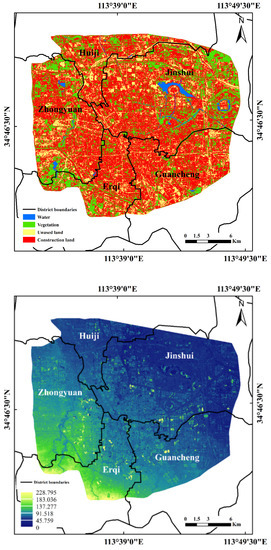
Figure 5.
Land use and DSM map of Zhengzhou city, 2017.
2.4. Elo Rating System
The Elo rating system was proposed by Arpad Elo [15,16]. It was originally used to objectively calculate the relative strength of players in a chess competition. Currently, it is widely used in the strength grading of players in various competitions. Therefore, each panoramic image was regarded as a player. After several random pairwise comparisons, all the images were finally obtained, which were the scores and ranks of different urban landscape visual effects.
The collected panoramic images of 50 points were traversed by comparing the images one by one. A total of 1225 questions were obtained as the question bank. For each questionnaire, 25 questions were randomly selected. The options for each question were set as follows: the first image has a better visual effect, the second image has a better visual effect, and equally good. The person who fills in the questionnaire only needs to choose one of the three options.
The questionnaire results were calculated through the Elo rating system. The specific equation is as follows:
where RA and RB are the scores of two images involved in the comparison (the initial score is 1600). SA represents the actual winning and losing value, where win = 1 point, draw = 0.5 point, and lose = 0 points. EA and EB are the winning rate of two images (the initial winning rate is 0.5). R’A is the updated score. Additionally, K indicates the impact of a single comparison on the score. In order to increase the discrimination of different images, 64 is taken as the K value in this study. The questionnaire only provided the total votes for each image. Hence, the comparison of each image pair was simulated each time through random allocation and then scored with Equations (1)–(3).
2.5. Remote Sensing Model of the Landscape Visual Effect
Considering previous studies, land use type, and the height of surface, objects within a certain distance around each pixel point were chosen to be the factors that affect the landscape visual effect. Therefore, within a certain distance, the area proportion of different land use types and the average elevation were used as the variables associated with visual effect scores to build the model. First, the area within 510 m (17 pixels on the image) around each pixel point was considered to be the main range that affects the visual effect of the point. The proportions of four land use types around the sampling points were extracted as four independent variables of the model. Meanwhile, the average elevation within 500 m around the sampling point was extracted as the other independent variable of the model. The visual effect rating results were used as dependent variable of the model.
Theoretically, the landscape factors (such as vegetation, water, openness, etc.) affect the visual effect in a complex way. Therefore, it is not reasonable to establish the relationship of landscape visual effect with the selected remote sensing factors through simple linear fitting. Hence, the ANN model was utilized to build the nonlinear corresponding relationship, to construct the visual effect model. Through a series of simple linear transformations combined with nonlinear transformations, the ANN obtains a network structure that can accurately express dependent variables through error reverse transmission and rapid training [18,19]. This made ANN performed well in certain linear indivisible issues [20,21,22,23,24].
2.6. Model Accuracy Assessment
Mean absolute percentage error (MAPE) and root mean square error (RMSE) were used to evaluate the error between the landscape visual effect score estimated by the model and the image rating results. The equation is as follows:
where yi and yi’ represent the landscape visual effect obtained by image rating and model estimation, respectively, and n represents the number of samples.
3. Results and Analysis
3.1. Elo System Rating Results
After 1 week of questionnaire statistics, 1157 questionnaires were collected, of which 854 were valid. A total of 21,350 answers were collected. In all the effective questionnaires, 69.77% were from Henan province, with 49.48% from male and 50.52% from female. The questionnaire results were randomly arranged, and the quantitative scores were obtained by the Elo rating system. The scores of different sampling areas are shown in Table 2.
Table 2.
The visual effect scores of different sampling areas.
Table 2 illustrates that the average score of visual effect in Zhengdong New District where CBD and Longzi Lake are located is significantly higher than that in other areas, which is consistent with the actual situation of high greening rate and dense rivers and lakes in Zhengdong New District. The visual effect near Henan Agricultural University is also good. These regions are away from city center and the high-rise buildings are not too dense. Jinshui River is located along the city center with a dense distribution of high-rise buildings. Therefore, its score is low. In the sampling season, the water level in Xiliu Lake Park recedes and the vegetation does not grow. Consequently, its score is also poor. The North Third Ring Road is the area with the worst score, which may be closely related to the surrounding high-density viaducts and high-rise buildings.
In the results, there are three panoramic images with a substantial amount of vegetation and waters nearby. However, the overall image looks dark due to the light problem in the photography process, which affects the overall impression. That abnormal information will be introduced into the model, resulting in unnecessary errors. Therefore, these three samples were removed during visual effect modeling; the remaining 47 sampling points were analyzed in the model.
3.2. Visual Effect Remote Sensing Model Result
3.2.1. Land Use Status and Surface Elevation
The current land use situation of the Zhengzhou urban area in 2017 is mainly built-up land (red points in Figure 5). The vegetation and waters are mainly distributed at the edge of the urban area, whereas the unused land is scattered in the city. The vegetation in the urban area is mainly concentrated in parks (such as People’s Park, Zijing Mountain Park, Xiliu Lake Park, Cultural Park, and the Zoo), CBD, and Longzi Lake. The waters in the urban area are mainly concentrated in Ruyi Lake, Beilong Lake, and Longzi Lake in the CBD of Zhengdong New District, Dongfeng Canal in the north, and Jinshui River in the south. Unused land refers to the land to be developed after demolition and land leveling. The classification accuracy was verified by independently selected points. The confusion matrix is shown in Table 3.
Table 3.
The confusion matrix of classification.
The overall elevation of Zhengzhou is below 45 m. The terrain is high in the southwest and gradually becomes lower in the northeast. High-rise buildings (scattered high-value areas in the image) gather at the junction of five districts (old urban area). Further, there is a small gathering area in the east of the urban area (Zhengdong New District). Some elevation maps in the north of the urban area are missing because they were affected by the imaging range.
3.2.2. Visual Effect Modeling Results
The proportion of 4 surface object types and average DSM value within 500 m around 47 sampling points (Figure 3) were taken as the x, while the final visual effect score of 47 panoramic images was taken as y to determine the weightings of each node in the ANN. The transfer function of the first hierarchy network set to TANSIG. The number of neurons was set to 10. The transfer function of the second hierarchy network was set to PURELIN. The training parameter min_grad was set to 1×10⁻¹⁰, while max_fail was set to 10. The nftool in Matlab was used to define and train the network. A total 32 samples were randomly selected for network training, i.e., model construction. The other 15 samples were used for model validation.
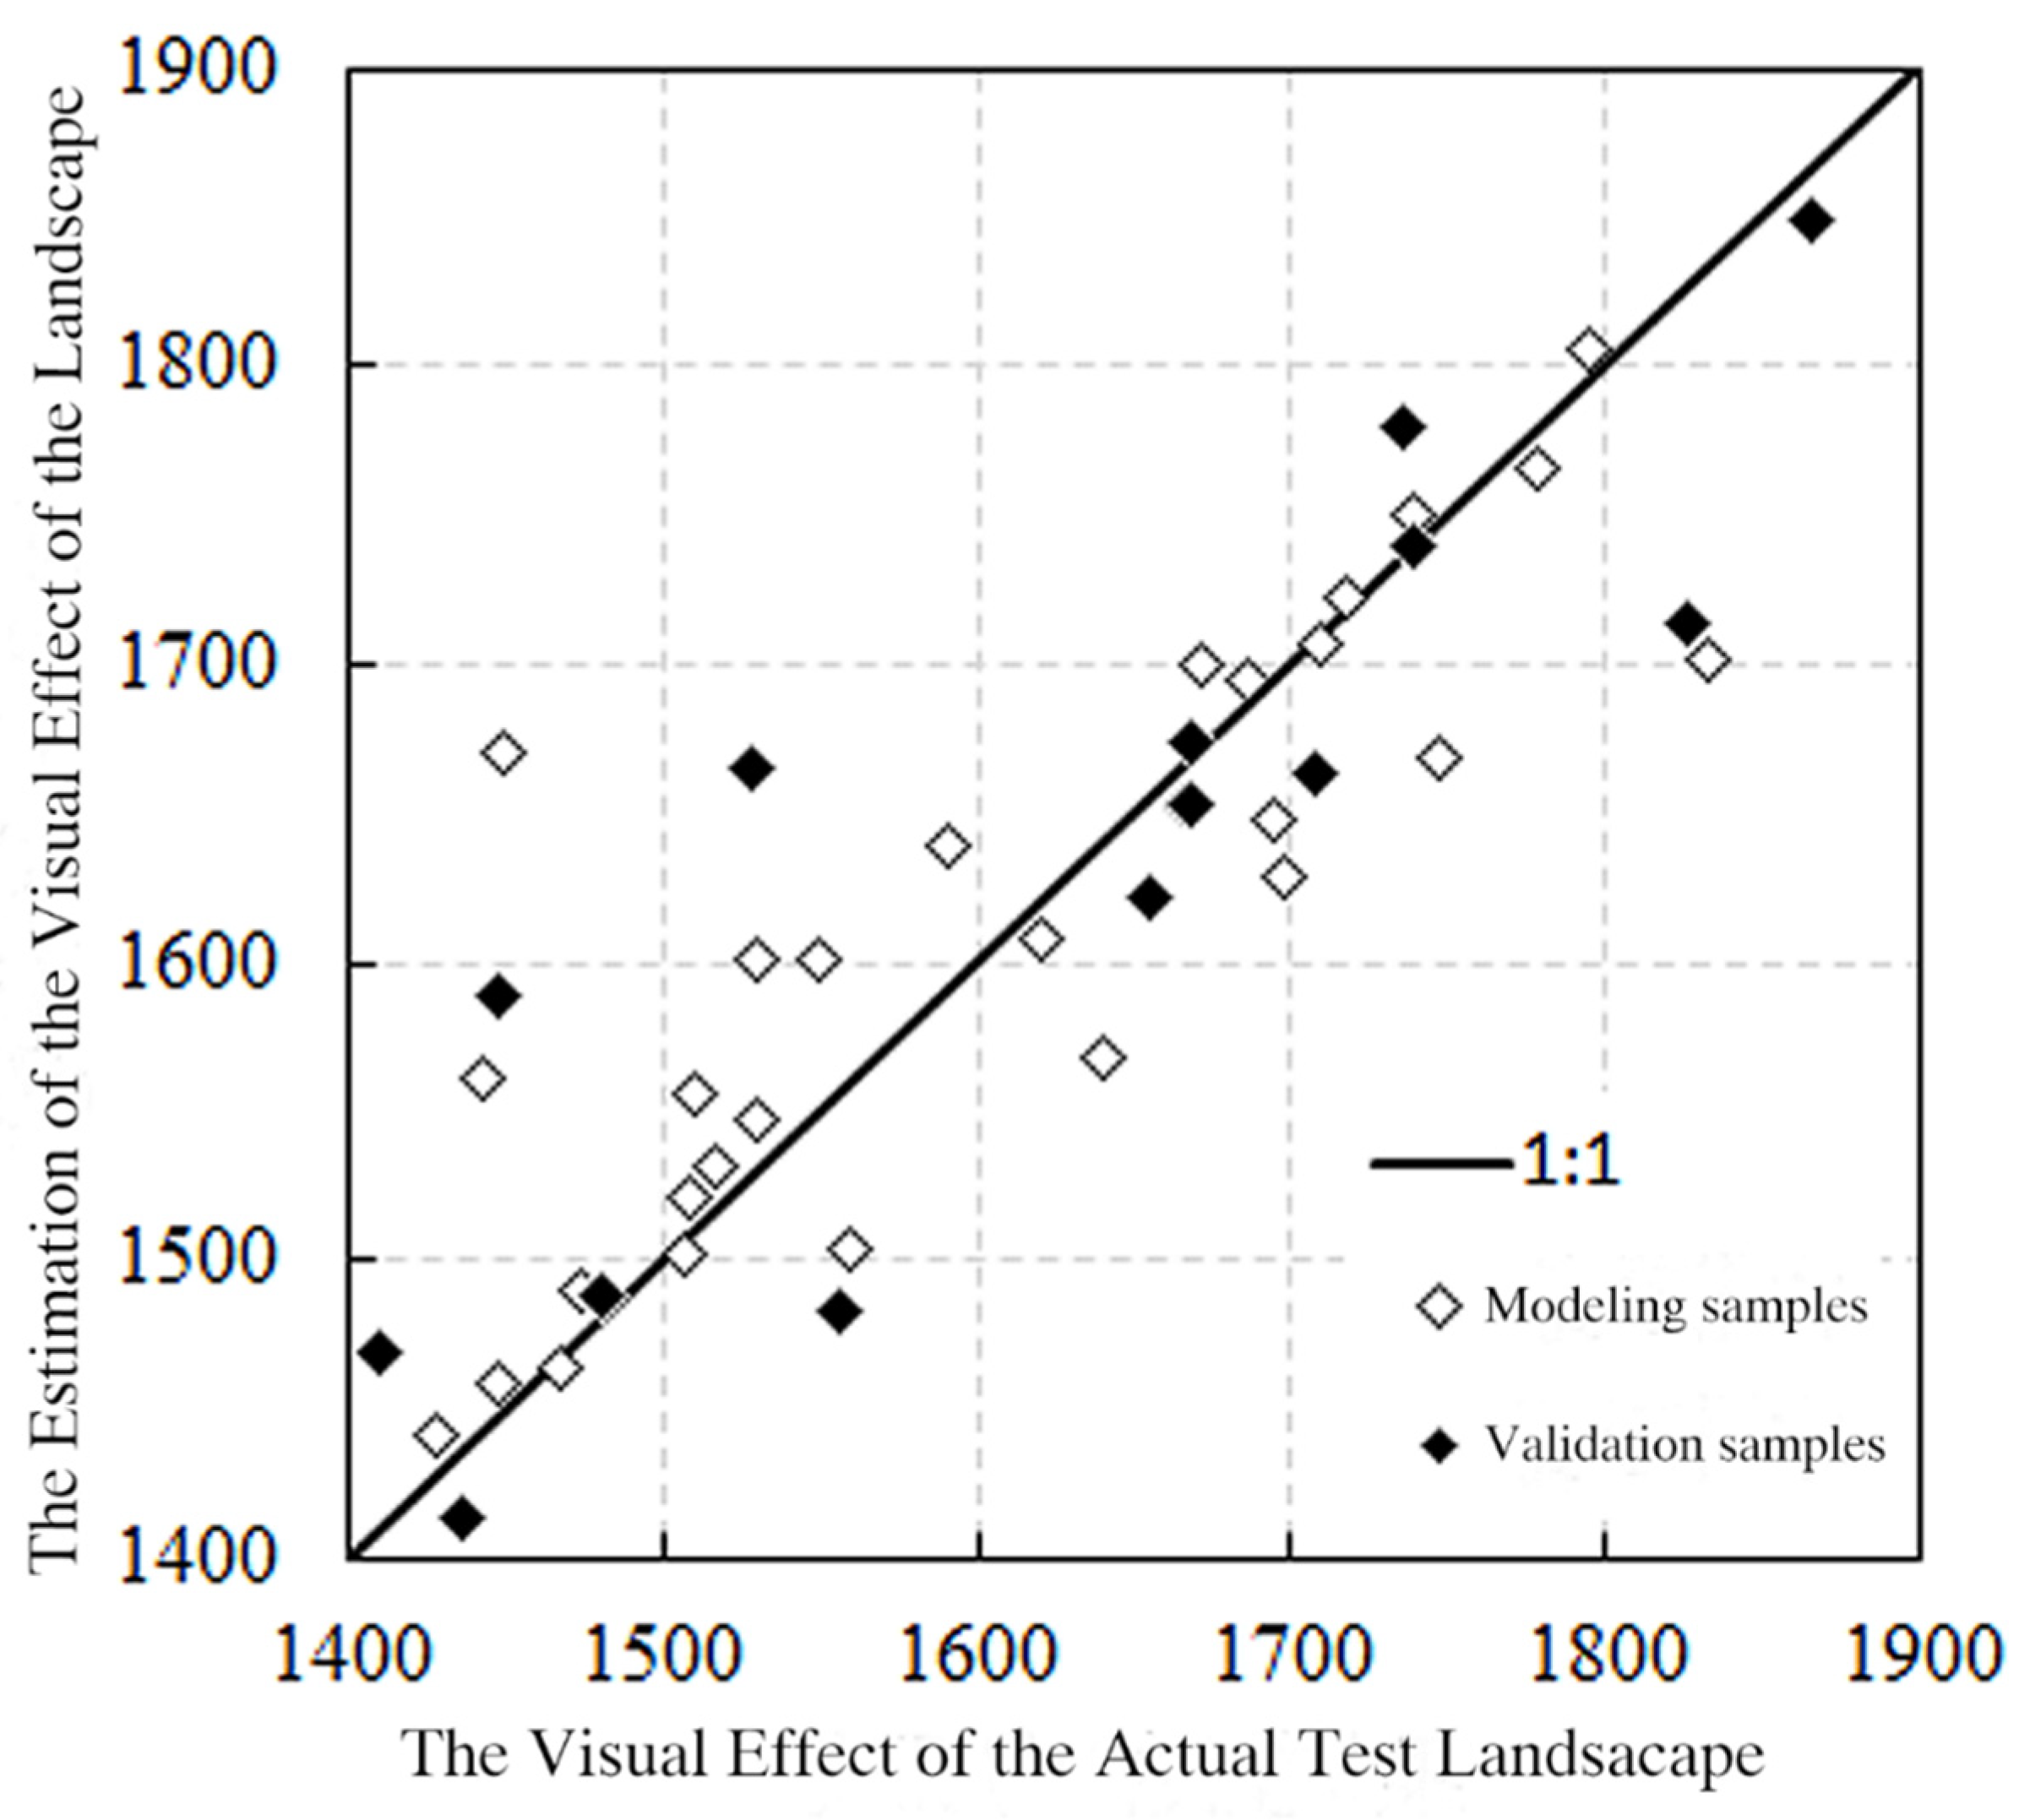
The fitting results were shown in Figure 6. Both modeling sample and validation sample are evenly distributed near the 1:1 line. The MAPE indices of the modeling sample and the validation sample were 0.0293 and 0.0301, respectively; the RMSE indices of those samples were 73.528 and 64.155, respectively. This indicates that the constructed remote sensing estimation model not only can accurately estimate the landscape visual effect at the sampling point, but it can also accurately describe the landscape visual effect within the current range of values.

Figure 6.
Scatter plot of landscape visual remote sensing model.
3.2.3. Visual Effect Estimation Results
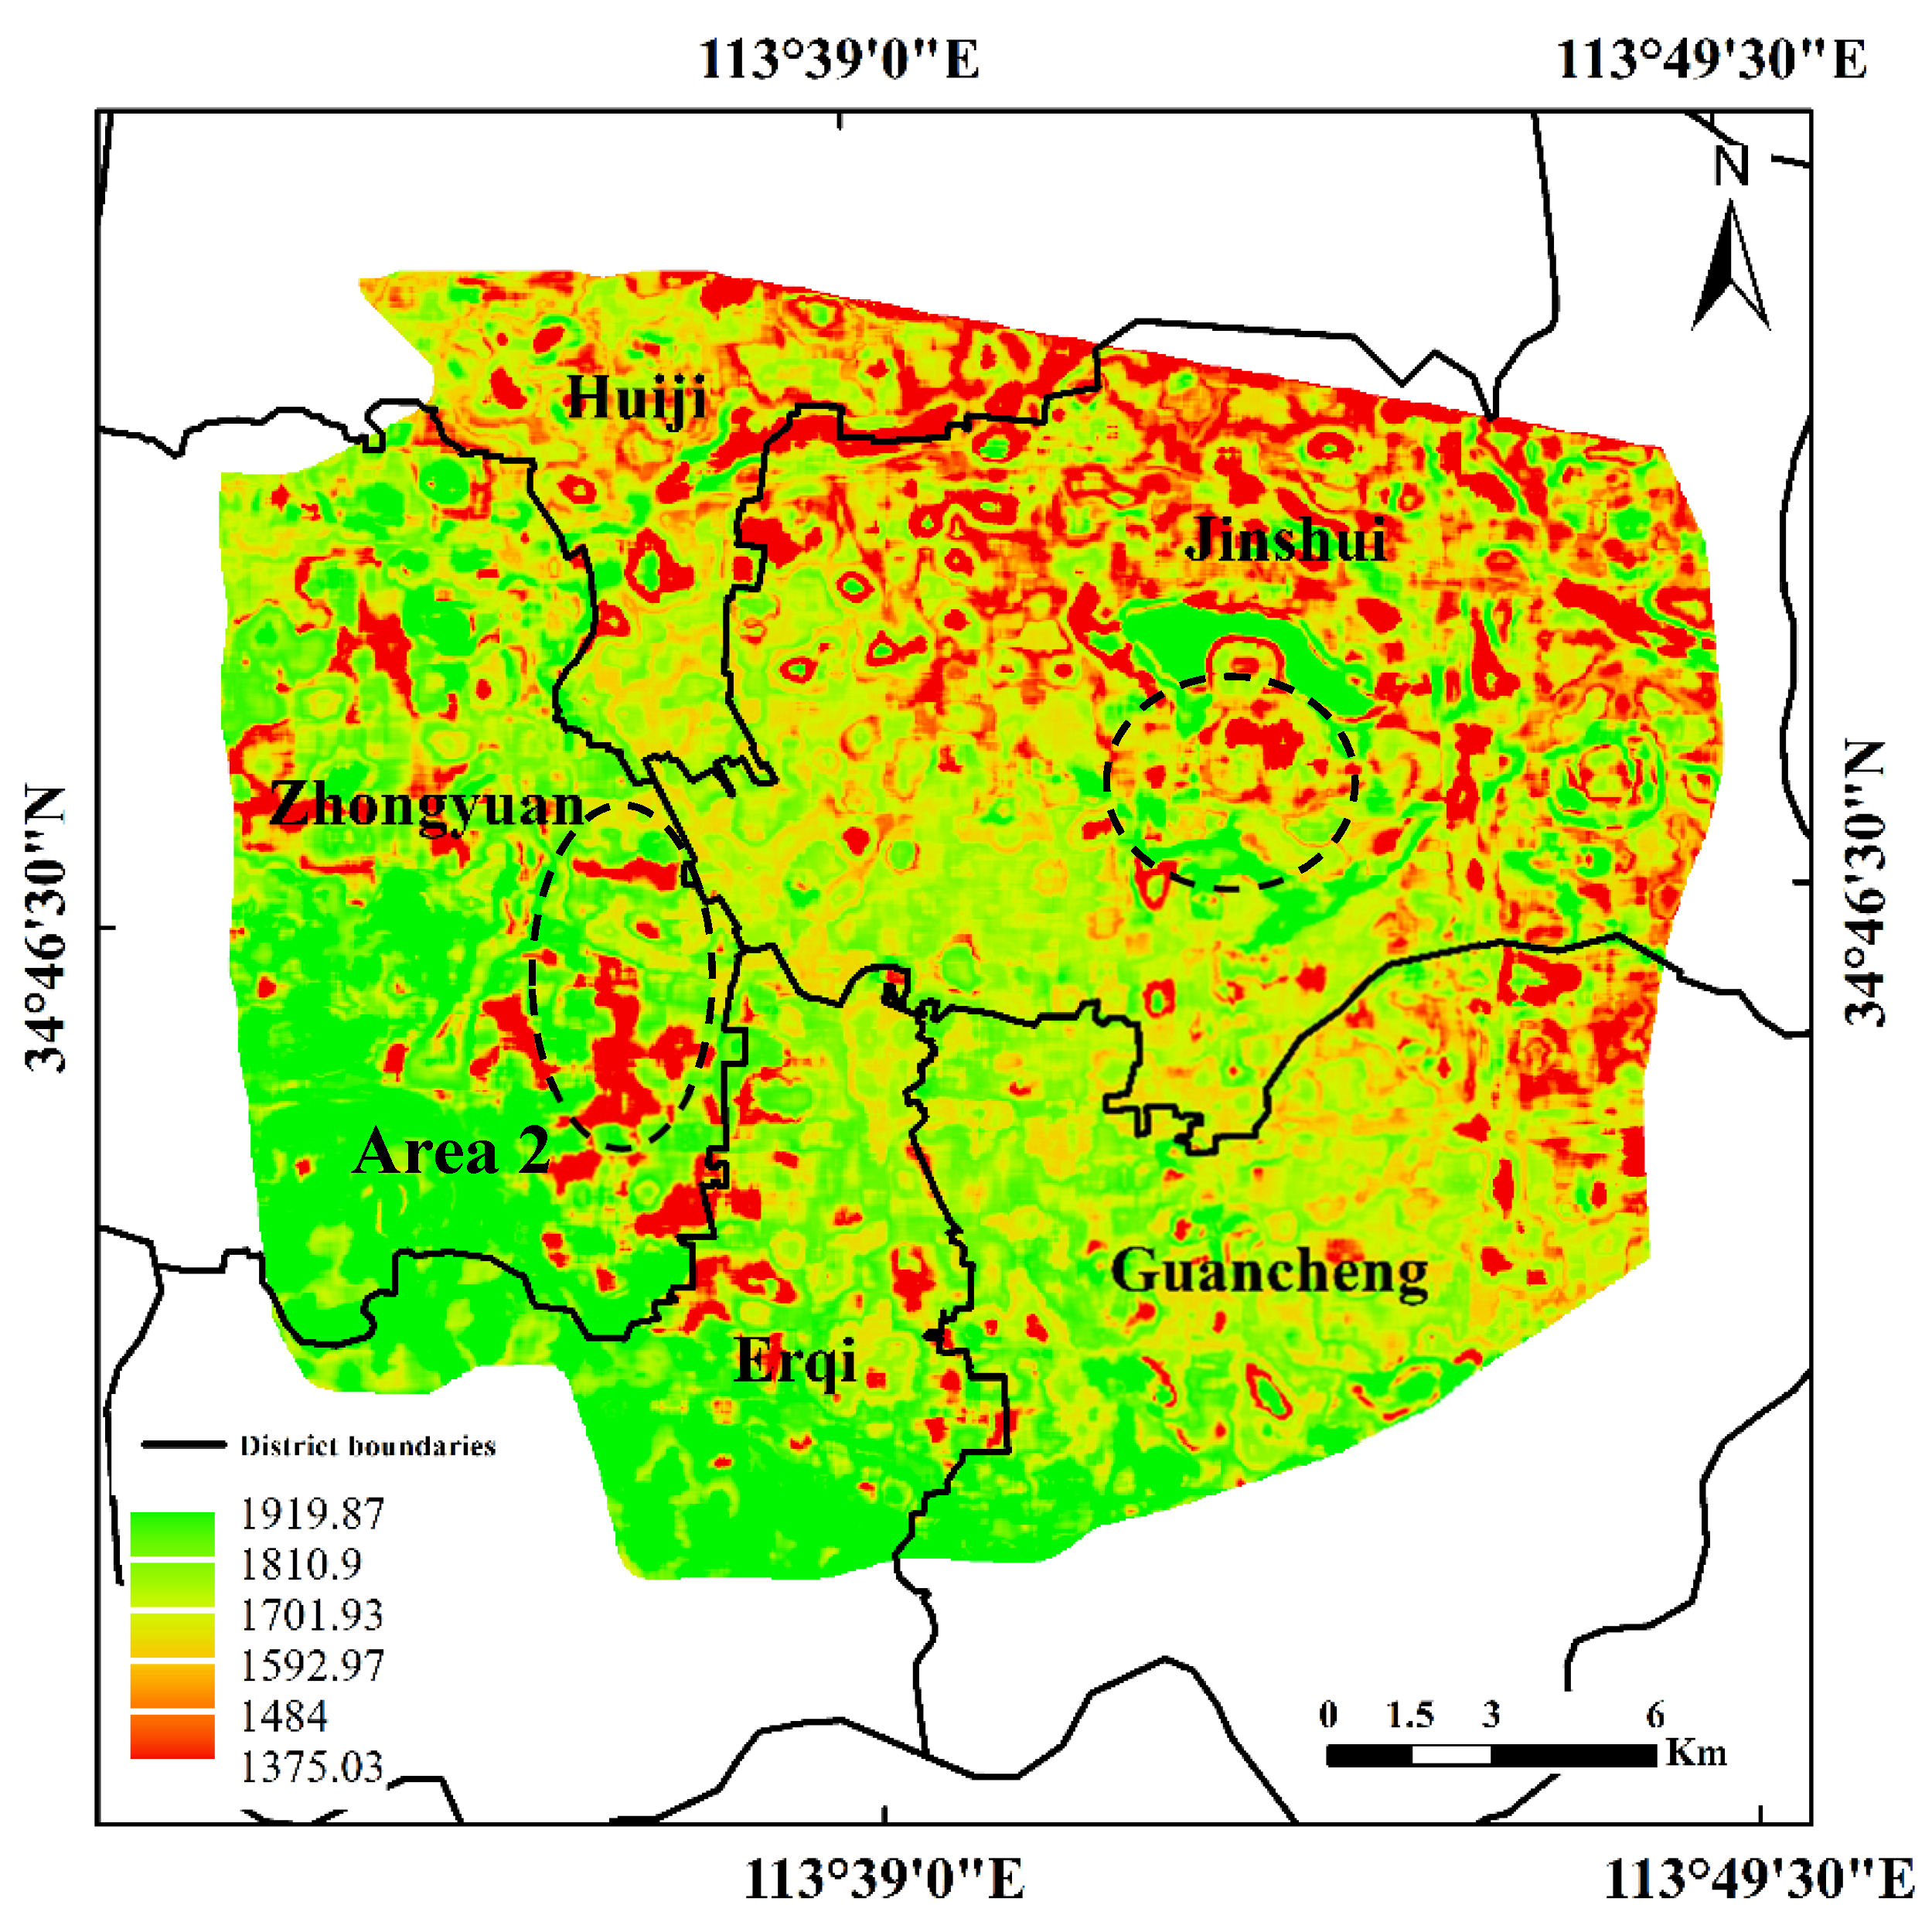
The constructed neural network model was applied to the remote sensing images from 2017. The results are shown in Figure 7. The basic score is 1600. The higher the score, the better the visual effect, vice versa.

Figure 7.
The landscape visual effect of Zhengzhou city, 2017.
Figure 7 shows that the landscape visual effects in the west, south, and east of Zhengzhou in 2017 were good, whereas that in the north of Erqi District, the east of Zhongyuan District, the northeast of Guancheng District, most of Jinshui District, and Huiji District was poor. The landscape visual effect in most areas of Jinshui District was especially poor. Jinshui District is the administrative district with the highest economic level and the highest density of high-rise buildings in Zhengzhou. There are mountains and waters in the south of Erqi District with dense vegetation and water bodies; hence, its visual effect is the best. The elevation value of the southwest of Zhongyuan District is low. There are no dense high-rise buildings, so people do not feel repressed. The visual effect is also good. Moreover, as representatives of the new district construction, Beilong Lake and CBD area (Area 1 in Figure 7) in Jinshui District achieved a high greening rate, dense water bodies, spacious roads, and appropriate building density at the beginning of planning. Therefore, they also obtained good visual effect.
As for the whole city of Zhengzhou, the visual effect in the southwest is good, while that in the northeast is poor. However, there is one significant high value area: Area 1, in the middle of Jinshui District. There is one significant low value area: Area 2, at the junction of Zhongyuan District and Erqi District. To further verify the actual visual effect of those abnormal areas, two sampling points were selected for verification in these two areas. The point distribution is shown in Figure 3.
3.2.4. Verification of the Method
As shown in Section 3.2.3, the overall spatial distribution of visual effect in Zhengzhou, 2017, is reasonable. However, in the two marked areas in Figure 7, visual effect seems changing dramatically. In order to verify the authenticity of the visual effect estimation results, four panoramic images (green points in Figure 3) were collected in the Long Lake area (Area 1 in Figure 7) of Jinshui District and in the Bishagang area (Area 2 in Figure 7) of Erqi District. The results are shown in Figure 8.

Figure 8.
Validation pictures of typical areas. (a), (b), (c), and (d) were collected in Bishagang, Ruhe Road, East Dongfeng Road, and Soccer Park, respectively.
Figure 8a was collected at Bishagang (Area 2 in Figure 7) on East Jianshe Road. The surrounding density is large, but the heights of buildings are low. Green vegetation makes people feel comfortable. The landscape visual effect score is 1919.87 at this point. From the score and landscape status, this sampling point is representative in this area (southwest high value area). Figure 8b was collected along the Jinshui River on Ruhe Road (Area 2 in Figure 7). This point is adjacent to the Jinshui River and has a substantial vegetation. However, the high and dense buildings suppress the visual perception, leading to the visual effect estimation value of 1379.38 at this point. Therefore, the low value area in Area 2 is mainly caused by high-rise buildings blocking the visible sky area. Figure 8c was collected on East Dongfeng Road and Zhongyi Road (Area 1 in Figure 7). Within the visual range of this point, there are spacious roads, low building height, substantial green vegetation, and a large visible sky area. However, the color effect is relatively poor, with a large number of artificial surfaces. As a result, the visual effect score is 1537.33 at this point. From the score and landscape status, this sampling point is well representative in the area (east low value area). Additionally, Figure 8d was collected in the Soccer Park located outside the central island of Beilong Lake (Area 1). There is a wide water surface, dense vegetation, and a large visible sky area. In addition, the artificial impervious surface has a small surface area and a good color scheme, making the visual effect good, and leading to the score of 1919.87. Therefore, the high value area in Area 1 is mainly due to urban waters and surface greening.
Through the collection of field panoramic images, the landscape visual effect estimation results were compared. The estimation results can accurately determine visual effect, which is suitable for the rapid analysis of the urban landscape visual effect on a large spatial scale.
4. Discussion
4.1. Visual Effect Simulation
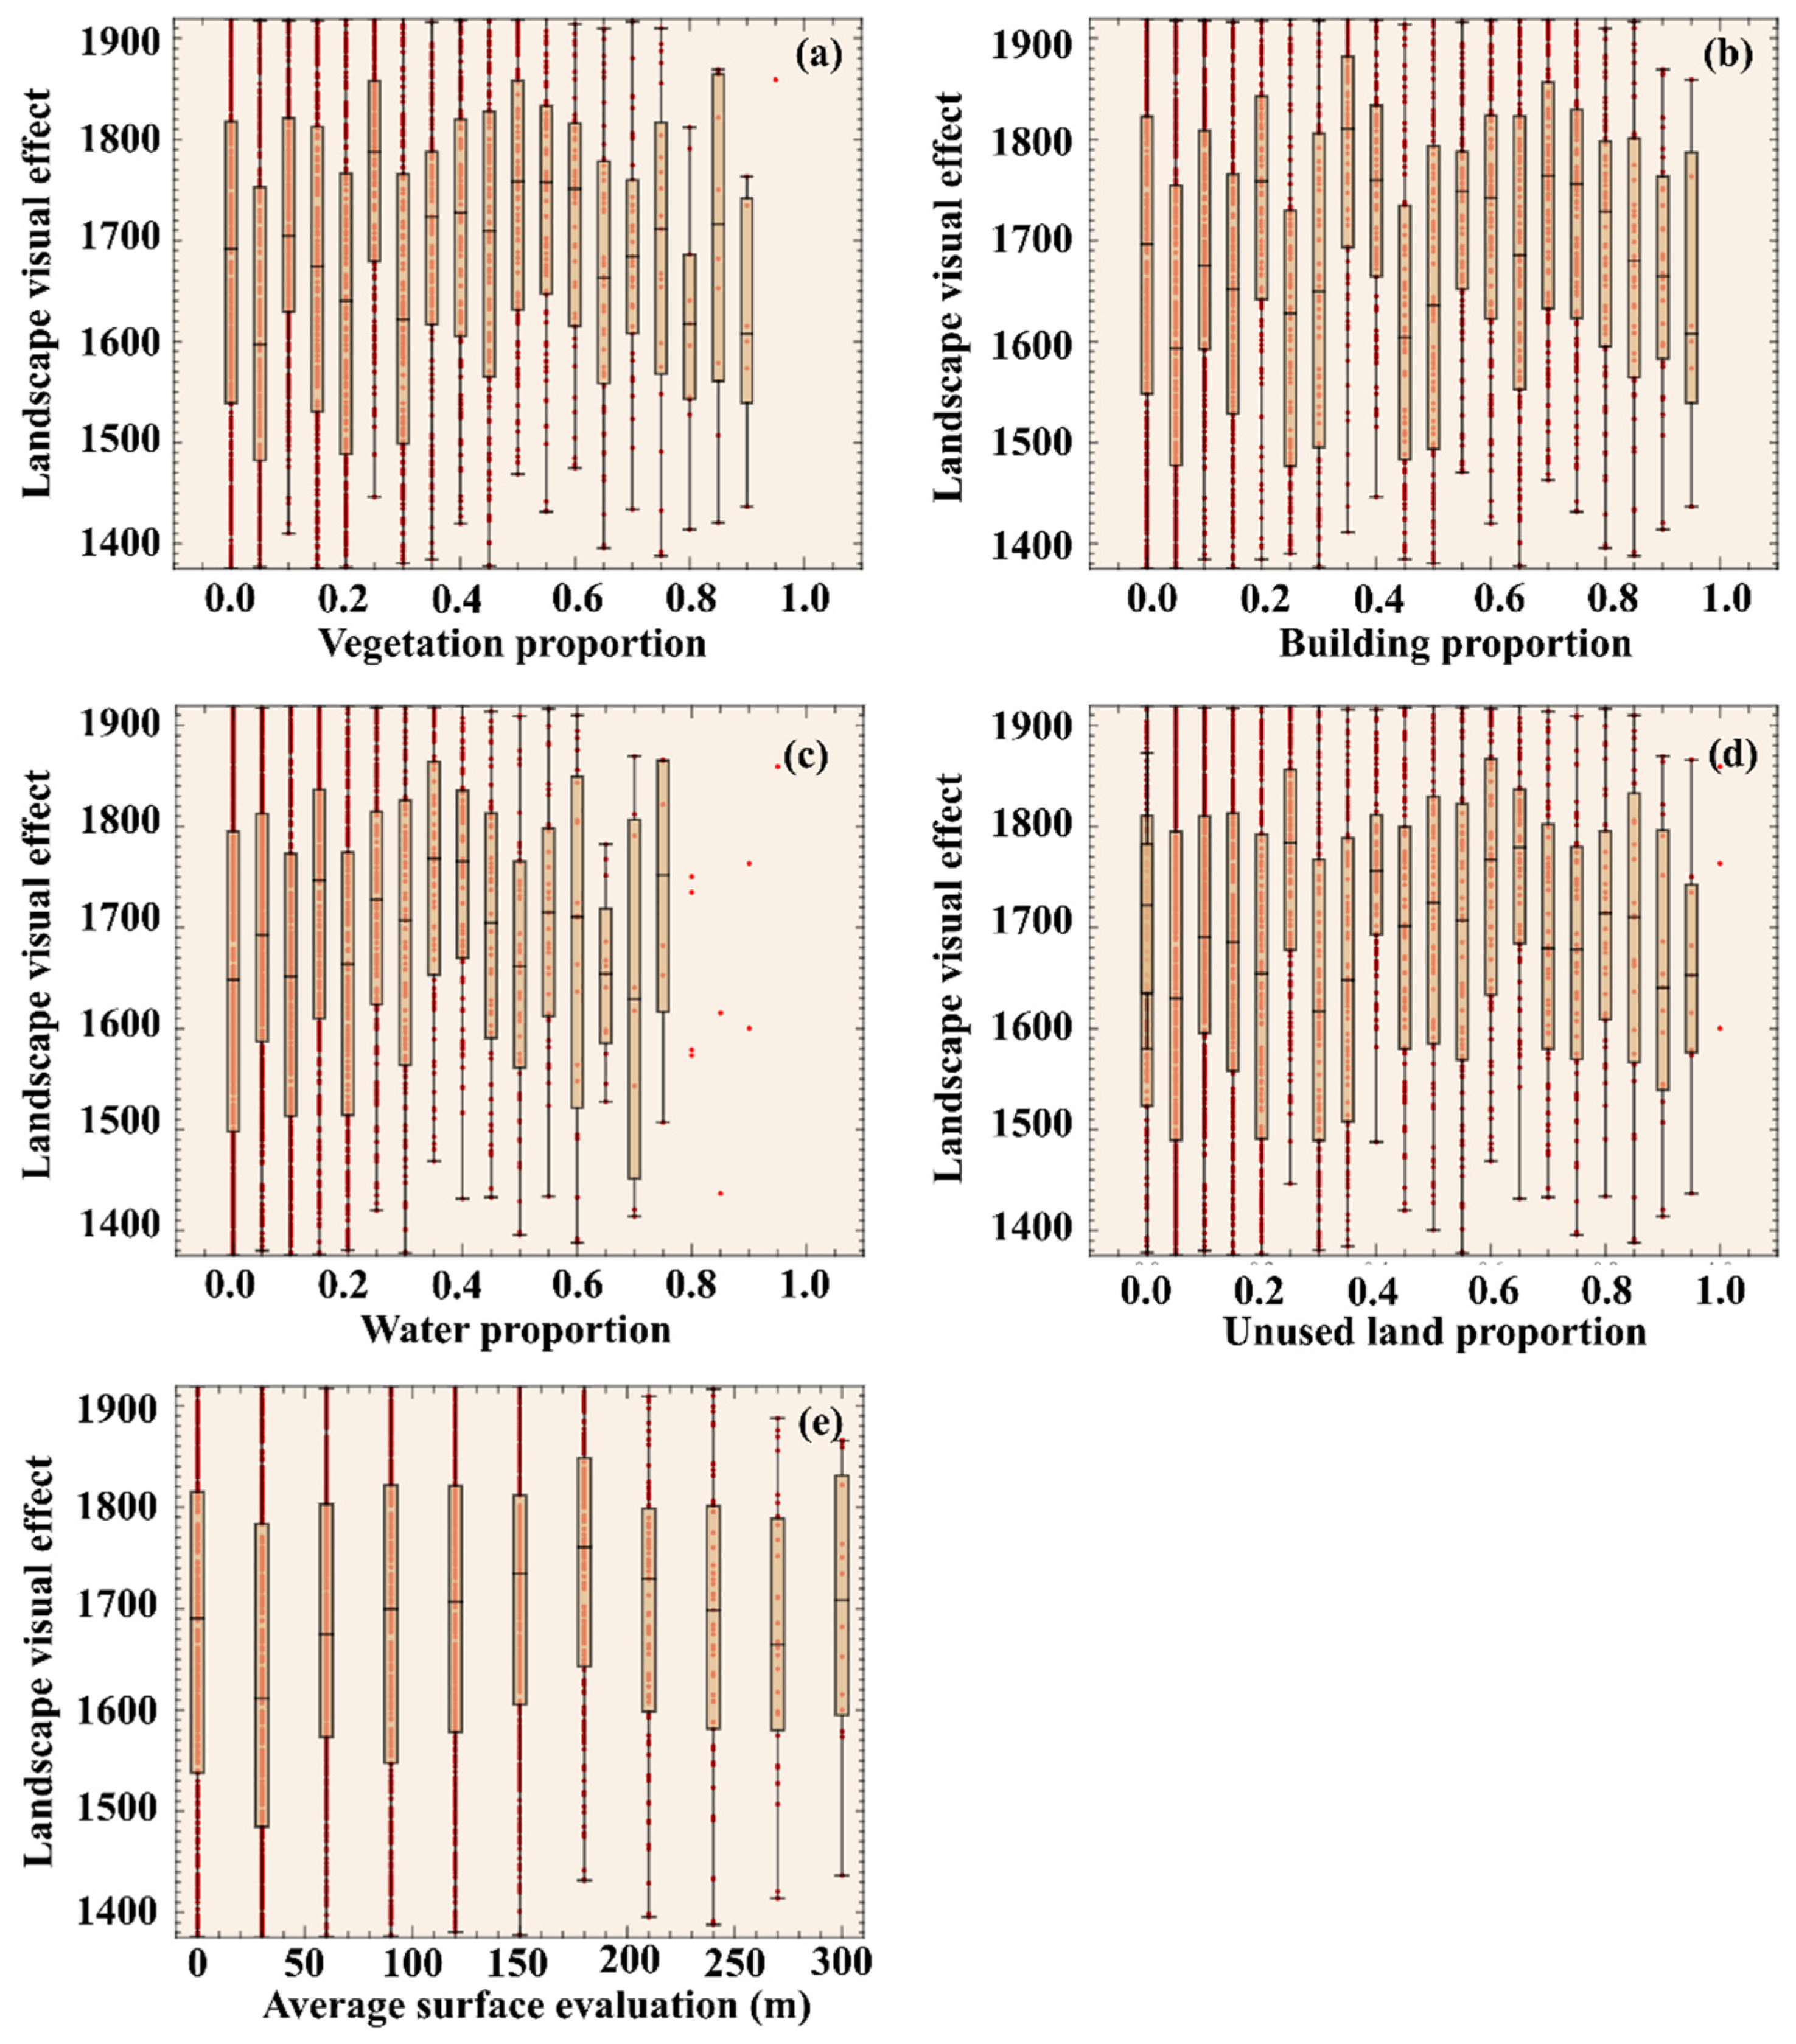
Differently from previous studies, our proposed visual effect assessment scheme yields a remote sensing estimation model. The model showed satisfactory performance in our study area in the previous section. Therefore, beyond estimation of the existing sample points, the model could also perform prediction/simulation and reveal potential laws outside of the sampling points. In order to further explore the impact of different land use types and surface object elevations on the visual effect of urban landscape, a simulation was carried out based on the trained ANN model. In the simulation, the proportion of different land types and elevations were input into the model to calculate their corresponding visual effect scores. The proportion of single land type ranges from 0 to 0.95 with a step size of 0.05, constrained by the sum of all land types being 1. Finally, box diagrams of different land type proportion, surface object elevation, and visual effect score were plotted (Figure 9). Because the actual landscape visual effect rating value is between 1375.03 and 1919.87, only the visual effect scores in this interval was analyzed.

Figure 9.
Box plots of 5 factors with landscape visual effect. (a), (b), (c), (d), and (e) are the simulated relationships between landscape visual effect with vegetation proportion, building proportion, water proportion, unused land proportion, and average surface evaluation, respectively.
Figure 9 shows that, on the whole, the simulation points are few when the value of a certain element is too high (the land proportion is close to 1 and the elevation is close to 300). This is mainly because in this situation, the sample number will be greatly reduced according to the restriction where the total proportion of all land types is 1. Therefore, the simulation results with good statistical characteristics are concentrated below the proportion of 0.8 and the elevation of 250. First of all, the visual effect score trend does not show monotonic change, thus indicating that the impact of various elements on the visual effect is very complex. Separately, the vegetation proportion and landscape visual effect display one significant peak. When the vegetation proportion reaches 0.5, the overall visual effect is good. With the further increase in vegetation proportion, the visual effect becomes poor. This may be because the urban vegetation is mostly tall trees in the green belt, which will cover the sky and affect the visual width if their proportion is too high. Meanwhile, when the vegetation proportion is less than 0.4, the visual effect fluctuates significantly, yet the overall score is not high. The relationship between building proportion and visual effect shows two peaks. The first appears when the building proportion is 0.35 and the second peak appears when the building proportion is 0.7. The visual effect continues to decline as the building proportion further rises. The possible reason is the same as vegetation, where too many buildings will cover the sky and cause a certain degree of psychological oppression. The relationship between water proportion and visual effect shows one significant peak. When the water proportion reaches 0.35, the overall visual effect is the best. Additionally, there is an upward trend after the water area is greater than 0.5. When the unused land proportion increases from 0.3 to 0.6, the overall number of landscape visual effect appears to peak at 0.6, and then drop as the unused land proportion continues to increase. Finally, the average surface elevation also displays the characteristics of single peak. The peak appears at 180 m. With the continuous increase in average elevation, the overall landscape visual effect shows a downward trend.
4.2. Effect of Typical Landscape Proportions in the Pictures to Visual Effect Scores
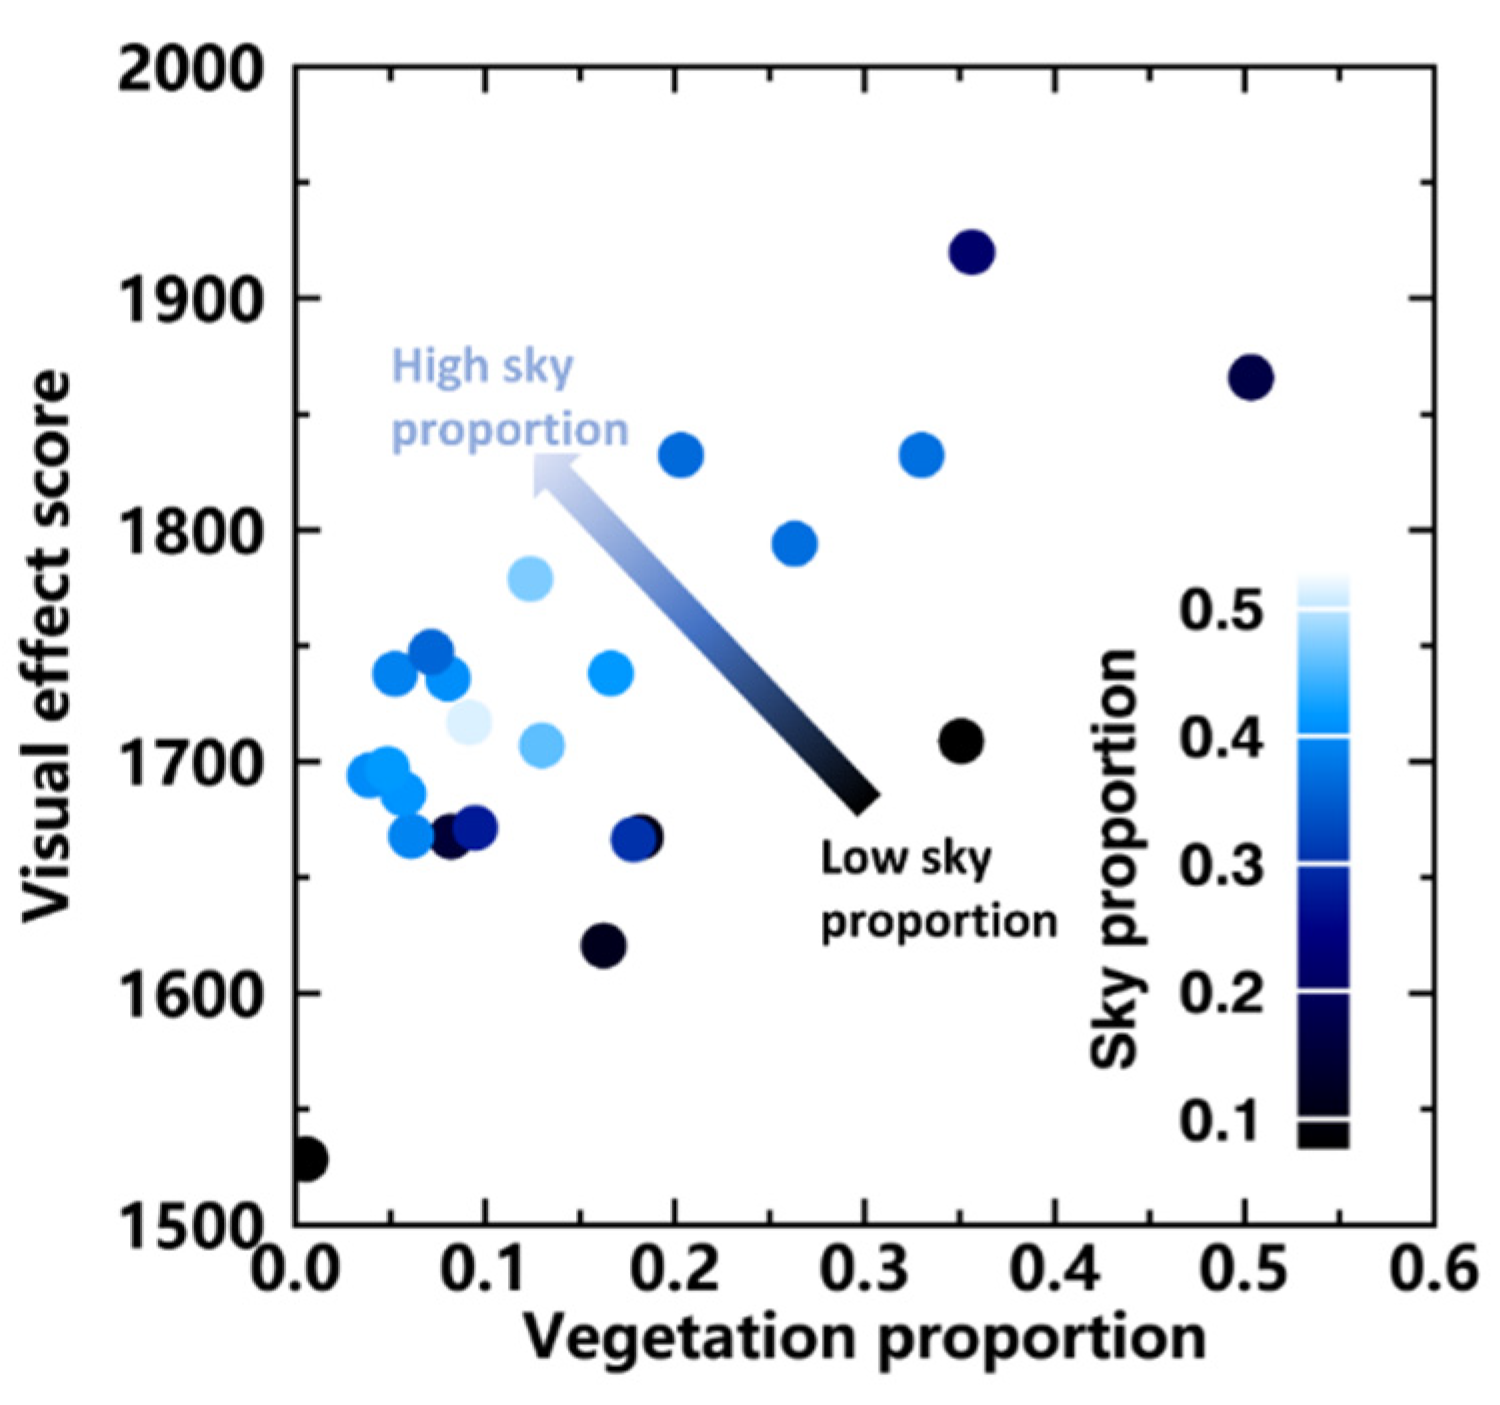
In previous studies, sky and vegetation proportions in the vision were proved to be related to the visual effect [25,26]. With the Elo rating system, quantitative visual effect scores were generated. This offered the opportunity of an objective discussion of the relationships between sky proportion, vegetation proportion, and the visual effect. To visualize the relationships of the three variables, a colored scatter plot is shown in Figure 10.

Figure 10.
Relationship between visual effect score, vegetation proportion, and sky proportion.
In general, Pearson’s correlation coefficient of vegetation proportion and sky proportion with the visual effect score are 0.5984 (p < 0.01) and 0.313 (p > 0.1), respectively. This indicates that, compared with sky proportion, vegetation is a more important factor that affects the visual effect in our study area. That correlation can be observed in Figure 10; the overall trend of visual effect scores could be explained by the two variables’ variation in different directions. The main trend of visual effect score is its increasing with vegetation proportion. This trend is from lower left corner to the upper right corner of the plot. The secondary trend was marked by an arrow in Figure 10. In this direction, when sky proportion of a sample is higher, its visual effect score also increased. Interestingly, this trend is not independent with the vegetation proportion. The samples below the arrow have a clearer increasing trend than those above the arrow. In other words, in this case study, vegetation proportion is the main factor that affects visual effect of the landscape. However, when vegetation proportion is small (less than 0.2), sky proportion will make a higher contribution to the visual effect.
Of course, vegetation proportion and sky proportion cannot explain all the variations of visual effect scores. This means that, apart from the two main factors, the visual effect contains some more complex factors, such as the rhythm of the skyline [27,28], the color and style of buildings [29], and so on. With the Elo rating method, more detailed research on different factors of visual effect could be quantitatively discussed in the future. This might bring novel research opportunities for landscape visual effect evaluation and draw more interesting conclusions.
4.3. Limitations and Outlook
With the continuous development of cities, the landscape visual effect has attracted more and more attention while cities meet basic living conditions. How to assess the visual effect in the region is the primary question in the research of the landscape visual effect. The Elo rating system was first used for chess players to evaluate chess strength, and then it was widely used in the game ‘go’, soccer, and E-sports. Similar to the visual effect, the competitive characteristics of competitive players are also different, which is difficult to assess with a certain indicator. The Elo rating system has inherent advantages in this type of issue. The player’s level can be deduced from the game results. After numerous cross comparisons, a relatively objective comparison of advantages and disadvantages can be obtained. Landscape visual effect contains strong subjective factors. The questionnaire is an effective method for this type of issue. However, in traditional questionnaire method, the questionnaire survey can only be carried out on a certain theoretical basis (such as the fluctuation, shape, and rhythm of buildings), while information about buildings, such as fluctuation and rhythm, are abstract. There is deviation in the understanding of these concepts between fillers and experts. Consequently, it is difficult to obtain intuitive and effective survey results. With the involving of Elo rating system, questionnaires used in this study are pairwise comparisons. The collected result is the direct feedback of the respondents on the intuitive perceptions of the two images. The feedback results are a comprehensive reflection of the landscape visual effect. Through a large number of survey samples, the effectiveness of the assessment results is ensured to a certain extent. This study made a local study with a relatively small sample set; thus, we cannot extrapolate the results to other cities currently. Although, the Elo rating system did show its potential in quantitatively assessing the landscape visual effect. The direct feedback of fillers naturally contains all elements that possibly affect the landscape visual effects. Together with experts’ knowledge, deeper understanding of the landscape visual effect could be gained in the future.
With the introduction of remote sensing technology, the landscape visual effect at the sampling point in the study is extended to the area. This not only provides data support for urban landscape planning and design, but it also expands the application of remote sensing technology itself. Remote sensing technology has played a key role in many fields, such as global change, because of its ability to obtain surface information rapidly, in real time, and over a large area. However, the current remote sensing products are mostly concentrated in professional fields, such as vegetation indexes, surface temperatures, and land use and land cover change information. It is difficult for people without the relevant knowledge to understand the information behind these data. The remote sensing estimation model of the landscape visual effect established in this paper effectively links remote sensing technology with subjective perceptions, and it expands the application scope of remote sensing technology.
This study has made certain preliminary attempts on the quantitative assessment of urban landscape visual effect and the remote sensing estimation method. This study has established a preliminary research framework; there are many directions for further research in the future. At present, only a fixed range of remote sensing information is roughly intercepted around the sampling points. Combined with geo-information technology, the three-dimensional visual field analysis can be introduced in the scheme to further explore the impact of different building combination forms on the landscape visual effect. In this study, only the landscape visual effect of Zhengzhou in 2017 is assessed. Combined with remote sensing historical data and the remote sensing estimation model established in this paper, the history of landscape visual effect can be traced to further study the temporal–spatial evolution of the landscape visual effect in different regions. Furthermore, as our proposed scheme successfully expanded visual effect assessment to a city scale, new opportunities arise to formulate more mechanisms of the relationships between urban transformation [30,31] and aesthetic change. In addition, the horizontal comparison can be increased to expand the number of samples. The different urban landscape visual effects can be compared and studied to provide rich data to support urban development and construction.
5. Conclusions
Through the field collection of panoramic images, this study carried out quantitative research on urban visual effect and used the Elo rating system. The remote sensing estimation model of urban visual effect was obtained. Furthermore, the visual effect of sampling points was extrapolated to the area by remote sensing technology. Through the analysis of the experimental results, the following conclusions are drawn:
- (1)
- Using the combination of the questionnaire and the Elo rating system, the visual effect of urban landscape can be quantified and scored effectively. This provides a feasible quantitative assessment method for the assessment of the urban landscape visual effect.
- (2)
- Using the combination of the remote sensing technology and ANN simulation technology, the remote sensing estimation model of the urban landscape visual effect can be effectively constructed. By using 32 sampling points to train the network and 15 sampling points to validate the accuracy, the estimation model was found to have high accuracy. Those with a MAPE less than 0.05 and an RMSE less than 80 can be used for remote sensing estimation.
- (3)
- The overall landscape visual effect score of Zhengzhou in 2017 showed a low gradient distribution in the northeast and a high gradient distribution in the southwest. Furthermore, there was a high value island near the CBD of Jinshui District, indicating that the design concept of this area is advanced and pleasing to people’s visual experience.
- (4)
- The model simulation results showed that among the five elements, the building proportion has the most complex impact on the landscape visual effect. When the building proportion is 0.35 and 0.7, the visual effect score has two significant peaks. The other four elements have only one peak. The peak of vegetation proportion appears at 0.5, the peak of water proportion appears at 0.35, the peak of unused land proportion appears at 0.6, and the peak of average elevation appears at 180 m.
- (5)
- The proposed method could be easily applied to similar study areas by inputting land use maps and DSM maps into our trained ANN model.
- (6)
- The proposed scheme is friendly to any expansion. With more in situ samples and advanced machine learning methods, more exiting results could be revealed in the future works.
Author Contributions
Conceptualization, C.X. and Y.G.; methodology, C.X. and Y.G.; software, C.X., R.H. and Y.G.; validation, C.X., B.M. and P.Z.; formal analysis, C.X.; investigation, C.X. and P.Z.; resources, Y.G. and R.H.; data curation, C.X. and Y.G.; writing—original draft preparation, C.X.; writing—review and editing, C.X., Y.G. and Y.L.; visualization, C.X. and Y.G.; supervision, R.H. and B.M.; project administration, Y.L. and Y.G.; funding acquisition, Y.L. and Y.G. All authors have read and agreed to the published version of the manuscript.
Funding
The Project Supported by the Open Fund of Key Laboratory of National Geographical Census and Monitoring, Ministry of Natural Resources (2020NGCM01). National Natural Science Foundation of China, grant number 41701422.
Data Availability Statement
The Landsat 8 OLI image was downloaded from https://earthexplorer.usgs.gov/, (accessed on 2 December 2021). The ZiYuan-3 data was downloaded from http://36.112.130.153:7777/DSSPlatform/, (accessed on 2 December 2021).
Conflicts of Interest
The authors declare no conflict of interest.
References
- Wurster, C.B. The image of the city—Lynch, K. Ann. Am. Acad. Political Soc. Sci. 1961, 336, 207–208. [Google Scholar] [CrossRef]
- Tveit, M.S. Indicators of visual scale as predictors of landscape preference; a comparison between groups. J. Environ. Manag. 2009, 90, 2882–2888. [Google Scholar] [CrossRef]
- Wei, X. The Research of Urban Landscape Space Based on the Visual Analysis; Wuhan University of Technology: Wuhan, China, 2008. [Google Scholar]
- Yang, J.; Pan, Y.; Shi, B. Evaluation of Overlooking Views of City Central District: The Case of Hong Kong. Urban Plan. Forum 2013, 5, 106–112. [Google Scholar]
- Niu, X.; Kaike, L.I. A Quantitative Approach to Visual Impact Analysis of City Skyline. Urban Plan. Forum 2013, 3, 99–105. [Google Scholar]
- Zhang, J. Applied Research in Visual Analytics for Controlling Buidling Height in Coastal Areas; South China University of Technology: Guangzhou, China, 2012. [Google Scholar]
- Kochurov, B.I.; Khaziakhmetova, Y.A.; Ivashkina, I.V.; Sukmanova, E.A. Landscape Approach in City-Planning. South Russ.-Ecol. Dev. 2018, 13, 71–82. [Google Scholar] [CrossRef]
- Mesa Carranza, J.A.; Lopez Bernal, O.; Lopez Valencia, A.P. Proposal for a system of indicators to assess the visual quality of the urban landscape in informal settlements. Rev. Arquit. 2016, 18, 35–47. [Google Scholar] [CrossRef] [Green Version]
- Piselli, C.; Castaldo, V.L.; Pigliautile, I.; Pisello, A.L.; Cotana, F. Outdoor comfort conditions in urban areas: On citizens’ perspective about microclimate mitigation of urban transit areas. Sustain. Cities Soc. 2018, 39, 16–36. [Google Scholar] [CrossRef]
- Polat, A.T.; Akay, A. Relationships between the visual preferences of urban recreation area users and various landscape design elements. Urban For. Urban Green. 2015, 14, 573–582. [Google Scholar] [CrossRef]
- Ren, X.X.; Kang, J. Effects of the visual landscape factors of an ecological waterscape on acoustic comfort. Appl. Acoust. 2015, 96, 171–179. [Google Scholar] [CrossRef]
- Talebzadeh, A.; Nowghabi, A.S. The Visual Effects of Store’s Signage Displays in Urban Landscape. Civ. Eng. J.-Tehran 2019, 5, 191–199. [Google Scholar] [CrossRef] [Green Version]
- Ren, X.; Tang, J.; Cai, J. A comfortable soundscape perspective in acoustic environmental planning and management: A case study based on local resident audio-visual perceptions. J. Environ. Plan. Manag. 2021. [Google Scholar] [CrossRef]
- Sun, R.; Chen, A.; Li, F.; Wang, D.; Xu, Z.; Chen, L. Guidelines and evaluation indicators of urban ecological landscape construction. Acta Ecol. Sin. 2013, 33, 2322–2329. [Google Scholar]
- Elo, A.E. New USCF rating system. Chess Life 1961, 1961, 160–161. [Google Scholar]
- Elo, A.E. The Rating of Chessplayers, Past and Present; Arco Pub.: New York, NY, USA, 1978. [Google Scholar]
- Goodspeed, R. Research note: An evaluation of the Elo algorithm for pairwise visual assessment surveys. Landsc. Urban Plan. 2017, 157, 131–137. [Google Scholar] [CrossRef]
- Krizhevsky, A.; Sutskever, I.; Hinton, G.E. ImageNet Classification with Deep Convolutional Neural Networks. Commun. Acm 2017, 60, 84–90. [Google Scholar] [CrossRef]
- Zhang, G.P. Time series forecasting using a hybrid ARIMA and neural network model. Neurocomputing 2003, 50, 159–175. [Google Scholar] [CrossRef]
- Gevrey, M.; Dimopoulos, L.; Lek, S. Review and comparison of methods to study the contribution of variables in artificial neural network models. Ecol. Model. 2003, 160, 249–264. [Google Scholar] [CrossRef]
- Hile, R.; Cova, T.J. Exploratory Testing of an Artificial Neural Network Classification for Enhancement of the Social Vulnerability Index. ISPRS Int. J. Geo-Inf. 2015, 4, 1774–1790. [Google Scholar] [CrossRef] [Green Version]
- Hsu, K.L.; Gupta, H.V.; Sorooshian, S. ARTIFICIAL NEURAL-NETWORK MODELING OF THE RAINFALL-RUNOFF PROCESS. Water Resour. Res. 1995, 31, 2517–2530. [Google Scholar] [CrossRef]
- Lek, S.; Guegan, J.F. Artificial neural networks as a tool in ecological modelling, an introduction. Ecol. Model. 1999, 120, 65–73. [Google Scholar] [CrossRef]
- Scarselli, F.; Gori, M.; Tsoi, A.C.; Hagenbuchner, M.; Monfardini, G. The Graph Neural Network Model. IEEE Trans. Neural Netw. 2009, 20, 61–80. [Google Scholar] [CrossRef] [PubMed] [Green Version]
- Dang, H.; Li, J. The integration of urban streetscapes provides the possibility to fully quantify the ecological landscape of urban green spaces: A case study of Xi’an city. Ecol. Indic. 2021, 133, 108388. [Google Scholar] [CrossRef]
- Yin, L.; Wang, Z. Measuring visual enclosure for street walkability: Using machine learning algorithms and Google Street View imagery. Appl. Geogr. 2016, 76, 147–153. [Google Scholar] [CrossRef]
- Heath, T.; Smith, S.G.; Lim, B. Tall buildings and the urban skyline—The effect of visual complexity on preferences. Environ. Behav. 2000, 32, 541–556. [Google Scholar] [CrossRef] [Green Version]
- Karimimoshaver, M.; Parsamanesh, M.; Aram, F.; Mosavi, A. The impact of the city skyline on pleasantness; state of the art and a case study. Heliyon 2021, 7. [Google Scholar] [CrossRef] [PubMed]
- Samavatekbatan, A.; Gholami, S.; Karimimoshaver, M. Assessing the visual impact of physical features of tall buildings: Height, top, color. Environ. Impact Assess. Rev. 2016, 57, 53–62. [Google Scholar] [CrossRef]
- Wang, T.; Kazak, J.; Han, Q.; de Vries, B. A framework for path-dependent industrial land transition analysis using vector data. Eur. Plan. Stud. 2019, 27, 1391–1412. [Google Scholar] [CrossRef]
- Wu, H.; Lin, A.; Xing, X.; Song, D.; Li, Y. Identifying core driving factors of urban land use change from global land cover products and POI data using the random forest method. Int. J. Appl. Earth Obs. Geoinf. 2021, 103, 102475. [Google Scholar] [CrossRef]


Publisher’s Note: MDPI stays neutral with regard to jurisdictional claims in published maps and institutional affiliations. |
© 2022 by the authors. Licensee MDPI, Basel, Switzerland. This article is an open access article distributed under the terms and conditions of the Creative Commons Attribution (CC BY) license (https://creativecommons.org/licenses/by/4.0/).