3.1. Surface Characteristics
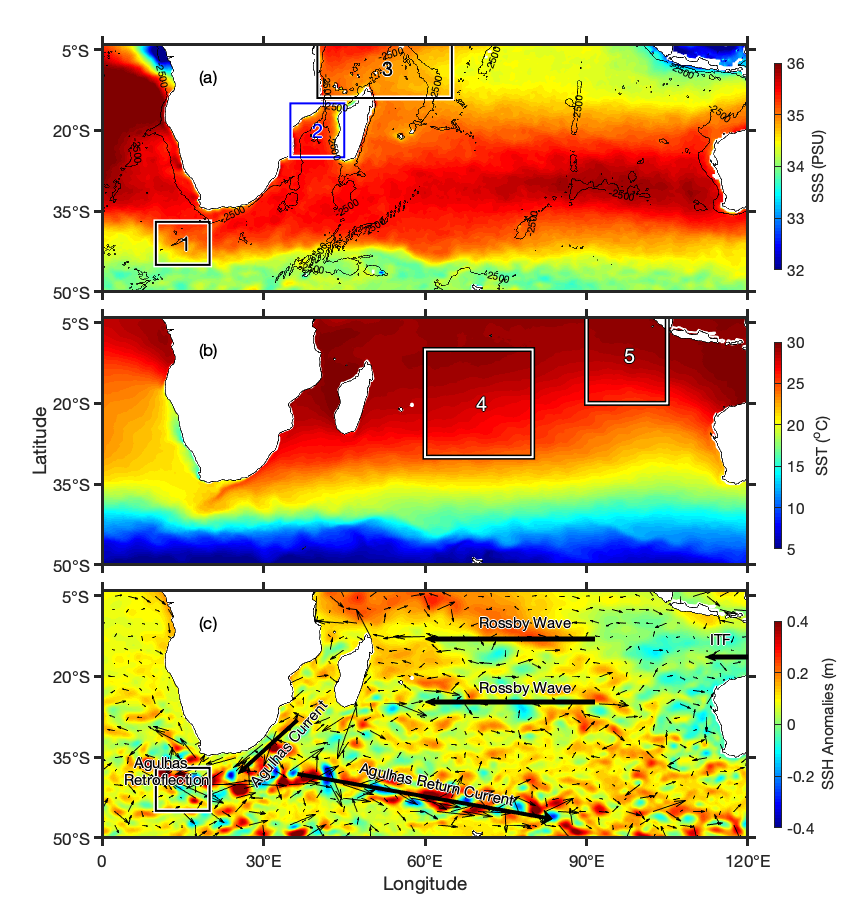
Climatological SMAP SSS (
Figure 1a), CMC SST (
Figure 1b), and CMEMS SSH anomalies (
Figure 1c) reveal large-scale ocean features in the region of interest that encompasses the southern Indian Ocean and Agulhas Current region. The subtropical gyre in the southern Indian Ocean is visible as a band of high salinities (>35 psu) and the low-salinity waters of the ITF. The mechanism by which ENSO signals propagate across the Indian Ocean is by Rossby waves at 8° S and 22.5° S [
12]. The most clearly visible features in the average SST are the ACC and the retroflection point of the Agulhas Current (
Figure 1b). In the SSH anomalies, the eddy train associated with the Agulhas Retroflection is clear at about 35° S across nearly the entire southern Indian Ocean (
Figure 1c). Ocean currents and features relevant to this work are identified in
Figure 1c.
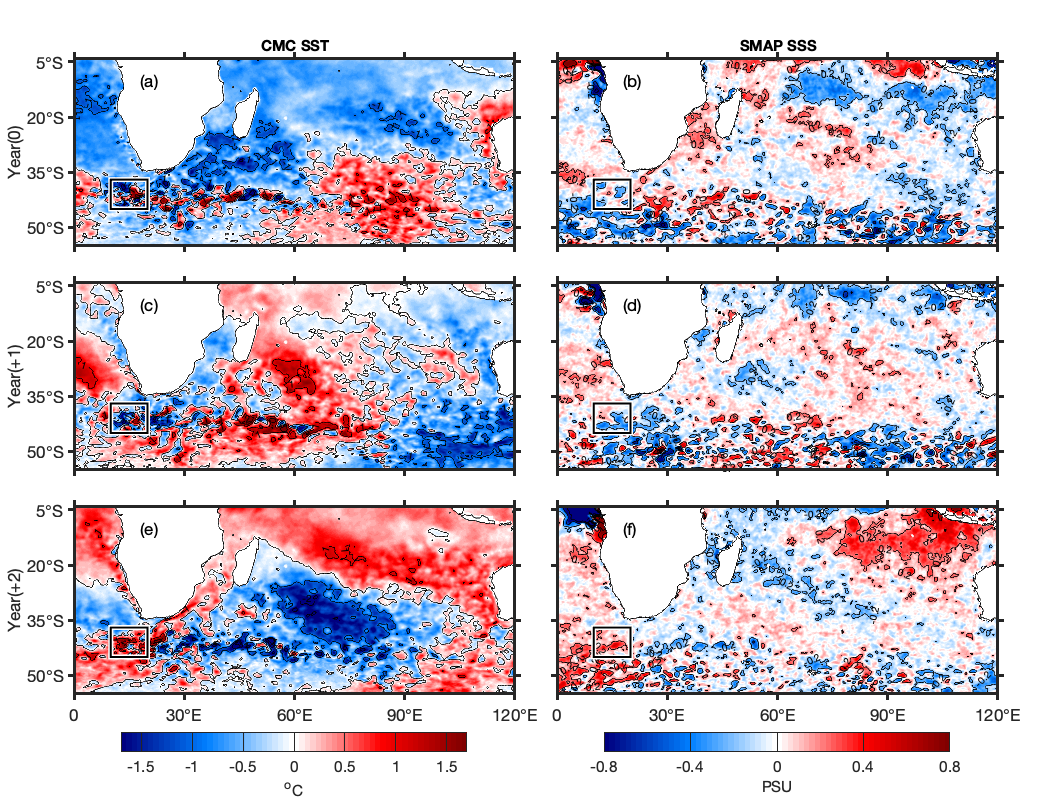
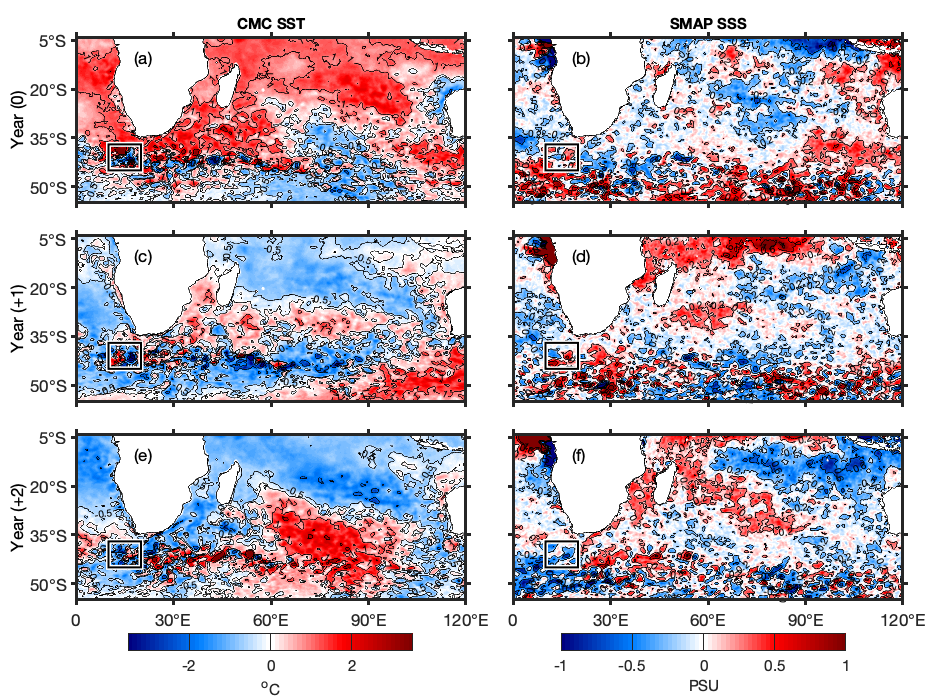
SST anomalies and SSS anomalies for the 2016 and 2018 La Niña events for those identified years, their respective successive year, and the two years following each event are, respectively, presented in
Figure 2 and
Figure 3 (
Figure 2 is for 2016 and
Figure 3 is for 2018). We compare the different years to see changes that can be attributed to La Niña and follow the evolution of the oceanic response. Much of the southern Indian Ocean experiences a shift from anomalously warm in
Figure 2a to anomalously cool in
Figure 2c, with the exception of the warm water mass at 20°–35° S and 40°–80° E. Cool waters enter the region from the western Pacific through the Indonesian Throughflow (ITF) [
20] in
Figure 2c and then flow into the Agulhas Current in
Figure 2e. There is a less spatially uniform change in SSS when compared to that of SST for the overall domain in
Figure 2. A year after
Figure 2b, in
Figure 2d, there is a mass of anomalously fresh water in the upper right representing the ITF. In
Figure 2f, the anomalously fresh water mass appears to weaken as it propagates westward and comes in contact with the highly saline Arabian Sea waters [
21] and only propagates to about 60° E, while the temperature signal at this same time fully extends across the southern Indian Ocean and towards the northern tip of Madagascar.
Regarding the 2018 La Niña, there is, again, a basin-scale SST anomaly reversal (in
Figure 2a,c from warm to cool, and in
Figure 3a,c from cool to warm), with a unique temperature signal at 20°–35° S and 40°–80° E and a meridionally oriented temperature dipole two years after the event’s peak (
Figure 2e and
Figure 3e). SMAP SSS again primarily identifies the anomalous ITF flow as the primary mechanism for the ENSO SSS signal propagation across the Indian Ocean, which is expected and is well captured by the SMAP satellite. It is important to note that the 2016 La Niña event is slightly stronger than that of 2018, according to the ONI, hence the ITF SSS variability (
Figure 2f and
Figure 3f). We will elaborate further on this differing surface response later in this section.
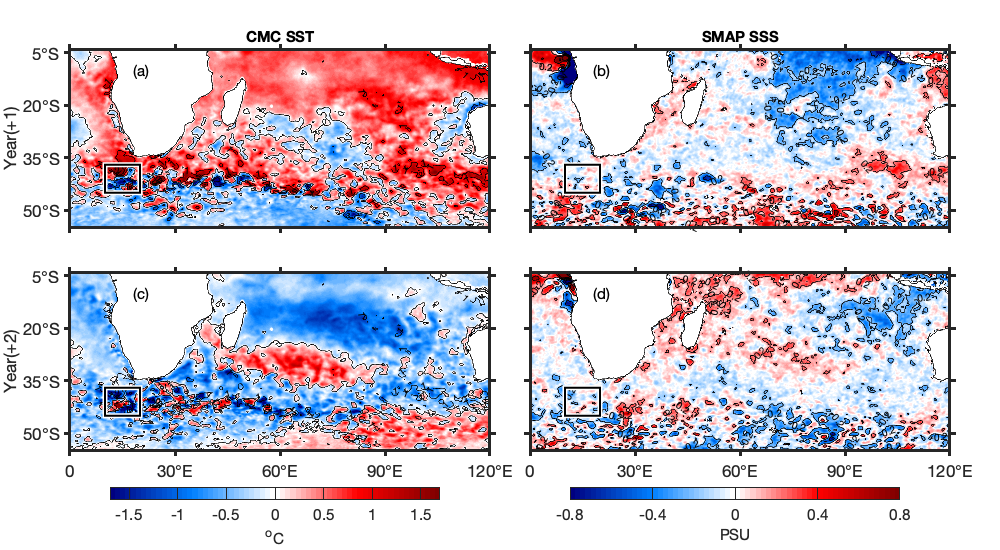
SST anomalies and SSS anomalies of the 2015 El Niño event a year after and two years after the event itself are presented in
Figure 4. The 2015 El Niño is not included because there is no SMAP salinity data for 2015 until April, which is after the January–March period of peak event intensity. Overall, the temperature shifts from anomalously warm in
Figure 4a to anomalously cool in
Figure 4c. Warm water circulates in the Agulhas Current during this time and is no longer present the subsequent year. We trace the warm water signal in
Figure 4a along westward-propagating Rossby waves later in this manuscript and confirm that its location and timing is consistent with heavy rainfall associated with the 2015 El Niño event [
20]. There is a region of anomalously cooler waters that experiences warming and then cooling again as per the progression in
Figure 4a through
Figure 4c southeast of Madagascar. The difference in the region southeast of Madagascar’s temperature compared to the rest of the region is consistent among other figures (
Figure 2,
Figure 3 and
Figure 5). This is the point at which the Agulhas Return Current (ARC) recirculates and initiates mixing and advection of the Indian, Atlantic, and Southern Ocean waters into the ARC [
2].
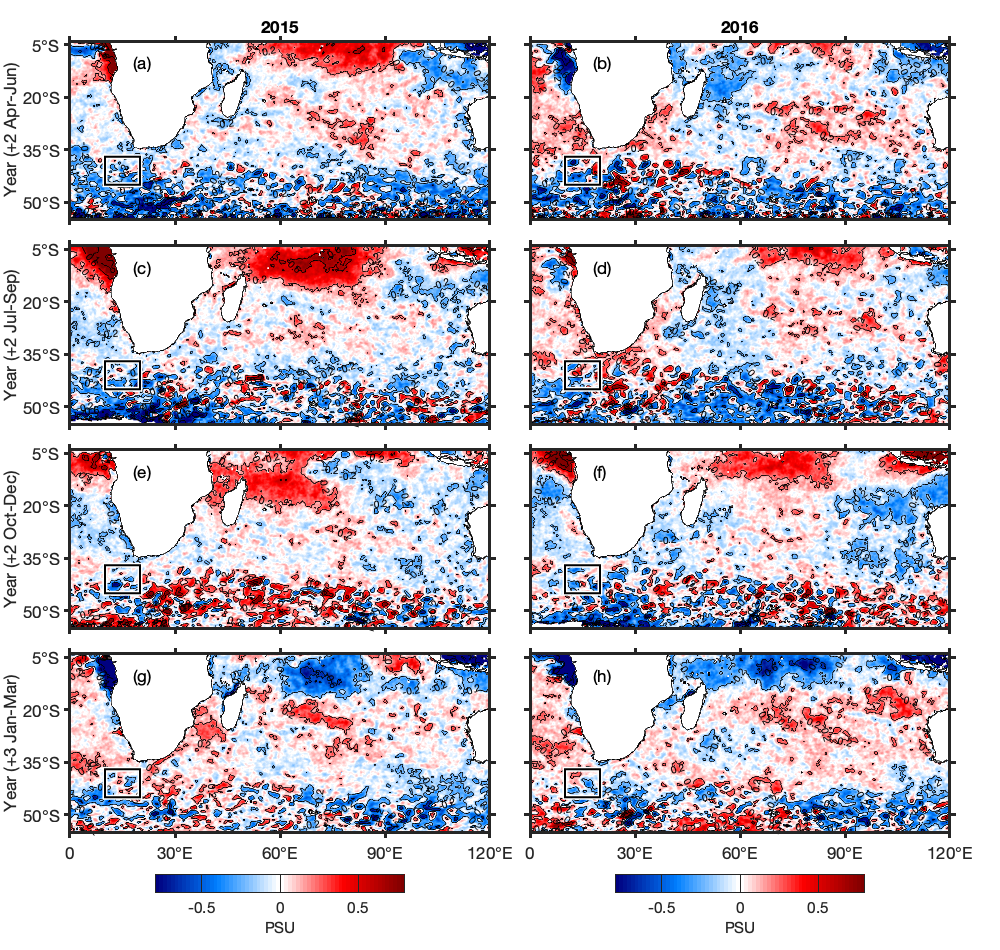
The composite mean of SSS anomalies for two years after the 2016 and 2018 La Niña events and the 2015 El Niño event in April–June (
Figure 5a,b), July–September (
Figure 5c,d), October–December (
Figure 5e,f), and three years after in January–March (
Figure 5g,h) traces the SSS signal westward across the Indian Ocean and into the Agulhas Current region.
Figure 5a,c have a mass of anomalously saline water in the northwestern part of the region displayed which may be attributed to the previous El Niño event in 2015, as seen in
Figure 5d. Fresher waters enter the region in response to La Niña events (
Figure 5a,c,e,g) [
12] via the ITF, travel westward (
Figure 5e) into the inflow point of the Mozambique Channel (
Figure 5g), driven by the South Equatorial Current, and feed into the Agulhas Current. In the El Niño column (
Figure 5b,d,f,h), there is a mass of anomalously saline water in
Figure 5b–f. No timesteps reveal this mass entering the region from the western Pacific, so it is likely unrelated to ENSO events [
20]. Three years after the El Niño event (
Figure 5h), there is a large mass of anomalously saline water at about 5–25° S, 70–115° E that enters the northwestern part of the whole region from the ITF, as seen in
Figure 1f. As there is anomalously saline water appearing from the Pacific one year after the El Niño (
Figure 4a) and three years after (
Figure 5h), it cannot be comfortably assumed that this increase in salinity is directly related to ENSO. Other factors can change the SSS of the Indian Ocean such as the Indian Ocean Dipole (IOD) [
22].
SST anomalies and SSS anomalies for the 2016 La Niña event (
Figure 6) for that identified year, its successive year, and two years following the event identify a general shift from anomalously warm to anomalously cool waters over the entire domain from
Figure 6a–c, with the exception of the region southeast of Madagascar, which experiences an opposite response. The cause of the anomalously warm waters in 2016 may be because of the 2015 El Niño event effects appearing a year later, as seen in
Figure 4a. The region becomes anomalously cool in
Figure 4e when the cool water moves westward into the Mozambique Channel and into the Agulhas Current. There is minor freshening from
Figure 6d–f in the entirety of the region and anomalously cold and less saline water in the ITF region in
Figure 6d that expands in
Figure 6f, signifying increased ITF fresh water from the effects of La Niña. The region does become more saline from
Figure 6b to
Figure 6d, perhaps due to the effects of the 2015 El Niño two years later, as revealed in
Figure 4d.
The composite mean of SSS and SST of the 2016 La Niña event minus the composite mean of SSS and SST of the 2018 La Niña event for January–March is presented in
Figure 7. Both La Niña events are considered weak, but 2018 is slightly stronger [
23]. During year zero (
Figure 7a), there is a meridional SSTA dipole with warmer waters north of 35° S and cooler waters south of 35° S (with the exception of the West Australian Current upwelling). This pattern is true for the entire selected domain. This could be attributed to El Niño conditions at this point from the 2015 El Niño [
22]. After one year (
Figure 7c), this pattern of warmer waters is constrained from about 32° S to 35° S, and there is a similar band of cooler waters stretching along 35° S to 40° S. These are the remnants of warm waters that pass southward through the Mozambique Channel and then eastward due to the Agulhas Retroflection. After two years, the anomalously warm temperatures intensify within a concentrated region (60° E–90° E, 20° S–60° S). At this point (
Figure 7e), the meridional temperature anomaly dipole has completely flipped, with cooler waters to the north and warmer waters to the south (relative to 30° S) once the signal has had ample time to propagate.
It is interesting to note the clear difference in timing between the temperature and salinity of these two La Niña events. Not only does the SMAP salinity measure a slower reaction timing than that of temperature but we also see a slightly different pathway between the signal of SMAP SSS and that of CMC SST. While the initial state is again dipolar (
Figure 7b), the saline response to La Niña events along westward-propagating Rossby waves is not clear until one year later (
Figure 7d), and by the time the signal has reached the Agulhas Current region (
Figure 7f), there is a clear bifurcation of the southward-flowing salinity signal, split by Madagascar. One branch flows through the Mozambique Channel, while the other follows the circulation pattern of the Indian Ocean Gyre (
Figure 7f). SMAP SSS not only clearly measured the timing of the SSS response with respect to the Agulhas Current region but also illustrated signal pathways not seen in SST.
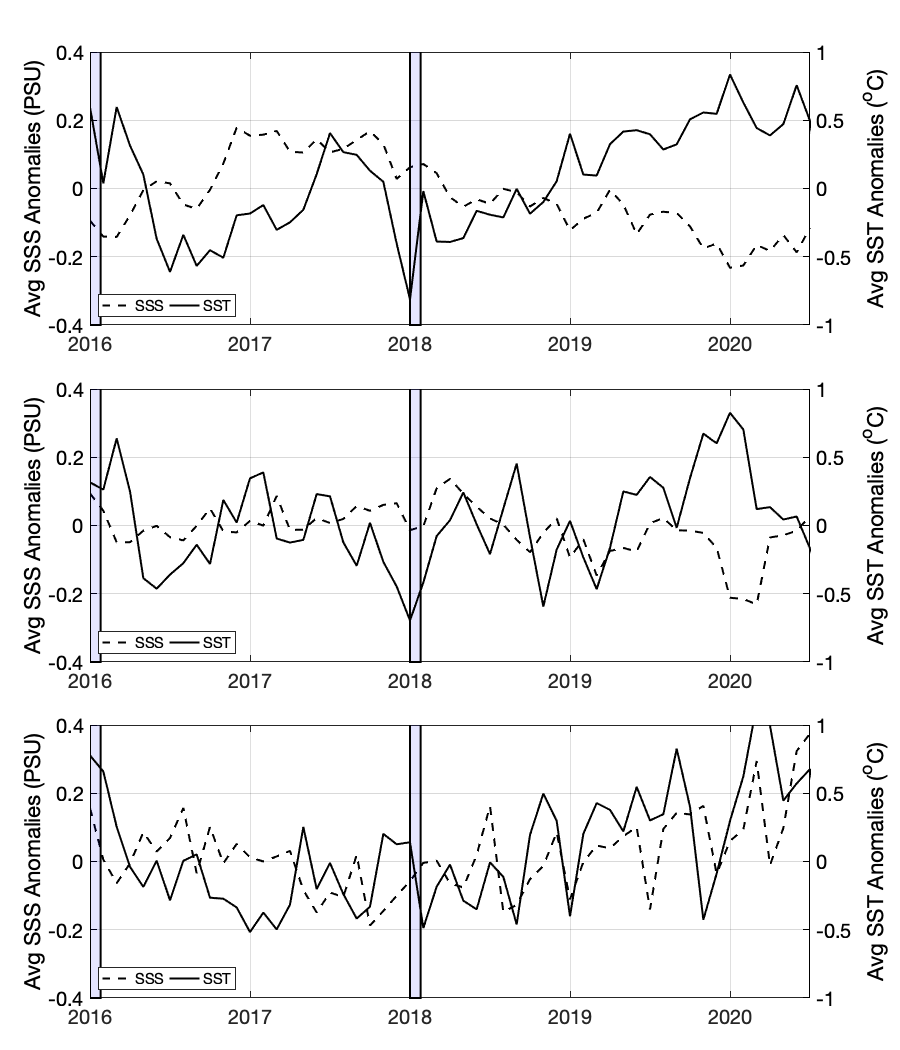
Three time series of SST and SSS from 2016 to 2020 represent a region north of Madagascar (
Figure 8, top panel, box 3 in
Figure 1), a region between Madagascar and the coast of Africa in the Mozambique Channel (
Figure 8, middle panel, box 2 in
Figure 1), and the Agulhas Leakage region (
Figure 8, bottom panel, box 1 in
Figure 1). These three regions compose the path that water from the Rossby wave outflow point travels before entering the Agulhas Current. The water in the Agulhas Current originates north of Madagascar (box 3 in
Figure 1), enters the Mozambique Channel (box 2 in
Figure 1), and then flows into the Agulhas Current (box 1 in
Figure 1).
Figure 8 provides a temporal visual of the anomalies represented in the previous figures. In the top panel, water is anomalously saline, while the temperature is anomalously fresh, and this switches in 2019. The drop in salinity at the beginning of 2019 in the top panel represents the 2016 La Niña bringing fresher waters into the region three years after the peak of the event. In the second time series, there is a spike in SSS in 2018 attributed to the 2015 El Niño advecting more saline waters two years after the event, as seen in
Figure 4. Temperature and salinity have the most similar pattern in the leakage region (bottom panel).
Lead–lag correlation analysis presents the lag (in months) between the peak of ENSO and the SST and SSS in the Agulhas Leakage region (box 1 in
Figure 1). SST and SSS for the La Niña years have a stronger correlation than the El Niño year. SST and SSS for the El Niño years behave independently instead of mirroring the trend of the other. SST and SSS of La Niña have a positive correlation with the ONI until approximately 17 months after the peak of the event (
Figure 9). Both variables continue to negatively correlate after this mark until about 32 months when the correlation becomes slightly positive. The SST for the La Niña events peaks positively at about 5 months and the SSS at about 12 months. The SST for El Niño is positively correlated until about 10 months and remains negative until about 34 months after the peak of the event. The SSS of El Niño is positively correlated with the ONI until about 14 months and remains negatively correlated for the rest of the period. The positive peak of SST for El Niño is at about 2 months and the SSS is less dramatic, plateauing around 5 to 11 months.
Figure 9 supports the idea of SST changing faster than SSS as both lines of SST become negatively correlated prior to those of SSS.
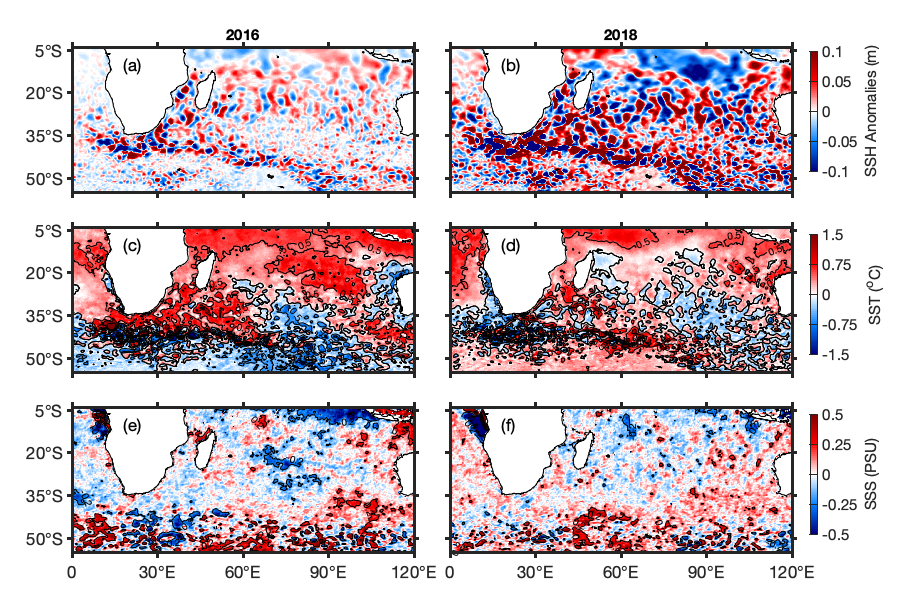
SSH, SST, and SSS anomalies are plotted in 2015 (an El Niño year) and two years later in 2017 (
Figure 10). The SSH anomalies vary throughout the entire region in both panels, but the difference is more dramatic in
Figure 10b that has stronger anomalies than
Figure 10a. Warm waters from El Niño induce thermal expansion and anomalously high SSH anomalies. There is a noticeable change from
Figure 10c to
Figure 10d where the domain anomalously warms, as expected after an El Niño [
19]. The Agulhas Current is anomalously warm in
Figure 10d compared with
Figure 8. Anomalously warm waters in the northwestern part of
Figure 10c are observed moving into the Mozambique Channel and then into the Agulhas Current. From
Figure 10e,f, saline regions become more saline, and the fresh regions become fresher. In 2017 (
Figure 4d), there is an increase in salinity, similar to the increase in salinity of the saline regions from
Figure 10e to
Figure 10f.
SSH, SST, and SSS anomalies during the 2016 La Niña event and two years later in 2018 (
Figure 11) reveal a decrease in SSH anomalies in the northwestern region from
Figure 11a to
Figure 11b, signifying the effects of the La Niña signal traveling through the ITF and propagating towards Africa via the South Equatorial Current [
20,
24]. Cold waters enter the region around 90° E in
Figure 11c where the Subtropical Front (STF) joins the ARC and recirculates into the Agulhas Current [
25].
3.2. Subsurface Properties
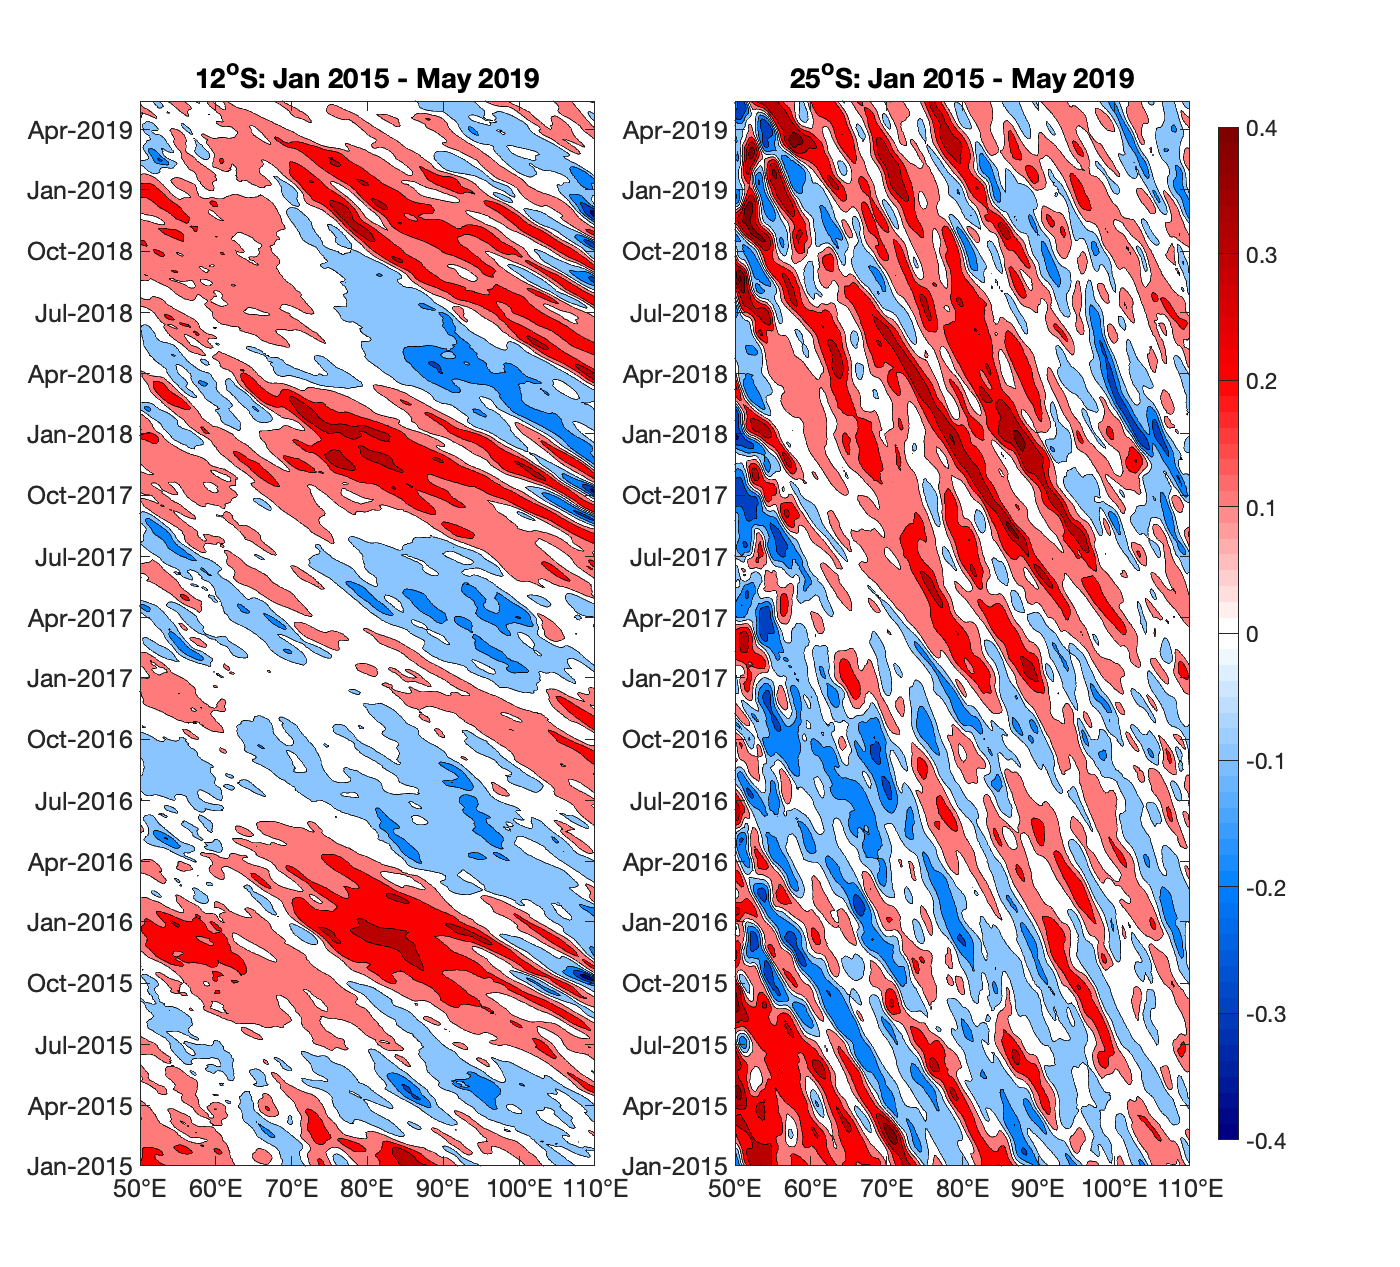
A Hovmöller diagram of SSH anomalies at 12° S and 25° S from 50° to 100° W during January 2015 to May 2019 presents alternating bands of negative and positive SSH anomalies, signifying westward propagation of Rossby waves (
Figure 12). The angle of the bands is steeper at 25° S than at 12° S because the Rossby waves propagate faster at this latitude. In the 12° S diagram, there is westward movement of water masses consistent with ENSO events. There is a large mass of positively anomalous water appearing in 2016, one year after the 2015 El Niño. Anomalously warm waters in
Figure 4a at this time contribute to thermal expansion and increased SSH anomalies. A mass of anomalously negative water appears in 2018 two years after the 2016 La Niña and may be attributed to that event. In the 25° S diagram, the large portion of anomalously positive bands may be attributed to the 2015 El Niño, and the effects took longer to reach this region because of ocean circulation patterns [
26].
The depth–time plots in
Figure 13 present Argo temperature (top panel) and salinity (bottom panel) anomalies in the eastern Indian Ocean from April 2015 to March 2020 (box 5 in
Figure 1).
Figure 13,
Figure 14 and
Figure 15 allow us to evaluate temperature and salinity anomalies as a function of depth in the upper 500 m. The temperature and salinity in
Figure 13 are in antiphase; when there are colder temperatures, there are higher salinities and vice versa. The salinity lags behind temperature, which would further support the conclusion that salinity changes later than temperature from
Figure 2,
Figure 3 and
Figure 4. The boxes in the diagram represent January–March of ENSO years. This region experiences the effects of ENSO events first because it is geographically closest to the Pacific where ENSO events originate (box 5 in
Figure 1) [
27]. There are anomalously warm temperatures at the surface in the eastern Indian Ocean in 2016 (
Figure 4a), which are observed in
Figure 13 as well and may be attributed to the 2015 El Niño. This anomalously warm mass of water begins in late 2015 from the surface up to 300 m depth and continues into early 2017. We expect to see temporal effects in this region a year after a La Niña event (
Figure 2c and
Figure 3c), which is also supported in this diagram.
Figure 2d shows anomalously saline waters in this region in 2017 in the bottom panel of
Figure 13. This anomalously saline mass of water reaches down to about 150 m. The response in salinity for the La Niña events is two to three years after the event (
Figure 2 and
Figure 3e,g). This is displayed in
Figure 13 by the large mass of anomalously fresh water in the second half of 2019. This mass of water extends to approximately 300 m deep.
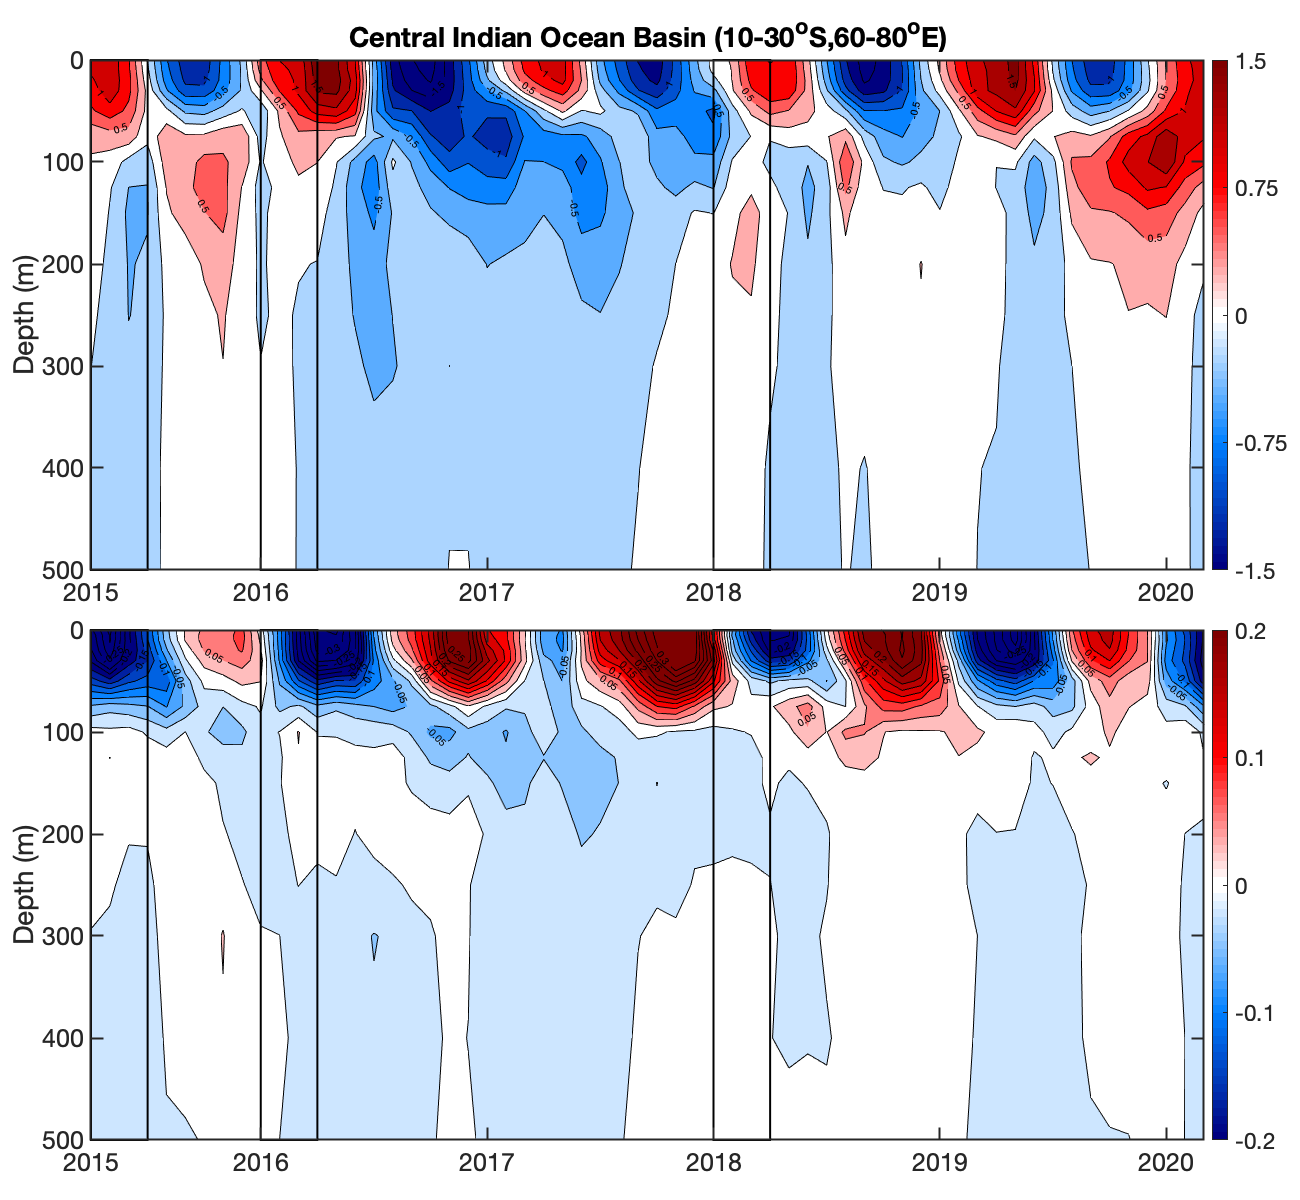
Subsurface variations in Argo temperature (top panel) and salinity (bottom panel) anomalies in the central Indian Ocean (box 4 in
Figure 1) from April 2015 to March 2020 are presented in
Figure 14. The effects of the El Niño event and La Niña events appear around the same time as in
Figure 13, but a little later and in different intensities. The surface temperature and salinity also generally do not reach as deep down in this region as they did in
Figure 13 in the eastern Indian Ocean due to the different stratification of the local water column [
26]. The general temperature change is very similar to that in
Figure 11. The salinity follows the same pattern as
Figure 13 but experiences stronger variability due to the South Equatorial Current and both the Northeast and Southeast Madagascar Currents (NEMC, SEMC). Theses currents transport high volumes of water; the NEMC transports about 30 Sv and the SEMC transports about 20 Sv [
26].
Subsurface Argo temperature (top panel) and salinity (bottom panel) anomalies in the Agulhas Leakage region from April 2015 to March 2020 are displayed in
Figure 15. Both temperature and salinity changes experience higher variability than the regions in
Figure 13 and
Figure 14. This is expected because the Agulhas Current advects waters with different temperature and salinity characteristics [
25]. The temperature changes seasonally, and the salinity appears to be in antiphase with the temperature with a small lag. The temperature and salinity extend much further than in
Figure 13 and
Figure 14, even reaching 500 m, because the Agulhas Current has large vertical transports [
28]. Since this region is the furthest from the Pacific out of the three depth plots, it is expected that the effects of ENSO will arrive later [
26,
27]. There is an increase in SST in this region in
Figure 4a one year after the 2015 El Niño, which can be seen in the top panel of this diagram, and it extends all the way to 500 m. Anomalously cool waters flow along the Agulhas Current two years after the La Niña events (
Figure 3e), but there are anomalously warm waters in the Agulhas Leakage region at this time. The leakage region may not have been majority anomalously cool until just after this, which is seen in the top panel of
Figure 14, in 2019. The leakage region is not anomalously saline until three years after the 2015 El Niño and anomalously fresh three years after the La Niña events (
Figure 2 and
Figure 3). There is a mass of anomalously saline water three years after the El Niño in 2018 which only extends slightly beyond 100 m depth. At the beginning of 2019, three years after the 2016 La Niña, there is both anomalously saline and fresh waters, which aligns with the region in
Figure 3g.
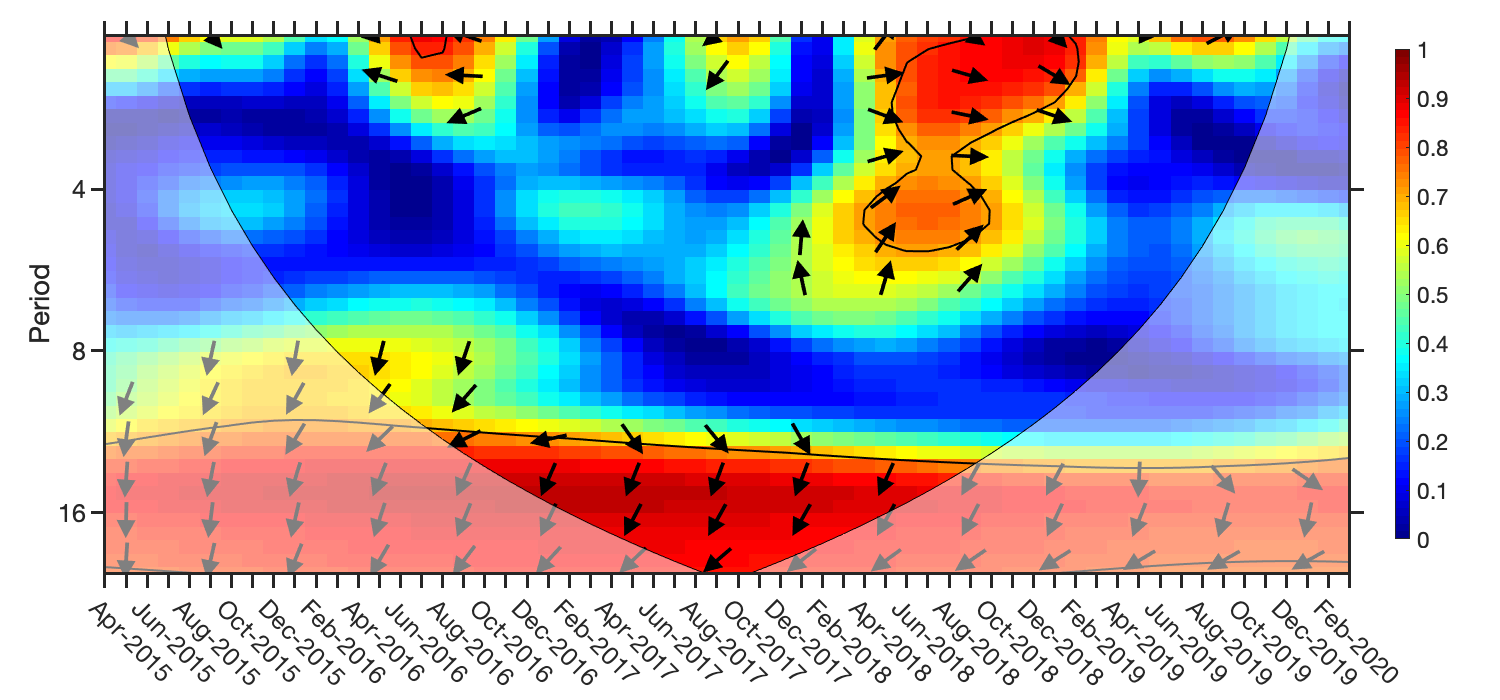
Wavelet analysis of SSS and ENSO (via the Oceanic Niño Index) was conducted in the Agulhas Leakage region (
Figure 16). There are three regions of high correlation in this plot. One appears in about June 2016, a second centered about May 2018, and a third for all months for periodicities higher than 12 months. This first region directly relates to the 2015 El Niño, and the second region may be the effects of the 2016 La Niña once the signal has propagated to the Agulhas Current region. The arrows pointing left in the first region of high correlation mean SSS and ENSO are out of phase, and they slightly point up, meaning that the Oceanic Niño Index leads SSS, though the statistically significant region is only for periods of 1–2 months, so this is likely not an immediate ENSO–Agulhas response. In the second region, the arrows point right, meaning ENSO and SSS are in phase, and they slightly point down in the upper part of the region and up in the lower part. This reveals that ENSO led SSS and then the statistical relationship switched to where SSS leads ENSO. This second event has a statistically significant correlation for periods of up to 5 months. The main takeaway from this analysis is that there is a consistent statistically significant correlation between ENSO and SSS on timescales longer than one year, and also isolated events of positive correlations on interannual timescales, which are likely attributed to the lagged effect between SSS in the Agulhas Current region and each individual ENSO event to permit the signal to propagate across the Indian Ocean and through the Mozambique Channel. However, the persistent long-term correlation is optimistic for justification of this study and the effectiveness of SMAP on understanding Agulhas Current and ENSO interactions.
