Abstract
Various drought indices have been used for agricultural drought monitoring, such as Standardized Precipitation Index (SPI), Standardized Precipitation Evapotranspiration Index (SPEI), Palmer Drought Severity Index (PDSI), Soil Water Deficit Index (SWDI), Normalized Difference Vegetation Index (NDVI), Vegetation Health Index (VHI), Vegetation Drought Response Index (VegDRI), and Scaled Drought Condition Index (SDCI). They incorporate such factors as rainfall, land surface temperature (LST), potential evapotranspiration (PET), soil moisture content (SM), and vegetation index to express the meteorological and agricultural aspects of drought. However, these five factors should be combined more comprehensively and reasonably to explain better the dryness/wetness of land surface and the association with crop yield. This study aims to develop the Integrated Crop Drought Index (ICDI) by combining the weather factors (rainfall and LST), hydrological factors (PET and SM), and a vegetation factor (enhanced vegetation index (EVI)) to better express the wet/dry state of land surface and healthy/unhealthy state of vegetation together. The study area was the State of Illinois, a key region of the U.S. Corn Belt, and the quantification and analysis of the droughts were conducted on a county scale for 2004–2019. The performance of the ICDI was evaluated through the comparisons with SDCI and VegDRI, which are the representative drought index in terms of the composite of the dryness and vegetation elements. The ICDI properly expressed both the dry and wet trend of the land surface and described the state of the agricultural drought accompanied by yield damage. The ICDI had higher positive correlations with the corn yields than SDCI and VegDRI during the crucial growth period from June to August for 2004–2019, which means that the ICDI could reflect the agricultural drought well in terms of the dryness/wetness of land surface and the association with crop yield. Future work should examine the other factors for ICDI, such as locality, crop type, and the anthropogenic impacts, on drought. It is expected that the ICDI can be a viable option for agricultural drought monitoring and yield management.
1. Introduction
In recent years, the frequency and severity of drought have been increasing due to climate change, accompanied by the threat to ecosystems and human societies [1,2,3,4]. In particular, Amazonia, the southern part of South America, the Mediterranean region, most of Africa, and the northeastern part of China were the hotspots of drought for the last decades [5]. Drought is difficult to categorize in a formulaic manner because its beginning and end are difficult to determine accurately; it occurs broadly over a long period [6,7]. However, it is generally classified into meteorological, agricultural, hydrological, and socioeconomic drought [8,9]. Meteorological drought is a phenomenon in which the water on the land surface becomes scarce as the precipitation below the average or normal level continues for a long time [4,10,11]. If the high-temperature dry condition persists over a long period, the evaporation from soil and the transpiration from vegetation (that is, evapotranspiration) can increase, causing a shortage of water on the land surface [8,9,12,13,14]. When a meteorological drought intensifies, the soil moisture (SM) decreases, and the water stress increases. If such a condition results in damage to the vegetation growth, it is regarded as agricultural drought [8,9,15]. In addition, if the water scarcity becomes more severe—lowering the water level of dam and groundwater, it is categorized as hydrological drought [8,9]. If the drought becomes even more severe—whereby the water supply can no longer meet the demand of the society, it is regarded as socioeconomic drought [16,17].
In particular, agricultural drought is of great importance in terms of food security and climate change [18]. Agricultural drought causes damage to the biomass and crop yield. For example, a 2012 drought in the United States caused billions of dollars in economic loss due to the reduced production of the crops, such as corn and soybeans [19]. In California, low precipitation and dry condition persisted from 2012 to 2015, which accelerated the evapotranspiration and decreased the SM, worsening the vegetation health [20]. Because agricultural drought has a direct impact on crops and forest ecosystems, various drought indices have been used for agricultural drought monitoring, such as Standardized Precipitation Index (SPI) [21,22,23], Standardized Precipitation Evapotranspiration Index (SPEI) [21,22,23,24], Palmer Drought Severity Index (PDSI) [21,25], Soil Water Deficit Index (SWDI) [26,27], Normalized Difference Vegetation Index (NDVI) [28,29], Vegetation Health Index (VHI) [30,31], Vegetation Drought Response Index (VegDRI) [32,33], and Scaled Drought Condition Index (SDCI) [34].
The meteorological drought indices, such as SPI, SPEI, and PDSI, which use precipitation as a key variable, have been employed in the analyses of drought transition, in which a meteorological drought extends to an agricultural drought [21,22,23,24]. SPI can be applied on various time scales (such as 3, 6, 12, and 24 months). For example, SPI3 and SPI6 are obtained by an empirical cumulative distribution function (ECDF) of 3-month or 6-month cumulative precipitation, and the standardized form of the ECDF is a z-value [10,35]. A positive SPI indicates a wet state, and a negative SPI indicates a dry state. In general, the SPI below -1 indicates a drought, and the greater the absolute value is, the worse the drought [35]. SPI has the advantage that it can be calculated simply using precipitation only [36]. However, because it is an index that considers only the aspect of water supply, there is a disadvantage that the aspect of water consumption from the land surface caused by the temperature rise and the dry air is not considered. On the other hand, SPEI is a drought index that has improved the SPI by using the difference between the precipitation and the potential evapotranspiration (PET) [37]. PET is the maximum amount of evapotranspiration that can occur under a given weather condition for the reference crop [38,39]. Because both precipitation and PET affect the water balance on the land surface [40,41,42,43], the SPEI, which considers both the supply and consumption of water, may be regarded as a more reasonable drought index than SPI [44,45,46]. PDSI is a drought index using the difference between the actual precipitation and the precipitation needed to maintain a normal soil moisture level [47,48]. However, the necessary elements for PDSI, such as evapotranspiration and recharge rate, are difficult to calibrate, so that they are usually approximated by using available variables, such as precipitation and air temperature [47,48,49,50].
For the drought indices with more emphasis on the agricultural aspect, SM and the vegetation index are used in addition to the weather variables, such as precipitation, air temperature, and PET. SM affects vegetation growth and yield, and the vegetation index is a direct indicator of vegetation vitality. SWDI is calculated as a ratio that divides the difference between SM and field capacity (FC) by the available water content (AWC) [26,27]. The original SWDI was designed to use in-situ observation data, but satellite-based SWDI can also be applied for spatially continuous information of drought. However, SWDI has a drawback in that it requires local-level ancillary data, such as FC and AWC, which are difficult to obtain [27]. On the other hand, NDVI, VHI, SDCI, and VegDRI, in which vegetation index plays a crucial role, can provide the information for both the cause of drought (lack of precipitation) and the result of drought (vegetation damage) [32,51,52,53]. NDVI is a vegetation index that uses a characteristic of high values of near-infrared reflectance in healthy vegetation [32,52,54]. The NDVI anomaly has been used in drought monitoring [32,55], but there is a limitation in identifying the complex condition of drought only using one variable, NDVI anomaly. To improve this, VHI represents a drought by combining the Temperature Condition Index (TCI) and the Vegetation Condition Index (VCI): the former shows the relative state of temperature compared to historical data, and the latter shows the relative state of NDVI compared to historical data for each location [30,31]. However, VHI does not include the precipitation information, and to supplement this, SDCI quantified the drought through the weighted sum of VCI, TCI, and Precipitation Condition Index (PCI) [34,56]. VegDRI is a drought index that combines SPI, PDSI, NDVI, and biophysical data by reflecting both meteorological and vegetation factors [32,33].
Table 1 summarizes the components of major drought indices, such as SPI, SPEI, PDSI, SWDI, NDVI, VHI, SDCI, and VegDRI. Meteorological drought can lead to agricultural drought through processes such as a lack of precipitation, rise in temperature, increase in evapotranspiration, decrease in SM, and deterioration of vegetation. Most drought indices express the drought through a combination of meteorological and land surface variables. Thus, in a comprehensive sense, they can be called agro–meteorological drought indices. The crucial factors for drought monitoring, such as rainfall, temperature, PET, SM, and vegetation, should be combined more comprehensively and reasonably to explain the meteorological aspect (dryness/wetness of land surface) and the agricultural aspect (association with crop yield) as well.

Table 1.
Major meteorological and agricultural factors that make up the drought index.
This study aims to develop a new agro–meteorological drought index by combining rainfall, land surface temperature (LST), PET, SM, and vegetation index, which are essential variables for representing meteorological and agricultural drought. Our drought index is named the Integrated Crop Drought Index (ICDI) to show the impact of drought on crop yield as well as the dryness/wetness of land surface. It can provide a comprehensive representation of drought by combining the relative degrees of rainfall, LST, PET, SM, and vegetation index by comparison with the minimum and maximum of those over the normal crop yield period. The case study was based on the State of Illinois, a key region of the U.S. Corn Belt, and the quantification and analysis of drought were conducted on a county scale for 2004–2019. Tropical Rainfall Measuring Mission (TRMM) data were used for the rainfall; Moderate Resolution Imaging Spectroradiometer (MODIS) data for the LST, PET, and vegetation index; and Global Land Data Assimilation System (GLDAS) data for the SM. The performance of the ICDI developed in this study was evaluated through comparative analysis with SDCI and VegDRI, which have similar characteristics as the ICDI.
2. Materials
The state of Illinois is in the Midwest of the United States. It is a representative corn production region together with Iowa, and its recent average yield (2017–2019) was approximately 200 bushels per acre [57]. The northern regions have a climate of Dfa (humid continental climate) in terms of the Köppen–Geiger classification, and the southern regions have a climate of Cfa (humid subtropical climate) (Figure 1) [58]. The average annual temperature is 10.9 °C, and the annual average precipitation is 915.7 mm [59]. During 2004–2019, the period in the case study, considerable droughts occurred in 2005, 2006, 2007, and 2012. In particular, the crops suffered severe damage due to the drought in 2012 [59,60].
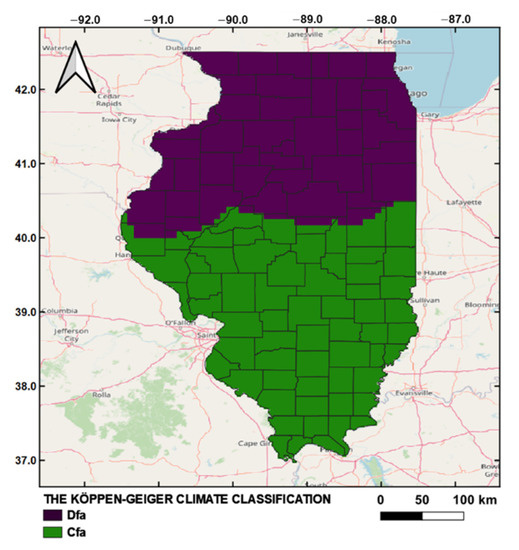
Figure 1.
The Köppen–Geiger climate classification in the study area [61].
Rainfall, LST, PET, SM, and enhanced vegetation index (EVI) were used to calculate the ICDI. We summarized the information, such as resolution and source of these data, in Table 2. TRMM 3B42 V7 for rainfall is provided in 0.25° grid by the daily accumulation of the original 3-hourly data. The products of Terra/Aqua MODIS were used for the LST (C6 MOD11A2), PET (MOD16A2GF), and EVI (MOD13C2 and MYD13C2). MOD16A2GF is a product that has improved the existing PET product through a gap-filling process. We used the EVI product because the EVI represents the vegetation vitality better than NDVI in the croplands of dense vegetation [62,63]. GLDAS daily data (GLDAS_CLSM025_DA1_D_2.2), which were created by an improved model simulation through the data assimilation process using the satellite and in-situ observation [64,65], were used for the soil moisture. TRMM 3B42 V7 generally shows a high positive correlation with the rain gauge in the Continental United States (CONUS) [66]. The MODIS C6 MOD11 and MOD16 products in cropland are in good agreement with in-situ LST and PET measurements in the United States [67,68]. The accuracy of the soil moisture from GLDAS product is not provided officially, but National Aeronautics and Space Administration (NASA) mentions that it is more accurate over the US and Europe because of the dense network of observation [69]. The MODIS land cover type product (MCD12Q1) at 500 m resolution was used to extract the parts corresponding to the croplands from this grid data. The data of corn yield by county, which were ancillary data, were acquired from the United States Department of Agriculture’s (USDA) National Agricultural Statistics Service (NASS) [70].
Table 2.
Data used to develop the integrated crop drought index (ICDI).
We extracted the pixels having a value of 12 (croplands) continuously for the 16 years (2004–2019) from the MODIS land cover type data and created a cropland mask at a 500 m resolution. The rainfall, LST, PET, SM, and EVI used in the calculation of ICDI were resampled at a 500 m resolution with the coordinate reference system of the WGS84 (World Geodetic System 1984). These five variables had different temporal resolutions, and they were processed into an 8-day composite to facilitate the analyses of drought. Because the 16-day vegetation products had many missing pixels due to the clouds in summer [71,72,73], we used monthly EVI products provided through a gap-filling process. Since the vegetation vitality changed gradually over time like a cosine curve, the monthly EVI was interpolated at an 8-day interval by applying a cubic spline method [71].
3. Methods
3.1. Integrated Crop Drought Index (ICDI)
We aimed to develop the ICDI as a drought index that reflects the dryness/wetness and the damage to crop yield by integrating the rainfall, LST, PET, SM, and EVI. First, we defined the years of normal crop yield as the years with over 95% of the average yield for each county during the 16 years (2004–2019). The five variables were converted into the ECDF, and the ECDF values were normalized using the min and max. Then the severity index (SI) of each variable was derived, as shown in Table 3. Here, the min and max of each variable were defined as the minimum and maximum ECDF values during the normal years to show how exceptional the weather and land surface conditions were compared to those of the normal years. In the five variables, a high value indicates a wet (or healthy) state, and a low value indicates a dry (or unhealthy) state. For this, the numerator was set by subtracting the minimum from the ECDF value in the cases of rainfall, SM, and EVI, and by subtracting the ECDF value from the maximum in the cases of LST and PET. Indeed, heatwaves and excessive evapotranspiration can increase the water consumption of the land surface. Since the ECDF value of each variable may exceed the max from the normal years or may be smaller than the min from the normal years, SI has a range of −∞ to ∞. During the normal years, 0 ≤ SI ≤ 1. The ICDI proposed in this study represents both dryness/wetness and healthy/unhealthy states of cropland by combining , and . As shown in Equation (1). Furthermore, a 3-month moving average was obtained (ICDI3) to reflect the temporally accumulated characteristics of drought. The optimal size of the moving window was determined by the comparison of 1, 2, 3, and 6-month moving averages. The comparison result according to the size of moving window was presented in the Appendix A.
Table 3.
Formulas of the severity index (SI).
3.2. Performance Evaluation
SDCI and VegDRI are typical drought indices with combined weather and land surface factors, similar to the ICDI developed in this study. For a comparative evaluation of these three indices (ICDI, SDCI, and VegDRI), the VegDRI product was obtained from the United States Geological Survey (USGS) [74], and the SDCI was calculated using Equation (2). The PCI required for this was calculated using the TRMM data (Equation (3)). TCI and VCI were obtained from the NOAA National Environmental Satellite, Data, and Information Service (NESDIS) [75].
SDCI = 0.5 × PCI + 0.25 × TCI + 0.25 × VCI
To evaluate the suitability of ICDI as a drought index and compare its capability for drought representation to that of SDCI and VegDRI, we conducted a case study by selecting four counties that had significant yield damages and two counties that did not. In general, crop productivity can vary depending on the physical, chemical, and biological characteristics of the soil [76]. Optimal Productivity Index (OPI) shows the crop productivity by reflecting the soil characteristics under the assumption that the soil is managed optimally. The OPI of Illinois is the highest in the central region and relatively high in the northern region but shows a decreasing pattern toward the south (Figure 2a). Furthermore, the distribution of the corn yield in 2004–2019 was similar to that of OPI (Figure 3). In Figure 4, the corn yield anomaly of each county was obtained, and the total was calculated based on the percentage class. The cases in which the corn yield of each county decreased by more than 10% compared to its 16-year average were set as the years damaged. The totals were calculated for the number of the years damaged and the average corn yield anomaly during the years damaged (Table 4). Based on these criteria, Franklin, Effingham, Marion, and Adams were selected as severely damaged counties, and Carroll and Lee as moderately damaged counties (Figure 2b and Figure 5). The number of the years damaged in Adams and Franklin, among the severely damaged group, was 5–6 during the 16 years. Effingham and Marion suffered the crop yield damage three times, but the average corn yield anomaly during the years reached almost −40%. The moderately damaged group suffered two times of the crop yield damages over the 16 years (Table 4).
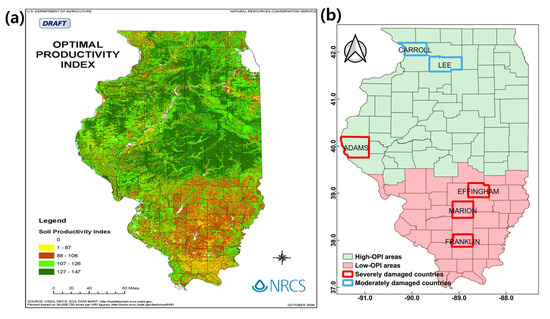
Figure 2.
Map of (a) optimal productivity index (OPI) [77] and (b) the selected counties for drought analysis in Illinois.
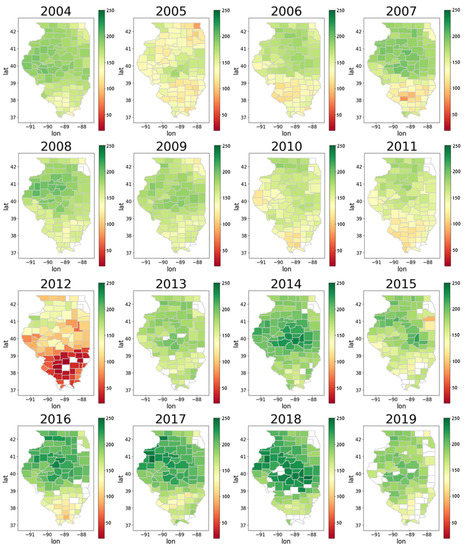
Figure 3.
Distribution of corn yields (bushels per acre) in Illinois, 2004–2019.
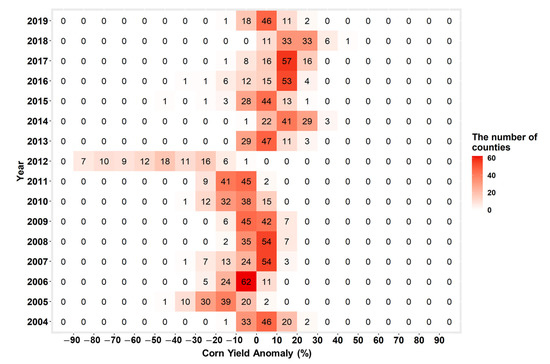
Figure 4.
Corn yield anomaly for each county in Illinois.
Table 4.
Severely and moderately damaged counties selected from Illinois, USA.
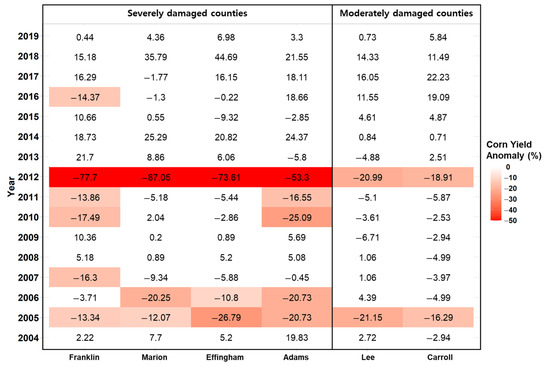
Figure 5.
Annual corn yield anomalies for counties with severely and moderately damaged counties in Illinois.
3.3. ICDI Classification
The drought intensity of the ICDI was classified into four categories by comprehensively considering the characteristics of the ICDI and its components and the yield anomalies during 2004–2019 (Table 5). The ICDI has a value in the range of −∞ to ∞, and we assume that it indicates a drought state when it falls below 0.5. As the value of ICDI decreases, the drought intensity increases, and it is classified into light, moderate, severe, and extreme drought. The light drought (ICDI < 0.5) indicates an endurable drought state for the crops whereby the air and the land surface are slightly dry. The moderate drought (ICDI < 0.25) indicates a drought state, in which the air and the land surface are relatively dry with a possibility of certain damage to the crop yield. The severe drought (ICDI < 0) indicates a drought state, in which the air and the land surface are very dry, with a possibility of severe damage to the crop yield. The extreme drought (ICDI < −0.5) indicates a drought state, in which the air and the land surface are extremely dry, with a possibility of very severe damage to the crop yield. We divided the threshold values (0.5, 0.25, 0, and −0.5) by taking account of the overall characteristics of ICDI and the convenience of perception. However, the threshold values should be more examined to consider the sensitivity to drought according to regional differences and crop type, which will require many case studies.
Table 5.
Classification of Integrated Crop Drought Index (ICDI).
4. Results and Discussion
4.1. Characteristics of Drought by Period and County
The overall drought trend of Illinois can be seen through the United States Drought Monitor (USDM) index. Figure 6 shows the monthly drought status in 2005 and 2012, with the percentage of the area size corresponding to D0 (abnormally dry), D1 (moderate drought), D2 (severe drought), D3 (extreme drought), and D4 (exceptional drought), respectively. Concerning the significant growth period (June to August) of corn [78], the drought was extremely severe, particularly in 2005 and 2012 [59,79,80].
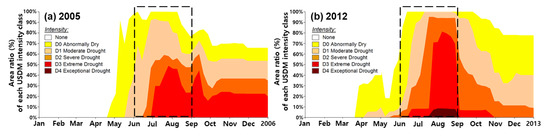
Figure 6.
Monthly drought status in Illinois in (a) 2005 and (b) 2012 [80].
We examined the characteristics of drought by period and county in more detail using ICDI3, the 3-month moving average of ICDI, considering the cumulative effects of meteorological and agricultural phenomena between cause and effect over time [81]. According to the comparison of the moving window size (Figure A1), ICDI1 and ICDI2 showed a short-term fluctuation, and ICDI6 produced a somewhat delayed response to drought. However, ICDI3 looks appropriate in terms of the temporal trend and timely response to drought. Adams and Franklin were the counties where the yield frequently declined in Illinois, and in the drought years (2005, 2006, 2007, and 2012) when the condition of ICDI3 < 0.25 persisted for a long time, the summer LST and PET were high, and the rainfall and SM were generally low (Figure 7). The evapotranspiration increased, and the SM decreased due to the lack of rainfall and the hot and dry air. The EVI increase slowed in July, the intensive growth season due to the effect of the drought, and particularly, this trend was observed more distinctively in 2012 when an extreme drought occurred (Figure 8a,d). In the six counties for our case study, the ICDI3 of May–September 2005 was between 0.5 and 0 (severe drought), and the corn yield decreased by 12.07% to 26.79% compared to the average. In 2006, Adams, Effingham, and Marion were in a moderate drought state with the ICDI3 of 0.04 to 0.2. The yield decreased from 10% to 20% compared to the average due to the drought lasting more than four months. In 2007, the ICDI3 of Franklin, Effingham, and Marion deteriorated severely, reaching almost 0.5 in June before recovering after July. Still, the corn yield decreased by a certain level due to the effect of the summer drought. In 2012, the ICDI3 fell significantly below 0.5, which continued through September (extreme drought), and in the moderately damaged counties, the yield had decreased by 18.91% to 20.99% compared to the average. In the severely damaged counties, the yield had decreased by 53.3% to 77.7% compared to the average.
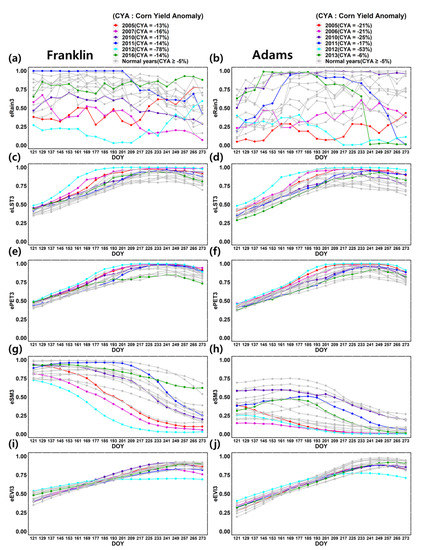
Figure 7.
Time-series of eRain3, eLST3, ePET3, eSM3, and eEVI3 in the severely damaged counties: eRain3 in Franklin (a) and Adams (b); eLST3 in Franklin (c) and Adams (d); ePET3 in Franklin (e) and Adams (f); eSM3 in Franklin (g) and Adams (h); eEVI3 in Franklin (i) and Adams (j).
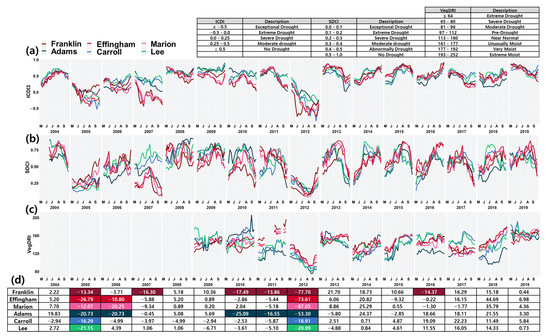
Figure 8.
Time series of (a) ICDI3, (b) SDCI (Scaled Drought Condition Index), (c) VegDRI (Vegetation Drought Response Index), and (d) corn yield anomaly (%) in severely and moderately damaged counties during 2004–2019. The VegDRI data from USGS (United States Geological Survey) was provided from 2009 onward.
Even without a drought, yield damage may occur if wet spring and dry summer are combined. For example, in the case of Franklin and Adams in 2011, there was a lot of rainfall in May and June, and because of the humid weather, the PET was low, and the SM was high (Figure 7). Furthermore, from July to September, the dry condition continued due to high LST and low rainfall, resulting in a moderate increase in the EVI. The ICDI3 was between 0.5 and 0.8 in May and June, showing a humid trend, which started to decrease in July due to hot and dry air, approaching 0 in September. As a result, the yield anomaly reached 13.86% and 16.55% in Franklin and Adams, respectively (Figure 8a,d). On the other hand, yield damage sometimes occurs due to too much rainfall [82,83]. In 2010, for example, Adams showed a 25.09% decrease in the yield compared to the average, and the cumulative precipitation between May and September was 868 mm, approximately 1.5 times higher than the average (558 mm), and rain fell almost every day throughout the two months of June and July. In Franklin in 2016, the cumulative precipitation from July to September was 450 mm, reaching almost 1.5 times the average (284 mm). The excessively wet soil condition in July–September led to a yield reduction of 14.37% compared to the average. Too much rainfall may affect crop productivity in various ways, such as soil erosion, direct physical damage, harvest delays, and increased diseases [84,85]. The ICDI slightly over 0.5 corresponds to no drought or humid state, and the ICDI much larger than 0.5 can denote a rainy season. The ICDI3 of Adams in 2010, which showed excessive summer wetness, was high at 0.5–0.75, and the ICDI3 of Franklin in 2016 reached 0.92 at the end of September, eventually leading to a decrease in the yield.
4.2. Comparison with Other Drought Indices
In 2005, the corn yield anomaly reached 26.79% in the severely damaged counties (Franklin, Effingham, Marion, and Adams), and in 2012 when the damage was at its worst, it reached 87.05% at its lowest (Table 6 and Table 7). The ICDI3 and the SDCI for the six counties (two moderately damaged and four severely damaged counties) indicated a moderate or severe drought state throughout the summer in 2005 and a severe or extreme drought state throughout the summer in 2012. On the other hand, VegDRI showed a declining pattern from June to August 2012 (Figure 8c) but indicated a near-normal or pre-drought state for most of the areas in June and July. All areas were classified as moderate drought in August (Table 7). In 2006, some counties suffered significant yield damages due to a drought. The corn yield anomaly was approximately 10% in Effingham and 20% in Adams and Marion (Figure 8d). A value of approximately 0 was maintained for the ICDI3 in these three counties, indicating a moderate or severe drought (Figure 8a). In the case of SDCI, Adams showed a moderate or severe drought, but no drought was indicated for Effingham and Marion (Figure 8b). In fact, in 2006, the severity index of PET and SM in the Effingham and Marion counties was below 0, indicating a very dry state compared to the normal years. Accordingly, the EVI worsened (Figure 9). However, it was assumed that the SDCI did not represent the water balance of the land surface properly because it did not use the PET and the SM. Furthermore, not all ICDI3 values coincided with the yield anomaly: for example, Adams in 2005. Although the degree of drought was not worse in Adams than in Marion or Carrol, the yield anomaly of Adams was worse than that of Marion or Carrol. A potential cause is due to the yield variability being different according to region. As shown in Figure 10, Adams had more variable yields than Marion and Carrol during 2004–2019, which resulted in some inconsistency between the drought index and the yield anomaly.
Table 6.
Drought indices in summer and the corn yield anomalies in 2005.
Table 7.
Drought indices in summer and the corn yield anomalies in 2012.
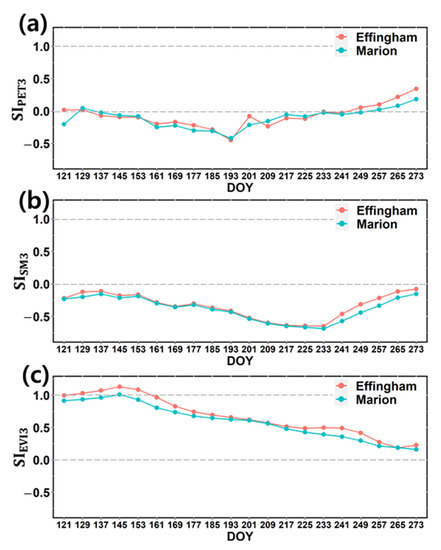
Figure 9.
Time-series of (a) , (b) , and (c) in Effingham and Marion in 2006.
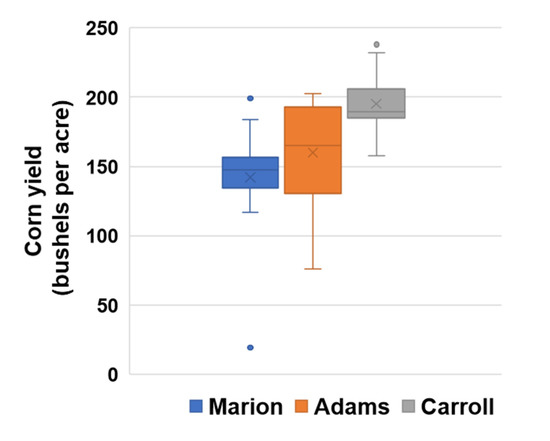
Figure 10.
The distribution of corn yields of Marion, Adams, and Carroll during 2004–2019.
4.3. Relationship between Drought Index and Crop Yield
The crucial growth period for corn is June–August, and the drought state of this period can have a significant impact on the crop yield [86]. Therefore, we analyzed the correlation between the average drought indices in June–August and the crop yield in that year. The ICDI combines the weather factors (rainfall and LST), hydrological factors (PET and SM), and a vegetation factor (EVI) to show the wet/dry state of land surface and the healthy/unhealthy state of vegetation together. The correlation between the ICDI and the corn yield was higher overall than similar drought indices (SDCI and VegDRI). In particular, the correlation was much higher in July and August than in June (Figure 11). Because corn kernels, which are closely related to the yield, develop in July and August, which correspond to the reproductive growth stage [87,88], crop yield may reflect the drought state sensitively [89,90]. Therefore, the high correlation between the ICDI of July and August and the crop yield of that year shows that the ICDI is very suitable as a drought index.
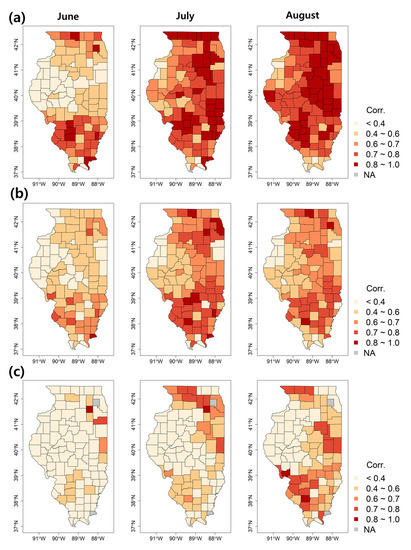
Figure 11.
Distribution of the correlation between annual corn yields and the monthly average of (a) ICDI, (b) SDCI, and (c) VegDRI.
In Figure 12, the average ICDI in summer (JJA) showed a considerable positive relationship with the corn yield anomaly during 2004–2019 (Corr. = 0.745). The slope of the regression line was steeper in the counties with low OPI, which means that the low-OPI counties were more sensitive to drought, and the yield damages were more serious. Such characteristics were also shown in the drought years (Figure 13). In 2005, however, the high-OPI counties suffered more serious yield damages, which was because of the degree of drought. Their ICDI values were overall lower than those of the low-OPI counties, so their yield anomaly was 5% to 40% for moderate drought state and 20% to 40% for severe drought state. In general, the regions with low-quality soil are more vulnerable to drought, although the response may be different according to region.
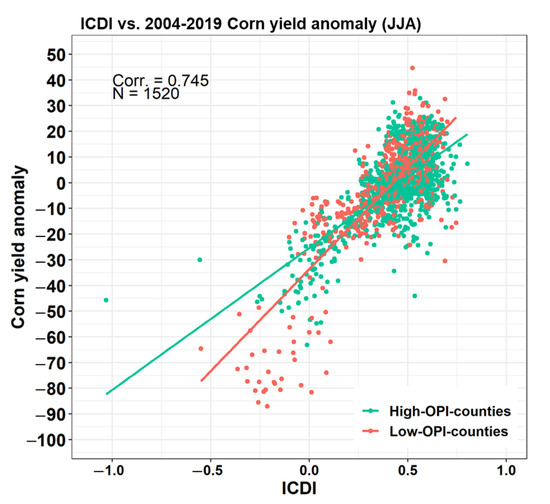
Figure 12.
Relationship between the average ICDI in summer (JJA) and the corn yield anomaly, 2004–2019.
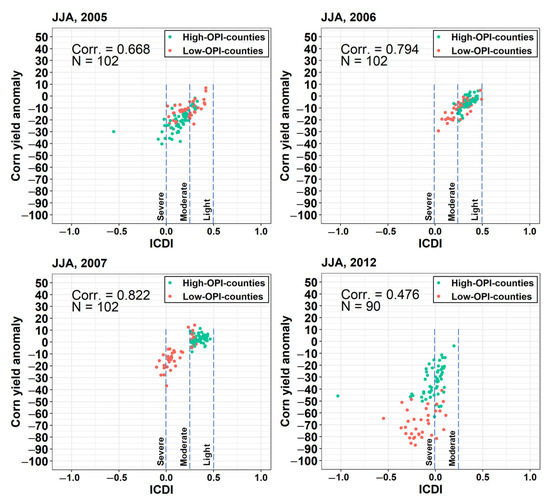
Figure 13.
Relationship between the average ICDI in summer (JJA) and the corn yield anomaly for the drought years (2005, 2006, 2007, and 2012).
5. Conclusions
In this study, we proposed the ICDI, which can appropriately represent agricultural drought by combining the weather factors (rainfall and LST), hydrological factors (PET and SM), and a vegetation factor (EVI) to show the wet/dry state of land surface and healthy/unhealthy state of vegetation together. The time-series changes of ICDI, ICDI’s components, and yield anomalies were analyzed for Illinois from 2004 to 2019, and the relationships with corn yields were investigated. The performance of the ICDI was evaluated through the comparisons with SDCI and VegDRI, which are the representative drought index in terms of the combination of the dryness and vegetation elements. The ICDI showed higher positive correlations with the corn yields than SDCI and VegDRI during the crucial growth period from June to August between 2004 and 2019, which means that the ICDI could reflect the drought conditions well in terms of the land surface dryness and vegetation health. SDCI did not detect the drought in some counties in 2006 because it did not use the PET and SM that are closely related to the water balance of land surface. VegDRI indicated a near-normal or pre-drought state for most of the damaged counties in June and July and a moderate drought in August in 2012, although it was the most extreme drought year all over the state.
The ICDI can be evaluated as appropriate to express the state of agricultural drought in terms of the water balance of land surface and the association with yield damage. However, because the performance of ICDI may be variable according to regions, crop types, irrigation efforts, and anthropogenic impacts on drought, more case studies will be necessary for a more suitable setting of the threshold values. In addition, the five factors of ICDI could be combined in a different way. For example, principal component analysis (PCA) can be an alternative to the combination of the factors, which can be one of the future directions for ICDI.
Author Contributions
Conceptualization, S.-J.L. and Y.L.; methodology, S.-J.L. and Y.L.; formal analysis, S.-J.L.; data curation, S.-J.L.; writing—original draft preparation, S.-J.L., N.K., and Y.L.; writing—review and editing, S.-J.L., N.K., and Y.L. All authors have read and agreed to the published version of the manuscript.
Funding
This work was supported by the National Research Foundation of Korea (NRF) grant funded by the Korean government (MSIT) (No. 2018R1D1A1B07050194). In addition, this work was carried out with the support of the “Cooperative Research Program for Agriculture Science & Technology Development (PJ014787042020)”, Rural Development Administration, Republic of Korea.
Data Availability Statement
Not applicable.
Conflicts of Interest
The authors declare no conflict of interest.
Abbreviations
| AWC | Available water content |
| Corr. | Correlation coefficient |
| ECDF | Empirical cumulative distribution function |
| eEVI | EVI in ECDF percentile unit |
| eLST | LST in ECDF percentile unit |
| ePET | PET in ECDF percentile unit |
| eRain | Rain in ECDF percentile unit |
| eSM | SM in ECDF percentile unit |
| EVI | Enhanced Vegetation Index |
| FC | Field capacity |
| GLDAS | Global Land Data Assimilation System |
| ICDI | Integrated Crop Drought Index |
| LST | Land surface temperature |
| MODIS | Moderate Resolution Imaging Spectroradiometer |
| NASS | National Agricultural Statistics Service |
| NDVI | Normalized Difference Vegetation Index |
| NESDIS | NOAA National Environmental Satellite, Data, and Information Service |
| OPI | Optimal Productivity Index |
| PCI | Precipitation Condition Index |
| PDSI | Palmer Drought Severity Index |
| PET | Potential evapotranspiration |
| RMSE | Root Mean Square Error |
| SDCI | Scaled Drought Condition Index |
| SI | Severity index |
| SM | Soil moisture content |
| SPEI | Standardized Precipitation Evapotranspiration Index |
| SPI | Standardized Precipitation Index |
| SWDI | Soil Water Deficit Index |
| TCI | Temperature Condition Index |
| TRMM | Tropical Rainfall Measuring Mission |
| USDA | United States Department of Agriculture |
| USDM | United States Drought Monitor |
| USGS | United States Geological Survey |
| VCI | Vegetation Condition Index |
| VegDRI | Vegetation Drought Response Index |
| VHI | Vegetation Health Index |
Appendix A

Figure A1.
Comparison of ICDI according to the period of moving average: (a) ICDI1 (1 month), (b) ICDI2 (2 months), (c) ICDI3 (3 months), and (d) ICDI6 (6 months).
Figure A1.
Comparison of ICDI according to the period of moving average: (a) ICDI1 (1 month), (b) ICDI2 (2 months), (c) ICDI3 (3 months), and (d) ICDI6 (6 months).

References
- Allen, C.D.; Macalady, A.K.; Chenchouni, H.; Bachelet, D.; McDowell, N.; Vennetier, M.; Kitzberger, T.; Rigling, A.; Breshears, D.D.; Hogg, E.H.; et al. A global overview of drought and heat-induced tree mortality reveals emerging climate change risks for forests. For. Ecol. Manag. 2010, 259, 660–684. [Google Scholar] [CrossRef]
- Mora, C.; Spirandelli, D.; Franklin, E.C.; Lynham, J.; Kantar, M.B.; Miles, W.; Smith, C.Z.; Freel, K.; Moy, J.; Louis, L.V.; et al. Broad threat to humanity from cumulative climate hazards intensified by greenhouse gas emissions. Nat. Clim. Chang. 2018, 8, 1062–1071. [Google Scholar] [CrossRef]
- He, X.; Estes, L.; Konar, M.; Tian, D.; Anghileri, D.; Baylis, K.; Evans, T.; Sheffield, J. Integrated approaches to understanding and reducing drought impact on food security across scales. Curr. Opin. Environ. Sustain. 2019, 40, 43–54. [Google Scholar] [CrossRef]
- Javadinejad, S.; Dara, R.; Jafary, F. Analysis and prioritization the effective factors on increasing farmers resilience under climate change and drought. Agric. Res. 2020, 9, 1–17. [Google Scholar]
- Spinoni, J.; Barbosa, P.; De Jager, A.; McCormick, N.; Naumann, G.; Vogt, J.V.; Magni, D.; Masante, D.; Mazzeschi, M. A new global database of meteorological drought events from 1951 to 2016. J. Hydrol. Reg. Stud. 2019, 22, 100593. [Google Scholar] [CrossRef]
- Le Page, M.; Zribi, M. Analysis and predictability of drought in Northwest Africa using optical and microwave satellite remote sensing products. Sci. Rep. 2019, 9, 1466. [Google Scholar] [CrossRef]
- Cook, E.R.; Seager, R.; Cane, M.A.; Stahle, D.W. North American drought: Reconstructions, causes, and consequences. Earth Sci. Rev. 2007, 81, 93–134. [Google Scholar] [CrossRef]
- Alvala, R.; Cunha, A.P.; Brito, S.S.; Seluchi, M.E.; Marengo, J.A.; Moraes, O.L.; Carvalho, M.A. Drought monitoring in the Brazilian Semiarid region. An. Acad. Bras. Ciênc. 2019, 91, 1–15. [Google Scholar] [CrossRef] [PubMed]
- Wilhite, D.A. Chapter 1 Drought as a Natural Hazard: Concepts and Definitions. In Drought: A Global Assessment; Wilhite, D.A., Ed.; Routledge: London, UK, 2000; Volume 1, pp. 3–18. [Google Scholar]
- McKee, T.B.; Doesken, N.J.; Kleist, J. The relationship of drought frequency and duration to time scales. In Proceedings of the 8th Conference on Applied Climatology, Anaheim, CA, USA, 17–22 January 1993. [Google Scholar]
- Almedeij, J. Drought analysis for kuwait using standardized precipitation index. Sci. World J. 2014, 2014, 451841. [Google Scholar] [CrossRef] [PubMed]
- Wilhite, D.A.; Glantz, M.H. Understanding: The drought phenomenon: The role of definitions. Water Int. 1985, 10, 111–120. [Google Scholar] [CrossRef]
- Mishra, A.K.; Singh, V.P. A review of drought concepts. J. Hydrol. 2010, 391, 202–216. [Google Scholar] [CrossRef]
- Van Loon, A.F. Hydrological drought explained. WIREs Water 2015, 2, 359–392. [Google Scholar] [CrossRef]
- Wilhite, D.A.; Svoboda, M.D. Drought early warning systems in the context of drought preparedness and mitigation. In Proceedings of the An Expert Group Meeting on Early Warning Systems, Lisbon, Portugal, 5–7 September 2000. [Google Scholar]
- Zhao, M.; Huang, S.; Huang, Q.; Wang, H.; Leng, G.; Xie, Y. Assessing socio-economic drought evolution characteristics and their possible meteorological driving force. Geomat. Nat. Hazards Risk 2019, 10, 1084–1101. [Google Scholar] [CrossRef]
- Guo, Y.; Huang, S.; Huang, Q.; Wang, H.; Fang, W.; Yang, Y.; Wang, L. Assessing socioeconomic drought based on an improved Multivariate Standardized Reliability and Resilience Index. J. Hydrol. 2019, 568, 904–918. [Google Scholar] [CrossRef]
- Kogan, F.; Guo, W.; Yang, W. Drought and food security prediction from NOAA new generation of operational satellites. Geomat. Nat. Hazards Risk 2019, 10, 651–666. [Google Scholar] [CrossRef]
- Rippey, B.R. The US drought of 2012. Weather Clim. Extrem. 2015, 10, 57–64. [Google Scholar] [CrossRef]
- Goulden, M.L.; Bales, R.C. California forest die-off linked to multi-year deep soil drying in 2012–2015 drought. Nat. Geosci. 2019, 12, 632–637. [Google Scholar] [CrossRef]
- Dalezios, N.R.; Dunkel, Z.; Eslamian, S. Meteorological drought indices: Definitions. In Handbook of Drought and Water Scarcity, Principles of Drought and Water Scarcity; Eslamian, S., Eslamian, F., Eds.; CRC Press: New York, NY, USA, 2017; Volume 1, pp. 27–44. [Google Scholar]
- Homdee, T.; Pongput, K.; Kanae, S. A comparative performance analysis of three standardized climatic drought indices in the Chi River basin, Thailand. Agric. Nat. Resour. 2016, 50, 211–219. [Google Scholar] [CrossRef]
- Parsons, D.J.; Rey, D.; Tanguy, M.; Holman, I.P. Regional variations in the link between drought indices and reported agricultural impacts of drought. Agric. Syst. 2019, 173, 119–129. [Google Scholar] [CrossRef]
- Moorhead, J.E.; Gowda, P.H.; Singh, V.P.; Porter, D.O.; Marek, T.H.; Howell, T.A.; Stewart, B.A. Identifying and evaluating a suitable index for agricultural drought monitoring in the Texas high plains. J. Am. Water Resour. Assoc. 2015, 51, 807–820. [Google Scholar] [CrossRef]
- Gunda, T.; Hornberger, G.M.; Gilligan, J.M. Spatiotemporal patterns of agricultural drought in Sri Lanka: 1881–2010. Int. J. Climatol. 2016, 36, 563–575. [Google Scholar] [CrossRef]
- Martínez-Fernández, J.; González-Zamora, A.; Sánchez, N.; Gumuzzio, A. A soil water based index as a suitable agricultural drought indicator. J. Hydrol. 2015, 522, 265–273. [Google Scholar] [CrossRef]
- Martínez-Fernández, J.; González-Zamora, A.; Sánchez, N.; Gumuzzio, A.; Herrero-Jiménez, C.M. Satellite soil moisture for agricultural drought monitoring: Assessment of the SMOS derived Soil Water Deficit Index. Remote Sens. Environ. 2016, 177, 277–286. [Google Scholar] [CrossRef]
- Sruthi, S.; Aslam, M.M. Agricultural drought analysis using the NDVI and land surface temperature data; a case study of Raichur district. Aquat. Procedia 2015, 4, 1258–1264. [Google Scholar] [CrossRef]
- Dutta, D.; Kundu, A.; Patel, N.R. Predicting agricultural drought in eastern Rajasthan of India using NDVI and standardized precipitation index. Geocarto Int. 2013, 28, 192–209. [Google Scholar] [CrossRef]
- Sholihah, R.I.; Trisasongko, B.H.; Shiddiq, D.; La Ode, S.I.; Kusdaryanto, S.; Panuju, D.R. Identification of agricultural drought extent based on vegetation health indices of Landsat data: Case of Subang and Karawang, Indonesia. Procedia Environ. Sci. 2016, 33, 14–20. [Google Scholar] [CrossRef]
- Kogan, F.N. Operational space technology for global vegetation assessment. Bull. Am. Meteorol. Soc. 2001, 82, 1949–1964. [Google Scholar] [CrossRef]
- Brown, J.F.; Wardlow, B.D.; Tadesse, T.; Hayes, M.J.; Reed, B.C. The Vegetation Drought Response Index (VegDRI): A new integrated approach for monitoring drought stress in vegetation. GIsci. Remote Sens. 2008, 45, 16–46. [Google Scholar] [CrossRef]
- Brown, J.F. Drought Monitoring with VegDRI; United States Geological Survey: Reston, VA, USA, 2010.
- Rhee, J.; Im, J.; Carbone, G.J. Monitoring agricultural drought for arid and humid regions using multi-sensor remote sensing data. Remote Sens. Environ. 2010, 114, 2875–2887. [Google Scholar] [CrossRef]
- Svoboda, M.; Hayes, M.; Wood, D.A. Standardized Precipitation Index User Guide; World Meteorological Organization (WMO): Geneva, Switzerland, 2012; pp. 1–24. [Google Scholar]
- Hayes, M.J.; Svoboda, M.D.; Wiihite, D.A.; Vanyarkho, O.V. Monitoring the 1996 drought using the standardized precipitation index. Bull. Am. Meteorol. Soc. 1999, 80, 429–438. [Google Scholar] [CrossRef]
- Vicente-Serrano, S.M.; Beguería, S.; López-Moreno, J.I. A multiscalar drought index sensitive to global warming: The standardized precipitation evapotranspiration index. J. Clim. 2010, 23, 1696–1718. [Google Scholar] [CrossRef]
- Piedallu, C.; Gégout, J.C.; Perez, V.; Lebourgeois, F. Soil water balance performs better than climatic water variables in tree species distribution modelling. Glob. Ecol. Biogeogr. 2013, 22, 470–482. [Google Scholar] [CrossRef]
- Manning, C.; Widmann, M.; Bevacqua, E.; Van Loon, A.F.; Maraun, D.; Vrac, M. Soil moisture drought in Europe: A compound event of precipitation and potential evapotranspiration on multiple time scales. J. Hydrometeorol. 2018, 19, 1255–1271. [Google Scholar] [CrossRef]
- Szewczak, K.; Łoś, H.; Pudełko, R.; Doroszewski, A.; Gluba, Ł.; Łukowski, M.; Rafalska-Przysucha, A.; Słominski, J.; Usowicz, B. Agricultural Drought Monitoring by MODIS Potential Evapotranspiration Remote Sensing Data Application. Remote Sens. 2020, 12, 3411. [Google Scholar] [CrossRef]
- Pham, H.X.; Shamseldin, A.Y.; Melville, B.W. Assessment of climate change impact on water balance of forested and farmed catchments. J. Hydrol. Eng. 2015, 20, 04015009. [Google Scholar] [CrossRef]
- Cowley, G.S.; Niemann, J.D.; Green, T.R.; Seyfried, M.S.; Jones, A.S.; Grazaitis, P.J. Impacts of precipitation and potential evapotranspiration patterns on downscaling soil moisture in regions with large topographic relief. Water Resour. Res. 2017, 53, 1553–1574. [Google Scholar] [CrossRef]
- Lozano-Parra, J.; Schnabel, S.; Pulido, M.; Gómez-Gutiérrez, Á.; Lavado-Contador, F. Effects of soil moisture and vegetation cover on biomass growth in water-limited environments. Land Degrad. Dev. 2018, 29, 4405–4414. [Google Scholar] [CrossRef]
- Beguería, S.; Vicente-Serrano, S.M.; Reig, F.; Latorre, B. Standardized precipitation evapotranspiration index (SPEI) revisited: Parameter fitting, evapotranspiration models, tools, datasets and drought monitoring. Int. J. Climatol. 2014, 34, 3001–3023. [Google Scholar] [CrossRef]
- Tian, Y.; Xu, Y.P.; Wang, G. Agricultural drought prediction using climate indices based on Support Vector Regression in Xiangjiang River basin. Sci. Total Environ. 2018, 622, 710–720. [Google Scholar] [CrossRef]
- Vicente-Serrano, S.M.; Beguería, S.; Lorenzo-Lacruz, J.; Camarero, J.J.; López-Moreno, J.I.; Azorin-Molina, C.; Revuelto, J.; Morán-Tejeda, E.; Sanchez-Lorenzo, A. Performance of Drought Indices for Ecological, Agricultural, and Hydrological Applications. Earth Interact. 2012, 16, 1–27. [Google Scholar] [CrossRef]
- Wang, H.; Rogers, J.C.; Munroe, D.K. Commonly used drought indices as indicators of soil moisture in China. J. Hydrometeorol. 2015, 16, 1397–1408. [Google Scholar] [CrossRef]
- Ogunrinde, A.T.; Oguntunde, P.G.; Olasehinde, D.A.; Fasinmirin, J.T.; Akinwumiju, A.S. Drought spatiotemporal characterization using self-calibrating Palmer Drought Severity Index in the northern region of Nigeria. Results Eng. 2020, 5, 100088. [Google Scholar] [CrossRef]
- Li, Z.; Chen, Y.; Fang, G.; Li, Y. Multivariate assessment and attribution of droughts in Central Asia. Sci. Rep. 2017, 7, 1316. [Google Scholar] [CrossRef] [PubMed]
- Yu, H.; Zhang, Q.; Xu, C.Y.; Du, J.; Sun, P.; Hu, P. Modified palmer drought severity index: Model improvement and application. Environ. Int. 2019, 130, 104951. [Google Scholar] [CrossRef]
- Dalezios, N.R.; Gobin, A.; Tarquis Alfonso, A.M.; Eslamian, S. Agricultural drought indices: Combining crop, climate, and soil factors. In Handbook of Drought and Water Scarcity, Principles of Drought and Water Scarcity; Eslamian, S., Eslamian, F., Eds.; CRC Press: New York, NY, USA, 2017; Volume 1, pp. 73–90. [Google Scholar]
- Zhao, S.; Cong, D.; He, K.; Yang, H.; Qin, Z. Spatial-temporal variation of drought in China from 1982 to 2010 based on a modified temperature vegetation drought index (mTVDI). Sci Rep. 2017, 7, 17473. [Google Scholar] [CrossRef]
- Han, Y.; Li, Z.; Huang, C.; Zhou, Y.; Zong, S.; Hao, T.; Niu, H.; Yao, H. Monitoring droughts in the Greater Changbai Mountains using multiple remote sensing-based drought indices. Remote Sens. 2020, 12, 530. [Google Scholar] [CrossRef]
- Karnieli, A.; Agam, N.; Pinker, R.T.; Anderson, M.; Imhoff, M.L.; Gutman, G.G.; Panov, N.; Goldberg, A. Use of NDVI and land surface temperature for drought assessment: Merits and limitations. J. Clim. 2010, 23, 618–633. [Google Scholar] [CrossRef]
- Nanzad, L.; Zhang, J.; Tuvdendorj, B.; Nabil, M.; Zhang, S.; Bai, Y. NDVI anomaly for drought monitoring and its correlation with climate factors over Mongolia from 2000 to 2016. J. Arid Environ. 2019, 164, 69–77. [Google Scholar] [CrossRef]
- Cao, Y.; Chen, S.; Wang, L.; Zhu, B.; Lu, T.; Yu, Y. An agricultural drought index for assessing droughts using a water balance method: A case study in Jilin Province, Northeast China. Remote Sens. 2019, 11, 1066. [Google Scholar] [CrossRef]
- United States Department of Agriculture (USDA) National Agricultural Statistics Service (NASS) Crop Production 2019 Summary. Available online: https://www.nass.usda.gov/Publications/Todays_Reports/reports/cropan20.pdf (accessed on 16 November 2020).
- Kottek, M.; Grieser, J.; Beck, C.; Rudolf, B.; Rubel, F. World Map of the Köppen-Geiger climate classification updated. Meteorol. Z. 2006, 15, 259–263. [Google Scholar] [CrossRef]
- Seo, B.; Lee, J.; Lee, K.D.; Hong, S.; Kang, S. Improving remotely-sensed crop monitoring by NDVI-based crop phenology estimators for corn and soybeans in Iowa and Illinois, USA. Field Crop. Res. 2019, 238, 113–128. [Google Scholar] [CrossRef]
- Knapp, H.V.; Angel, J.R.; Atkins, J.R.; Bard, L.; Getahun, E.; Hlinka, K.J.; Keefer, L.L.; Kelly, W.R.; Roadcap, G.S. The 2012 Drought in Illinois. ISWSRI-123; Prairie Research Institute: Champaign, IL, USA, 2017. [Google Scholar]
- World Maps of Köppen-Geiger Climate Classification. Available online: http://koeppen-geiger.vu-wien.ac.at/ (accessed on 16 November 2020).
- Huete, A.; Justice, C.; van Leeuwen, W. MODIS Vegetation Index (MOD13) Algorithm Theoretical Basis Document; Version 3; NASA Goddard Space Flight Center: Greenbelt, MD, USA, 1999.
- Qiu, J.; Yang, J.; Wang, Y.; Su, H. A comparison of NDVI and EVI in the DisTrad model for thermal sub-pixel mapping in densely vegetated areas: A case study in Southern China. Int. J. Remote Sens. 2018, 39, 2105–2118. [Google Scholar] [CrossRef]
- Rui, H.; Beaudoing, H. README Document for NASA GLDAS Version 2 Data Products; Goddard Earth Sciences Data and Information Services Center (GES DISC): Greenbelt, MD, USA, 2018.
- Rodell, M.; Houser, P.R.; Jambor, U.; Gottschalck, J.; Mitchell, K.; Meng, C.-J.; Arsenault, K.; Cosgrove, B.; Radakovich, J.; Bosilovich, M.; et al. The Global Land Data Assimilation System. Bull. Am. Meteorol. Soc. 2004, 85, 381–394. [Google Scholar] [CrossRef]
- Chen, S.; Hong, Y.; Gourley, J.J.; Huffman, G.J.; Tian, Y.; Cao, Q.; Yong, B.; Kirstetter, P.-E.; Hu, J.; Hardy, J.; et al. Evaluation of the successive V6 and V7 TRMM multisatellite precipitation analysis over the Continental United States. Water Resour. Res. 2013, 49, 8174–8186. [Google Scholar] [CrossRef]
- Duan, S.-B.; Li, Z.-L.; Li, H.; Göttsche, F.-M.; Wu, H.; Zhao, W.; Leng, P.; Zhang, X.; Coll, C. Validation of Collection 6 MODIS land surface temperature product using in situ measurements. Remote Sens. Environ. 2019, 225, 16–29. [Google Scholar] [CrossRef]
- Mu, Q.; Zhao, M.; Running, S.W. Improvements to a MODIS global terrestrial evapotranspiration algorithm. Remote Sens. Environ. 2011, 115, 1781–1800. [Google Scholar] [CrossRef]
- How Accurate Is NASA GLDAS Data? Available online: https://disc.gsfc.nasa.gov/information/faqs?title=How%20accurate%20is%20NASA%20GLDAS%20data%3F (accessed on 1 April 2021).
- United States Department of Agriculture (USDA) National Agricultural Statistics Service (NASS) Quick Stats. Available online: https://quickstats.nass.usda.gov/ (accessed on 27 May 2020).
- De Carvalho, O.A.; Guimaraes, R.F.; Gomes, R.A.T.; Da Silva, N.C. Time series interpolation. IEEE Int. Geosci. Remote Sens. Symp. 2007, 1959–1961. [Google Scholar] [CrossRef]
- Weiss, D.J.; Atkinson, P.M.; Bhatt, S.; Mappin, B.; Hay, S.I.; Gething, P.W. An effective approach for gap-filling continental scale remotely sensed time-series. ISPRS J. Photogramm. Remote Sens. 2014, 98, 106–118. [Google Scholar] [CrossRef]
- Li, X.; Shen, R.; Chen, R. Improving Time Series Reconstruction by Fixing Invalid Values and its Fidelity Evaluation. IEEE Access. 2019, 8, 7558–7572. [Google Scholar] [CrossRef]
- United States Geological Survey (USGS) Science for a Changing World EarthExplorer. Available online: https://earthexplorer.usgs.gov/ (accessed on 2 November 2020).
- NOAA National Environmental Satellite, Data, and Information Service (NESDIS) STAR Center for Satellite Applications and Research. Available online: https://www.star.nesdis.noaa.gov/smcd/emb/vci/VH/index.php (accessed on 2 November 2020).
- Olson, K.R.; Lang, J.M. Bulletin 811: Optimum Crop Productivity Ratings for Illinois Soils; ACES Illinois: Urbana, IL, USA, 2000. [Google Scholar]
- United States Department of Agriculture (USDA) Natural Resources Conservation Service (NRCS) Optimal Productivity Index (OPI). 2009. Available online: https://www.nrcs.usda.gov/Internet/FSE_MEDIA/stelprdb1167165.jpg (accessed on 4 October 2020).
- USDA-NASS. Field Crops: Usual Planting and Harvesting Dates. Agricultural Handbook 628; USDA NASS: Washington, DC, USA, 2010.
- NOAA National Centers for Environmental Information, State of the Climate: Drought for Annual. Available online: https://www.ncdc.noaa.gov/sotc/drought/ (accessed on 28 December 2020).
- NIDIS. The U.S. Drought Monitor (USDM). Drought in Illinois from 2000–Present. Available online: https://www.drought.gov/states/illinois (accessed on 2 January 2021).
- Huang, Y.; Liu, X.; Shen, Y.; Jin, J. Assessment of Agricultural Drought Indicators Impact on Soybean Crop Yield: A Case Study in Iowa, USA. In Proceedings of the 2014 The Third International Conference on Agro-Geoinformatics, Beijing, China, 11–14 August 2014; pp. 1–6. [Google Scholar]
- Schnitkey, G. How Poor Were 2010 Corn Yields in Illinois? Farmdoc Dly. 2011, 1, 52. [Google Scholar]
- Hohl, R.M. Agricultural Risk Transfer: From Insurance to Reinsurance to Capital Markets; John Wiley & Sons: West Sussex, UK, 2019; p. 261. [Google Scholar]
- Li, Y.; Guan, K.; Schnitkey, G.D.; DeLucia, E.; Peng, B. Excessive rainfall leads to maize yield loss of a comparable magnitude to extreme drought in the United States. Glob. Chang. Biol. 2019, 25, 2325–2337. [Google Scholar] [CrossRef] [PubMed]
- Roesch-McNally, G.E.; Arbuckle, J.G.; Tyndall, J.C. What would farmers do? Adaptation intentions under a Corn Belt climate change scenario. Agric. Hum. Values 2017, 34, 333–346. [Google Scholar] [CrossRef]
- Li, P.; Omani, N.; Chaubey, I.; Wei, X. Evaluation of drought implications on ecosystem services: Freshwater provisioning and food provisioning in the upper Mississippi River basin. Int. J. Environ. Res. Public Health 2017, 14, 496. [Google Scholar] [CrossRef] [PubMed]
- Lee, C.; Herbek, J.; Murdock, L.; Schwab, G.; Green, J.D.; Martin, J. Corn and Soybean Production Calendar; University of Kentucky Cooperative Extension Service: Lexington, KY, USA, 2007. [Google Scholar]
- Hanway, J.J. How a Corn Plant Develops. Special Report 48; Iowa State University Digital Repository: Ames, IA, USA, 1966. [Google Scholar]
- Goldblum, D. Sensitivity of corn and soybean yield in Illinois to air temperature and precipitation: The potential impact of future climate change. Phys. Geogr. 2009, 30, 27–42. [Google Scholar] [CrossRef]
- Westcott, P.; Jewison, M. Weather Effects on Expected Corn and Soybean Yields; USDA: Washington, DC, USA, 2013; FDS-13g-01.


Publisher’s Note: MDPI stays neutral with regard to jurisdictional claims in published maps and institutional affiliations. |
© 2021 by the authors. Licensee MDPI, Basel, Switzerland. This article is an open access article distributed under the terms and conditions of the Creative Commons Attribution (CC BY) license (https://creativecommons.org/licenses/by/4.0/).