
Applications of Unmanned Aerial Systems (UASs) in Hydrology: A Review

 ,
,  ,
,  ,
,  and
and 
Abstract

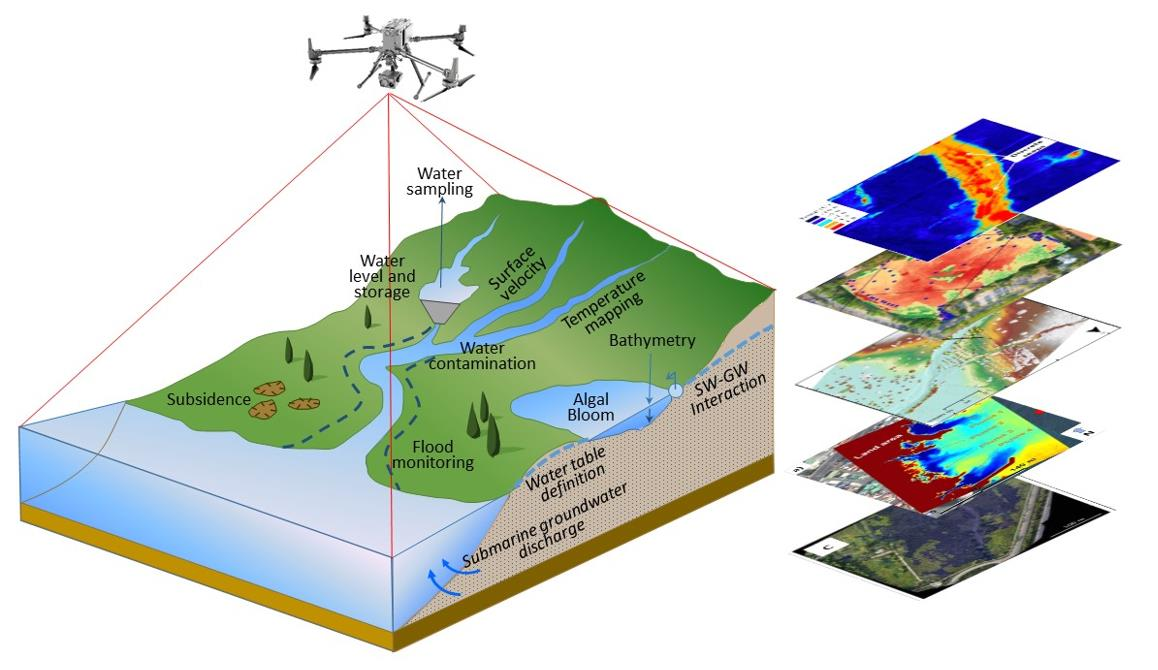
1. Introduction
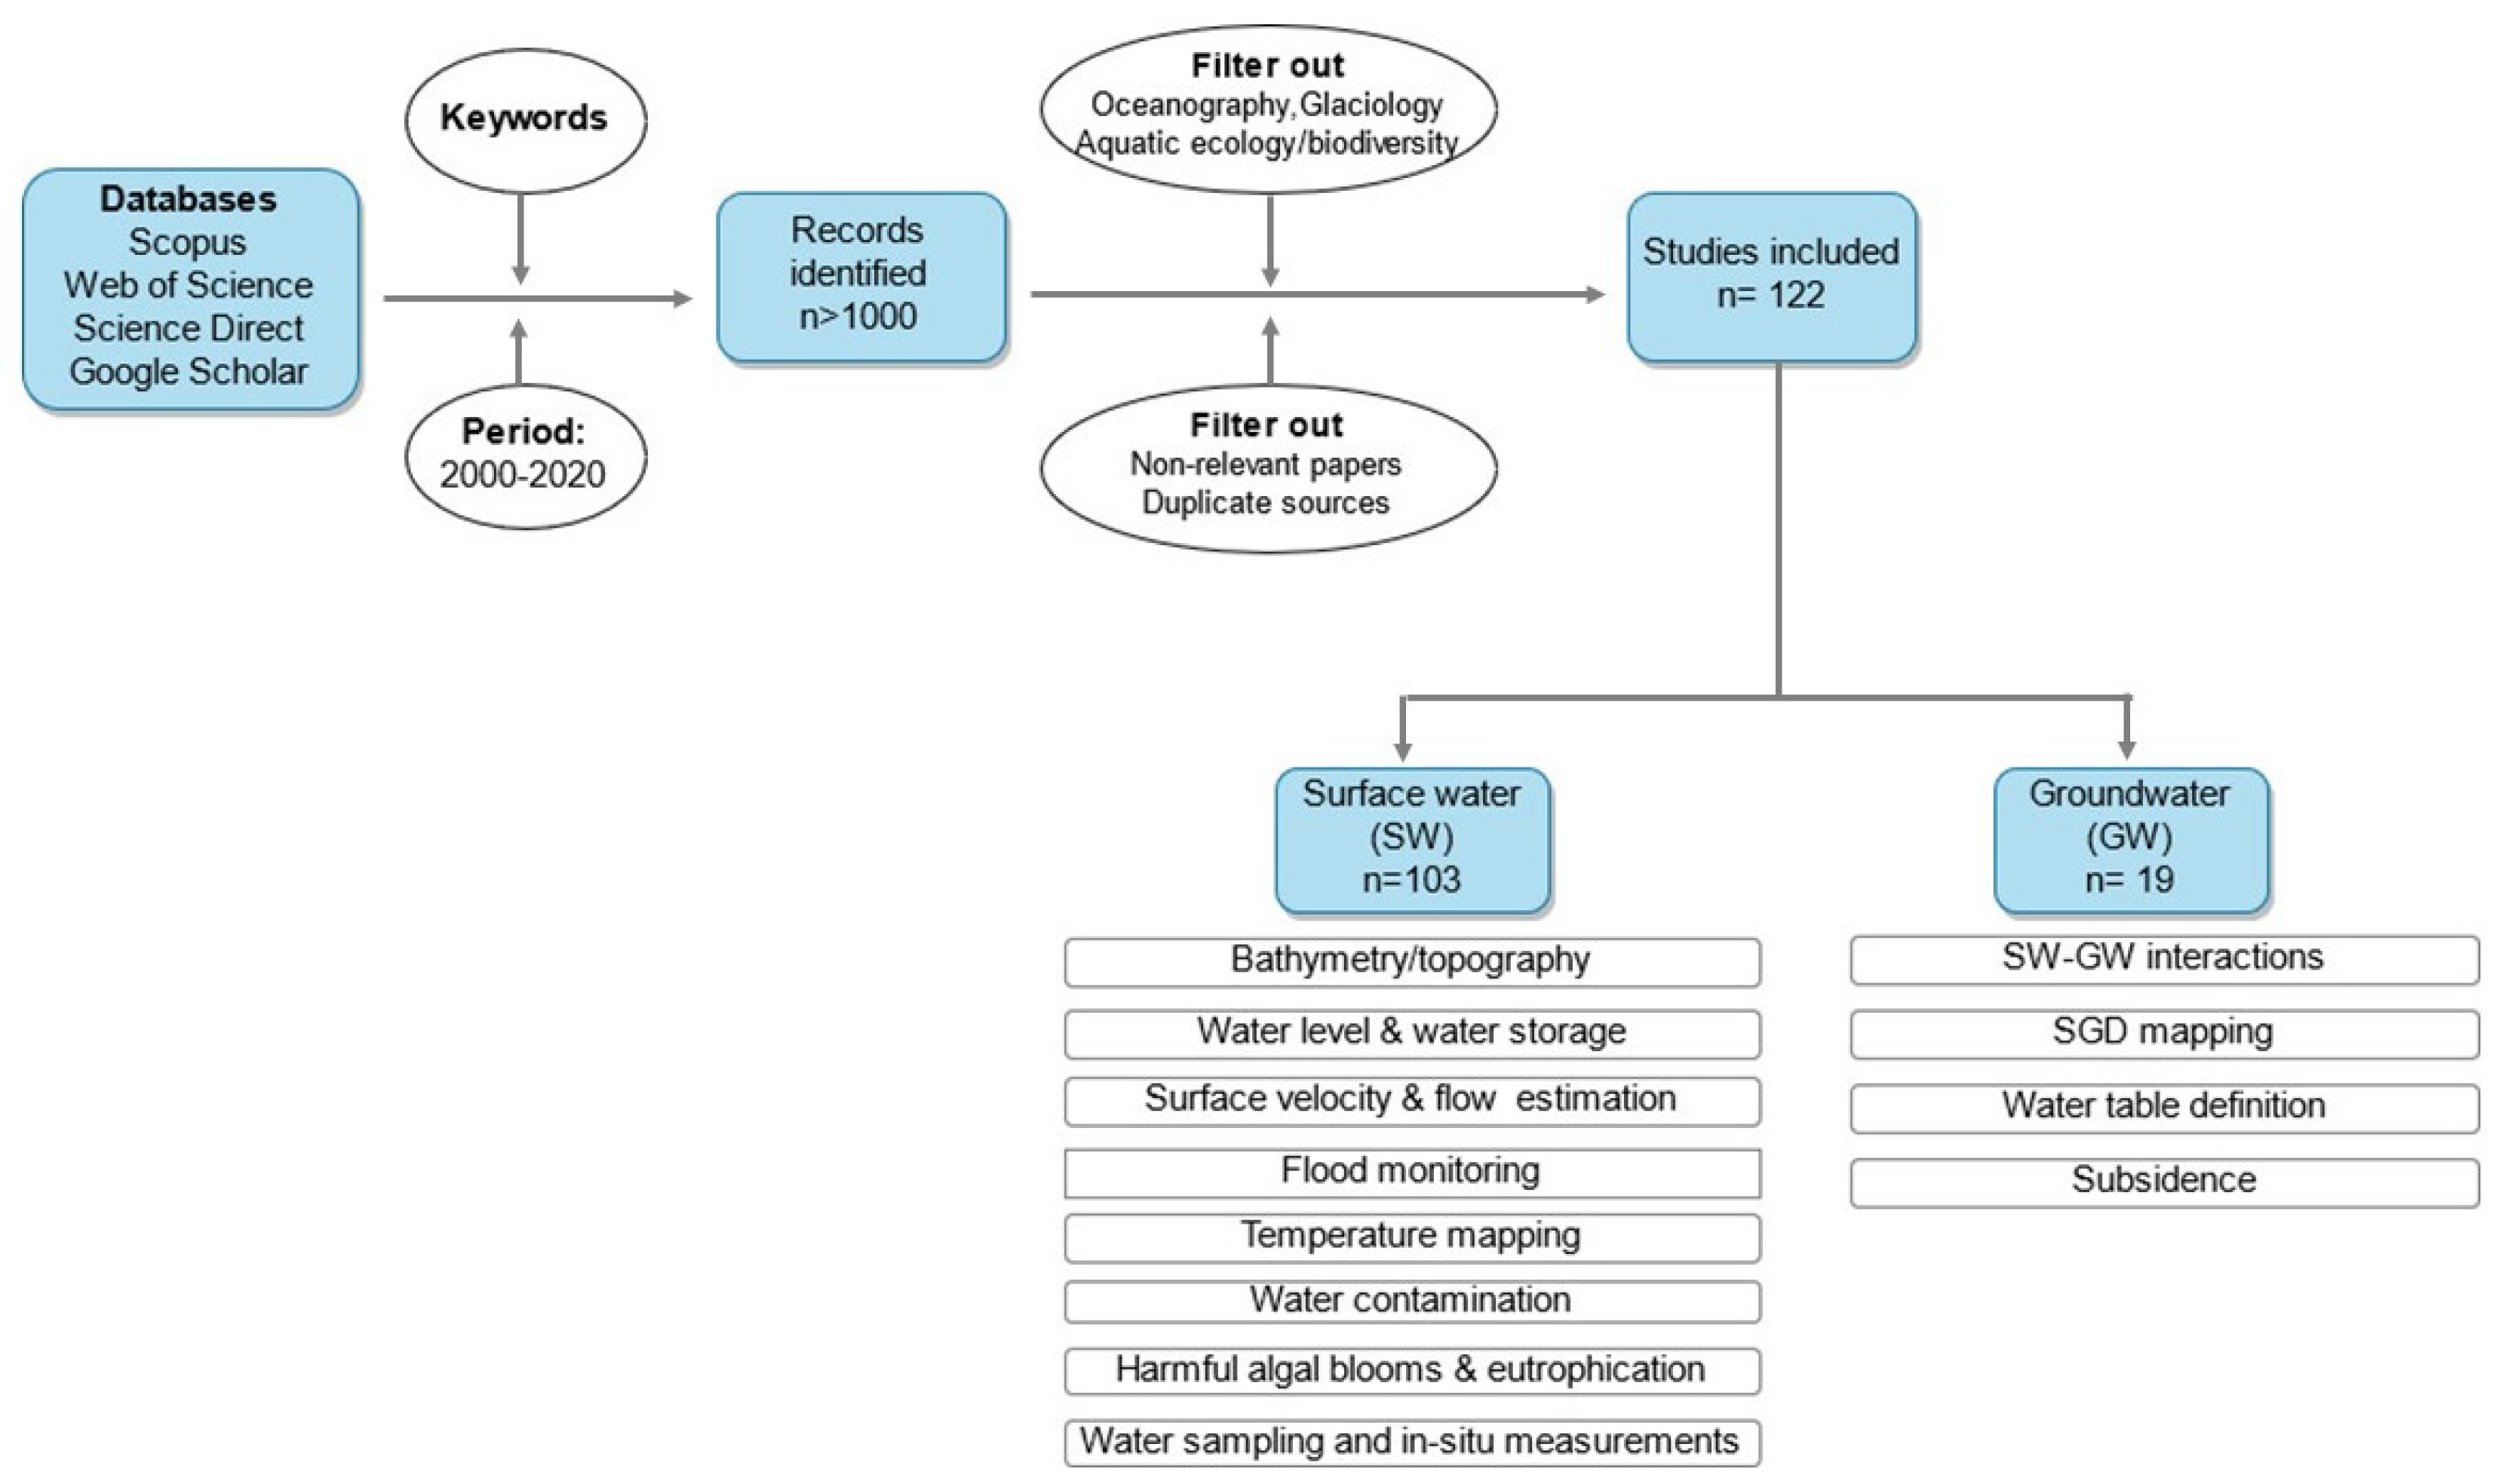
2. Methodology
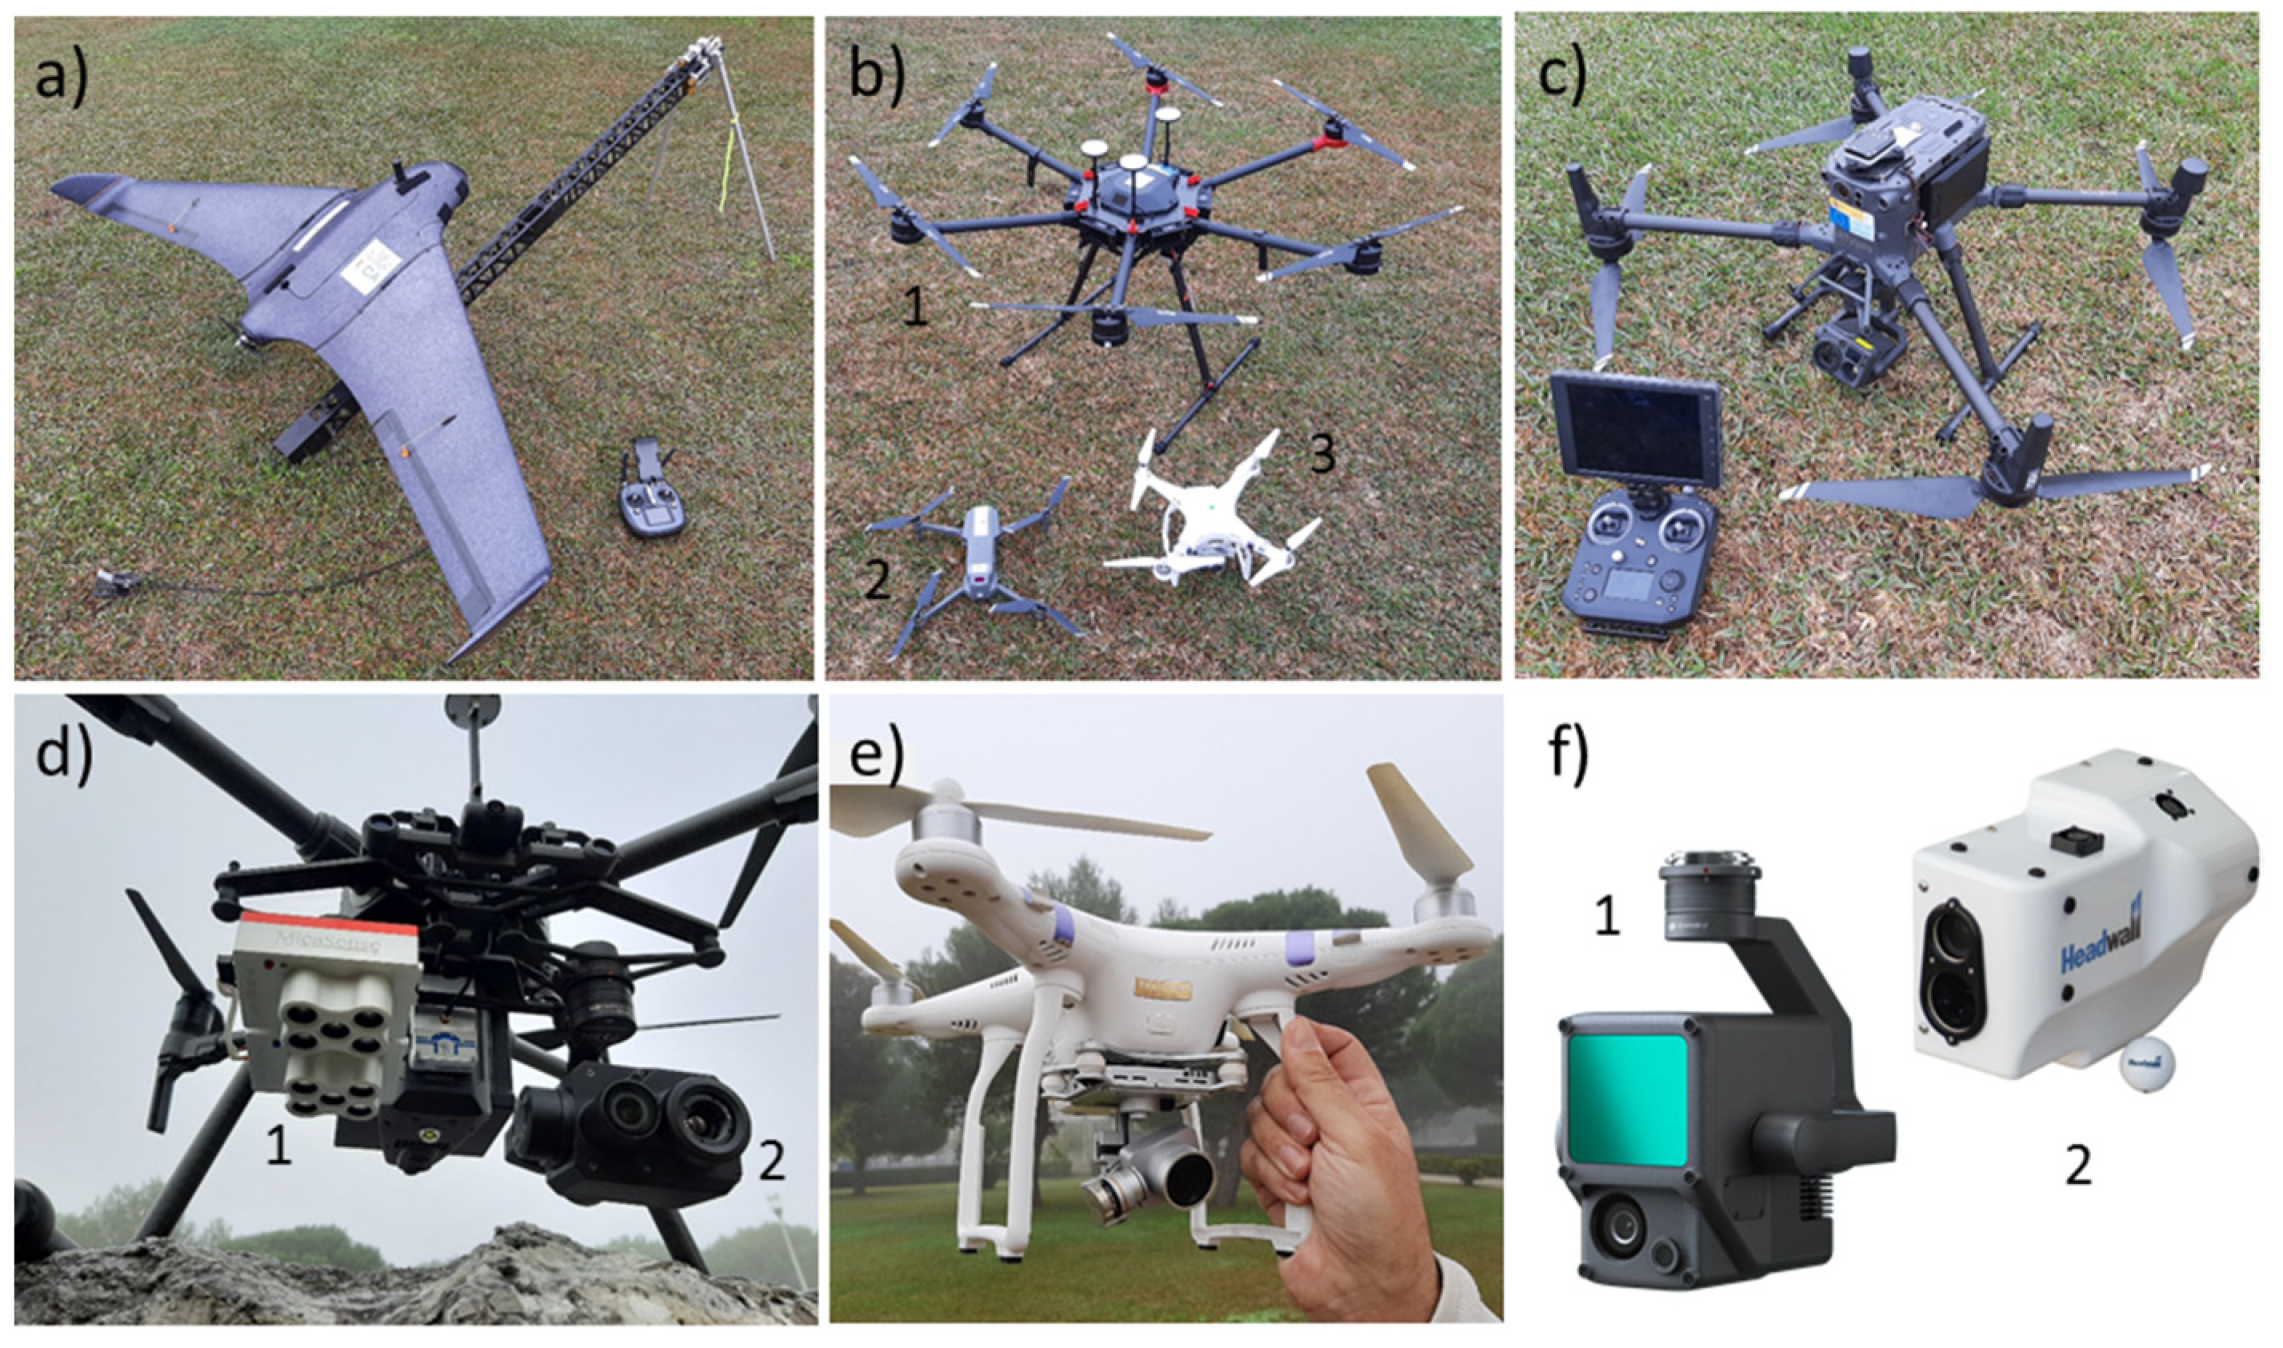
3. Types of UAS, Sensors and Other Payloads
3.1. Platforms
3.2. Sensors and Other Payloads

| Types of Sensor | Spectral Ranges (nm) | Camera Examples from Cited Works | Hydrological Applications | Main Advantages and Disadvantages |
|---|---|---|---|---|
| RGB | ~400–700 | Canon Powershot G5/Canon EOS [34] | Visual analysis, bathymetry, DEM photogrammetry, water stages, flood monitoring, particle velocymetry, HAB 1 monitoring, mapping and classification of surfaces. | Advantages: (1) Wide range of prices, resolutions and weights available depending on the model. (2) Video capture. (3) Easy integration in different platforms. |
| Zenmuse X3 FC350 [35] | Disadvantages: (1) Lower spectral resolution that makes them unsuitable for many tasks. (2) Very sensitive to environmental and ilumination conditions. (3) Some lack of geometric and radiometric calibration. | |||
| RGB OLYMPUS EP-2 [36] | ||||
| Nikon D500/D5100 [37] | ||||
| Multispectral | ~400–1000 | Rededge Micasense [38,39] | Bathymetry, HAB monitoring, river/lake trophic status, flood monitoring, SW–GW 2 interactions, wetland/river mapping, surface/material identification. | Advantages: (1) Wider range of applications compared to RGB sensors, allowing to discriminate/identify a variety of materials. (2) Some present means of radiometric calibration. (3) Allow geometric reconstruction. (4) Allow sub-decimetric mapping. |
| Disadvantages: (1) Relatively high prices. (2) Detect radiation in a small number of broad wavelength bands, limiting their applications. (3) Currently, sensors are not optimised for aquatic applications. (4) Limited compatibility to UASs. | ||||
| Hyperspectral | ~500–2500 | Rikola 2D [36] | Bathymetry, HAB monitoring, river/lake trophic status, flood monitoring, water quality monitoring, wetland/river mapping, surface/material identification. | Advantages: (1) High spectral resolution data, with many narrow contiguous spectral bands that improve their ability to discriminate/identify materials. |
| Nano Hyperspec [40] | Disadvantages: (1) High costs. (2) Size of sensors. (3) Need for spesialised software. (4) Low signal-to-noise ratio. | |||
| Thermal infrared | ~8000–14,000 | ThermoMAP [41] | River/lake temperature mapping, SW- GWD identification, thermal plumes identification, river discharge. | Advantages: (1) Validation is not required if only relativetemperatures are needed. (2) Relatively low cost. (3) Wide range of models and resolutions. |
| DJI Zenmuse XT [42] | ||||
| ICI Mirage 640 [43] | Disadvantages: (1) Temperature drift issues. (2) Radiation emitted from near-bank objects may impact the sensor, resulting in erroneous image interpretation. (3) Need for radiometric corrections. (4) TIR imagery interpretation can be complex and requires expertise. (5) Highly sensitive to <30° observation angles and changes in surface roughness. | |||
| FLIR TAU2 640 [44] | ||||
| UAS LiDAR | ~500–900 | Phoenix Scout SL1 [45] | Bathymetry, 3-D mapping, water stages, flood monitoring. | Advantages: (1) Less susceptible to environmental conditions. (2) provides direct geometric measurements. (3) Possibility of discriminating the effect of vegetation. |
| ASTRALiTE edge [43] | Disadvantages: (1) Limited by water clarity and bottom reflectivity. (2) High costs. (3) Few models compatible with UAS. (4) Need for groundfiltering corrections. (5) Strong dependence on accurate dynamic positioning systems. |
4. UAS Applications in Surface Water Research
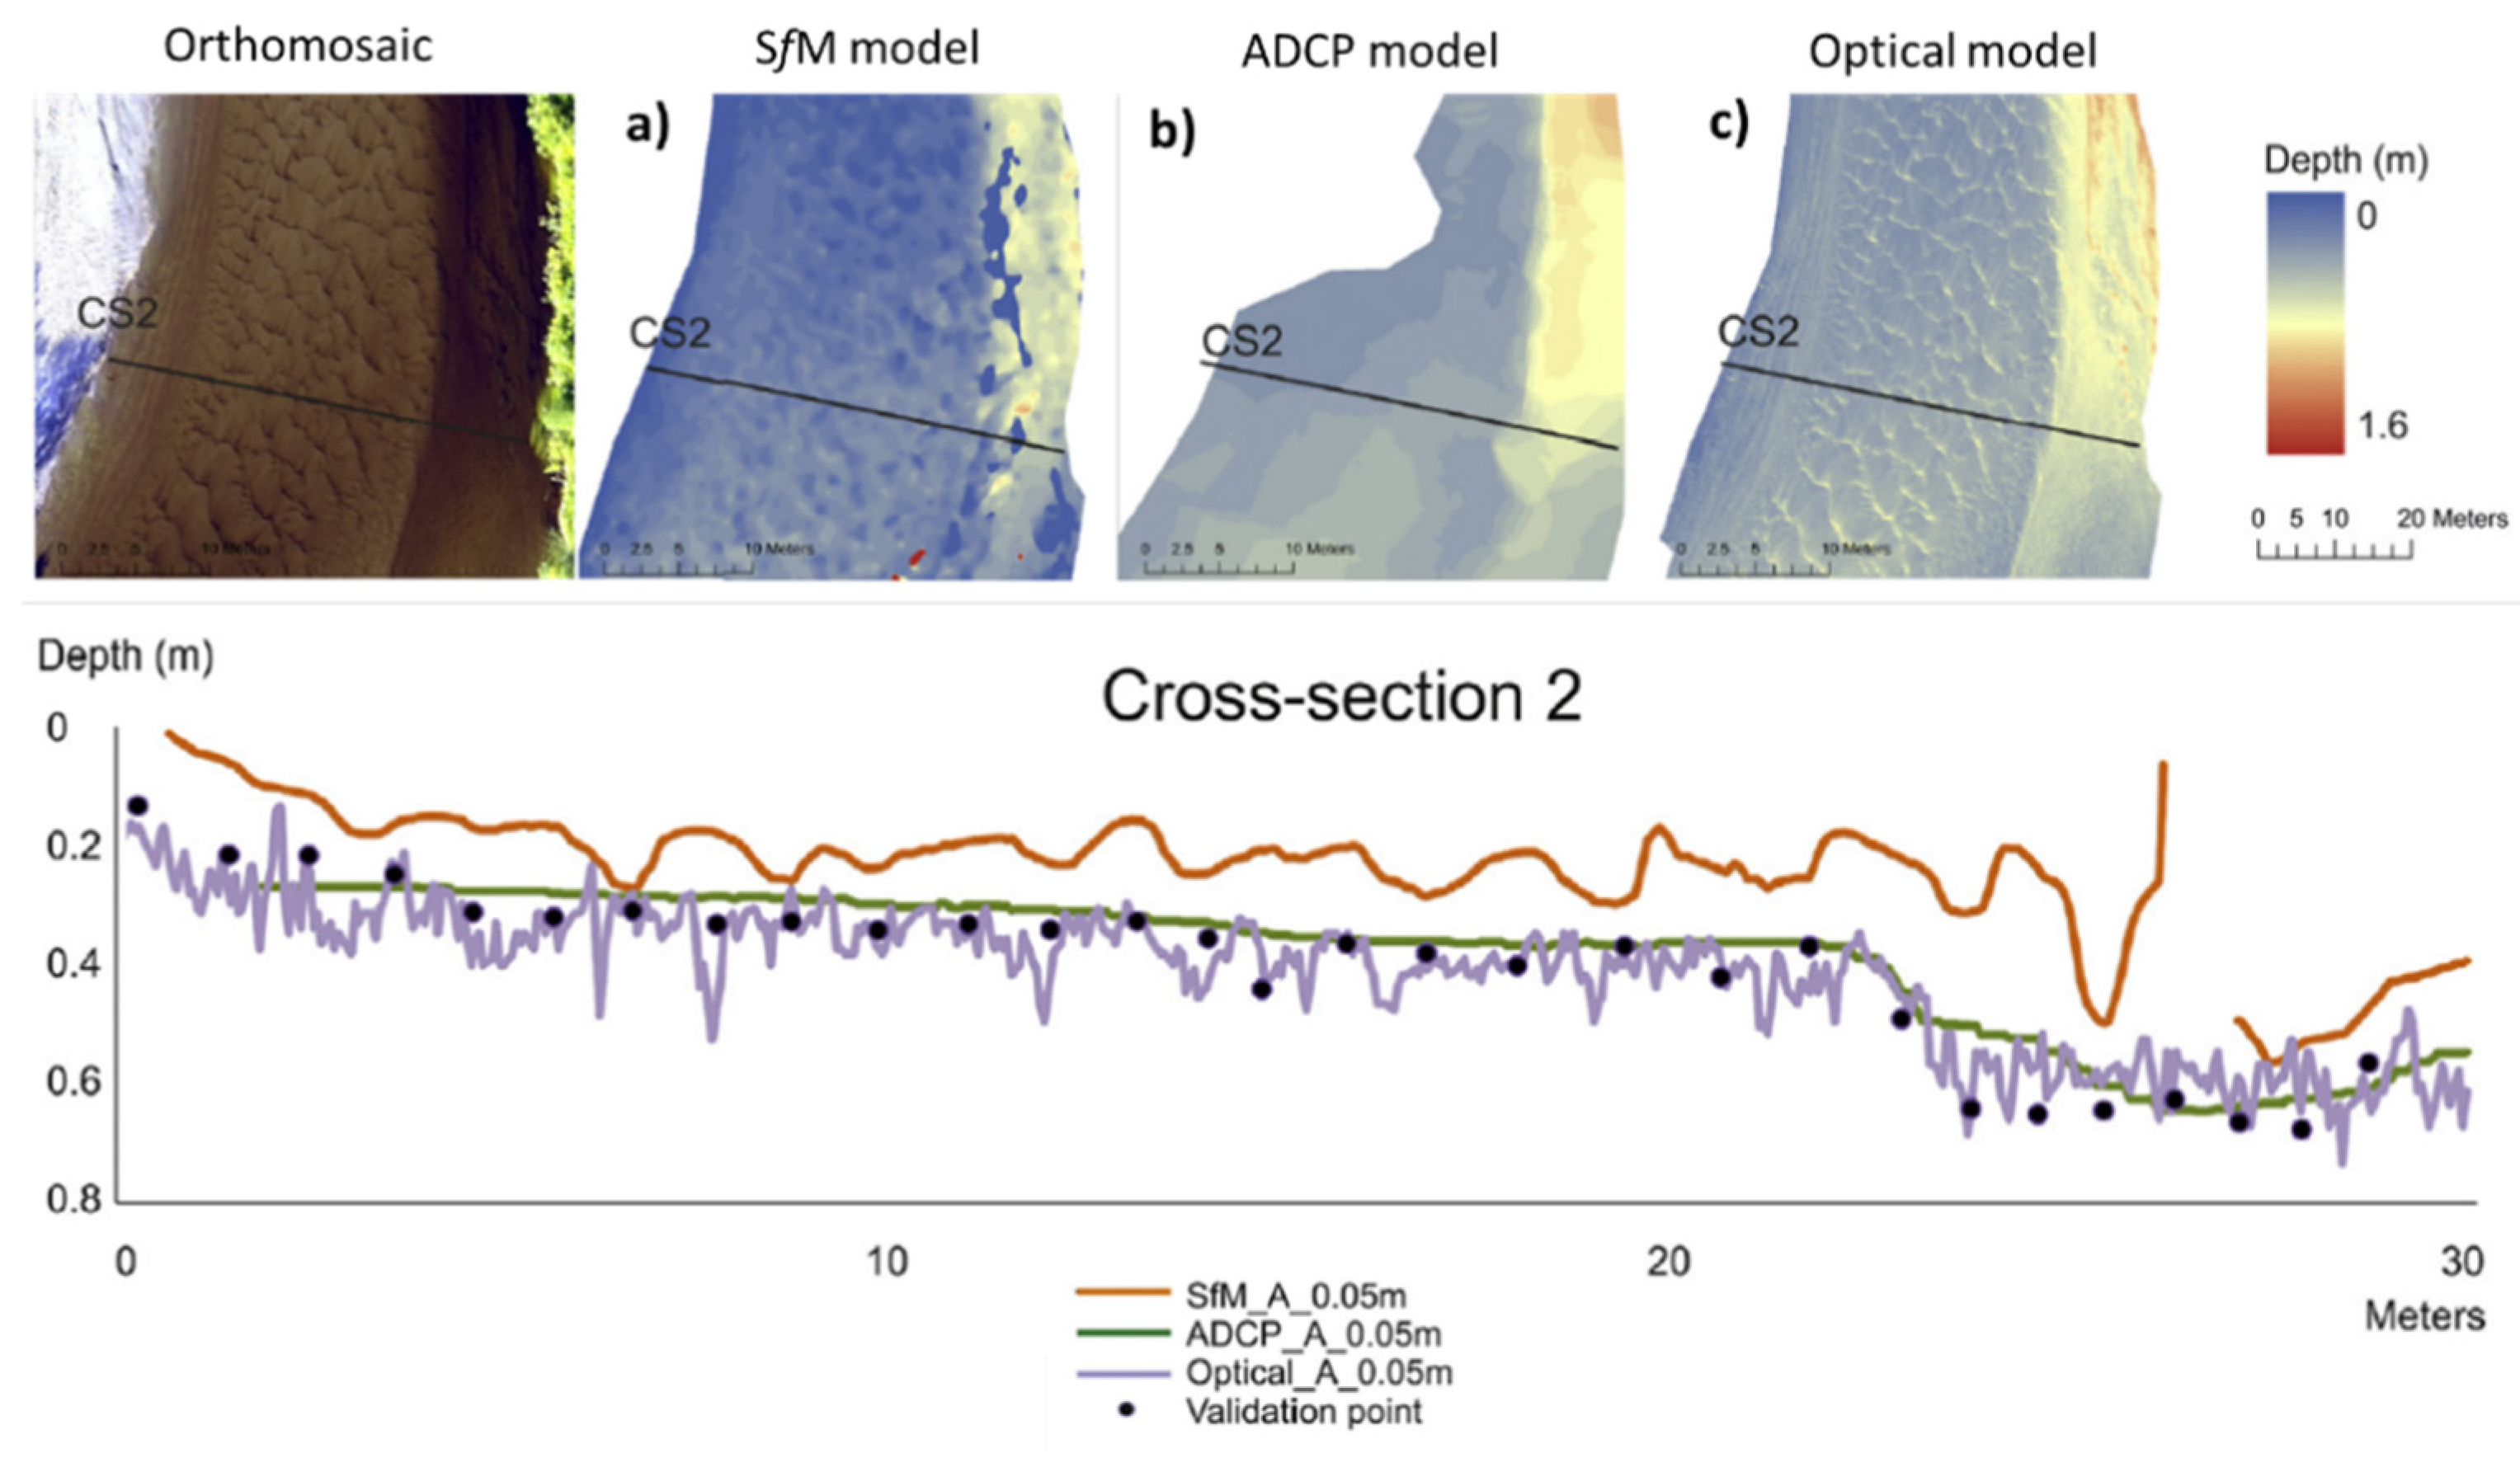
4.1. Bathymetry and Submerged Topography
4.2. Water Level Measurement and Water Storage
4.3. Surface Velocity and Flow Estimations
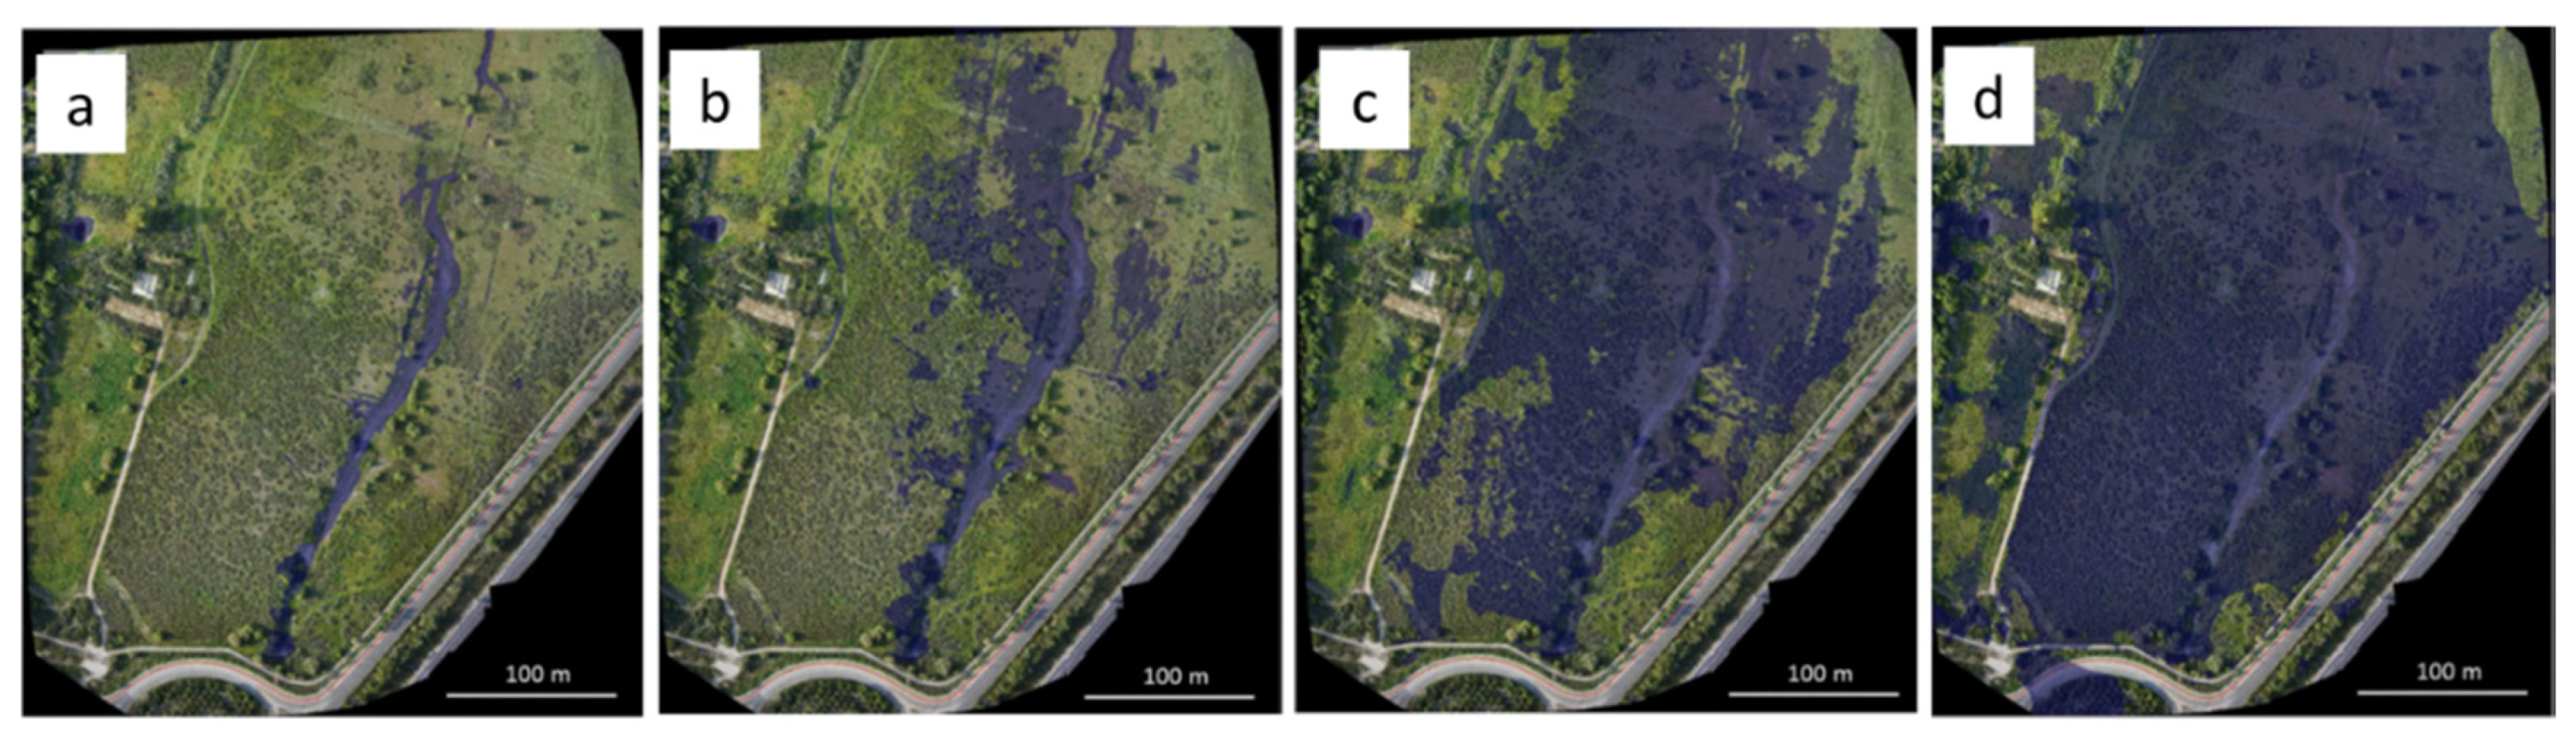
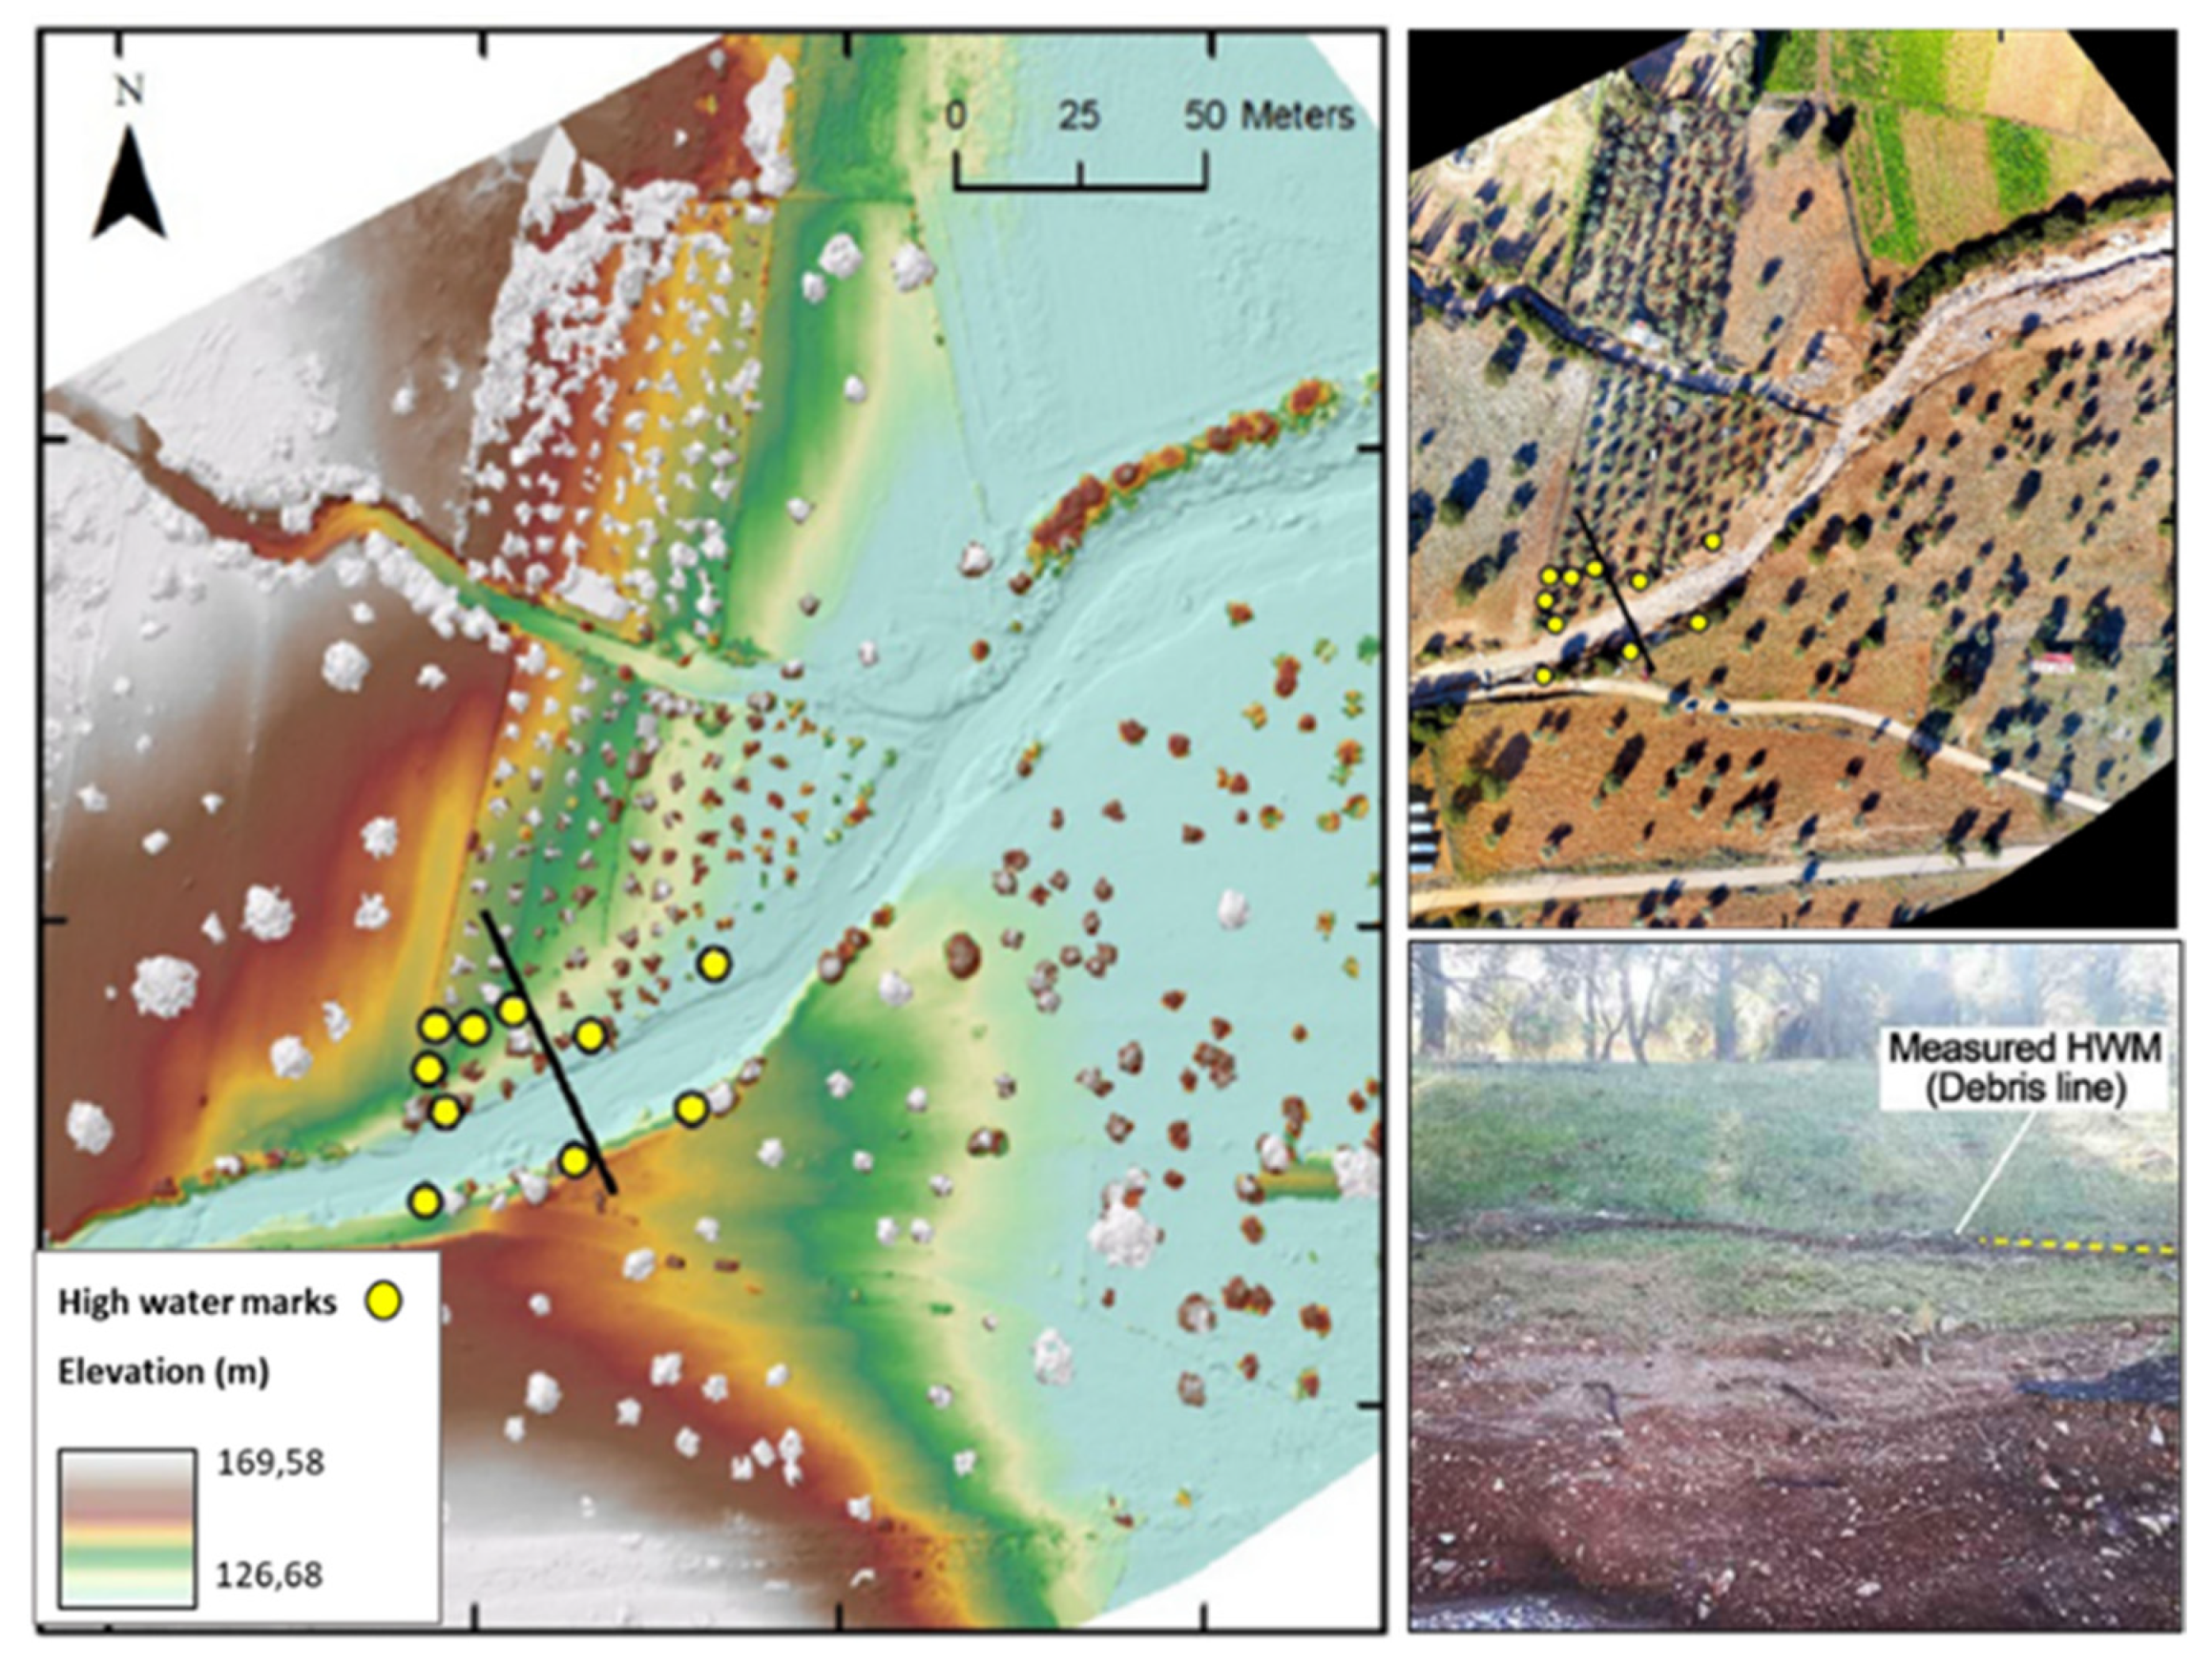
4.4. Flood Monitoring
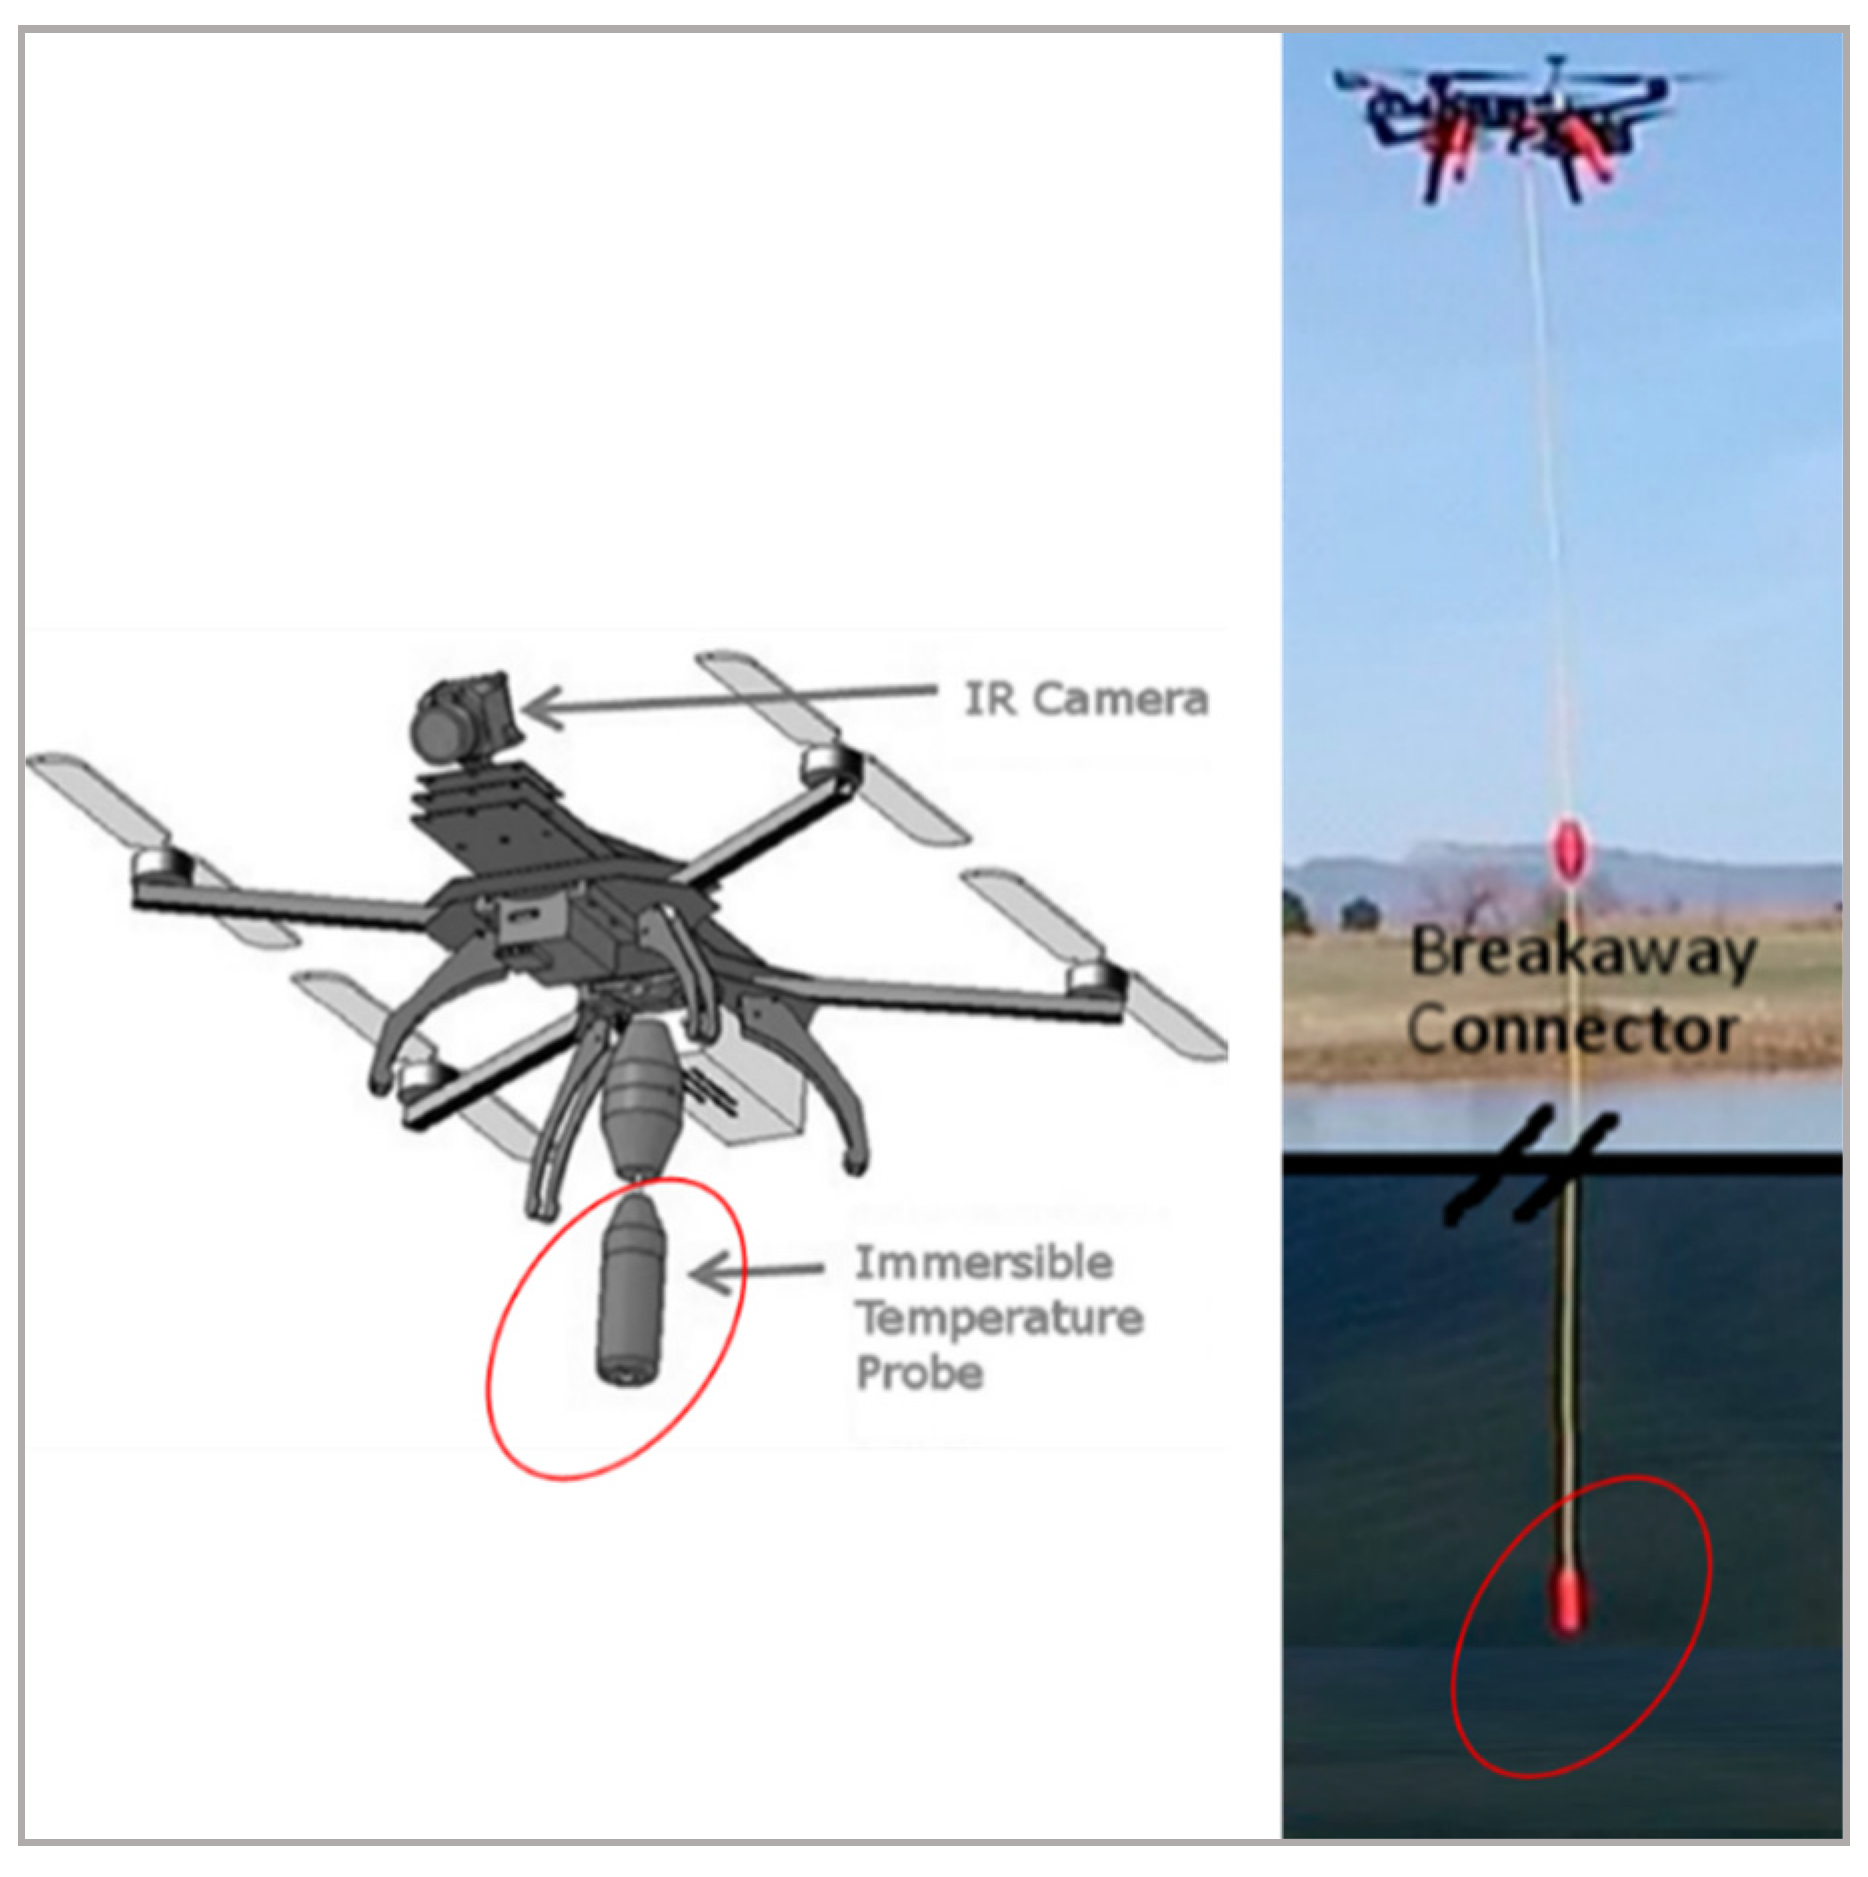
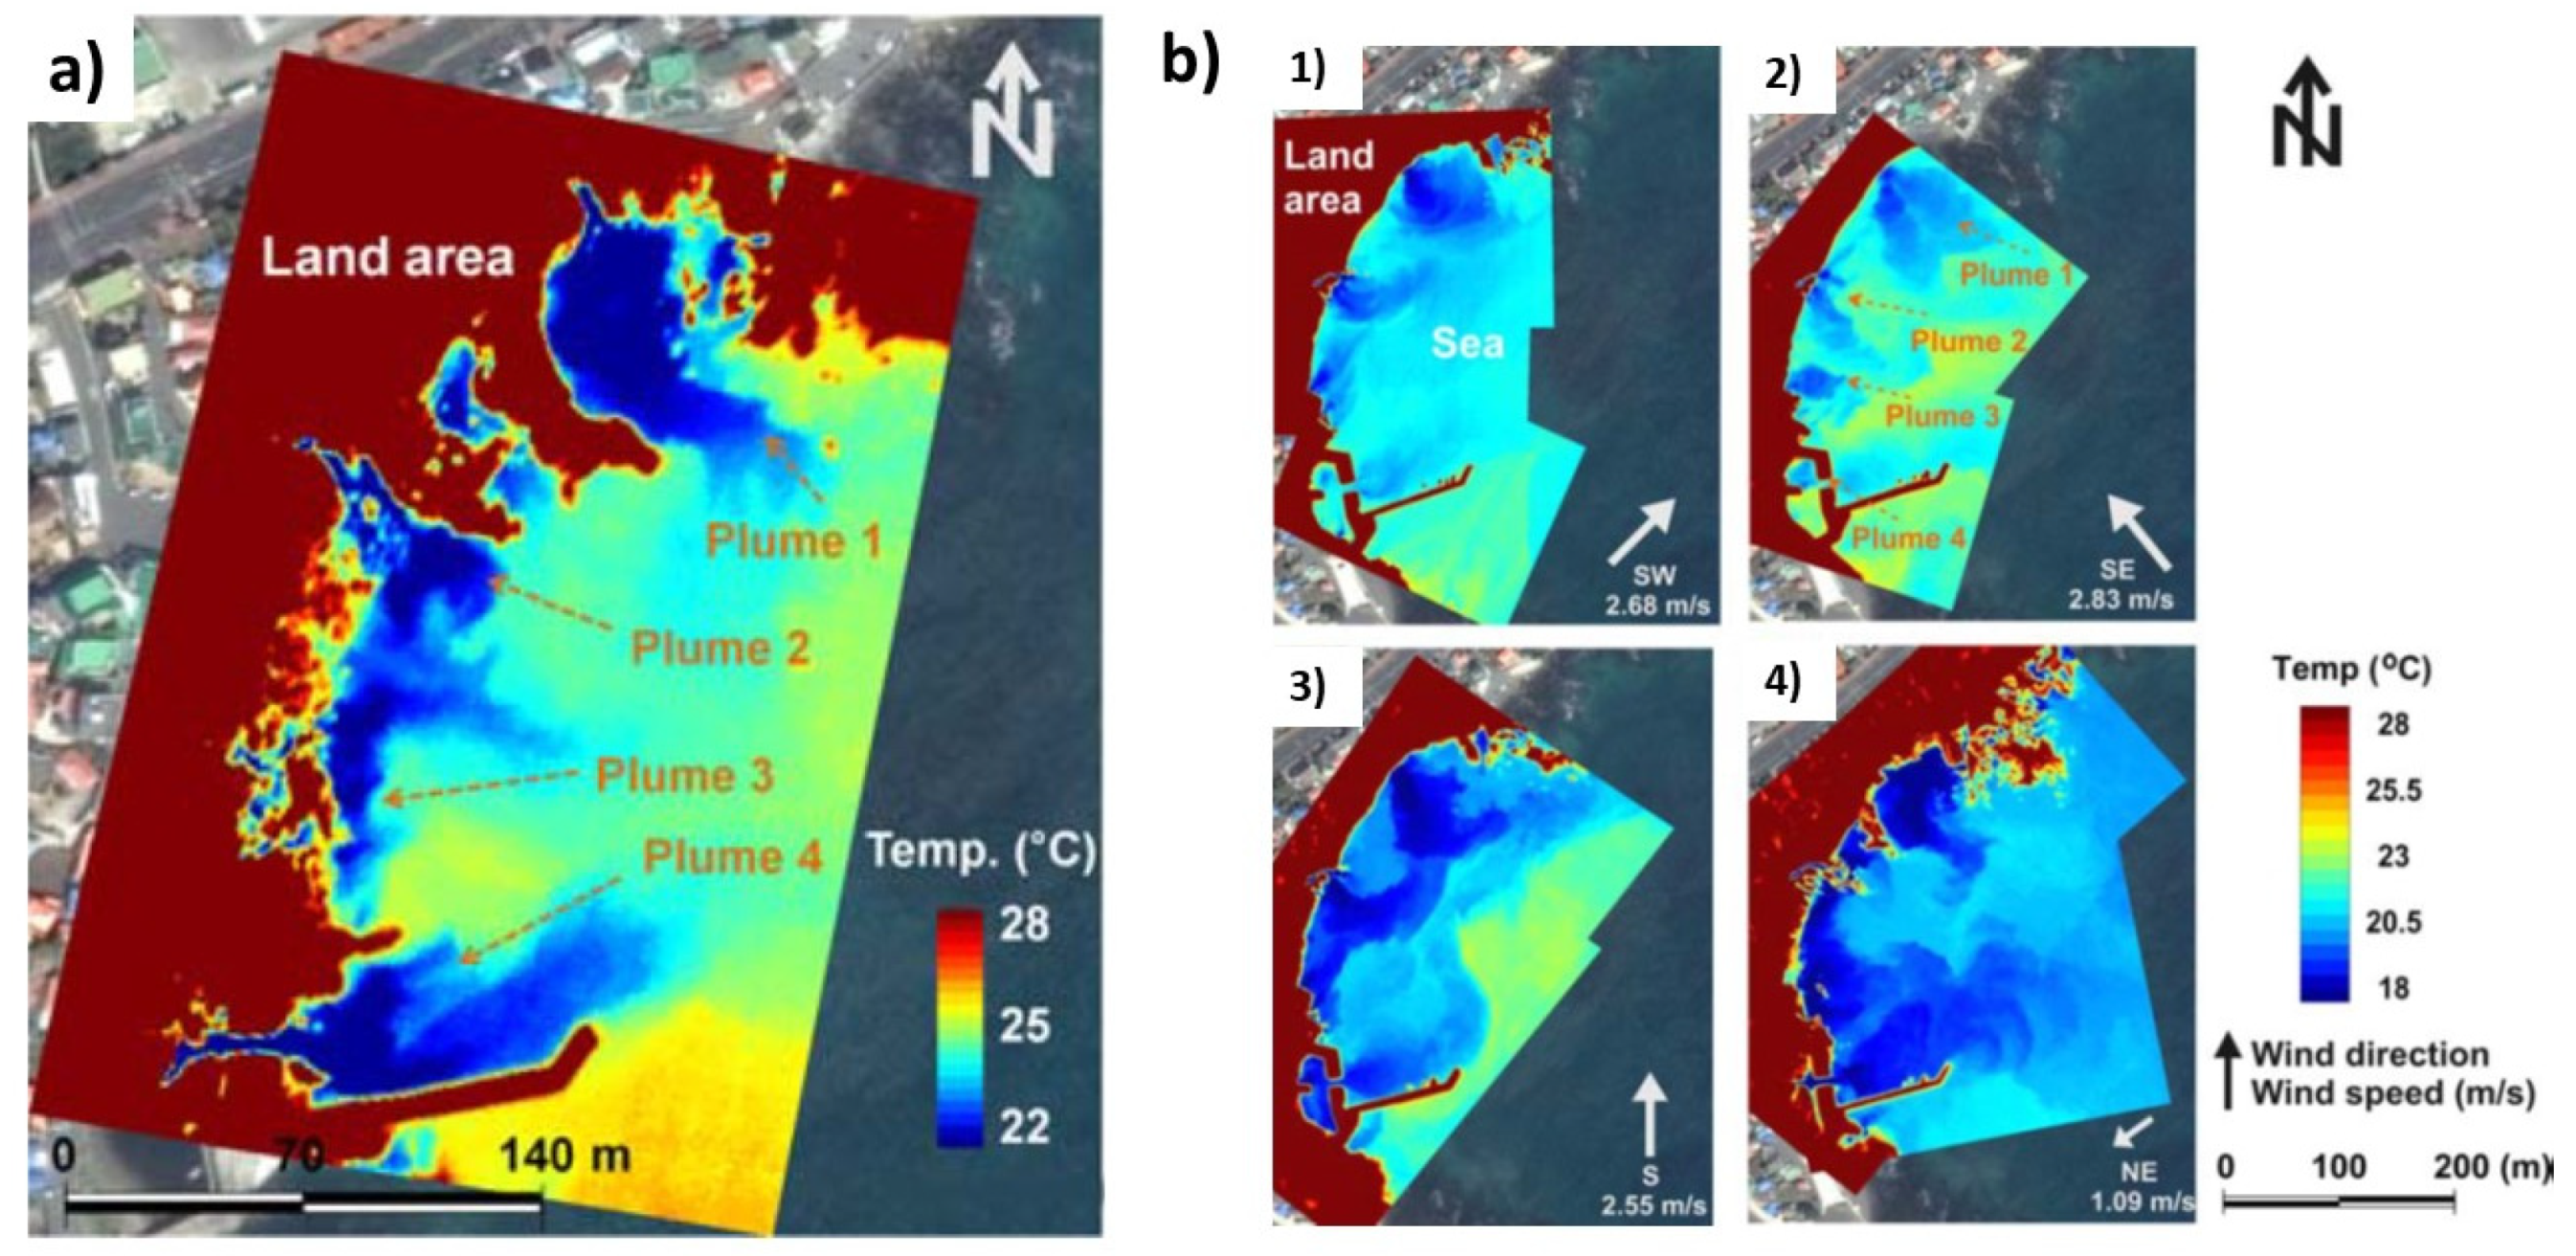
4.5. Temperature Mapping
4.6. Water Contamination
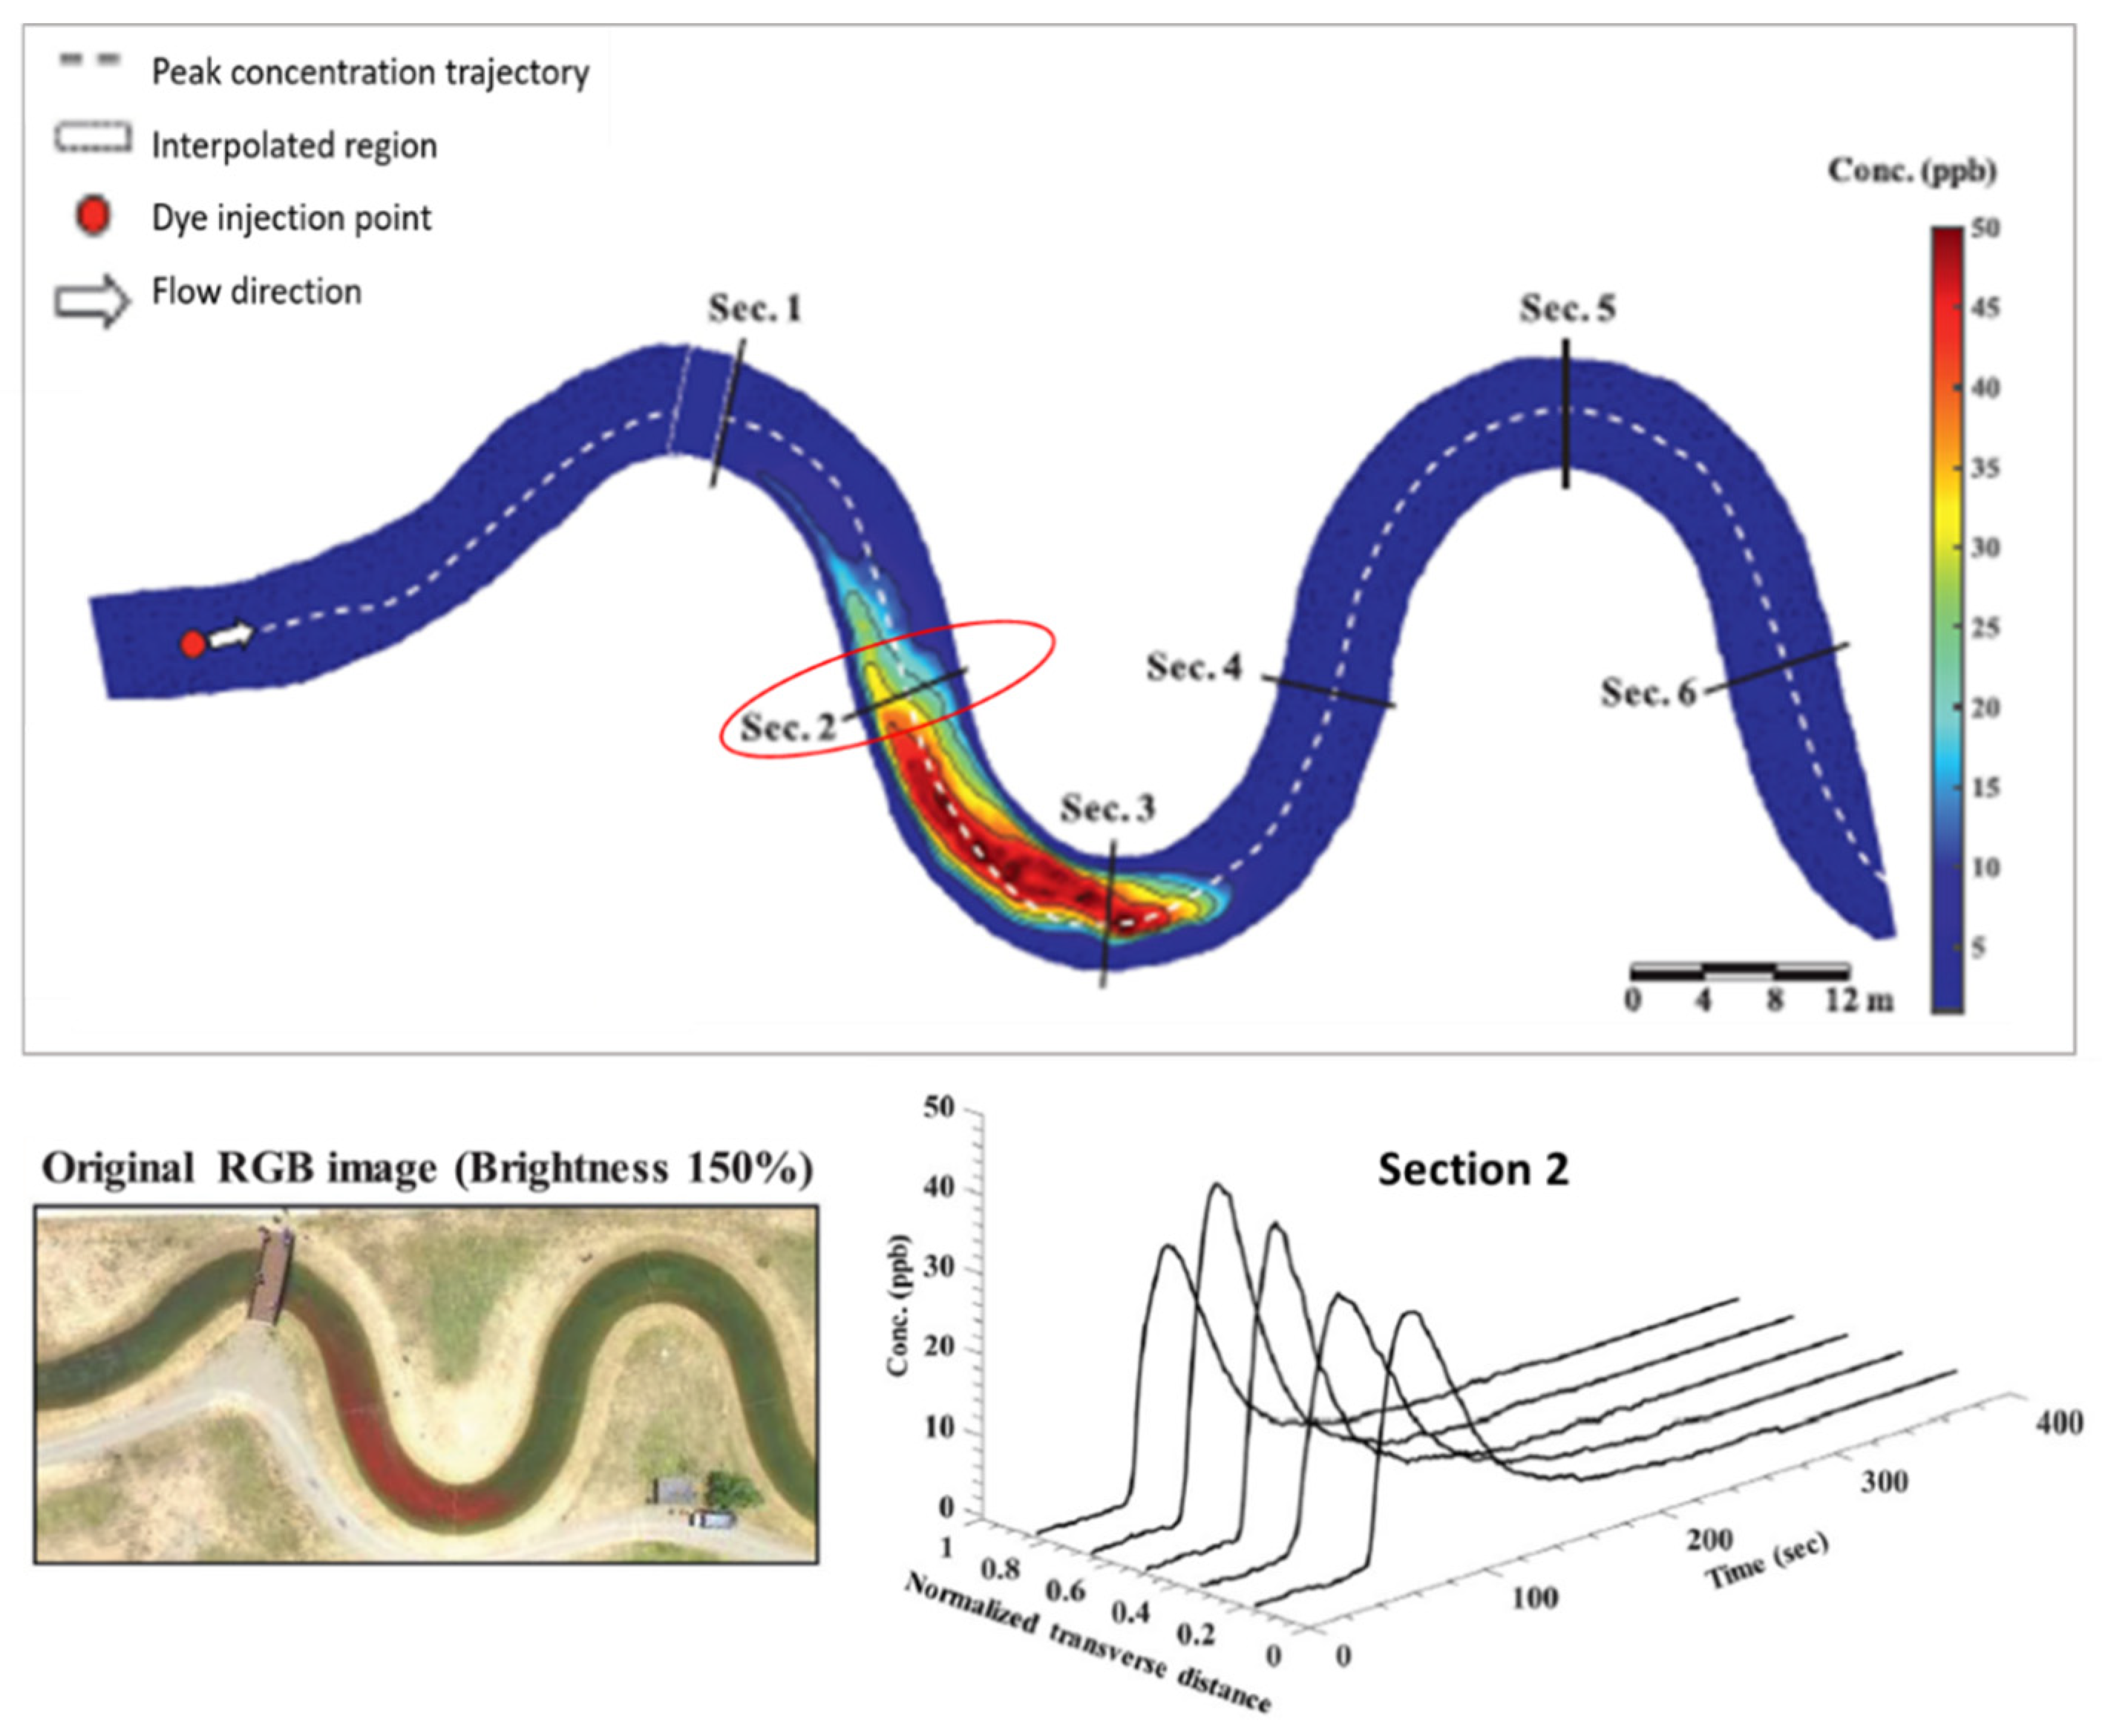
4.6.1. Dispersion Processes
4.6.2. Plastic Pollution
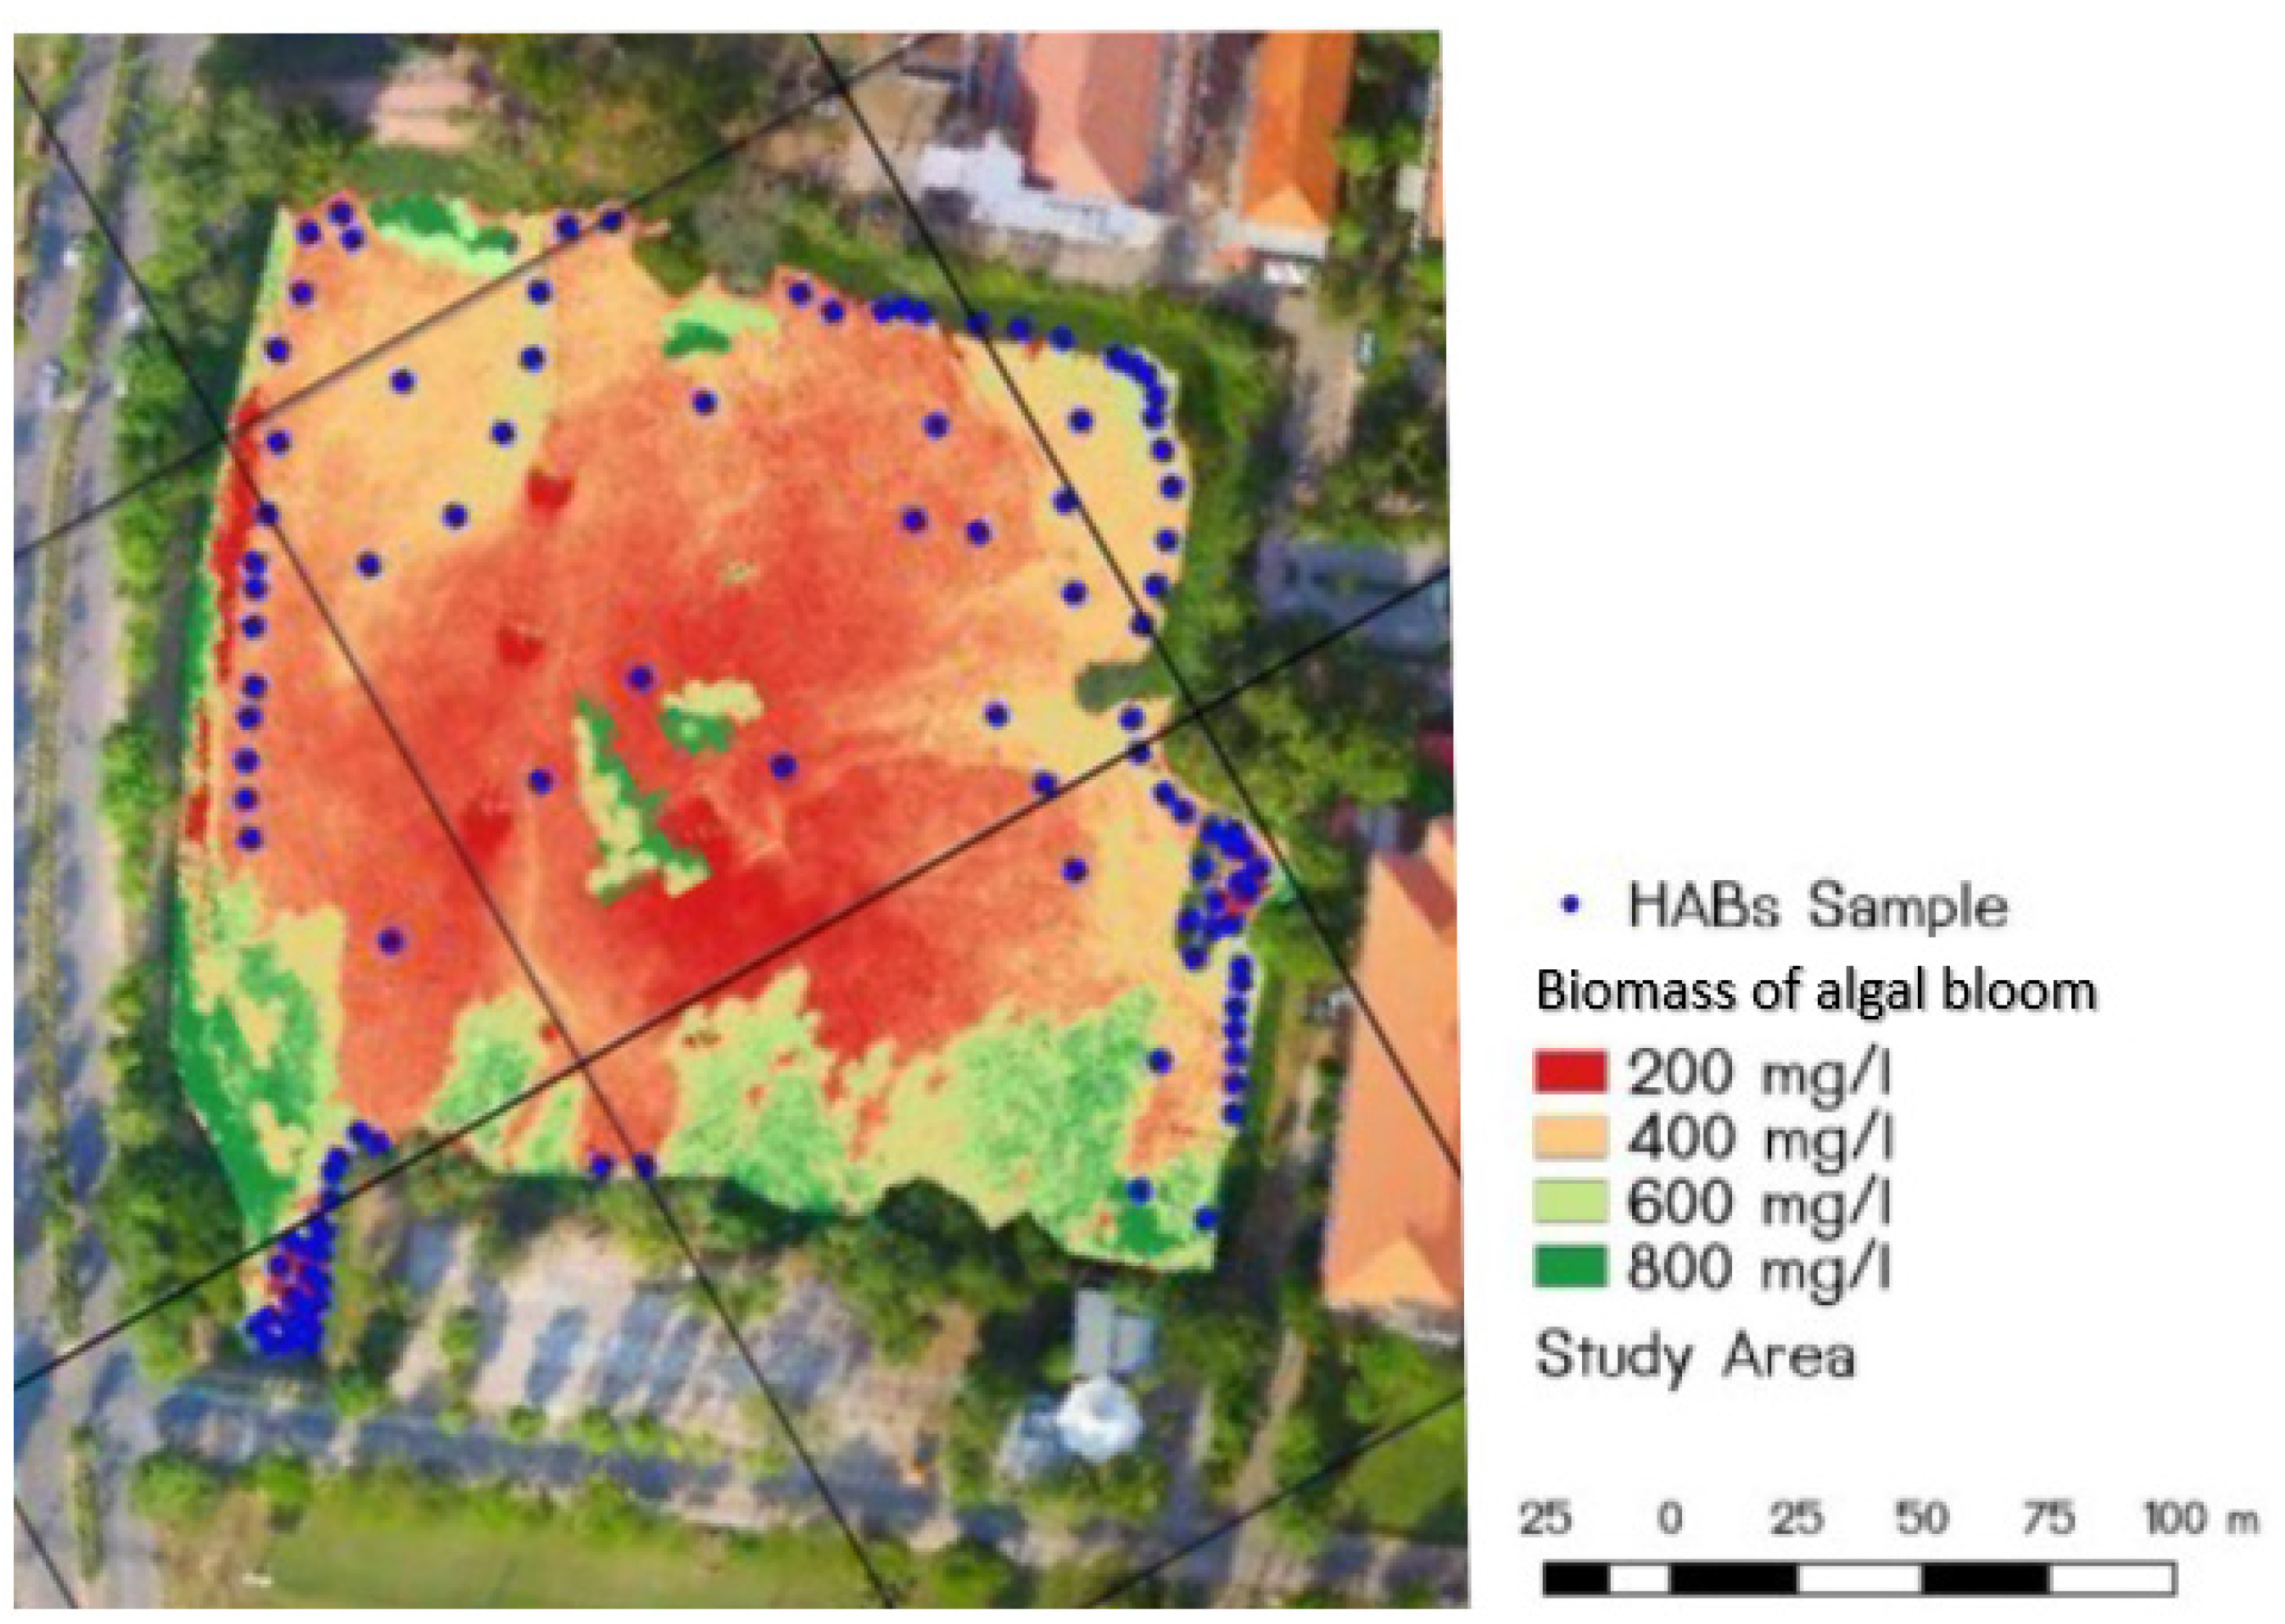
4.7. Harmful Algal Blooms (HABs) and Eutrophication
4.8. Water Sampling and In Situ Parameter Measurement
5. UAS Applications in Hydrogeology
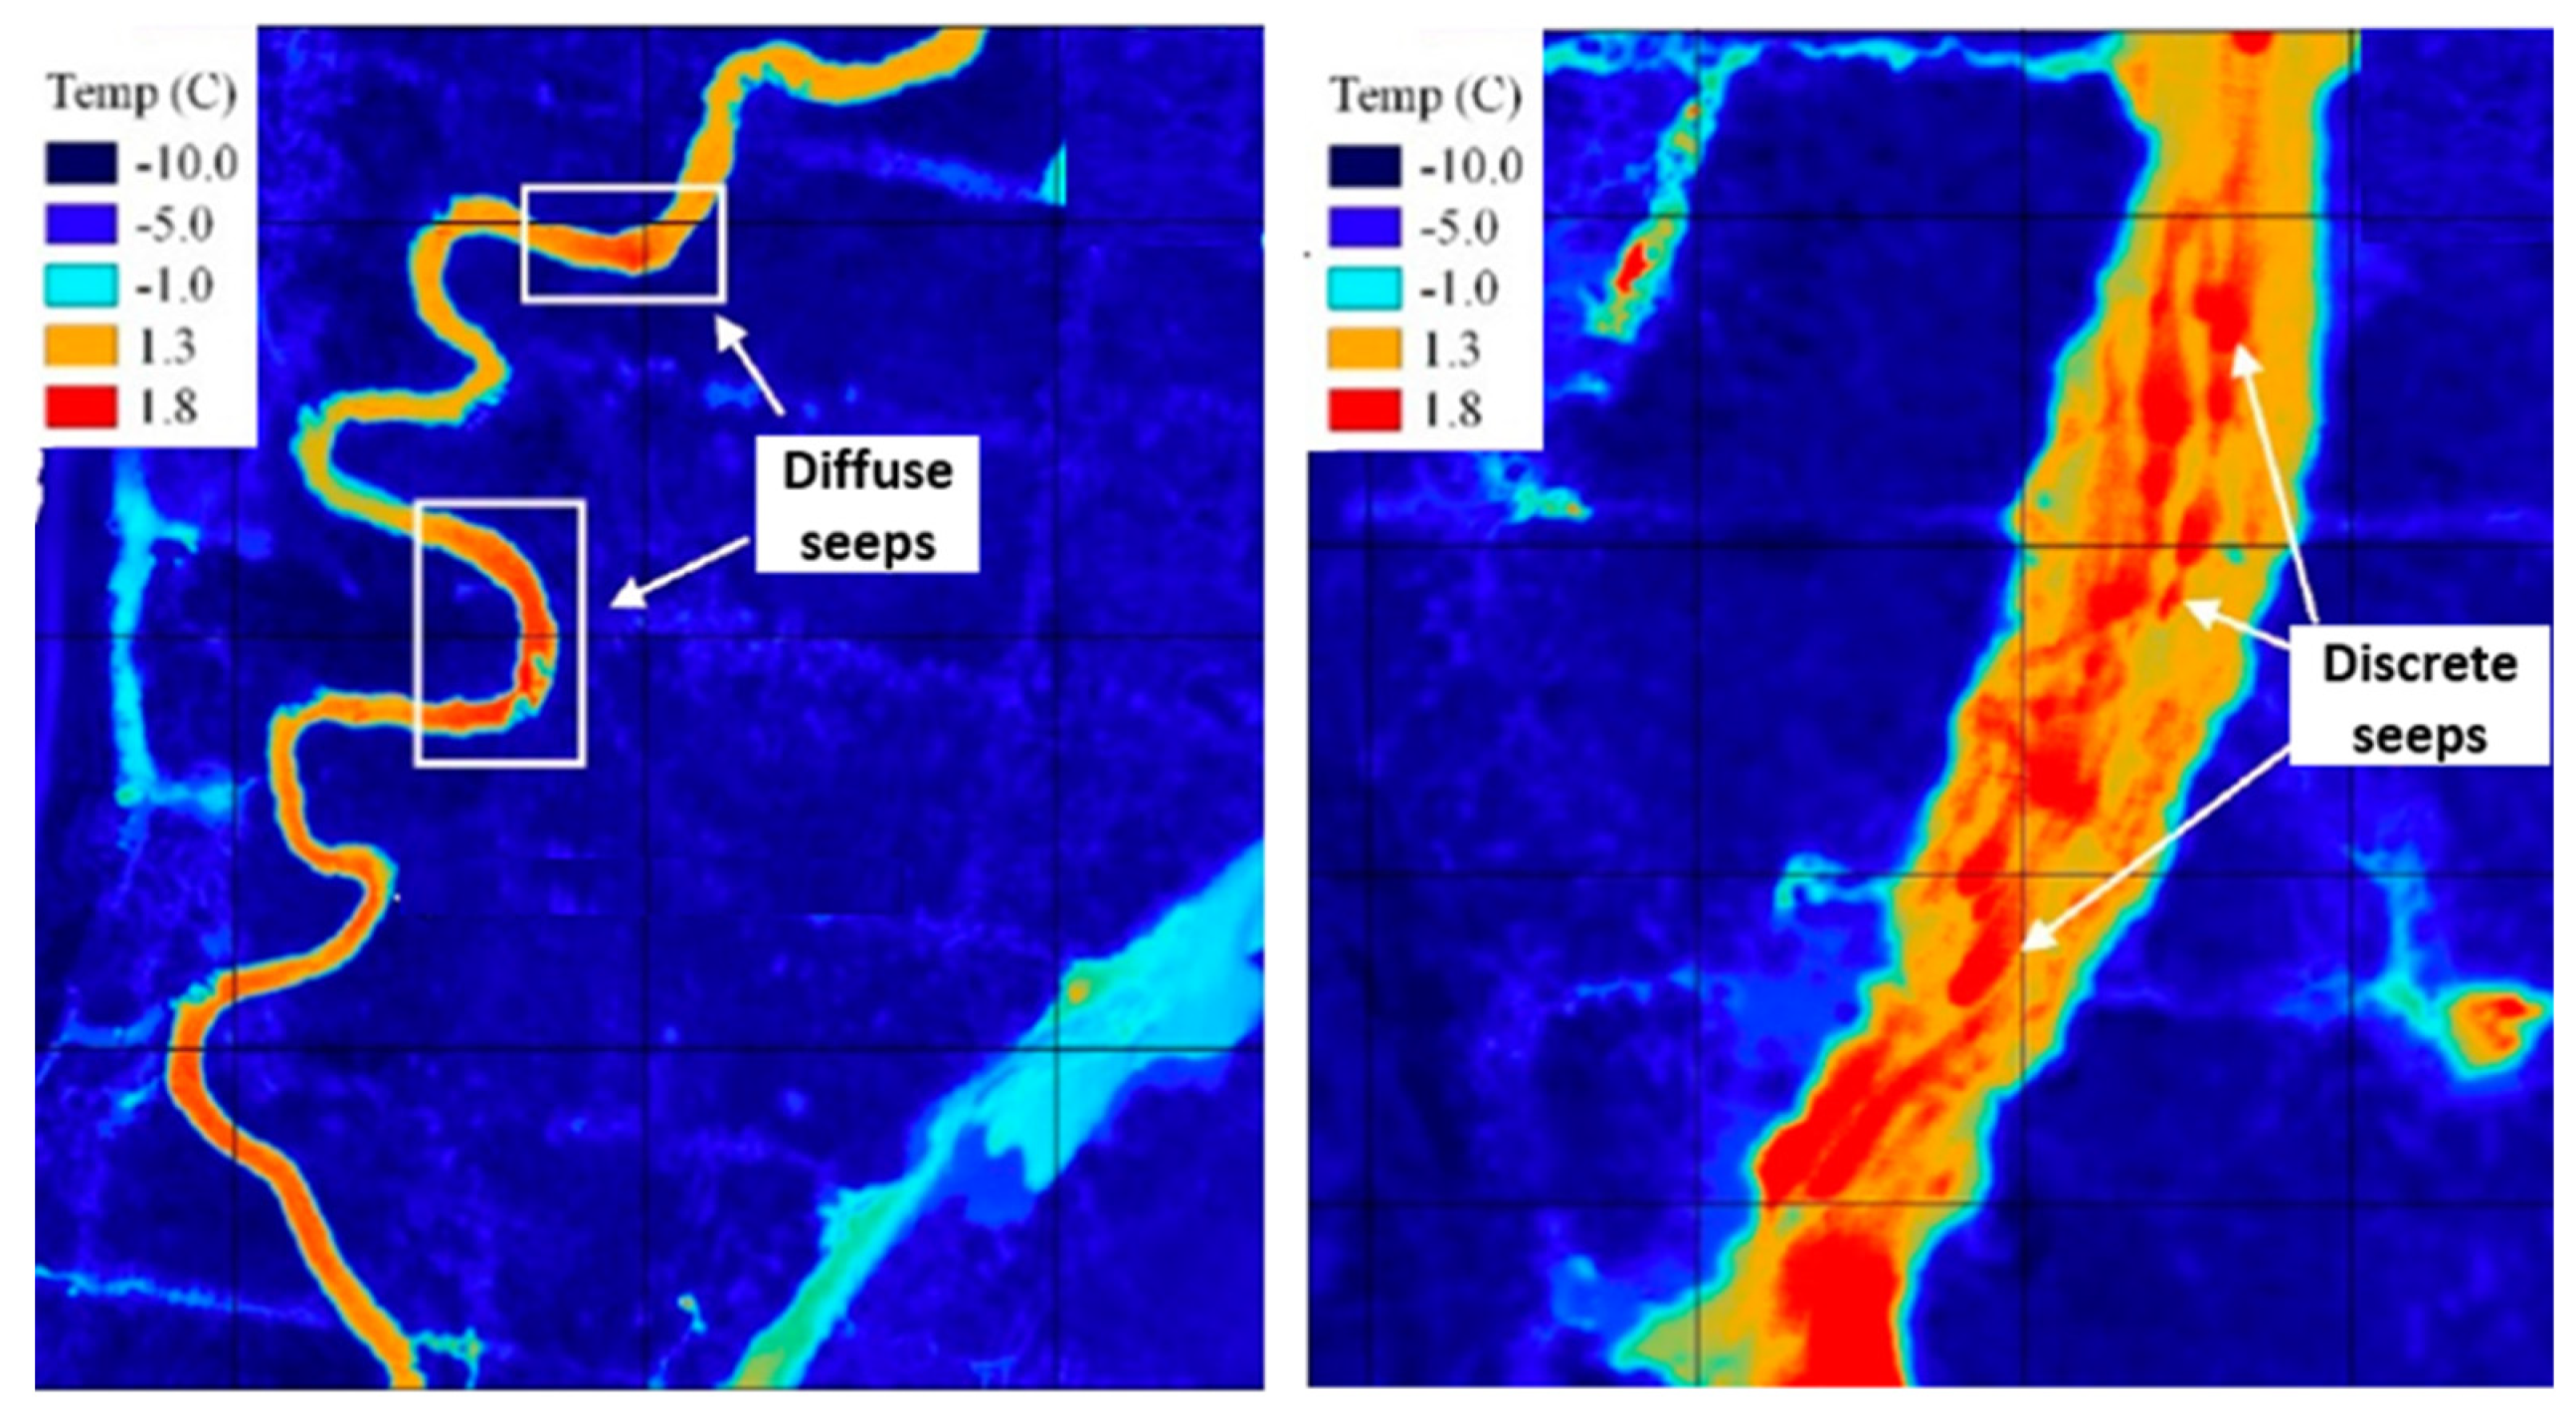
5.1. Surface Water–Groundwater (SW–GW) Interactions
5.2. Submarine Groundwater Discharge (SGD) Mapping
5.3. Water Table Definition
5.4. Subsidence
6. Results and Conclusions
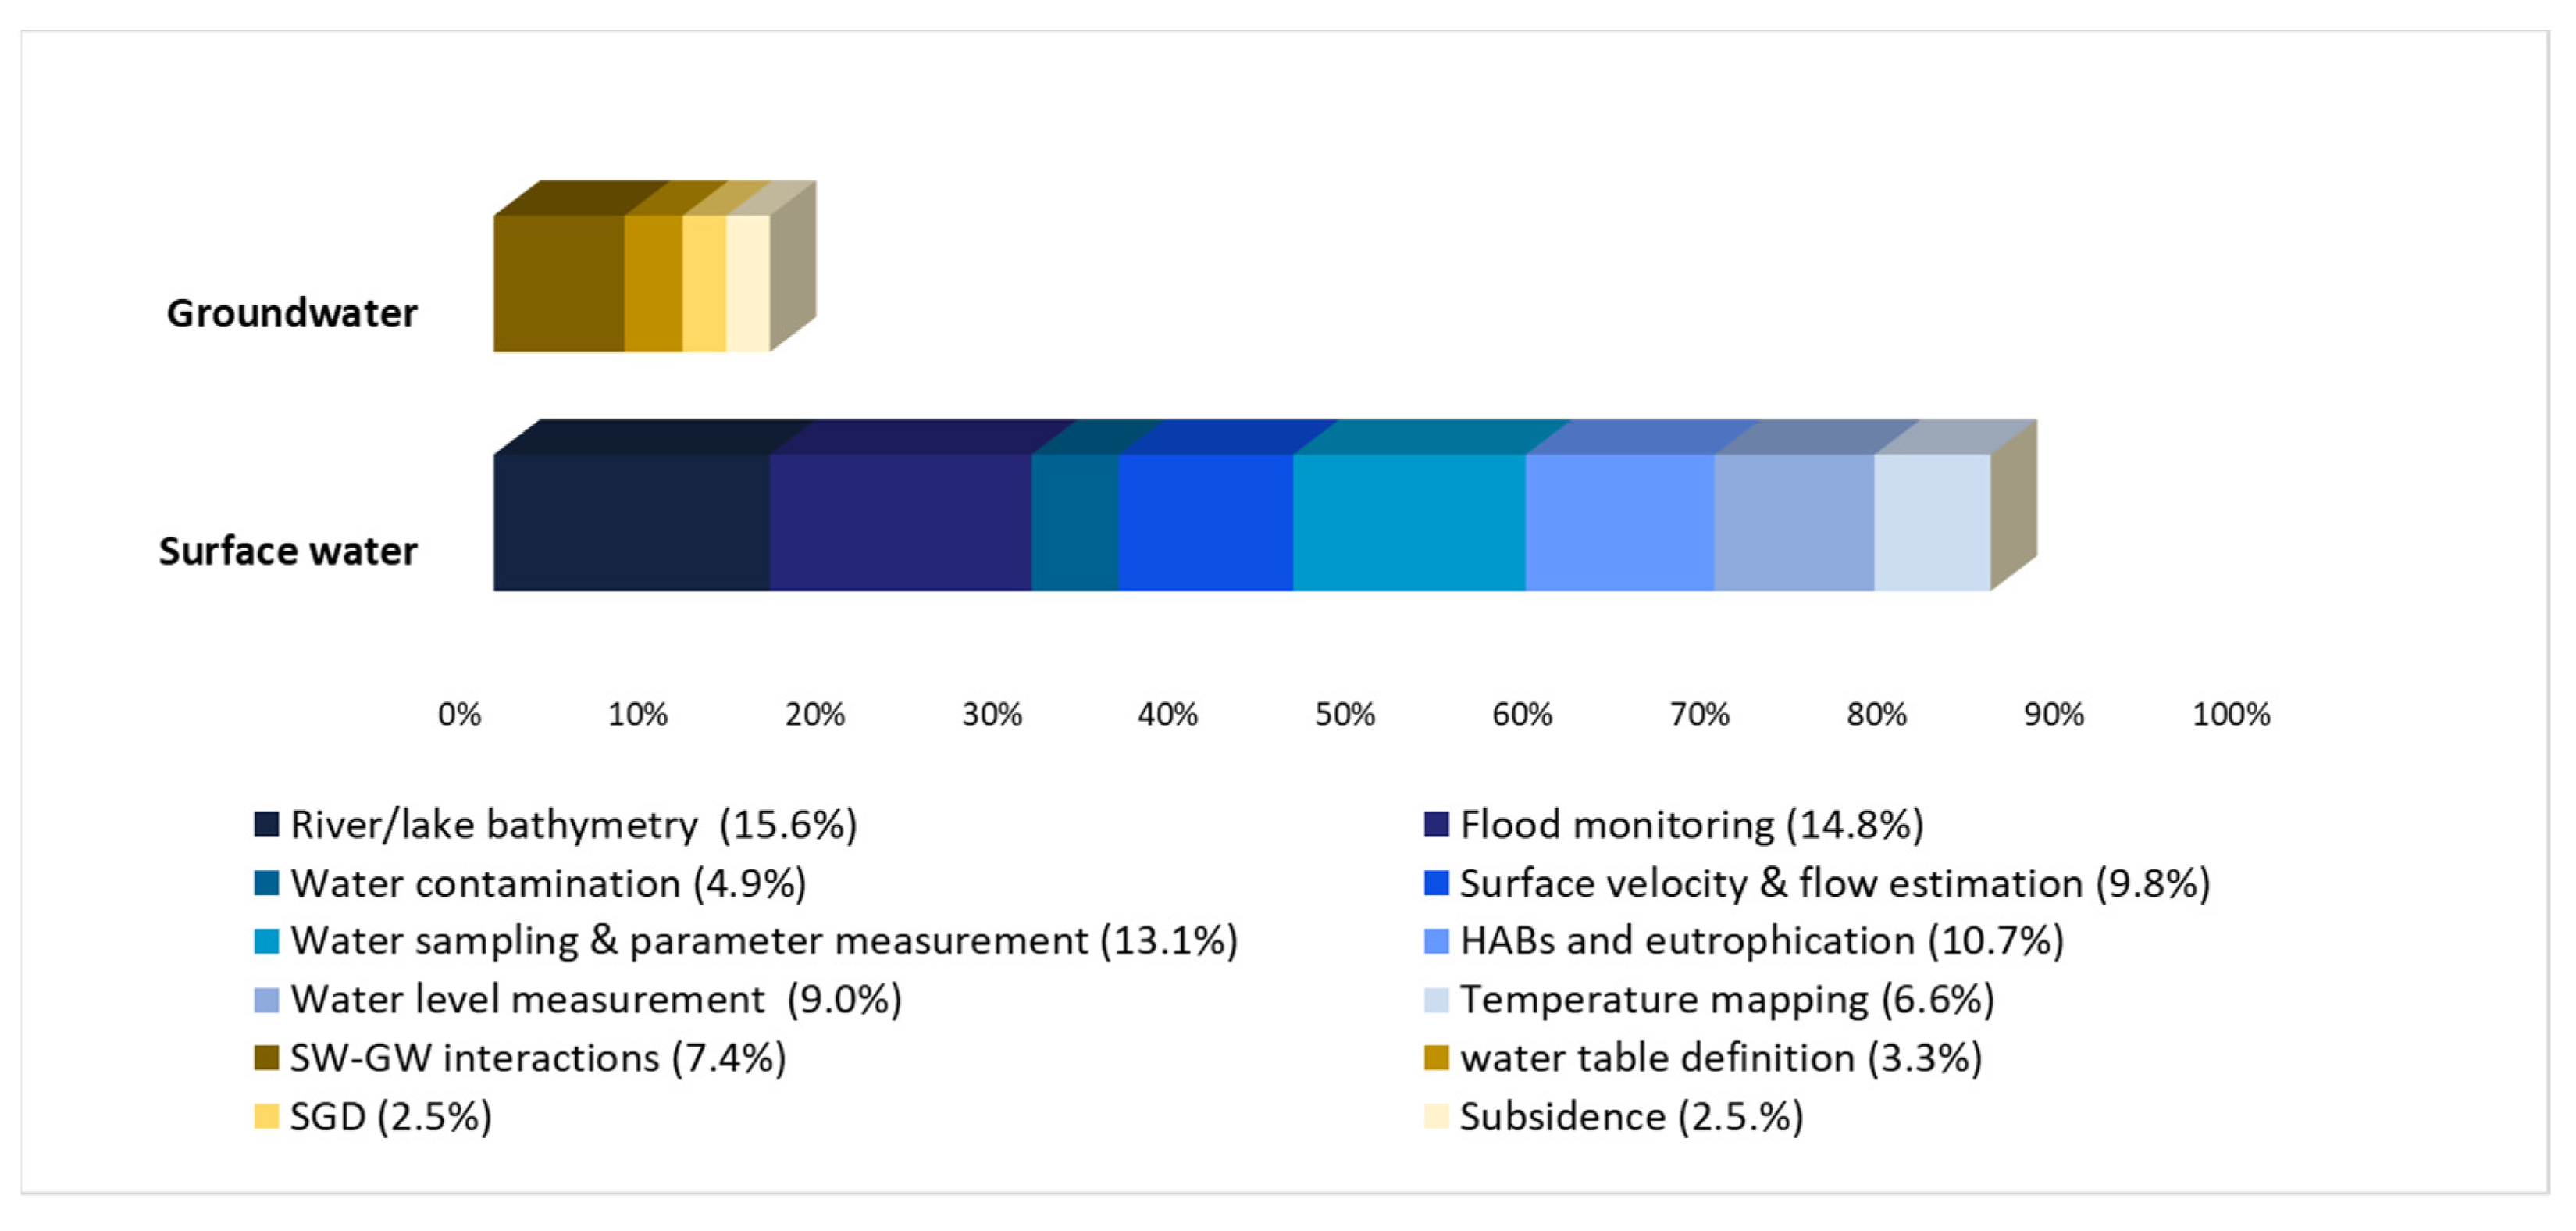
6.1. Current Applications of UASs in Water Resource Research
6.2. UAS Application in Freshwater Research: Future Prospects
Author Contributions
Funding
Institutional Review Board Statement
Informed Consent Statement
Data Availability Statement
Acknowledgments
Conflicts of Interest
References
- WWAP (UNESCO World Water Assessment Programme). The United Nations World Water Development Report 2019: Leaving No One Behind; UNESCO: Paris, France, 2019. [Google Scholar]
- IPCC. Climate Change 2014: Synthesis Report. Contribution of Working Groups I, II and III to the Fifth Assessment Report of the Intergovernmental Panel on Climate Change; Core Writing Team, Pachauri, R.K., Meyer, L.A., Eds.; IPCC: Geneva, Switzerland, 2014; 151p. [Google Scholar]
- Chamoso, P.; González-Briones, A.; Rivas, A.; De Mata, F.B.; Corchado, J.M. The Use of Drones in Spain: Towards a Platform for Controlling UAVs in Urban Environments. Sensors 2018, 18, 1416. [Google Scholar] [CrossRef] [PubMed]
- Linchant, J.; Lisein, J.; Semeki, J.; Lejeune, P.; Vermeulen, C. Are unmanned aircraft systems (UASs) the future of wildlife monitoring? A review of accomplishments and challenges. Mammal Rev. 2015, 45, 239–252. [Google Scholar] [CrossRef]
- Chabot, D.; Bird, D.M. Wildlife research and management methods in the 21st century: Where do unmanned aircraft fit in? J. Unmanned Veh. Syst. 2015, 3, 137–155. [Google Scholar] [CrossRef]
- Christie, K.S.; Gilbert, S.L.; Brown, C.L.; Hatfield, M.; Hanson, L. Unmanned aircraft systems in wildlife research: Current and future applications of a transformative technology. Front. Ecol. Environ. 2016, 14, 241–251. [Google Scholar] [CrossRef]
- Adão, T.; Hruška, J.; Pádua, L.; Bessa, J.; Peres, E.; Morais, R.; Sousa, J.J. Hyperspectral Imaging: A Review on UAV-Based Sensors, Data Processing and Applications for Agriculture and Forestry. Remote Sens. 2017, 9, 1110. [Google Scholar] [CrossRef]
- Wieser, M.; Mandlburger, G.; Hollaus, M.; Otepka, J.; Glira, P.; Pfeifer, N. A Case Study of UAS Borne Laser Scanning for Measurement of Tree Stem Diameter. Remote Sens. 2017, 9, 1154. [Google Scholar] [CrossRef]
- Radoglou-Grammatikis, P.; Sarigiannidis, P.; Lagkas, T.; Moscholios, I. A compilation of UAV applications for precision agriculture. Comput. Netw. 2020, 172, 107148. [Google Scholar] [CrossRef]
- Rakha, T.; Gorodetsky, A. Review of Unmanned Aerial System (UAS) applications in the built environment: Towards automated building inspection procedures using drones. Autom. Constr. 2018, 93, 252–264. [Google Scholar] [CrossRef]
- Zhou, S.; Gheisari, M. Unmanned aerial system applications in construction: A systematic review. Constr. Innov. 2018, 18, 453–468. [Google Scholar] [CrossRef]
- Restas, A. Drone Applications for Supporting Disaster Management. World J. Eng. Technol. 2015, 3, 316–321. [Google Scholar] [CrossRef]
- McCabe, M.; Rodell, M.; Alsdorf, D.; Miralles, D.; Uijlenhoet, R.; Wagner, W.; Lucieer, A.; Houborg, R.; Verhoest, N.; Franz, T.; et al. The future of earth observation in Hydrology. Air Space Eur. 2017, 2, 42–44. [Google Scholar] [CrossRef]
- Debell, L.; Anderson, K.; Brazier, R.; King, N.; Jones, L. Water resource management at catchment scales using lightweight UAVs: Current capabilities and future perspectives. J. Unmanned Veh. Syst. 2016, 4, 7–30. [Google Scholar] [CrossRef]
- Colomina, I.; Molina, P. Unmanned aerial systems for photogrammetry and remote sensing: A review. ISPRS J. Photogramm. Remote Sens. 2014, 92, 79–97. [Google Scholar] [CrossRef]
- Carrivick, J.L.; Smith, M.W. Fluvial and aquatic applications of Structure from Motion photogrammetry and unmanned aerial vehicle/drone technology. Wiley Interdiscip. Rev. Water 2019, 6, e1328. [Google Scholar] [CrossRef]
- Tomsett, C.; Leyland, J. Remote sensing of river corridors: A review of current trends and future directions. River Res. Appl. 2019, 35, 779–803. [Google Scholar] [CrossRef]
- Rhee, D.S.; Kim, Y.D.; Kang, B.; Kim, D. Applications of unmanned aerial vehicles in fluvial remote sensing: An overview of recent achievements. KSCE J. Civ. Eng. 2017, 22, 588–602. [Google Scholar] [CrossRef]
- Kislik, C.; Dronova, I.; Kelly, M. UAVs in Support of Algal Bloom Research: A Review of Current Applications and Future Opportunities. Drones 2018, 2, 35. [Google Scholar] [CrossRef]
- Wu, D.; Li, R.; Zhang, F.; Liu, J. A review on drone-based harmful algae blooms monitoring. Environ. Monit. Assess. 2019, 191, 211. [Google Scholar] [CrossRef] [PubMed]
- Terwilliger, B.; Ison, D.C.; Robbins, J.; Vincenzi, D. Small Unmanned Aircraft Systems Guide: Exploring Designs, Operations, Regulations, and Economics; Aviation Supplies & Academics: Washington, DC, USA, 2017. [Google Scholar]
- Arjomandi, M.; Agostino, S.; Mammone, M.; Nelson, M.; Zhou, T. Classification of Unmanned Aerial Vehicles; Mech. Eng.; University of Adelaide: Adelaide, Australia, 2006. [Google Scholar]
- Weibel, R.E.; Hansman, R.J. Safety considerations for operation of different classes of UAVs in the NAS. In Proceedings of the Aiaa 4th Aviation Technology, Integration and Operations (Atio) Forum, Chicago, IL, USA, 20–22 September 2004; Volume 1, pp. 341–351. [Google Scholar] [CrossRef]
- Hassanalian, M.; Abdelkefi, A. Classifications, applications, and design challenges of drones: A review. Prog. Aerosp. Sci. 2017, 91, 99–131. [Google Scholar] [CrossRef]
- Watts, A.C.; Ambrosia, V.G.; Hinkley, E.A. Unmanned Aircraft Systems in Remote Sensing and Scientific Research: Classification and Considerations of Use. Remote Sens. 2012, 4, 1671–1692. [Google Scholar] [CrossRef]
- Johnston, D.W. Unoccupied Aircraft Systems in Marine Science and Conservation. Annu. Rev. Mar. Sci. 2019, 11, 439–463. [Google Scholar] [CrossRef]
- Boukoberine, M.N.; Zhou, Z.; Benbouzid, M. A critical review on unmanned aerial vehicles power supply and energy management: Solutions, strategies, and prospects. Appl. Energy 2019, 255, 113823. [Google Scholar] [CrossRef]
- Snavely, N.; Seitz, S.M.; Szeliski, R. Modeling the World from Internet Photo Collections. Int. J. Comput. Vis. 2008, 80, 189–210. [Google Scholar] [CrossRef]
- He, Y.; Weng, Q. High Spatial Resolution Remote Sensing: Data, Analysis, and Applications; CRC Press: Boca Raton, FL, USA, 2018; ISBN 9781498767682. [Google Scholar]
- Dugdale, S.J. A practitioner’s guide to thermal infrared remote sensing of rivers and streams: Recent advances, precautions and considerations. Wiley Interdiscip. Rev. Water 2016, 3, 251–268. [Google Scholar] [CrossRef]
- Mesas-Carrascosa, F.-J.; Pérez-Porras, F.; De Larriva, J.E.M.; Frau, C.M.; Agüera-Vega, F.; Carvajal-Ramírez, F.; Martínez-Carricondo, P.; García-Ferrer, A. Drift Correction of Lightweight Microbolometer Thermal Sensors On-Board Unmanned Aerial Vehicles. Remote Sens. 2018, 10, 615. [Google Scholar] [CrossRef]
- Döpper, V.; Gränzig, T.; Kleinschmit, B.; Förster, M. Challenges in UAS-Based TIR Imagery Processing: Image Alignment and Uncertainty Quantification. Remote Sens. 2020, 12, 1552. [Google Scholar] [CrossRef]
- Di Stefano, G.; Romeo, G.; Mazzini, A.; Iarocci, A.; Hadi, S.; Pelphrey, S. The Lusi drone: A multidisciplinary tool to access extreme environments. Mar. Pet. Geol. 2018, 90, 26–37. [Google Scholar] [CrossRef]
- Lejot, J.; Delacourt, C.; Piégay, H.; Fournier, T.; Trémélo, M.-L.; Allemand, P. Very high spatial resolution imagery for channel bathymetry and topography from an unmanned mapping controlled platform. Earth Surf. Process. Landf. 2007, 32, 1705–1725. [Google Scholar] [CrossRef]
- Woodget, A.S.; Dietrich, J.T.; Wilson, R.T. Quantifying Below-Water Fluvial Geomorphic Change: The Implications of Refraction Correction, Water Surface Elevations, and Spatially Variable Error. Remote Sens. 2019, 11, 2415. [Google Scholar] [CrossRef]
- Gentile, V.; Mrόz, M.; Spitoni, M.; Lejot, J.; Piégay, H.; Demarchi, L. Bathymetric Mapping of Shallow Rivers with UAV Hyperspectral Data. In Proceedings of the Fifth International Conference on Telecommunications and Remote Sensing, Milan, Italy, 10–11 October 2016; pp. 43–49. [Google Scholar]
- Flener, C.; Vaaja, M.; Jaakkola, A.; Krooks, A.; Kaartinen, H.; Kukko, A.; Kasvi, E.; Hyyppä, H.; Hyyppä, J.; Alho, P. Seamless Mapping of River Channels at High Resolution Using Mobile LiDAR and UAV-Photography. Remote Sens. 2013, 5, 6382–6407. [Google Scholar] [CrossRef]
- Castro, C.C.; Gómez, J.A.D.; Martín, J.D.; Sánchez, B.A.H.; Arango, J.L.C.; Tuya, F.A.C.; Díaz-Varela, R. An UAV and Satellite Multispectral Data Approach to Monitor Water Quality in Small Reservoirs. Remote Sens. 2020, 12, 1514. [Google Scholar] [CrossRef]
- Pai, H.; Malenda, H.F.; Briggs, M.A.; Singha, K.; González-Pinzón, R.; Gooseff, M.N.; Tyler, S.W. Potential for Small Unmanned Aircraft Systems Applications for Identifying Groundwater-Surface Water Exchange in a Meandering River Reach. Geophys. Res. Lett. 2017, 44, 11868–11877. [Google Scholar] [CrossRef]
- Legleiter, C.J.; Harrison, L.R. Remote Sensing of River Bathymetry: Evaluating a Range of Sensors, Platforms, and Algorithms on the Upper Sacramento River, California, USA. Water Resour. Res. 2019, 55, 2142–2169. [Google Scholar] [CrossRef]
- Collas, F.P.; Van Iersel, W.K.; Straatsma, M.W.; Buijse, A.D.; Leuven, R.S. Sub-Daily Temperature Heterogeneity in a Side Channel and the Influence on Habitat Suitability of Freshwater Fish. Remote Sens. 2019, 11, 2367. [Google Scholar] [CrossRef]
- Dugdale, S.J.; Kelleher, C.A.; Malcolm, I.A.; Caldwell, S.; Hannah, D.M. Assessing the potential of drone-based thermal infrared imagery for quantifying river temperature heterogeneity. Hydrol. Process. 2019, 33, 1152–1163. [Google Scholar] [CrossRef]
- Kinzel, P.J.; Legleiter, C.J. sUAS-Based Remote Sensing of River Discharge Using Thermal Particle Image Velocimetry and Bathymetric Lidar. Remote Sens. 2019, 11, 2317. [Google Scholar] [CrossRef]
- Mallast, U.; Siebert, C. Combining continuous spatial and temporal scales for SGD investigations using UAV-based thermal infrared measurements. Hydrol. Earth Syst. Sci. 2019, 23, 1375–1392. [Google Scholar] [CrossRef]
- Chen, S.; Johnson, F.; Drummond, C.; Glamore, W. A new method to improve the accuracy of remotely sensed data for wetland water balance estimates. J. Hydrol. Reg. Stud. 2020, 29, 100689. [Google Scholar] [CrossRef]
- Vázquez-Tarrío, D.; Borgniet, L.; Liébault, F.; Recking, A. Using UAS optical imagery and SfM photogrammetry to characterize the surface grain size of gravel bars in a braided river (Vénéon River, French Alps). Geomorphology 2017, 285, 94–105. [Google Scholar] [CrossRef]
- Li, H.; Chen, L.; Wang, Z.; Yu, Z. Mapping of River Terraces with Low-Cost UAS Based Structure-from-Motion Photogrammetry in a Complex Terrain Setting. Remote Sens. 2019, 11, 464. [Google Scholar] [CrossRef]
- Hemmelder, S.; Marra, W.; Markies, H.; De Jong, S.M. Monitoring river morphology & bank erosion using UAV imagery—A case study of the river Buëch, Hautes-Alpes, France. Int. J. Appl. Earth Obs. Geoinf. 2018, 73, 428–437. [Google Scholar] [CrossRef]
- Mazzoleni, M.; Paron, P.; Reali, A.; Juizo, D.; Manane, J.; Brandimarte, L. Testing UAV-derived topography for hydraulic modelling in a tropical environment. Nat. Hazards 2020, 103, 139–163. [Google Scholar] [CrossRef]
- Zinke, P.; Flenner, C. 2013. Experiences from the use of Unmanned Aerial Vehicles (UAV) for River Bathymetry Modelling in Norway. Vann 2013, 48, 351–360. [Google Scholar]
- Woodget, A.S.; Carbonneau, P.E.; Visser, F.; Maddock, I.P. Quantifying submerged fluvial topography using hyperspatial resolution UAS imagery and structure from motion photogrammetry. Earth Surf. Process. Landf. 2014, 40, 47–64. [Google Scholar] [CrossRef]
- Dietrich, J.T. Bathymetric Structure-from-Motion: Extracting shallow stream bathymetry from multi-view stereo photogrammetry. Earth Surf. Process. Landf. 2017, 42, 355–364. [Google Scholar] [CrossRef]
- Entwistle, N.S.; Heritage, G.L. Small unmanned aerial model accuracy for photogrammetrical fluvial bathymetric survey. J. Appl. Remote Sens. 2019, 13, 014523. [Google Scholar] [CrossRef]
- Partama, I.Y.; Kanno, A.; Ueda, M.; Akamatsu, Y.; Inui, R.; Sekine, M.; Yamamoto, K.; Imai, T.; Higuchi, T. Removal of water-surface reflection effects with a temporal minimum filter for UAV-based shallow-water photogrammetry. Earth Surf. Process. Landf. 2018, 43, 2673–2682. [Google Scholar] [CrossRef]
- Skarlatos, D.; Agrafiotis, P. A Novel Iterative Water Refraction Correction Algorithm for Use in Structure from Motion Photogrammetric Pipeline. J. Mar. Sci. Eng. 2018, 6, 77. [Google Scholar] [CrossRef]
- Agrafiotis, P.; Karantzalos, K.; Georgopoulos, A.; Skarlatos, D. Correcting Image Refraction: Towards Accurate Aerial Image-Based Bathymetry Mapping in Shallow Waters. Remote Sens. 2020, 12, 322. [Google Scholar] [CrossRef]
- Agrafiotis, P.; Skarlatos, D.; Georgopoulos, A.; Karantzalos, K. DepthLearn: Learning to Correct the Refraction on Point Clouds Derived from Aerial Imagery for Accurate Dense Shallow Water Bathymetry Based on SVMs-Fusion with LiDAR Point Clouds. Remote Sens. 2019, 11, 2225. [Google Scholar] [CrossRef]
- Mandlburger, G.; Pfennigbauer, M.; Schwarz, R.; Flöry, S.; Nussbaumer, L. Concept and Performance Evaluation of a Novel UAV-Borne Topo-Bathymetric LiDAR Sensor. Remote Sens. 2020, 12, 986. [Google Scholar] [CrossRef]
- Kasvi, E.; Salmela, J.; Lotsari, E.; Kumpula, T.; Lane, S. Comparison of remote sensing based approaches for mapping bathymetry of shallow, clear water rivers. Geomorphology 2019, 333, 180–197. [Google Scholar] [CrossRef]
- Erena, M.; Atenza, J.F.; García-Galiano, S.; Domínguez, J.A.; Bernabé, J.M. Use of Drones for the Topo-Bathymetric Monitoring of the Reservoirs of the Segura River Basin. Water 2019, 11, 445. [Google Scholar] [CrossRef]
- Bandini, F.; Olesen, D.; Jakobsen, J.; Kittel, C.M.M.; Wang, S.; Garcia, M.; Bauer-Gottwein, P. Technical note: Bathymetry observations of inland water bodies using a tethered single-beam sonar controlled by an unmanned aerial vehicle. Hydrol. Earth Syst. Sci. 2018, 22, 4165–4181. [Google Scholar] [CrossRef]
- Alvarez, L.V.; Moreno, H.A.; Segales, A.R.; Pham, T.G.; Pillar-Little, E.A.; Chilson, P.B. Merging Unmanned Aerial Systems (UAS) Imagery and Echo Soundings with an Adaptive Sampling Technique for Bathymetric Surveys. Remote Sens. 2018, 10, 1362. [Google Scholar] [CrossRef]
- Kim, J.S.; Baek, D.; Seo, I.W.; Shin, J. Retrieving shallow stream bathymetry from UAV-assisted RGB imagery using a geospatial regression method. Geomorphology 2019, 341, 102–114. [Google Scholar] [CrossRef]
- Langhammer, J.; Janský, B.; Kocum, J.; Minařík, R. 3-D reconstruction of an abandoned montane reservoir using UAV photogrammetry, aerial LiDAR and field survey. Appl. Geogr. 2018, 98, 9–21. [Google Scholar] [CrossRef]
- Tamminga, A.D.; Hugenholtz, C.H.; Eaton, B.C.; Lapointe, M. Hyperspatial Remote Sensing of Channel Reach Morphology and Hydraulic Fish Habitat Using an Unmanned Aerial Vehicle (UAV): A First Assessment in the Context of River Research and Management. River Res. Appl. 2015, 31, 379–391. [Google Scholar] [CrossRef]
- Templin, T.; Popielarczyk, D.; Kosecki, R. Application of Low-Cost Fixed-Wing UAV for Inland Lakes Shoreline Investigation. Pure Appl. Geophys. 2018, 175, 3263–3283. [Google Scholar] [CrossRef]
- Alsdorf, D.E.; Rodríguez, E.; Lettenmaier, D.P. Measuring surface water from space. Rev. Geophys. 2007, 45. [Google Scholar] [CrossRef]
- Ridolfi, E.; Manciola, P. Water Level Measurements from Drones: A Pilot Case Study at a Dam Site. Water 2018, 10, 297. [Google Scholar] [CrossRef]
- Gao, A.; Wu, S.; Wang, F.; Wu, X.; Xu, P.; Yu, L.; Zhu, S. A Newly Developed Unmanned Aerial Vehicle (UAV) Imagery Based Technology for Field Measurement of Water Level. Water 2019, 11, 124. [Google Scholar] [CrossRef]
- Bandini, F.; Jakobsen, J.; Olesen, D.H.; Reyna-Gutierrez, J.A.; Bauer-Gottwein, P. Measuring water level in rivers and lakes from lightweight Unmanned Aerial Vehicles. J. Hydrol. 2017, 548, 237–250. [Google Scholar] [CrossRef]
- Bandini, F.; Sunding, T.P.; Linde, J.; Smith, O.; Jensen, I.K.; Köppl, C.J.; Butts, M.; Bauer-Gottwein, P. Unmanned Aerial System (UAS) observations of water surface elevation in a small stream: Comparison of radar altimetry, LIDAR and photogrammetry techniques. Remote Sens. Environ. 2020, 237, 111487. [Google Scholar] [CrossRef]
- Jiang, L.; Bandini, F.; Smith, O.; Jensen, I.K.; Bauer-Gottwein, P. The Value of Distributed High-Resolution UAV-Borne Observations of Water Surface Elevation for River Management and Hydrodynamic Modeling. Remote Sens. 2020, 12, 1171. [Google Scholar] [CrossRef]
- Tymków, P.; Jóźków, G.; Walicka, A.; Karpina, M.; Borkowski, A. Identification of Water Body Extent Based on Remote Sensing Data Collected with Unmanned Aerial Vehicle. Water 2019, 11, 338. [Google Scholar] [CrossRef]
- Niedzielski, T.; Witek, M.; Spallek, W. Observing river stages using unmanned aerial vehicles. Hydrol. Earth Syst. Sci. 2016, 20, 3193–3205. [Google Scholar] [CrossRef]
- García-López, S.; Ruiz-Ortiz, V.; Barbero, L.; Sánchez-Bellón, Á. Contribution of the UAS to the determination of the water budget in a coastal wetland: A case study in the natural park of the Bay of Cádiz (SW Spain). Eur. J. Remote Sens. 2018, 51, 965–977. [Google Scholar] [CrossRef]
- Mohamad, N.; Khanan, M.F.A.; Ahmad, A.; Din, A.H.M.; Shahabi, H. Evaluating Water Level Changes at Different Tidal Phases Using UAV Photogrammetry and GNSS Vertical Data. Sensors 2019, 19, 3778. [Google Scholar] [CrossRef]
- Yucel, M.A.; Turan, R.Y. Areal Change Detection and 3D Modeling of Mine Lakes Using High-Resolution Unmanned Aerial Vehicle Images. Arab. J. Sci. Eng. 2016, 41, 4867–4878. [Google Scholar] [CrossRef]
- McGlynn, B.L.; Blöschl, G.; Borga, M.; Bormann, H.; Hurkmans, R.; Komma, J.; Nandagiri, L.; Uijlenhoet, R.; Wagener, T. A Data Acquisition Framework for Runoff Prediction in Ungauged Basins, Runoff Prediction in Ungauged Basins; Cambridge University Press: Cambridge, UK, 2013. [Google Scholar] [CrossRef]
- Mishra, A.K.; Coulibaly, P. Developments in hydrometric network design: A review. Rev. Geophys. 2009, 47. [Google Scholar] [CrossRef]
- Sichangi, A.W.; Wang, L.; Yang, K.; Chen, D.; Wang, Z.; Li, X.; Zhou, J.; Liu, W.; Kuria, D. Estimating continental river basin discharges using multiple remote sensing data sets. Remote Sens. Environ. 2016, 179, 36–53. [Google Scholar] [CrossRef]
- Sneeuw, N.; Lorenz, C.; Devaraju, B.; Tourian, M.J.; Riegger, J.; Kunstmann, H.; Bárdossy, A. Estimating Runoff Using Hydro-Geodetic Approaches. Surv. Geophys. 2014, 35, 1333–1359. [Google Scholar] [CrossRef]
- Yang, S.; Wang, J.; Wang, P.; Gong, T.; Liu, H. Low Altitude Unmanned Aerial Vehicles (UAVs) and Satellite Remote Sensing Are Used to Calculated River Discharge Attenuation Coefficients of Ungauged Catchments in Arid Desert. Water 2019, 11, 2633. [Google Scholar] [CrossRef]
- Yang, S.; Wang, P.; Lou, H.; Wang, J.; Zhao, C.; Gong, T. Estimating River Discharges in Ungauged Catchments Using the Slope–Area Method and Unmanned Aerial Vehicle. Water 2019, 11, 2361. [Google Scholar] [CrossRef]
- Lou, H.; Wang, P.; Yang, S.; Hao, F.; Ren, X.; Wang, Y.; Shi, L.; Wang, J.; Gong, T. Combining and Comparing an Unmanned Aerial Vehicle and Multiple Remote Sensing Satellites to Calculate Long-Term River Discharge in an Ungauged Water Source Region on the Tibetan Plateau. Remote Sens. 2020, 12, 2155. [Google Scholar] [CrossRef]
- Koutalakis, P.; Tzoraki, O.; Zaimes, G. UAVs for Hydrologic Scopes: Application of a Low-Cost UAV to Estimate Surface Water Velocity by Using Three Different Image-Based Methods. Drones 2019, 3, 14. [Google Scholar] [CrossRef]
- Pearce, S.; Ljubičić, R.; Peña-Haro, S.; Perks, M.; Tauro, F.; Pizarro, A.; Sasso, S.F.D.; Strelnikova, D.; Grimaldi, S.; Maddock, I.; et al. An Evaluation of Image Velocimetry Techniques under Low Flow Conditions and High Seeding Densities Using Unmanned Aerial Systems. Remote Sens. 2020, 12, 232. [Google Scholar] [CrossRef]
- Tauro, F.; Pagano, C.; Phamduy, P.; Grimaldi, S.; Porfiri, M. Large-Scale Particle Image Velocimetry From an Unmanned Aerial Vehicle. IEEE/ASME Trans. Mechatronics 2015, 20, 3269–3275. [Google Scholar] [CrossRef]
- Tauro, F.; Porfiri, M.; Grimaldi, S. Surface flow measurements from drones. J. Hydrol. 2016, 540, 240–245. [Google Scholar] [CrossRef]
- Lewis, Q.W.; Lindroth, E.M.; Rhoads, B.L. Integrating unmanned aerial systems and LSPIV for rapid, cost-effective stream gauging. J. Hydrol. 2018, 560, 230–246. [Google Scholar] [CrossRef]
- Sasso, S.F.D.; Pizarro, A.; Manfreda, S. Metrics for the Quantification of Seeding Characteristics to Enhance Image Velocimetry Performance in Rivers. Remote Sens. 2020, 12, 1789. [Google Scholar] [CrossRef]
- Thumser, P.; Haas, C.; Tuhtan, J.A.; Fuentes-Pérez, J.F.; Toming, G. RAPTOR-UAV: Real-time particle tracking in rivers using an unmanned aerial vehicle. Earth Surf. Process. Landf. 2017, 42, 2439–2446. [Google Scholar] [CrossRef]
- Fulton, J.; Anderson, I.; Chiu, C.-L.; Sommer, W.; Adams, J.; Moramarco, T.; Bjerklie, D.; Fulford, J.; Sloan, J.; Best, H.; et al. QCam: sUAS-Based Doppler Radar for Measuring River Discharge. Remote Sens. 2020, 12, 3317. [Google Scholar] [CrossRef]
- Dyer, J.L.; Moorhead, R.J.; Hathcock, L. Identification and Analysis of Microscale Hydrologic Flood Impacts Using Unmanned Aerial Systems. Remote Sens. 2020, 12, 1549. [Google Scholar] [CrossRef]
- Mourato, S.; Fernandez, P.; Pereira, L.; Moreira, M. Improving a DSM Obtained by Unmanned Aerial Vehicles for Flood Modelling. IOP Conf. Series: Earth Environ. Sci. 2017, 95, 022014. [Google Scholar] [CrossRef]
- Muthusamy, M.; Casado, M.R.; Salmoral, G.; Irvine, T.; Leinster, P. A Remote Sensing Based Integrated Approach to Quantify the Impact of Fluvial and Pluvial Flooding in an Urban Catchment. Remote Sens. 2019, 11, 577. [Google Scholar] [CrossRef]
- Şerban, G.; Rus, I.; Vele, D.; Breţcan, P.; Alexe, M.; Petrea, D. Flood-prone area delimitation using UAV technology, in the areas hard-to-reach for classic aircrafts: Case study in the north-east of Apuseni Mountains, Transylvania. Nat. Hazards 2016, 82, 1817–1832. [Google Scholar] [CrossRef]
- Yalcin, E. Two-dimensional hydrodynamic modelling for urban flood risk assessment using unmanned aerial vehicle imagery: A case study of Kirsehir, Turkey. J. Flood Risk Manag. 2018, 12, e12499. [Google Scholar] [CrossRef]
- Özcan, O. Multi-temporal UAV based repeat monitoring of rivers sensitive to flood. J. Maps 2020, 1–8. [Google Scholar] [CrossRef]
- Diakakis, M.; Andreadakis, E.; Nikolopoulos, E.; Spyrou, N.; Gogou, M.; Deligiannakis, G.; Katsetsiadou, N.; Antoniadis, Z.; Melaki, M.; Georgakopoulos, A.; et al. An integrated approach of ground and aerial observations in flash flood disaster investigations. The case of the 2017 Mandra flash flood in Greece. Int. J. Disaster Risk Reduct. 2019, 33, 290–309. [Google Scholar] [CrossRef]
- Leitão, J.P.; De Vitry, M.M.; Scheidegger, A.; Rieckermann, J. Assessing the quality of digital elevation models obtained from mini unmanned aerial vehicles for overland flow modelling in urban areas. Hydrol. Earth Syst. Sci. 2016, 20, 1637–1653. [Google Scholar] [CrossRef]
- Hashemi-Beni, L.; Jones, J.; Thompson, G.; Johnson, C.; Gebrehiwot, A. Challenges and Opportunities for UAV-Based Digital Elevation Model Generation for Flood-Risk Management: A Case of Princeville, North Carolina. Sensors 2018, 18, 3843. [Google Scholar] [CrossRef]
- Schumann, G.J.P.; Muhlhausen, J.; Andreadis, K.M. Rapid mapping of small-scale river-floodplain environments using UAV SfM supports classical theory. Remote Sens. 2019, 11, 982. [Google Scholar] [CrossRef]
- Annis, A.; Nardi, F.; Petroselli, A.; Apollonio, C.; Arcangeletti, E.; Tauro, F.; Belli, C.; Bianconi, R.; Grimaldi, S. UAV-DEMs for Small-Scale Flood Hazard Mapping. Water 2020, 12, 1717. [Google Scholar] [CrossRef]
- Villanueva, J.R.E.; Martínez, L.I.; Montiel, J.I.P. DEM Generation from Fixed-Wing UAV Imaging and LiDAR-Derived Ground Control Points for Flood Estimations. Sensors 2019, 19, 3205. [Google Scholar] [CrossRef] [PubMed]
- Tamminga, A.D.; Eaton, B.C.; Hugenholtz, C.H. UAS-based remote sensing of fluvial change following an extreme flood event. Earth Surf. Process. Landf. 2015, 40, 1464–1476. [Google Scholar] [CrossRef]
- Abdelkader, M.; Shaqura, M.; Claudel, C.G.; Gueaieb, W. A UAV based system for real time flash flood monitoring in desert environments using Lagrangian microsensors. In Proceedings of the 2013 International Conference on Unmanned Aircraft Systems (ICUAS), Atlanta, GA, USA, 28–31 May 2013; pp. 25–34. [Google Scholar]
- Popescu, D.; Ichim, L.; Stoican, F. Unmanned Aerial Vehicle Systems for Remote Estimation of Flooded Areas Based on Complex Image Processing. Sensors 2017, 17, 446. [Google Scholar] [CrossRef]
- Gebrehiwot, A.; Hashemi-Beni, L.; Thompson, G.; Kordjamshidi, P.; Langan, T.E. Deep Convolutional Neural Network for Flood Extent Mapping Using Unmanned Aerial Vehicles Data. Sensors 2019, 19, 1486. [Google Scholar] [CrossRef]
- Jakovljevic, G.; Govedarica, M.; Alvarez-Taboada, F.; Pajic, V. Accuracy Assessment of Deep Learning Based Classification of LiDAR and UAV Points Clouds for DTM Creation and Flood Risk Mapping. Geosciences 2019, 9, 323. [Google Scholar] [CrossRef]
- Erdelj, M.; Natalizio, E.; Chowdhury, K.R.; Akyildiz, I.F. Help from the Sky: Leveraging UAVs for Disaster Management. IEEE Pervasive Comput. 2017, 16, 24–32. [Google Scholar] [CrossRef]
- Salmoral, G.; Casado, M.R.; Muthusamy, M.; Butler, D.; Menon, P.P.; Leinster, P. Guidelines for the Use of Unmanned Aerial Systems in Flood Emergency Response. Water 2020, 12, 521. [Google Scholar] [CrossRef]
- Kastridis, A.; Kirkenidis, C.; Sapountzis, M. An integrated approach of flash flood analysis in ungauged Mediterranean watersheds using post-flood surveys and unmanned aerial vehicles. Hydrol. Process. 2020, 34, 4920–4939. [Google Scholar] [CrossRef]
- Handcock, R.N.; Torgersen, C.E.; Cherkauer, K.A.; Gillespie, A.R.; Tockner, K.; Faux, R.N.; Tan, J. Thermal Infrared Remote Sensing of Water Temperature in Riverine Landscapes. Fluv. Remote Sens. Sci. Manag. 2012, 1, 85–113. [Google Scholar] [CrossRef]
- Jensen, A.M.; Neilson, B.T.; McKee, M.; Chen, Y. Thermal remote sensing with an autonomous unmanned aerial remote sensing platform for surface stream temperatures. 2012 IEEE Int. Geosci. Remote Sens. Symp. 2012, 5049–5052. [Google Scholar] [CrossRef]
- Wawrzyniak, V.; Piégay, H.; Allemand, P.; Vaudor, L.; Grandjean, P. Prediction of water temperature heterogeneity of braided rivers using very high resolution thermal infrared (TIR) images. Int. J. Remote Sens. 2013, 34, 4812–4831. [Google Scholar] [CrossRef]
- Kelly, J.; Kljun, N.; Olsson, P.-O.; Mihai, L.; Liljeblad, B.; Weslien, P.; Klemedtsson, L.; Eklundh, L. Challenges and Best Practices for Deriving Temperature Data from an Uncalibrated UAV Thermal Infrared Camera. Remote Sens. 2019, 11, 567. [Google Scholar] [CrossRef]
- Chung, M.; Detweiler, C.; Hamilton, M.; Higgins, J.; Ore, J.-P.; Thompson, S. Obtaining the Thermal Structure of Lakes from the Air. Water 2015, 7, 6467–6482. [Google Scholar] [CrossRef]
- Koparan, C.; Koc, A.B.; Sawyer, C.; Privette, C. Temperature Profiling of Waterbodies with a UAV-Integrated Sensor Subsystem. Drones 2020, 4, 35. [Google Scholar] [CrossRef]
- Demario, A.; Lopez, P.; Plewka, E.; Wix, R.; Xia, H.; Zamora, E.; Gessler, D.; Yalin, A.P. Water Plume Temperature Measurements by an Unmanned Aerial System (UAS). Sensors 2017, 17, 306. [Google Scholar] [CrossRef] [PubMed]
- Caldwell, S.; Kelleher, C.; Baker, E.; Lautz, L. Relative information from thermal infrared imagery via unoccupied aerial vehicle informs simulations and spatially-distributed assessments of stream temperature. Sci. Total. Environ. 2019, 661, 364–374. [Google Scholar] [CrossRef]
- Powers, C.; Hanlon, R.; Schmale, D. Tracking of a Fluorescent Dye in a Freshwater Lake with an Unmanned Surface Vehicle and an Unmanned Aircraft System. Remote Sens. 2018, 10, 81. [Google Scholar] [CrossRef]
- Baek, D.; Seo, I.W.; Kim, J.S.; Nelson, J.M. UAV-based measurements of spatio-temporal concentration distributions of fluorescent tracers in open channel flows. Adv. Water Resour. 2019, 127, 76–88. [Google Scholar] [CrossRef]
- Legleiter, C.J.; McDonald, R.R.; Nelson, J.M.; Kinzel, P.J.; Perroy, R.L.; Baek, D.; Seo, I.W. Remote sensing of tracer dye concentrations to support dispersion studies in river channels. J. Ecohydraulics 2019, 4, 131–146. [Google Scholar] [CrossRef]
- Martin, C.; Parkes, S.; Zhang, Q.; Zhang, X.; McCabe, M.F.; Duarte, C.M. Use of unmanned aerial vehicles for efficient beach litter monitoring. Mar. Pollut. Bull. 2018, 131, 662–673. [Google Scholar] [CrossRef] [PubMed]
- Fallati, L.; Polidori, A.; Salvatore, C.; Saponari, L.; Savini, A.; Galli, P. Anthropogenic Marine Debris assessment with Unmanned Aerial Vehicle imagery and deep learning: A case study along the beaches of the Republic of Maldives. Sci. Total Environ. 2019, 693, 133581. [Google Scholar] [CrossRef] [PubMed]
- Kako, S.; Morita, S.; Taneda, T. Estimation of plastic marine debris volumes on beaches using unmanned aerial vehicles and image processing based on deep learning. Mar. Pollut. Bull. 2020, 155, 111127. [Google Scholar] [CrossRef]
- Geraeds, M.; Van Emmerik, T.; De Vries, R.; Bin Ab Razak, M.S. Riverine Plastic Litter Monitoring Using Unmanned Aerial Vehicles (UAVs). Remote Sens. 2019, 11, 2045. [Google Scholar] [CrossRef]
- Jakovljevic, G.; Govedarica, M.; Alvarez-Taboada, F. A Deep Learning Model for Automatic Plastic Mapping Using Unmanned Aerial Vehicle (UAV) Data. Remote Sens. 2020, 12, 1515. [Google Scholar] [CrossRef]
- Hengstmann, E.; Fischer, E.K. Anthropogenic litter in freshwater environments—Study on lake beaches evaluating marine guidelines and aerial imaging. Environ. Res. 2020, 189, 109945. [Google Scholar] [CrossRef]
- Wurtsbaugh, W.A.; Paerl, H.W.; Dodds, W.K. Nutrients, eutrophication and harmful algal blooms along the freshwater to marine continuum. Wiley Interdiscip. Rev. Water 2019, 6. [Google Scholar] [CrossRef]
- Fráter, T.; Juzsakova, T.; Lauer, J.; Dióssy, L.; Rédey, Á. Unmanned Aerial Vehicles in Environmental Monitoring—An Efficient Way for Remote Sensing. J. Environ. Sci. Eng. A 2015, 4, 85–91. [Google Scholar] [CrossRef][Green Version]
- Ngo, A.S.K.; Desingco, J.D.B.; Ii, M.O.C.; Uy, R.L.; Ong, P.M.B.; Punzalan, E.R.; Ilao, J.P. Determining the Correlation between Concentration Levels and the Visual Determining the Correlation Between Concentration Levels and the Visual Features of Algae in Water Surfaces. 2015. Available online: https://www.researchgate.net/publication/283086583_Determining_the_Correlation_Between_Concentration_Levels_and_the_Visual_Features_of_Algae_in_Water_Surfaces (accessed on 30 November 2020).
- Van Der Merwe, D.; Price, K.P. Harmful Algal Bloom Characterization at Ultra-High Spatial and Temporal Resolution Using Small Unmanned Aircraft Systems. Toxins 2015, 7, 1065–1078. [Google Scholar] [CrossRef] [PubMed]
- Su, T.-C.; Chou, H.-T. Application of Multispectral Sensors Carried on Unmanned Aerial Vehicle (UAV) to Trophic State Mapping of Small Reservoirs: A Case Study of Tain-Pu Reservoir in Kinmen, Taiwan. Remote Sens. 2015, 7, 10078–10097. [Google Scholar] [CrossRef]
- Jang, S.W.; Yoon, H.J.; Kwak, S.N.; Sohn, B.Y.; Kim, S.G.; Kim, D.H. Algal Bloom Monitoring using UAVs Imagery. Next Gener. Comput. Inf. Technol. 2016, 138, 30–33. [Google Scholar] [CrossRef]
- Aguirre-Gómez, R.; Salmerón-García, O.; Gómez-Rodríguez, G.; Peralta-Higuera, A. Use of unmanned aerial vehicles and remote sensors in urban lakes studies in Mexico. Int. J. Remote Sens. 2016, 38, 2771–2779. [Google Scholar] [CrossRef]
- Salarux, C.; Kaewplang, S. Estimation of Algal Bloom Biomass Using UAV-Based Remote Sensing with NDVI and GRVI. Mahasarakham Int. J. Eng. Technol. 2020, 6, 1–6. [Google Scholar]
- Honkavaara, E.; Hakala, T.; Kirjasniemi, J.; Lindfors, A.; Mäkynen, J.; Nurminen, K.; Ruokokoski, P.; Saari, H.; Markelin, L. New light-weight stereosopic spectrometric airborne imaging technology for high-resolution environmental remote sensing; case studies in water quality mapping. ISPRS Int. Arch. Photogramm. Remote Sens. Spat. Inf. Sci. 2013, XL-1/W1, 139–144. [Google Scholar] [CrossRef]
- Becker, R.H.; Sayers, M.; Dehm, D.; Shuchman, R.; Quintero, K.; Bosse, K.; Sawtell, R. Unmanned aerial system based spectroradiometer for monitoring harmful algal blooms: A new paradigm in water quality monitoring. J. Great Lakes Res. 2019, 45, 444–453. [Google Scholar] [CrossRef]
- Penmetcha, M.; Luo, S.; Samantaray, A.; DIetz, J.E.; Yang, B.; Min, B.C. Computer vision-based algae removal planner for multi-robot teams. In Proceedings of the 2019 IEEE International Conference on Systems, Man and Cybernetics (SMC), Bari, Italy, 6–9 October 2019; pp. 1575–1581. [Google Scholar] [CrossRef]
- Kwon, Y.S.; Pyo, J.; Duan, H.; Cho, K.H.; Park, Y. Drone-based hyperspectral remote sensing of cyanobacteria using vertical cumulative pigment concentration in a deep reservoir. Remote Sens. Environ. 2020, 236, 111517. [Google Scholar] [CrossRef]
- Zhang, Y.; Wu, L.; Ren, H.; Liu, Y.; Zheng, Y.; Liu, Y.; Dong, J. Mapping Water Quality Parameters in Urban Rivers from Hyperspectral Images Using a New Self-Adapting Selection of Multiple Artificial Neural Networks. Remote Sens. 2020, 12, 336. [Google Scholar] [CrossRef]
- Ore, J.P.; Elbaum, S.; Burgin, A.; Detweiler, C. Autonomous aerial water sampling. In Field and Service Robotics; Mejias, L., Corke, P., Roberts, J., Eds.; Springer International Publishing: Cham, Switzerland, 2015; pp. 137–151. [Google Scholar]
- Detweiler, C.; Ore, J.-P.; Anthony, D.; Elbaum, S.; Burgin, A.J.; Lorenz, A. Environmental Reviews and Case Studies: Bringing Unmanned Aerial Systems Closer to the Environment. Environ. Pract. 2015, 17, 188–200. [Google Scholar] [CrossRef]
- Schwarzbach, M.; Laiacker, M.; Mulero-Pazmany, M.; Kondak, K. Remote water sampling using flying robots. In Proceedings of the 2014 International conference on unmanned aircraft systems (ICUAS), Orlando, FL, USA, 27–30 May 2014; pp. 72–76. [Google Scholar] [CrossRef]
- Terada, A.; Morita, Y.; Hashimoto, T.; Mori, T.; Ohba, T.; Yaguchi, M.; Kanda, W. Water sampling using a drone at Yugama crater lake, Kusatsu-Shirane volcano, Japan. Earth Planets Space 2018, 70, 64. [Google Scholar] [CrossRef]
- Song, K.; Brewer, A.; Ahmadian, S.; Shankar, A.; Detweiler, C.; Burgin, A.J. Using unmanned aerial vehicles to sample aquatic ecosystems. Limnol. Oceanogr. Methods 2017, 15, 1021–1030. [Google Scholar] [CrossRef]
- Elijah, O.; Rahman, T.A.; Leow, C.Y.; Yeen, H.C.; Sarijari, M.A.; Aris, A.; Salleh, J.; Chua, T.H. A concept paper on smart river monitoring system for sustainability in river. Int. J. Integr. Eng. 2018, 10, 130–139. [Google Scholar] [CrossRef]
- Koparan, C.; Koc, A.B.; Privette, C.V.; Sawyer, C.B. In Situ Water Quality Measurements Using an Unmanned Aerial Vehicle (UAV) System. Water 2018, 10, 264. [Google Scholar] [CrossRef]
- Esakki, B.; Ganesan, S.; Mathiyazhagan, S.; Ramasubramanian, K.; Gnanasekaran, B.; Son, B.; Park, S.W.; Choi, J.S. Design of Amphibious Vehicle for Unmanned Mission in Water Quality Monitoring Using Internet of Things. Sensors 2018, 18, 3318. [Google Scholar] [CrossRef]
- Doi, H.; Akamatsu, Y.; Watanabe, Y.; Goto, M.; Inui, R.; Katano, I.; Nagano, M.; Takahara, T.; Minamoto, T. Water sampling for environmental DNA surveys by using an unmanned aerial vehicle. Limnol. Oceanogr. Methods 2017, 15, 939–944. [Google Scholar] [CrossRef]
- Banerjee, B.; Raval, S.; Maslin, T.J.; Timms, W. Development of a UAV-mounted system for remotely collecting mine water samples. Int. J. Mining Reclam. Environ. 2018, 34, 385–396. [Google Scholar] [CrossRef]
- Castendyk, D.; Straight, B.; Flllatreault, P.; Thlbeault, S.; Cameron, L. Aerial drones used to sample pit lake water reduce costs and improve safety. Miner. Eng. 2017, 69, 20–28. [Google Scholar]
- Castendyk, D.; Straight, B.; Voorhis, J.; Somogyi, M.; Jepson, W.; Kucera, B. Using aerial drones to select sample depths in pit lakes. In Proceedings of the 13th International Conference on Mine Closure, Perth, Australia, 3–5 September 2019; pp. 1113–1126. [Google Scholar] [CrossRef]
- Jung, S.; Cho, H.; Kim, N.; Kim, K.; Han, J.-I.; Myung, H. Development of Algal Bloom Removal System Using Unmanned Aerial Vehicle and Surface Vehicle. IEEE Access 2017, 5, 22166–22176. [Google Scholar] [CrossRef]
- Agarwal, P.; Singh, M.K. A multipurpose drone for water sampling video surveillance. In Proceedings of the 2019 Second International Conference on Advanced Computational and Communication Paradigms (ICACCP), Gangtok, India, 25–28 February 2019; pp. 1–5. [Google Scholar] [CrossRef]
- Grandy, J.J.; Galpin, V.; Singh, V.; Pawliszyn, J. Development of a Drone-Based Thin-Film Solid-Phase Microextraction Water Sampler to Facilitate On-Site Screening of Environmental Pollutants. Anal. Chem. 2020, 92, 12917–12924. [Google Scholar] [CrossRef] [PubMed]
- Lally, H.; O’Connor, I.; Jensen, O.; Graham, C. Can drones be used to conduct water sampling in aquatic environments? A review. Sci. Total Environ. 2019, 670, 569–575. [Google Scholar] [CrossRef] [PubMed]
- Abolt, C.; Caldwell, T.; Wolaver, B.; Pai, H. Unmanned aerial vehicle-based monitoring of groundwater inputs to surface waters using an economical thermal infrared camera. Opt. Eng. 2018, 57, 053113. [Google Scholar] [CrossRef]
- Harvey, M.C.; Hare, D.K.; Hackman, A.; Davenport, G.; Haynes, A.B.; Helton, A.; Lane, J.J.W.; Briggs, M.A. Evaluation of Stream and Wetland Restoration Using UAS-Based Thermal Infrared Mapping. Water 2019, 11, 1568. [Google Scholar] [CrossRef]
- Casas-Mulet, R.; Pander, J.; Ryu, D.; Stewardson, M.J.; Geist, J. Unmanned Aerial Vehicle (UAV)-Based Thermal Infra-Red (TIR) and Optical Imagery Reveals Multi-Spatial Scale Controls of Cold-Water Areas Over a Groundwater-Dominated Riverscape. Front. Environ. Sci. 2020, 8, 1–16. [Google Scholar] [CrossRef]
- Rautio, A.; Korkka-Niemi, K.; Salonen, V.-P. Thermal Infrared Remote Sensing in Assessing Ground/Surface Water Resources Related to the Hannukainen Mining Development Site; Mine Water and Circular Economy IMWA: Lappeenranta, Finland, 2017. [Google Scholar]
- Bandini, F.; Butts, M.; Jacobsen, T.V.; Bauer-Gottwein, P. Water level observations from unmanned aerial vehicles for improving estimates of surface water-groundwater interaction. Hydrol. Process. 2017, 31, 4371–4383. [Google Scholar] [CrossRef]
- Tang, Q.; Schilling, O.S.; Kurtz, W.; Brunner, P.; Vereecken, H.; Franssen, H.-J.H. Simulating Flood-Induced Riverbed Transience Using Unmanned Aerial Vehicles, Physically Based Hydrological Modeling, and the Ensemble Kalman Filter. Water Resour. Res. 2018, 54, 9342–9363. [Google Scholar] [CrossRef]
- Briggs, M.A.; Wang, C.; Day-Lewis, F.D.; Williams, K.H.; Dong, W.; Lane, J.W. Return flows from beaver ponds enhance floodplain-to-river metals exchange in alluvial mountain catchments. Sci. Total Environ. 2019, 685, 357–369. [Google Scholar] [CrossRef]
- Furlan, L.M.; Rosolen, V.; Salles, J.; Moreira, C.A.; Ferreira, M.E.; Bueno, G.T.; Coelho, C.V.D.S.; Mounier, S. Natural superficial water storage and aquifer recharge assessment in Brazilian savanna wetland using unmanned aerial vehicle and geophysical survey. J. Unmanned Veh. Syst. 2020, 8, 224–244. [Google Scholar] [CrossRef]
- Siebert, C.; Mallast, U.; Rödiger, T.; Ionescu, D.; Schwonke, F.; Hall, J.K.; Sade, A.R.; Pohl, T.; Merkel, B. Multiple sensor tracking of submarine groundwater discharge: Concept study along the Dead Sea. In Proceedings of the EGU General Assembly Conference Abstracts, Vienna, Austria, 24 April–2 May 2014; p. 11217. [Google Scholar]
- Lee, E.; Yoon, H.; Hyun, S.P.; Burnett, W.C.; Koh, D.; Ha, K.; Kim, D.; Kim, Y.; Kang, K. Unmanned aerial vehicles (UAVs)-based thermal infrared (TIR) mapping, a novel approach to assess groundwater discharge into the coastal zone. Limnol. Oceanogr. Methods 2016, 14, 725–735. [Google Scholar] [CrossRef]
- Rahman, M.M.; McDermid, G.J.; Strack, M.; Lovitt, J. A New Method to Map Groundwater Table in Peatlands Using Unmanned Aerial Vehicles. Remote Sens. 2017, 9, 1057. [Google Scholar] [CrossRef]
- Bandini, F.; Lopez-Tamayo, A.; Merediz-Alonso, G.; Olesen, D.; Jakobsen, J.; Wang, S.; Garcia, M.; Bauer-Gottwein, P. Unmanned aerial vehicle observations of water surface elevation and bathymetry in the cenotes and lagoons of the Yucatan Peninsula, Mexico. Hydrogeol. J. 2018, 26, 2213–2228. [Google Scholar] [CrossRef]
- Allred, B.; Eash, N.; Freeland, R.; Martinez, L.; Wishart, D. Effective and efficient agricultural drainage pipe mapping with UAS thermal infrared imagery: A case study. Agric. Water Manag. 2018, 197, 132–137. [Google Scholar] [CrossRef]
- Kratt, C.; Woo, D.; Johnson, K.; Haagsma, M.; Kumar, P.; Selker, J.; Tyler, S. Field trials to detect drainage pipe networks using thermal and RGB data from unmanned aircraft. Agric. Water Manag. 2020, 229, 105895. [Google Scholar] [CrossRef]
- Levy, M.C.; Neely, W.R.; Borsa, A.A.; Burney, J.A. Fine-scale spatiotemporal variation in subsidence across California’s San Joaquin Valley explained by groundwater demand. Environ. Res. Lett. 2020, 15, 104083. [Google Scholar] [CrossRef]
- Nayyeri, M.; Hosseini, S.A.; Javadi, S.; Sharafati, A. Spatial Differentiation Characteristics of Groundwater Stress Index and its Relation to Land Use and Subsidence in the Varamin Plain, Iran. Nat. Resour. Res. 2021, 30, 339–357. [Google Scholar] [CrossRef]
- Yu, H.; Gong, H.; Chen, B.; Liu, K.; Gao, M. Analysis of the influence of groundwater on land subsidence in Beijing based on the geographical weighted regression (GWR) model. Sci. Total Environ. 2020, 738, 139405. [Google Scholar] [CrossRef]
- Carlson, G.; Carnes, L.K.; Cook, J.P. Exploring Arizona earth fissures: An anthropogenic geologic hazard. GSA Annu. Meet. Phoenix Ariz. 2019, 55, 115–126. [Google Scholar] [CrossRef]
- Hu, X.; Li, X. Information extraction of subsided cultivated land in high-groundwater-level coal mines based on unmanned aerial vehicle visible bands. Environ. Earth Sci. 2019, 78. [Google Scholar] [CrossRef]
- Hu, X.; Li, X.; Min, X.; Niu, B. Optimal scale extraction of farmland in coal mining areas with high groundwater levels based on visible light images from an unmanned aerial vehicle (UAV). Earth Sci. Inform. 2020, 13, 1151–1162. [Google Scholar] [CrossRef]
- Commission Implementing Regulation (EU) 2019/947 of 24 May 2019 on the Rules and Procedures for the Operation of Unmanned Aircraft. Available online: http://data.europa.eu/eli/reg_impl/2019/947/oj (accessed on 30 November 2020).


| UAS and Sensor-Related Terms | Hydrology-Related Terms | ||
|---|---|---|---|
| Drone LiDAR Remote sensing RPAS UAS UAV Unmanned Aerial System Unmanned Aerial Vehicle Structure from Motion RGB | Photogrammetry Multispectral Hyperspectral Thermal infrared | Algal bloom Aquifer Bathymetry Flooding Freshwater Groundwater Hydrology Morphology River River discharge Riverine plastic Runoff | Submarine groundwater discharge Subsidence Surface velocity Surface-Groundwater interaction Thermal plume Thermal structure Water budget Water level Water pollution Water sampling Water storage Water table Wetland |
| Main Features | Multi-Rotor | Fixed-Wing | Transitional | Other (Balloons, Kites and Blimp) |
|---|---|---|---|---|
| Diameter or wing-span | 35–150 cm | 100–200 cm | 100–200 cm | Up to 5 m |
| Flight time | 15–50 min | 25–75 min | 25–90 min | Hours |
| Payload Capability | 1–2.5 kg | 1–2 kg | 1–2 kg | >2.5 kg |
| Maneuverability | High | Medium | Medium-high | Low |
| Wind resistivity | 10–15 m/s | 8–20m/s | 12 m/s | Highly variable |
| Ability to fly under windy conditions | Medium | Medium-high | Medium-high | Low |
| Spatial coverage in a single flight | 20–40 ha | 80–320 ha | 80–320 ha | Variable |
| Expertise required | Low | Medium | High | Low |
| Take-off and landing capability | Vertical take-off and landing (VTOL) | Launch line, catapult, or hand launch; open area for landing or parachute | Vertical take-off and landing (VTOL) | Vertical take-off and landing (VTOL) |
| Velocity or thrust failure | Crash | Glide capability, controlled crash, or parachute | Glide capability, controlled crash, or parachute | Variable |
| Ability to carry sampling devices | Yes | No | No | No |
| Bathymetry | Water Level | Surface Velocity/Discharge | Flood Monitoring | TermperaTure Mapping | Water Contamination | HABs | Water Sampling | Sum | |
|---|---|---|---|---|---|---|---|---|---|
| Fixed-wing | 1 | 1 | 0 | 10 | 2 | 0 | 2 | 0 | 16 |
| Rotary-wing | 17 | 9 | 12 | 6 | 6 | 5 | 8 | 14 | 77 |
| Both | 0 | 0 | 0 | 2 | 0 | 0 | 2 | 0 | 4 |
| Other | 1 | 0 | 0 | 0 | 0 | 0 | 0 | 0 | 1 |
| SW–GW Interactions | SGD | Water Table Definition | Subsidence | Sum | |
|---|---|---|---|---|---|
| Fixed-wing | 1 | 0 | 1 | 0 | 2 |
| Rotary-wing | 4 | 2 | 3 | 3 | 12 |
| Both | 0 | 0 | 0 | 0 | 0 |
Publisher’s Note: MDPI stays neutral with regard to jurisdictional claims in published maps and institutional affiliations. |
© 2021 by the authors. Licensee MDPI, Basel, Switzerland. This article is an open access article distributed under the terms and conditions of the Creative Commons Attribution (CC BY) license (https://creativecommons.org/licenses/by/4.0/).
Share and Cite
Vélez-Nicolás, M.; García-López, S.; Barbero, L.; Ruiz-Ortiz, V.; Sánchez-Bellón, Á. Applications of Unmanned Aerial Systems (UASs) in Hydrology: A Review. Remote Sens. 2021, 13, 1359. https://doi.org/10.3390/rs13071359
Vélez-Nicolás M, García-López S, Barbero L, Ruiz-Ortiz V, Sánchez-Bellón Á. Applications of Unmanned Aerial Systems (UASs) in Hydrology: A Review. Remote Sensing. 2021; 13(7):1359. https://doi.org/10.3390/rs13071359
Chicago/Turabian StyleVélez-Nicolás, Mercedes, Santiago García-López, Luis Barbero, Verónica Ruiz-Ortiz, and Ángel Sánchez-Bellón. 2021. "Applications of Unmanned Aerial Systems (UASs) in Hydrology: A Review" Remote Sensing 13, no. 7: 1359. https://doi.org/10.3390/rs13071359
APA StyleVélez-Nicolás, M., García-López, S., Barbero, L., Ruiz-Ortiz, V., & Sánchez-Bellón, Á. (2021). Applications of Unmanned Aerial Systems (UASs) in Hydrology: A Review. Remote Sensing, 13(7), 1359. https://doi.org/10.3390/rs13071359