
A UAV Open Dataset of Rice Paddies for Deep Learning Practice

 ,
,  ,
,
Abstract
1. Introduction
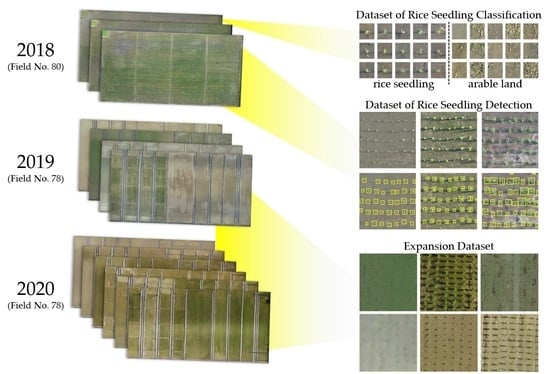
2. Dataset Description
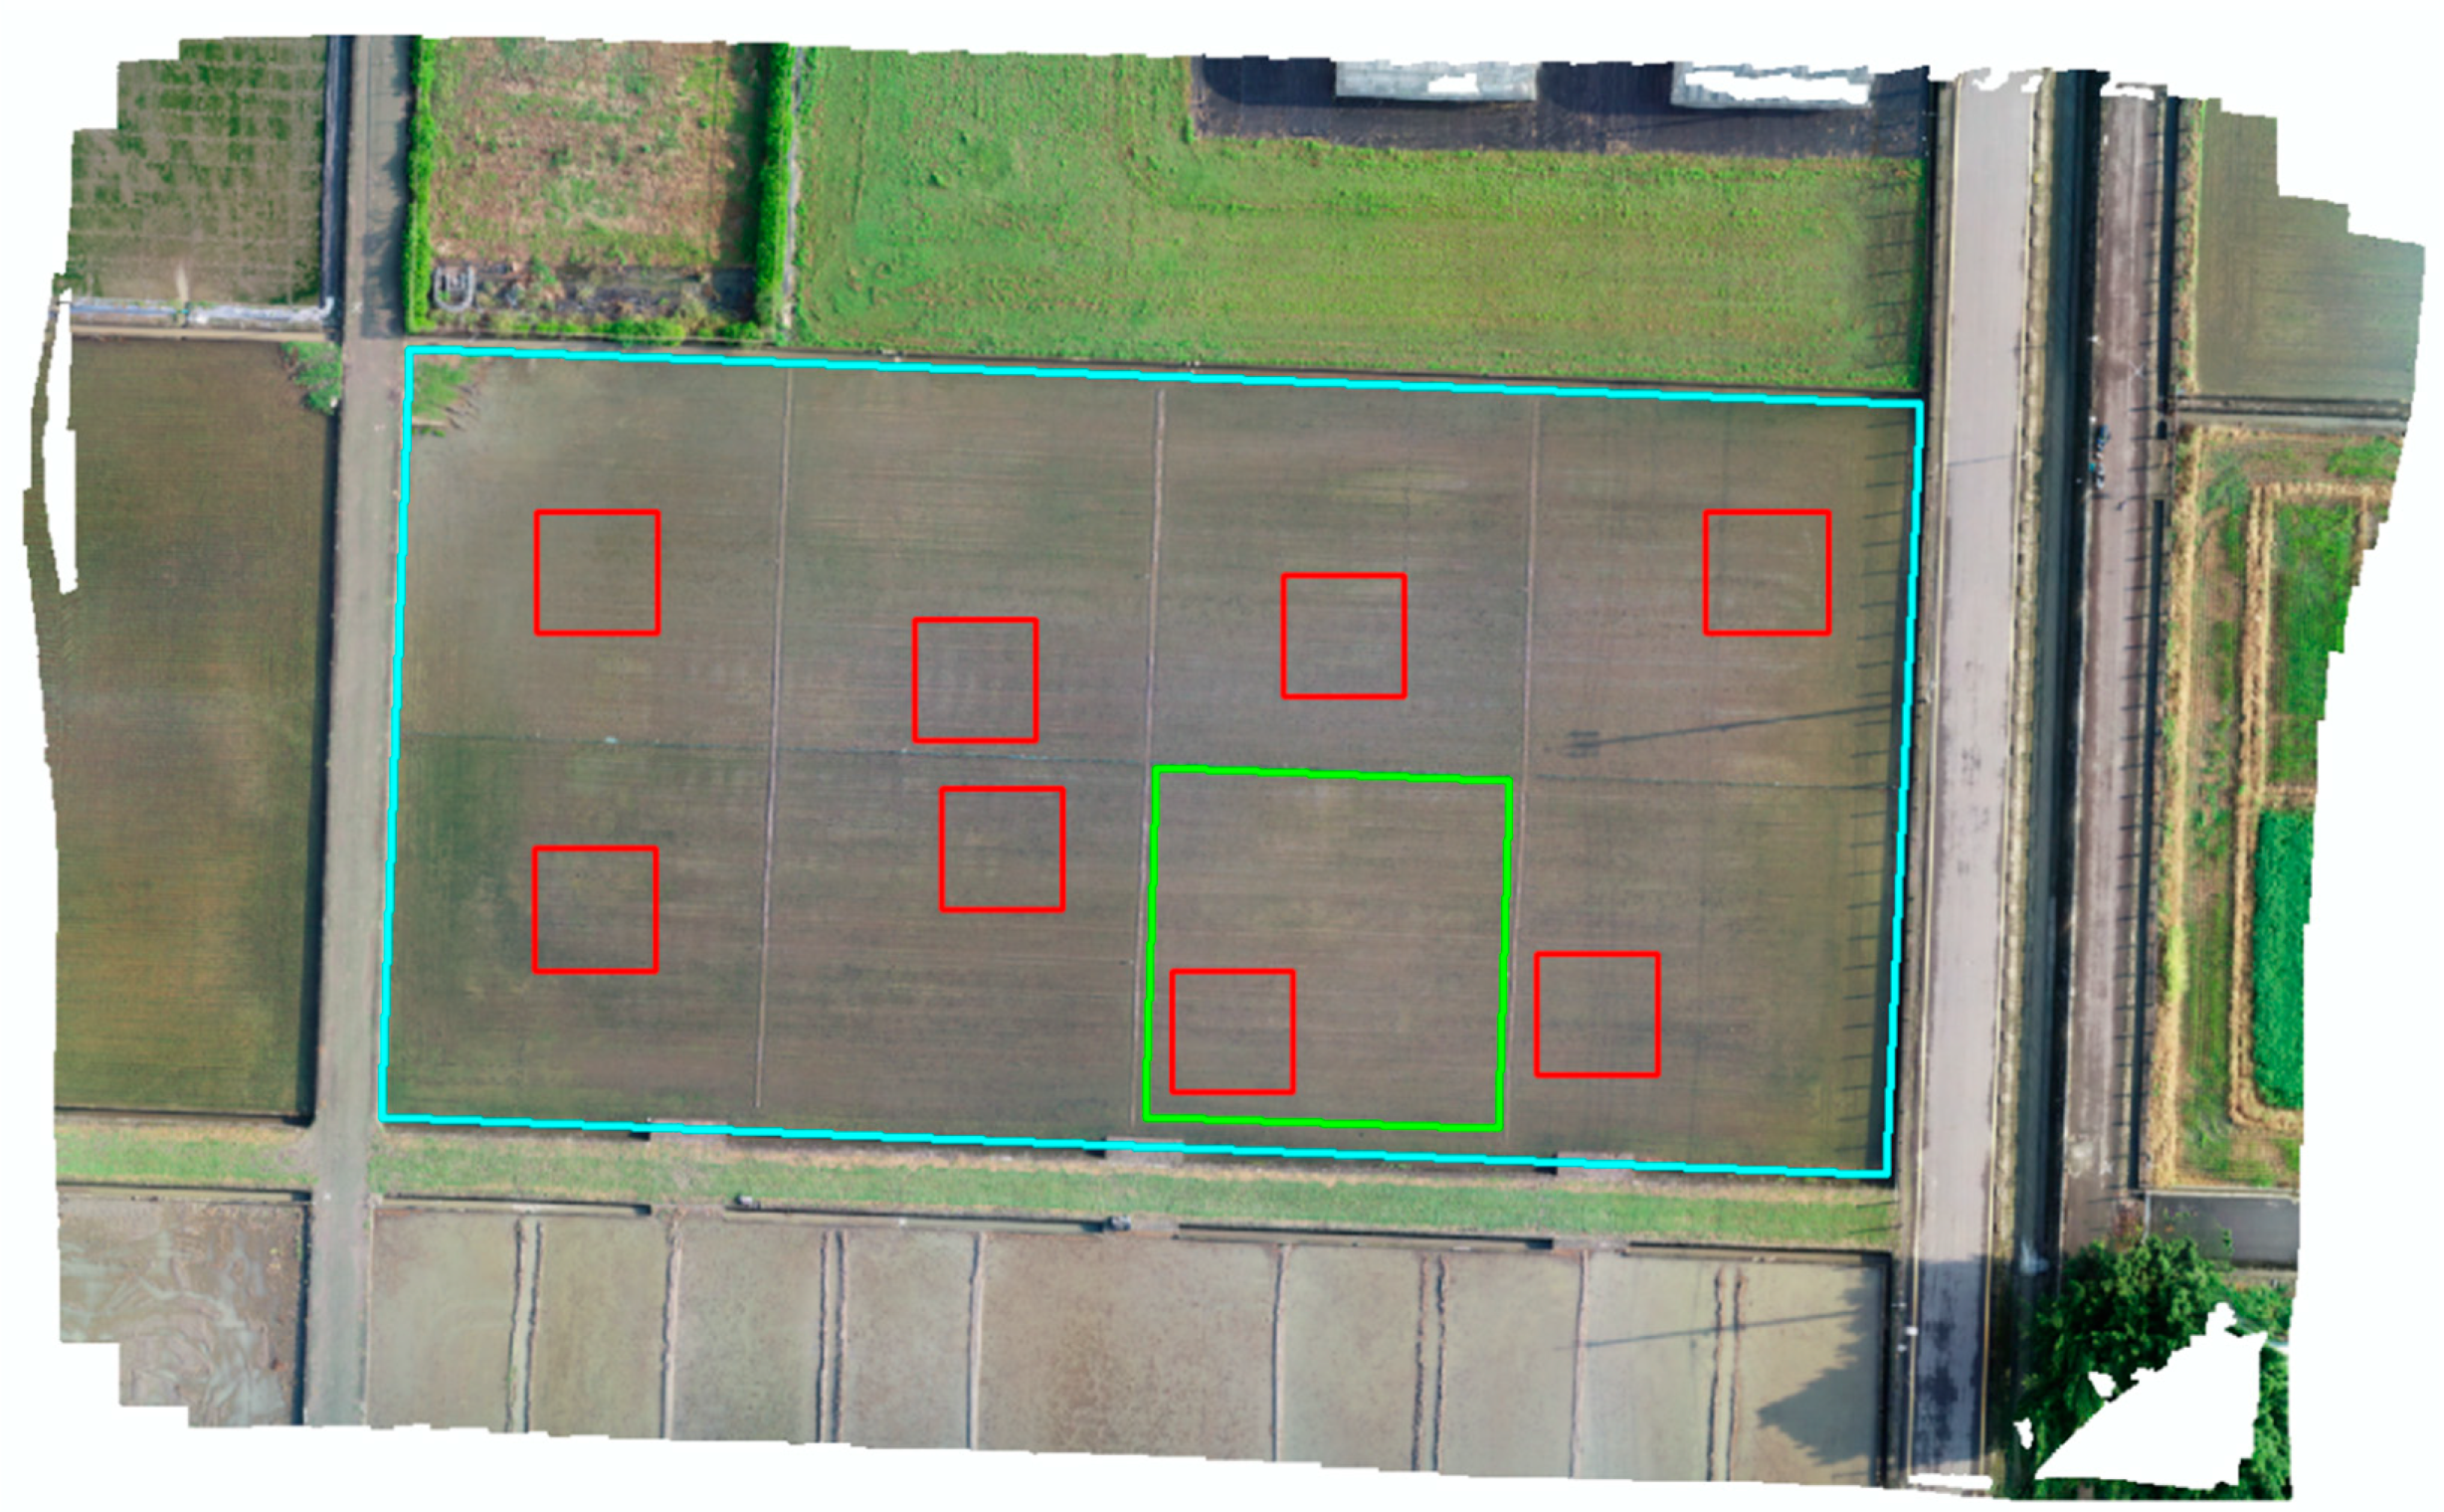
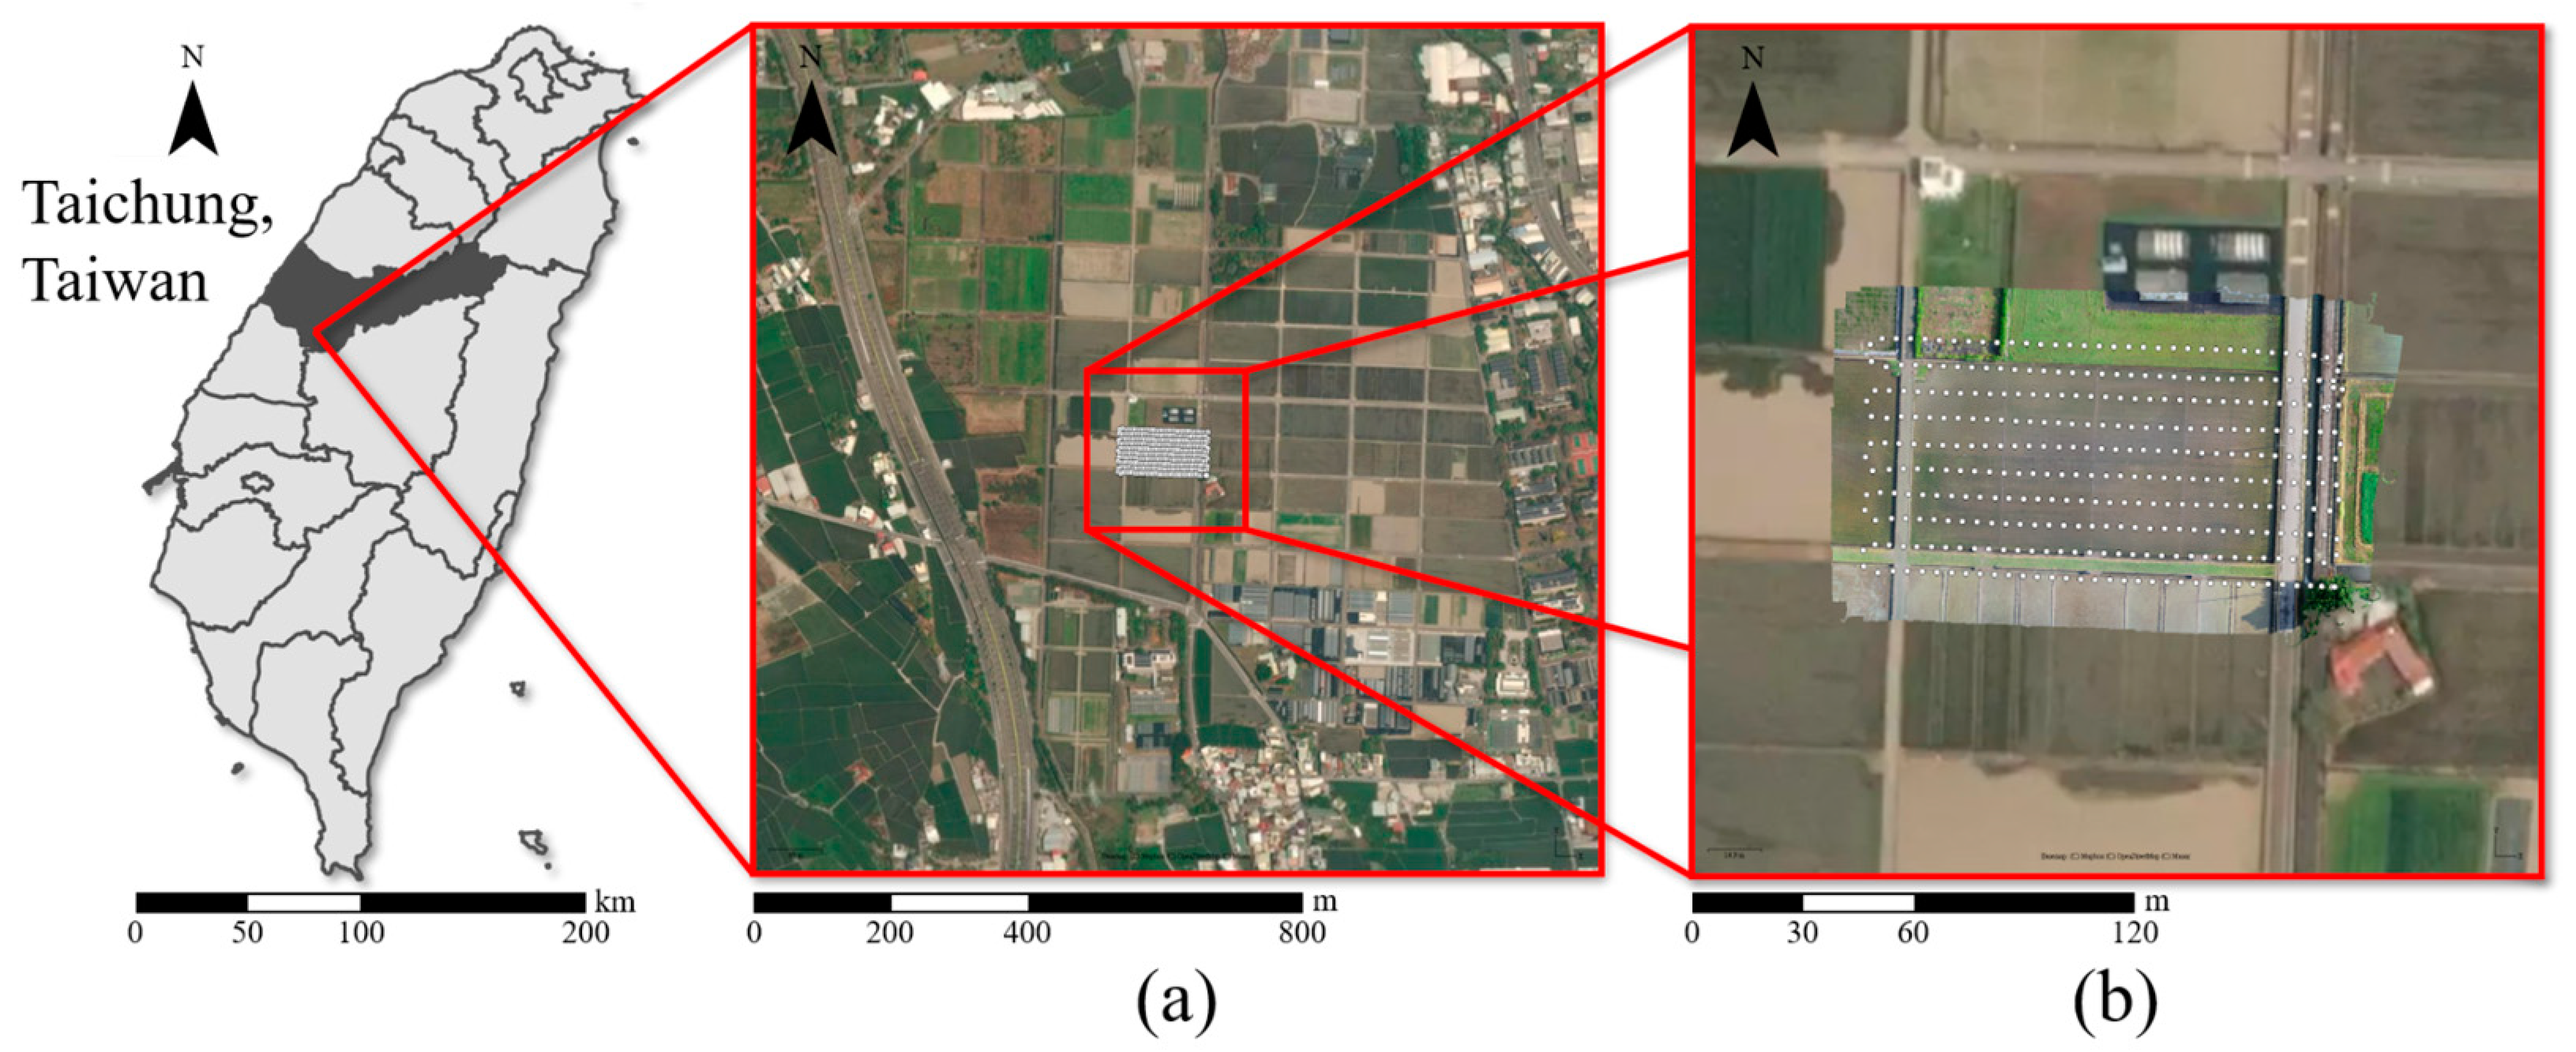
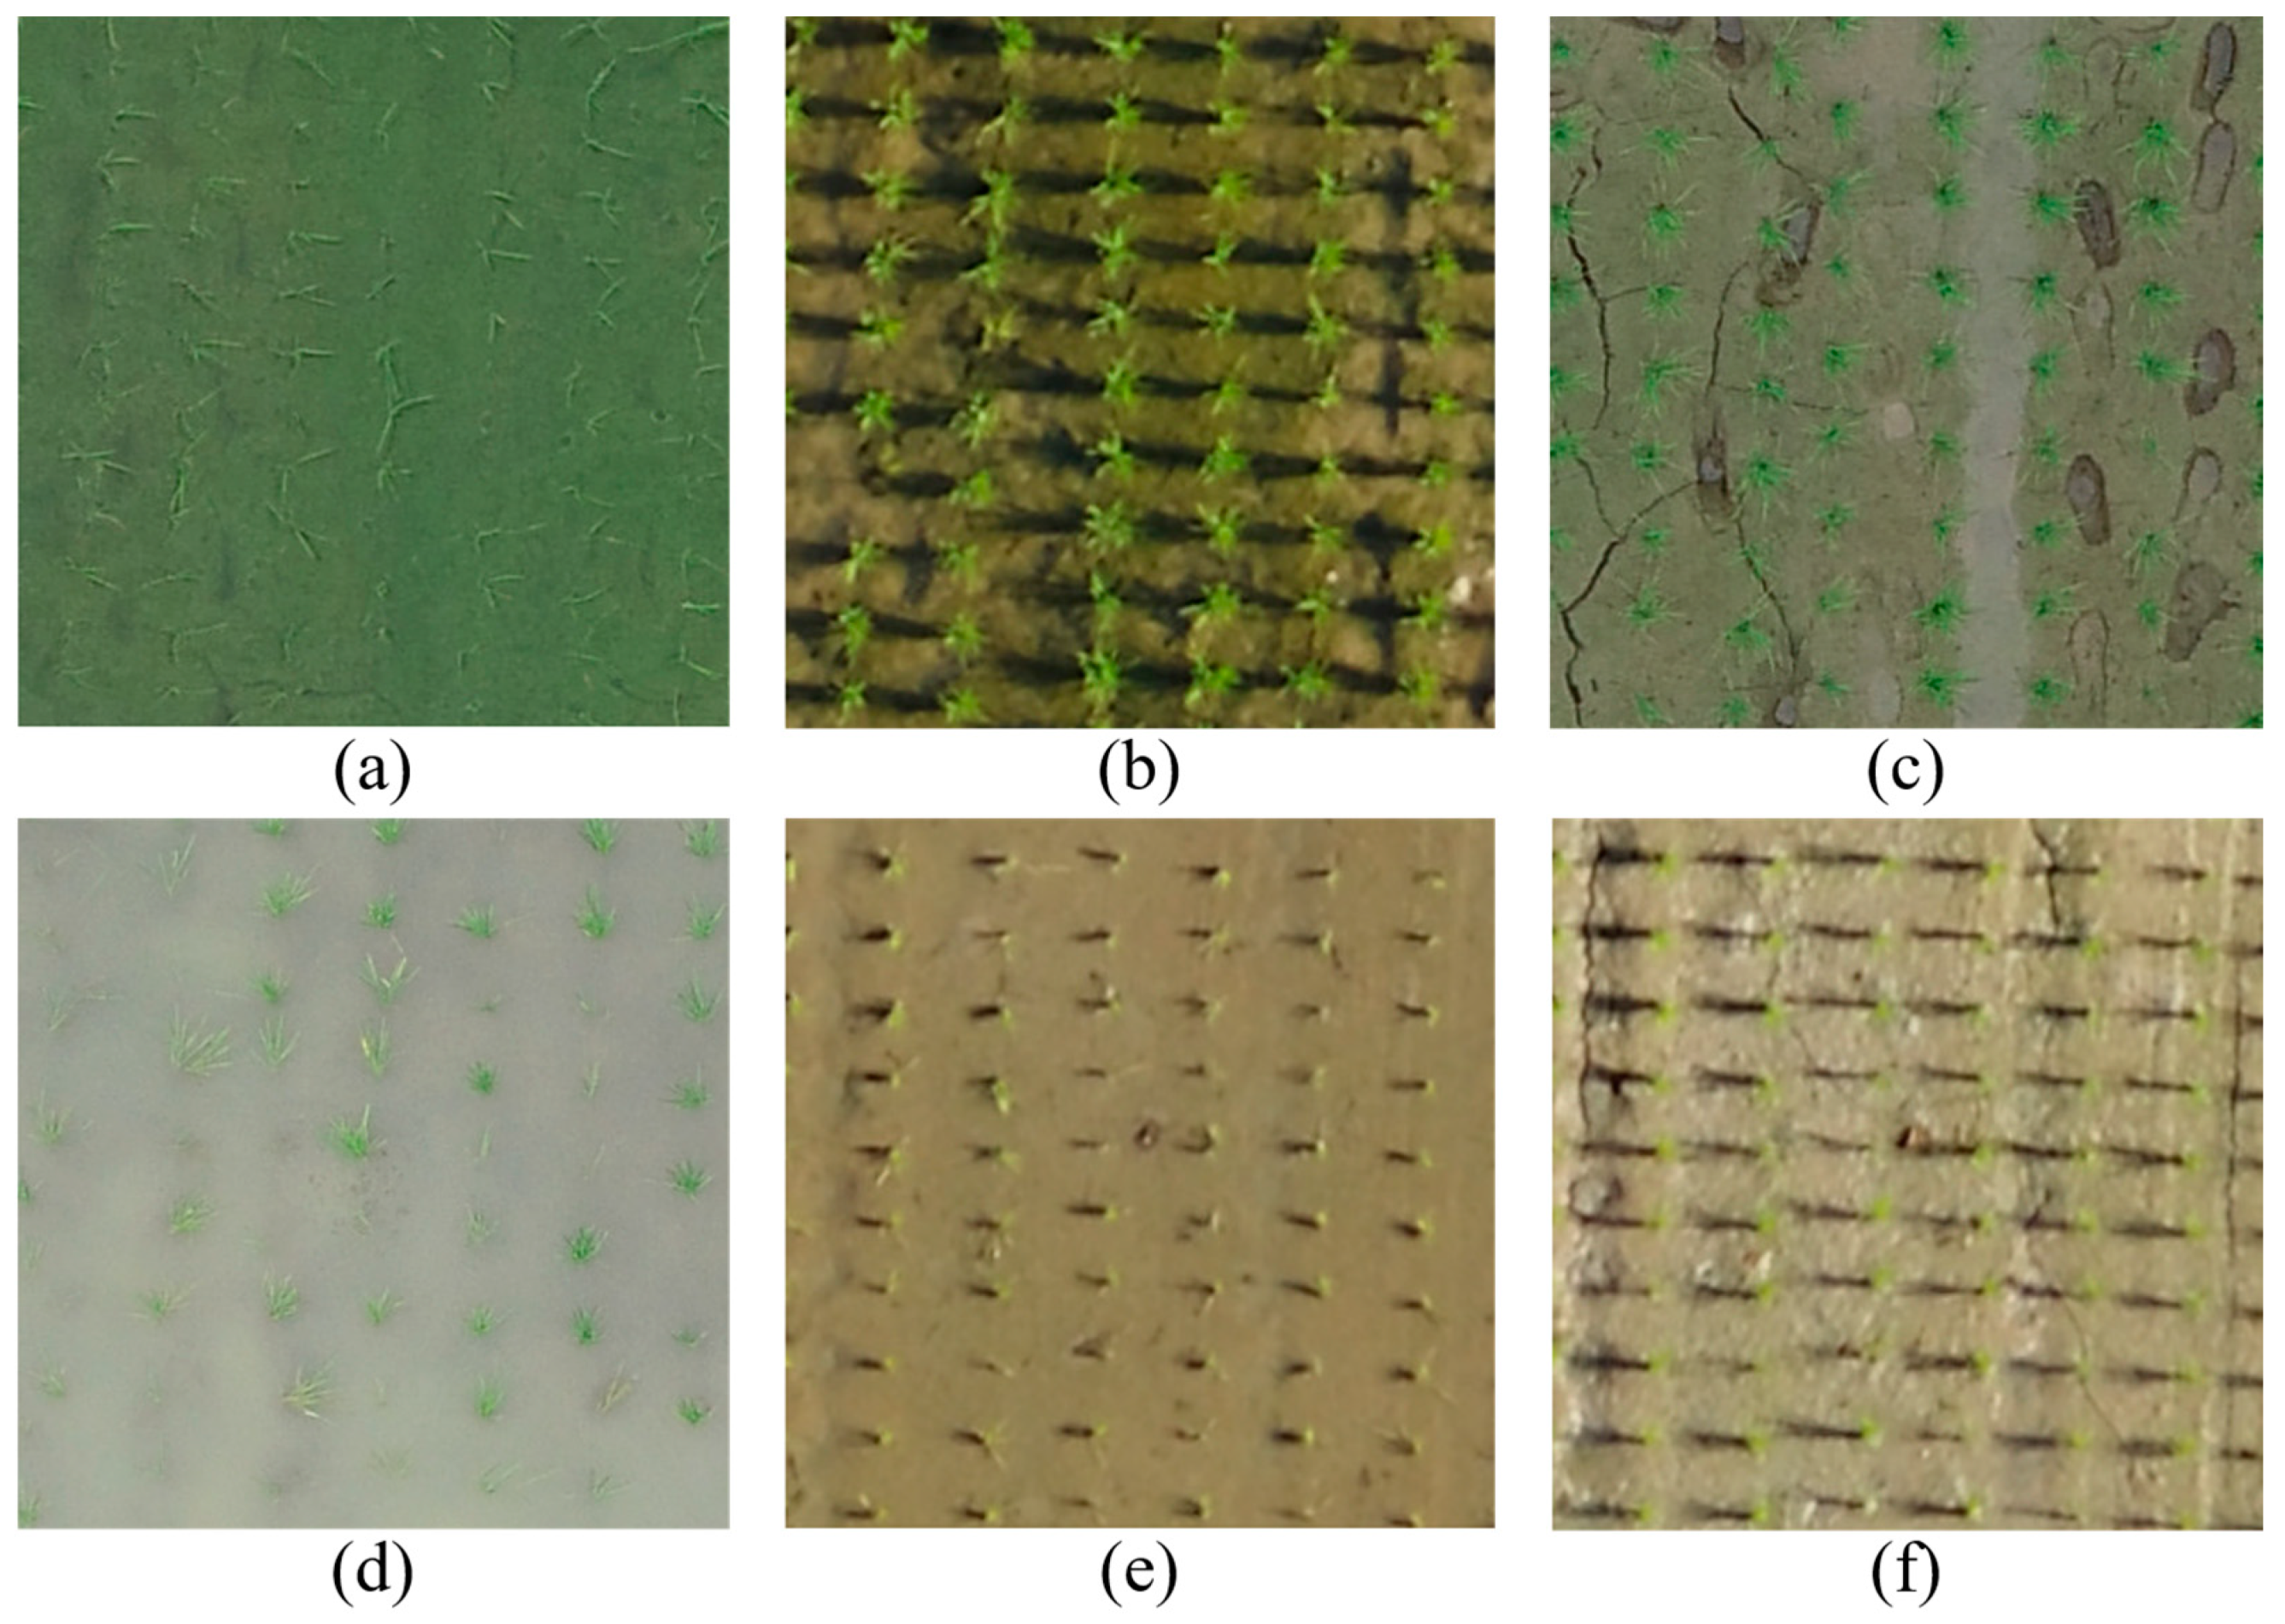
2.1. Data Introduction
2.2. Training-Validation Dataset
2.3. Expansion Dataset
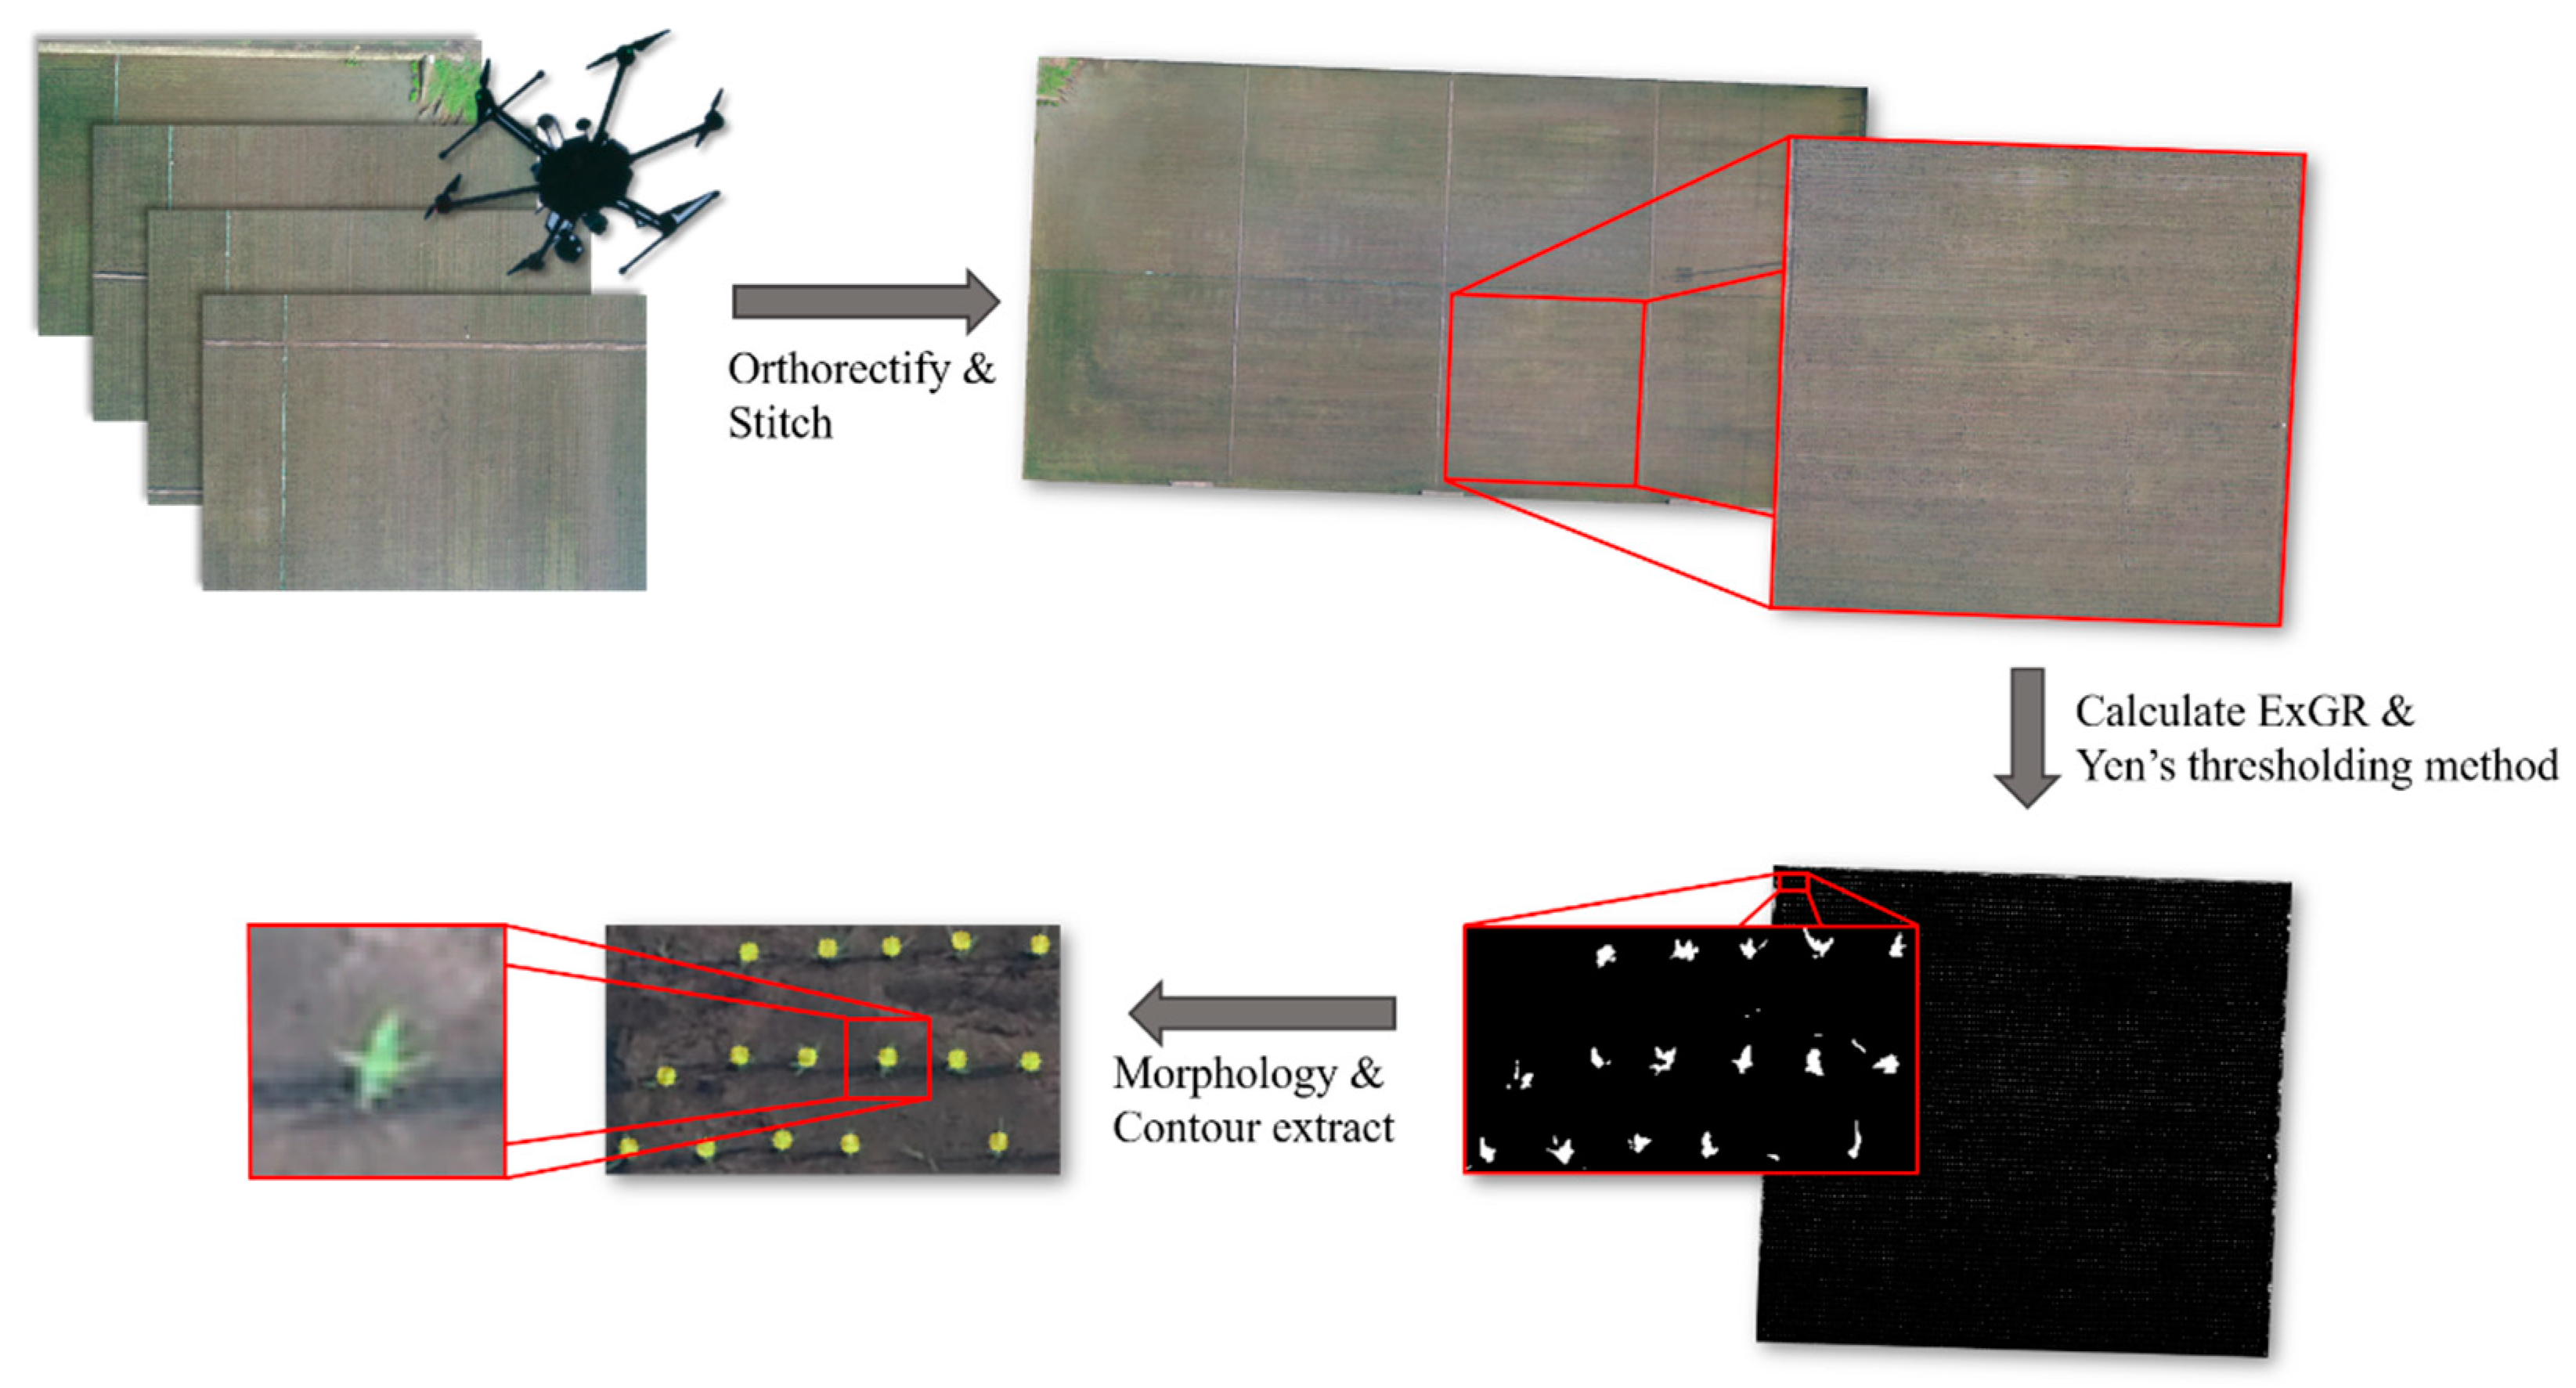
2.4. Data Preprocessing
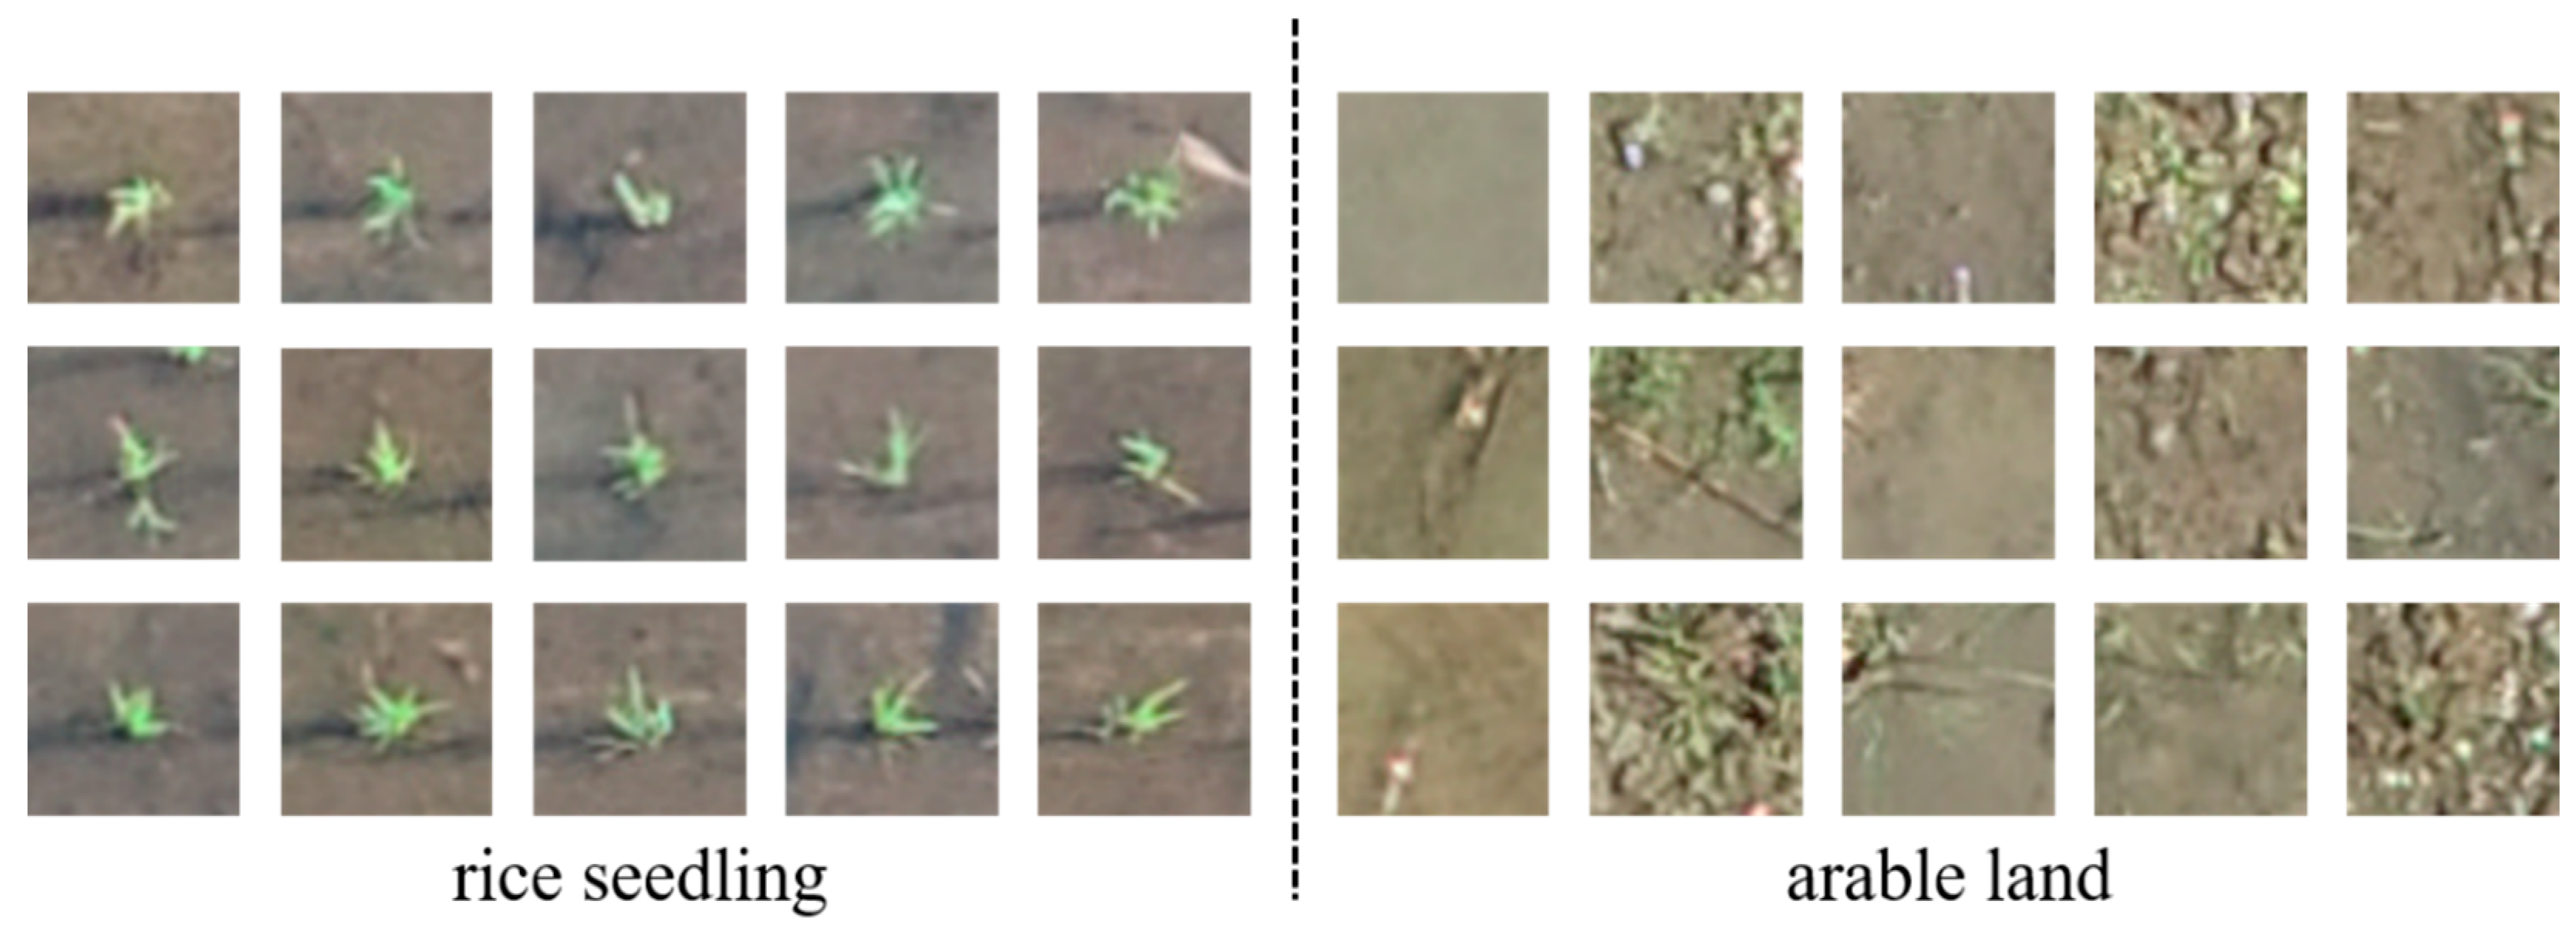
2.5. UAV Dataset of Rice Seedling Classification
2.6. UAV Dataset of Rice Seedling Detection
3. Data Application
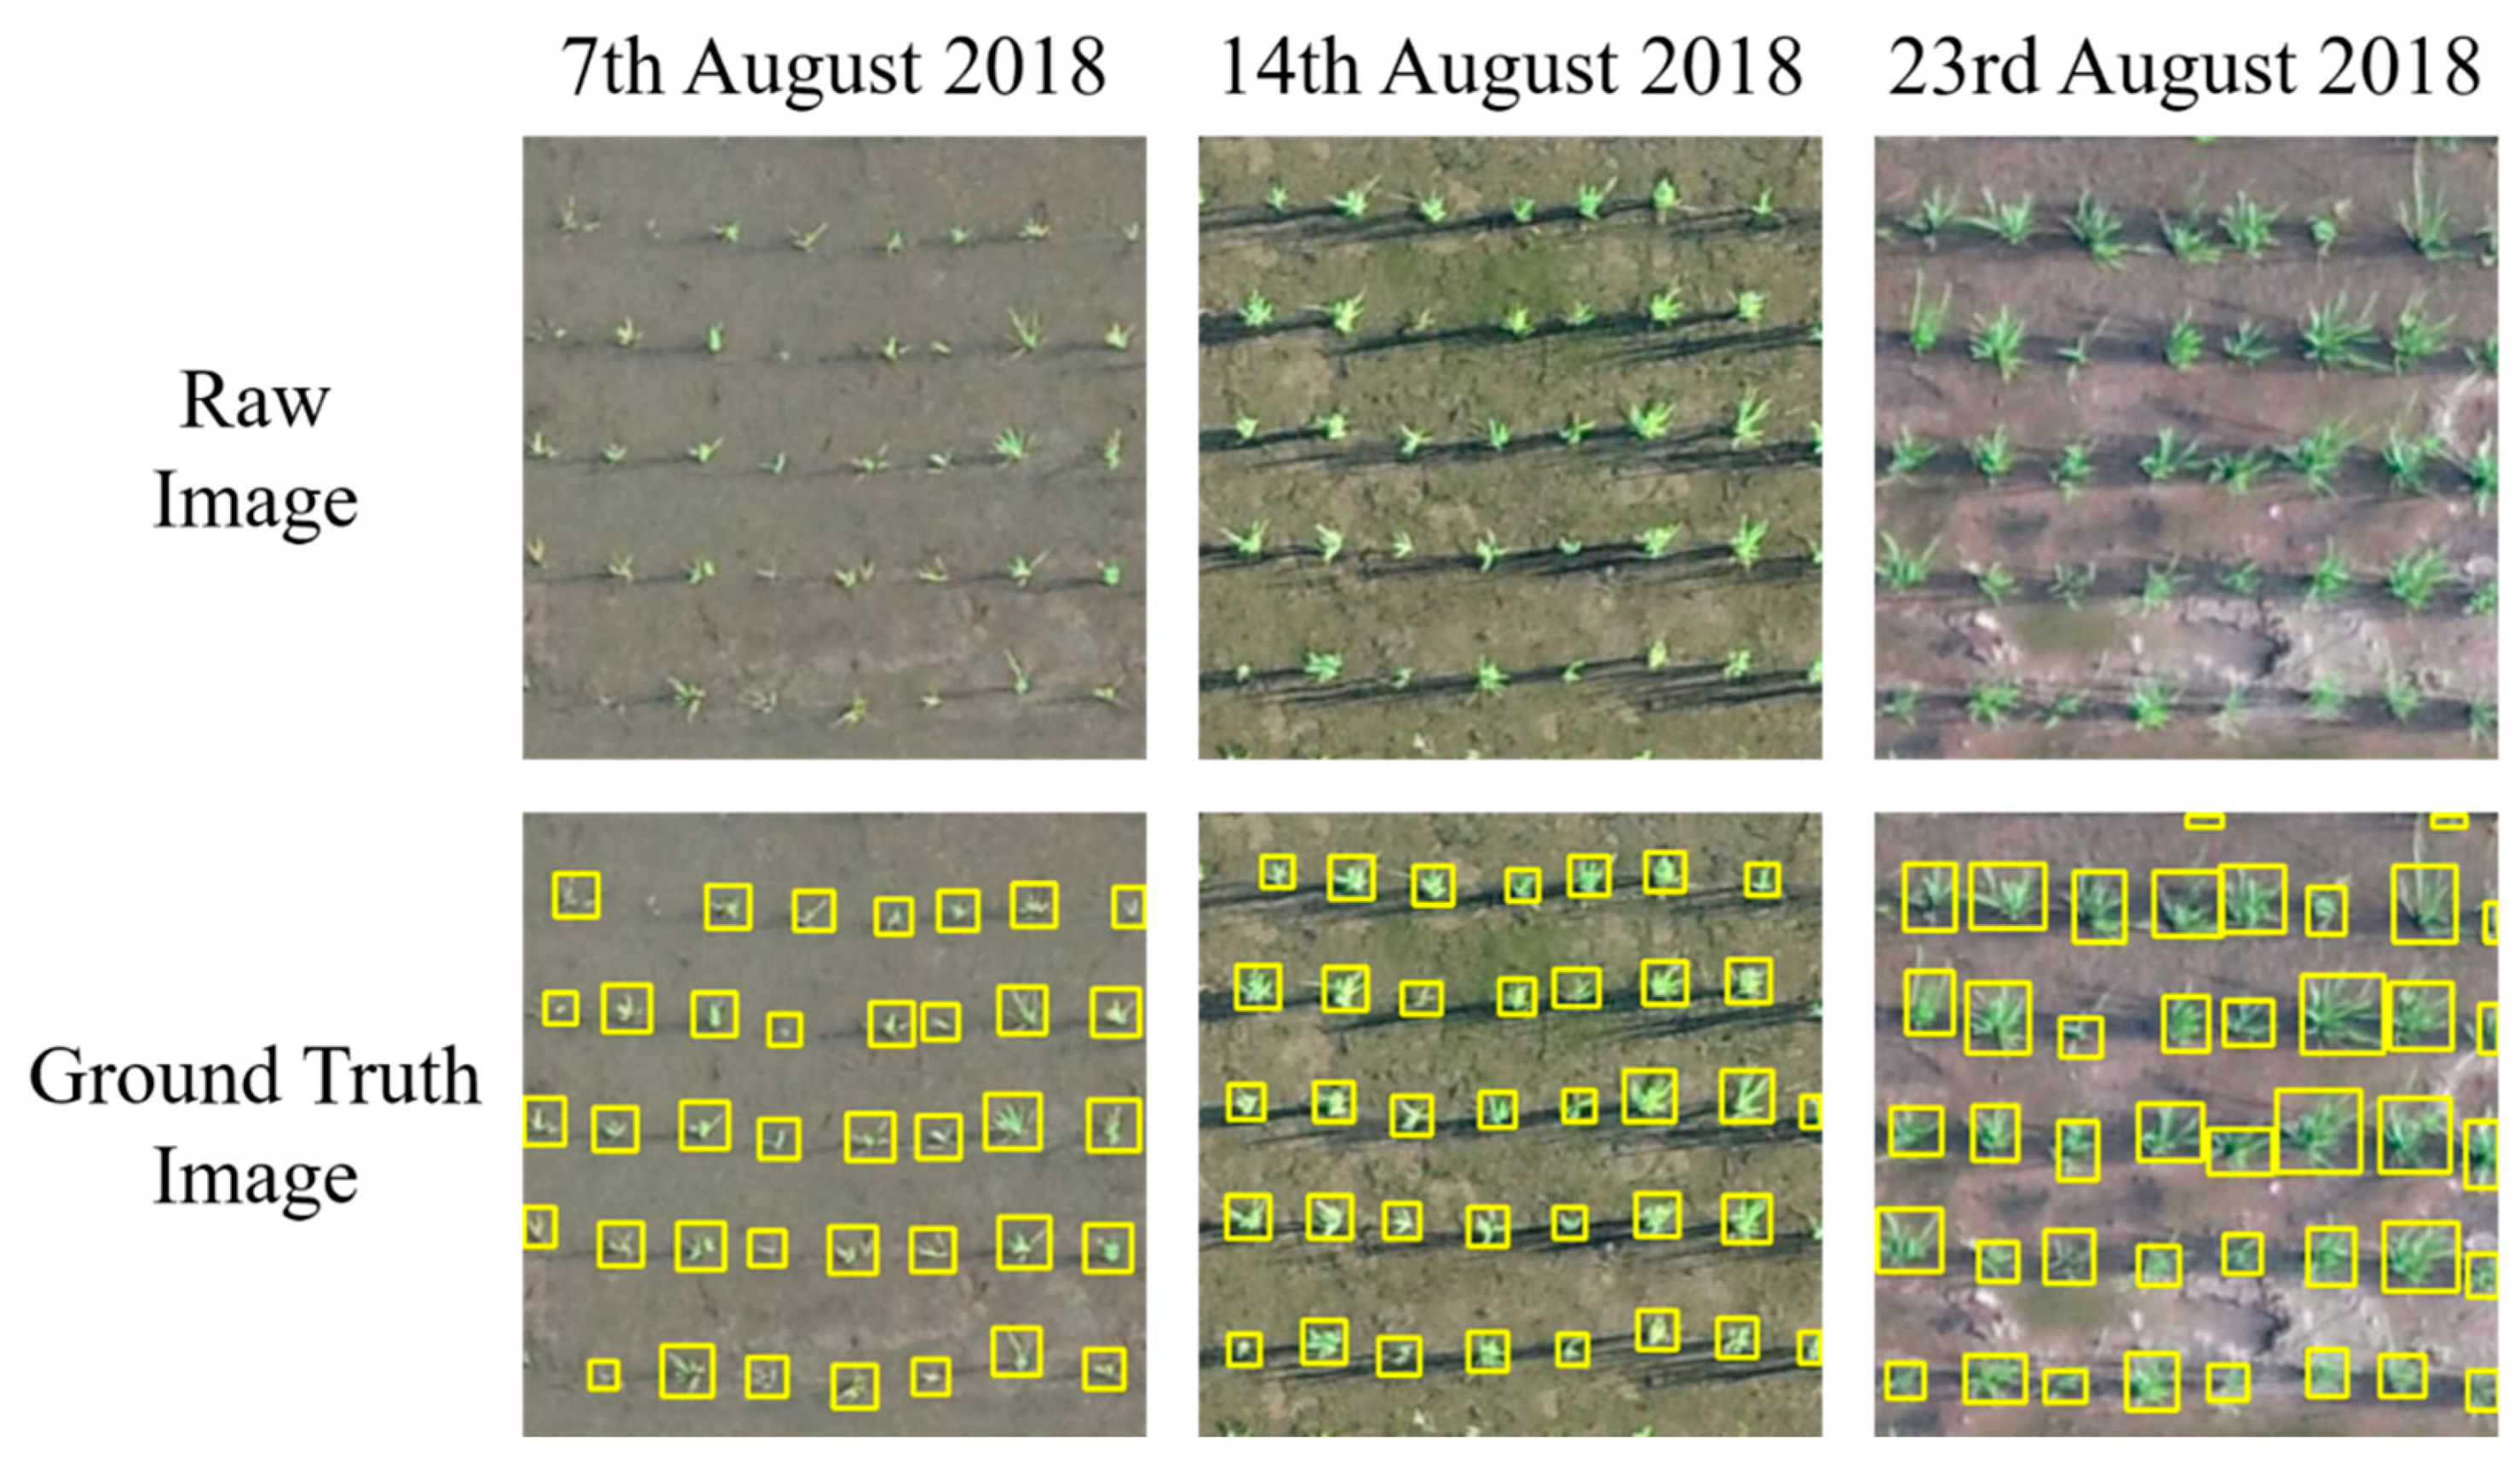
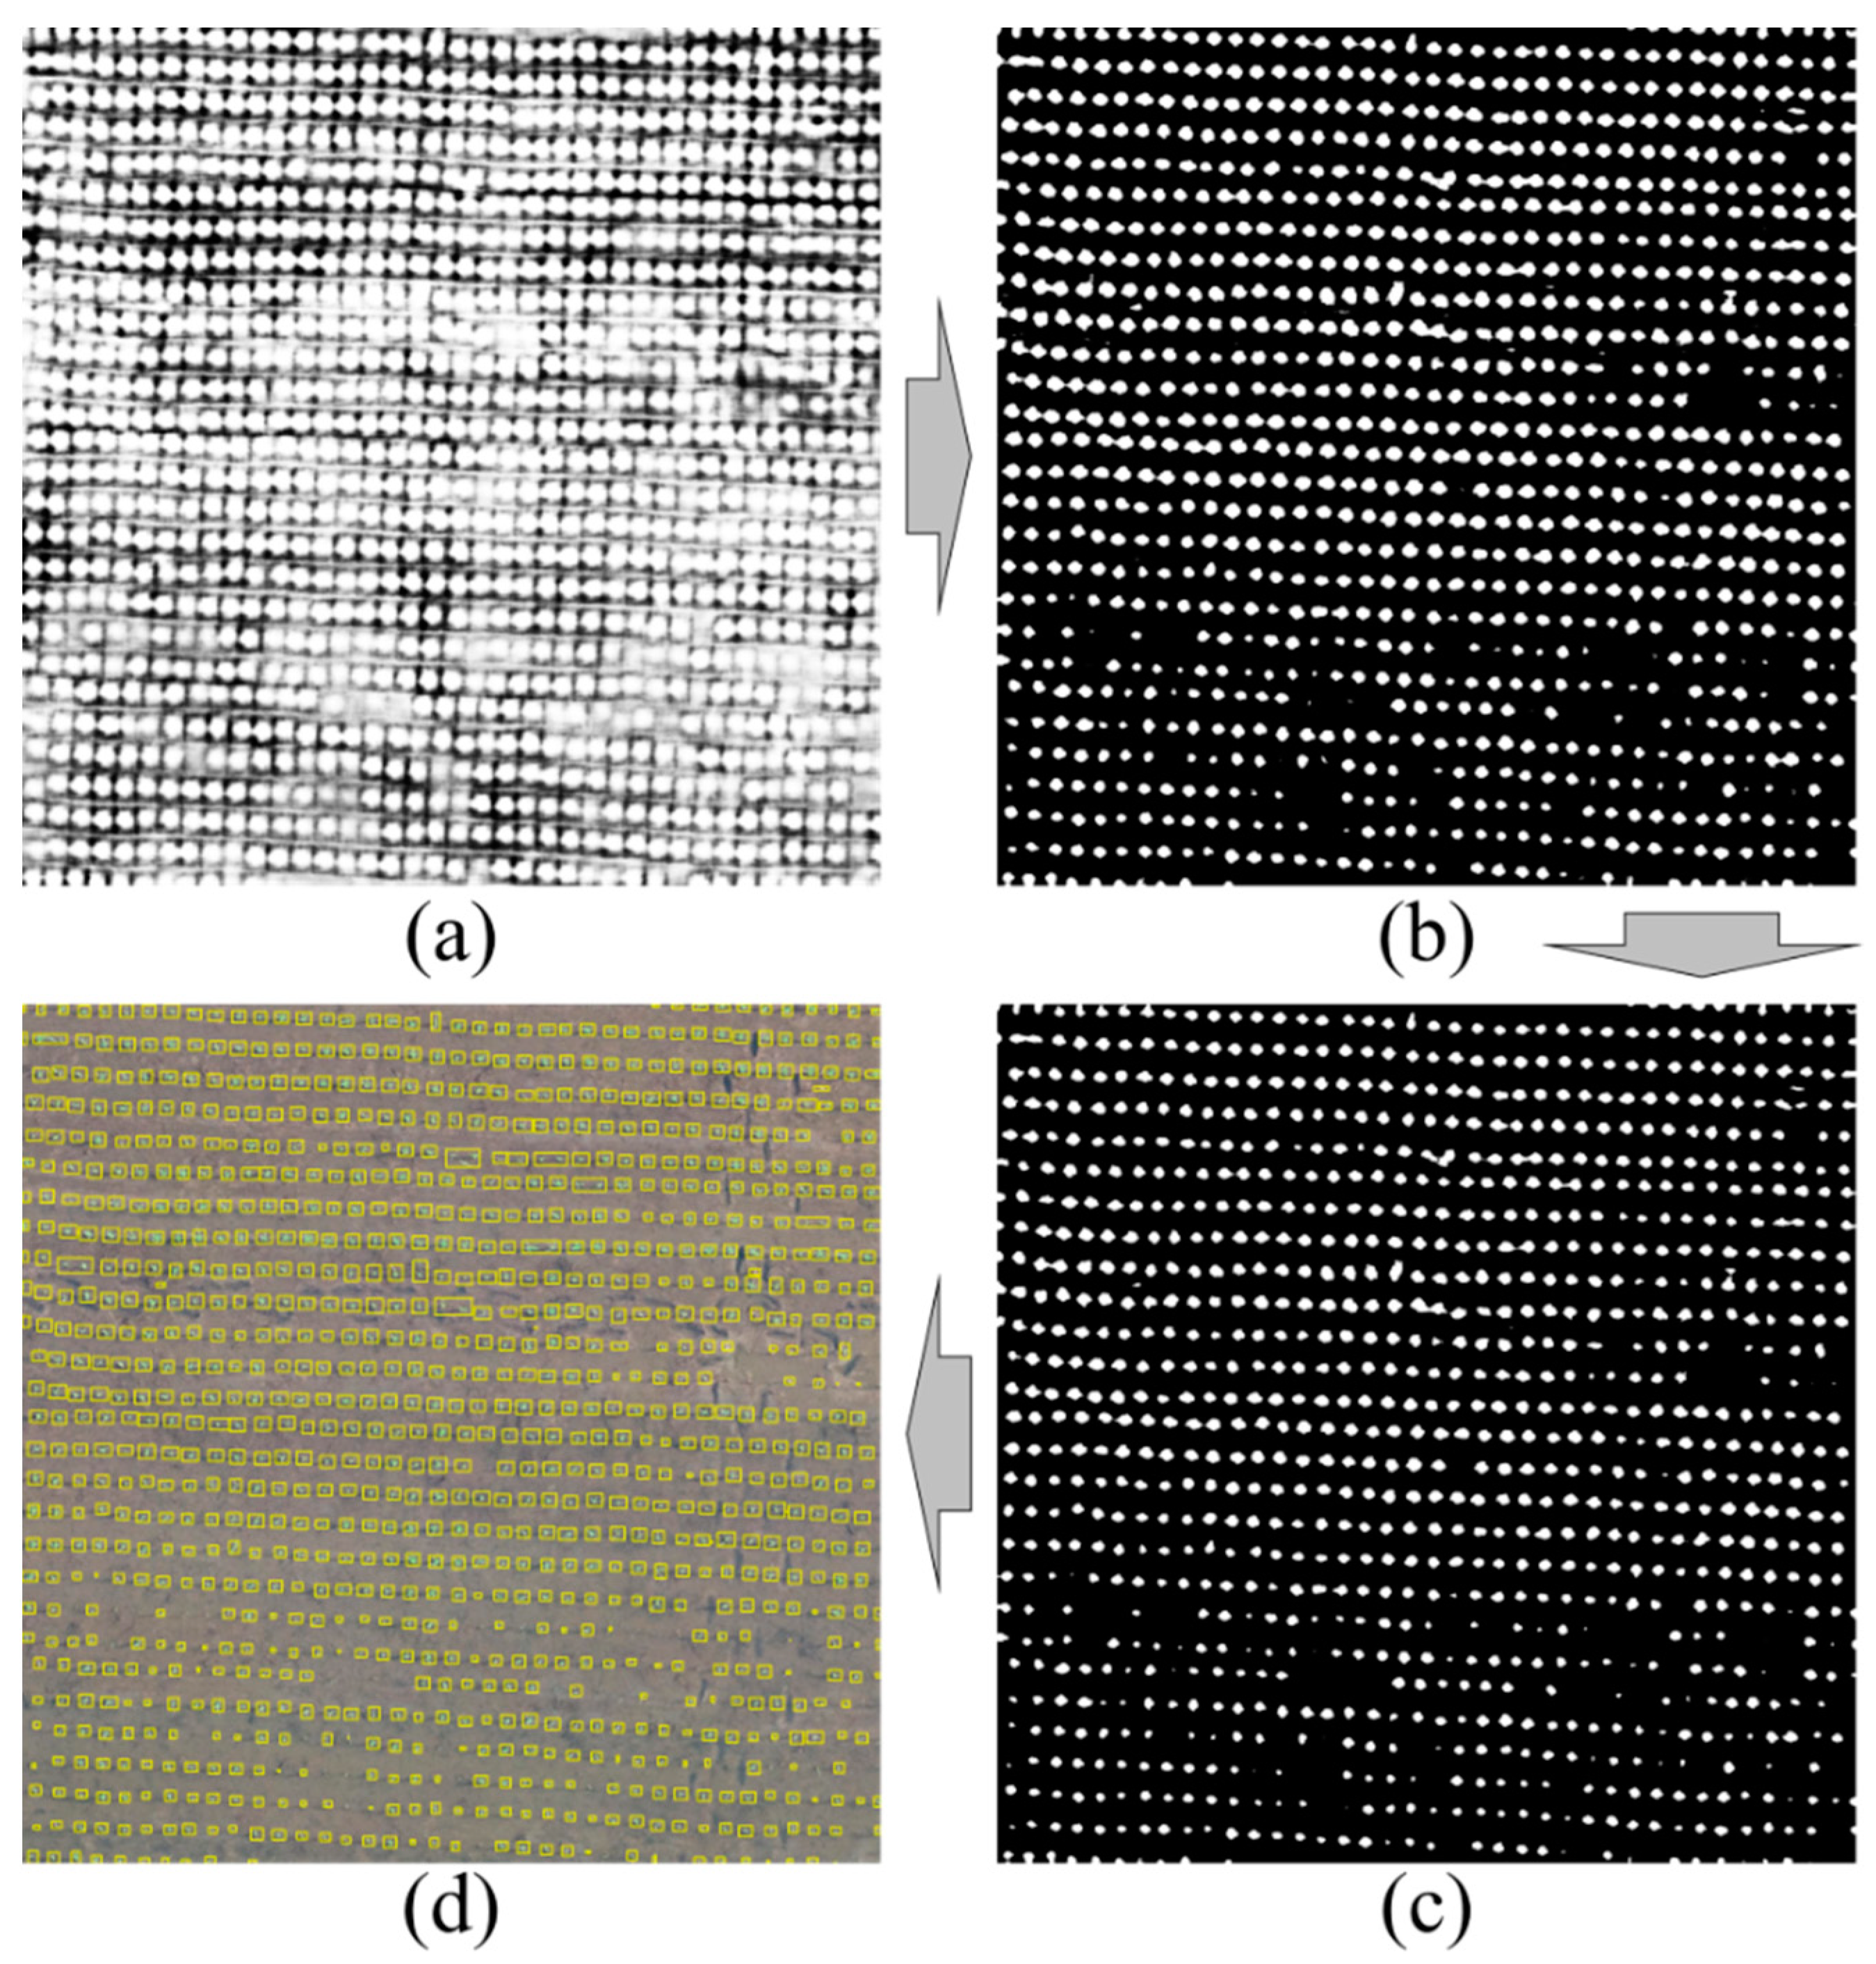
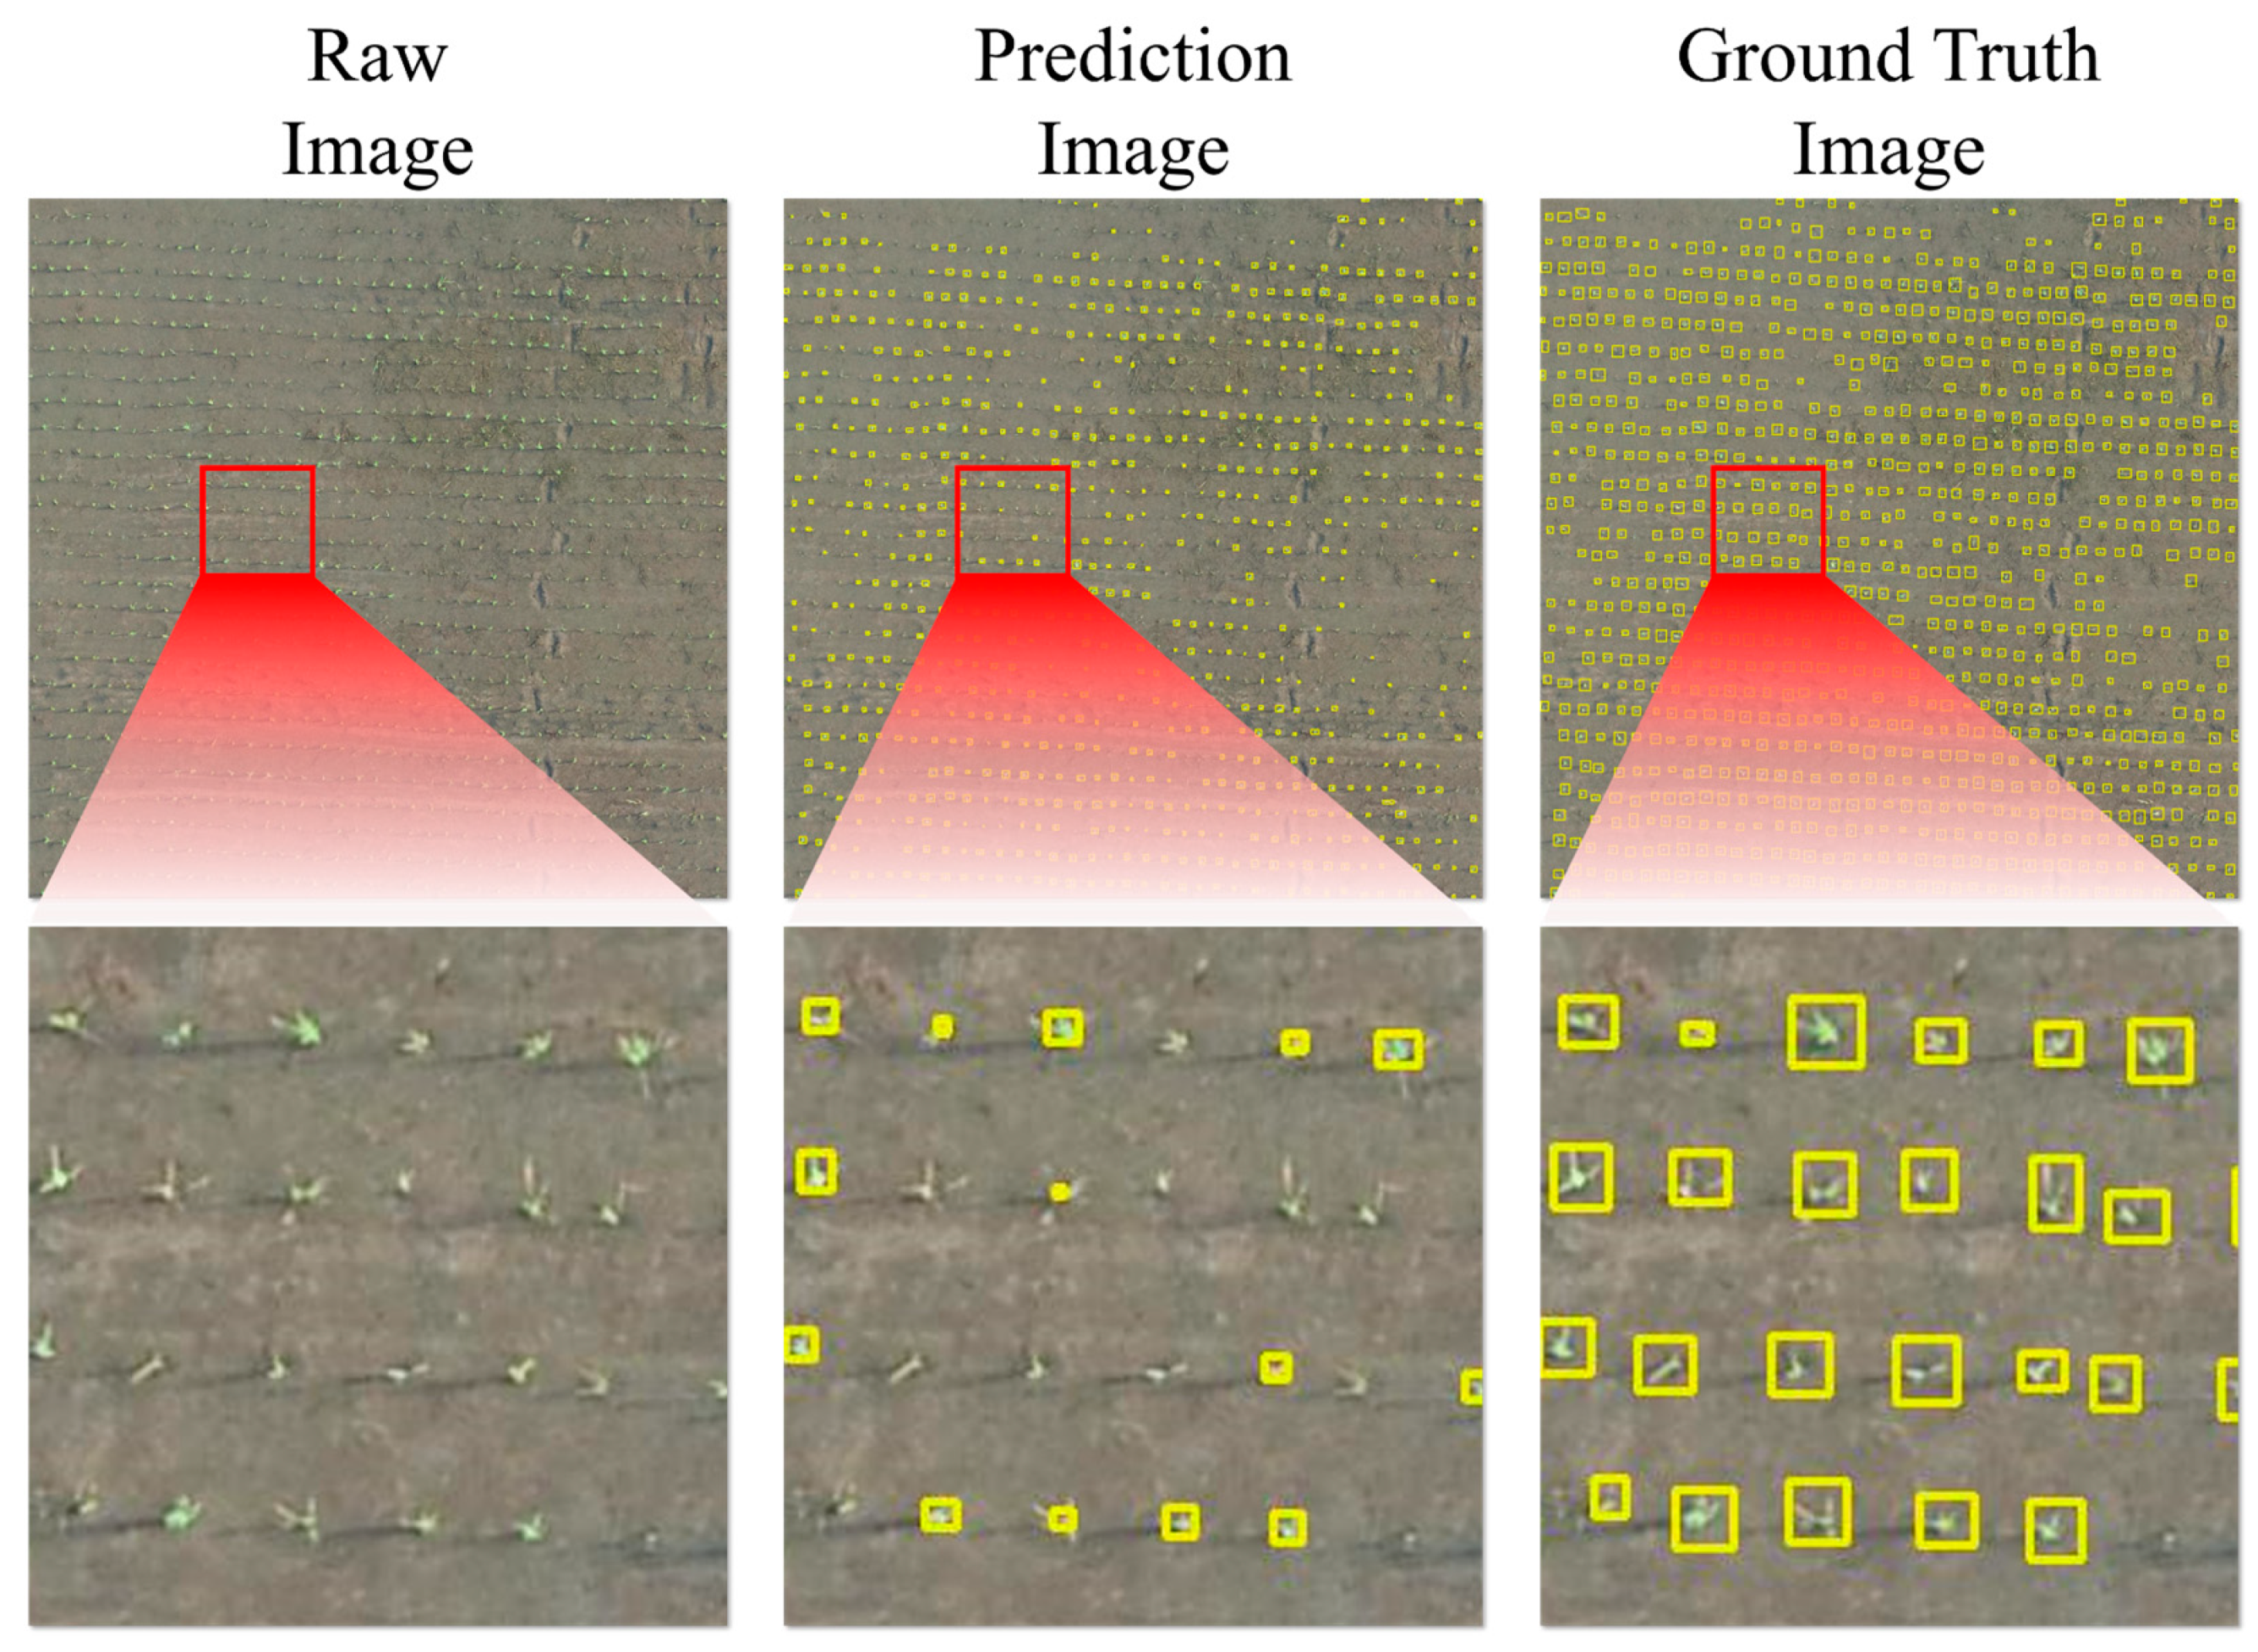
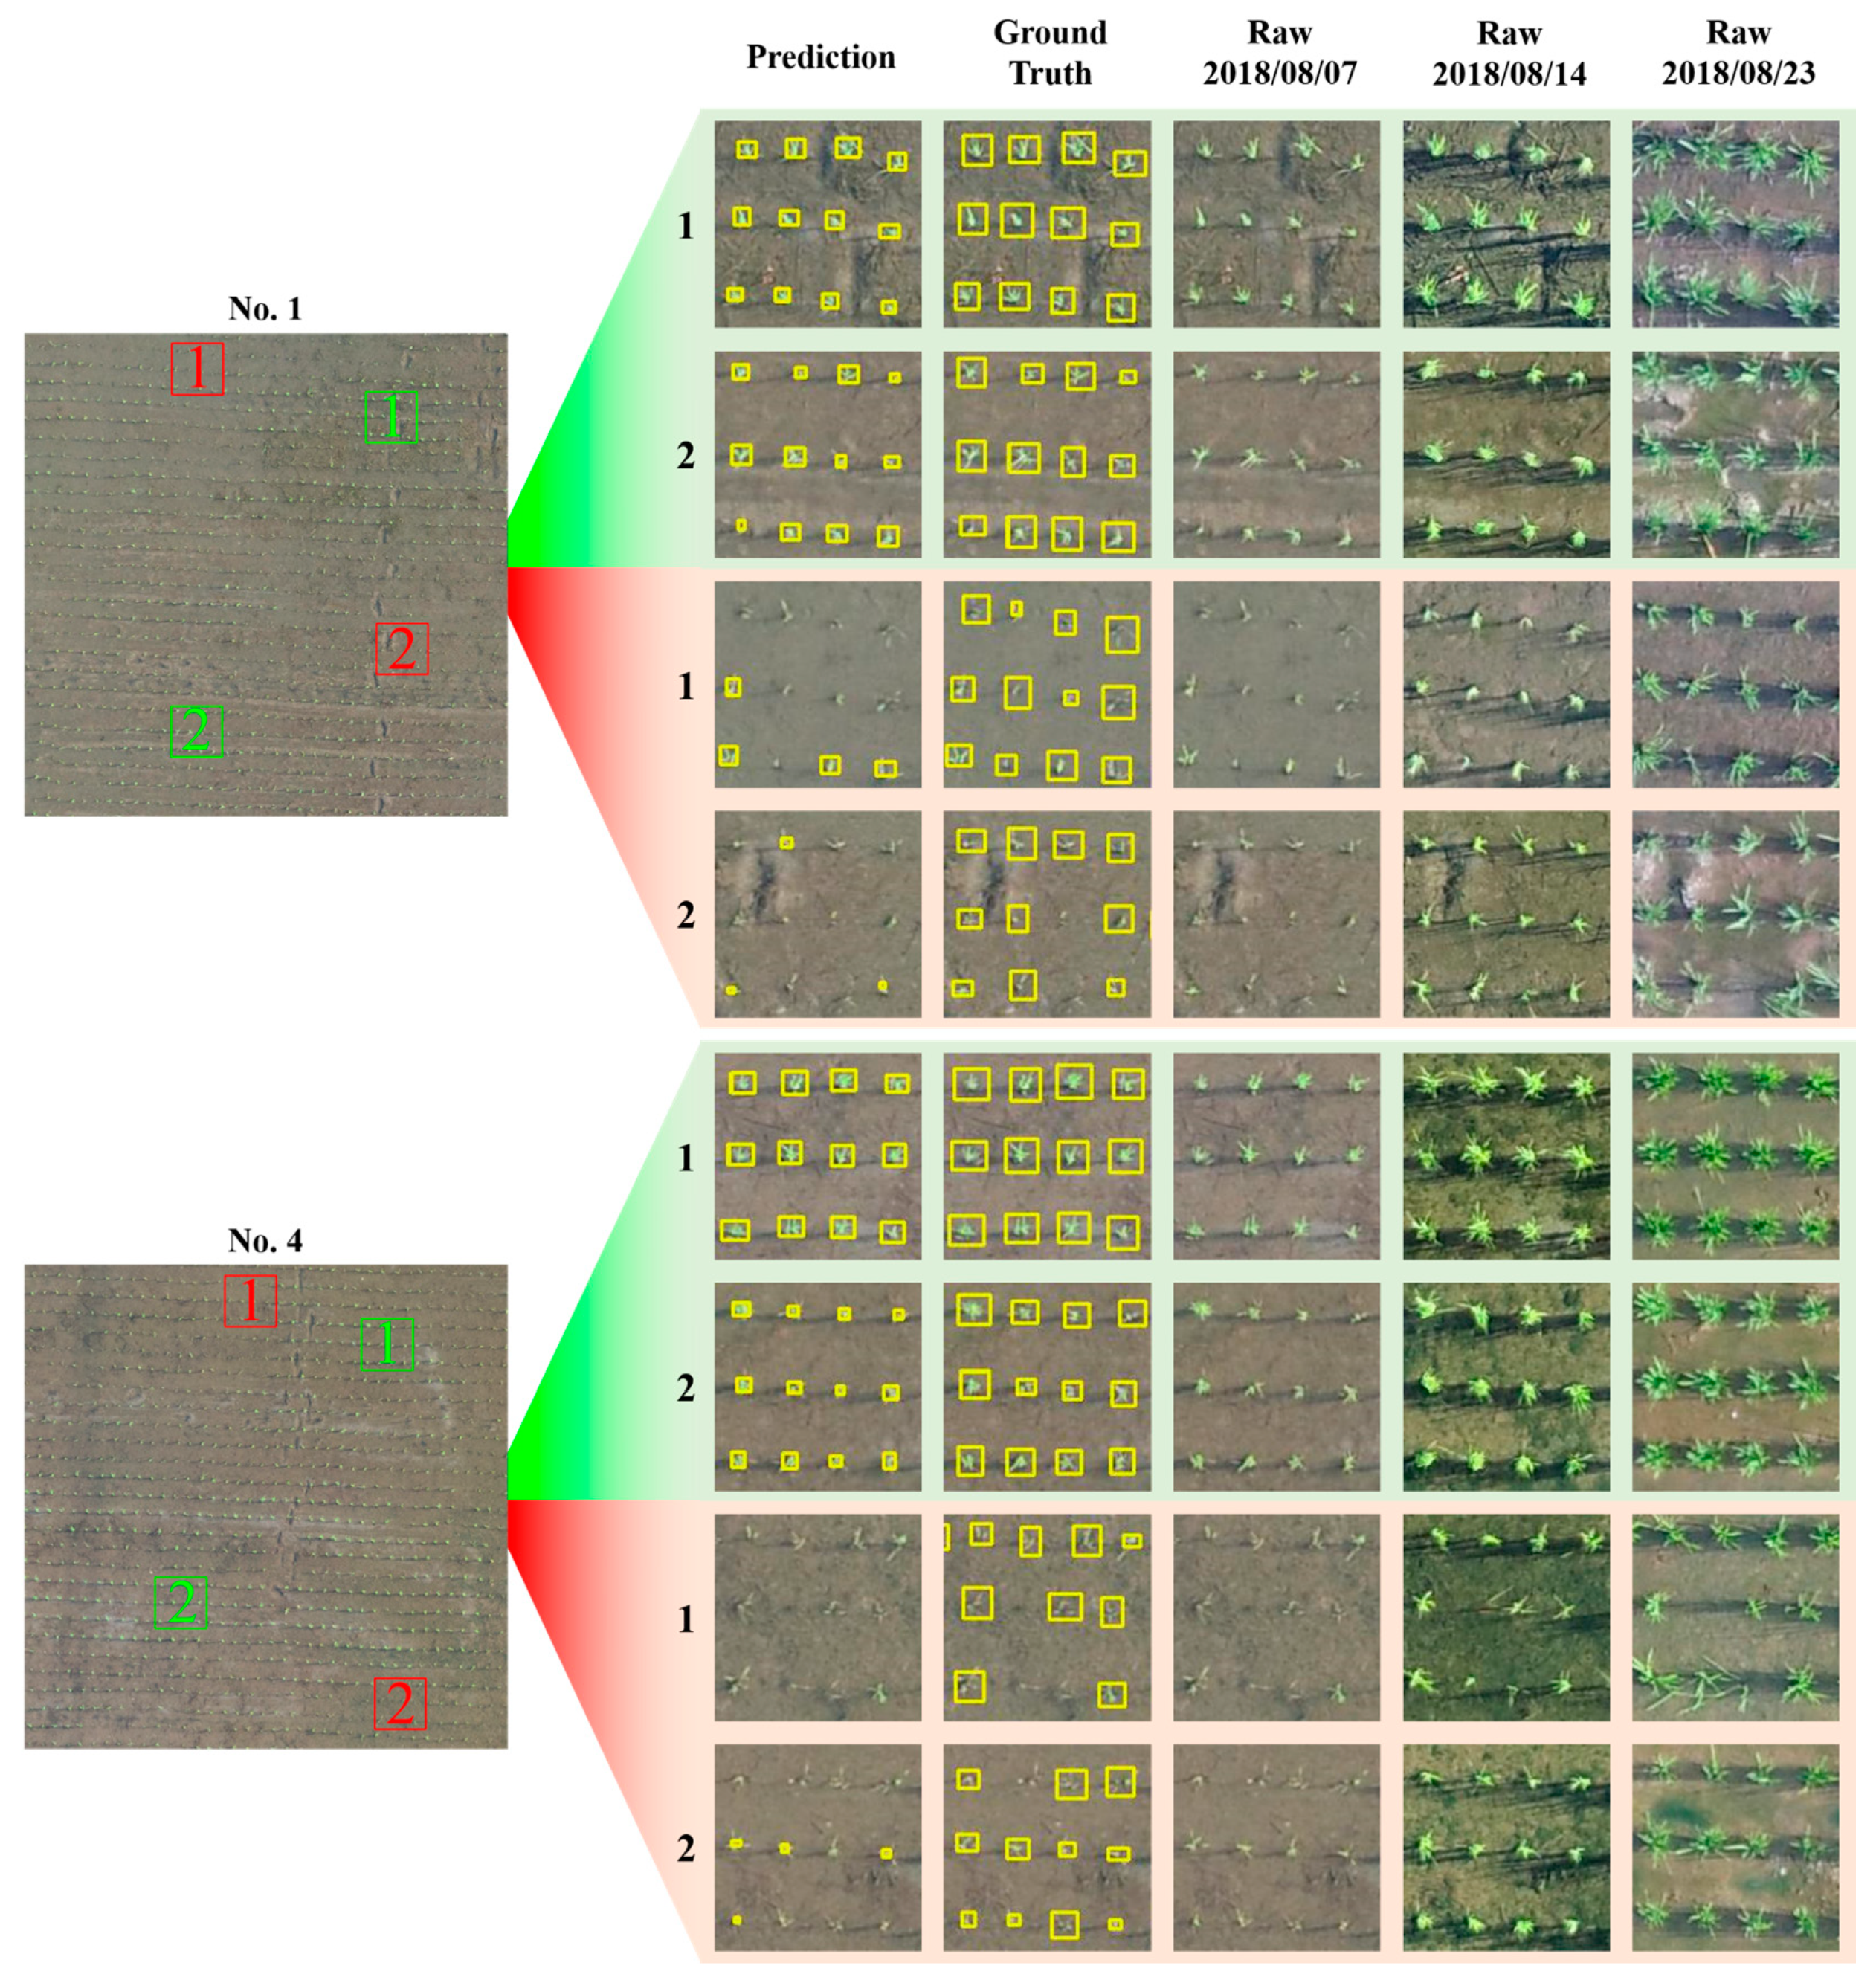
3.1. Demonstration of Rice Seedling Detection
3.2. Classification Model
3.3. Performance Evaluation
3.3.1. Precision
3.3.2. Recall
3.3.3. Accuracy
3.3.4. F1-Score
3.4. Model Training
3.5. Model Evaluation and Detection Demonstration Results
4. Conclusions
Author Contributions
Funding
Data Availability Statement
Acknowledgments
Conflicts of Interest
Appendix A

| <annotation> <folder>raw</folder> <filename>1.tif</filename> <path>data/demo/raw/1.tif</path> <source> <database>RiceSeedlingDetection</database> </source> <size> <width>320</width> <height>320</height> <depth>3</depth> </size> <segmented>0</segmented> <object> <name>RiceSeedling</name> <pose>Unspecified</pose> <truncated>0</truncated> <difficult>0</difficult> <bndbox> <xmin>159</xmin> <ymin>283</ymin> <xmax>181</xmax> <ymax>305</ymax> </bndbox> </object> <object> … </annotation> |
References
- Brown, M.E.; Funk, C.C. Food security under climate change. Science 2008, 319, 580–581. [Google Scholar] [CrossRef]
- Pison, G. The population of the world. Popul. Soc. 2019, 569, 1–8. [Google Scholar]
- Yang, M.D.; Yang, Y.F.; Hsu, S.C. Application of remotely sensed data to the assessment of terrain factors affecting the Tsao-Ling landslide. Can. J. Remote Sens. 2004, 30, 593–603. [Google Scholar] [CrossRef]
- Yang, M.D.; Lin, J.Y.; Yao, C.Y.; Chen, J.Y.; Su, T.C.; Jan, C.D. Landslide-induced levee failure by high concentrated sediment flow—A case of Shan-An levee at Chenyulan River, Taiwan. Eng. Geol. 2011, 123, 91–99. [Google Scholar] [CrossRef]
- Yang, M.D.; Su, T.C.; Hsu, C.H.; Chang, K.C.; Wu, A.M. Mapping of the 26 December 2004 tsunami disaster by using FORMOSAT-2 images. Int. J. Remote Sens. 2007, 28, 3071–3091. [Google Scholar] [CrossRef]
- Lin, J.Y.; Yang, M.D.; Lin, B.R.; Lin, P.S. Risk assessment of debris flows in Songhe Stream, Taiwan. Eng. Geol. 2011, 123, 100–112. [Google Scholar] [CrossRef]
- Xiao, X.; Boles, S.; Frolking, S.; Li, C.; Babu, J.Y.; Salas, W.; Moore III, B. Mapping paddy rice agriculture in South and Southeast Asia using multi-temporal MODIS images. Remote Sens Environ. 2006, 100, 95–113. [Google Scholar] [CrossRef]
- Gebbers, R.; Adamchuk, V.I. Precision agriculture and food security. Science 2010, 327, 828–831. [Google Scholar] [CrossRef]
- Ozdogan, M.; Yang, Y.; Allez, G.; Cervantes, C. Remote sensing of irrigated agriculture: Opportunities and challenges. Remote Sens. 2010, 2, 2274–2304. [Google Scholar] [CrossRef]
- Downs, S.W. Remote Sensing in Agriculture; NASA: Huntsville, AL, USA, 1974. Available online: https://ntrs.nasa.gov/api/citations/19740009927/downloads/19740009927.pdf (accessed on 4 January 2021).
- Peña, J.M.; Gutiérrez, P.A.; Hervás-Martínez, C.; Six, J.; Plant, R.E.; López-Granados, F. Object-Based Image Classification of Summer Crops with Machine Learning Methods. Remote Sens. 2014, 6, 5019–5041. [Google Scholar] [CrossRef]
- Becker-Reshef, I.; Justice, C.; Sullivan, M.; Vermote, E.; Tucker, C.; Anyamba, A.; Small, J.; Pak, E.; Masuoka, E.; Schmaltz, J.; et al. Monitoring global croplands with coarse resolution earth observations: The Global Agriculture Monitoring (GLAM) project. Remote Sens. 2010, 2, 1589–1609. [Google Scholar] [CrossRef]
- Atzberger, C. Advances in remote sensing of agriculture: Context description, existing operational monitoring systems and major information needs. Remote Sens. 2013, 5, 949–981. [Google Scholar] [CrossRef]
- Sanders, K.T.; Masri, S.F. The energy-water agriculture nexus: The past, present and future of holistic resource management via remote sensing technologies. J. Clean. Prod. 2016, 117, 73–88. [Google Scholar] [CrossRef]
- Landsat Missions—Landsat 8. Available online: https://www.usgs.gov/core-science-systems/nli/landsat/landsat-8 (accessed on 6 January 2021).
- SPOT7—Earth Online. Available online: https://earth.esa.int/eogateway/missions/spot-7 (accessed on 6 January 2021).
- Sentinel-2—Missions—Resolution and Swath—Sentinel Handbook. Available online: https://sentinel.esa.int/web/sentinel/missions/sentinel-2/instrument-payload/resolution-and-swath (accessed on 6 January 2021).
- RADARSAT Constellation. Available online: https://earth.esa.int/web/eoportal/satellite-missions/r/rcm (accessed on 6 January 2021).
- Zhang, C.; Kovacs, J.M. The application of small unmanned aerial systems for precision agriculture: A review. Precis. Agric. 2012, 13, 693–712. [Google Scholar] [CrossRef]
- Kwak, G.; Park, N. Impact of Texture Information on Crop Classification with Machine Learning and UAV Images. Appl. Sci. 2019, 9, 643. [Google Scholar] [CrossRef]
- Yang, M.D.; Huang, K.S.; Kuo, Y.H.; Tsai, H.P.; Lin, L.M. Spatial and Spectral Hybrid Image Classification for Rice Lodging Assessment through UAV Imagery. Remote Sens. 2017, 9, 583. [Google Scholar] [CrossRef]
- Yang, M.D.; Boubin, J.G.; Tsai, H.P.; Tseng, H.H.; Hsu, Y.C.; Stewart, C.C. Adaptive autonomous UAV scouting for rice lodging assessment using edge computing with deep learning EDANet. Comput. Electron. Agric. 2020, 179, 105817. [Google Scholar] [CrossRef]
- Yang, C.Y.; Yang, M.D.; Tseng, W.C.; Hsu, Y.C.; Li, G.S.; Lai, M.H.; Wu, D.H.; Lu, H.Y. Assessment of Rice Developmental Stage Using Time Series UAV Imagery for Variable Irrigation Management. Sensors 2020, 20, 5354. [Google Scholar] [CrossRef]
- Egli, S.; Höpke, M. CNN-Based Tree Species Classification Using High Resolution RGB Image Data from Automated UAV Observations. Remote Sens. 2020, 12, 3892. [Google Scholar] [CrossRef]
- Chen, Y.; Lee, W.S.; Gan, H.; Peres, N.; Fraisse, C.; Zhang, Y.; He, Y. Strawberry Yield Prediction Based on a Deep Neural Network Using High-Resolution Aerial Orthoimages. Remote Sens. 2019, 11, 1584. [Google Scholar] [CrossRef]
- Yang, M.D.; Tseng, H.H.; Hsu, Y.C.; Tsai, H.P. Semantic Segmentation Using Deep Learning with Vegetation Indices for Rice Lodging Identification in Multi-date UAV Visible Images. Remote Sens. 2020, 12, 633. [Google Scholar] [CrossRef]
- Li, Z.; Li, Y.; Yang, Y.; Guo, R.; Yang, J.; Yue, J.; Wang, Y. A high-precision detection method of hydroponic lettuce seedlings status based on improved Faster RCNN. Comput. Electron. Agric. 2021, 182, 106054. [Google Scholar] [CrossRef]
- Pearse, G.D.; Tan, A.Y.S.; Watt, M.S.; Franz, M.O.; Dash, J.P. Detecting and mapping tree seedlings in UAV imagery using convolutional neural networks and field-verified data. ISPRS J. Photogramm. Remote Sens. 2020, 168, 156–169. [Google Scholar] [CrossRef]
- Oh, S.; Chang, A.; Ashapure, A.; Jung, J.; Dube, N.; Maeda, M.; Gonzalez, D.; Landivar, J. Plant Counting of Cotton from UAS Imagery Using Deep Learning-Based Object Detection Framework. Remote Sens. 2020, 12, 2981. [Google Scholar] [CrossRef]
- CIFAR-10 and CIFAR-100 Datasets. Available online: https://www.cs.toronto.edu/~kriz/cifar.html (accessed on 6 January 2021).
- Deng, J.; Dong, W.; Socher, R.; Li, L.J.; Li, K.; Fei-Fei, L. ImageNet: A Large-Scale Hierarchical Image Database. In Proceedings of the 2009 IEEE Conference on Computer Vision and Pattern Recognition (CVPR), Miami, FL, USA, 20–25 June 2009; pp. 248–255. [Google Scholar]
- Lin, Y.T.; Maire, M.; Belongie, S.; Bourdev, L.; Girshick, R.; Hays, J.; Perona, P.; Ramanan, D.; Zitnick, C.L.; Dollár, P. Microsoft COCO: Common Objects in Context. In Proceedings of the 13th European Conference on Computer Vision (ECCV), Zurich, Switzerland, 6–12 September 2014; pp. 740–755. [Google Scholar]
- FAOSTAT—New Food Balances. Available online: http://www.fao.org/faostat/en/#data/FBS (accessed on 4 January 2021).
- Muthayya, S.; Sugimoto, J.D.; Montgomery, S.; Maberly, G.F. An overview of global rice production, supply, trade, and consumption. Ann. N. Y. Acad. Sci. 2014, 1324, 7–14. [Google Scholar] [CrossRef]
- Phantom 4 Pro—DJI. Available online: https://www.dji.com/phantom-4-pro?site=brandsite&from=nav (accessed on 6 January 2021).
- Zenmuse X7 Specs—DJI. Available online: https://www.dji.com/zenmuse-x7/info#specs (accessed on 12 March 2021).
- Shorten, C.; Khoshgoftaar, T.M. A survey on Image Data Augmentation for Deep Learning. J. Big Data 2019, 6, 60. [Google Scholar] [CrossRef]
- AgiSoft Metashape Professional 1.6.5. (Software); AgiSoft LCC: St. Petersburg, Russia, 2020.
- Meyer, G.E.; Neto, J.C. Verification of Color Vegetation Indices for Automated Crop Imaging Applications. Comput. Electron. Agric. 2008, 63, 282–293. [Google Scholar] [CrossRef]
- Yen, J.C.; Chang, F.J.; Chang, S. A new criterion for automatic multilevel thresholding. IEEE Trans. Image Process. 1995, 4, 370–378. [Google Scholar]
- Contour Features—Open Source Computer Vision (OpenCV). Available online: https://docs.opencv.org/4.5.1/dd/d49/tutorial_py_contour_features.html (accessed on 6 January 2021).
- Lever, J.; Krzywinski, M.; Altman, N. Model selection and overfitting. Nat. Methods 2016, 13, 703–704. [Google Scholar] [CrossRef]
- The PASCAL Visual Object Classes Homepage. Available online: http://host.robots.ox.ac.uk/pascal/VOC/ (accessed on 6 January 2021).
- LabelImg. Available online: https://github.com/tzutalin/labelImg (accessed on 7 January 2021).
- Simonyan, K.; Zisserman, A. Very Deep Convolutional Networks for Large-Scale Image Recognition. arXiv 2014, arXiv:1409.1556. [Google Scholar]
- Sokolova, M.; Japkowicz, N.; Szpakowicz, S. Beyond accuracy, F-score and ROC: A family of discriminant measures for performance evaluation. In Proceedings of the 19th Australian Joint Conference on Artificial Intelligence (AI), Hobart, Australia, 4–8 December 2006; pp. 1015–1021. [Google Scholar]
- TensorFlow. Available online: https://www.tensorflow.org/ (accessed on 7 January 2021).
- Kingma, D.P.; Ba, J. Adam: A method for stochastic optimization. arXiv 2014, arXiv:1412.6980. [Google Scholar]


| Filename | Description | Disk Space |
|---|---|---|
| 2018-08-07_ARI80_20m_Orthomosaic.tif | orthomosaic image | 465 MB |
| 2018-08-14_ARI80_20m_Orthomosaic.tif | orthomosaic image | 610 MB |
| 2018-08-23_ARI80_20m_Orthomosaic.tif | orthomosaic image | 556 MB |
| 2019-03-26_ARI78_20m_Orthomosaic.tif | orthomosaic image | 485 MB |
| 2019-04-02_ARI78_20m_Orthomosaic.tif | orthomosaic image | 418 MB |
| 2019-08-12_ARI78_20m_Orthomosaic.tif | orthomosaic image | 503 MB |
| 2019-08-20_ARI78_20m_Orthomosaic.tif | orthomosaic image | 605 MB |
| 2020-03-12_ARI78_40m_Orthomosaic.tif | orthomosaic image | 278 MB |
| 2020-03-17_ARI78_40m_Orthomosaic.tif | orthomosaic image | 317 MB |
| 2020-03-26_ARI78_40m_Orthomosaic.tif | orthomosaic image | 385 MB |
| 2020-08-12_ARI78_40m_Orthomosaic.tif | orthomosaic image | 330 MB |
| 2020-08-18_ARI78_40m_Orthomosaic.tif | orthomosaic image | 382 MB |
| 2020-08-25_ARI78_40m_Orthomosaic.tif | orthomosaic image | 402 MB |
| RiceSeedlingClassification.tgz | training-validation dataset | 426 MB |
| RiceSeedlingDetection.tgz | detection training dataset | 10.9 MB |
| RiceSeedlingDemo.tgz | detection demonstration dataset | 48.5 MB |
| Sensor | DJI Phantom 4 Pro [35] | DJI Zenmuse X7 [36] |
|---|---|---|
| Resolution (H × V) | 5472 × 3648 | 6016 × 4008 |
| FOV (H° × V°) | 73.7° × 53.1° | 52.2° × 36.2° |
| Focal Length (mm) | 8.8 | 24 |
| Sensor Size (H × V mm) | 13.2 × 8.8 | 23.5 × 15.7 |
| Pixel Size (μm) | 2.41 × 2.41 | 3.99 × 3.99 |
| Image Format | JPG | JPG |
| Dynamic Range | 8 bit | 8 bit |
| Study Area | No. 80 Field | ||
|---|---|---|---|
| Sensor | DJI Phantom 4 Pro | ||
| Acquisition Date | 7th August 2018 | 14th August 2018 | 23rd August 2018 |
| Time | 07:19–07:32 | 07:03–07:13 | 07:41–08:00 |
| Weather | Mostly clear | Mostly clear | Partly Cloudy |
| Avg. Temperature (°C) | 28.7 | 27.8 | 28.6 |
| Avg. Press (hPa) | 997.7 | 992.2 | 987.9 |
| Flight Height (m) | 21.4 | 20.8 | 22.9 |
| Spatial Resolution (mm/pixel) | 5.24 | 5.09 | 5.57 |
| Forward Overlap (%) | 80 | 80 | 80 |
| Side Overlap (%) | 75 | 75 | 80 |
| Collected Images | 349 | 299 | 443 |
| Coverage Area (ha) | 1.38 | 1.18 | 1.33 |
| Study Area | No. 78 Field | |||||||||
|---|---|---|---|---|---|---|---|---|---|---|
| Sensor | DJI Phantom 4 Pro | DJI Zenmuse X7 | ||||||||
| Acquisition Date | 26th March 2019 | 2nd April 2019 | 12th August 2019 | 20th August 2019 | 12th March 2020 | 17th March 2020 | 26th March 2020 | 12th August 2020 | 18th August 2020 | 25th August 2020 |
| Time | 09:40–10:05 | 09:19–09:48 | 14:23–14:44 | 08:16–08:36 | 09:54–10:07 | 09:27–09:42 | 08:58–09:12 | 09:00–09:12 | 08:34–08:46 | 08:16–08:29 |
| Weather | Clear | Cloudy | Cloudy/ occasional l rain | Partly cloudy | Partly cloudy | Clear | Clear | Clear | Clear | Clear |
| Avg. Tempera ture (°C) | 22.6 | 21.2 | 29.1 | 28.5 | 22.0 | 23.6 | 27.8 | 32.4 | 29.8 | 30.7 |
| Avg. Press (hPa) | 1011.7 | 1011.3 | 994.2 | 997.8 | 1009.8 | 1011.5 | 1006.9 | 1005.2 | 999.2 | 996.3 |
| Flight Height (m) | 20.2 | 21.3 | 18.6 | 19.1 | 42.2 | 41.9 | 42.0 | 41.8 | 40.2 | 40.2 |
| Spatial Resolution (mm/pixel) | 5.04 | 5.33 | 4.62 | 4.78 | 6.38 | 6.38 | 6.38 | 6.37 | 6.36 | 6.36 |
| Forward Overlap (%) | 80 | 80 | 80 | 80 | 80 | 80 | 80 | 80 | 80 | 80 |
| Side Overlap (%) | 80 | 80 | 80 | 80 | 80 | 80 | 80 | 80 | 80 | 80 |
| Collected Images | 583 | 631 | 615 | 596 | 250 | 250 | 250 | 250 | 250 | 251 |
| Coverage Area (ha) | 1.17 | 1.25 | 1.17 | 1.18 | 1.59 | 1.60 | 1.58 | 1.59 | 1.59 | 1.60 |
| Class | Training Samples | Validation Samples | Testing Samples | Total Samples |
|---|---|---|---|---|
| Rice Seedling | 22,438 | 561 | 5048 | 28,047 |
| Arable land | 21,265 | 532 | 4784 | 26,581 |
| Total | 43,703 | 1093 | 9832 | 54,628 |
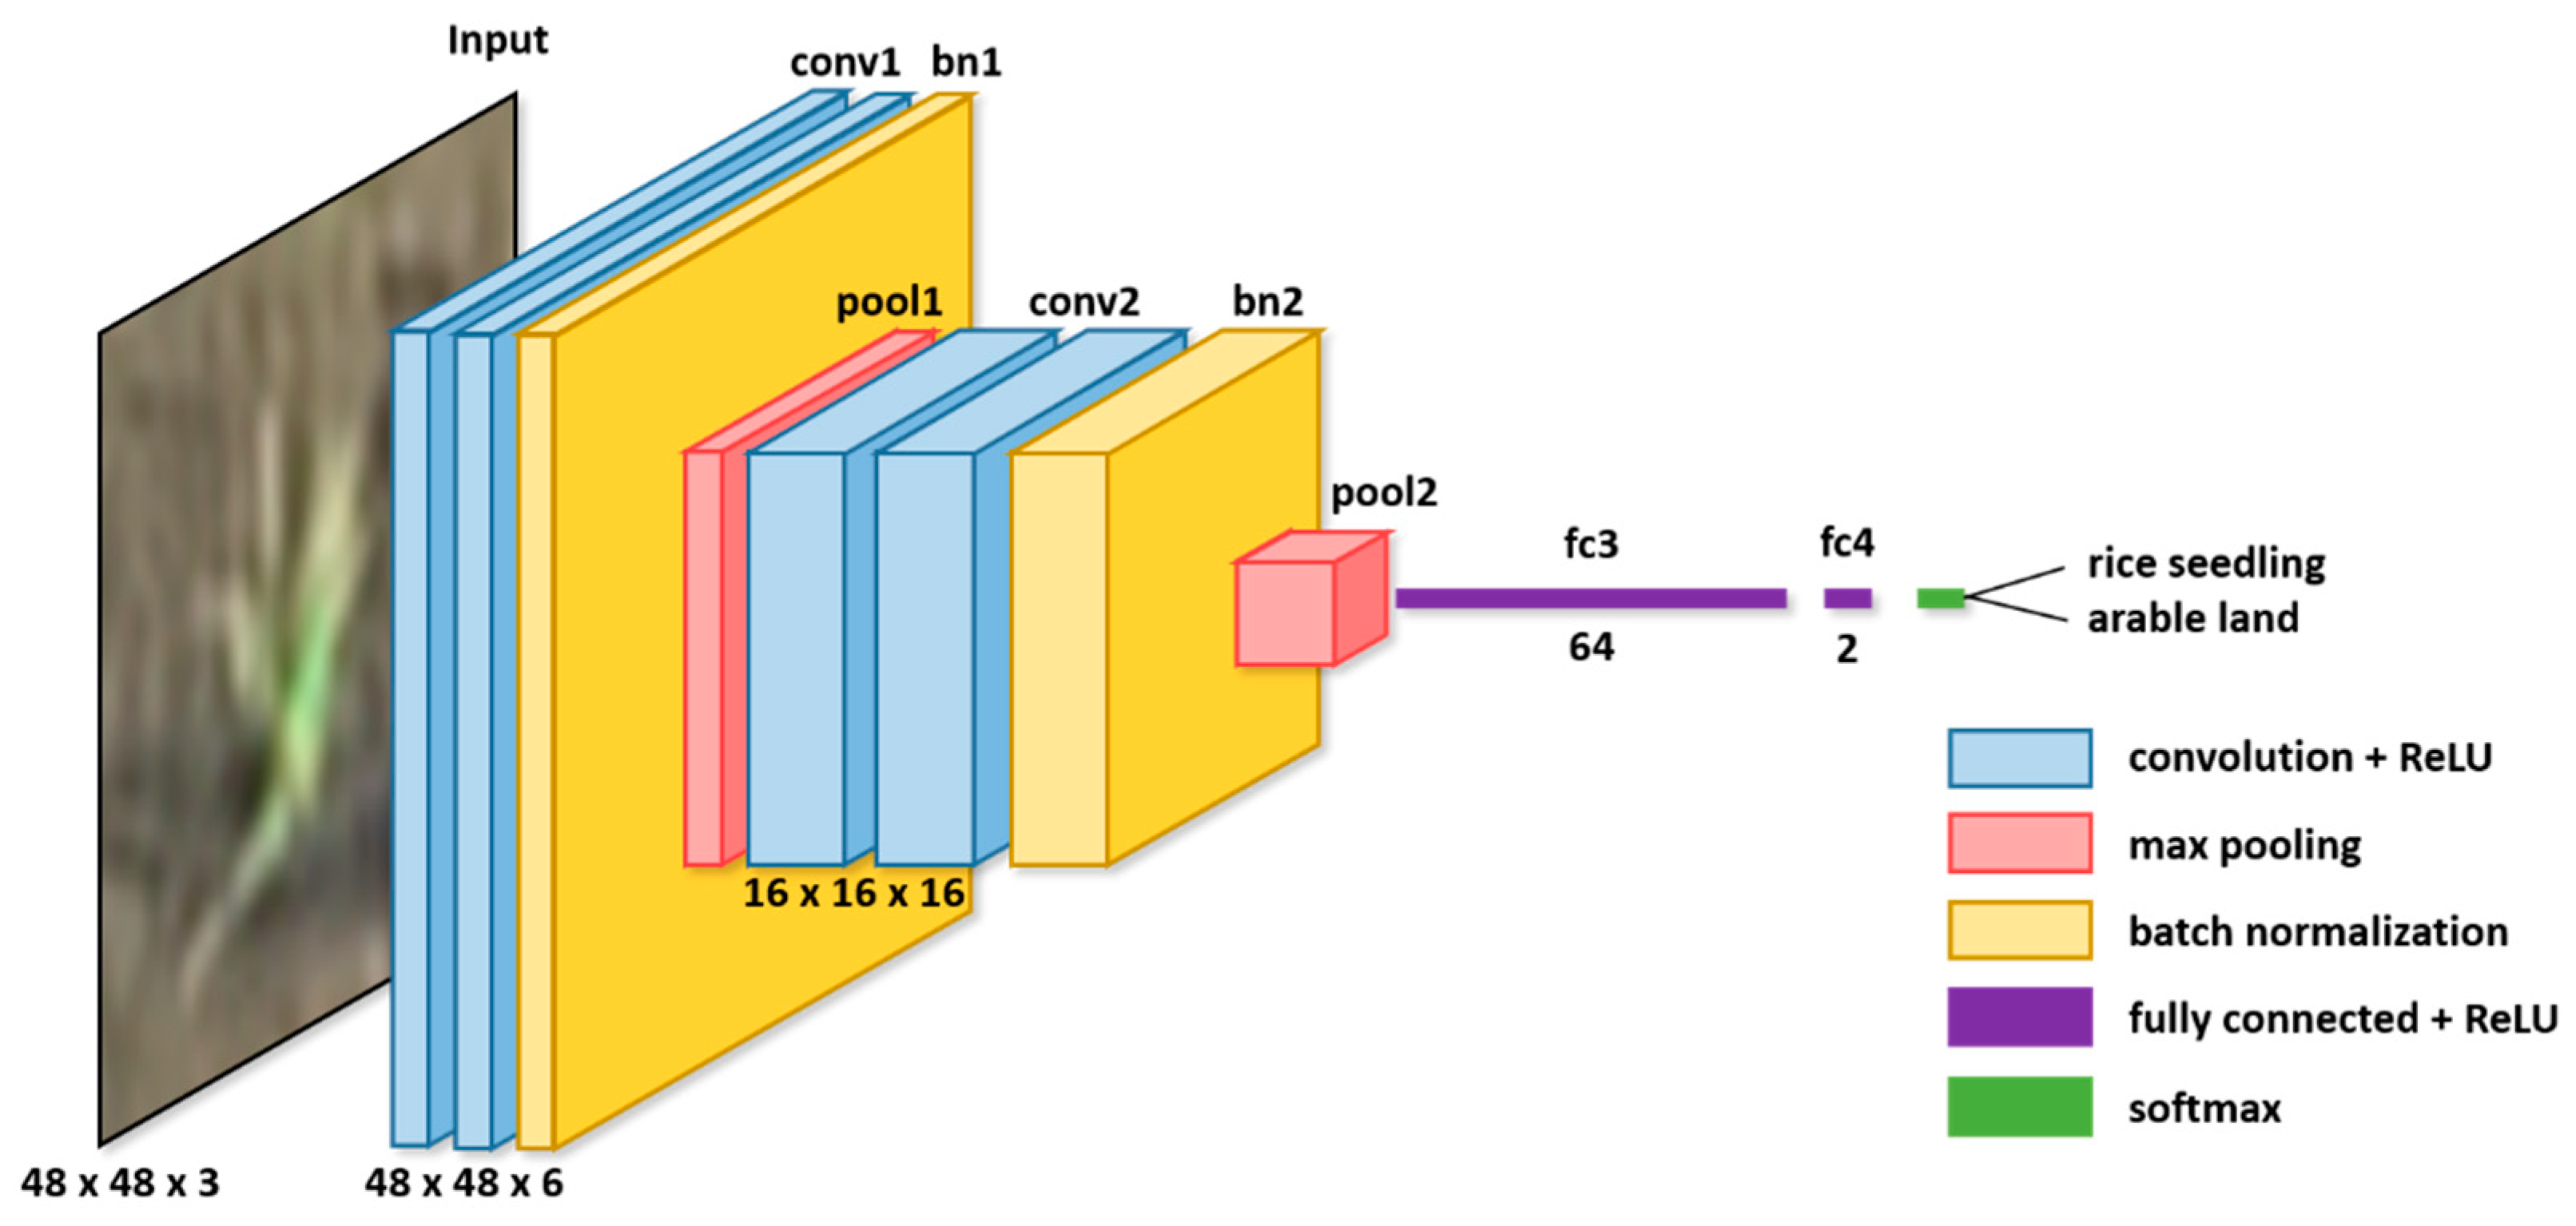
| Layer | Parameter | Activation Function |
|---|---|---|
| Input | 48 × 48 × 3 | ― |
| Convolution 1_1 (conv1_1) | 6 filters (3 × 3), stride 1, padding same | ReLU |
| Convolution 1_2 (conv1_2) | 6 filters (3 × 3), stride 1, padding same | ReLU |
| Batch Normalization 1 (bn1) | ― | ― |
| Pooling 1 (pool1) | Max pooling (3 × 3), stride 3 | ― |
| Convolution 2_1 (conv2_1) | 16 filters (3 × 3), stride 1, padding same | ReLU |
| Convolution 2_2 (conv2_2) | 16 filters (3 × 3), stride 1, padding same | ReLU |
| Batch Normalization 2 (bn2) | ― | ― |
| Pooling 2 (pool2) | Max pooling (4 × 4), stride 4 | ― |
| Flatten | ― | ― |
| Full Connect 3 (fc3) | 64 nodes | ReLU |
| Dropout | Dropout rate 0.1 | ― |
| Full Connect 4 (fc4) | 2 nodes | ReLU |
| Output | ― | Softmax |
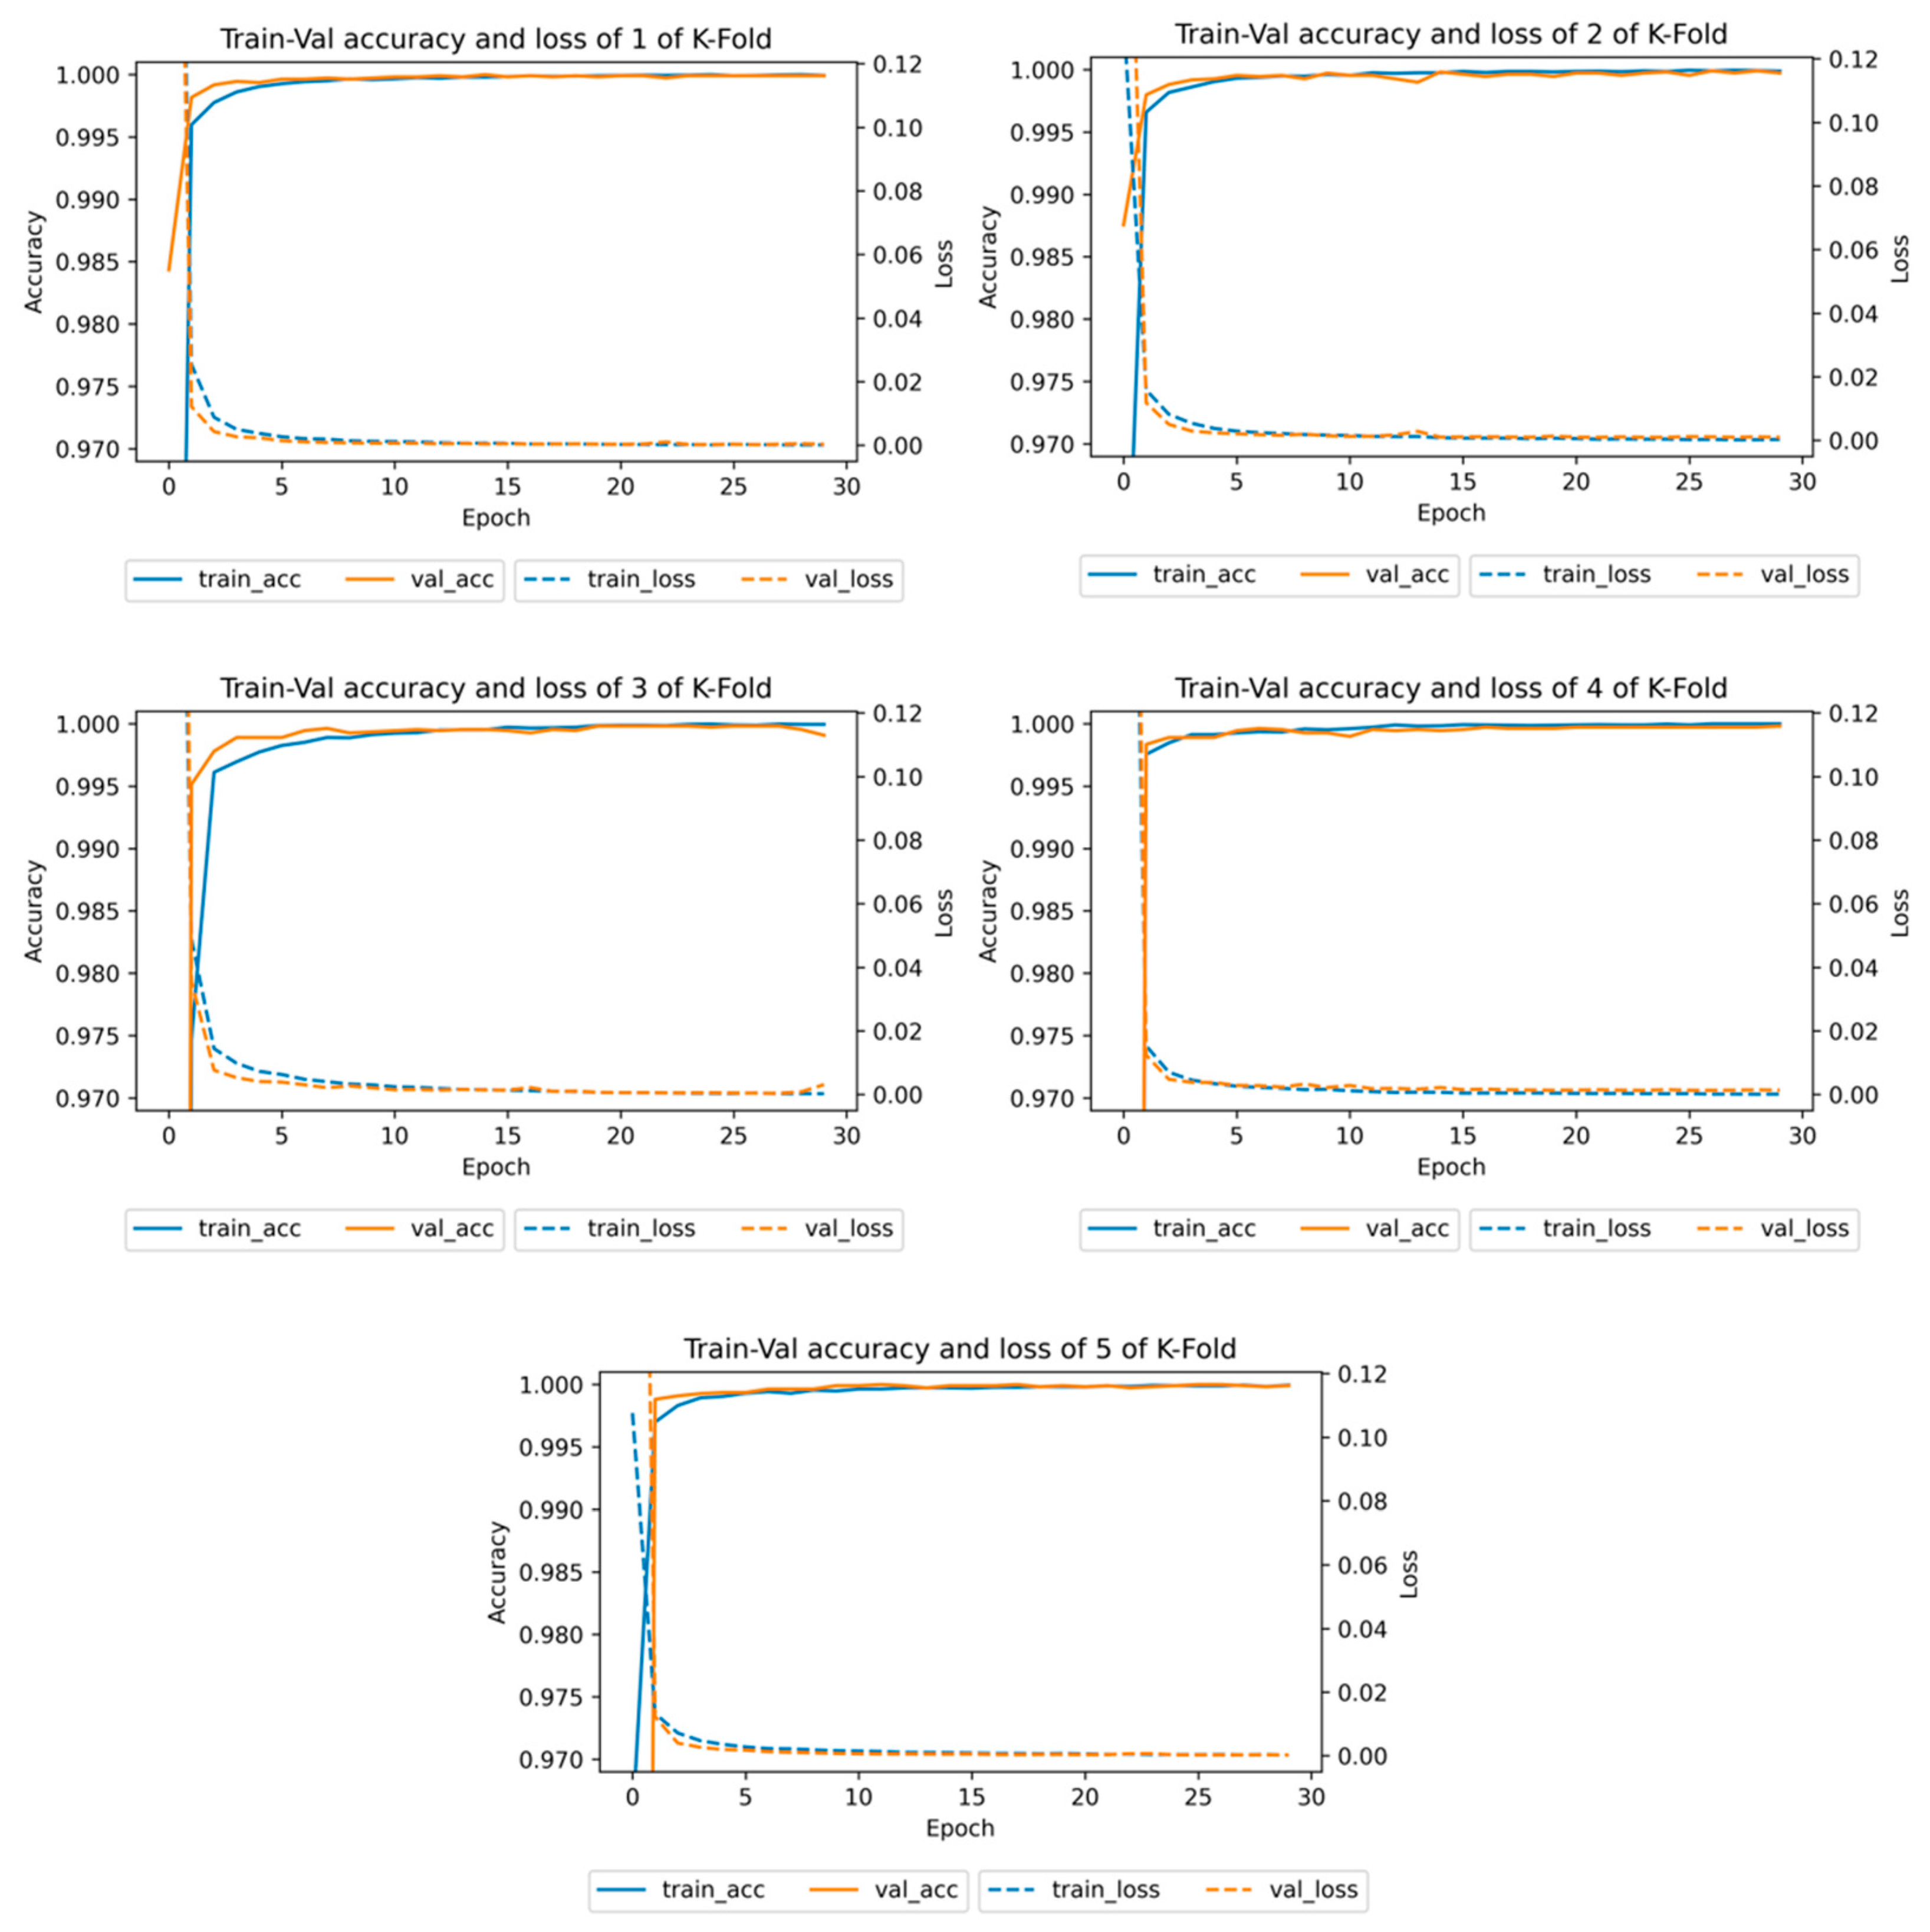
| Fold | Rice Seedling | Arable Land | Accuracy | ||||
|---|---|---|---|---|---|---|---|
| Precision (%) | Recall (%) | F1-Score (%) | Precision (%) | Recall (%) | F1-Score (%) | ||
| 1 | 99.98 | 100.00 | 99.99 | 100.00 | 99.98 | 99.99 | 99.99 |
| 2 | 99.98 | 99.98 | 99.98 | 99.98 | 99.98 | 99.98 | 99.98 |
| 3 | 99.98 | 99.98 | 99.98 | 99.98 | 99.98 | 99.98 | 99.98 |
| 4 | 99.98 | 99.95 | 99.96 | 99.94 | 99.98 | 99.94 | 99.96 |
| 5 | 100.00 | 100.00 | 100.00 | 100.00 | 100.00 | 100.00 | 100.00 |
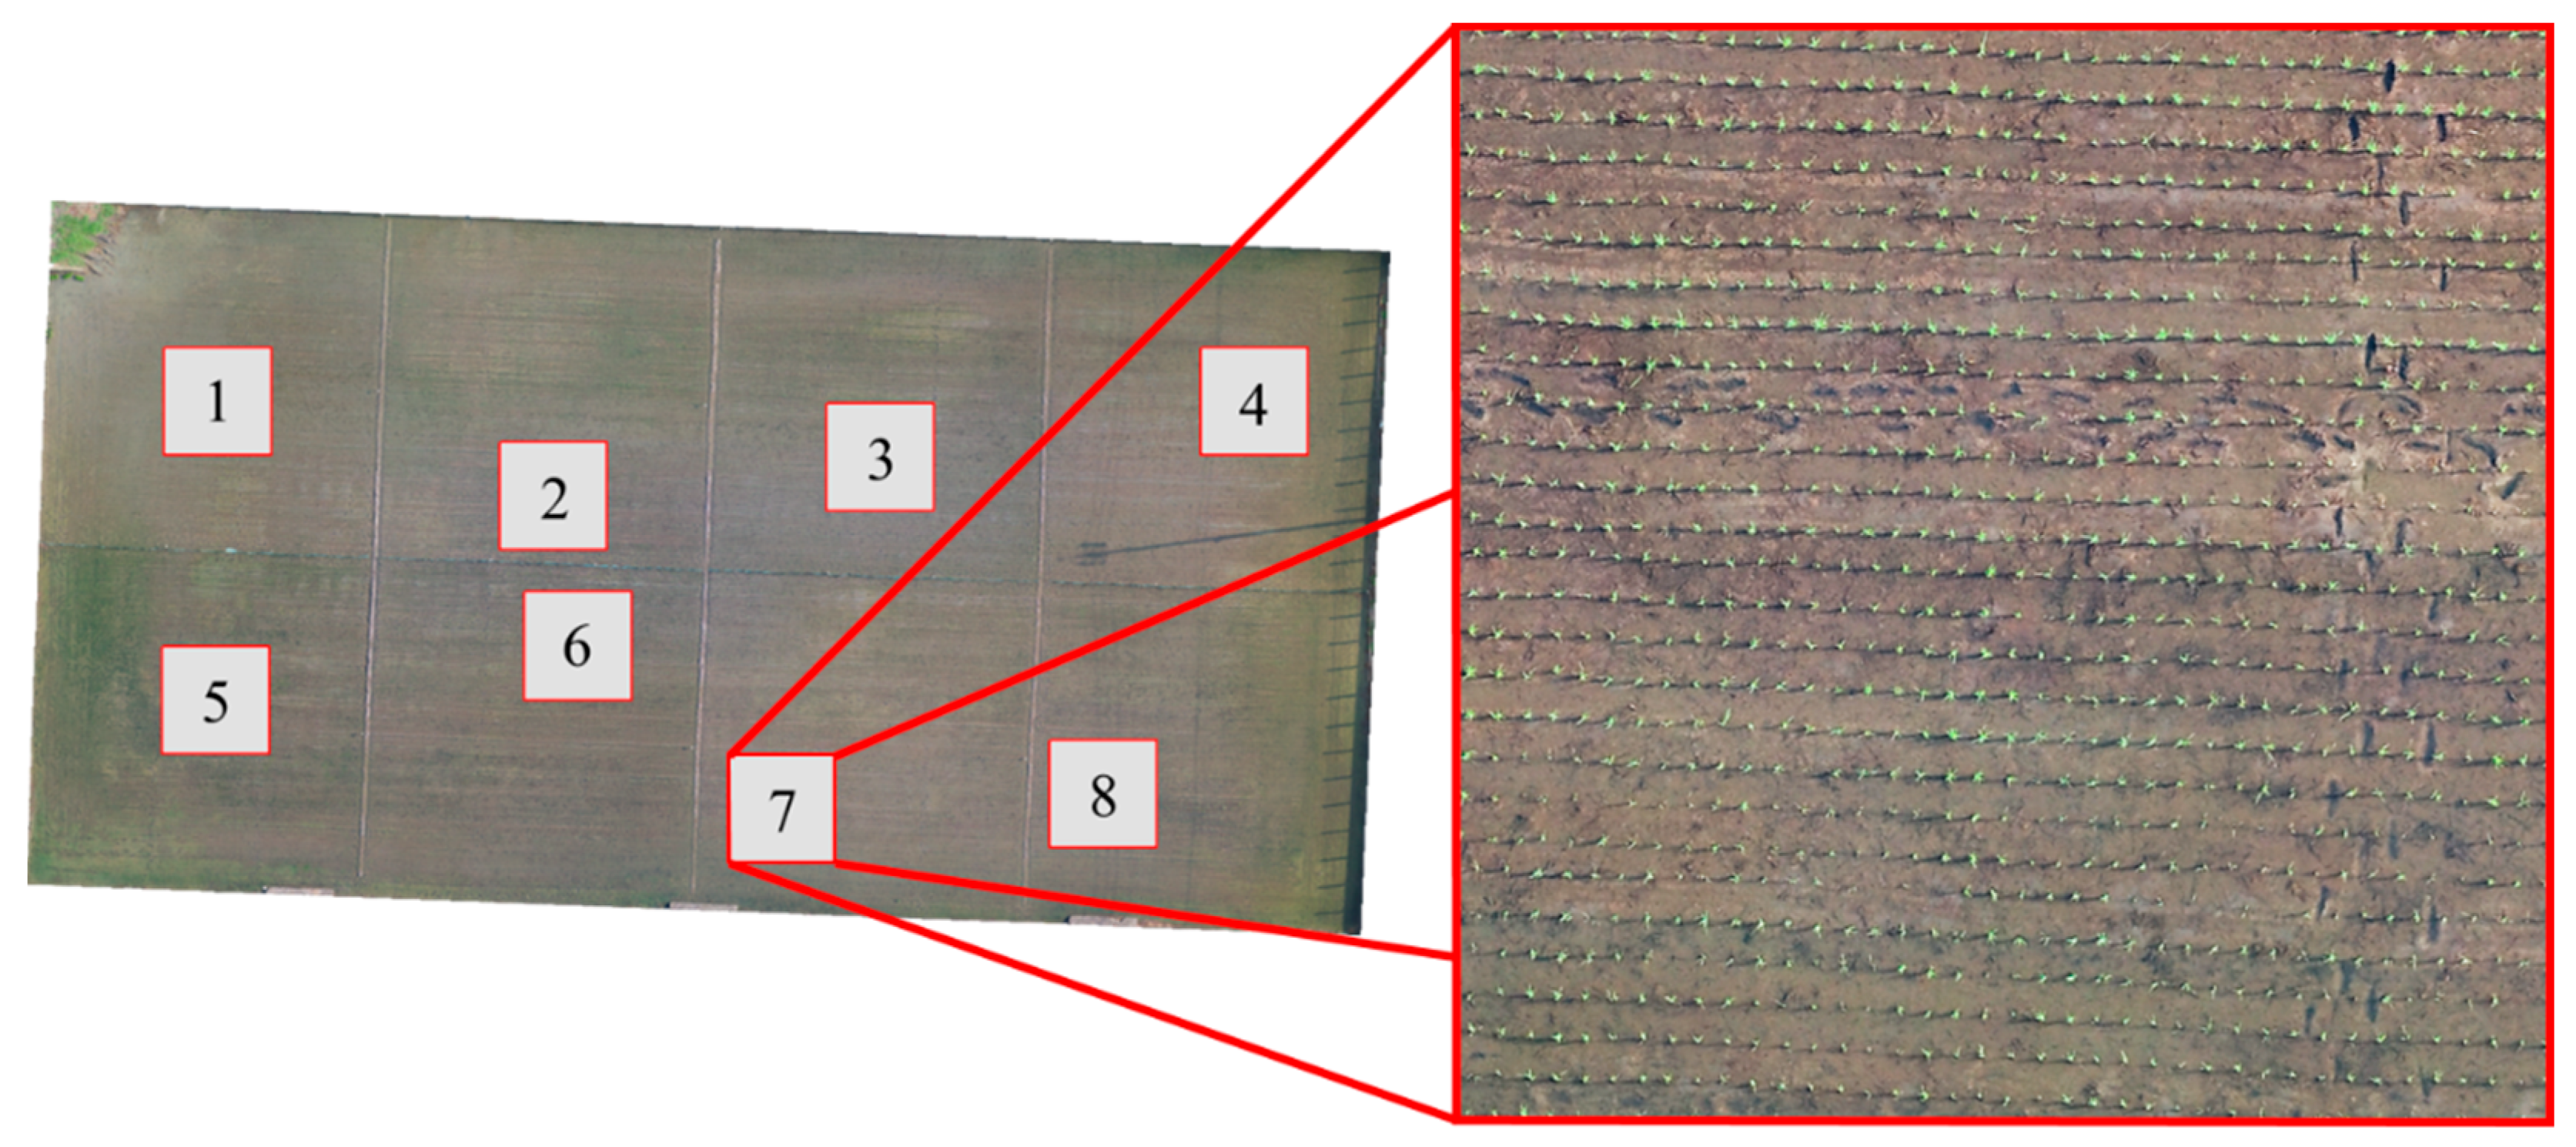
| Subset No. | 1 | 2 | 3 | 4 | 5 | 6 | 7 | 8 |
|---|---|---|---|---|---|---|---|---|
| Prediction | 735 | 1006 | 1037 | 809 | 1004 | 1050 | 1017 | 1032 |
| Ground truth | 898 | 1000 | 1019 | 964 | 971 | 1002 | 1033 | 1005 |
| Error (%) | 18.15 | 0.60 | 1.77 | 16.08 | 3.40 | 4.79 | 1.55 | 2.69 |
Publisher’s Note: MDPI stays neutral with regard to jurisdictional claims in published maps and institutional affiliations. |
© 2021 by the authors. Licensee MDPI, Basel, Switzerland. This article is an open access article distributed under the terms and conditions of the Creative Commons Attribution (CC BY) license (https://creativecommons.org/licenses/by/4.0/).
Share and Cite
Yang, M.-D.; Tseng, H.-H.; Hsu, Y.-C.; Yang, C.-Y.; Lai, M.-H.; Wu, D.-H. A UAV Open Dataset of Rice Paddies for Deep Learning Practice. Remote Sens. 2021, 13, 1358. https://doi.org/10.3390/rs13071358
Yang M-D, Tseng H-H, Hsu Y-C, Yang C-Y, Lai M-H, Wu D-H. A UAV Open Dataset of Rice Paddies for Deep Learning Practice. Remote Sensing. 2021; 13(7):1358. https://doi.org/10.3390/rs13071358
Chicago/Turabian StyleYang, Ming-Der, Hsin-Hung Tseng, Yu-Chun Hsu, Chin-Ying Yang, Ming-Hsin Lai, and Dong-Hong Wu. 2021. "A UAV Open Dataset of Rice Paddies for Deep Learning Practice" Remote Sensing 13, no. 7: 1358. https://doi.org/10.3390/rs13071358
APA StyleYang, M.-D., Tseng, H.-H., Hsu, Y.-C., Yang, C.-Y., Lai, M.-H., & Wu, D.-H. (2021). A UAV Open Dataset of Rice Paddies for Deep Learning Practice. Remote Sensing, 13(7), 1358. https://doi.org/10.3390/rs13071358