Article

Using UAV Imagery to Detect and Map Woody Species Encroachment in a Subalpine Grassland: Advantages and Limits

1
Department of Life Sciences and Systems Biology, University of Torino, Via Pier Andrea Mattioli 25, 10125 Turin, Italy
2
Environmental Protection Agency of Aosta Valley (ARPA VdA), Località Grande Charrière 44, Saint-Christophe, 11020 Aosta, Italy
*
Author to whom correspondence should be addressed.
Remote Sens. 2021, 13(7), 1239; https://doi.org/10.3390/rs13071239
Submission received: 22 January 2021 / Revised: 15 March 2021 / Accepted: 19 March 2021 / Published: 24 March 2021
(This article belongs to the Special Issue Remote Sensing for Land Cover and Vegetation Mapping)

Abstract

:
Woody species encroachment on grassland ecosystems is occurring worldwide with both negative and positive consequences for biodiversity conservation and ecosystem services. Remote sensing and image analysis represent useful tools for the monitoring of this process. In this paper, we aimed at evaluating quantitatively the potential of using high-resolution UAV imagery to monitor the encroachment process during its early development and at comparing the performance of manual and semi-automatic classification methods. The RGB images of an abandoned subalpine grassland on the Western Italian Alps were acquired by drone and then classified through manual photo-interpretation, with both pixel- and object-based semi-automatic models, using machine-learning algorithms. The classification techniques were applied at different resolution levels and tested for their accuracy against reference data including measurements of tree dimensions collected in the field. Results showed that the most accurate method was the photo-interpretation (≈99%), followed by the pixel-based approach (≈86%) that was faster than the manual technique and more accurate than the object-based one (≈78%). The dimensional threshold for juvenile tree detection was lower for the photo-interpretation but comparable to the pixel-based one. Therefore, for the encroachment mapping at its early stages, the pixel-based approach proved to be a promising and pragmatic choice.

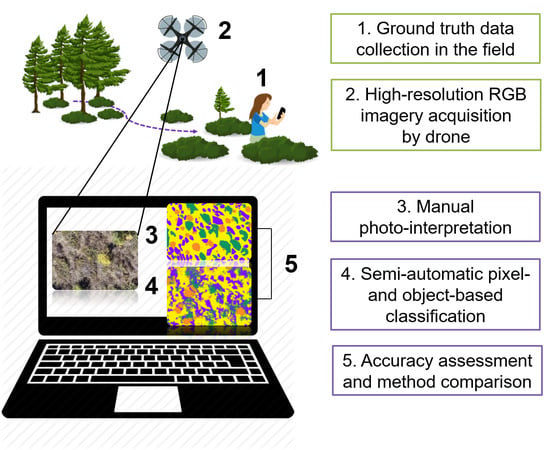
Graphical Abstract

1. Introduction

Land-use and climate change are the main processes predicted to have major effects on biodiversity and the functioning of terrestrial ecosystems [1,2]. In montane and subalpine grasslands, below the treeline, land abandonment is the main driver of shrub and tree colonization [3]. In Europe, semi-natural grasslands, mainly used for foraging purposes, have been prevalent on south-facing slopes and managed to prevent tree establishment [4,5,6]. In the last few decades, socio-economic transformations in the Alps have led, in some areas, to the decline of livestock farming and agriculture and consequently to land abandonment [7,8]. This process opened the way to woody shrub and tree encroachment, which, in turn, has the potential to modify the ecosystem structure and function, with both negative and positive consequences for ecosystem services [9,10,11] and biodiversity [12,13]. Generally, the woody encroachment of grasslands causes an alteration of microclimatic conditions and a reduction of herbaceous cover, which contribute to the consequent decrease of species richness in the long-term, e.g., [12,13,14]. Nevertheless, this observation depends on the encroachment stage and the relative woody cover. In fact, many studies observed a peak in plant species diversity at intermediate levels of woody cover, especially during the so-called “shrub islands stage”, characterized by an increase in species richness and a decrease in the cover of dominant native grasses [15,16,17]. Furthermore, a long-term reduction in the number of species was also observed for insects, birds and small mammals, e.g., [18,19,20]. Similar to what we observed for the ecosystem structure, the woody encroachment effects on ecosystem services depend on the stage of the chronosequence process. Indeed, at the turn of the initial and intermediate stages, when woody and herbaceous species coexist in a heterogeneous mosaic, CO2 fixation increases [21] as a consequence of the increase in biomass production and the decrease in decomposition rate [22]. Moreover, woody encroachment is also associated with changes in soil properties, in particular with the increasing of soil C:N ratio and/or the reduction of N, P or K contents [23]. Although there is evidence of common trends in the consequences of woody encroachment, it is important to bear in mind that the effects of this process depend on several ecological aspects which characterize the study area, such as climate, soil properties, plant community structure, site history and many others.
The main species involved in tree encroachment of the subalpine belt are Picea abies (L.) H. Karst, Larix decidua Mill., Pinus cembra L., Pinus uncinata Ramond ex DC., and Alnus alnobetula (Ehrh.) K. Koch [8], and their establishment in abandoned grasslands is often preceded by the invasion of the shrub species coming from the surrounding forest undergrowth. The onset, rate and extent of shrub and tree encroachment in grasslands may depend not only on land use but also on species dispersal, topographic gradients and biotic processes (i.e., competition and facilitation) [5,24,25,26,27]. Moreover, climatic variations have also been associated with pulses of the encroachment rate, making the disentangling of all these effects very complex.
The development of new methods for vegetation monitoring, which are faster and easier compared to field surveys, represents a necessary step forward for the investigation of encroachment dynamics and its consequences on ecosystem structure and functioning. In fact, studying this ecological process generally requires a huge amount of data, widely distributed across a large geographical area, and frequently repeated over time, which can be hardly obtained by “standard” systematic approaches in the field (i.e., vegetation surveys). So far, encroachment monitoring at a local scale has mostly been conducted in the field by measuring variables in permanent plots, such as trunk diameter, tree height, percentage of canopy cover, number of trees, tree and shrub species. These methods are well-developed and allow researchers to collect good data but, at the same time, can be very time-consuming and logistically challenging in remote areas. For these reasons, ground-based surveys are not carried out at the frequency required to statistically detect fast processes or inter-annual changes [28].
In this context, remote sensing represents a useful tool for the monitoring of the encroachment process within grasslands, being a suitable source of data for vegetation classification. Mapping and monitoring shrub and tree encroachment through remote sensing may contribute to a more thorough understanding of the mechanisms involved in this process, its spatial patterns and temporal rates, and the consequences on ecosystem structure and functioning. Remote sensing generated a growing interest in the last few decades for its applications in ecological research and management purposes, counting among the essential approaches for data acquisition on vegetation [29,30,31,32,33]. In this context, remote sensing can be put forward as a fundamental approach for mapping and monitoring essential biodiversity variables on both a global and local scale [34,35,36,37]. Regarding vegetation mapping, the most common approach to classifying land-cover types and monitoring vegetation dynamics is currently satellite-based remote sensing [28,38,39,40,41], followed by piloted aircraft imagery [4,42,43]. However, the pixel size range (e.g., 5 to 30 m) of high-resolution satellite data (e.g., Pleiades, Sentinel, Landsat) hinders the detection of small-scale changes or the differentiation between similar land-cover types. On the other hand, high-resolution satellite images (e.g., QuickBird, IKONOS) are expensive and might not always be accessible due to financial constraints or the overall complexity of data acquisition [28,39].
So far, most of the studies that tried to replace fieldwork in the investigation of land cover change due to encroachment resorted to the analysis of satellite images [40,41]. However, using satellite imagery can produce large errors when applied to highly-heterogeneous vegetation on a fine scale, mainly due to pixel-mixing occurring when the pixel size is not small enough to avoid a combination of different species inside it. Due to resolution limits of satellite imagery, only long-term dynamics at landscape- to basin scale of shrub and tree cover can be accurately detected through commonly available remote sensing products without excessive costs. For all these reasons, there is still a lack of knowledge regarding the early stages of the encroachment occurring at small scale, particularly regarding the rate of the process onset and the spatial and temporal distribution of the invasive woody species from the beginning of the process. Indeed, during the first stages of the encroachment, the shrub and tree individuals colonizing the abandoned area are quite small and almost impossible to detect using satellite or airborne data.
In this context, Unmanned Aerial Vehicles (UAVs), which can achieve a very high and flexible spatial resolution, represent a great opportunity to monitor the early stages of the encroachment process and to replace laborious and time-consuming fieldwork. The use of UAVs can be a useful tool for cost-effective land-cover monitoring due to several advantages and in particular extremely high spatial resolution, with a pixel size of a few centimeters, and a potentially high-resolution time-series imagery, thanks to lower deployment and acquisition issues compared to high-resolution satellite imagery. Few studies have used UAV-acquired images to classify vegetation and monitor its dynamics at the community level [44,45,46,47,48,49,50]. However, most of these studies focused on the identification of wide tree canopies or on the detection of invasive alien species [47,48,51,52,53], and only a small number investigated juvenile trees and shrubs and herbaceous plant species at small scale [50,54]. Finally, to the best of our knowledge, none of these studies were conducted in the Alps.
However, image resolution is not the only issue when the analysis focuses on small-grain landscapes. Areas showing small-scale heterogeneity due to the mosaic pattern of shrub and herbaceous formations, which are typical of grasslands under recent encroachment, make the elaboration of accurate vegetation maps more challenging. Indeed, abandoned grasslands evolving into shrublands exhibit high spatial and temporal dynamics, resulting in heterogeneous landscape patterns [41,55]. Furthermore, shrublands are usually composed of various vegetation types, including different shrubs, trees or herbs, where shrubs can be the persistent dominating vegetation type or only a transitional vegetation formation depending on elevation and slope [41,56].
Accurate classification of high-resolution imagery may allow detecting the onset of the encroachment process and the establishment of the first small woody individuals. Since the manual classification of high-resolution drone imagery tends to be laborious and prone to the subjectivity of interpretation, several quantitative approaches have been developed to automate and speed up vegetation classification. Classification accuracy can be affected by the properties and quality of the spectral information [57] but also by the classification approach. If processing very high-resolution data, classifications based on the object-based approach [53,58,59] tend to provide better results than the traditional pixel-based approach [57,60].
Moreover, the UAV approach not only has the potential to substitute laborious ground surveys, but it may also allow collecting frequent time-series data in an easier way. The temporal aspect is very important for encroachment investigation because the analysis of image time-series may help to investigate the temporal patterns of the process and its rate fluctuations. Indeed, there still are unanswered questions about the time frame needed to detect shrub and tree establishment in abandoned semi-natural grasslands and about the effects of climatic fluctuations on the encroachment rate, because of the lack of knowledge regarding the early stages of this ecological process in different climate and vegetation types.
In order to evaluate quantitatively the potential and the advantages of using high-resolution UAV data to monitor the encroachment process during the early stages of its development in a subalpine grassland, in this paper, our aim was to answer the following questions: (1) What is the accuracy of manual photo-interpretation during the early phases of the encroachment? (2) Can pixel- and/or object-based semi-automatic classification methods efficiently replace manual photo-interpretation? (3) What is the size of the smallest tree colonizing the grassland that can be detected by different classification methods? (4) Is it possible to detect a short-term (i.e., less than 10 years) temporal pattern of the encroachment through manual and semi-automatic classification?

2. Materials and Methods

2.1. Study Area and Vegetation Characteristics

The study was carried out in a subalpine grassland in the north-western Italian Alps. The site is an abandoned pasture that was extensively grazed until 2007 and is located in the Aosta Valley region, at a short distance from the village of Torgnon, at an elevation of 2160 m asl (Figure 1). The terrain is characterized by an average slope of 4°, which is south facing (195°), and the soil is classified as Cambisol (FAO/ISRIC/ISS). Furthermore, the site is characterized by an intra-alpine semi-continental climate, with a mean annual temperature of 3.1 °C and a mean annual precipitation of 880 mm. On average, from the end of October to late May, the site is covered by a thick snow cover (90 to 120 cm) which limits the growing period to about 5 months during the year [61].
The study area is occupied by a species-rich Nardus grassland, a priority habitat (6230) listed in the Habitat Directive (92/43/CEE). The dominant vegetation of the area consists of Nardus stricta L., Festuca nigrescens All., Arnica montana L., Carex sempervirens Vill., Geum montanum L., Anthoxanthum alpinum L., Potentilla aurea L. and Trifolium alpinum L. This habitat occurs in almost all the EU member states, except for Estonia, Malta and Cyprus, and more than 40% of its area is located within the Alpine bioregion (Alps, Pyrenees and the Carpathian region), with 23% occurring in Italy [62]. As a consequence of land abandonment, in the last few decades, large areas of mountainous Nardus grasslands evolved into heath or shrub communities or were colonized by forests as secondary succession (i.e., woody plant encroachment) [62]. A simulation study conducted in a French subalpine grassland [27] predicted that abandoned grasslands could turn into woody communities within a few decades, with juveniles of Larix decidua Mill. appearing outside the initial population source after 20 years, and mature trees about 50 years after the land-use change.
Within the study area, the shrub species involved in the encroachment process are mainly Calluna vulgaris (L.) Hull, Juniperus communis L., Vaccinium myrtillus L. and V. uliginousm L. To a lesser extent, there are also individuals of Rhododendron ferrugineum L., Vaccinium vitis-idaea L. and Arcostaphylos uva-ursi (L.) Spreng. Regarding tree species, the area is being colonized only by Larix decidua dispersing from the surrounding forest. In this study, herbaceous and woody species were divided into four vegetation classes that were captured using high-resolution drone imagery: (1) larch trees, (2) brownish and (3) greenish shrubs, and (4) the area dominated by the herbaceous species characterizing the grassland community (Figure 2).

2.2. Image Acquisition

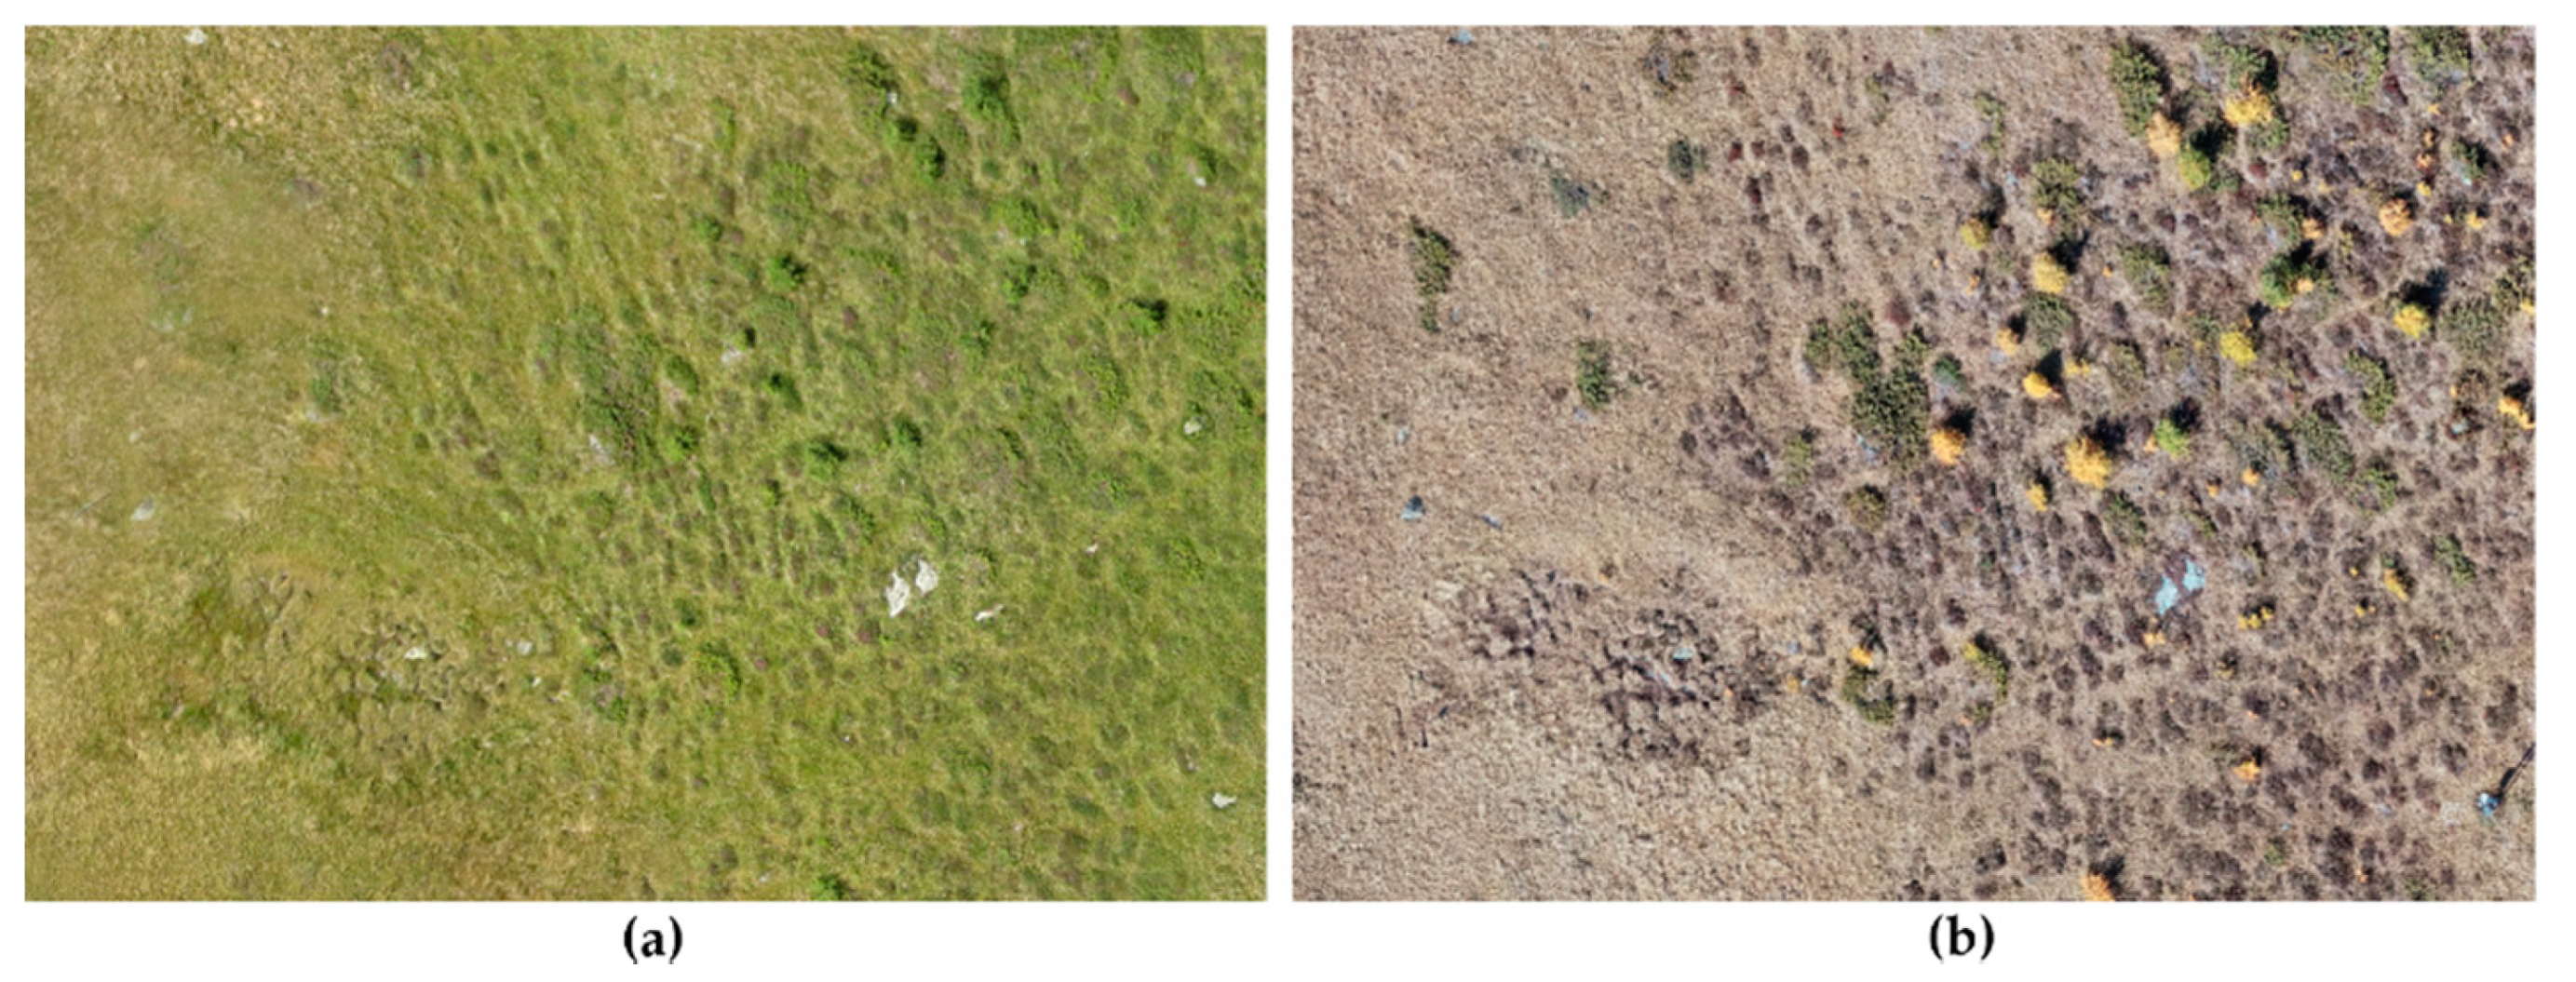
RGB images were acquired in mid-October 2012 and 2018 because the senescent phase, which began in October and lasted for at least four weeks, was considered the best moment to achieve a good classification quality, according to the vegetation phenology. Indeed, at the onset of the growing season in May, the area was mainly grayish and brownish, except for evergreen species such as J. communis, whereas during most of the vegetation growth the whole area appeared green (Figure 3a). On the contrary, in October, during senescence, the highest rate of species differentiation occurred because larches became yellow, C. vulgaris and Vaccinium sp. were brownish, and J. communis remained a green and herbaceous species of the grassland, dominated by N. stricta, which appeared grayish (Figure 2 and Figure 3b).
Flight was carried out with a DJI™ Phantom 4 Pro equipped with a compact camera FC6310 (20 Mpixel; CMOS 1” sensor, FOV 84° and focal length 8.8 mm/24 mm–35 mm format equivalent). The aspect ratio was kept at 3:2 (5472 × 3648 pixels). The images were captured on 4 October, between 1:30 and 1:45 PM. Flight planning was designed with 75% forward overlap and 70% side overlap at ground level. The photogrammetric block consisted of 12 strips (211 images), flown at about 30 m above ground level and at an average speed of 3 m/s, with a GSD of about 1.0 cm. Flight lines were oriented along the North-South direction. Each point in the whole area was covered by >9 images. For external orientation and bundle block adjustment, nine ground control points (GCPs) were marked and measured by using Geomax Z35 Pro GNSS antennas in RTK base-rover mode; the base station was installed on a fixed and known point near the site.

2.3. Photogrammetric Data Processing

All the photogrammetric process was performed in PhotoScan Agisoft software (LLC Company, St. Petersburg, FL, USA), and high-resolution/high-accuracy outputs (DSM and RGB orthomosaic) were achieved. To investigate the image classification accuracy at different resolution levels, the original orthomosaic exported at high spatial resolution (1 cm; HR = high resolution) in 2018, was resized with nearest-neighbor interpolation from its original size (10,109 × 14,952) to medium (2022 × 2990) and low (505 × 748) scale, with a spatial resolution of 5 (MR = medium resolution) and 20 cm (LR = low resolution), respectively (Figure 4). Regarding the 2012, only an LR original orthomosaic was available.

2.4. Ground Truth

To carry out a quantitative comparison between the “ground truth” and the data obtained through different classification methods, we collected data representing ground truth by performing a detailed vegetation survey in mid-October 2018, at the same time as image acquisition. We installed 47 transects 100-m long in the field. Transects were arranged every 3 m from the eastern to the western side of the study area that was located in a Cartesian coordinate system, where y- and x-axis were respectively orthogonal and parallel to the transect direction (Figure 5a). Moving from the axis origin along the x-direction, we recorded the species and length of all the shrub individuals growing below each transect. At the same time, we geo-located all the larches growing on the right side of each transect, using Geomax Z35 Pro GNSS antennas in RTK base-rover mode, and for each individual, we measured trunk diameter at ground level and maximum height and mean canopy width. Therefore, at the end of the survey, we obtained a list including all the larches growing within the study area with their dimensions and all the shrubs intersecting transects with information about their species and length. This data was used, firstly, to estimate a dimensional threshold for larch identification through different methods and, secondly, to compare the linear percentage cover of shrub species obtained using transects, with their area percentage cover obtained by photo-interpretation.

2.5. Reference Data: Sampling and Response Design

To obtain high-quality reference data for classification accuracy assessment, other types of surveys were carried out in the field at the same time as image acquisition. In these cases, sample locations were identified using a stratified random sampling. The study area was divided into two discrete strata: grassland and shrubland, respectively dominated by herbaceous and woody plant species. The sample size for reference data was set to n = 120, after calculation through the following formula proposed by [63], which returned the minimum number of reference samples that are requested to achieve a specific overall accuracy (Equation (1)):
n = ( W i S i ) 2 [ S ( Ô ) ] 2 + ( 1 N ) ( W i S i ) 2 ( W i S i ) 2 [ S ( Ô ) ] 2
where N is the number of units in the map data, Ô is the standard error of the estimated overall accuracy that we would like to achieve, Wi is the mapped proportion of the area of class i, and Si is the standard deviation of stratum i. Because N is typically a very large number, the second term in the denominator of Equation (1) can be ignored. The standard error of the estimated overall accuracy was set to 0.01, according to the values for target standard error suggested by [64]. The user’s accuracy was set to 0.98 for both shrubland and grassland stable strata. Sample allocation was carried out taking into account the mapped proportion of each stratum and their heterogeneity, so that 40 and 80 samples were randomly located, respectively, within the grassland and shrubland stratum. A minimum distance of 10 m was maintained among all the samples. We used pixels as the spatial unit of the sampling data. The minimum mapping unit (MMU) of the reference data was set to 100 cm2. Regarding the collection of reference data, we labelled the 120 sample plots, assigning to each sample one of the four vegetation classes used in this study (Figure 2) by means of observation in the field. Furthermore, we geo-located the sample plots using Geomax Z35 Pro GNSS antennas in RTK base-rover mode to obtain high-quality spatial locations of the reference data (Figure 5b).

2.6. Image Classification

Image analysis was carried out using two different approaches: (i) visual photo-interpretation by a user expert on the study area and (ii) semi-automatic classification.
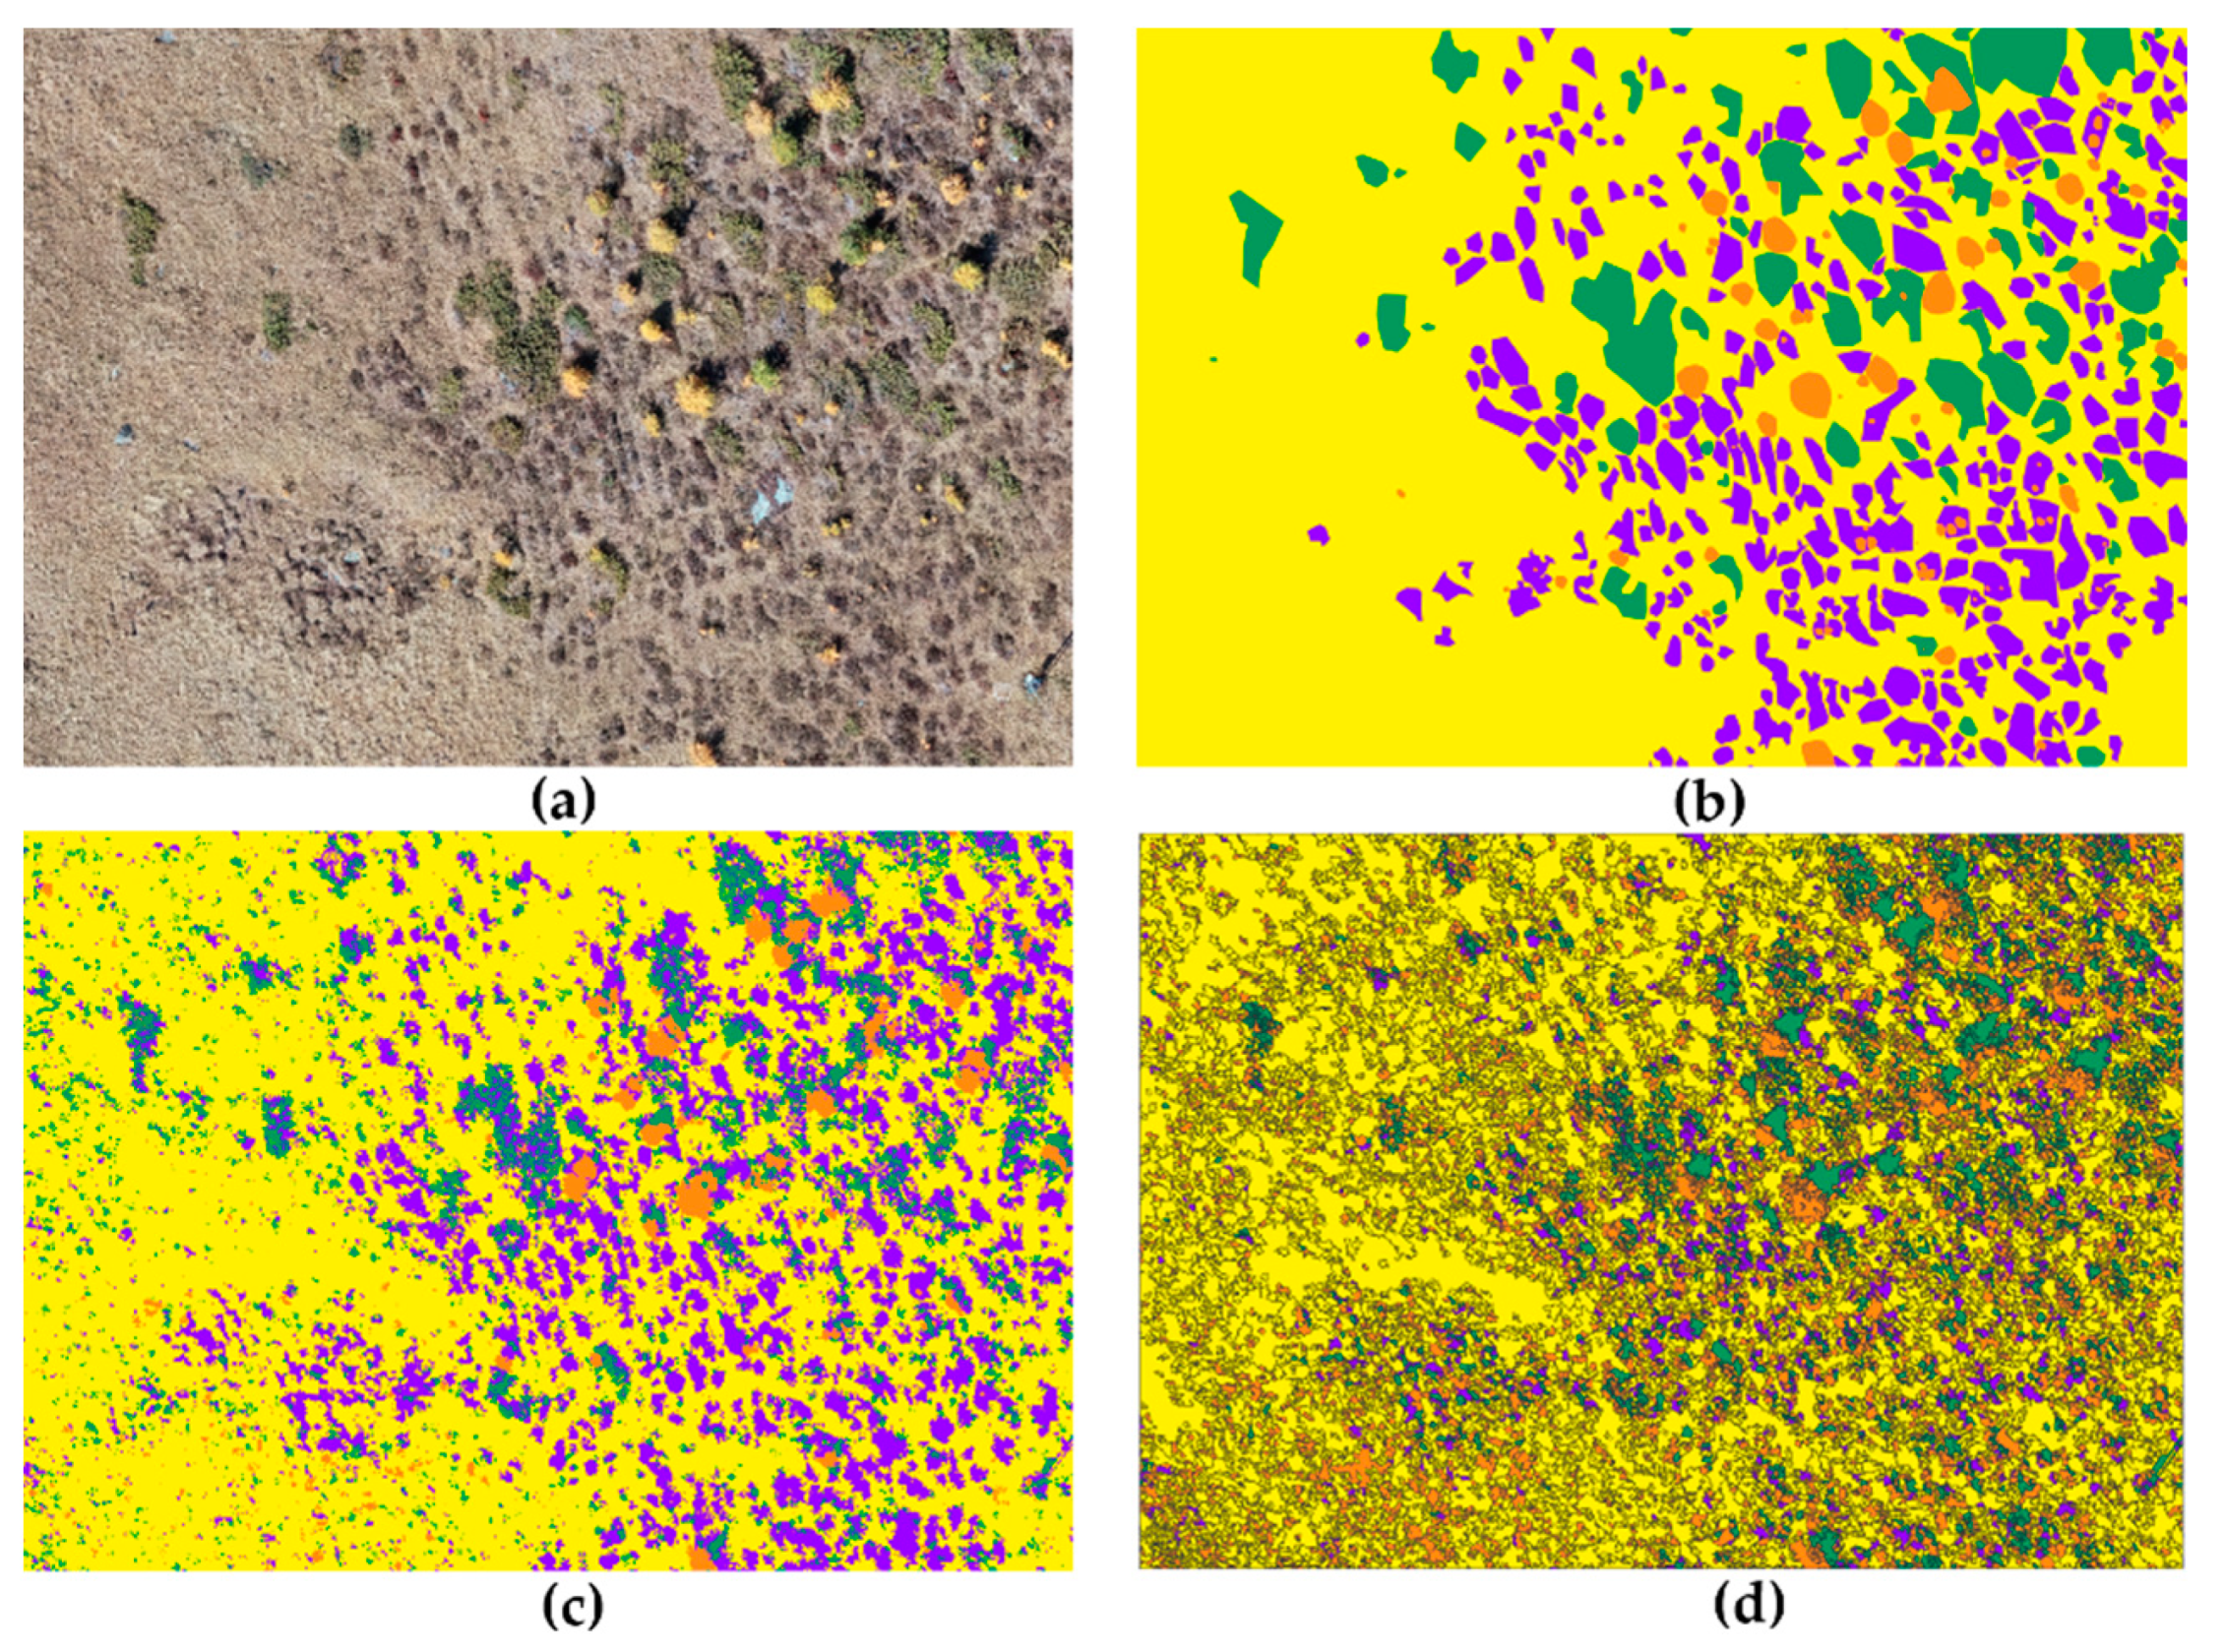
Photo-interpretation (PI) was manually carried out in QGIS 3.10.1 (QGIS Development Team, 2019) [65] by an operator interpreting the images according to their knowledge of the vegetation in the area. The operator created a one-point vector layer for larches (i.e., one point for each larch location) and one polygon vector layer for larch crowns and shrubs (Figure 6b). The number of classes was set to four, according to the number of classes detected by the PI: (1) larches, (2) brownish shrubs, mainly represented by C. vulgaris, V. uliginosum and V. myrtillus, (3) greenish shrubs, including the evergreen species J. communis and R. ferrugineum, and (4) grassland. In order to estimate the size threshold for larch identification, the operator matched the locations of the photo-interpreted larches with field data. Furthermore, the PI was carried out on LR and HR images, to assess the effect of pixel dimension on classification accuracy.
Semi-automatic classification was performed in the QGIS 3.10.1 environment, using a machine learning approach and making use of the algorithms available in OTB 7.1.0 (Orfeo ToolBox) and SCP 6.4.6 (Semi-automatic Classification) plugins. We carried out pixel-based (PBC) and object-based (OBIA) classifications (Figure 6c,d) of HR, MR and LR images. To perform PBC and OBIA, we used Random Forest (RF) [66] classification models, based on several studies that highlighted the efficiency and power of RF approaches in the classification of remote sensing imagery, e.g., [67,68]. In general, RF classifiers were used with satisfactory results in several mapping applications for different vegetation types, such as bog communities [69], invasive plant species [70] and, especially, for heterogeneous categories such as shrublands [71] and grasslands [46], which are the most difficult to classify. Moreover, RF classifiers were compared to other classifiers, such as support vector machine (SVM) and AdaBoost, which in some cases showed similar or even a higher classification accuracy [72,73,74,75]; RF classifiers are more user-friendly, and the algorithms are faster to train and more stable. We set model parameters as follows: maximum depth of the tree = 5; minimum number of samples in each node = 10; cluster possible values of a categorical variable into K = 4; maximum number of trees in the forest = 500; sufficient accuracy (OOB error) = 0.01; training and validation ratio = 0.8. RF models, were trained with five training regions per class. To obtain random training regions, random points were generated across the whole area, avoiding the overlap with the 120 plots constituting the reference data (see Section 2.5), and were manually labelled, according to the four vegetation classes described above. Afterwards, the training regions (hereafter ROI) were manually drawn around five points per class, randomly selected among all the manually labelled points.
Six RF models were trained (3 × 2), one for each resolution level and one for each of the two different types of image: (1) original and (2) smoothed. We obtained the second type of image by running an iterative edge-preserving image smoothing algorithm, which, for any given pixel of the input image, returned a filtered value corresponding to the average spectral signature of the neighborhood pixels, that are both close in space and spectral signatures. More precisely, neighborhood pixels are those pixels spatially closer than the spatial radius parameter (spatialr), that in this study was set to 5, 20 or 100, respectively for low-, medium- and high-resolution images, and with spectral signature having Euclidean distance to the input pixel lower than the range radius (ranger) that was set to 15. Regarding OBIA, an additional step to obtain image objects was carried out, producing a segmentation for both original and smoothed images. Segmentation was performed in the Monteverdi module of Orfeo ToolBox repository and consisted of three steps: (i) smoothing (LSMSSegmentation), with the same parameters described above, (ii) small region merging (LSMSSmallRegionMerging), with a threshold value of 1, 16 and 400 pixels, respectively, for low-, medium- and high-resolution images, and (iii) vectorization (LSMSVectorization) to obtain mean and standard deviation values of the three bands for each image object. The threshold values for the region merging were set up according to the image resolution, in order to create objects with a fixed minimum surface area of 400 cm2, which corresponds to the pixel area of the image at the lowest resolution (i.e., 20 cm). All these steps were made starting from HR, MR and LR images, which were then classified by means of an RF model, trained with five ROIs per class, as mentioned before.
The accuracy assessment was carried out in two steps on both “raw” and “cleaned” classification maps. A first accuracy assessment was preceded immediately by the classification process performed through the PBC and OBIA. Afterwards, all the classification maps obtained through PBC were post-processed to “clean” the classification output and try to improve the classification accuracy, which was assessed again thanks to a second accuracy assessment. Post-processing included raster filtering of PBC maps with a threshold value of 1, 16 and 400 pixels respectively for LR, MR and HR images. This step of the analyses aimed at reducing the potential salt and pepper effect (i.e., noise consisting in a scattered occurring of black and white pixels due to transmission errors) or the presence of noise due to small shadows in the raw classification maps, and at quantifying the effect of the filtering algorithm on the classification accuracy. The filtering step was not performed on OBIA classification maps where the same thresholds were already applied through the small-region-merging step. The whole workflow of image classification through the three methods described above was outlined in Figure 7.
Once we obtained the classification maps and performed the accuracy assessment, we compared, firstly the accuracy metrics of the three classification methods (i.e., PI, PBC and OBIA) and, secondly, the accuracy metrics obtained at different resolution levels. Moreover, to answer our question about the opportunity for using semi-automatic classification for the detection of encroachment advance over time, the three classification methods described above were also applied on the LR image of the study area acquired by drone in October 2012. The image was photo-interpreted by the same operator as before and then classified using the two most accurate models identified among PBC and OBIA models trained on LR images. Afterwards, the classification maps of 2012, obtained through the three different methods, were compared with the classification maps obtained through the same three methods applied on LR images of 2018 and a map of land cover change was generated for each classification method (see Figures S2–S7 for land cover change and classification maps).

2.7. Analyses

The accuracy of each map classification, obtained through photo-interpretation and semi-automatic classification methods, was assessed with the algorithms available in SCP 6.4.6 (Semi-automatic Classification) plugin, which were used to derive three accuracy parameters from an area-based error matrix: (1) the Overall Accuracy (OA), indicating the proportion of the reference plots that was correctly mapped; (2) the Producer’s Accuracy (PA), that is, the proportion of the area of reference class j that was mapped as class j; and (3) the User’s Accuracy (UA), that is, the proportion of the area mapped as class i that had reference class i. Assuming that, in the error matrix, pij represents the proportion of area that has map class i and reference class j, for an error matrix of q classes, the overall accuracy is
O A = j = 1 q p j j
whereas producer’s accuracy of class j and user’s accuracy of class i are respectively calculated with Equations (3) and (4):
P j = p j j / p j
U i = p i i / p i
Finally, we performed the non-parametric Mann–Whitney’s test (95% CI) to investigate the differences between the dimensions of the larches surveyed in the field and correctly classified or misclassified through the different methods. All the analyses, maps and graphs were produced in R 3.5.1 and QGIS 3.10.1. In particular, accuracy assessment was performed using the algorithms available in SCP 6.4.2 (Semi-automatic Classification Plugin).

3. Results

3.1. Photo-Interpretation

The photo-interpretation (PI) of the low-resolution (LR) image, acquired in mid-October 2018, allowed us to detect and correctly classify 135 larches (CC-larches), corresponding to 25.4% of the 531 ground-surveyed larches (GS-larches), identified and measured in the field). The dimension of the CC-larches significantly differed from the GS-larches, in terms of trunk diameter, maximum height and mean canopy width. More precisely, the population of CC-larches showed higher trunk diameter (p < 0.001), maximum height (p < 0.001) and mean canopy width (p < 0.001) compared to the GS-larches (Table 1).
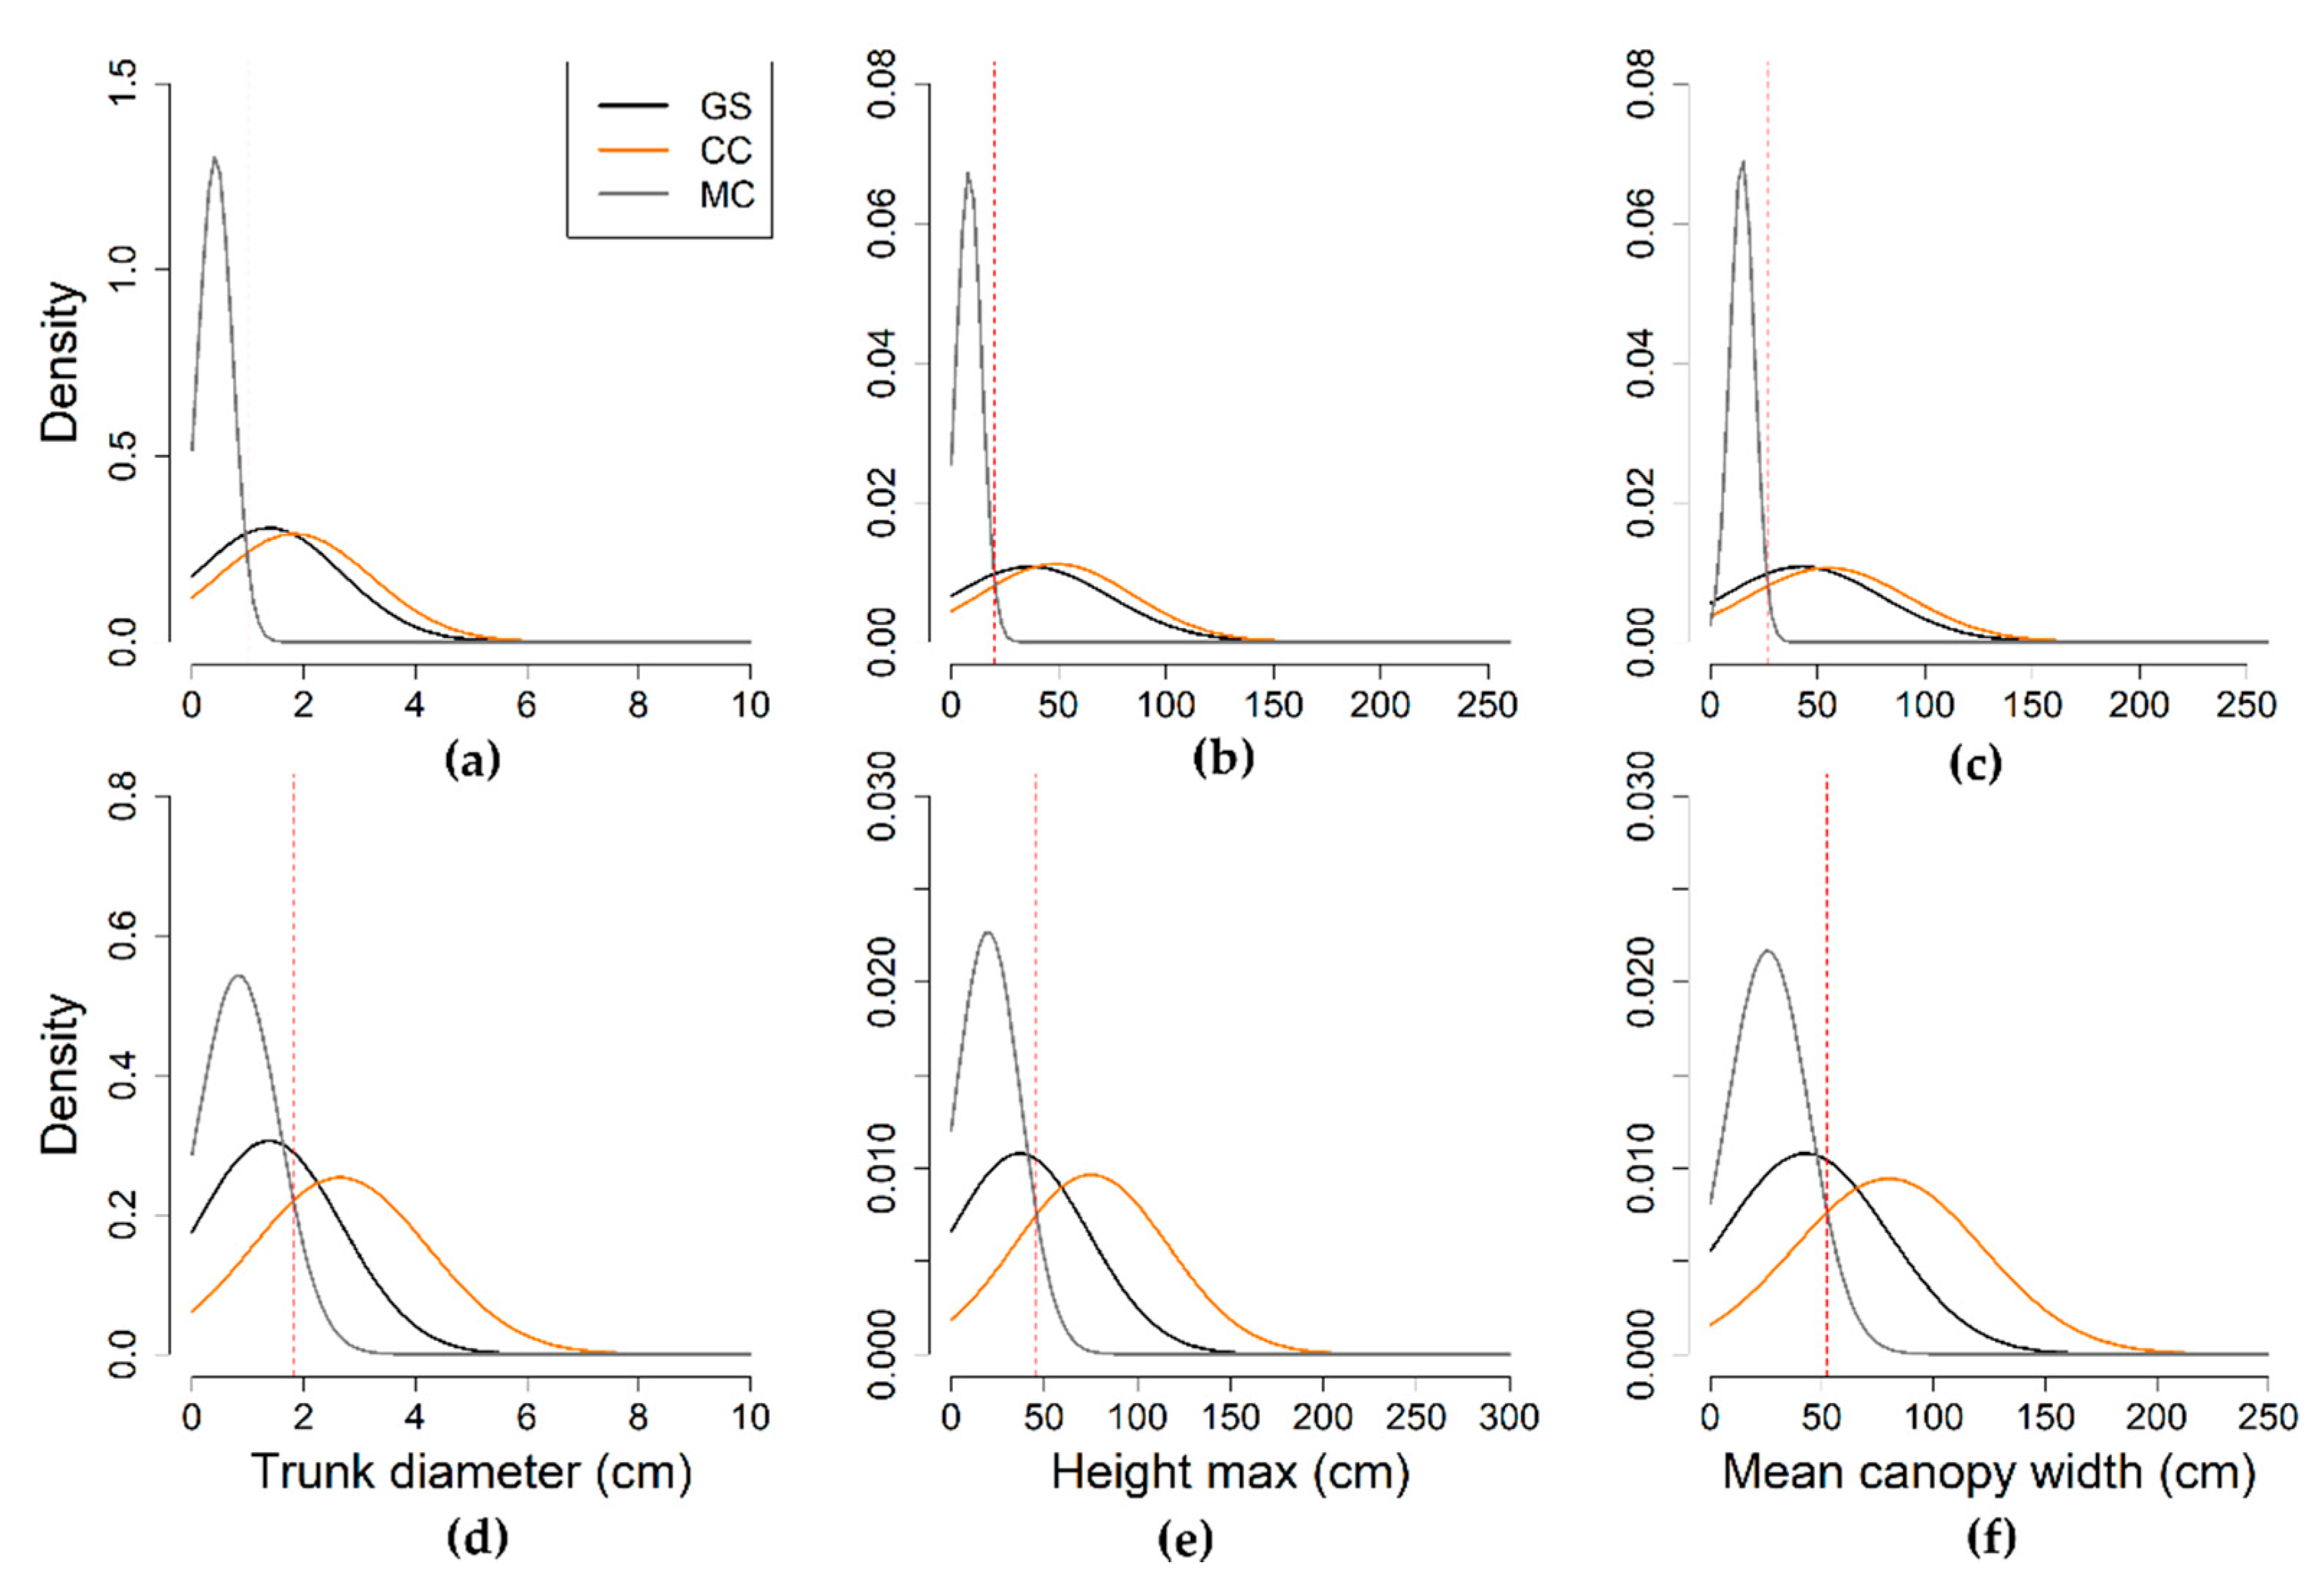
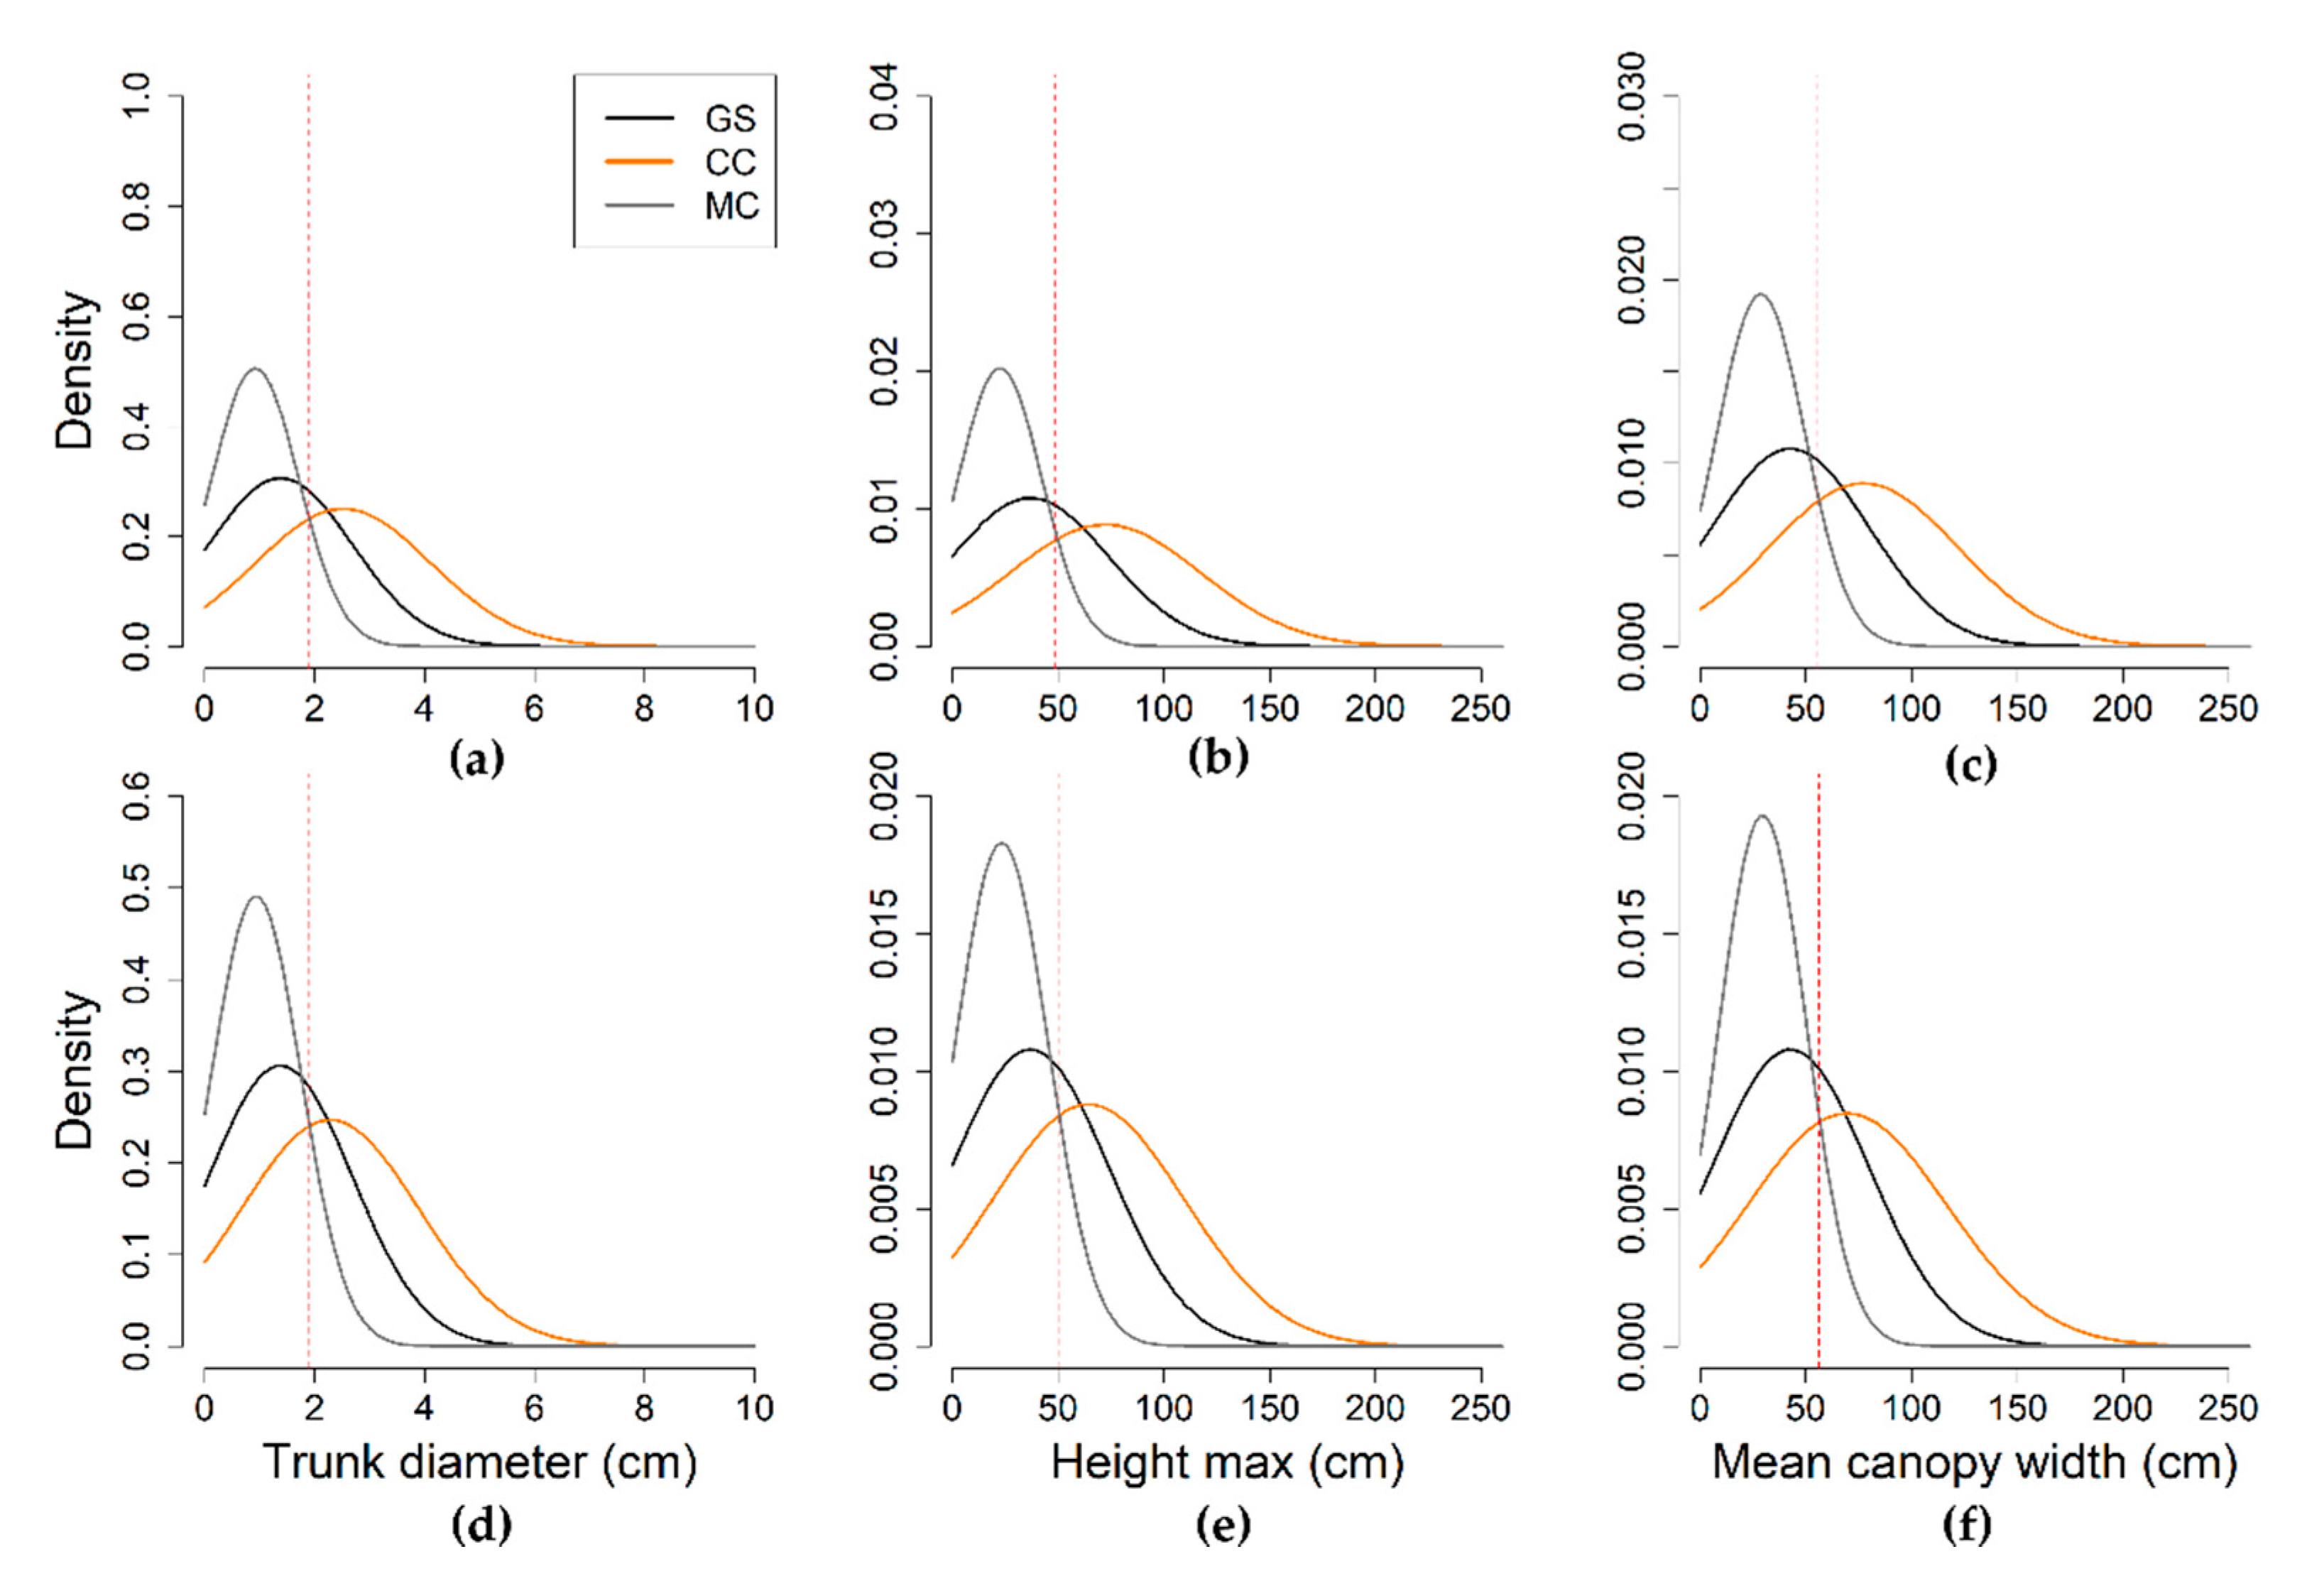
The undetected larches were sorted into two groups according to their position relative to the other larches: isolated and grouped larches. This classification allowed us to discriminate between larches that were not detected because of their small size and larches that were undetectable since they were part of a group, where distinguishing the individual canopy borders was not possible from the image. This latter type of larches was excluded from the analyses that we performed to define the PI resolution threshold. Among the 396 larches that were not detected through the photo-interpretation, 84.6% (n = 335) were isolated and not detectable due to their dimensions and were consequently misclassified (hereafter MC-larches). These MC-larches were used to define the PI resolution threshold. The MC-larches, as a subset of the GS-larches including the smallest individuals, were significantly smaller compared to all the GS-larches, in terms of trunk diameter (p < 0.001), maximum height (p < 0.001), and mean canopy width (p < 0.001) (Table 1). The intersection between the density curves of CC- and MC-larches was used to define the threshold of the PI efficiency or, in other words, the size limit between detectable and undetectable larches. According to this approach, the threshold was set at 1.8 cm of trunk diameter, 45.7 cm of maximum height and 52.1 cm of mean canopy width (Figure 8a–c), meaning that the photo-interpretation of low-resolution (20 cm) images cannot guarantee the detection of larches smaller than this size.
Regarding the high-resolution (HR) image, 320 larches (60.3% of the GS-larches) were manually detected during the photo-interpretation. Similar to what we observed for the LR image, the dimension of the CC-larches differed significantly from the dimension of the GS-larches, in terms of trunk diameter, maximum height and mean canopy width. More precisely, the population of CC-larches showed higher trunk diameter (p < 0.001), maximum height (p < 0.001), and mean canopy width (p < 0.001) compared to the GS-larches (Table 1 and Figure S1a–c).
On the other hand, 39.7% (n = 229) of the GS-larches were not detected through PI. As seen above for the LR image, we selected the 134 isolated larches (58.5% of all the not-detected larches) that were not detected due to their small size and thus misclassified (MC-larches) and used them for further analyses. The MC-larches, as a subset of the GS-larches including the smallest individuals, were significantly smaller than the GS-larches, in terms of trunk diameter (p < 0.001), maximum height (p < 0.001) and mean canopy width (p < 0.001) (Table 1 and Figure S1a–c). For the HR image, the PI threshold was set at 0.9 cm of diameter, 20.3 cm of maximum height and 26.5 cm of mean canopy width (Figure 8d–f), meaning that the PI of HR images cannot guarantee the detection of larches smaller than this size, that was much lower than the PI threshold of the LR image.
Regarding shrub species, since discriminating the species of the shrubs with similar color was nearly impossible without the support of a “ground truth”, especially on the LR image, the shrubs that were included in the two classes distinguishable by color were: (i) brownish shrubs, including C. vulgaris + Vaccinium ssp., and (ii) greenish shrubs, including J. communis + R. ferrugineum, which correspond respectively to “Class 2” and “Class 3” of the classification categories.
The area of the polygons created around the detected shrubs was calculated to estimate the percentage cover of each class, which was then compared to the linear percentage cover obtained through the vegetation survey. We observed that the percentage cover of the two shrub classes within the study area was greatly similar to the linear percentage cover along transects. More specifically, brownish shrubs showed a linear percentage cover of 5.6% and a surface area of 5.4% or 8.1% obtained through the PI of, respectively, the LR and HR image, whereas greenish shrubs showed a linear percentage cover of 4.2% and 4.0% or 4.4% obtained through the PI of, respectively, the LR and HR image. Moreover, “Class 1” including larches and “Class 4” including areas dominated by herbaceous species showed a percentage cover of, respectively, 0.6% and 90.0% as resulted from the PI of the LR image and a percentage cover of, respectively, 0.7% and 86.8% as resulted from the PI of the HR image (Table S3).
Finally, the accuracy assessment of the PI against reference data showed an Overall Accuracy (OA) of 88.5% and 99.3%, respectively, for the PI of the LR and HR image. All the other accuracy metrics are reported in Table 2.

3.2. Semi-Automatic Classification Methods

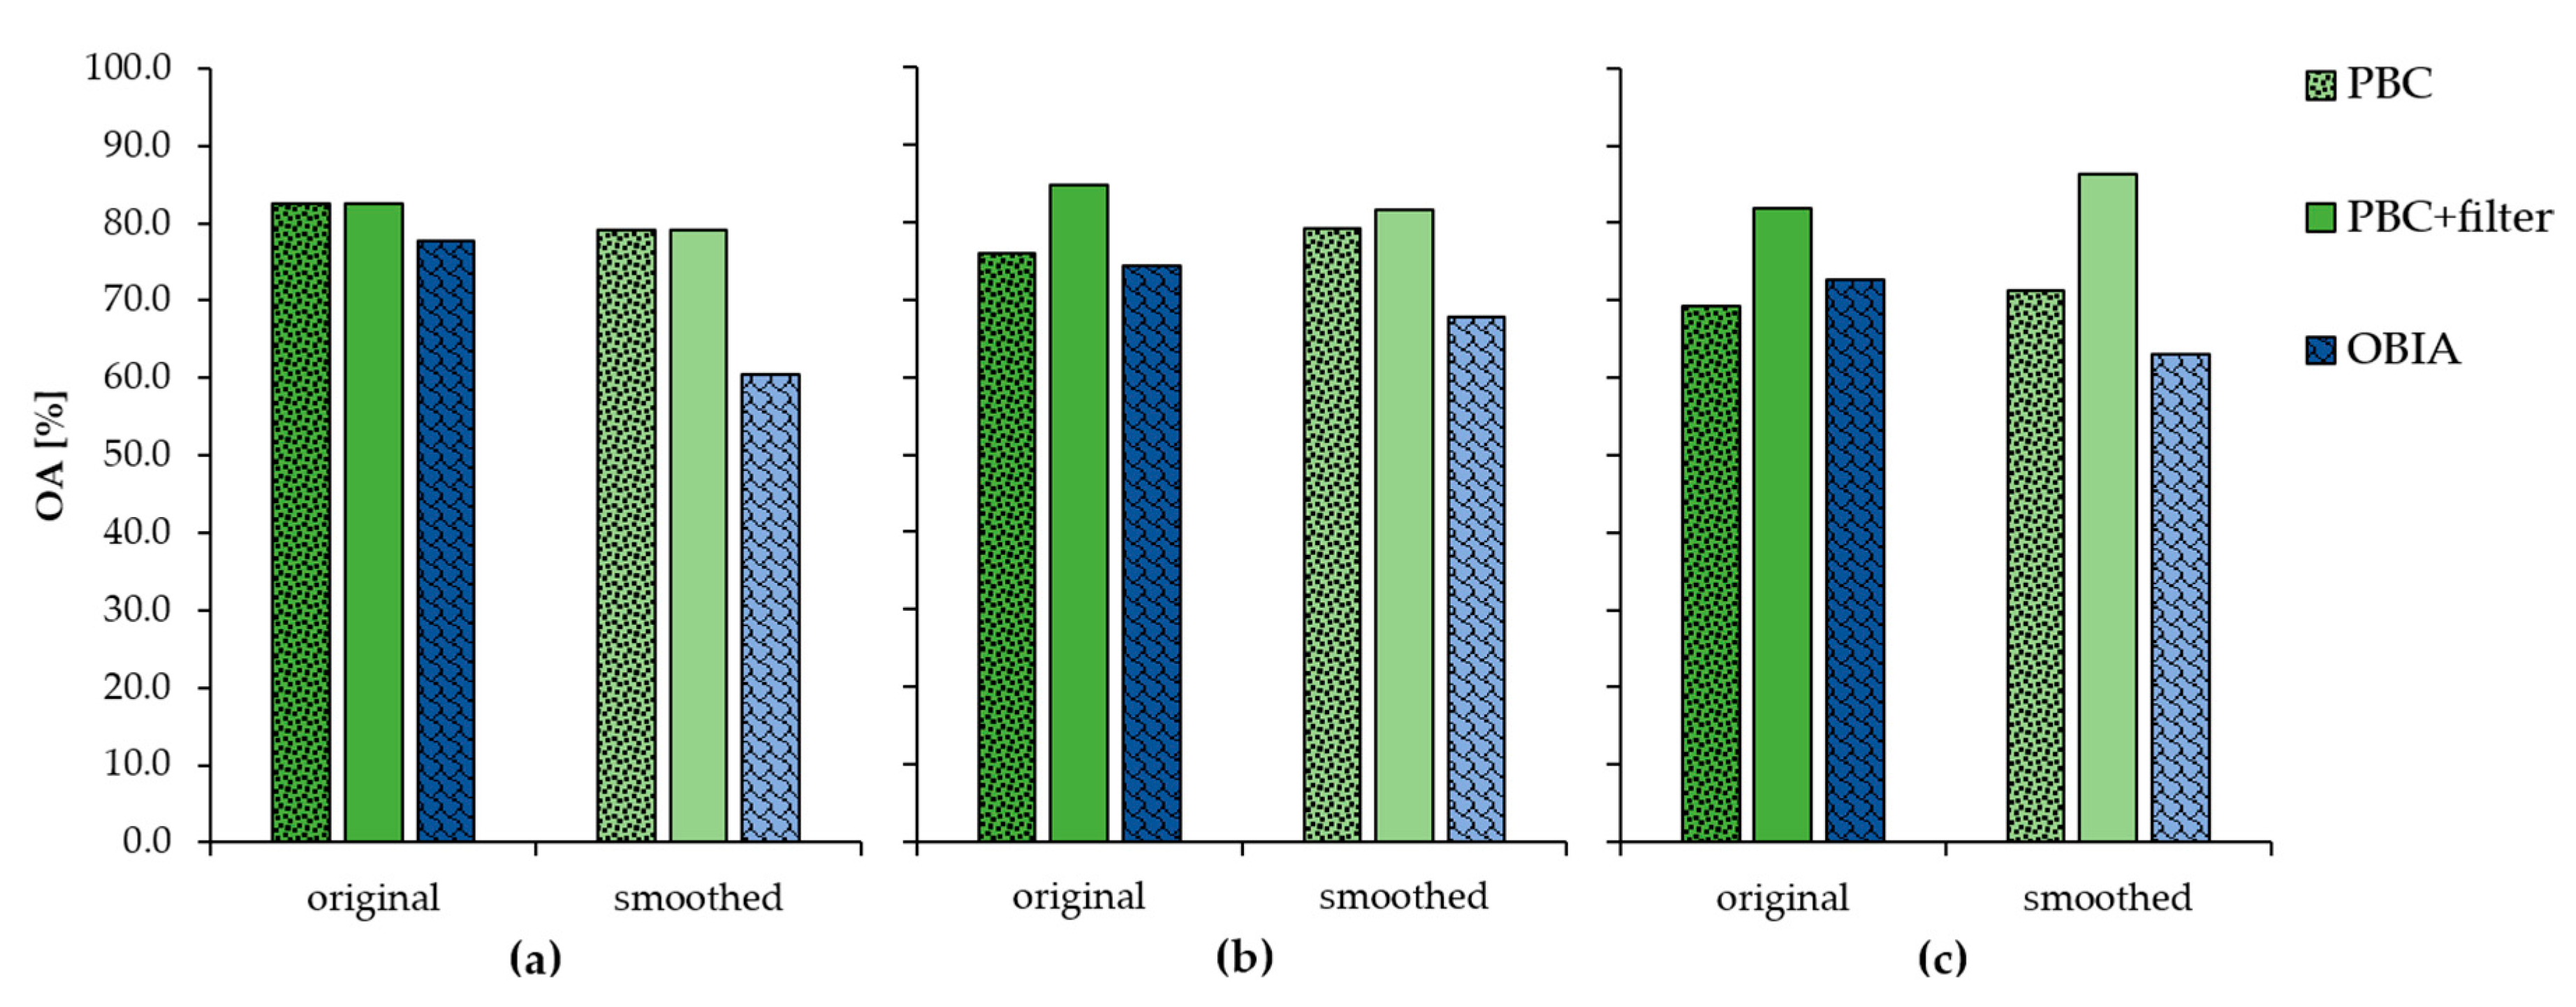
The PBC method was more accurate than the OBIA approach for the classification of the images at all the resolution levels and for both the original and smoothed images. Moreover, the highest accuracy was observed for the PBC followed by the filtering of the classification maps. We found that the filtering step was able to increase the classification accuracy of all the PBC models by 3% to 15%. In particular the most accurate classification was the one performed through the PBC method followed by filtering on the HR smoothed image, which showed an overall accuracy of 86.3%. On the other hand, the highest accuracy reached by OBIA models was 77.7% (Figure 9 and Table S2).
Generally, the effect of the image smoothing on the performance of the PBC models was positive for the classification of the HR image and negative for the LR image, respectively increasing and decreasing the overall accuracy of the classification of 2% to 5%. OBIA models did not show any positive effects of the smoothing process and showed higher values of overall accuracy when applied to the original images (Figure 9 and Table S2).
Regarding single classes, in general, “Class 1”, including larches, showed the lowest values of the producer’s accuracy (PA) and the highest values of the user’s accuracy (UA), in both PBC and OBIA classification maps. As shown by the area-based error matrices of the three-best-performing PBC models (highlighted in grey in Table S2), the most common error was the misclassification of the larches (“Class 1”) as grassland (“Class 4”). This observation was confirmed also for the OBIA classification maps that additionally showed a recurring misclassification between brownish (“Class 2”) and greenish (“Class 3”) shrubs.
According to Table S3, the percentage covers of each class obtained by the best performing PBC model were 0.4% for larches (“Class 1”); 12.8% and 1.5%, respectively, for brownish and greenish shrubs (“Class 2” and “Class 3”) and 85.3% for the herbaceous cover of the grassland (“Class 3”) (Table S2). Regarding larches, we found that only 28.8% of the GS-larches showed greater dimensions (Figure S1d–f) and were correctly classified by the PBC. We then compared the dimensional parameters of correctly classified and misclassified larches, and we extrapolated the classification threshold, as done before for photo-interpretation. The results of this analysis highlighted that PBC was not able to correctly classify larches smaller than 1.9 cm of diameter, 48.8 cm of maximum height and 55.5 cm of mean canopy width (Figure 10a–c). On the other hand, the percentage covers of each class, obtained by the best performing OBIA model according to Table S3, were 4.1% for larches (“Class 1”); 4.2% and 8.3%, respectively, for brownish and greenish shrubs (“Class 2” and “Class 3”) and 83.4% for the herbaceous cover of the grassland (“Class 3”). Regarding larches, we found that only 33.0% of the GS-larches showed greater dimensions (Figure S1g–i) and were correctly classified by OBIA, and that this method was not able to correctly classify larches smaller than 1.9 cm of diameter, 50.0 cm of maximum height and 56.1 cm of mean canopy width (Figure 10d–f).

3.3. Land Cover Change

The map of land cover change obtained by the PI of the LR images acquired in 2012 and 2018 showed an increase of the shrubland cover on the grassland area of 6.5%, whereas 6.7% of the shrubland cover already observed in 2012 remained constant (Table 3). Considering the area that changed from shrubland to grassland cover, mainly due to the limits of the classification method, these results led to a general increase in the shrubland cover of 4.3%, from 8.9% in 2012 to 13.2% in 2018, while grassland cover decreased from 91.1% to 86.8% (Table 3). The most accurate pixel-based classification model was not able to detect this trend of change and, on the contrary, showed a substantially unvaried land cover, with 24.6% of shrubland cover in 2012 and 23.6% in 2018 (Table 3). Similar results were observed for the most accurate object-based classification model that even showed an increase of grassland cover, from 79% to 83.3%, and a consequent decrease of shrubland cover, from 21% to 16.6% (Table 3).

4. Discussion

This study described the application of UAV-acquired imagery to the monitoring of the early stages of shrub and tree colonization (i.e., woody encroachment) of an abandoned subalpine grassland that was previously grazed by cattle, keeping the area “clean” from woody plant species. In particular, we achieved the goal of describing a straightforward workflow for an accurate, cost-effective and readily accessible image classification approach based, with manual or semi-automatic techniques, which were applied at a very fine scale (<10 cm). The results showed that RGB images acquired at the resolution of 1 to 20 cm are adequate for mapping vegetation, at least at the life-form level (i.e., tree, shrub and herbaceous species), without the support of any other information concerning spectral resolution or object texture. Indeed, we reached good automated classification performance, with the most accurate model showing an overall accuracy of ~86%.
Among the three classification methods evaluated in this study, i.e., manual photo-interpretation, pixel- and object-based semi-automatic classifications, the former showed the best performance at both high (1 cm) and low (20 cm) resolution, with an overall accuracy of 99.3% and 88.5%, respectively. Thus, the accuracy level of the photo-interpretation was high and increased by more than 10%, moving from a resolution of 20 cm to 1 cm. On the contrary, we observed that the overall accuracy of the raw (i.e., not filtered) pixel-based classifications generally increased with decreasing image resolution, from a minimum of 69.2% (high resolution) to a maximum of 82.5% (low resolution). Despite the high-quality classification, this observation confirmed that pixel-based classification methods may run into several constraints when they are applied to very high spatial resolution imagery, for the occurrence of noise due to a salt-and-pepper effect or to the presence of small shadows, e.g., [52], as we observed in our study. Generally, our pixel-based classification models misclassified shadows projected by larches and other smaller shadows within the herbaceous cover as brownish or greenish shrubs (“Class 2” and “Class 3”). This misclassification led to an overestimation of the corresponding classes and generally of the shrub cover, as found also by Poznanovic et al. [76], who observed an overestimation of the western juniper cover in their study area, when performing pixel-based classification. The effects of the misclassification in the high-resolution image were limited by the application of a simple filtering algorithm that increased the accuracy of the high-resolution classification map from 71.3% to 86.3%. The overall accuracy values achieved in our study (i.e., >80%) were consistent with recent studies focused on pixel-based classification of satellite images to determine the vegetation cover of herbaceous-dominated areas under woody encroachment [77,78]. Moreover, to the best of our knowledge, only one recent study used very-high-resolution UAV imagery (2.4 cm) and pixel-based classification methods to investigate shrub encroachment directly, in a watershed dominated by perennial grasses [79]. Similar to our study, Durfee et al. [79] used data collected in the field to assess the overall accuracy of their classification, which was 76.6% for the RGB imagery. These results are not only in accordance with our study but helped us to demonstrate that high resolution UAV imagery can be a successful tool for reaching high levels of accuracy, even with simple RGB images.
According to the literature, some of the limitations of pixel-based classification methods can be overcome using an object-based approach, whose minimum processing unit is an object (or segment) instead of a pixel. Several studies demonstrated that object-based classification models can successfully classify very high spatial resolution imagery [52,80], but the choice between pixel- or object-based approaches does not follow rigid rules and depends on the aims of the study and on several characteristics of the available data and the study area, such as vegetation type and phenology, land cover heterogeneity and imagery features [52,81,82,83]. For instance, in their study on grassland colonization by Juniperus virginiana in Nebraska, Filippelli et al. [84] showed that the object-based approach had the lowest error when the cover of the target vegetation was less than 10% and maintained a low number of errors, up to cover levels of 30%. On the other hand, alternative pixel-based methods, which are less dependent on the object-background contrast, performed better in areas with a high vegetation cover (>60%) [76]. According to these observations, the object-based approach was less suitable than the pixel-based approach for the classification of our study area, characterized by a target vegetation cover of nearly 100%. Indeed, the highest overall accuracy reached by this method was 77.7% in our study. This outcome was consistent with the results of the study performed by Ma et al. [82]. In their meta-analysis, they showed that land-cover type and heterogeneity had a significant effect on object-based classification accuracy, with vegetation and forest showing lower accuracy than other categories, such as agriculture and wetland study areas, and with more homogeneous areas showing higher accuracy than heterogeneous ones. Similar to what we observed for pixel-based classifications, the overall accuracy of object-based classifications decreased with increasing image resolution. Moreover, we found that the images that underwent a smoothing step were classified with higher accuracy than the original images by the pixel-based classification models, whereas the opposite trend was observed for the object-based classification models. All these observations can be explained considering that image smoothing and resizing likely helped the pixel-based models in reducing error-rates generated by salt-and-pepper noise and small shadows. On the other hand, image smoothing flattened the spectral differences among the pixels and consequently hampered the image segmentation and the object creation.
A notable aspect of our study is that the testing of different image classification methods was not exclusively focused on the categorical aspects of the classification, like it is in most of the available literature about remote sensing applications for encroachment monitoring [40,41,85]. Instead, we used the field measurements of the larch dimensions (i.e., trunk diameter, maximum height and mean crown width) to evaluate a quantitative threshold of tree detection. In other words, by knowing the dimension of all the larches occurring within the grassland, we were able to determine not only the percentage of detected larches but also the smallest larch size that could be detected by each method. Among the three-dimensional variables that we measured in the field, the mean crown width was undoubtedly the most important parameter, having a crucial role in larch detection. Similar to what we observed in the classification accuracy, the photo-interpretation of the high-resolution image showed the best performance, being able to detect very small larches to a threshold of 0.9 cm of diameter, 20.3 cm of maximum height and 26.5 cm of mean canopy width. The minimum dimensions of detectable larches sharply increased for the photo-interpretation of the low-resolution image, which showed a threshold value of about twice as high as the one reported above, of 1.8 cm of diameter, 45.7 cm of maximum height and 52.1 cm of mean canopy width. This implies that, by moving from a resolution of 1 cm to a resolution of 20 cm, the photo-interpretation efficiency in tree detection was at least halved. In general, the cut off size of tree detection in our study was lower than the size of all the studies we were able to find in literature, e.g., [76,81,83,86], where the canopy area of non-detected shrubs and/or trees ranged from 1 to 1.6 m2. Interestingly, we found that the threshold values of the most accurate semi-automatic models were very close to the values observed for the photo-interpretation of the low-resolution image, which means that the performance of the semi-automatic classification models in larch detection was comparable to the classification carried out by the operator on the low-resolution image. In fact, the photo-interpretation of the low-resolution image was able to detect 25.4% of the field-surveyed larches, whereas the best performing pixel- and object-based classification models detected, respectively, 28.8% and 33.0% of all the larches occurring in the study area.
However, although the percentage of the larches detected by the semi-automatic classification was similar or even higher than the percentage of the larches detected by the photo-interpretation, the former method underestimated the tree cover by 0.4% when the pixel-based classification was applied and overestimated by 4.1% the same class in the case of the object-based classification when compared to the photo-interpretation (0.7%). A similar trend was observed for the shrub species, whose percentage cover was overestimated by 5.3% and 3.5%, respectively, by the pixel- and the object-based classification. Considering the percentage cover of all the woody plant species (i.e., larch + brownish shrubs + greenish shrubs) and taking the 9.7% of cover detected by the high-resolution photo-interpretation as a reference value, we observed that the overestimation increased from 13.2% of the low-resolution photo-interpretation to 14.7% and 16.6% of the pixel- and the object-based classification, respectively. This overestimation of the larch and shrub cover was the most likely reason why both the semi-automatic classification methods were not able to detect the land cover change occurring in the last six years, from 2012 to 2018. This can be explained by the fact that, even if the overall accuracy of the semi-automatic classifications was quite high, the omission error of the models was still higher than the percentage of the land cover change in terms of tree and shrub cover percentage. Furthermore, the differences between 2012 and 2018 in image acquisition and features likely increased the error in the estimation of the land cover change. Unfortunately, a high-resolution image of 2012 was not available and neither was a simultaneous vegetation survey, so that we could not properly investigate the accuracy of the photo-interpretation in the detection of the land cover change. For these reasons, we recommend further studies on the efficiency of different image analysis methods in the detection of the early stages of land cover change, due to encroachment. Nevertheless, according to the overall accuracy of the photo-interpretation, we suggest using this method rather than semi-automatic classification when investigating short-term (<10 years) or slow-rate changes of the land cover (1–10%) or generally when the expected land cover change to be smaller than the omission error of the semi-automatic classification models to be applied. Finally, according to the results of photo-interpretation, the encroachment rate in the study area from 2012 to 2018 was ~1% per year, in terms of tree and shrub cover expansion. This result is consistent with other studies which found that the increase of woody species cover due to the encroachment process ranged from 0.9% to 2.3% per year [10,84,87].
Therefore, we demonstrated that RGB images acquired by drone at a resolution of 1 to 20 cm can be readily and accurately (overall accuracy > 80%) classified through a pixel-based approach, in order to investigate the vegetation cover of a subalpine grassland under recent encroachment. This method outperformed the object-based classification under the circumstances of our study, requiring a very fine scale classification. Although it was not an objective of this study, we hypothesized that the accuracy of the object-based classification could be improved by setting a smaller spatial radius for segmentation, in other words, by creating smaller objects. However, in that case, the time requested by the image analysis would significantly increase and, thus, further analyses would be needed to understand if it might be worth it in terms of overall accuracy. Moreover, the pixel-based classification was shown to have several advantages compared to the field observations and the photo-interpretation: It is faster and less laborious; it can be easily applied to wider areas and removes the set of problems linked to the subjectivity of manual classification. Nevertheless, we observed that, for a low percentage of land cover changes, the semi-automatic classification methods were not as efficient as photo-interpretation, at least when only RGB bands are considered. Therefore, in light of the above results, we suggest using a semi-automatic classification of RGB images when the main aim of the study is to describe the vegetation cover of several areas or long-term land cover changes. For instance, Malatesta et al. [87] successfully detected 27 years (1988–2015) of land cover change of a pastoral landscape in the central Apennines in Italy through a supervised object-based classification of satellite imagery. On the other hand, we suggest preferring more accurate methods, such as visual photo-interpretation, when the objective is to describe short-term land cover changes on a small scale.
Regardless of the classification method, the opportunity to substitute fieldwork with high-resolution image analysis in the study of vegetation dynamics has important advantages for the monitoring of land cover change under encroachment and, consequently, for management decisions and biodiversity conservation assessment [88]. Indeed, scientific knowledge may lead management decisions regarding the optimal land-use practice to control woody encroachment in terms of grazing or fire features, such as timing, intensity and frequency. Moreover, monitoring vegetation at high-resolution may help to identify not only the encroachment stage at which biodiversity is maximized but also the areas needing an urgent management intervention due to their critical conditions. The method developed in this study has the potential to help the environmental diagnostic and drive management decisions, thanks to its high flexibility, spatial and temporal resolution, objectivity and reproducibility. In fact, the UAV imagery analysis approach allows detailed information to be collected across a wide geographical area and with a high temporal resolution. For instance, Suess et al. [41] obtained a reliable annual time series of shrub cover changes, from high-resolution satellite imagery available for 32 years, but the resolution level they worked with would not be enough to investigate small shrub and tree individuals at the species level. The access to annual data on a small scale is essential for the study of the encroachment consequences on the structure and functioning of ecosystems. Indeed, monitoring the encroachment process frequently and on a small scale facilitates the detection of its onset and the investigation of the colonization pattern of the woody species in its early stages, which are still quite unknown. At the same time, the annual structural changes of the plant community may be correlated with the available annual data on the functioning of the ecosystems. Several instruments and methods for the monitoring of terrestrial ecosystem functioning became very common in the last few decades (e.g., eddy covariance towers, litterbag approach for decomposition, respiration chambers, NDVI sensors and phenocams). The integration of the functional data provided by these methods with the information on the structural changes may help to explain and predict the encroachment effects on the ecosystem processes and services. Furthermore, another advantage of having annual data from several areas is the opportunity to investigate the relationship between structural changes in the plant community and environmental factors, such as fire [78], land-use change [83] and climate change [85,89]. There is still a lack of knowledge on the effects of climate on the encroachment rate, and having a time series of structural and climatic data may help to explain this relationship and, consequently, to disentangle the effects of climate and land cover change on ecosystem functioning and services.
In this study, the acquisition schedule was set in order to successfully exploit the unique phenological characteristics of the vegetation growing in the study area. In fact, the RGB images were acquired in mid-October because the senescent phase immediately before snow cover establishment was characterized by the highest species diversification: larches became yellow, C. vulgaris and Vaccinium sp. were brownish, J. communis remained green, and the herbaceous species of the grassland, dominated by N. stricta, appeared grayish. Therefore, the accuracy level that we reached was strictly dependent on the timing of the image acquisition, confirming that, regardless of spectral resolution or classification method, phenology is a key issue for vegetation classification, especially when using RGB images, as already suggested by other studies, e.g., [47,52,79].
Finally, all the software used in the study is free, which represents a plus point for their employment in nature conservation or land management. In fact, image analysis is often performed using paid software, such as ArcGIS [78,79], eCognition [81,83] and MATLAB [77], whereas we carried out all the analyses using the free software R and QGIS. Regarding sensors, multispectral or hyperspectral UAV sensors would probably improve the resulting classification accuracy, but they would make the methodology much more expensive and complex [90]. Furthermore, thanks to its plasticity, the method developed in this study might be applied to map and monitor not only subalpine grasslands under encroachment but also several other worldwide areas characterized by different processes of vegetation dynamics, such as invasion of alien species, bush encroachment in the savannahs, algal blooms in aquatic ecosystems, or the upward treeline shift.

5. Conclusions

This study showed that it is possible to efficiently replace, or at least significantly reduce, fieldwork and visual photo-interpretation of images by combining high-resolution remote sensing offered by drones with a simple and accurate pixel-based classification workflow, in order to map the vegetation of a subalpine grassland under recent encroachment, at least at the level of life-form (i.e., tree, shrub and herbaceous species). We developed a straightforward workflow that can be carried out through cost-effective methods and free software, without requiring professional skills in programming and image analysis. Moreover, we were able not only to compare the accuracy of three different classification methods (i.e., photo-interpretation, pixel- and object-based semi-automatic classification) but also to describe their quantitative limits in juvenile tree detection, by analyzing the dimensions of the detected and undetected trees thanks to a very detailed dataset collected in the field. In light of our results, pixel-based classification of the high-resolution image can be highly recommended for the study of the encroachment process, especially in long-term studies or in the case of several and widely distributed areas. However, we suggest avoiding semi-automatic classification methods for the investigation of short-term land cover change, at least when the omission error is higher than the percentage of land cover change, in which case we recommend using visual photo-interpretation. To conclude, encroachment is a widely distributed ecological process, with important consequences on ecosystem structure and functioning, and to our knowledge, this study was the first attempt to describe its early effects on vegetation structure at a very fine scale and exclusively using the RGB bands.

Supplementary Materials

The following are available online at https://www.mdpi.com/article/10.3390/rs13071239/s1. Figures S1–S7 and Tables S1–S3.

Author Contributions

Conceptualization, all the authors; methodology, L.O. and U.M.d.C.; software, L.O. and E.C.; validation, L.O., L.A. and G.F.; formal analysis, L.O. and M.G.; investigation, L.O. and L.A.; resources, U.M.d.C.; data curation, D.S.; writing—original draft preparation, L.O.; writing—review and editing, all the authors; visualization, all the authors; supervision, U.M.d.C.; project administration, E.C.; funding acquisition, U.M.d.C. and E.C. All authors have read and agreed to the published version of the manuscript.

Funding

This research received no external funding.

Institutional Review Board Statement

Not applicable.

Informed Consent Statement

Not applicable.

Data Availability Statement

Data supporting the findings of this study could be available from the authors on request.

Acknowledgments

The authors would like to thank Consolata Siniscalco (University of Torino), Luca Bresciani, and Marta Vanotti for providing their precious support during fieldwork and paper writing. Part of this study was supported by the LIFE project PASTORALP (LIFE16 CCA/IT/000060).

Conflicts of Interest

The authors declare no conflict of interest. The funders had no role in the design of the study; in the collection, analyses or interpretation of data; in the writing of the manuscript or in the decision to publish the results.

References

  1. Newbold, T.; Hudson, L.N.; Hill, S.L.L.; Contu, S.; Lysenko, I.; Senior, R.A.; Börger, L.; Bennett, D.J.; Choimes, A.; Collen, B.; et al. Global effects of land use on local terrestrial biodiversity. Nature 2015, 520, 45–50. [Google Scholar] [CrossRef]
  2. Sala, O.E.; Chapin, F.S.; Armesto, J.J.; Berlow, E.; Bloomfield, J.; Dirzo, R.; Huber-Sanwald, E.; Huenneke, L.F.; Jackson, R.B.; Kinzig, A.; et al. Global biodiversity scenarios for the year 2100. Science 2000, 287, 1770–1774. [Google Scholar] [CrossRef]
  3. Rickebusch, S. Modelling Tree Population Dynamics at the Alpine and Boreal Thee-Line Ecotones in Response to Climate and Land-Use Change. Ph.D. Thesis, Université de Lausanne (UNIL), Lausanne, Switzerland, 2006. [Google Scholar]
  4. Didier, L. Invasion patterns of European larch and Swiss stone pine in subalpine pastures in the French Alps. For. Ecol. Manag. 2001, 145, 67–77. [Google Scholar] [CrossRef]
  5. Dullinger, S.; Dirnböck, T.; Grabherr, G. Patterns of Shrub Invasion into High Mountain Grasslands of the Northern Calcareous Alps, Austria. Arct. Antarct. Alp. Res. 2003, 35, 434–441. [Google Scholar] [CrossRef]
  6. Quétier, F. Vulnérabilité des Écosystèmes Semi-Naturels Européens aux Changements D’utilisation des Terres: Application aux Prairies Subalpines de Villar D’arène, France. Ph.D. Thesis, École Nationale Supérieure Agronomique (ENSA), Montpellier, France, 2006. [Google Scholar]
  7. Kräuchi, N.; Brang, P.; Schönenberger, W. Forests of mountainous regions: Gaps in knowledge and research needs. For. Ecol. Manag. 2000, 132, 73–82. [Google Scholar] [CrossRef]
  8. Anthelme, F.; Villaret, J.-C.; Brun, J.-J. Shrub encroachment in the Alps gives rise to the convergence of sub-alpine communities on a regional scale. J. Veg. Sci. 2007, 18, 355. [Google Scholar] [CrossRef]
  9. Leitner, M.; Davies, A.B.; Parr, C.L.; Eggleton, P.; Robertson, M.P. Woody encroachment slows decomposition and termite activity in an African savanna. Glob. Chang. Biol. 2018, 24, 2597–2606. [Google Scholar] [CrossRef] [PubMed]
  10. Barger, N.N.; Archer, S.R.; Campbell, J.L.; Huang, C.Y.; Morton, J.A.; Knapp, A.K. Woody plant proliferation in North American drylands: A synthesis of impacts on ecosystem carbon balance. J. Geophys. Res. Biogeosci. 2011, 116, 1–17. [Google Scholar] [CrossRef]
  11. Tappeiner, U.; Cernusca, A. Alpine meadows and pastures after abandonment. Results of the Austrian MAB programme and the EC-STEP project INTEGRALP. Pirineos 1993, 141–142, 97–118. [Google Scholar] [CrossRef]
  12. Görzen, E.; Borisova, K.; Fenesi, A.; Ruprecht, E.; Donath, T.W. Effects of woody species encroachment and fire on vegetation and the soil seed bank in dry grasslands of Transylvania. Appl. Veg. Sci. 2019, 22, 409–422. [Google Scholar] [CrossRef]
  13. Zhou, L.; Shen, H.; Xu, Y.; Li, H.; Chen, L.; Wang, Y.; Zhang, P.; Zhao, X.; Liu, T.; Hu, H.; et al. Soil organic carbon components in inner Mongolian shrub-encroached grasslands. Plant Soil 2019, 442, 199–213. [Google Scholar] [CrossRef]
  14. Plieninger, T.; Hui, C.; Gaertner, M.; Huntsinger, L. The impact of land abandonment on species richness and abundance in the Mediterranean Basin: A meta-analysis. PLoS ONE 2014, 9, e98355. [Google Scholar] [CrossRef] [PubMed]
  15. Terziyska, T.S.; Tsakalos, J.; Bartha, S.; Apostolova, I.; Sopotlieva, D.; Zimmermann, M.Z.; Szabo, G.; Wellstein, C. Species and functional differences between subalpine grasslands with and without dwarf shrub encroachment. Plant Biosyst. 2020, 154, 568–577. [Google Scholar] [CrossRef]
  16. da Silva, F.H.B.; Arieira, J.; Parolin, P.; da Cunha, C.N.; Junk, W.J. Shrub encroachment influences herbaceous communities in flooded grasslands of a neotropical savanna wetland. Appl. Veg. Sci. 2016, 19, 391–400. [Google Scholar] [CrossRef]
  17. Soliveres, S.; Maestre, F.T.; Eldridge, D.J.; Delgado-Baquerizo, M.; Quero, J.L.; Bowker, M.A.; Gallardo, A. Plant diversity and ecosystem multifunctionality peak at intermediate levels of woody cover in global drylands. Glob. Ecol. Biogeogr. 2014, 23, 1408–1416. [Google Scholar] [CrossRef]
  18. McCleery, R.; Monadjem, A.; Baiser, B.; Fletcher, R.; Vickers, K.; Kruger, L. Animal diversity declines with broad-scale homogenization of canopy cover in African savannas. Biol. Conserv. 2018, 226, 54–62. [Google Scholar] [CrossRef]
  19. Stanton, R.A.; Boone, W.W.; Soto-Shoender, J.; Fletcher, R.J.; Blaum, N.; McCleery, R.A. Shrub encroachment and vertebrate diversity: A global meta-analysis. Glob. Ecol. Biogeogr. 2018, 27, 368–379. [Google Scholar] [CrossRef]
  20. Schirmel, J.; Mantilla-Contreras, J.; Gauger, D.; Blindow, I. Carabid beetles as indicators for shrub encroachment in dry grasslands. Ecol. Indic. 2015, 49, 76–82. [Google Scholar] [CrossRef]
  21. Pellis, G.; Chiti, T.; Rey, A.; Yuste, J.C.; Trotta, C.; Papale, D. The ecosystem carbon sink implications of mountain forest expansion into abandoned grazing land: The role of subsoil and climatic factors. Sci. Total Environ. 2019, 672, 106–120. [Google Scholar] [CrossRef] [PubMed]
  22. Brigham, L.M.; Esch, E.H.; Kopp, C.W.; Cleland, E.E. Warming and shrub encroachment decrease decomposition in arid alpine and subalpine ecosystems. Arct. Antarct. Alp. Res. 2018, 50. [Google Scholar] [CrossRef]
  23. Grau, O.; Saravesi, K.; Ninot, J.M.; Geml, J.; Markkola, A.; Ahonen, S.H.K.; Peñuelas, J. Encroachment of shrubs into subalpine grasslands in the Pyrenees modifies the structure of soil fungal communities and soil properties. FEMS Microbiol. Ecol. 2019, 95, fiz028. [Google Scholar] [CrossRef] [PubMed]
  24. Li, X.; Wilson, S.D. Facilitation among woody plants establishing in an old field. Ecology 1998, 79, 2694–2705. [Google Scholar] [CrossRef]
  25. Kunstler, G.; Curt, T.; Bouchaud, M.; Lepart, J. Indirect facilitation and competition in tree species colonization of sub-Mediterranean grasslands. J. Veg. Sci. 2006, 17, 379. [Google Scholar] [CrossRef]
  26. Coop, J.D.; Givnish, T.J. Spatial and temporal patterns of recent forest encroachment in montane grasslands of the Valles Caldera, New Mexico, USA. J. Biogeogr. 2007, 34, 914–927. [Google Scholar] [CrossRef]
  27. Albert, C.H.; Thuiller, W.; Lavorel, S.; Davies, I.D.; Garbolino, E. Land-use change and subalpine tree dynamics: Colonization of Larix decidua in French subalpine grasslands. J. Appl. Ecol. 2008, 45, 659–669. [Google Scholar] [CrossRef]
  28. Wich, S. Drones and conservation. In Drones and Aerial Observation: New Technologies for Property Rights, Human Rights, and Global Development. A Primer; New America Press: Washington, DC, USA, 2015; pp. 63–70. [Google Scholar]
  29. Bazzichetto, M.; Malavasi, M.; Barták, V.; Acosta, A.T.R.; Moudrý, V.; Carranza, M.L. Modeling plant invasion on Mediterranean coastal landscapes: An integrative approach using remotely sensed data. Landsc. Urban Plan. 2018, 171, 98–106. [Google Scholar] [CrossRef]
  30. Chignell, S.M.; Luizza, M.W.; Skach, S.; Young, N.E.; Evangelista, P.H. An integrative modeling approach to mapping wetlands and riparian areas in a heterogeneous Rocky Mountain watershed. Remote Sens. Ecol. Conserv. 2018, 4, 150–165. [Google Scholar] [CrossRef]
  31. Husson, E.; Reese, H.; Ecke, F. Combining spectral data and a DSM from UAS-images for improved classification of non-submerged aquatic vegetation. Remote Sens. 2017, 9, 247. [Google Scholar] [CrossRef]
  32. Rapinel, S.; Hubert-Moya, L.; Clémentb’, B. Combined use of lidar data and multispectral earth observation imagery for wetland habitat mapping. Int. J. Appl. Earth Obs. Geoinf. 2015, 37, 56–64. [Google Scholar] [CrossRef]
  33. Prošek, J.; Šímová, P. UAV for mapping shrubland vegetation: Does fusion of spectral and vertical information derived from a single sensor increase the classification accuracy? Int. J. Appl. Earth Obs. Geoinf. 2019, 75, 151–162. [Google Scholar] [CrossRef]
  34. Jetz, W.; McGeoch, M.A.; Guralnick, R.; Ferrier, S.; Beck, J.; Costello, M.J.; Fernandez, M.; Geller, G.N.; Keil, P.; Merow, C.; et al. Essential biodiversity variables for mapping and monitoring species populations. Nat. Ecol. Evol. 2019, 3, 539–551. [Google Scholar] [CrossRef]
  35. Kissling, W.D.; Walls, R.; Bowser, A.; Jones, M.O.; Kattge, J.; Agosti, D.; Amengual, J.; Basset, A.; van Bodegom, P.M.; Cornelissen, J.H.C.; et al. Towards global data products of Essential Biodiversity Variables on species traits. Nat. Ecol. Evol. 2018, 2, 1531–1540. [Google Scholar] [CrossRef] [PubMed]
  36. Pettorelli, N.; Wegmann, M.; Skidmore, A.; Mücher, S.; Dawson, T.P.; Fernandez, M.; Lucas, R.; Schaepman, M.E.; Wang, T.; O’Connor, B.; et al. Framing the concept of satellite remote sensing essential biodiversity variables: Challenges and future directions. Remote Sens. Ecol. Conserv. 2016, 2, 122–131. [Google Scholar] [CrossRef]
  37. Pereira, H.M.; Ferrier, S.; Walters, M.; Geller, G.N.; Jongman, R.H.G.; Scholes, R.J.; Bruford, M.W.; Brummitt, N.; Butchart, S.H.M.; Cardoso, A.C.; et al. Essential biodiversity variables. Science 2013, 339, 277–278. [Google Scholar] [CrossRef]
  38. Broich, M.; Hansen, M.C.; Potapov, P.; Adusei, B.; Lindquist, E.; Stehman, S.V. Time-series analysis of multi-resolution optical imagery for quantifying forest cover loss in Sumatra and Kalimantan, Indonesia. Int. J. Appl. Earth Obs. Geoinf. 2011, 13, 277–291. [Google Scholar] [CrossRef]
  39. Koh, L.P.; Wich, S.A. Dawn of drone ecology: Low-cost autonomous aerial vehicles for conservation. Trop. Conserv. Sci. 2012, 5, 121–132. [Google Scholar] [CrossRef]
  40. Tiwari, L.K.; Sinha, S.K.; Saran, S.; Tolpekin, V.A.; Raju, P.L.N. Markov random field-based method for super-resolution mapping of forest encroachment from remotely sensed ASTER image. Geocarto Int. 2016, 31, 428–445. [Google Scholar] [CrossRef]
  41. Suess, S.; van der Linden, S.; Okujeni, A.; Griffiths, P.; Leitão, P.J.; Schwieder, M.; Hostert, P. Characterizing 32 years of shrub cover dynamics in southern Portugal using annual Landsat composites and machine learning regression modeling. Remote Sens. Environ. 2018, 219, 353–364. [Google Scholar] [CrossRef]
  42. Hung, C.; Bryson, M.; Sukkarieh, S. Multi-class predictive template for tree crown detection. ISPRS J. Photogramm. Remote Sens. 2012, 68, 170–183. [Google Scholar] [CrossRef]
  43. Haest, B.; Borre, J.V.; Spanhove, T.; Thoonen, G.; Delalieux, S.; Kooistra, L.; Mücher, C.A.; Paelinckx, D.; Scheunders, P.; Kempeneers, P. Habitat mapping and quality assessment of NATURA 2000 heathland using airborne imaging spectroscopy. Remote Sens. 2017, 9, 266. [Google Scholar] [CrossRef]
  44. Peck, M.; Mariscal, A.; Padbury, M.; Cane, T.; Kniveton, D.; Chinchero, M.A. Identifying tropical Ecuadorian Andean trees from inter-crown pixel distributions in hyperspatial aerial imagery. Appl. Veg. Sci. 2012, 15, 548–559. [Google Scholar] [CrossRef]
  45. Paneque-Gálvez, J.; McCall, M.K.; Napoletano, B.M.; Wich, S.A.; Koh, L.P. Small drones for community-based forest monitoring: An assessment of their feasibility and potential in tropical areas. Forests 2014, 5, 1481–1507. [Google Scholar] [CrossRef]
  46. Lu, B.; He, Y. Species classification using Unmanned Aerial Vehicle (UAV)-acquired high spatial resolution imagery in a heterogeneous grassland. ISPRS J. Photogramm. Remote Sens. 2017, 128, 73–85. [Google Scholar] [CrossRef]
  47. Alvarez-Taboada, F.; Paredes, C.; Julián-Pelaz, J. Mapping of the invasive species Hakea sericea using Unmanned Aerial Vehicle (UAV) and worldview-2 imagery and an object-oriented approach. Remote Sens. 2017, 9, 913. [Google Scholar] [CrossRef]
  48. Baena, S.; Moat, J.; Whaley, O.; Boyd, D.S. Identifying species from the air: UAVs and the very high resolution challenge for plant conservation. PLoS ONE 2017, 12, e0188714. [Google Scholar] [CrossRef]
  49. Räpple, B.; Piégay, H.; Stella, J.C.; Mercier, D. What drives riparian vegetation encroachment in braided river channels at patch to reach scales? Insights from annual airborne surveys (Drôme River, SE France, 2005–2011). Ecohydrology 2017, 10. [Google Scholar] [CrossRef]
  50. Chabot, D.; Dillon, C.; Shemrock, A.; Weissflog, N.; Sager, E.P.S. An object-based image analysis workflow for monitoring shallow-water aquatic vegetation in multispectral drone imagery. ISPRS Int. J. Geo-Inf. 2018, 7, 294. [Google Scholar] [CrossRef]
  51. Dvořák, P.; Müllerová, J.; Bartaloš, T.; Brůna, J. Unmanned aerial vehicles for alien plant species detection and monitoring. Int. Arch. Photogramm. Remote Sens. Spat. Inf. Sci. 2015, 40, 83–90. [Google Scholar] [CrossRef]
  52. Müllerová, J.; Brůna, J.; Bartaloš, T.; Dvořák, P.; Vítková, M.; Pyšek, P. Timing is important: Unmanned aircraft vs. Satellite imagery in plant invasion monitoring. Front. Plant Sci. 2017, 8, 887. [Google Scholar] [CrossRef] [PubMed]
  53. Radoux, J.; Bogaert, P. Good practices for object-based accuracy assessment. Remote Sens. 2017, 9, 646. [Google Scholar] [CrossRef]
  54. Hill, D.J.; Tarasoff, C.; Whitworth, G.E.; Baron, J.; Bradshaw, J.L.; Church, J.S. Utility of unmanned aerial vehicles for mapping invasive plant species: A case study on yellow flag iris (Iris pseudacorus L.). Int. J. Remote Sens. 2017, 38, 2083–2105. [Google Scholar] [CrossRef]
  55. Leitão, P.J.; Schwieder, M.; Suess, S.; Okujeni, A.; Galvão, L.S.; van der Linden, S.; Hostert, P. Monitoring natural ecosystem and ecological gradients: Perspectives with EnMAP. Remote Sens. 2015, 7, 13098–13119. [Google Scholar] [CrossRef]
  56. Petraitis, P. Multiple Stable States in Natural Ecosystems; Oxford University Press: Oxford, UK, 2013; ISBN 9780191810084. [Google Scholar]
  57. Komárek, J.; Klouček, T.; Prošek, J. The potential of Unmanned Aerial Systems: A tool towards precision classification of hard-to-distinguish vegetation types? Int. J. Appl. Earth Obs. Geoinf. 2018, 71, 9–19. [Google Scholar] [CrossRef]
  58. Blaschke, T.; Hay, G.J.; Kelly, M.; Lang, S.; Hofmann, P.; Addink, E.; Queiroz Feitosa, R.; van der Meer, F.; van der Werff, H.; van Coillie, F.; et al. Geographic Object-Based Image Analysis—Towards a new paradigm. ISPRS J. Photogramm. Remote Sens. 2014, 87, 180–191. [Google Scholar] [CrossRef] [PubMed]
  59. Liu, J.; Li, P.; Wang, X. A new segmentation method for very high resolution imagery using spectral and morphological information. ISPRS J. Photogramm. Remote Sens. 2015, 101, 145–162. [Google Scholar] [CrossRef]
  60. Yu, Q.; Gong, P.; Clinton, N.; Biging, G.; Kelly, M.; Schirokauer, D. Object-based detailed vegetation classification with airborne high spatial resolution remote sensing imagery. Photogramm. Eng. Remote Sens. 2006, 72, 799–811. [Google Scholar] [CrossRef]
  61. Galvagno, M.; Wohlfahrt, G.; Cremonese, E.; Rossini, M.; Colombo, R.; Filippa, G.; Julitta, T.; Manca, G.; Siniscalco, C.; Di Cella, U.M.; et al. Phenology and carbon dioxide source/sink strength of a subalpine grassland in response to an exceptionally short snow season. Environ. Res. Lett. 2013, 8. [Google Scholar] [CrossRef]
  62. Galvánek, D.; Janák, M. Managment of Natura 2000 Habitats. 6230* Species-Rich Nardus Grasslands; European Commission: Brussels, Belgium, 2008. [Google Scholar]
  63. Cochran, W. Sampling Techniques, 3rd ed.; John Wiley & Sons: New York, NY, USA, 1997. [Google Scholar]
  64. Olofsson, P.; Foody, G.M.; Herold, M.; Stehman, S.V.; Woodcock, C.E.; Wulder, M.A. Good practices for estimating area and assessing accuracy of land change. Remote Sens. Environ. 2014, 148, 42–57. [Google Scholar] [CrossRef]
  65. QGIS. QGIS Geographic Information System. Open Source Geospatial Foundation Project. 2019. Available online: http://qgis.osgeo.org (accessed on 21 March 2021).
  66. Breiman, L. Random forests. Mach. Learn. 2001, 45, 5–32. [Google Scholar] [CrossRef]
  67. Belgiu, M.; Drăgu, L. Random forest in remote sensing: A review of applications and future directions. ISPRS J. Photogramm. Remote Sens. 2016, 114, 24–31. [Google Scholar] [CrossRef]
  68. Chutia, D.; Bhattacharyya, D.K.; Sarma, K.K.; Kalita, R.; Sudhakar, S. Hyperspectral Remote Sensing Classifications: A Perspective Survey. Trans. GIS 2016, 20, 463–490. [Google Scholar] [CrossRef]
  69. Bhatnagar, S.; Gill, L.; Ghosh, B. Drone image segmentation using machine and deep learning for mapping raised bog vegetation communities. Remote Sens. 2020, 12, 2602. [Google Scholar] [CrossRef]
  70. Dorigo, W.; Lucieer, A.; Podobnikar, T.; Carni, A. Mapping invasive Fallopia japonica by combined spectral, spatial, and temporal analysis of digital orthophotos. Int. J. Appl. Earth Obs. Geoinf. 2012, 19, 185–195. [Google Scholar] [CrossRef]
  71. Rodriguez-Galiano, V.F.; Ghimire, B.; Rogan, J.; Chica-Olmo, M.; Rigol-Sanchez, J.P. An assessment of the effectiveness of a random forest classifier for land-cover classification. ISPRS J. Photogramm. Remote Sens. 2012, 67, 93–104. [Google Scholar] [CrossRef]
  72. Ghosh, A.; Joshi, P.K. A comparison of selected classification algorithms for mapping bamboo patches in lower Gangetic plains using very high resolution WorldView 2 imagery. Int. J. Appl. Earth Obs. Geoinf. 2014, 26, 298–311. [Google Scholar] [CrossRef]
  73. Ghosh, A.; Fassnacht, F.E.; Joshi, P.K.; Kochb, B. A framework for mapping tree species combining hyperspectral and LiDAR data: Role of selected classifiers and sensor across three spatial scales. Int. J. Appl. Earth Obs. Geoinf. 2014, 26, 49–63. [Google Scholar] [CrossRef]
  74. Dalponte, M.; Ørka, H.O.; Gobakken, T.; Gianelle, D.; Næsset, E. Tree species classification in boreal forests with hyperspectral data. IEEE Trans. Geosci. Remote Sens. 2013, 51, 2632–2645. [Google Scholar] [CrossRef]
  75. Chan, J.C.W.; Paelinckx, D. Evaluation of Random Forest and Adaboost tree-based ensemble classification and spectral band selection for ecotope mapping using airborne hyperspectral imagery. Remote Sens. Environ. 2008, 112, 2999–3011. [Google Scholar] [CrossRef]
  76. Poznanovic, A.J.; Falkowski, M.J.; Maclean, A.L.; Smith, A.M.S.; Evans, J.S. An accuracy assessment of tree detection algorithms in juniper woodlands. Photogramm. Eng. Remote Sens. 2014, 80, 627–637. [Google Scholar] [CrossRef]
  77. Falco, N.; Wainwright, H.; Dafflon, B.; Léger, E.; Peterson, J.; Steltzer, H.; Wilmer, C.; Rowland, J.C.; Williams, K.H.; Hubbard, S.S. Investigating microtopographic and soil controls on a mountainous meadow plant community using high-resolution remote sensing and surface geophysical data. J. Geophys. Res. Biogeosci. 2019, 124, 1618–1636. [Google Scholar] [CrossRef]
  78. Rosan, T.M.; Aragão, L.E.O.C.; Oliveras, I.; Phillips, O.L.; Malhi, Y.; Gloor, E.; Wagner, F.H. Extensive 21st-century woody encroachment in South America’s savanna. Geophys. Res. Lett. 2019, 46, 6594–6603. [Google Scholar] [CrossRef]
  79. Durfee, N.; Ochoa, C.G.; Mata-Gonzalez, R. The use of low-altitude UAV imagery to assess western juniper density and canopy cover in treated and untreated stands. Forests 2019, 10, 296. [Google Scholar] [CrossRef]
  80. Ruwaimana, M.; Satyanarayana, B.; Otero, V.; Muslim, A.M.; Muhammad Syafiq, A.; Ibrahim, S.; Raymaekers, D.; Koedam, N.; Dahdouh-Guebas, F. The advantages of using drones over space-borne imagery in the mapping of mangrove forests. PLoS ONE 2018, 13, e0200288. [Google Scholar] [CrossRef]
  81. Cao, X.; Liu, Y.; Liu, Q.; Cui, X.; Chen, X.; Chen, J. Estimating the age and population structure of encroaching shrubs in arid/semiarid grasslands using high spatial resolution remote sensing imagery. Remote Sens. Environ. 2018, 216, 572–585. [Google Scholar] [CrossRef]
  82. Ma, L.; Li, M.; Ma, X.; Cheng, L.; Du, P.; Liu, Y. A review of supervised object-based land-cover image classification. ISPRS J. Photogramm. Remote Sens. 2017, 130, 277–293. [Google Scholar] [CrossRef]
  83. Laliberte, A.S.; Rango, A.; Havstad, K.M.; Paris, J.F.; Beck, R.F.; McNeely, R.; Gonzalez, A.L. Object-oriented image analysis for mapping shrub encroachment from 1937 to 2003 in southern New Mexico. Remote Sens. Environ. 2004, 93, 198–210. [Google Scholar] [CrossRef]
  84. Filippelli, S.K.; Vogeler, J.C.; Falkowski, M.J.; Meneguzzo, D.M. Monitoring conifer cover: Leaf-off lidar and image-based tracking of eastern redcedar encroachment in central Nebraska. Remote Sens. Environ. 2020, 248, 111961. [Google Scholar] [CrossRef]
  85. Huang, C.Y.; Archer, S.R.; McClaran, M.P.; Marsh, S.E. Shrub encroachment into grasslands: End of an era? PeerJ 2018, 2018, e5474. [Google Scholar] [CrossRef] [PubMed]
  86. Kopeć, D.; Sławik, Ł. How to effectively use long-term remotely sensed data to analyze the process of tree and shrub encroachment into open protected wetlands. Appl. Geogr. 2020, 125, 102345. [Google Scholar] [CrossRef]
  87. Malatesta, L.; Tardella, F.M.; Tavoloni, M.; Postiglione, N.; Piermarteri, K.; Catorci, A. Land use change in the high mountain belts of the central Apennines led to marked changes of the grassland mosaic. Appl. Veg. Sci. 2018, 22, 243–255. [Google Scholar] [CrossRef]
  88. Cao, X.; Liu, Y.; Cui, X.; Chen, J.; Chen, X. Mechanisms, monitoring and modeling of shrub encroachment into grassland: A review. Int. J. Digit. Earth 2019, 12, 625–641. [Google Scholar] [CrossRef]
  89. Munson, S.M.; Webb, R.H.; Belnap, J.; Andrew Hubbard, J.; Swann, D.E.; Rutman, S. Forecasting climate change impacts to plant community composition in the Sonoran Desert region. Glob. Chang. Biol. 2012, 18, 1083–1095. [Google Scholar] [CrossRef]
  90. Govender, M.; Chetty, K.; Bulcock, H. A review of hyperspectral remote sensing and its application in vegetation and water resource studies. Water SA 2007, 33, 145–151. [Google Scholar] [CrossRef]
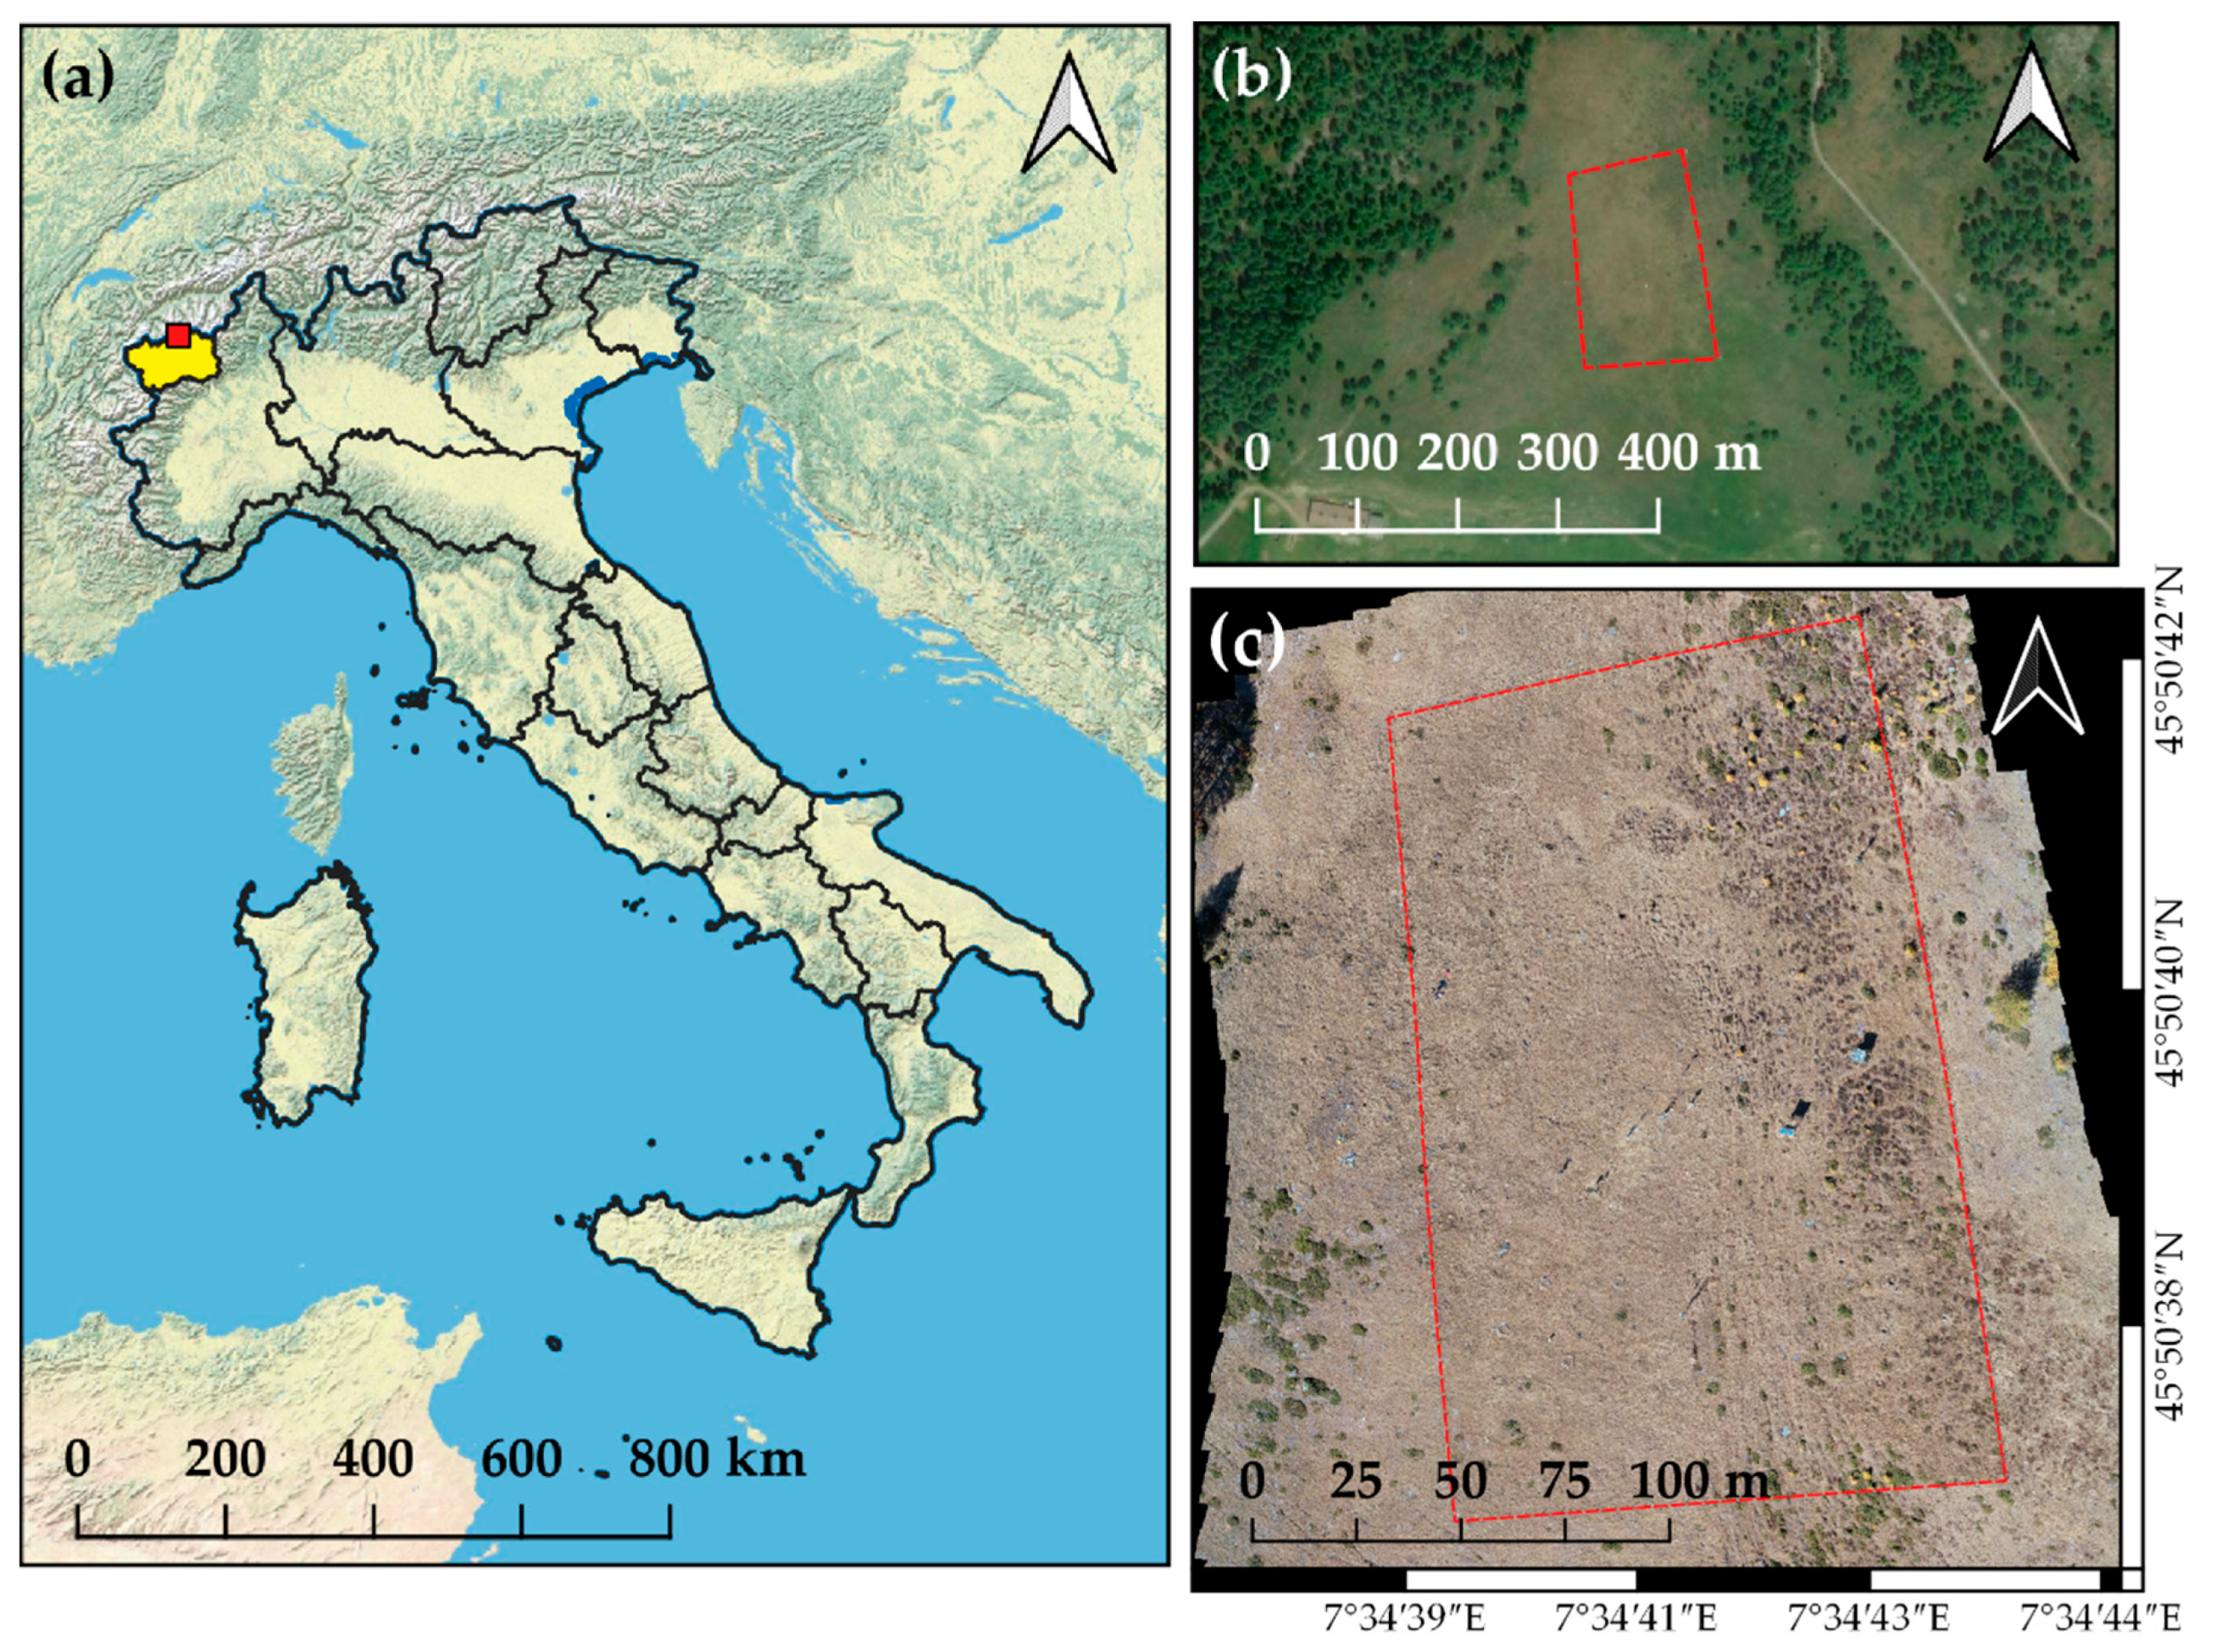
Figure 1. Study area: (a) ESRI physical map of Italy with the red dot highlighting the location of the study area in the Aosta Valley region (yellow); (b) ESRI satellite image of the grassland with surrounding larch forest; (c) portion of the area covered by drone that was used for classification (coordinate system: EPSG:4326–WGS84).
Remotesensing 13 01239 g001
Figure 2. Vegetation classes identified in the study area and used for classification: larch trees (a), brownish shrubs (b), greenish shrubs (c) and grassland (d). Portions of the drone images acquired in October 2018.
Remotesensing 13 01239 g002
Figure 3. Same portion of the study area extracted from the images that were acquired by drone during two different phenological phases, in mid-August (a) and mid-October (b) 2018.
Remotesensing 13 01239 g003
Figure 4. Same portion of the study area at different spatial resolutions: 1 cm (a), 5 cm (b) and 20 cm (c); the original image (a) was acquired by drone in October 2018, and it was then resized to obtain two more resolution levels.
Remotesensing 13 01239 g004
Figure 5. Sampling design of ground truth (a) and reference data (b) collection.
Remotesensing 13 01239 g005
Figure 6. Same portion of the original high-resolution (1 cm) image (a) and of the most accurate classification maps obtained through photo-interpretation (b), pixel-based classification (c) and object-based classification (d).
Remotesensing 13 01239 g006
Figure 7. Workflow of the three image classification methods analyzed in this study.
Remotesensing 13 01239 g007
Figure 8. Density curve of the trunk diameter (a,d), maximum height (b,e) and mean canopy width (c,f) of the ground-surveyed larches (GS; solid black line), larches correctly classified (CC; solid orange line) and larches that were not detected and so misclassified (MC; solid grey line) through the photo-interpretation. Density plots are reported for both low-resolution (ac) and high-resolution (df) images acquired by drone in an abandoned subalpine grassland during mid-October 2018. The dashed red line marks the intersection between CC- and MC-larches density curves, whose x-value was set as the size threshold of photo-interpretation efficiency.
Remotesensing 13 01239 g008
Figure 9. Overall accuracy (OA) of the classification maps obtained through the three semi-automatic classification methods tested in the study, i.e., the pixel-based classification (PBC), the PBC followed by map filtering and the object-based image analysis (OBIA). The accuracy values are reported for the classification of low-resolution (a), medium-resolution (b) and high-resolution (c) images and for both original and smoothed images.
Remotesensing 13 01239 g009
Figure 10. Density curve of the trunk diameter (a,d), maximum height (b,e) and mean canopy width (c,f) of the ground-surveyed larches (GS; solid black line), larches correctly classified (CC; solid orange line) and larches that were not detected and so misclassified (MC; solid grey line) through the semi-automatic classification methods. Density plots are reported for the most accurate pixel-based (ac) and object-based (df) classification maps of the images acquired by drone in an abandoned subalpine grassland during mid-October 2018. The dashed red line marks the intersection between CC- and MC-larches density curves, whose x-value was set as the size threshold of the semi-automatic classification efficiency.
Remotesensing 13 01239 g010
Table 1. Descriptive statistics of the trunk diameter, maximum height and mean canopy width of the ground-surveyed larches (GS), and of the larches correctly classified (CC) and misclassified (MC) through the photo-interpretation of the low-(20 cm; LR) and high-resolution (1 cm; HR) images acquired by drone in mid-October 2018 in an abandoned subalpine grassland subjected to recent encroachment.
ParameterStatisticsGSLRHR
CCMCCCMC
(n = 531)(n = 135)(n = 335)(n = 320)(n = 134)
Trunk diameter
(cm)
min0.10.90.10.20.1
median1.12.10.61.50.3
mean1.42.60.81.80.4
max9.19.15.89.12.3
Height max
(cm)
min1.07.01.06.01.0
median26.060.014.039.57.0
mean36.875.119.848.88.3
max260.0260.0140.0260.040.0
Mean crown width
(cm)
min5.030.05.011.05.0
median34.065.021.045.014.0
mean42.779.825.854.814.8
max250.0250.0200.0250.036.0
Table 2. Results of the accuracy assessment of the image classification performed through photo-interpretation (PI); the accuracy metrics are reported for the PI of the high-resolution (1 cm; HR) and low-resolution (20 cm; LR) images and included the overall accuracy (OA), the producer’s (PA) and user’s accuracy (UA) of each classification class (1: larches; 2: brownish shrubs; 3: greenish shrubs; 4: grassland).
MethodResolutionOA [%]PA [%]UA [%]
12341234
PIHR99.349.110010010010099.610099.3
PILR88.514.145.610010010093.595.685.5
Table 3. Land cover changes occurred in the study area from 2012 to 2018 as observed by the photo-interpretation (PI) of the LR images and by the most accurate pixel-based (PBC) and object-based (OBIA) classifications. Land cover change was determined through the identification of four cover classes: constant grassland (G) and constant shrubland (S), representing the area that maintained the same classification label (i.e., grassland or shrubland) from 2012 to 2018, and two more classes, describing the changes from grassland cover to shrubland (G→S) and vice versa (S→G).
MethodGG→SS→GS
PI84.6%6.5%2.2%6.7%
PBC63.1%12.3%13.3%11.3%
OBIA70.8%8.2%12.5%8.4%
Publisher’s Note: MDPI stays neutral with regard to jurisdictional claims in published maps and institutional affiliations.