Article

Long-Time Interval Satellite Image Analysis on Forest-Cover Changes and Disturbances around Protected Area, Zeya State Nature Reserve, in the Russian Far East

1
Department of Global Agricultural Sciences, Graduate School of Agricultural and Life Sciences, The University of Tokyo, 1-1-1, Yayoi, Tokyo 113-8654, Japan
2
Institute of Geology and Nature Management, Far Eastern, Branch of Russian Academy of Sciences, Relochny Lane, 675000 Blagoveshchensk, Amur Region, Russia
3
Center for Far Eastern Studies, University of Toyama, Gofuku 3190, Toyama 930-8555, Japan
4
Faculty of Life and Environmental Sciences, University of Tsukuba, 1-1-1 Ten-noudai, Tsukuba 305-8572, Japan
5
Zeya State Nature Reserve, Stroiteley St. 71, 676246 Zeya, Amur Region, Russia
6
Amur Branch of Botanical Garden-Institute, Far Eastern Branch of the Russian Academy of Sciences, Ignat’ evskoe shosse str., 2nd kilometer, 675000 Blagoveshchensk, Amur Region, Russia
*
Author to whom correspondence should be addressed.
Remote Sens. 2021, 13(7), 1285; https://doi.org/10.3390/rs13071285
Submission received: 2 February 2021 / Revised: 2 March 2021 / Accepted: 24 March 2021 / Published: 27 March 2021
(This article belongs to the Special Issue Remote Sensing for Land Cover and Vegetation Mapping)

Abstract

:
Boreal forest areas in the Russian Far East contained very large intact forests. This particular area is considered one of the most productive and diverse forests in the boreal biome of the world, and it is also home to many endangered species. Zeya State Nature Reserve is located at the southern margin of the boreal forest area in the Russian Far East and has rich fauna and flora. However, the forest in the region faced large-scale forest fires and clearcutting for timber recently. The information of disturbances is rarely understood. This study aimed to explore the effects of disturbance and forest dynamics around the reserve. Our study used two-year overlaid Landsat images from Landsat 5 Thematic Mapper (TM) and 8 Operational Land Imager (OLI), to generate forest-cover-change maps of 1988–1999, 1999–2010, and 2010–2016. In this paper, we analyze the direction of forest successional stages, to demonstrate the effectiveness of this protected area in terms of preventing human-based deforestation on the vegetation indices. The vegetation indices included the normalized burn ratio (NBR), the normalized difference vegetation index (NDVI), and the normalized difference water index (NDWI). The study provided information on the pattern of forest-cover change and disturbance area around the reserve. The NDWI was used to differentiate between water and non-water areas. The mean values of NBR and NDVI were calculated and determine the forest successional stages between burn, vegetation recovery, grass, mixed forest, oak forest, and birch and larch forest. The accuracy was assessed by using field measurements, field photos, and high-resolution images as references. Overall, our classification results have high accuracy for all three periods. The most disturbed area occurred during 2010–2016. The reserve was highly protected, with no human-disturbance activity. However, large areas from fire disturbance were found (137 km2) during 1999–2010. The findings also show a large area of disturbance, mostly located outside of the reserve. Mixed disturbance increased to almost 50 km2 during 2010–2016, in the buffer zone and outside of the reserve. We recommend future works to apply our methods to other ecosystems, to compare the forest dynamics and disturbance inside and outside the protected area.

Graphical Abstract

1. Introduction

Boreal forests are considered the largest ecoregion on Earth. This particular area is well-known for its productivity and diverse forest types which is home to many endangered species. About 20% of the world’s boreal forests are located in Eastern Siberia and the Russian Far East affected by natural disturbances and human activities [1]. Deforestation and degradation are expected to expand in the Central Siberia [2], the Eastern Siberia, and the Russian Far East [3]. In recent decades, unprecedented large-scale fire events have caused air pollution, smog blankets, ecosystem degradation, and biodiversity loss [1,3]. The increasing temperature of and the windy weather may intensify the forest fire on the mountain top after lightning occurred. There were significant positive correlations between lightning and wetter precipitation and the advent of forest fires during the summer and fall seasons [4]. More than 70% of forest fire in Russia are caused by human activities, 11% by lightning, 10% by agricultural prescribed burning [5,6]. Road building and bridge construction were expanded in Siberia and the Russian Far East, which has a tendency to cause the area more flammable when the weather is dry and warm. Mining and prescribed burning are also the causes of huge fire area in the 2015 Russia wildfire event and 2003 Siberian Taiga Fires event. The fire was out of control, causing as much as ten million hectares from West Siberia to the Russian Far East [7]. Scientists have linked the loss of forest cover in fires to human activity and global climate change, but as some remote regions in the Russian Far East are still unexplored, there are still lack of many data on the information of land-cover characteristics and forest dynamics [8].
Several nature reserves have been designated in the Russian Far East, to protect the landscape and conservation efforts against land conversion [9,10]. Although these remote places have a little human occupation, lack of monitoring makes them susceptible to landscape alteration, such as clearcutting for timber, agricultural expansion for ranching, mining, and road building [11]. Keeping the forest landscape stable and maintaining forest succession after disturbance is necessary to protect species diversity and climate regulation. Boreal forests are famous for their annual fire cycle [12]. However, some disturbed areas have not recovered to the old-growth forest, and many old-growth forests have turned into secondary forests and grassland. This modern forest dynamic increases the risk of reducing the function of the forest ecosystem, raising the risk of global climatic disturbance [13].
The inaccessible area and remote locations mean that forest changes and disturbance history have not been well studied [9]. Studying areas requires advanced technologies such as remote sensing. Using remote sensing to detect the disturbance history is essential for evaluating the effectiveness of site protection measures [9]. For example, satellite image analysis demonstrated that the Russian Far East forests were greatly affected by Siberian Taiga Fires in 2003, which destroyed nearly 3 million ha of forest, the most considerable loss in the Russian Far East’s history [2,13,14]. Satellite imagery is routinely used to calculate the normalized difference vegetation index (NDVI) and the normalized burn ratio (NBR), and the normalized difference water index (NDWI) which were used to detect vegetation health, fire severity, and water [15,16]. Such data can be useful for landscape management [17,18]. As commercial satellite images are costly, the use of freely available data, such as Landsat images, is a popular alternative for ecologists and environmentalists [2,18,19]. However, the images have disadvantages for studying forest cover in the Russian Far East due to frequent cloudiness and short seasons, limiting the number of high-quality images available [20]. Two year images could be overlaid to increase reliability. Such a two-image classification can yield higher accuracy than standard single-image classification, overcoming limited image availability [21]. However, the potentially long time interval between successive images reduces the accuracy of detecting forest disturbances, resulting in underestimation of disturbance [22]. A disturbed area might have recovered to typical vegetation in the later image and can no longer be treated as disturbed area [2,23]. Therefore, to adequately evaluate disturbance, it is necessary to consider changes of the forest types or successional forest type direction.
Here we determined forest-cover change and disturbance in a protected region of the Russian Far East to help managers prioritize conservation efforts on protecting flora and fauna and managing fuel above ground to prevent severed fire [24,25,26,27]. We present the maps of forest-cover change between 1988 and 2016, in this vulnerable ecosystem, based on remote-sensing data, to show the following: (1) how forest cover and disturbance differ among inside the protected area, the buffer zone, and outside the protected area. The buffer zone indicated the area that runs along the boundary of the reserve that limited some level of human activities but not highly restricted as the reserve and enhance the protection of biodiversity of the reserve. The next is (2) how vegetation indices can be used to overcome disadvantages of long-interval image analysis to show forest successional stages after disturbance; and the last is (3) how effective the reserve is in terms of preventing fire disturbance and protecting forest based on the area of forest successional directions inside, the buffer zone, and outside of the reserve.

2. Materials and Methods
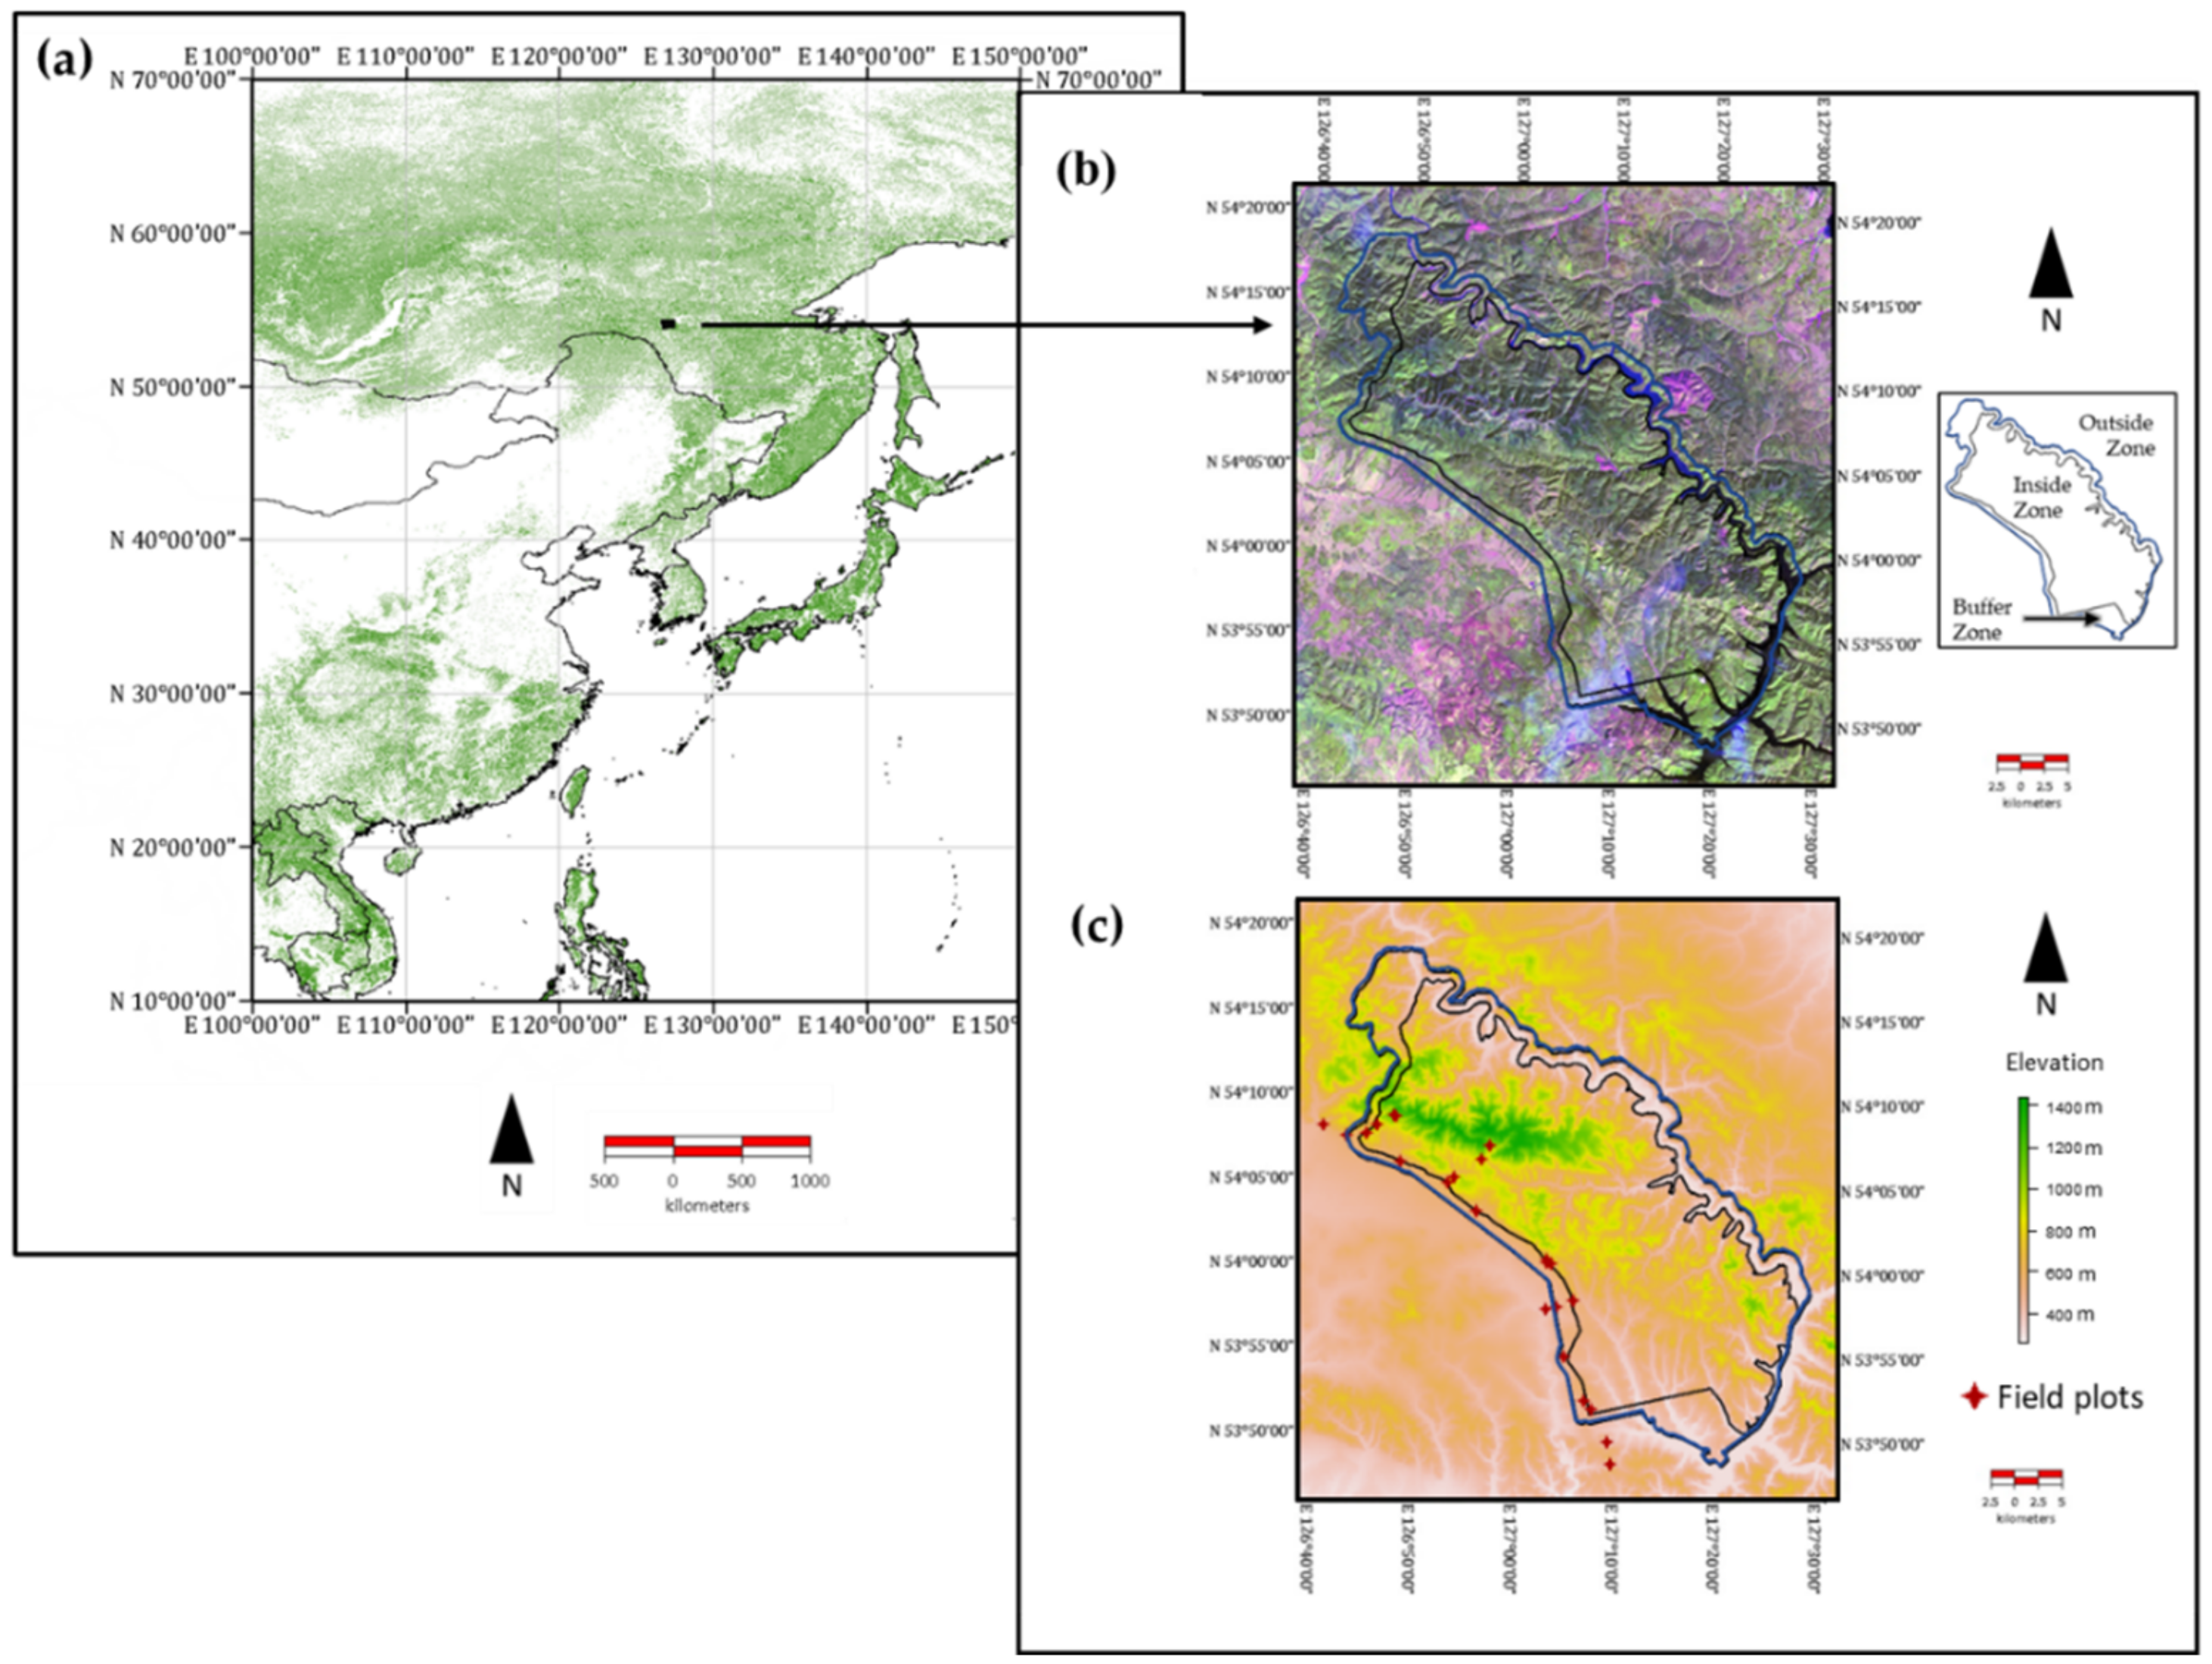
2.1. Study Area

The study area is located in Zeya State Nature Reserve, Amur Oblast, Far Eastern Russia (53°58′–54°07′N, 126°52′–127°22′E; Figure 1). The reserve, with a total area of 99,430 ha, was established on 3 October 1963, at the eastern end of the Tukuringra Ridge. Within the reserve, 40% of the area has an elevation of up to 700 m a.s.l., 35% of 700 to 1000 m, 18% of 1000 to 1300 m, and 7% of over 1300 m. The elevation gradient is shown in Figure 1. The average temperature is −28.8 °C in January and +19.7 °C in July. The average annual precipitation is 515.2 mm. The prevailing winds are northeasterly, most commonly (75%) at 1.2 to 2.2 m/s. The reserve are considered home to more than thousands of species, including 1111 species of plants, 2001 species of invertebrates, and 225 species of vertebrates. The biodiversity in the reserve is richer than other protected area in the Russian Far East. More than 35 species of fauna and flora are listed on the Red Book of Russia, and 10 species of bird and 1 species of mammal are on the International Union for Conservation of Nature (IUCN) Red List [28].
More than 90% of the reserve is covered by 7 major different forest types, with the most dominant be the Betula platyphylla and Larix gmelinii species (80% of the reserve and Picea ajanensis species (10% of the reserve) (Supplementary Materials Table S1). According to Dudov’s [29] spatial map of vegetation, the mountain tundra belts, located at elevations of >1200 m, are dominated by alpine dry heath species, such as Vaccinium uliginosum L., Arctous alpina (L.) Niedenzu, and Betula exilis Sukacz., edged by the dark green shrub-like tree Pinus pumila (Pall.) Regal. Picea ajanensis (Lindl. et Gord.) Fisch. ex Carr. grows at two elevations, high on the mountains and sometimes mixed with larch along river valleys. Larix gmelinii (Rupr.) Kuzen and Betula divaricata Pall. spread across the mountain in various habitats and end at the mountain tundra belt (1200 m). Vegetation under the canopy of larch forests includes Vaccinium vitis-idaea L., Ledum palustre L., Rhododendron dauricum L., and green mosses. Grasses and willows grow in the river valleys and floodplains at lower elevations. Quercus mongolica Fisch. et Ledeb. grows in the southeastern part of the reserve along the northern slopes. Tilia amurensis Rupr., Lespedeza bicolor Turcz., and Corylus heterophylla Fisch. ex Trautv. grow under the canopy of oak and black birch forests. Other plants along the river valleys include Dasiphora fruticosa (L.) Rydb., Syringa amurensis Rupr., Calamagrostis spp., and Carex spp. Meadows and grasslands are scattered in several places, such as fire-disturbed areas and floodplains. Marshes occupy only a small area inside the reserve, mostly in flat areas and on gentle slopes with northern exposure. In 2003, the region experienced a large-scale fire (around 700 km2) that caused extensive damage to forests both inside and outside the reserve.
The reserve established a buffer zone along the edge of the reserve, extending more than 5 km distance from the border of the reserve to the road on the eastern side and to the electricity line on the southern side and to the river on the western and northern sides. The area has reduced some degree of human activities but is not quite restrictive as inside the reserve. The buffer-zone area strengthens the conservation of biodiversity, providing protection shield to the reserve’s fauna and flora and only allowed limited intense use of natural resources. There is some monitoring at the buffer zone area to track human disturbance and infrastructure developments, like roads and bridge construction. Outside areas of the reserve beyond the buffer zone line owned by the federal government is seldom controlled or monitored by government officials. Rare surveillance may put the region at risk of forest destruction and landscape changes. The reserve interior was well protected from human disturbance, with no settlements or clearcutting activity within it. This situation has shown its effectiveness in protecting natural resources and ecosystems. However, many human-induced disturbances were still found nearby. The flat terrain and unprotected status outside the reserve make large forests vulnerable to human disturbance activity [30]. Clearcutting occurred more in the buffer zone during the most recent period because of easier accessibility and a new mining camp. In recent years, most forest fires have occurred in the clearcutting area, raising the question of whether the timber harvesters or the miners caused the fire and whether it was accidental or natural. For example, many areas of mixed disturbance located next to the mining area and the nearby electricity line in 2010–2016. An increasing fire frequency resulting from changes in species composition that favor the regrowth of deciduous forests prone to fire [31,32] usually occurs in small-scale clearcutting or selective logging areas [30].

2.2. Data and References
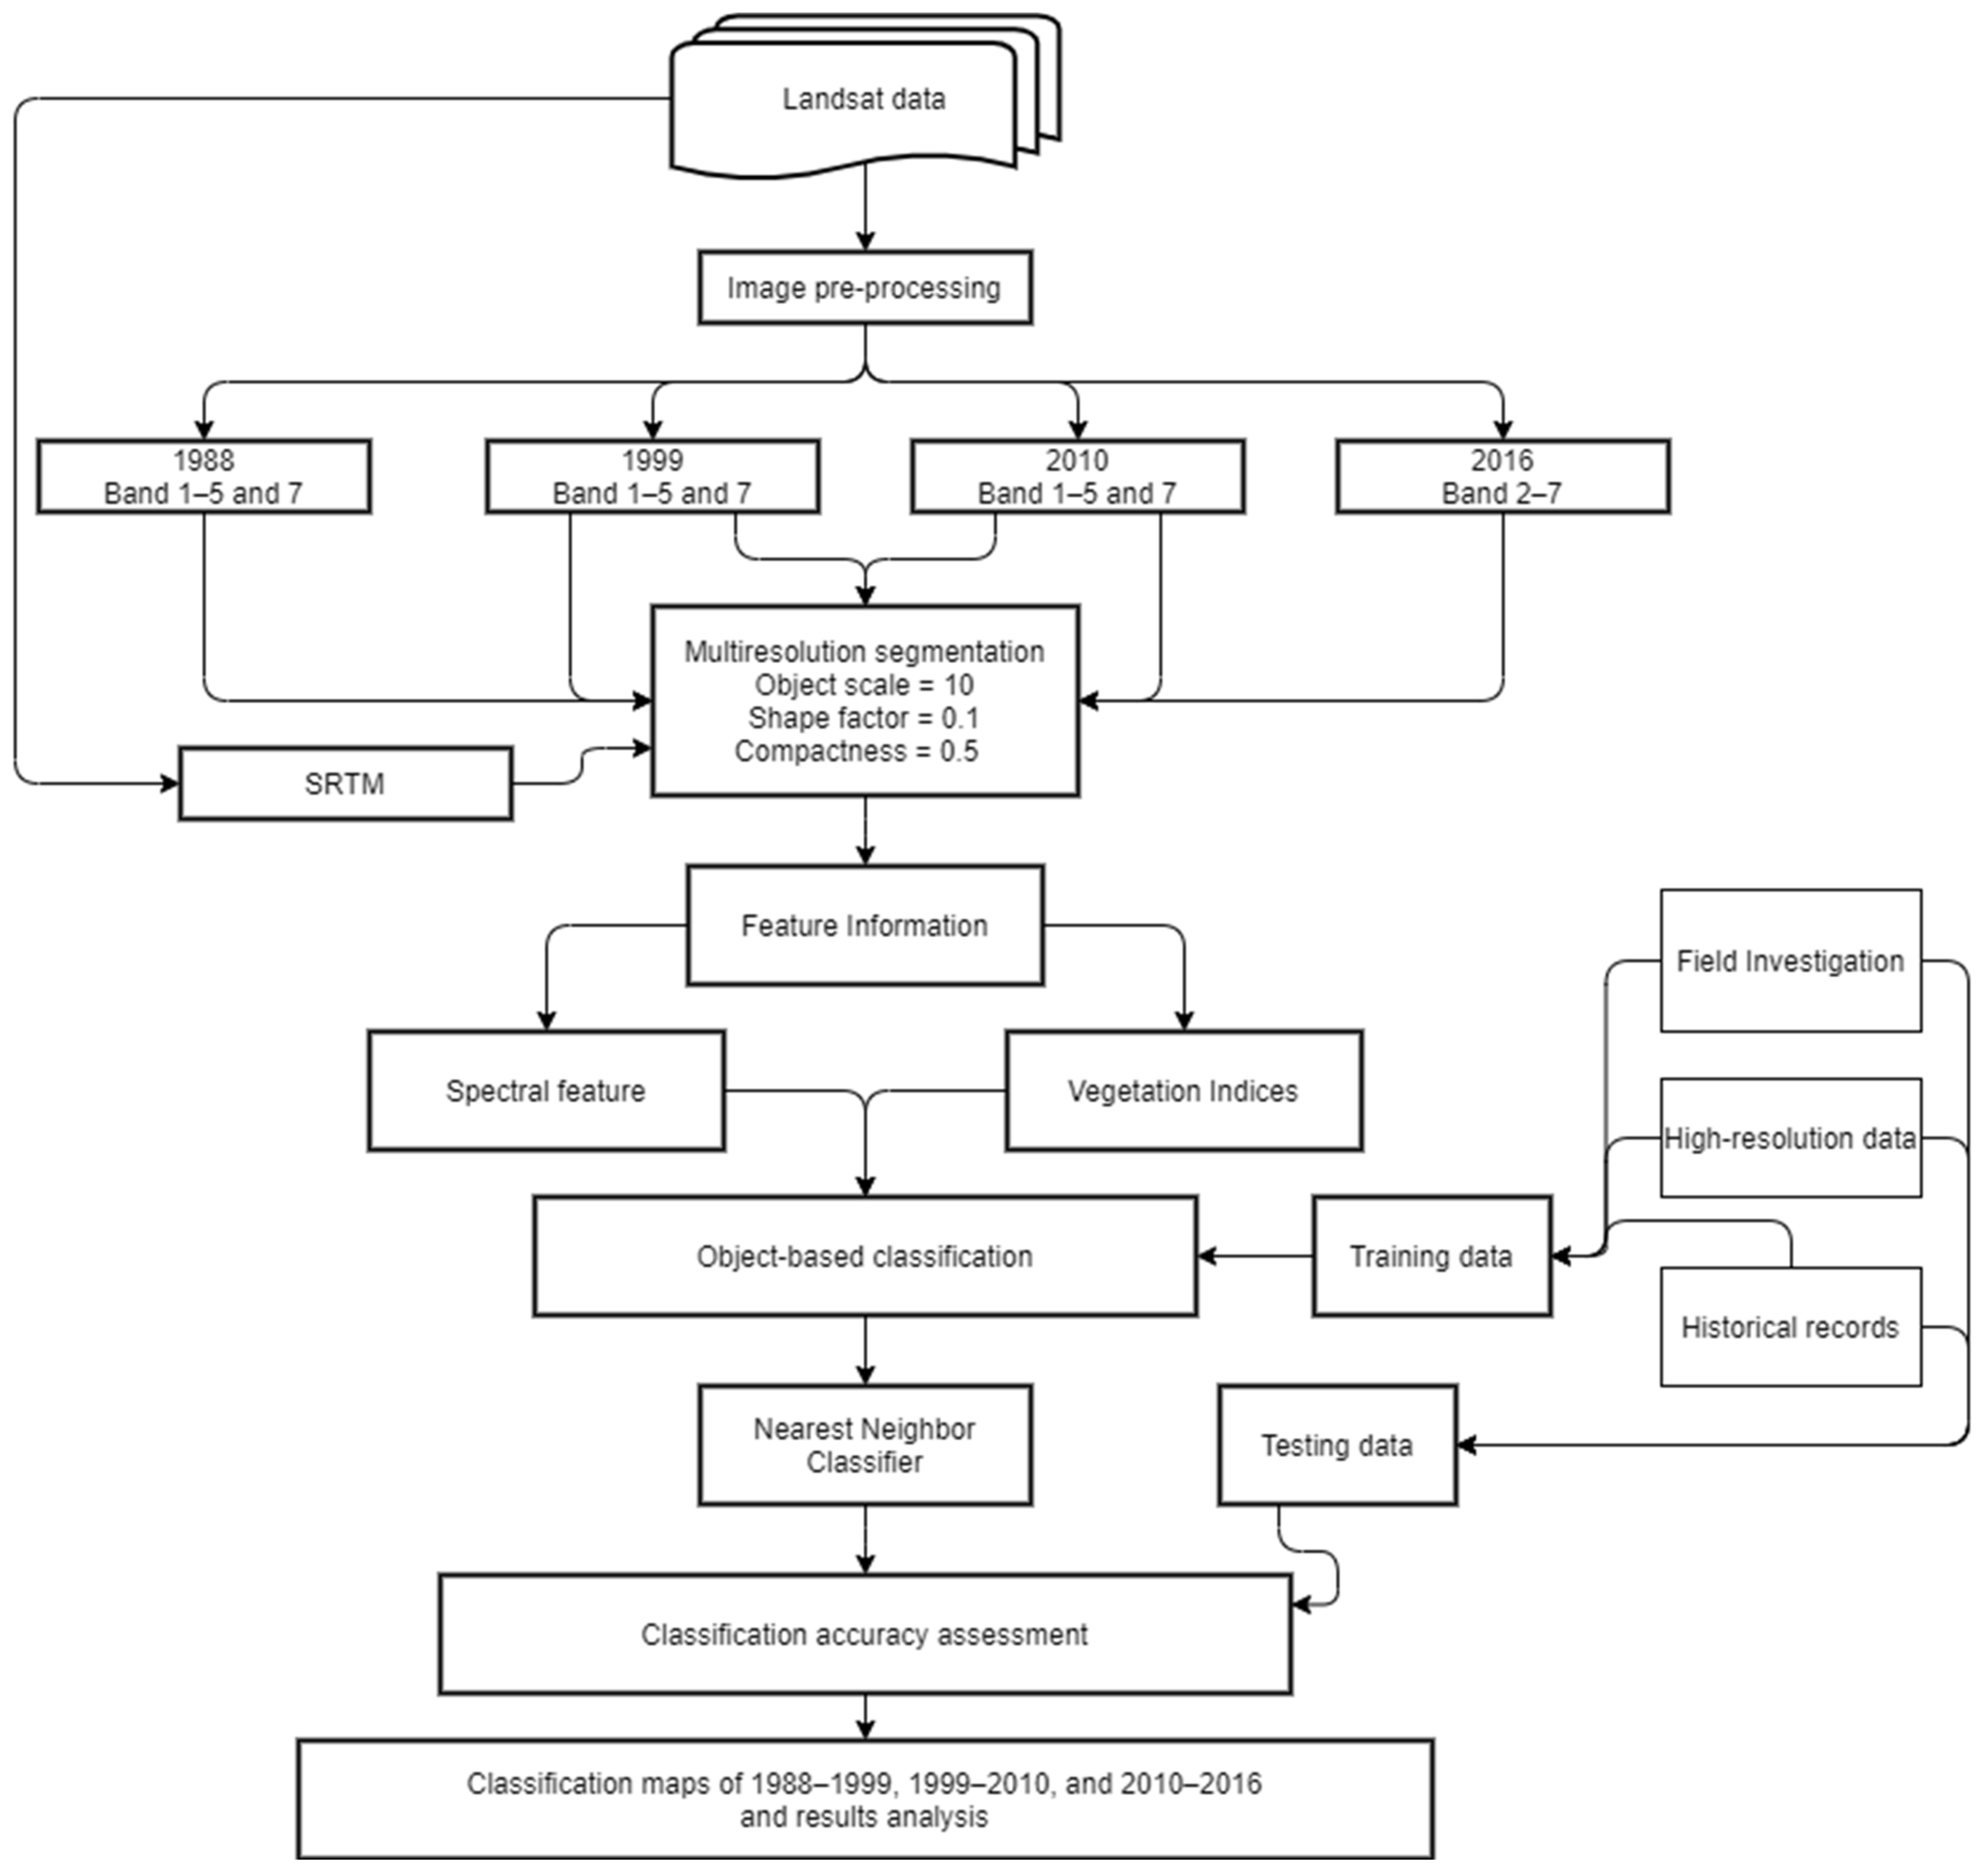
We used two datasets in this study: satellite images of the reserve during summer, for classification; and field data (Supplementary Materials Table S2) plus maps and literature, along with the high-resolution image and photographs, as references. The dataset for classification included Landsat satellite imagery, and 30 m Shuttle Radar Topography Mission (SRTM) data were acquired from the US Geological Survey’s Earth Resources Observation (USGS) [33]. We selected Landsat images with <10% cloud cover during the growing season (1 June to 30 September). After screening, we chose only four most suitable images based on cloud-free and relatively within the same season and appropriate time-interval, acquired in 1988, 1999, 2010, and 2016, from the Landsat Thematic Mapper (TM) and Operational Land Imager (OLI) imagery (Table 1). The images were preprocessed, using radiometric calibration, atmospheric correction made with COST model [34], and topographic correction made with SRTM as Digital Elevation Model (DEM) with TNTmips 2017 software (MicroImages, Raymond, NE, USA).
To preprocess the SRTM images, we used the TNTmips2017 Radiometric Correction, the most suitable parameters that provide the best images on all four dates were a scale of 1 for reflectance, “dark object from histogram”, and “very hazy” with a skylight fraction of 0.80 for correction. These parameters provided similar ranges of reflectance values between sunny and shadowy areas. After the reflectance images of all the full Landsat scenes were produced, they were extracted into regions of interest that covered the entire reserve and some areas outside it.
The reference dataset used as training and validating samples to evaluate classification accuracies, we investigated the area inside and outside the reserve during the summer season, August 2016 to 2018, and collected measurement data (Supplementary Materials Table S2). We established twenty-three plots in total: eleven plots (NR1–NR11) inside the reserve, six plots in the buffer zone (BZ1–BZ6), and six plots outside the reserve (ONR1–ONR6), each covering approximately 100 m2 (Figure 2). In each plot, we recorded tree species, tree height, and diameter at breast height, to identify forest cover. The photos and evidences of burn scars and cut woods helped identify the disturbance type in the area. Most of the plots were dominated by L. gmelinii and Betula platyphylla, and the higher elevation plots were dominated by P. ajanensis. Several plots, however, had experienced forest fire and clearcutting in the past.
Besides the field investigation information, other references included drawing maps, vegetation maps, high-resolution images, and photographs. For drawing fire maps, the reserve-management-office specialists observed and recorded the burned area that occurred from the 1990s to 2010 and hand-drawn the boundaries of the burned area on the reserve map. The vegetation map had been published in 2016, in Russian, by Dudov [29], using satellite images as a based map. The author collected information in the field and produced the classified vegetation map of the reserve, consisting of 45 forest classes in total. The mountainous topography and inaccessibility of the northern part of the reserve made it difficult for us to collect data there, so we used a high-resolution image from Digital Globe WorldView-2, taken on 20 September 2010, covering around 20 km2, to investigate the inaccessible area at the northern border of the reserve and check whether there is any evidence of forest burning or clearcutting area. We also obtained photographic evidence and evidence from experts and scientists who previously conducted experiments inside the reserve. The high-resolution images from global online mapping services, such as Google Earth imageries, Bing Maps, and Google Maps, also allowed us to monitor the change of the landscape and used it as one of the references to identify of forest cover and disturbance outside of the reserve area.

2.3. Classification

For image-classification processing (Figure 3), image datasets were first classified by object-based segmentation, a multi-scale object-oriented procedure that divides an image into small regions called “objects”, using eCognition v. 9.0 software (Trimble Geospatial, Sunnyvale, CA, USA). This study introduced a two-year overlaid image classification technique. In our object-based classification process, we inserted 12 layers of 6 bands (R, G, B, NIR, SWIR1, and SWIR2) from two Landsat dates (pre- and post- year images, e.g., 1988 and 1999) and a layer from the SRTM data in the workspace. All 13 band images were then segmented into objects, using a multiresolution segmentation algorithm with a scale of 10 for the most appropriate scale parameter [35]. We also gave image layer weights of 2 for NIR layer to weigh vegetation cover more. The other parameters remained defaults (0.1 for shape and 0.5 for compactness) [36]. The multiresolution segmentation algorithm provided ability to divide the pixels with similar spectral values into polygons. This technique lowers the numbers of heterogeneity polygon areas [37].
After segmentation, three vegetation indices (NDVI, NDWI (normalized difference water index), and NBR) and band values (RED, NIR (near-infrared), SWIR1 (short-wave infrared band 1), and SWIR2) of the Landsat images were calculated in the software, to provide information on polygon index values [38]. The NDVI was used to detect live green vegetation [39], to separate forest type into different classes. The NDWI was used to detect surface waters in wetlands [40] and to distinguish water and non-water areas. The NBR was used to detect burned areas [23]. We also calculated the change of the NDVI and NBR between years. The change of NBR between two years allowed us to locate the burn area in our study area, while the change of NDVI can give us a hint as to the location of deforested areas.
For the classification process, the study employed the nearest neighbors (NNs) algorithm. The core concept of the non-parametric machine learning NN algorithm method was that if the training objects and the neighboring objects in feature space belonged to the same class, then the objects would be identified as that class [41]. It was appropriated for our study because many objects had spectral values across multiple categories. The objects unfitted to the class would be identified as unclassified objects on the classification layer. We also used the interactive algorithm, such as the thresholding algorithm and assigning algorithm, for the post-classification to assign the unidentified and mismatch class objects to the proper class based on spectral values and indices. During the classification process in eCognition, first, we inserted the class hierarchy of 17 land-use classes. We selected training objects that represented each class well and assigned classes to the objects based on the criteria in Table 1. We checked the area on the layers and selected the polygons that match the physical description of each land-cover type, based on the Zeya State Nature Reserve vegetation map, field investigation, and high-resolution images used as training samples. After creating training samples for each image, NDVI and NDWI were calculated in the software, to add sufficient information for object features, which included 12 band values, four spectral indices, and the SRTM. In each period classification, we applied the standardized nearest neighbor (SNN) function [42] with the object features altogether with additional parameters that were already predefined in the software, including brightness, relative borders, shape index, and area index. The function allowed us to input specific characteristic information to the training objects, so that the classification would classify the objects based on similar information as the training objects. The classification function used NN algorithm and produced raster layer results of the 17 classes and unclassified class. After classification, several misclassified or unclassified isolated objects may exist, so we corrected them by using a basic classification algorithm that includes a class-reassignment algorithm, to adjust misclassified objects based on elevation range (Table 2), expert’s explanation, and reference data.
The thresholding algorithm allowed us to reassign misclassified class to the aiming class based on the condition we set. First, we corrected the unclassified class to WATER class, using a thresholding algorithm, by setting the mean NIR value to be less than 80. Due to the mislocation of MTV class and GRASS class, we reassigned MTV class of <1100 m a.s.l. as GASS, and GRASS class of ≥1100 m a.s.l., as MTV, by referring to SRTM elevation layer. Moreover, mislocated MSF class in the lower valley of <700 m a.s.l. was reassigned to SFRV class. These reassignment was executed by “assigned class” algorithm. On the other hand, a few unclassified objects and human-related disturbance classes misidentified inside the reserve were reassigned to the proper classes by their properties and physical characteristics or similarity to the nearest class inside the reserve, by executing “selected object” algorithm. This interactive algorithm allowed us to reassign misclassified class to the desired class to only the objects we selected. Two-year overlaid images were finally classified to obtain the results of one period of the forest-cover-change maps. We performed the same classification algorithms for three periods (1988–1999, 1999–2010, and 2010–2016). A total of three maps of three periods were generated as the final classification maps.

2.4. Accuracy Assessment

We randomly selected new sample “objects” or polygons to assess classification accuracy within the study area. To avoid appearing on a similar location as a training area and cloud and shadow effects, the “objects” located in such area were excluded, and then the total numbers of “objects” for validating process were 2121 for 1988–1999, 2321 for 1999–2010, and 2541 for 2010–2016. Those new sample objects were treated as validating objects and selected independently from training sample objects. The validating objects were identified based on references, including ground-truth plots, drawing fire map, vegetation maps of 2016, high-resolution image, and experts’ knowledge to evaluate the classification performance, using the “Accuracy Assessment” function in eCognition. We inserted the vegetation map 2016 raster layer and high-resolution image to eCognition. We selected validating objects based on reference layers and also refer to drawing a fire map. For classes outside of the reserve which were inaccessible, we referred to a high-resolution image of 2010, employed from Digital Globe World View-2, Google Maps, and Bing Maps, along with field photographs (see Supplementary Materials Figure S1) and staffs’ knowledge, to identify the ground-truth forest cover. The validating objects were then converted to the Training and Test Area (TTA) Mask, to compare with the classification layer. Finally, classification accuracy was assessed, using “Error Matrix Based on TTA”. The outputs included user’s accuracy, the number of correctly classified objects in that class divided by the total number of that class’s objects on the classified maps, producer’s accuracy, the number of correctly classified objects in that class divided by the total number of reference objects for that class, the overall accuracy, the total number of correctly classified objects divided by the total number of reference objects, and Kappa index of agreement (KIA) that measured the interrater reliability.

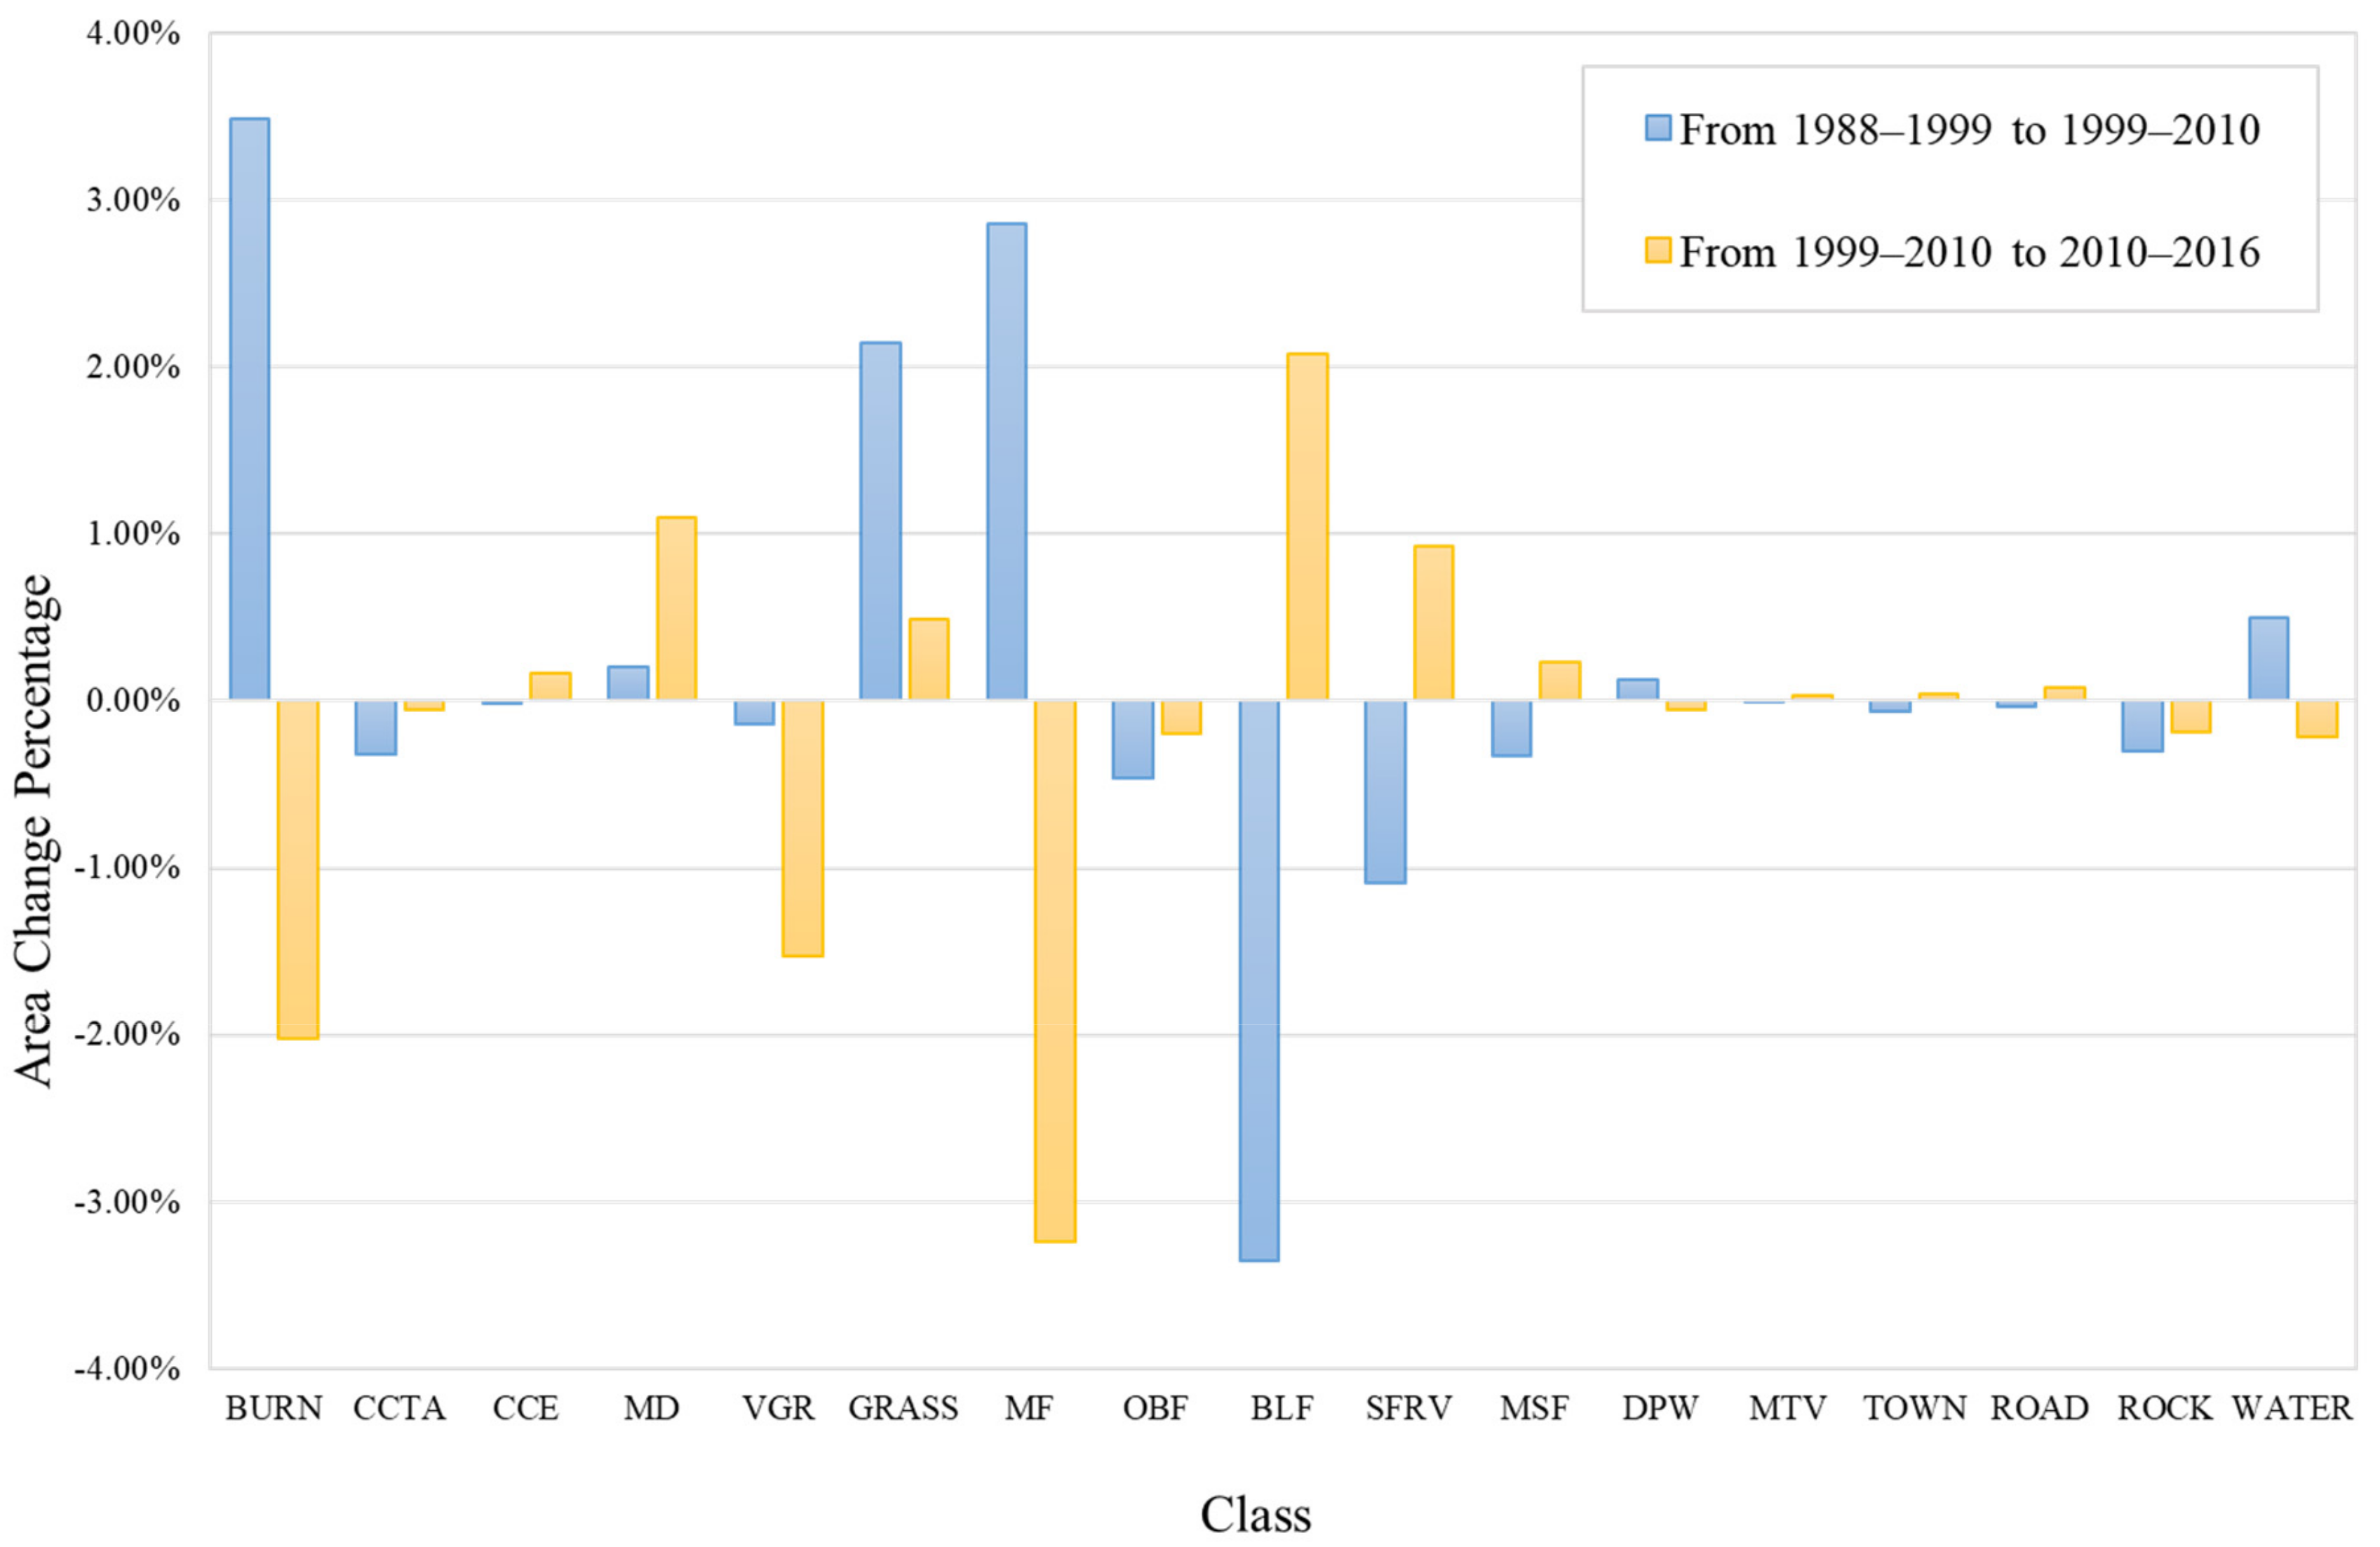
2.5. Forest-Cover Change and Disturbance Analysis

We generated forest-cover-change maps based on the 17 classes in each of the three periods. Delineating three zones—inside the reserve, a buffer (an area that runs along the boundary of the reserve which limited some level of human activities but not highly restricted as the reserve and enhance the protection of biodiversity of the reserve), and outside the reserve— helped us analyze the forest-cover change and disturbance areas. The buffer zones added security to the reserve’s biodiversity and ecosystem. The reserve established the buffer zone border to avoid heavy usage of natural resources. To understand the dynamics of forest and disturbance around the reserve, we separate the buffer zone area from the outside area to monitor the disturbance patterns and trend near the border of the reserve. The area was extracted by using the polygons of inside, buffer zone, and outside the reserve for forest-cover change and disturbance analysis. We calculated the areas of all the classes and created a matrix of area changes among the three periods and the three zones. We focused on six classes (BURN, VGR, GRASS, MF, OBF, and BLF) for analysis. These classes represented typical forest successional stages after disturbance in large areas inside the reserve, buffer zone, and outside the reserve. We excluded four classes (SFRV, MSF, DPW, and MTV) because those vegetation types were at higher elevations, had small area, and were rarely disturbed. We analyzed the mean values of NDVI and NBR of the six successional stages to assess forest succession. The lowest average value of NDVI and NBR class was considered the first stage while the higher average value class was considered the next stage and so on. The broad-leave forests typically dominated the land before needle-leave forest, thus we arranged BLF as the last stage of forest succession. After we assessed forest succession, we created a matrix of the percentage of area changes of successional stages to show their directions in the three zones.
Finally, we compared inter-annual fires to check the more precise dates of fire in the study region, using the MCD64A1 product [43] from Moderate Resolution Imaging Spectroradiometer (MODIS) satellite [44] (Supplementary Materials Figure S2). As MODIS started orbiting after 2000, it was possible to compare only two periods (1999–2010 and 2010–2016) in this research. The MODIS sensor has 36 spectral bands to monitor earth and water surface conditions, spatial resolutions of 250 m, 500 m, and 1 km, and temporal coverage of 1 or 2 days [45]. We selected the MCD64A1 product because it was specifically developed for burned area detection and has 500 m spatial and 1 month temporal resolutions [46]. This helped us better understand how the fire cycle impacted the forest cover in our study area.

3. Results

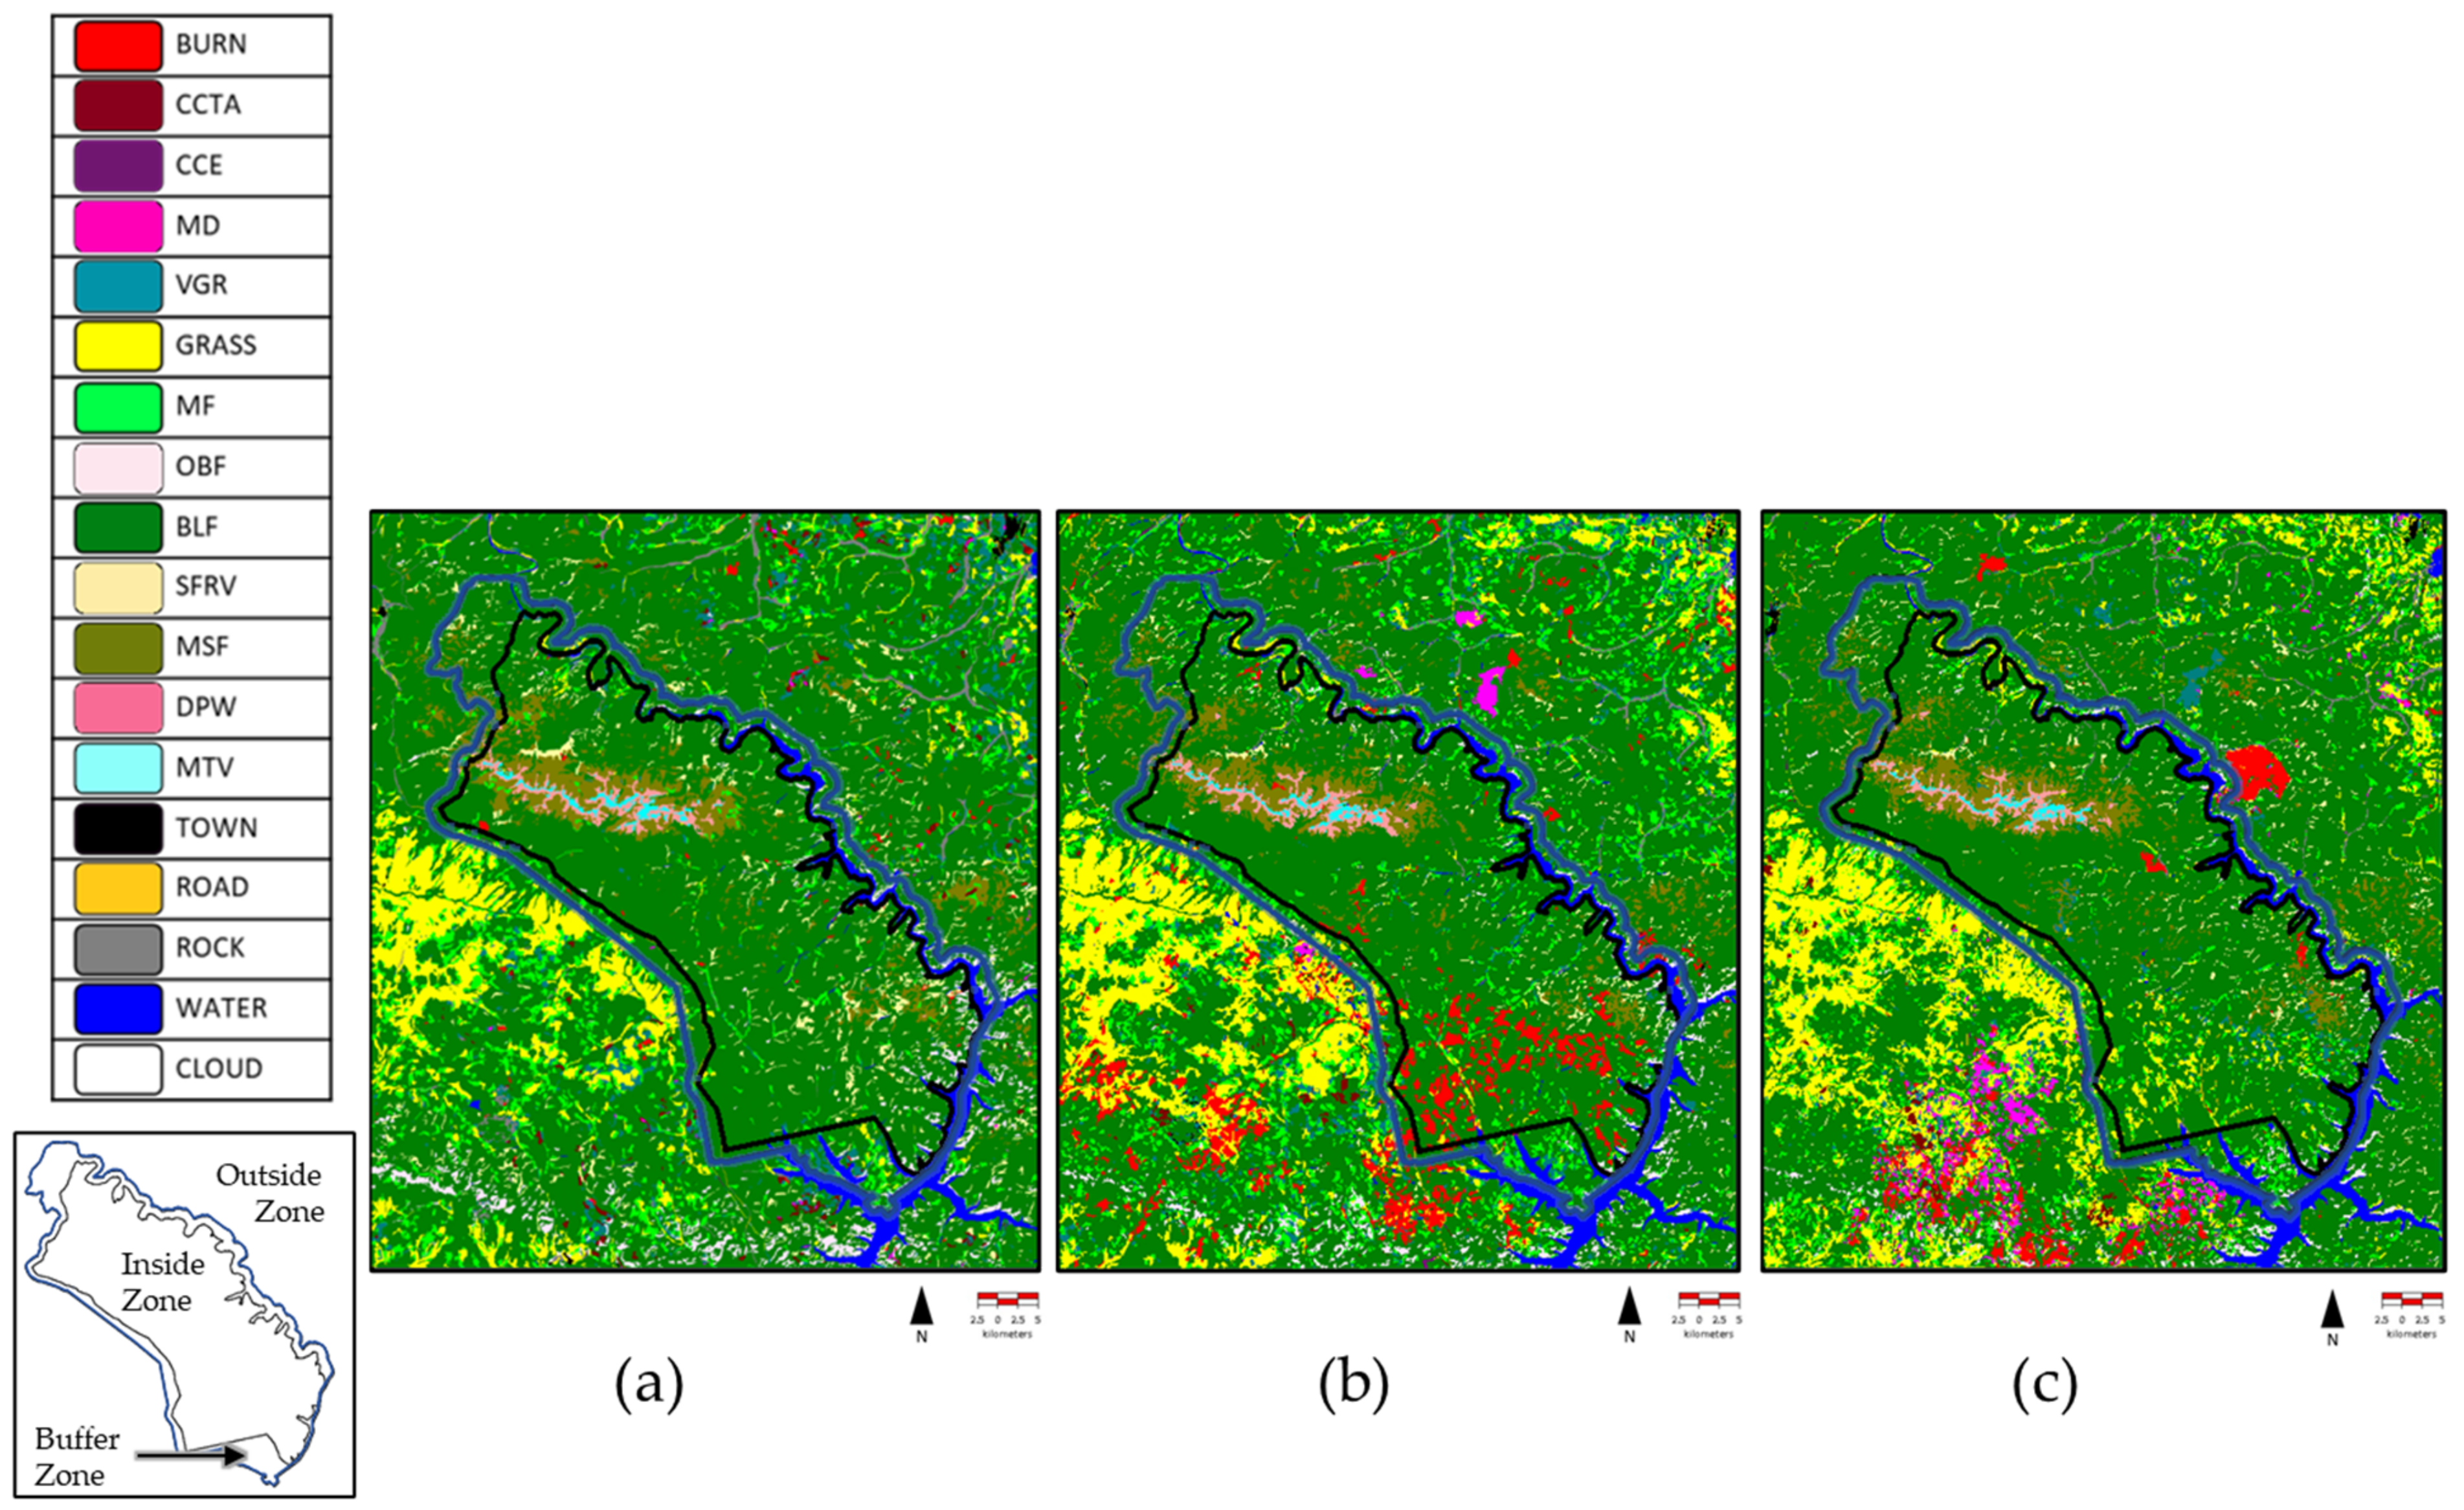
3.1. Classification Maps

The object-based classification produced three changed maps from three periods (1988–1999, 1999–2010, and 2010–2016). The maps indicated “change classes” and “stable classes” (Figure 4). “Changed classes” referred to the disturbance and recovery classes for which a large change was detected during classification (Table 1), while “stable classes” referred to classes for which a large change was not detected between pre- and post-year images, during classification; this included, forest, rock, water, permanent road, and settlement classes. These classified maps were the first change maps ever produced in the study area. This is also the first time we detected large burned area across the river at the northern border, outside the reserve, during 1999–2010 and 2010–2016. Most of the burned area lay to the southern, outside the reserve, near grassland. We found that, in the period 1988–1999, the burned area was small and hardly detected, but when compared to the period 1999–2010 and 2010–2016, large burned areas were detected across the southern parts of the reserve. By combining sequential images, we found that the classification had high overall accuracy for all three periods: 91.6% for 1988–1999, 90.9% for 1999–2010, and 94.3% for 2010–2016 (Table 3). For 1988–1999, the producer’s accuracy was low in most disturbance classes: 64.3% in mixed disturbance, 69.4% in burned area, 58.9% in clearcutting for timber or agriculture, and 70.0% in clearcutting for electricity line. The user’s accuracy for mixed disturbance class was 40.9%. This means that, even though 64.3% of mixed disturbance area from the ground-truth was correctly identified as mixed disturbance, only 40.9% of the mixed disturbance area on the classified map was actually mixed disturbance. For 1999–2010, the user’s accuracy was low in mixed disturbance (66.7%), burned area (40.9%), and vegetation recovery (57.4%). For 2010–2016, accuracy was very high except for clearcutting for timber or agriculture, with a user’s accuracy of only 60.0%.
Some of the forest areas in the southern parts experienced burning and two or more clearcuttings during 1988–2016. The burned area increased more than 3.48% of total area from the period of 1988–1999 to 1999–2010, but it decreased −2.02% from the period of 1999–2010 to 2010–2016, covering ~137 km2 (Figure 5; Table 4). Most of the burned area lay around the southern region inside the reserve during 1999–2010 (Figure 3; Supplementary Materials Table S3). The grassland area decreased inside and increased outside the reserve, after the first period. The total grassland area increased around 2.15% from the period of 1988–1999 to 1999–2010. Mixed disturbance was the only class that increased continuously, by about 0.20% from the period of 1988–1999 to 1999–2010, and 1.10% from the period of 1999–2010 to 2010–2016. Birch and larch forests lost ~42 km2 to vegetation recovery and lost ~212 km2 to mixed forests in 1999–2010, the largest conversion (Supplementary Materials Table S4). Other significant conversions of >50 km2 included birch and larch forests to grassland (69.35 km2), mixed forests to birch and larch forests (100.43 km2), and spruce forests in river valley to birch and larch forests (68.56 km2). In 2010–2016, most of the disturbance occurred in mixed forest areas, which lost ~19 km2 to burned area, and ~18 km2 became vegetation recovery (Supplementary Materials Table S5).
Some of the burned area areas in 1999–2010 repeatedly occurred during 2010–2016 (1.57 km2), and some converted to mixed disturbance (3.12 km2). Vegetation recovery area was unexpectedly low, at only 45 km2 during 2010–2016. The largest conversion was mixed forests to birch and larch forests (225.44 km2). The most surprising finding was the change of 51 km2 of the burned area to birch and larch forests. Major disturbances increased from the period of 1988–1999 to 2010–2016, especially outside the reserve, and both burned areas and mixed disturbance occupied larger areas (Figure 6). The burned area contained a large percentage increase from the period of 1988–1999 to 1999–2010 for all zones, inside (5.36%), the buffer zone (1.86%), and outside (2.93%) of the reserve, while it decreased in all zones, from the period of 1999–2010 to 2010–2016 (Figure 7). Clearcutting area for timber or agriculture and mixed disturbance only occurred in the buffer zone and outside of the reserve. Clearcutting for timber or agriculture increased the area by more than 0.18% in the buffer zone from the period of 1988–1999 to 1999–2010. For the outside of the reserve, mixed disturbance appeared to expand the area more than 0.31% from the period of 1988–1999 to 1999–2010, and 1.69% from the period of 1999–2010 to 2010–2016.

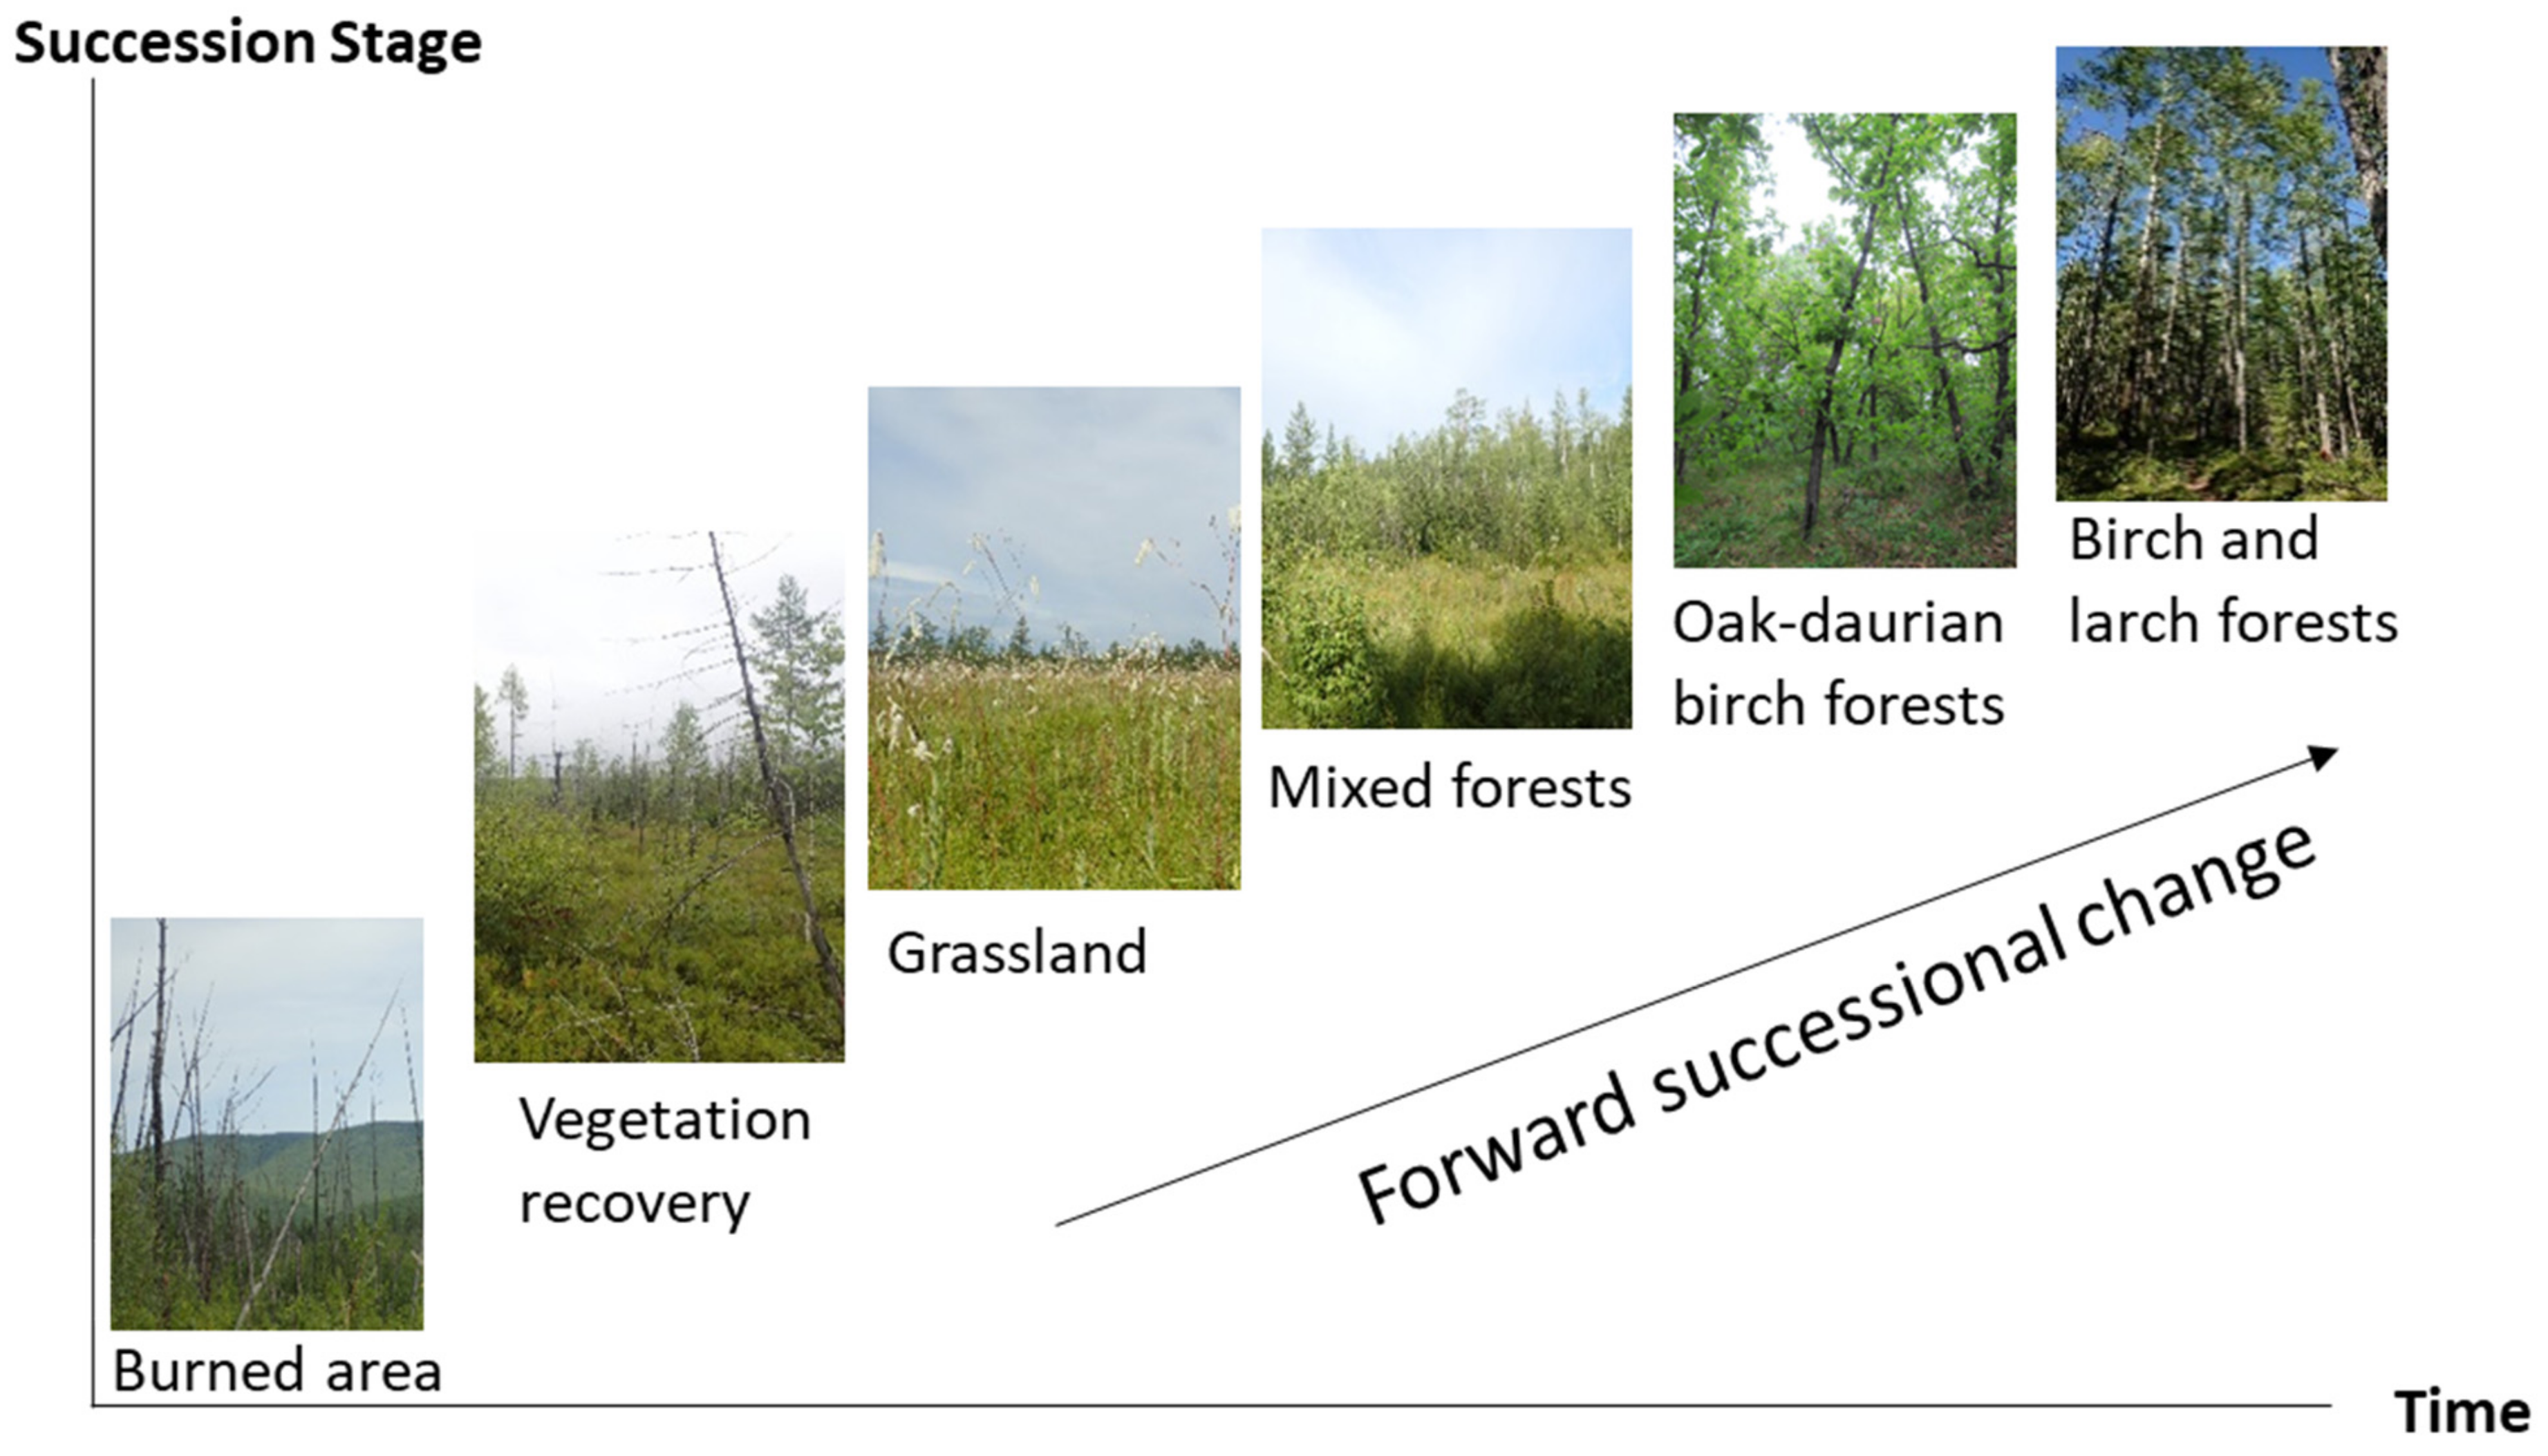
3.2. Determination of NDVI and NBR of Successional Stages

Mean NDVI and NBR values were lowest in burned area in 1999 and 2016 and tended to decrease during the study period. Most values were lower outside the reserve than inside and in the buffer zone. Higher values mean a gain in vegetation coverage. The characteristic values of NDVI in the growing season for this geoclimatic region ranged from 0.3 to 0.8 for NDVI of birch and larch forests [47,48,49]. Birch and larch forests, oak–Daurian birch forests, mixed forests, and vegetation recovery had higher NDVI and NBR values than grassland and burned area (Figure 8). The leftward and downward shifts of NDVI vs. NBR lines over time indicated that vegetation coverage decreased owing to disturbance. Birch and larch forests dominated the landscape, with larger NDVI and NBR, and with means between those of mixed forests and oak–Daurian birch forests. Oak–Daurian birch forests had higher mean values than the other five successional classes. The large-scale fire in 2003 occurred in many places with different degrees of severity. The long period (1999–2010) created a spatial mixture of vegetation coverage, so the mean NDVI and NBR values of the burned area areas varied between inside and outside the reserve. However, based on box plots of NDVI and NBR (Supplementary Materials Figures S3–S6), some of burned area and vegetation recovery areas had already recovered to a similar index value as grassland or higher. We then determined the ranking of the six successional classes after burn disturbance from first to last as burned area, vegetation recovery, grassland, mixed forest, oak–Daurian birch forests, and birch and larch forests based on the field investigation information. Thus, after a forest fire, areas enter the vegetation recovery stage before grassland develops. The growth of broadleaf and conifer seedlings creates a mixed of short grass and some trees. Broadleaf oaks or birch fully occupy the areas a few years later. If the areas are far from water bodies, larch will finally outcompete them and dominate.

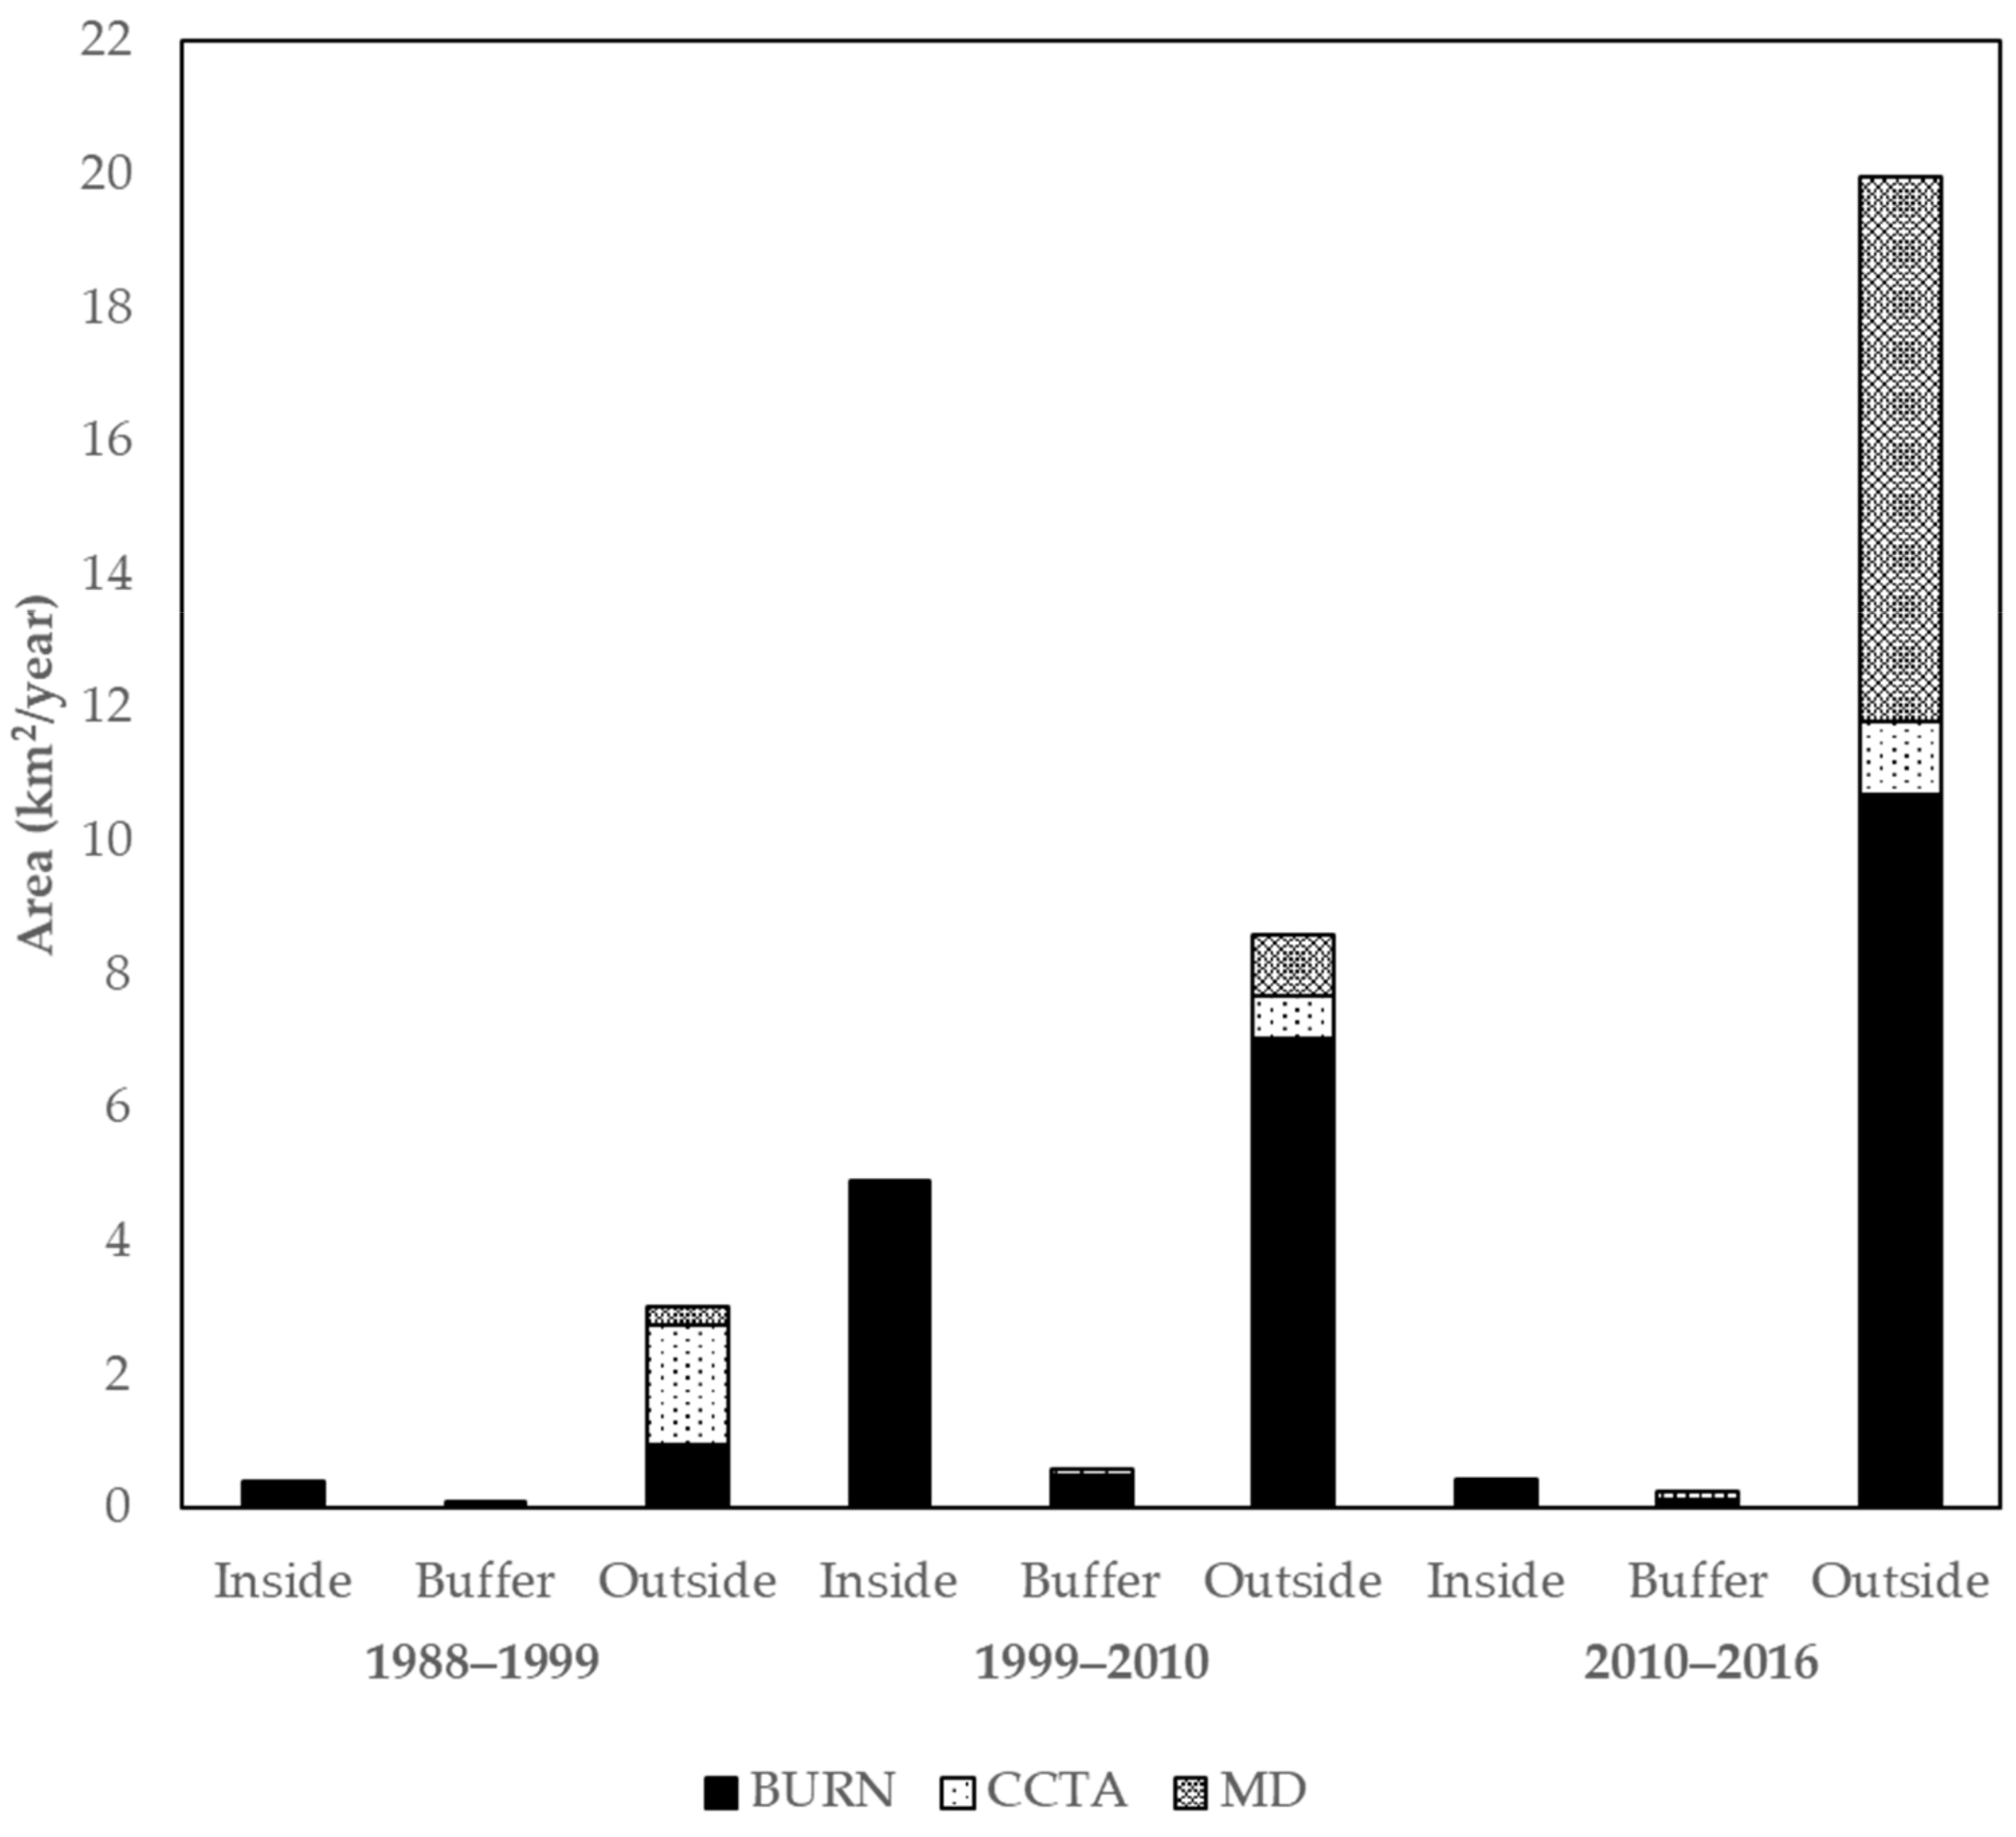
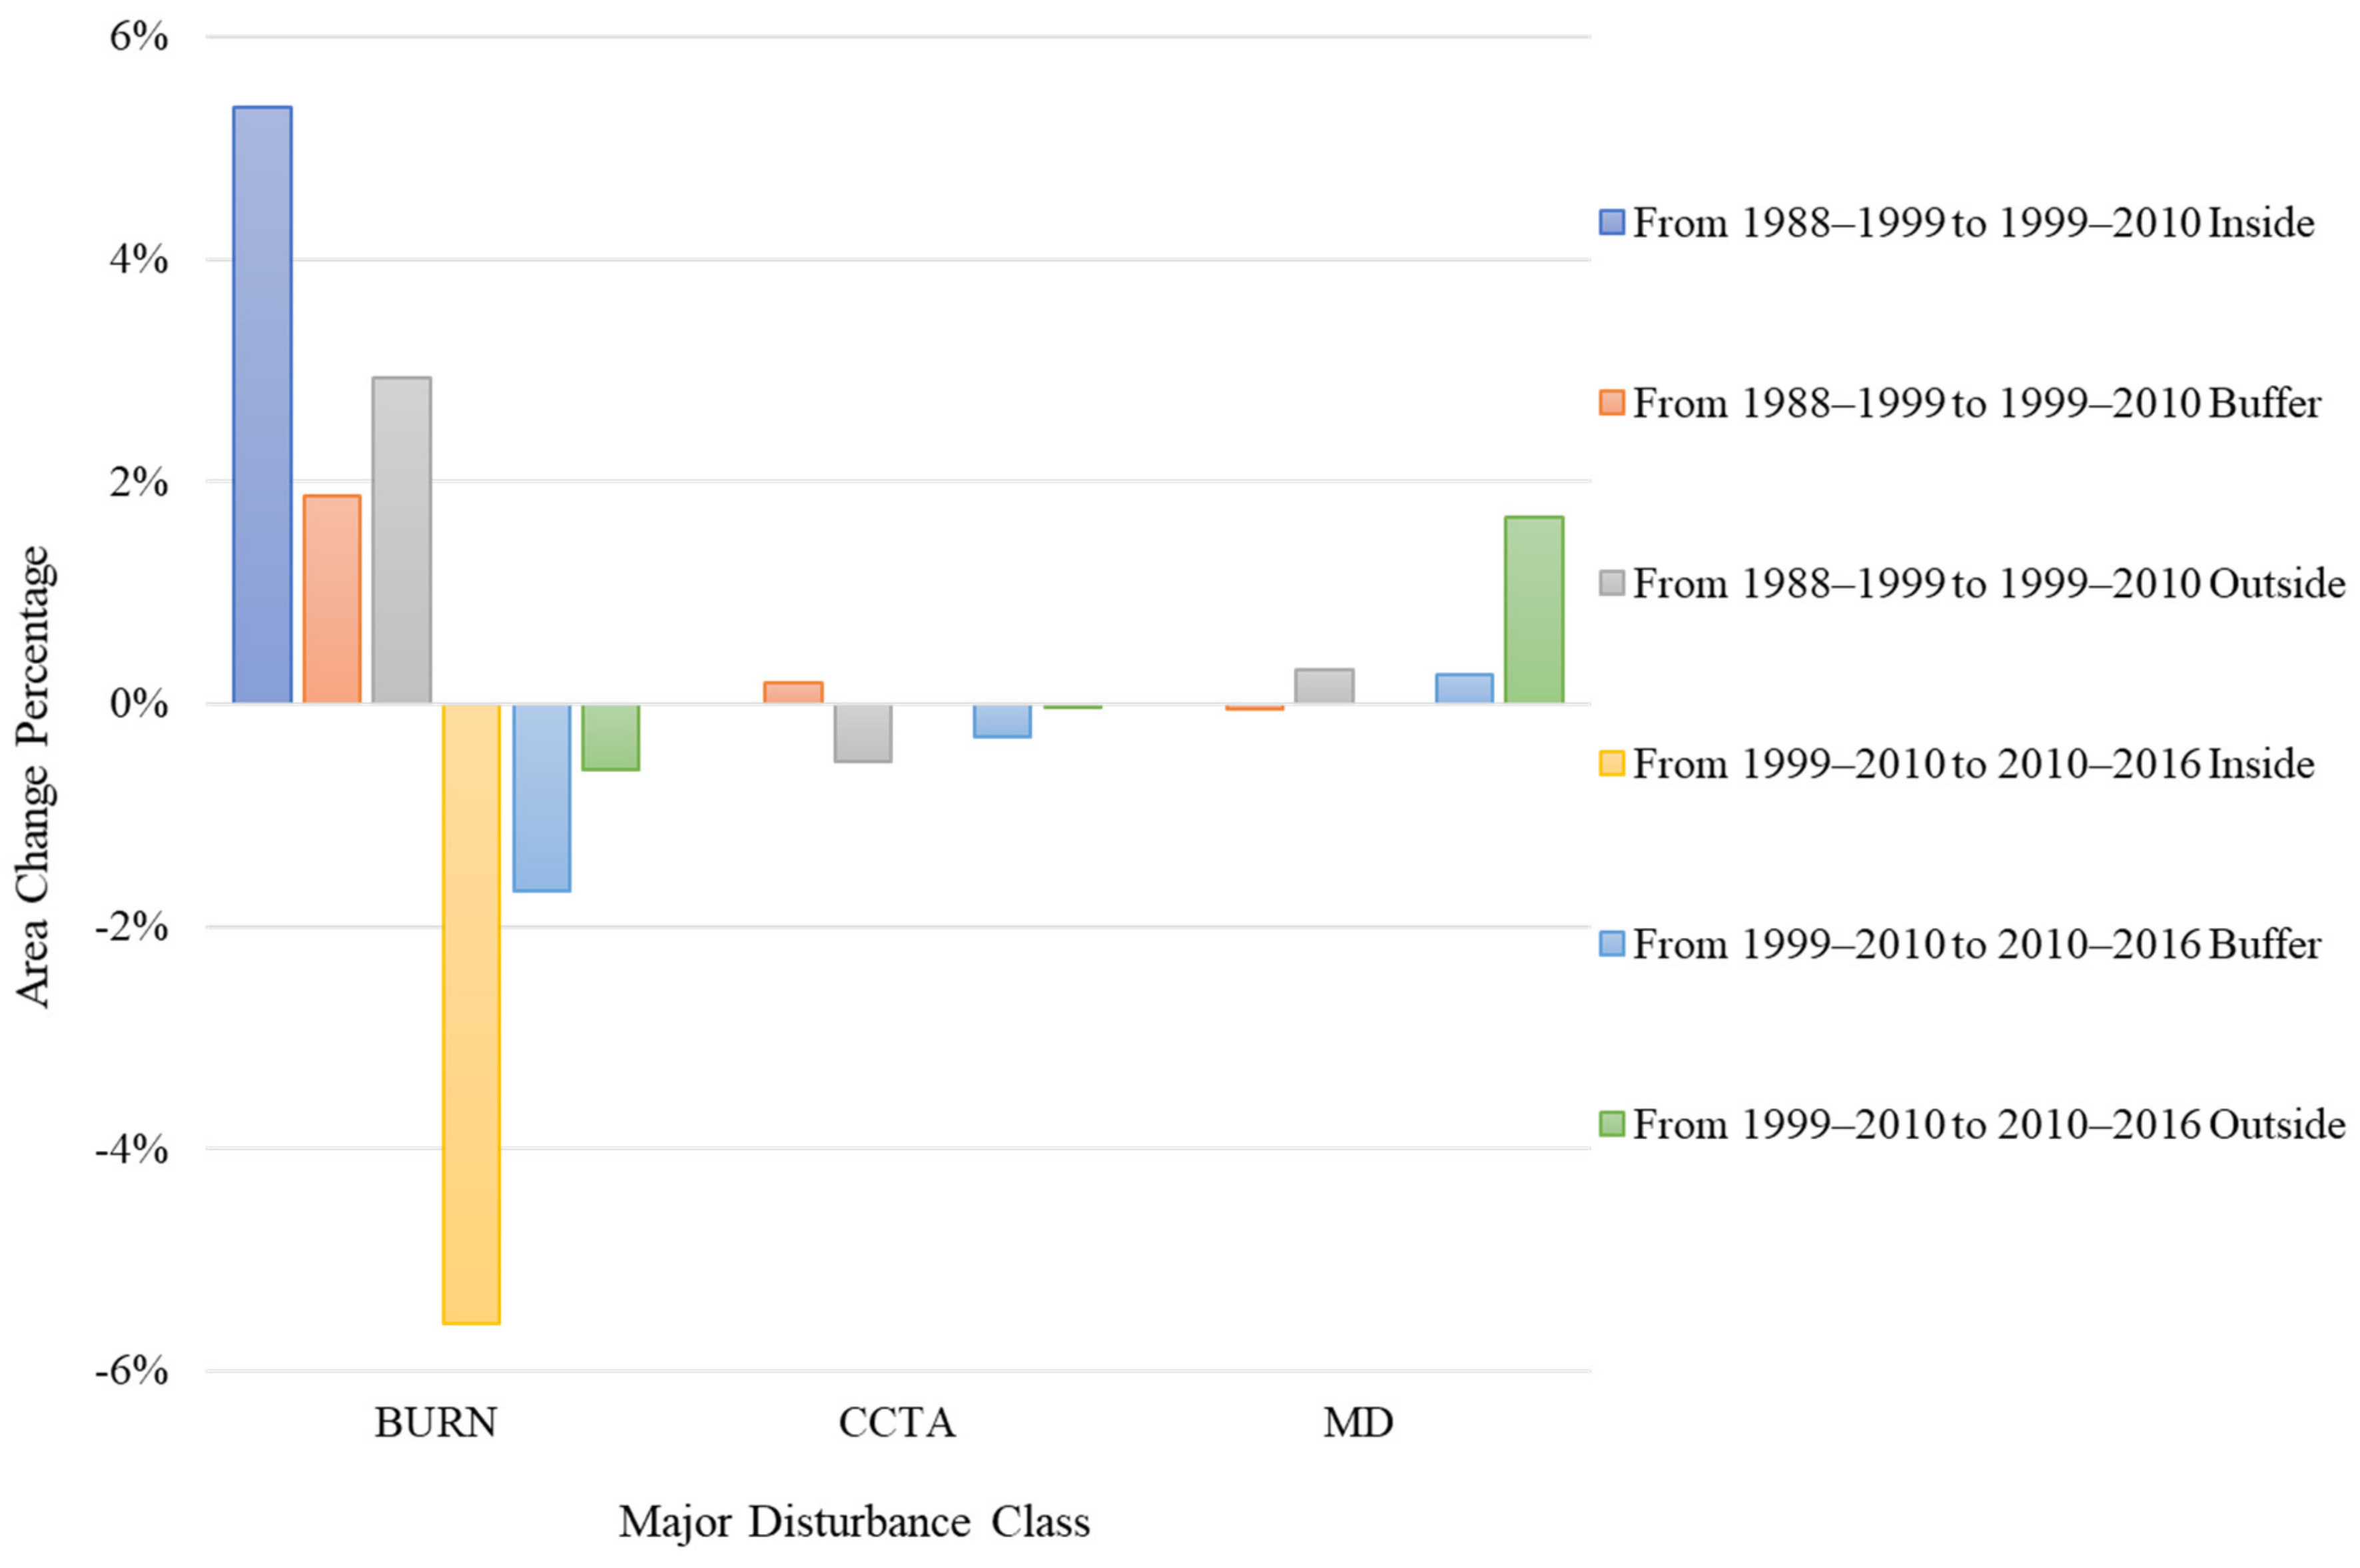
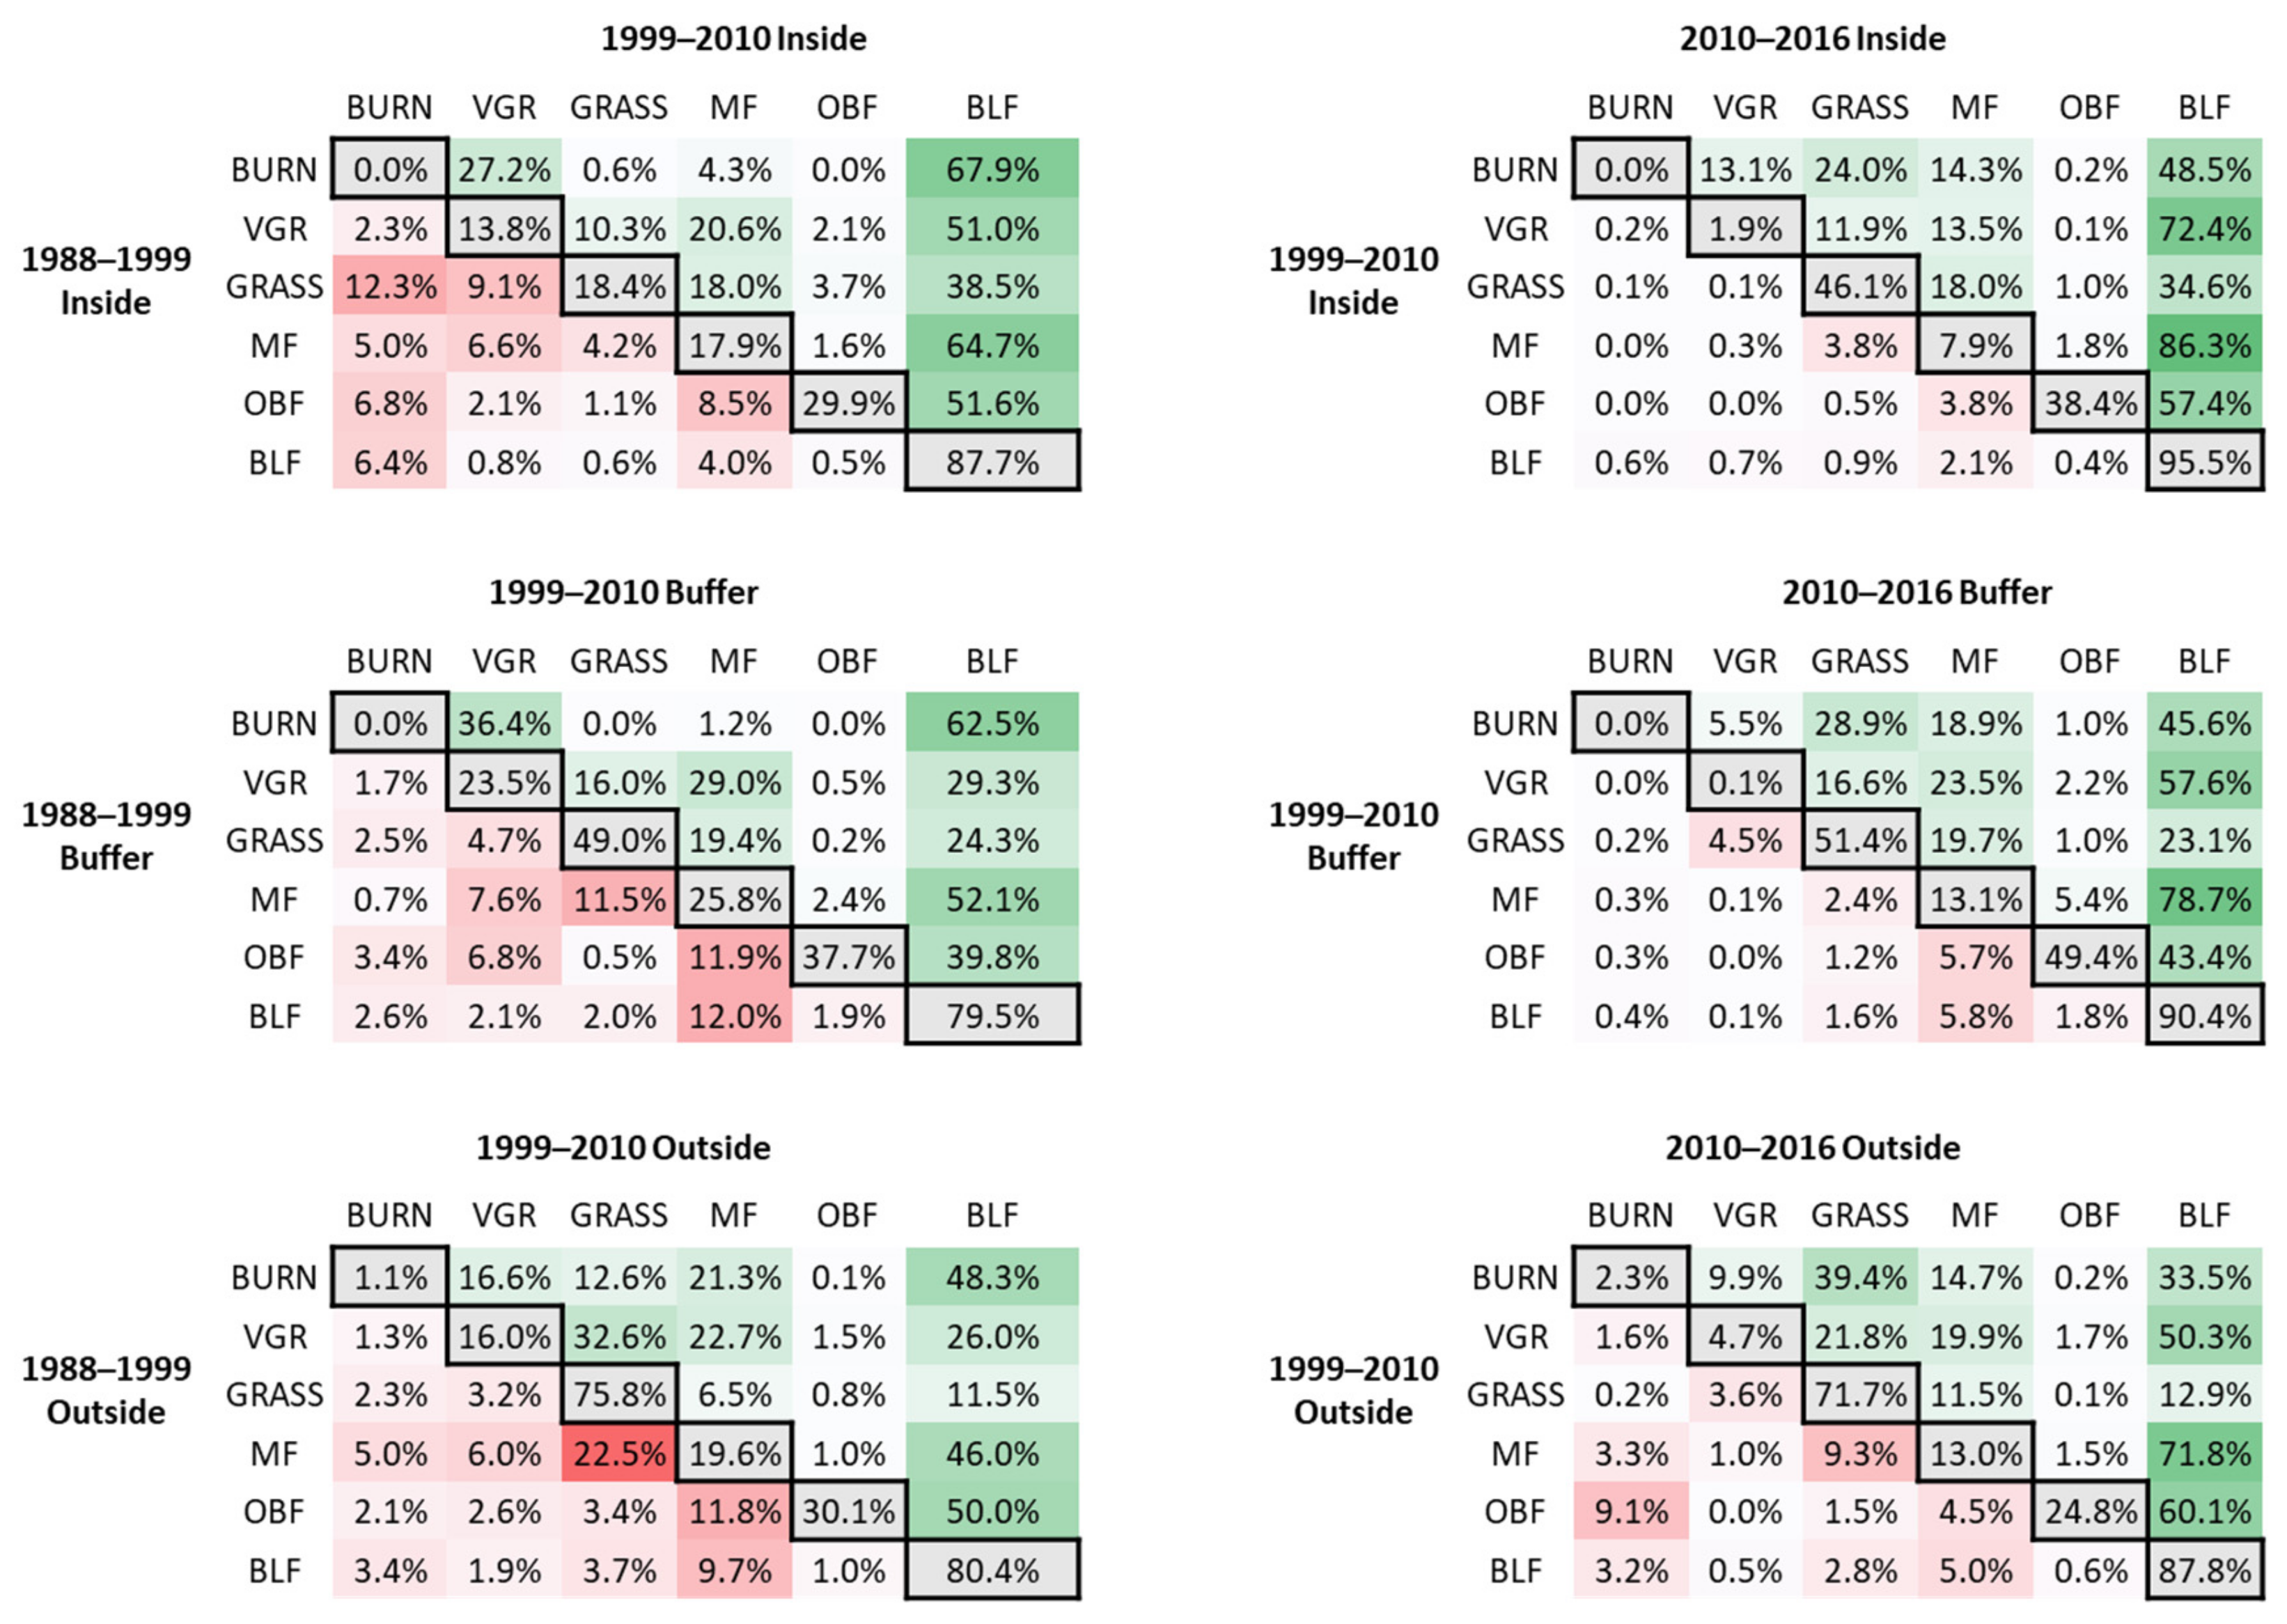
3.3. Effectiveness of the Reserve

The change matrices show the direction of forest successional change (Figure 9): upper right indicates higher stability, meaning forward succession, while lower left indicates lower stability, meaning backward succession. Green color gradient represented the forward successional stages and red color gradient represented the backward successional stages. The darker color means the higher percentages of an area moving toward that direction. Inside had higher ratios of each class moving forwards than the buffer, and outside of the reserve. On the contrast, outside had higher ratios moving backwards successional stages than inside the reserve. From the period 1999–2010 to 2010–2016, inside of the reserve was well protected, with all the classes moving backward successional stages were less than 5%. From the period of 1999–2010 to 2010–2016, 40.20 km2 of mixed forests outside converted to grassland, the largest ratio (22%) of backwards succession, indicating significant forest area loss to fire (Supplementary Materials Table S6). During the same time, 11.5% of mixed forest area in the buffer zone was converted to grassland while the inside of the reserve showed the smallest area of mixed forest-grassland conversion. More than 10% of mixed forests, oak–Daurian birch forests and birch and larch forests in the buffer zone and outside of the reserve moved at least one class backward on the forest successional stage from the first period to the second period.

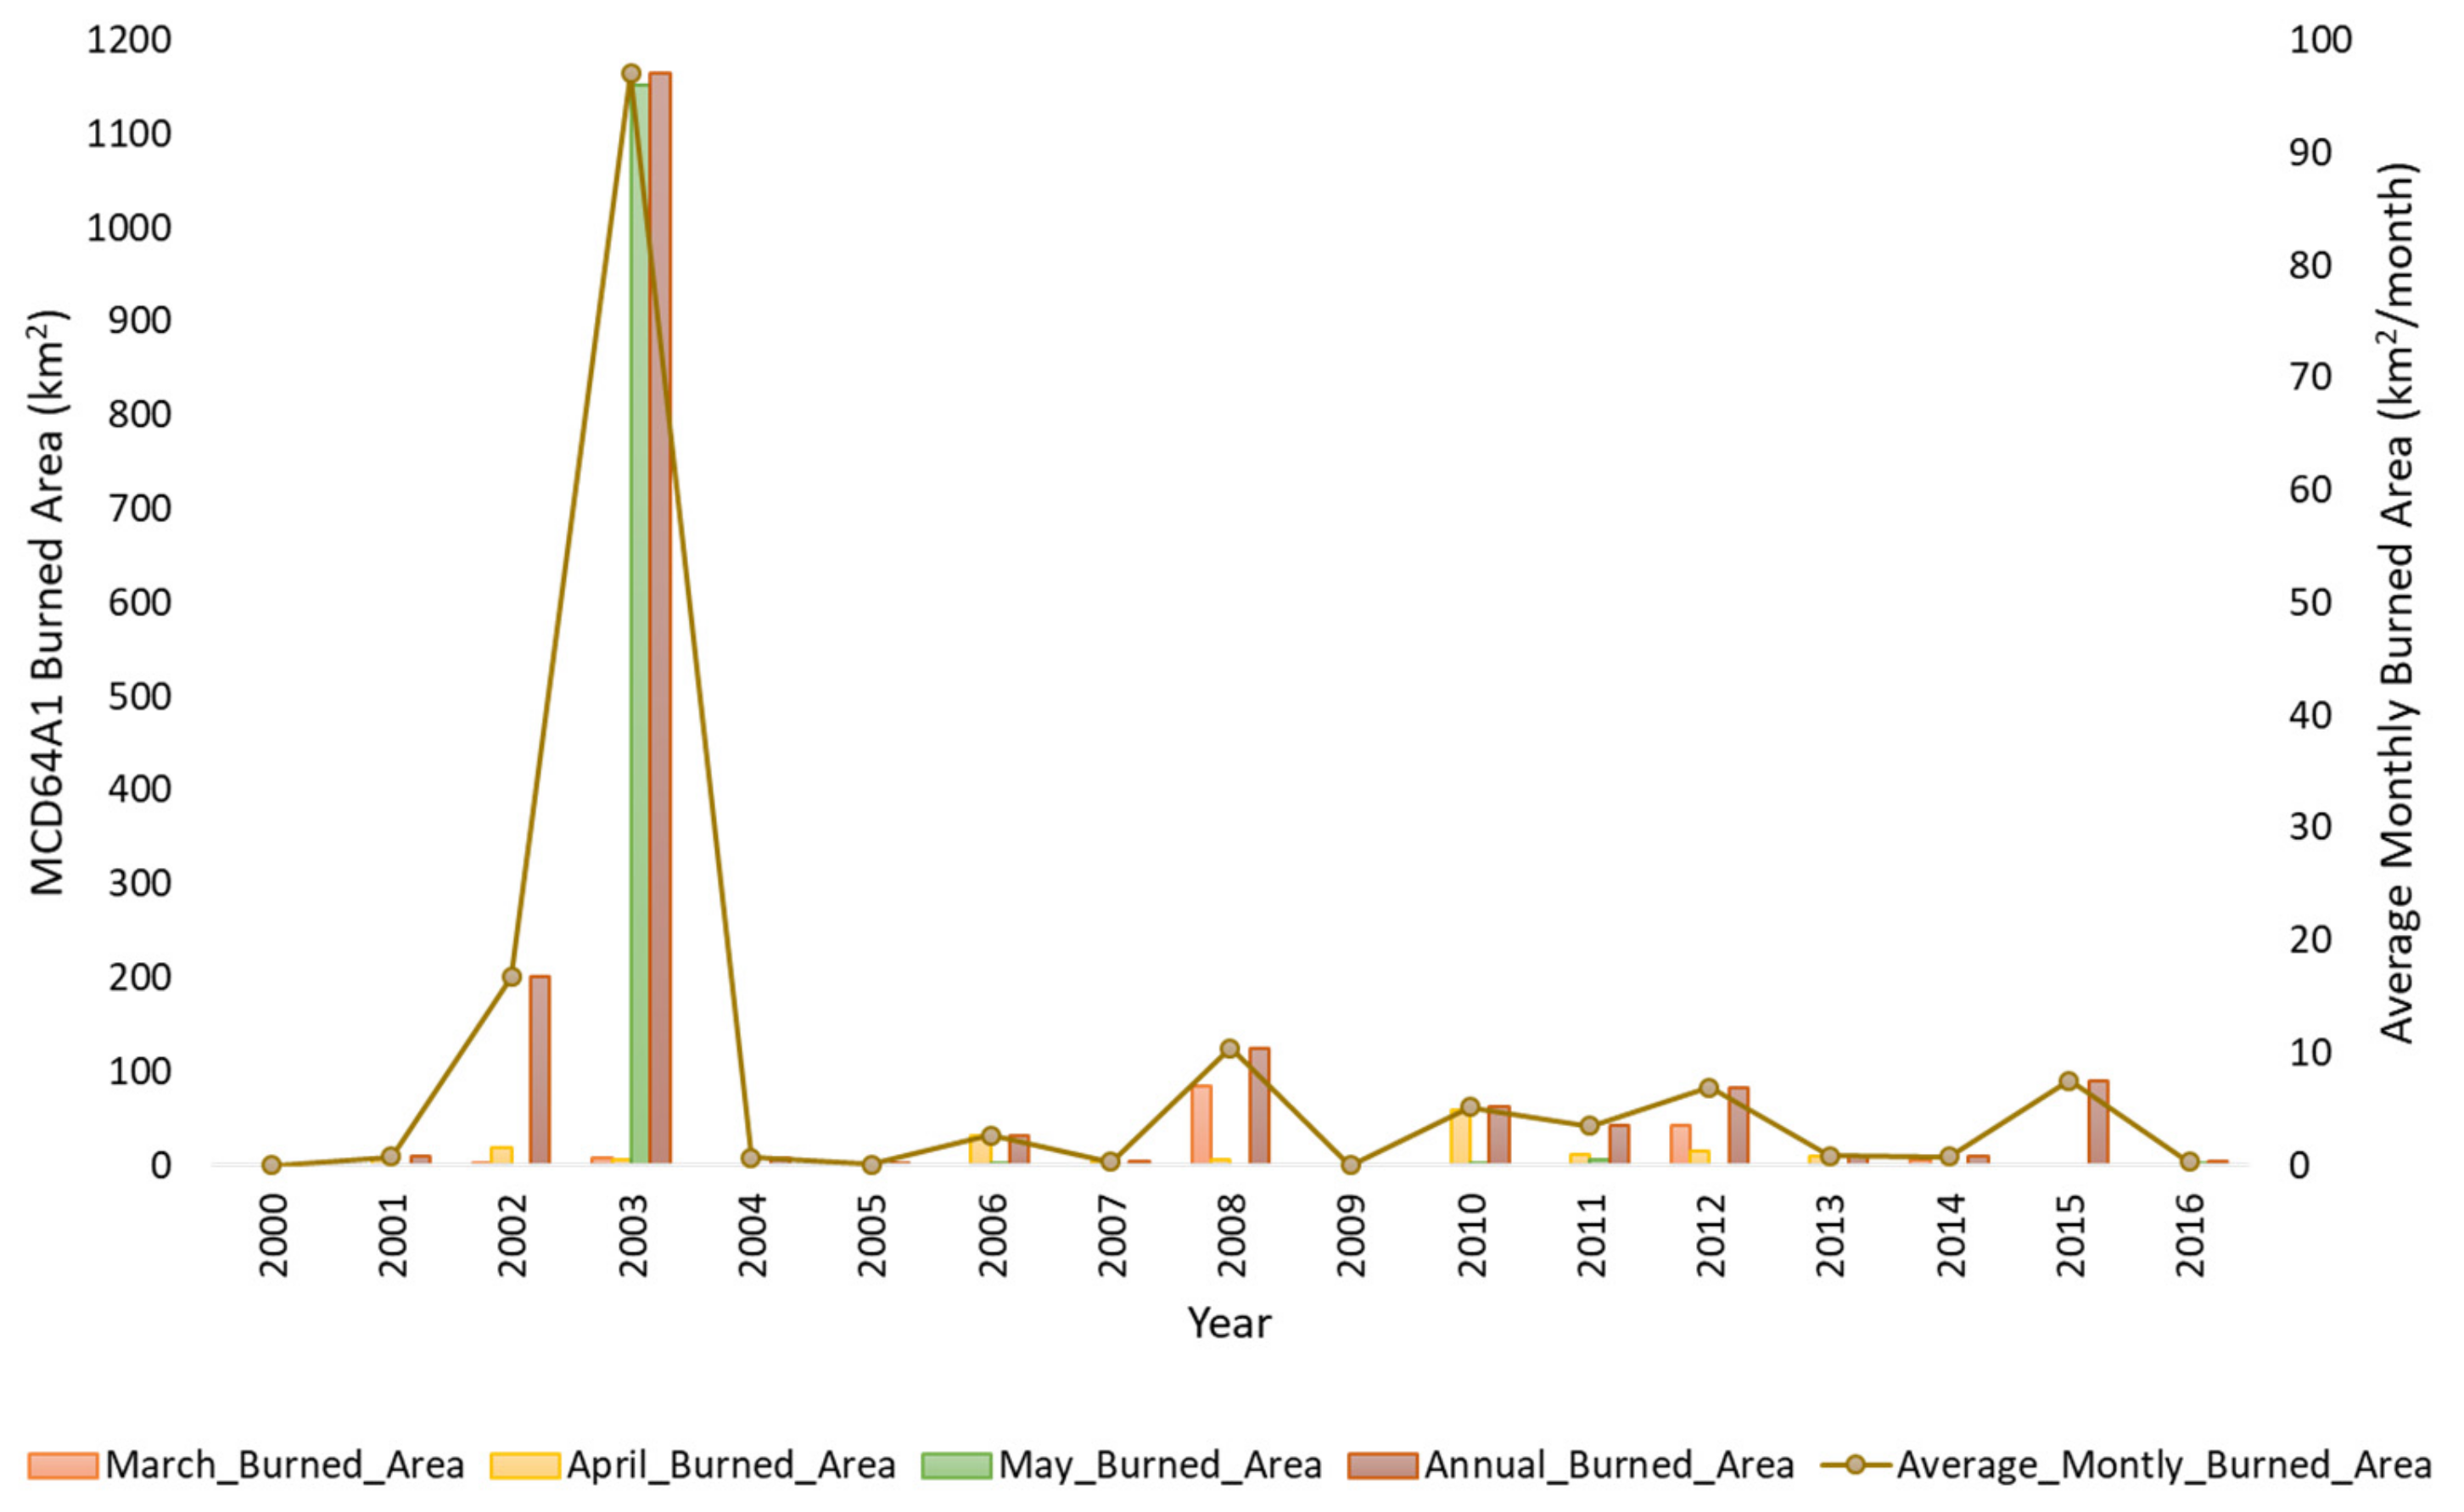
3.4. Analysis of MODIS Data

Figure 10 shows the annual distribution of the MCD64A1 product’s burned areas over the reserve for a whole year and the monthly distribution of burned areas detected from 2000 to 2016. The fire season usually occurred from March to May. These three months contained the largest burned areas per month. Approximately 50% of the total burned areas detected in our study area were aggregated in 2002, 2003, 2008, and 2015. On the contrary, 2000 and 2009 had no registrations of burned areas.

4. Discussion

This study is the first to assess fire disturbance and forest-cover change in the Zeya State Nature Reserve at the landscape scale. We used remote-sensing data to compensate for the lack of data in this remote region. Although ground-truth data were insufficient for accurate classification, our results show a high accuracy of classification maps. To analyze forest dynamics from long-time interval Landsat images, we used mean NDVI and NBR values to extract forest successional stages. The vegetation recovered through successional stages of grasses, shrubs, broadleaf and conifer trees, oak–birch forest, and birch and larch forests after severe fires (Figure 11). The results of the classification maps showed that several classes had both low producer’s accuracy and low user’s accuracy. The low producer’s accuracy of the disturbance classes (burned area, clearcutting for timber or agricultural, and mixed disturbance) in the 1988–1999 map was due to the limited ground-truth information in the historical data. The low user’s accuracy for burned area, mixed disturbance, and vegetation recovery in the 1999–2010 map was due to limitations in distinguishing spectral values due to the massive burned class being possibly adjacent to or including clearcutting area [50]. More high-resolution images are needed to monitor whether the tree canopy has been cut down in the disturbance classes. The sufficient data that can separate burned area and mixed disturbance will further improve the accuracy of classification.
The large-scale conversion of a mature forest to a lower successional stage is rarely observed in nature. Low-intensity, short-interval disturbances in the late 1980s to early 1990s reverted larch and birch forests to earlier ecological stages [51]. Clear-cut areas outside the reserve were associated with forest fires in recent years, challenging the separation of types of disturbances with similar severity. Vegetation indices helped determine the forest and disturbance types [50]. However, we found a similar range of mean NDVI and NBR values for grassland and burned area, owing to rapid understory vegetation recovery [31]. Intense disturbances created a massive loss of the forest canopy and understory vegetation, which showed up as lower vegetation areas on the Landsat images [16]. The decrease in NBR mean values during all three periods might be linked to the long-term effects of human activities on the ecosystem [15]. In the future, we will research the potential of using other difference satellites, such as Russian, Japanese, Chinese or Indian satellites to cover the gaps due to cloud coverage. Our study also contained enormous diversity of land features, from flat terrain to steep hills. Other satellite sensors, such as, the Sentinel-1 and Sentinel-2 data, could help us generate images with high temporal resolution for differentiating small agricultural areas and grassland [52]. The synthetic aperture radar (SAR) have been widely used to detect clearcutting in the tropical forest [53], however, our study did not involve such a method. We will also apply SAR-based change detection approach to monitor clearcutting evidences in our study area in the future.
As we assumed some forest areas can suffer repeated fires, the recovery from which varies, while other places might only experience fire once and recover rapidly. Some heavily disturbed areas can only restore to the recovery stage of grass and mixed forest [12] while others with fewer and less intense fires might have a higher possibility of recovering back to the original forest stage [23]. For simple succession, such as recovery stage and grass, the whole process might finish within a year. On the other hand, the large severe fire area in mature forests might require longer recoveries. Birch and larch forests and oak forests might take years to recover. From 2010 to 2016, grassland, vegetation recovery, and mixed forests did not differ much in NBR compared with BLF and OBF, which had lower NBR values than 1999–2010. This might be due to much slower recovery than grassland [3] or because the fire occurred near the post-year image.
MODIS showed supporting evidence that major fire damage occurred in the early years in the 1999–2010 period and later in the 2010–2016 period. This temporal variation in fire occurrence within a period can impact the recovery stage detected at the end of the period [18,23]. The years 2015 and 2016, which were the final years of the classified map 2010–2016, included larger recent fires than the years 2009 and 2010, which had small fires. A large-scale fire settled in the year 2003, so the recovery process of some classes in the 1999–2010 period might have had higher NBR and NDVI values than the 2010–2016 period. Even though this analysis did not involve forest succession process based on local climate (temperature and rainfall) and soil type, we recommend that future work consider those factors. Our approach overcame the gaps inherent in long-interval image analysis.
The findings of MODIS revealed that large areas of burning during 2002, 2008, 2012 and 2015. The findings matched the recorded fire map for all years except 2008. The southwest of the reserve had a fire in 2002, while the northern border of the reserve had a fire in two areas in 2012. In 2015, due to extreme temperatures and high winds, Russian wildfires have caused large damage around the reserve. The fire was initially set to clear grass but it was out of control, causing vast areas of forest loss from Transbaikal to the Far East of Russia. Historical documents failed to capture the burned area inside the reserve during 2008, our approach by using MODIS showed that the satellite could capture forest fire in an inaccessible location. We also found that the burned area from the records in 2000 and 2011 was absent from the MODIS data and the Landsat image, the location is yet to be explored, and in the future we will look for further confirmation from other satellite images. The overall study period showed the effects of strong enforcement of the protection of the reserve. Even though forest fires occurred inside the reserve, from 1999 to 2010, other human-made disturbances were low. The buffer zone around the reserve and the area outside the reserve faced more deforestation and burning, which pose threats to the area inside the reserve. Thus, more restrictions should be established to avoid unpredicted consequences. The buffer zone perhaps experienced more disturbances due to infrequent monitoring and the difficulty of preventing large fires. Difficulties in assessing such terrain also restrict enforcement. Forest fires and clearcutting were concentrated near the reserve boundary because of timber activities along the roads and flat terrain.
Even though remote-sensing data are useful in detecting burned areas, we found three limitations of the object-based segmentation classification. First, the Landsat surface reflectance’s pixel values were similar for clearcutting objects and neighboring objects that represented burned areas. Differentiating between mixed disturbance and burned areas on Landsat images is difficult [30]. Due to the extensive cloud cover and early vegetation regrowth, it was also difficult to identify fire scars and clearcutting area [54]. Second, the time-resolution of our study was not fine enough to detect precise disturbance events and vegetation recovery. The early recovery of grasses and shrubs (secondary succession stage) after a disturbance has been overlooked during long periods and has instead been interpreted as grassland. Third, areas burned from 1988 to 1999 and clear-cut for agriculture from 2010 to 2016 were minimal [30].
Our results suggest the need for more frequent observation and the incorporation of environmental factors. Sufficient ground-truth data of historical disturbance—not only large-scale fires but also small fires and clearcutting—would enhance classification accuracy. Analyzing large areas in short time intervals is difficult, costly, and laborious. Instead, using long-interval Landsat images is possible if we consider the successional stage as supporting information. This would allow us to recognize how fast the understory vegetation has recovered and the effectiveness of reserves at protecting fauna and flora [55]. For example, mountain tundra vegetation and other alpine ecosystems are well protected from human disturbance, but they are vulnerable to climate change [56]. Therefore, knowing how forest covers change over time inside and outside protected areas, especially in inaccessible locations, can improve forest conservation and management [9,55,57]. Information on forest fires, timber harvesting, and other anthropogenic activities around reserves, along with the help of remote-sensing techniques, can support park protection [9,58,59,60].

5. Conclusions

Using open-access satellite data is essential for detecting forest disturbance and forest-cover change. Applying object-based segmentation classification, using overlaid images from different years, also increased the accuracy and consistency among forest-cover-change maps. The analysis of successional stages based on NDVI and NBR values provided important insights into forest-cover-change patterns inside the Zeya State Nature Reserve, in the buffer zone, and outside the reserve, from the periods of 1988–1999, 1999–2010, and 2010–2016. Severe burning from the periods 1999–2010 and 2010–2016 revealed the critical role of fire in forest dynamics. Most areas burned outside the reserve were associated with clearcutting, indicating that anthropogenic factors influenced forest fire and forest-cover change. Even though the reserve is protected effectively, we found a reduction of both vegetation indices in burned areas, so there is no guarantee that forest-cover change and disturbance patterns outside the reserve will not affect the forest dynamics inside it.
The direction of forest successional stages is based on disturbance severity. Some forest areas did not return to their climax class. The dominant birch and larch forests were found to be linked with burned areas. If the consequences of disturbances are not predictable, the risk of losing biological diversity and ecological function is high. There is an urgent need for multiple-spatial-scale studies of how forest fires have behaved recently. Data on fire frequency, intensity, and severity can identify susceptible areas.
This study supported the assumption that fires are becoming more frequent in boreal forest and have been more extensive in recent years, affecting forest-cover patterns and trends. Unexpected weather events, increasing demand for timber along the Russia–China border, and increases in legal and illegal logging activity could alter the boreal forest ecosystem. Thus, a better understanding of recent forest fires and forest-cover changes in remote areas is needed to develop better ways to preserve biological diversity and ecosystem services. Our research has yielded data on forest disturbances in remote areas that other researchers can use to improve forest management and conservation plans for large-scale protected areas.
We encourage further studies using vegetation indices to determine ecological succession after disturbances to overcome the disadvantages of long-time-series analyses. Such methods can reduce the effort needed to monitor global forest trends. We also recommend that future studies focus on forest disturbances and forest-cover patterns in other protected areas, so that we can understand the effectiveness of forest conservation there as well.

Supplementary Materials

The following are available online, at https://www.mdpi.com/article/10.3390/rs13071285/s1, Table S1: Major forest types of Zeya State Nature Reserve. Table S2: Data from survey plots at Zeya State Nature Reserve. Table S2: List of processed Landsat images. Table S5: Producer’s accuracy and user’s accuracy for 1988–1999, 1999–2010, and 2010–2016. Table S3: Class-cover area (km2) inside, buffer zone, and outside of the reserve in 1988–1999, 1999–2010, and 2010–2016. Table S4: Area changes in different vegetation classes during 1999–2010, compared to 1988–1999. Table S5: Area changes in different vegetation classes during 2010–2016, compared to 1999–2010. Table S6: The change matrix of successional stages of class cover area (km2) in different periods and different zones of the reserve. Figure S1: Comparison of Landsat image data, classification result, and reference data (high-resolution image and field photographs) for 17 classes. Figure S2: Box plot of (a) normalized difference vegetation index (NDVI) and (b) normalized burn ratio index (NBR) values in total area of the reserve for each class in 2016. Figure S3: Box plot of (a) normalized difference vegetation index (NDVI) and (b) normalized burn ratio index (NBR) values in inside area of the reserve for each class in 2016. Figure S4: Box plot of (a) normalized difference vegetation index (NDVI) and (b) normalized burn ratio index (NBR) values in buffer zone area of the reserve for each class in 2016. Figure S5: Box plot of (a) normalized difference vegetation index (NDVI) and (b) normalized burn ratio index (NBR) in outside area of the reserve for each class in 2016. Figure S6: The reserve burned area in each date registered by the MCD64A1 product.

Author Contributions

Conceptualization, C.K., S.T., and N.W.; methodology, C.K., S.T., and N.W.; software, C.K. and S.T.; validation, C.K., S.T., N.W., K.S., T.S., S.V.B., and I.G.B.; formal analysis, C.K., S.T., and N.W.; investigation, C.K., S.T., N.W., K.S., T.S., S.V.B., V.V.L., and I.G.B.; resources, C.K., S.T., N.W., K.S., T.S., S.V.B., V.V.L., and I.G.B.; data curation, C.K., S.T., N.W., K.S., T.S., S.V.B., V.V.L., and I.G.B.; writing—original draft preparation, C.K.; writing—review and editing, C.K., S.T., N.W., K.S., T.S., I.G.B., and S.V.B.; visualization, C.K., S.T., and N.W.; supervision, S.T. and N.W.; project administration, N.W. and S.T.; funding acquisition, N.W. and S.T. All authors have read and agreed to the published version of the manuscript.

Funding

This study was funded by Japanese National Institutes for the Humanities (NIHU)’s Transdisciplinary Area Studies Project for Northeast Asia, University of Toyama and the University of Tokyo, Japan.

Acknowledgments

The authors would like to thank four anonymous reviewers for helpful comments. We also would like to thank the official staffs from Zeya State Nature Reserve for providing supports during field research. We were deeply saddened by the news of Viktor’s passing. We would like to send our heartfelt sympathy for the loss of one of our colleagues to his family. We would also like to specially thank him for being our best colleague. His support and care will be missed and he will never be forgotten; may his soul rest in peace.

Conflicts of Interest

The authors declare no conflict of interest.

References

  1. Astrup, R.; Bernier, P.Y.; Genet, H.; Lutz, D.A.; Bright, R.M. A Sensible Climate Solution for the Boreal Forest. Nat. Clim. Chang. 2018, 8, 11–12. [Google Scholar] [CrossRef]
  2. Loboda, T.V.; Zhang, Z.; O’Neal, K.J.; Sun, G.; Csiszar, I.A.; Shugart, H.H.; Sherman, N.J. Reconstructing Disturbance History Using Satellite-Based Assessment of the Distribution of Land Cover in the Russian Far East. Remote Sens. Environ. 2012, 118, 241–248. [Google Scholar] [CrossRef] [Green Version]
  3. Chen, D.; Loboda, T.V.; Krylov, A.; Potapov, P.V. Mapping Stand Age Dynamics of the Siberian Larch Forests from Recent Landsat Observations. Remote Sens. Environ. 2016, 187, 320–331. [Google Scholar] [CrossRef]
  4. Zhao, F.; Liu, Y.; Shu, L. Change in the Fire Season Pattern from Bimodal to Unimodal under Climate Change: The Case of Daxing’anling in Northeast China. Agric. For. Meteorol. 2020, 291, 108075. [Google Scholar] [CrossRef]
  5. Bedritsky, A.I.; Blinov, V.G.; DGershinkova, A. Assessment report on climate change and its consequences in russian federation. In Proceedings of the Federal Service for Hydrometeorology and Environmental Monitoring (Roshydromet), Moscow, Russia, 7 November 2008. [Google Scholar]
  6. Bockel, L.; Bernoux, M.; Thapa, D.; Armstrong, A. GHG and Natural Capital Impact of Russia Forest Fire Response Project. 26; Food and Agriculture Organization of the United Nations: Rome, Italy, 2011. [Google Scholar]
  7. Kharuk, V.I.; Ponomarev, E.I.; Ivanova, G.A.; Dvinskaya, M.L.; Coogan, S.C.P.; Flannigan, M.D. Wildfires in the Siberian Taiga. Ambio 2021. [Google Scholar] [CrossRef]
  8. Cohen, W.B.; Goward, S.N. Landsat’s Role in Ecological Applications of Remote Sensing. BioScience 2004, 54, 535–545. [Google Scholar] [CrossRef]
  9. Wendland, K.J.; Baumann, M.; Lewis, D.J.; Sieber, A.; Radeloff, V.C. Protected Area Effectiveness in European Russia: A Postmatching Panel Data Analysis. Land Econ. 2015, 91, 149–168. [Google Scholar] [CrossRef]
  10. Bartalev, S.A.; Loupian, E.A.; Stytsenko, F.V.; Panova, O.Y.; Efremov, V.Y. Rapid Mapping of Forest Burnt Areas over Russia Using Landsat Data. Curr. Probl. Remote Sens. Earth Space 2014, 11, 9–20. [Google Scholar]
  11. Kareiva, P.; Watts, S.; McDonald, R.; Boucher, T. Domesticated Nature: Shaping Landscapes and Ecosystems for Human Welfare. Science 2007, 316, 1866–1869. [Google Scholar] [CrossRef] [Green Version]
  12. Chen, D.; Loboda, T.V. Surface Forcing of Non-Stand-Replacing Fires in Siberian Larch Forests. Environ. Res. Lett. 2018, 13, 45008. [Google Scholar] [CrossRef]
  13. Achard, F.; Mollicone, D.; Stibig, H.-J.; Aksenov, D.; Laestadius, L.; Li, Z.; Popatov, P.; Yaroshenko, A. Areas of Rapid Forest-Cover Change in Boreal Eurasia. For. Ecol. Manag. 2006, 237, 322–334. [Google Scholar] [CrossRef]
  14. Peterson, L.K.; Bergen, K.M.; Brown, D.G.; Vashchuk, L.; Blam, Y. Forested Land-Cover Patterns and Trends over Changing Forest Management Eras in the Siberian Baikal Region. For. Ecol. Manag. 2009, 257, 911–922. [Google Scholar] [CrossRef]
  15. Fiore, N.M.; Goulden, M.L.; Czimczik, C.I.; Pedron, S.A.; Tayo, M.A. Do Recent NDVI Trends Demonstrate Boreal Forest Decline in Alaska? Environ. Res. Lett. 2020, 15, 095007. [Google Scholar] [CrossRef]
  16. Ju, J.; Masek, J.G. The Vegetation Greenness Trend in Canada and US Alaska from 1984–2012 Landsat Data. Remote Sens. Environ. 2016, 176, 1–16. [Google Scholar] [CrossRef]
  17. Amiro, B.D.; Orchansky, A.L.; Barr, A.G.; Blacks, T.A.; Chambers, S.D.; Chapin, F.S.; Goulden, M.L.; Litvak, M.; Liu, H.P.; McCaughey, J.H.; et al. The Effect of Post-Fire Stand Age on the Boreal Forest Energy Balance. Agric. For. Meteorol. 2006, 140, 41–50. [Google Scholar] [CrossRef] [Green Version]
  18. Chen, D.; Loboda, T.V.; Krylov, A.; Potapov, V. Distribution of Estimated Stand Age Across Siberian Larch Forests, 1989–2012; Oak Ridge National Laboratory Distributed Active Archive Center (ORNL DAAC): Oak Ridge, TN, USA, 2017. [CrossRef]
  19. Kharuk, V.I.; Ranson, K.J.; Im, S.T.; Vdovin, A.S. Spatial Distribution and Temporal Dynamics of High-Elevation Forest Stands in Southern Siberia. Glob. Ecol. Biogeogr. 2010, 19, 822–830. [Google Scholar] [CrossRef]
  20. Potapov, P.; Yaroshenko, A.; Turubanova, S.; Dubinin, M.; Laestadius, L.; Thies, C.; Aksenov, D.; Egorov, A.; Yesipova, Y.; Glushkov, I.; et al. Mapping the World’s Intact Forest Landscapes by Remote Sensing. Ecol. Soc. 2008, 13. [Google Scholar] [CrossRef] [Green Version]
  21. He, N.; Fang, L.; Li, S.; Plaza, A.; Plaza, J. Remote Sensing Scene Classification Using Multilayer Stacked Covariance Pooling. IEEE Trans. Geosci. Remote Sens. 2018, 56, 6899–6910. [Google Scholar] [CrossRef]
  22. Potapov, P.; Turubanova, S.; Hansen, M.C. Regional-Scale Boreal Forest Cover and Change Mapping Using Landsat Data Composites for European Russia. Remote Sens. Environ. 2011, 115, 548–561. [Google Scholar] [CrossRef]
  23. Bright, B.C.; Hudak, A.T.; Kennedy, R.E.; Braaten, J.D.; Henareh Khalyani, A. Examining Post-Fire Vegetation Recovery with Landsat Time Series Analysis in Three Western North American Forest Types. Fire Ecol. 2019, 15, 8. [Google Scholar] [CrossRef] [Green Version]
  24. Turner, M.G. Disturbance and Landscape Dynamics in a Changing World. Ecology 2010, 91, 2833–2849. [Google Scholar] [CrossRef] [Green Version]
  25. Turner, W.; Spector, S.; Gardiner, N.; Fladeland, M.; Sterling, E.; Steininger, M. Remote Sensing for Biodiversity Science and Conservation. Trends Ecol. Evol. 2003, 18, 306–314. [Google Scholar] [CrossRef]
  26. Wulder, M.A.; Coops, N.C. Satellites: Make Earth Observations Open Access. Nat. News 2014, 513, 30. [Google Scholar] [CrossRef]
  27. Anderson-Teixeira, K.J. Prioritizing Biodiversity and Carbon. Nat. Clim. Chang. 2018, 8, 667–668. [Google Scholar] [CrossRef]
  28. Zeya State Nature Reserve. Biodiversity 2020. Available online: https://zeyzap.ru/sohranyaem/zejskij-zapovednik/bioraznoobrazie/ (accessed on 5 December 2020).
  29. Dudov, S.V. Large-scale vegetation mapping of the Zeya State Nature Reserve. GiPR 2018. [Google Scholar] [CrossRef]
  30. Schroeder, T.A.; Wulder, M.A.; Healey, S.P.; Moisen, G.G. Mapping Wildfire and Clearcut Harvest Disturbances in Boreal Forests with Landsat Time Series Data. Remote Sens. Environ. 2011, 115, 1421–1433. [Google Scholar] [CrossRef]
  31. Smith, A.M.S.; Kolden, C.A.; Paveglio, T.B.; Cochrane, M.A.; Bowman, D.M.; Moritz, M.A.; Kliskey, A.D.; Alessa, L.; Hudak, A.T.; Hoffman, C.M.; et al. The Science of Firescapes: Achieving Fire-Resilient Communities. BioScience 2016, 66, 130–146. [Google Scholar] [CrossRef]
  32. Sommerfeld, A.; Senf, C.; Buma, B.; D’Amato, A.W.; Després, T.; Díaz-Hormazábal, I.; Fraver, S.; Frelich, L.E.; Gutiérrez, Á.G.; Hart, S.J.; et al. Patterns and Drivers of Recent Disturbances across the Temperate Forest Biome. Nat. Commun. 2018, 9, s41467–s415018. [Google Scholar] [CrossRef]
  33. U.S. Geological Survey (USGS). What Are the Band Designations for the Landsat Satellites? USGS: Reston, VA, USA, 2017.
  34. Chavez, P. Image-Based Atmospheric Corrections—Revisited and Improved. Available online: /paper/Image-Based-Atmospheric-Corrections-Revisited-and-Chavez/45f12625ce130261c7d360d50e09c635355ca919 (accessed on 27 February 2021).
  35. Hirata, Y.H.; Takahashi, T.T. Image Segmentation and Classification of Landsat Thematic Mapper Data Using a Sampling Approach for Forest Cover AssessmentThis Article Is One of a Selection of Papers from Extending Forest Inventory and Monitoring over Space and Time. Can. J. For. Res. 2010. [Google Scholar] [CrossRef]
  36. Başay, L.; Ersan, R. Comparison of Pixel-Based and Object-Based Classification Methods for Separation of Crop Patterns. Earth Obs. 2015, 6, 148–153. [Google Scholar]
  37. Drǎguţ, L.; Tiede, D.; Levick, S.R. ESP: A Tool to Estimate Scale Parameter for Multiresolution Image Segmentation of Remotely Sensed Data. Int. J. Geogr. Inf. Sci. 2010, 24, 859–871. [Google Scholar] [CrossRef]
  38. Tucker, C.J. Remote Sensing of Leaf Water Content in the near Infrared. Remote Sens. Environ. 1980, 10, 23–32. [Google Scholar] [CrossRef]
  39. Gao, B. NDWI—A Normalized Difference Water Index for Remote Sensing of Vegetation Liquid Water from Space. Remote Sens. Environ. 1996, 58, 257–266. [Google Scholar] [CrossRef]
  40. Chu, T.; Guo, X.; Takeda, K. Remote Sensing Approach to Detect Post-Fire Vegetation Regrowth in Siberian Boreal Larch Forest. Ecol. Indic. 2016, 62, 32–46. [Google Scholar] [CrossRef]
  41. Franco-Lopez, H.; Ek, A.R.; Bauer, M.E. Estimation and Mapping of Forest Stand Density, Volume, and Cover Type Using the k-Nearest Neighbors Method. Remote Sens. Environ. 2001, 77, 251–274. [Google Scholar] [CrossRef]
  42. Myint, S.W.; Yuan, M.; Cerveny, R.S.; Giri, C.P. Comparison of Remote Sensing Image Processing Techniques to Identify Tornado Damage Areas from Landsat TM Data. Sensors 2008, 8, 1128–1156. [Google Scholar] [CrossRef] [Green Version]
  43. Giglio, L.; Justice, C.; Boschetti, L.; Roy, D. MCD64A1 MODIS/Terra+Aqua Burned Area Monthly L3 Global 500m SIN Grid V006; NASA EOSDIS Land Processes DAAC: Sioux Falls, SD, USA, 2015. [CrossRef]
  44. ORNL DAAC MODIS and VIIRS Land Products Global Subsetting and Visualization Tool. ORNL DAAC, Oak Ridge, Tennessee, USA. Subset Obtained for MCD64A1 Product at Spatial Range: N = 60.41N, S = 59.73N, E = 140.68W, W = 141.71W, Time Period: 2000-01-02 to 2016-05-02, and Subset Size: 0.5 × 0.5 km. 2018. Available online: https://daac.ornl.gov/cgi-bin/dsviewer.pl?ds_id=1379 (accessed on 2 December 2020). [CrossRef]
  45. Justice, C.O.; Vermote, E.; Townshend, J.R.G.; Defries, R.; Roy, D.P.; Hall, D.K.; Salomonson, V.V.; Privette, J.L.; Riggs, G.; Strahler, A.; et al. The Moderate Resolution Imaging Spectroradiometer (MODIS): Land Remote Sensing for Global Change Research. IEEE Trans. Geosci. Remote Sens. 1998, 36, 1228–1249. [Google Scholar] [CrossRef] [Green Version]
  46. Roy, D.P.; Jin, Y.; Lewis, P.E.; Justice, C.O. Prototyping a Global Algorithm for Systematic Fire-Affected Area Mapping Using MODIS Time Series Data. Remote Sens. Environ. 2005, 97, 137–162. [Google Scholar] [CrossRef]
  47. Tei, S.; Sugimoto, A.; Kotani, A.; Ohta, T.; Morozumi, T.; Saito, S.; Hashiguchi, S.; Maximov, T. Strong and Stable Relationships between Tree-Ring Parameters and Forest-Level Carbon Fluxes in a Siberian Larch Forest. Polar Sci. 2019, 21, 146–157. [Google Scholar] [CrossRef]
  48. Suzuki, R.; Kobayashi, H.; Delbart, N.; Asanuma, J.; Hiyama, T. NDVI Responses to the Forest Canopy and Floor from Spring to Summer Observed by Airborne Spectrometer in Eastern Siberia. Remote Sens. Environ. 2011, 115, 3615–3624. [Google Scholar] [CrossRef]
  49. Kharuk, V.I.; Ranson, K.J.; Oskorbin, P.A.; Im, S.T.; Dvinskaya, M.L. Climate Induced Birch Mortality in Trans-Baikal Lake Region, Siberia. For. Ecol. Manag. 2013, 289, 385–392. [Google Scholar] [CrossRef] [Green Version]
  50. Escuin, S.; Navarro, R.; Fernández, P. Fire Severity Assessment by Using NBR (Normalized Burn Ratio) and NDVI (Normalized Difference Vegetation Index) Derived from LANDSAT TM/ETM Images. Int. J. Remote Sens. 2008, 29, 1053–1073. [Google Scholar] [CrossRef]
  51. Fernández-Nogueira, D.; Corbelle-Rico, E. Land Use Changes in Iberian Peninsula 1990–2012. Land 2018, 7, 99. [Google Scholar] [CrossRef] [Green Version]
  52. Kpienbaareh, D.; Sun, X.; Wang, J.; Luginaah, I.; Bezner Kerr, R.; Lupafya, E.; Dakishoni, L. Crop Type and Land Cover Mapping in Northern Malawi Using the Integration of Sentinel-1, Sentinel-2, and PlanetScope Satellite Data. Remote Sens. 2021, 13, 700. [Google Scholar] [CrossRef]
  53. Ruiz-Ramos, J.; Marino, A.; Boardman, C.; Suarez, J. Continuous Forest Monitoring Using Cumulative Sums of Sentinel-1 Timeseries. Remote Sens. 2020, 12, 3061. [Google Scholar] [CrossRef]
  54. Cocke, A.E.; Fulé, P.Z.; Crouse, J.E. Comparison of Burn Severity Assessments Using Differenced Normalized Burn Ratio and Ground Data. Int.J.Wildland Fire 2005, 14, 189–198. [Google Scholar] [CrossRef] [Green Version]
  55. Bragina, E.V.; Radeloff, V.C.; Baumann, M.; Wendland, K.; Kuemmerle, T.; Pidgeon, A.M. Effectiveness of Protected Areas in the Western Caucasus before and after the Transition to Post-Socialism. Biol. Conserv. 2015, 184, 456–464. [Google Scholar] [CrossRef]
  56. Makoto, K.; Bryanin, S.V.; Lisovsky, V.V.; Kushida, K.; Wada, N. Dwarf Pine Invasion in an Alpine Tundra of Discontinuous Permafrost Area: Effects on Fine Root and Soil Carbon Dynamics. Trees 2016, 30, 431–439. [Google Scholar] [CrossRef]
  57. Elbakidze, M.; Angelstam, P.; Sobolev, N.; Degerman, E.; Andersson, K.; Axelsson, R.; Höjer, O.; Wennberg, S. Protected Area as an Indicator of Ecological Sustainability? A Century of Development in Europe’s Boreal Forest. AMBIO 2013, 42, 201–214. [Google Scholar] [CrossRef] [Green Version]
  58. Chistyakova, A.A.; Leonova, N.A. The State of Protected Forest Communities in the European Forest–Steppe Zone of Russia and Prospects for Their Reconstruction: A Case Study of Specially Protected Areas of Penza Oblast. Russ. J. Ecol. 2003, 34, 285–291. [Google Scholar] [CrossRef]
  59. Degteva, S.V.; Ponomarev, V.I.; Eisenman, S.W.; Dushenkov, V. Striking the Balance: Challenges and Perspectives for the Protected Areas Network in Northeastern European Russia. Ambio 2015, 44, 473–490. [Google Scholar] [CrossRef] [PubMed] [Green Version]
  60. Wade, C.M.; Austin, K.G.; Cajka, J.; Lapidus, D.; Everett, K.H.; Galperin, D.; Maynard, R.; Sobel, A. What Is Threatening Forests in Protected Areas? A Global Assessment of Deforestation in Protected Areas, 2001–2018. Forests 2020, 11, 539. [Google Scholar] [CrossRef] [PubMed]
Figure 1. The study area and field plots established at Zeya State Nature Reserve. (a) The normalized different vegetation index (NDVI) distribution map of East Asia. (b) Zeya State Nature Reserve. (c) The study area elevation (m) and field plots.
Remotesensing 13 01285 g001
Figure 2. Overview examples of forest plots in the field: (a) plot NR1, located below the tundra belt, at 1305 m a.s.l., and dominated by mountain spruce forests; (b) plot NR2, located along the trail, at 853 m a.s.l., dominated by larch; (c) plot NR3, located at 626 m a.s.l., along the river valley, with the dominant species being larch and spruce in the river valley; (d) plot NR4, located near the road, with dominant trees including birch and larch; (e) plot BZ1 buffer zone plot, which experienced both massive forest fire and clearcutting in 2003 and 2007, and is now recovered by grass and shrub and birch; (f) plot ONR1, outside reserve plot, experienced with frequent annual burning from wildfires, the latest of which occurred in July. The photos were taken on 8 August 2016 (Khatancharoen 2016; personal observation).
Remotesensing 13 01285 g002
Figure 3. Flowchart for object-based classification based on Landsat images.
Remotesensing 13 01285 g003
Figure 4. Change maps obtained from object-based segmentation classification to detect the change of forest cover in the Scheme 1988 (a). (b) 1999–2010, and (c) 2010–2016. BURN = burned area, CCTA = clearcutting for timber or agricultural, CCE = clearcutting for electricity lines, MD = mixed disturbance, VGR = vegetation recovery, GRASS = grassland, MF = mixed forests, OBF = oak–Daurian birch forests, BLF = birch and larch forests, SFRV = spruce forests in a river valley, MSF = mountain spruce forests, DPW = dwarf pine woodland, MTV = mountain tundra vegetation, TOWN = settlement, ROAD = unpaved road, ROCK = stream bedrocks, and WATER = water.
Remotesensing 13 01285 g004
Figure 5. Area change percentage of class covers from the period of 1988–1999 to 1999–2010 and from the period of 1999–2010 to 2010–2016. BURN = burned area, CCTA = clearcutting for timber or agricultural, CCE = clearcutting for electricity lines, MD = mixed disturbance, VGR = vegetation recovery, GRASS = grassland, MF = mixed forests, OBF = oak–Daurian birch forests, BLF = birch and larch forests, SFRV = spruce forests in a river valley, MSF = mountain spruce forests, DPW = dwarf pine woodland, MTV = mountain tundra vegetation, TOWN = settlement, ROAD = unpaved road, ROCK = stream bedrocks, and WATER = water.
Remotesensing 13 01285 g005
Figure 6. The area of major disturbance classes, per year, in inside, buffer zone, and outside of the reserve, during 1988–1999, 1999–2010, and 2010–2016. BURN = burned area, CCTA = clearcutting for timber or agriculture, and MD = mixed disturbance.
Remotesensing 13 01285 g006
Figure 7. Area-change percentage of major disturbances inside, buffer zone, and outside the reserve, from the period of 1988–1999 to 1999–2010, and from the period of 1999–2010 to 2010–2016. BURN = burned area, CCTA = clearcutting for timber or agricultural, and MD = mixed disturbance.
Remotesensing 13 01285 g007
Figure 8. NDVI versus normalized burn ratio (NBR) inside, buffer zone, and outside of the reserve in 1999, 2010, 2016. BURN = burned area, VGR = vegetation recovery, GRASS = grassland, MF = mixed forests, OBF = oak–Daurian birch forests, and BLF = birch and larch forests.
Remotesensing 13 01285 g008
Figure 9. The relative area changes of each class. BURN = burned area, VGR = vegetation recovery, GRASS = grassland, MF = mixed forests, OBF = oak–Daurian birch forests, and BLF = birch and larch forests.
Remotesensing 13 01285 g009
Figure 10. The burned area in the study area (March, April, May, and whole year only) obtained by the MCD64A1 product.
Remotesensing 13 01285 g010
Figure 11. Typical forest successional gradient after forest fire disturbance on Zeya State Nature Reserve.
Remotesensing 13 01285 g011
Table 1. List of processed Landsat images.
Path/RowDateSensorBand Combination for False Color Composite (R, G, B)
120/2223 September 1988Landsat 5 TMB5, B4, B3
120/2221 August 1999Landsat 5 TMB5, B4, B3
120/224 September 2010Landsat 5 TMB5, B4, B3
120/2219 August 2016Landsat 8 OLIB6, B5, B4
TM, Thematic Mapper; OLI, Operational Land Imager.
Table 2. Classification criteria for object-based segmentation classification (see also Supplementary Materials Figure S1).
Class NameFull Class Name Physical DescriptionColor in Landsat Images (False Color)
BURNBurn area ***Forest disturbance by wildfireRed and pink
CCTAClearcutting for timber or agricultural ***Forest disturbance by harvesting for timber and ranching
(outside of the reserve)
Yellow and red in geometric shape
CCEClearcutting for electricity lines ***Forest disturbance by clearcutting to settle down electricity lines
(outside of the reserve)
Long-straight lines with bright color
MDMixed disturbance ***Forest disturbance by human-induced fire and harvesting at the same place (outside of the reserve)Red and pink in geometric shape
VGRVegetation recovery ***Vegetation recovery after disturbanceBright pink patches
GRASSBogged larch forests in a wide valley and grasslandMuddy, wetland, willow, floodplainLight pinkish with smoot light green
MFMixed forests in a river valleyLarch mixed with Spruce, willow, grass (below 700 m a.s.l.)Sparse light and dark green
OBFOak–Daurian birch forestsQuerqus mongolica, Lespedeza bicolor (below 700 m a.s.l.)Light green
BLFBirch and larch forestsLarix gmelinii, Betula platyphyllaNormal green
SFRVSpruce forests in a river valleyPicea ajanensis (315–700 m a.s.l.) sparsely dispersed near streamDark green
MSFMountain spruce forestsPicea ajanensis on steep slope
(700–1300 m a.s.l.)
Very dark green
DPWDwarf pine woodlandPinus pumila, Betula lanata
(1100–1300 m a.s.l.)
Smoot light green
MTVMountain tundra vegetationShrub, sedge, lichen, moss
(above 1200 m a.s.l.)
White
TOWNSettlementHouses and airports
(outside of the reserve)
Red-to-pink color
ROADUnpaved roadRoads or ways for transportation without pavementGray color in long-straight lines
ROCKStream bedrocksRiver or Stream bedrocks where no water flowsVery reddish color
WATERWaterWater bodies (e.g., river and lake)Dark blue
CLOUDCloud ****Smog, cloud, and cloud shadowsWhite and black color
Note: *** Change class detected after verifying existence between the two years. **** Cloud-cover-change class was masked out in forest-cover-change maps and analysis.
Table 3. Producer’s accuracy and user’s accuracy for 1988–1999, 1999–2010, and 2010–2016. BURN = burned area, CCTA = clearcutting for timber or agricultural, CCE = clearcutting for electricity lines, MD = mixed disturbance, VGR = vegetation recovery, GRASS = grassland, MF = mixed forests, OBF = oak–Daurian birch forests, BLF = birch and larch forests, SFRV = spruce forests in a river valley, MSF = mountain spruce forests, DPW = dwarf pine woodland, MTV = mountain tundra vegetation, TOWN = settlement, ROAD = unpaved road, ROCK = stream bedrocks, and WATER = water.
Class1988–19991999–20102010–2016
ProducerUserProducerUserProducerUser
BURN69.44%89.29%65.85%40.91%84.31%93.48%
CCTA58.93%86.84%85.71%85.71%100.00%60.00%
CCE70.00%100.00%86.67%100.00%87.50%87.50%
MD64.29%40.91%80.00%66.67%84.62%100.00%
VGR78.82%78.82%100.00%57.39%88.42%95.45%
GRASS95.26%95.94%88.06%99.76%87.88%80.56%
MF77.30%84.56%97.42%72.60%92.59%75.76%
OBF100.00%100.00%95.00%95.00%100.00%100.00%
BLF98.67%90.24%98.35%90.99%97.39%95.51%
SFRV94.25%98.80%78.95%100.00%100.00%76.92%
MSF96.26%94.74%94.30%91.46%86.71%93.75%
DPW85.71%91.14%88.51%89.53%96.30%81.25%
MTV92.86%88.64%90.91%85.11%77.55%92.68%
TOWN87.91%97.56%85.96%80.33%80.00%100.00%
ROAD93.75%88.24%85.71%94.74%100.00%90.91%
ROCK91.41%93.60%77.97%94.85%76.47%100.00%
WATER100.00%100.00%100.00%93.52%100.00%100.00%
Overall Accuracy91.61%90.90%94.33%
Kappa index of agreement (KIA)90.10%87.86%92.68%
Table 4. Area (km2) of class covers in first (1988–1999), second (1999–2010), and third (2010–2016) periods. BURN = burned area, CCTA = clearcutting for timber or agricultural, CCE = clearcutting for electricity lines, MD = mixed disturbance, VGR = vegetation recovery, GRASS = grassland, MF = mixed forests, OBF = oak–Daurian birch forests, BLF = birch and larch forests, SFRV = spruce forests in a river valley, MSF = mountain spruce forests, DPW = dwarf pine woodland, MTV = mountain tundra vegetation, TOWN = settlement, ROAD = unpaved road, ROCK = stream bedrocks, and WATER = water.
ClassArea (km2)
1988–19991999–20102010–2016
BURN15.4134136.912567.6089
CCTA20.01428.13336.5934
CCE4.28673.60639.4788
MD3.115810.104349.734
VGR105.964297.957845.4932
GRASS248.5971316.1943340.9686
MF224.7192318.0006209.2185
OBF70.435852.173946.4472
BLF2666.8472468.8932598.881
SFRV72.090931.727765.6172
MSF131.1309115.5024126.2691
DPW21.119424.872423.58
MTV7.12536.73658.1981
TOWN5.25152.98894.5891
ROAD5.63674.22557.2792
ROCK41.550329.792723.7357
WATER114.6123128.7387123.948
Publisher’s Note: MDPI stays neutral with regard to jurisdictional claims in published maps and institutional affiliations.

