Abstract
Changes in climate extremes have a profound impact on vegetation growth. In this study, we employed the Moderate Resolution Imaging Spectroradiometer (MODIS) and a recently published climate extremes dataset (HadEX3) to study the temporal and spatial evolution of vegetation cover, and its responses to climate extremes in the arid region of northwest China (ARNC). Mann-Kendall test, Anomaly analysis, Pearson correlation analysis, Time lag cross-correlation method, and Least absolute shrinkage and selection operator logistic regression (Lasso) were conducted to quantitatively analyze the response characteristics between Normalized Difference Vegetation Index (NDVI) and climate extremes from 2000 to 2018. The results showed that: (1) The vegetation in the ARNC had a fluctuating upward trend, with vegetation significantly increasing in Xinjiang Tianshan, Altai Mountain, and Tarim Basin, and decreasing in the central inland desert. (2) Temperature extremes showed an increasing trend, with extremely high-temperature events increasing and extremely low-temperature events decreasing. Precipitation extremes events also exhibited a slightly increasing trend. (3) NDVI was overall positively correlated with the climate extremes indices (CEIs), although both positive and negative correlations spatially coexisted. (4) The responses of NDVI and climate extremes showed time lag effects and spatial differences in the growing period. (5) Precipitation extremes were closely related to NDVI than temperature extremes according to Lasso modeling results. This study provides a reference for understanding vegetation variations and their response to climate extremes in arid regions.
1. Introduction
Climate change is increasingly impacting climate extremes events worldwide [1,2]. Furthermore, climate extreme events occur frequently, causing high temperatures, heat waves, cold snaps, droughts, rainstorms, and floods, which have significant impacts on ecological systems and human society [3,4,5,6], which can also cause a large number of casualties, loss of property, vegetation and animals. Vegetation connects the material circulation and energy flow of the soil, hydrosphere, and atmosphere, and plays an important role in regulating the terrestrial carbon balance and the climate system. Dynamic changes in vegetation are often a response to climate change and human activities [7]. Temperature and precipitation have the most direct and important influence on vegetation [8]. While climate change directly impacts vegetation, changes in vegetation can also significantly affect climate change. Climate extremes are more destructive than average climate events [9]. When the intensity of climate change exceeds the ability of vegetation to adapt to the environment and self-regulation, the survival and growth of vegetation will be fundamentally threatened, and the balance and stability of the entire ecosystem will be seriously damaged. Therefore, monitoring vegetation change and analyzing responses to climates extremes variations are critical for understanding global climate change [10].
Remote sensing serves as an ideal tool for this purpose. The Normalized Difference Vegetation Index (NDVI), derived from Moderate Resolution Imaging Spectroradiometer (MODIS) data, can capture the surface vegetation greenness and coverage [11], and therefore has been widely used in vegetation dynamics monitoring [12,13,14]. Numerous scholars have explored the characteristics of vegetation response to temperature and precipitation at global and regional scales [15,16]. Lamchin [17] found that the main reason for vegetation change in north-central China is temperature. Nemani et al. [18] suggested that the increase of NDVI in the mid-latitude of the Northern Hemisphere was caused by the rise in temperature while NDVI in semi-arid regions was affected by both temperature and precipitation. The complex impact of climate extremes events on vegetation has also attracted wide attention [19,20,21,22]. Zhao et al. [23] indicated that vegetation index is positively correlated with temperature extremes and precipitation. Bokhors et al. [24] found that the frequency of extremes winter warming events have caused considerable vegetation damage in the sub-Arctic. These studies have proven the effectiveness of the relationship between vegetation and climate extremes using NDVI. However, most of the studies are based on point-based meteorological data and only reflect the interaction between vegetation and climate extremes in a specific region.
The arid region of Northwest China (ARNC) is a sensitive area with a fragile ecological environment that has been significantly affected by global climate change [25,26]. The region not only has low temperatures, but it also experiences sandstorms, strong winds, and other disasters [27,28]. However, the climate exhibits a warm and humid trend [29,30], and the rising temperature has caused the melting and retreat of glaciers in the ARNC, which can regulate runoff and thus affect the growth of vegetation [31]. As the number of precipitation days increased [32], the sandstorms weakened, and vegetation cover improved to a certain extent.
The global climate is still warming [27,33], with more high-temperature extreme events and fewer low-temperature extreme events in ARNC [34,35]. Such climate extremes events will have a greater impact on society and the ecosystem [36,37] as they have inevitably led to vegetation loss [38,39]. Therefore, understanding the temporal and spatial changes of climate extremes and vegetation dynamics is not only urgent and necessary to strengthen in-depth studies of vegetation variation response to climate extremes events, but it is also of great significance for ecosystem sustainability in ARNC.
This study uses a time series of NDVI derived from MODIS data, and the latest release of climate extremes datasets (HadEX3) [36] from 2000 to 2018 to analyze recent vegetation dynamics and their responses to climate extremes. It has two major objectives: (1) analyze the temporal variation and spatial heterogeneity of temperature extremes in the ARNC from 2000 to 2018; (2) quantitatively analyze the response of vegetation to climate extremes and the difference in vegetation response under the lag effect. Through all the analysis conducted here, it is hoped that this study would be able to provide a more comprehensive understanding of the climate extremes and vegetation dynamics in ARNC under climate change. This will provide a solid scientific foundation for further investigating the interaction mechanism between the ecosystem and the climate.
2. Study Area
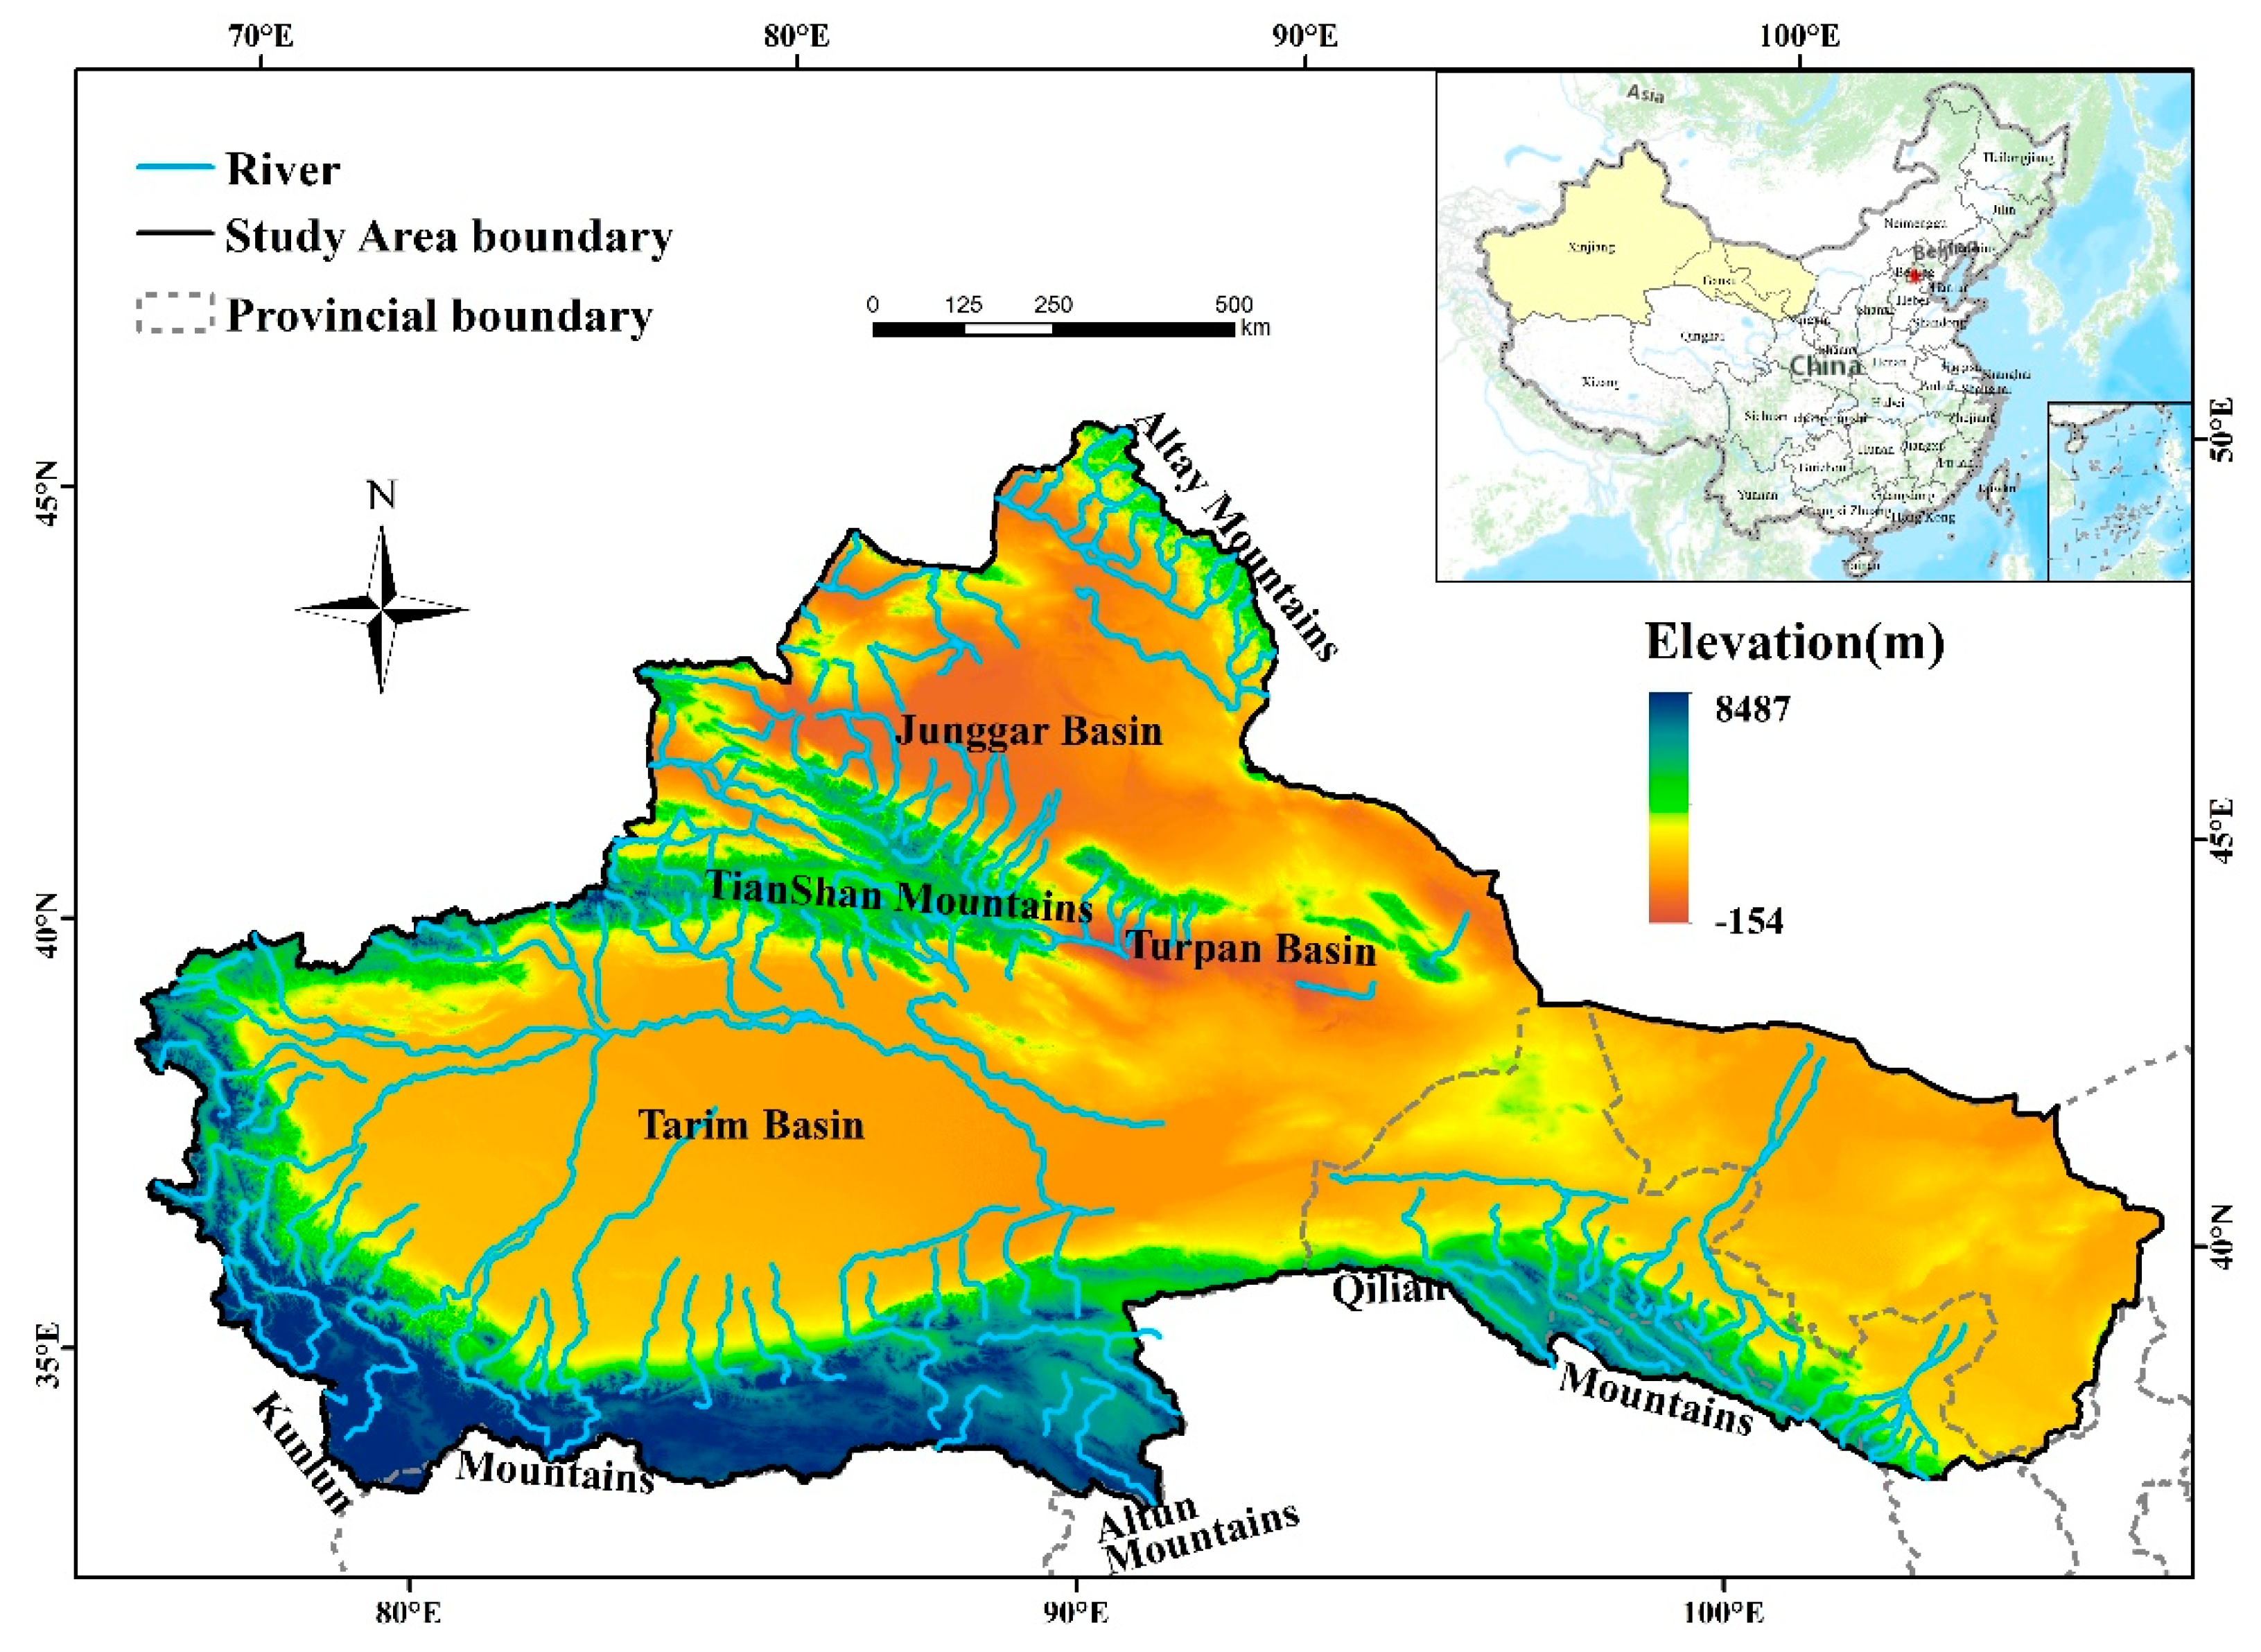
The arid region of Northwest China (ARNC) is located in 34°54′–49°19′ N, 73°44′–106°46′ E (Figure 1), and includes all of Xinjiang, central and western Inner Mongolia, the northwest of Ningxia, and Gansu Province. Its total area is about 2.12 million km2, accounting for over one-fourth of China’s total territory. It is one of the driest regions in the world, located deep inland and far away from the sea. The ARNC has a vast territory and a complex topography that includes mountains, plateaus, deserts, and basins [40]. It is a typical temperate continental arid climate with large temperature differences, intense evaporation, and a dry climate. The Westerly Circulation is the main factor for water vapor transport [41], and the distribution of precipitation is largely dependent on topography in the ARNC. The region is very sensitive to climate change because of its fragile ecological environment, arid climate, strong solar radiation, and scarce water resources. The magnitude of climate warming is significantly higher than that of global warming in this region. Since the 21st century, the climate here is getting warming and wetting [42,43].
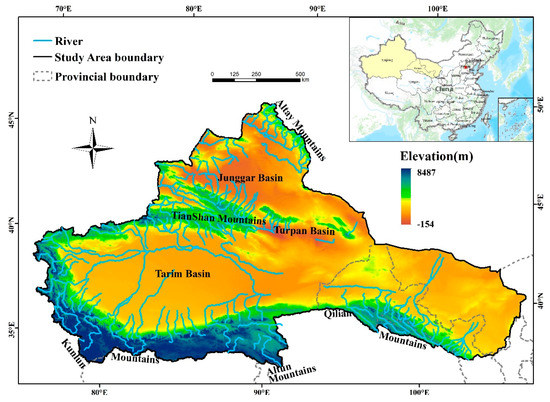
Figure 1.
Location and geographical settings of the arid region of Northwest China.
3. Datasets and Methodology
3.1. Datasets
3.1.1. NDVI Dataset
MODIS data have been widely used in large-scale vegetation monitoring due to their freely available with a higher temporal resolution [44]. The MOD13A2 V6 product, developed by the National Aeronautics and Space Administration (NASA) MODIS land product group [45], is a global vegetation index product with a spatial resolution of 1 km and a temporal resolution of 16 days [46]. The algorithm for this product chooses the best available pixel value from all the acquisitions within every 16 days. The criteria used are low clouds, low view angle, and the highest vegetation index value. In this study, Google Earth Engine (GEE) was used to obtain monthly and annual NDVI data covering the ARNC region from 2000 to 2018. The monthly NDVI data were obtained using the Maximum Value Composites (MVC) method [47]. Annual NDVI comprised the maximum of monthly NDVI datasets between 2000 and 2018. The outliers were removed to ensure the accuracy of the data. The annual MODIS-NDVI data are resampled from 1 km to 1.875° × 1.25° resolution to match the resolution of HadEX3 data.
3.1.2. Land Cover Dataset
The MODIS Land Cover type product (MCD12Q1) that was derived according to International Geosphere-Biosphere Programme (IGBP) classification scheme [42], was employed in this study as ancillary information for indicating vegetation-covered MODIS pixels and vegetation types. It includes 17 land types, which were reclassified into Needleleaf Forests, Broadleaf Forests, Shrublands, Grasslands, Croplands, Deserta, and Non-vegetation in this study. MCD12Q1 product is processed and acquired from GEE, same as the NDVI product. And we also checked the details that there were outliers in the data, and the outliers were removed to ensure the accuracy of the data.
3.1.3. HadEX3
The HadEX3 describes and uses the latest integrated observational resources to quantify changes in the diurnal temperatures and precipitation. The land-surface dataset that was used consists of 29 climate extremes indices (CEIs) which were first calculated at each station and interpolated onto a global grid with 1.875° longitude × 1.25° latitude spatial resolution (~142.67 km × 159.38 km) [48], covering 1901–2018, using data from about 7000 temperature stations and 17,000 precipitation stations around the world (www.metoffice.gov.uk/hadobs/hadex3, access on 10 November 2020). These 29 indices were developed by the World Meteorological Organization (WMO) Expert Team on Climate Change Detection and Indices (ETCCDI) [49]. They aim to facilitate the analysis of climate extremes by defining a set of climate extremes indices that provide a comprehensive overview of temperature and precipitation statistics focusing particularly on extreme aspects. The indices comprehensively reflect the frequency and intensity of temperature extremes and precipitation events. This method was used by ETCCDI to define CEIs and has been widely used for studying climate extremes events [50,51]. In accordance with the actual situation of temperature and precipitation, we selected 11 CEIs that best reflect the diurnal range of temperature (DTR), temperature extremes events, short-term and long-term precipitation events [52] to analyze climate extremes changes in ARNC. They include 2 precipitation and 9 temperature indices (Table 1). Both annual CEIs data and monthly CEIs data were used for analysis at different temporal scales.

Table 1.
Selection and definition of climate extremes indices (CEIs) in this study.
3.2. Methodology
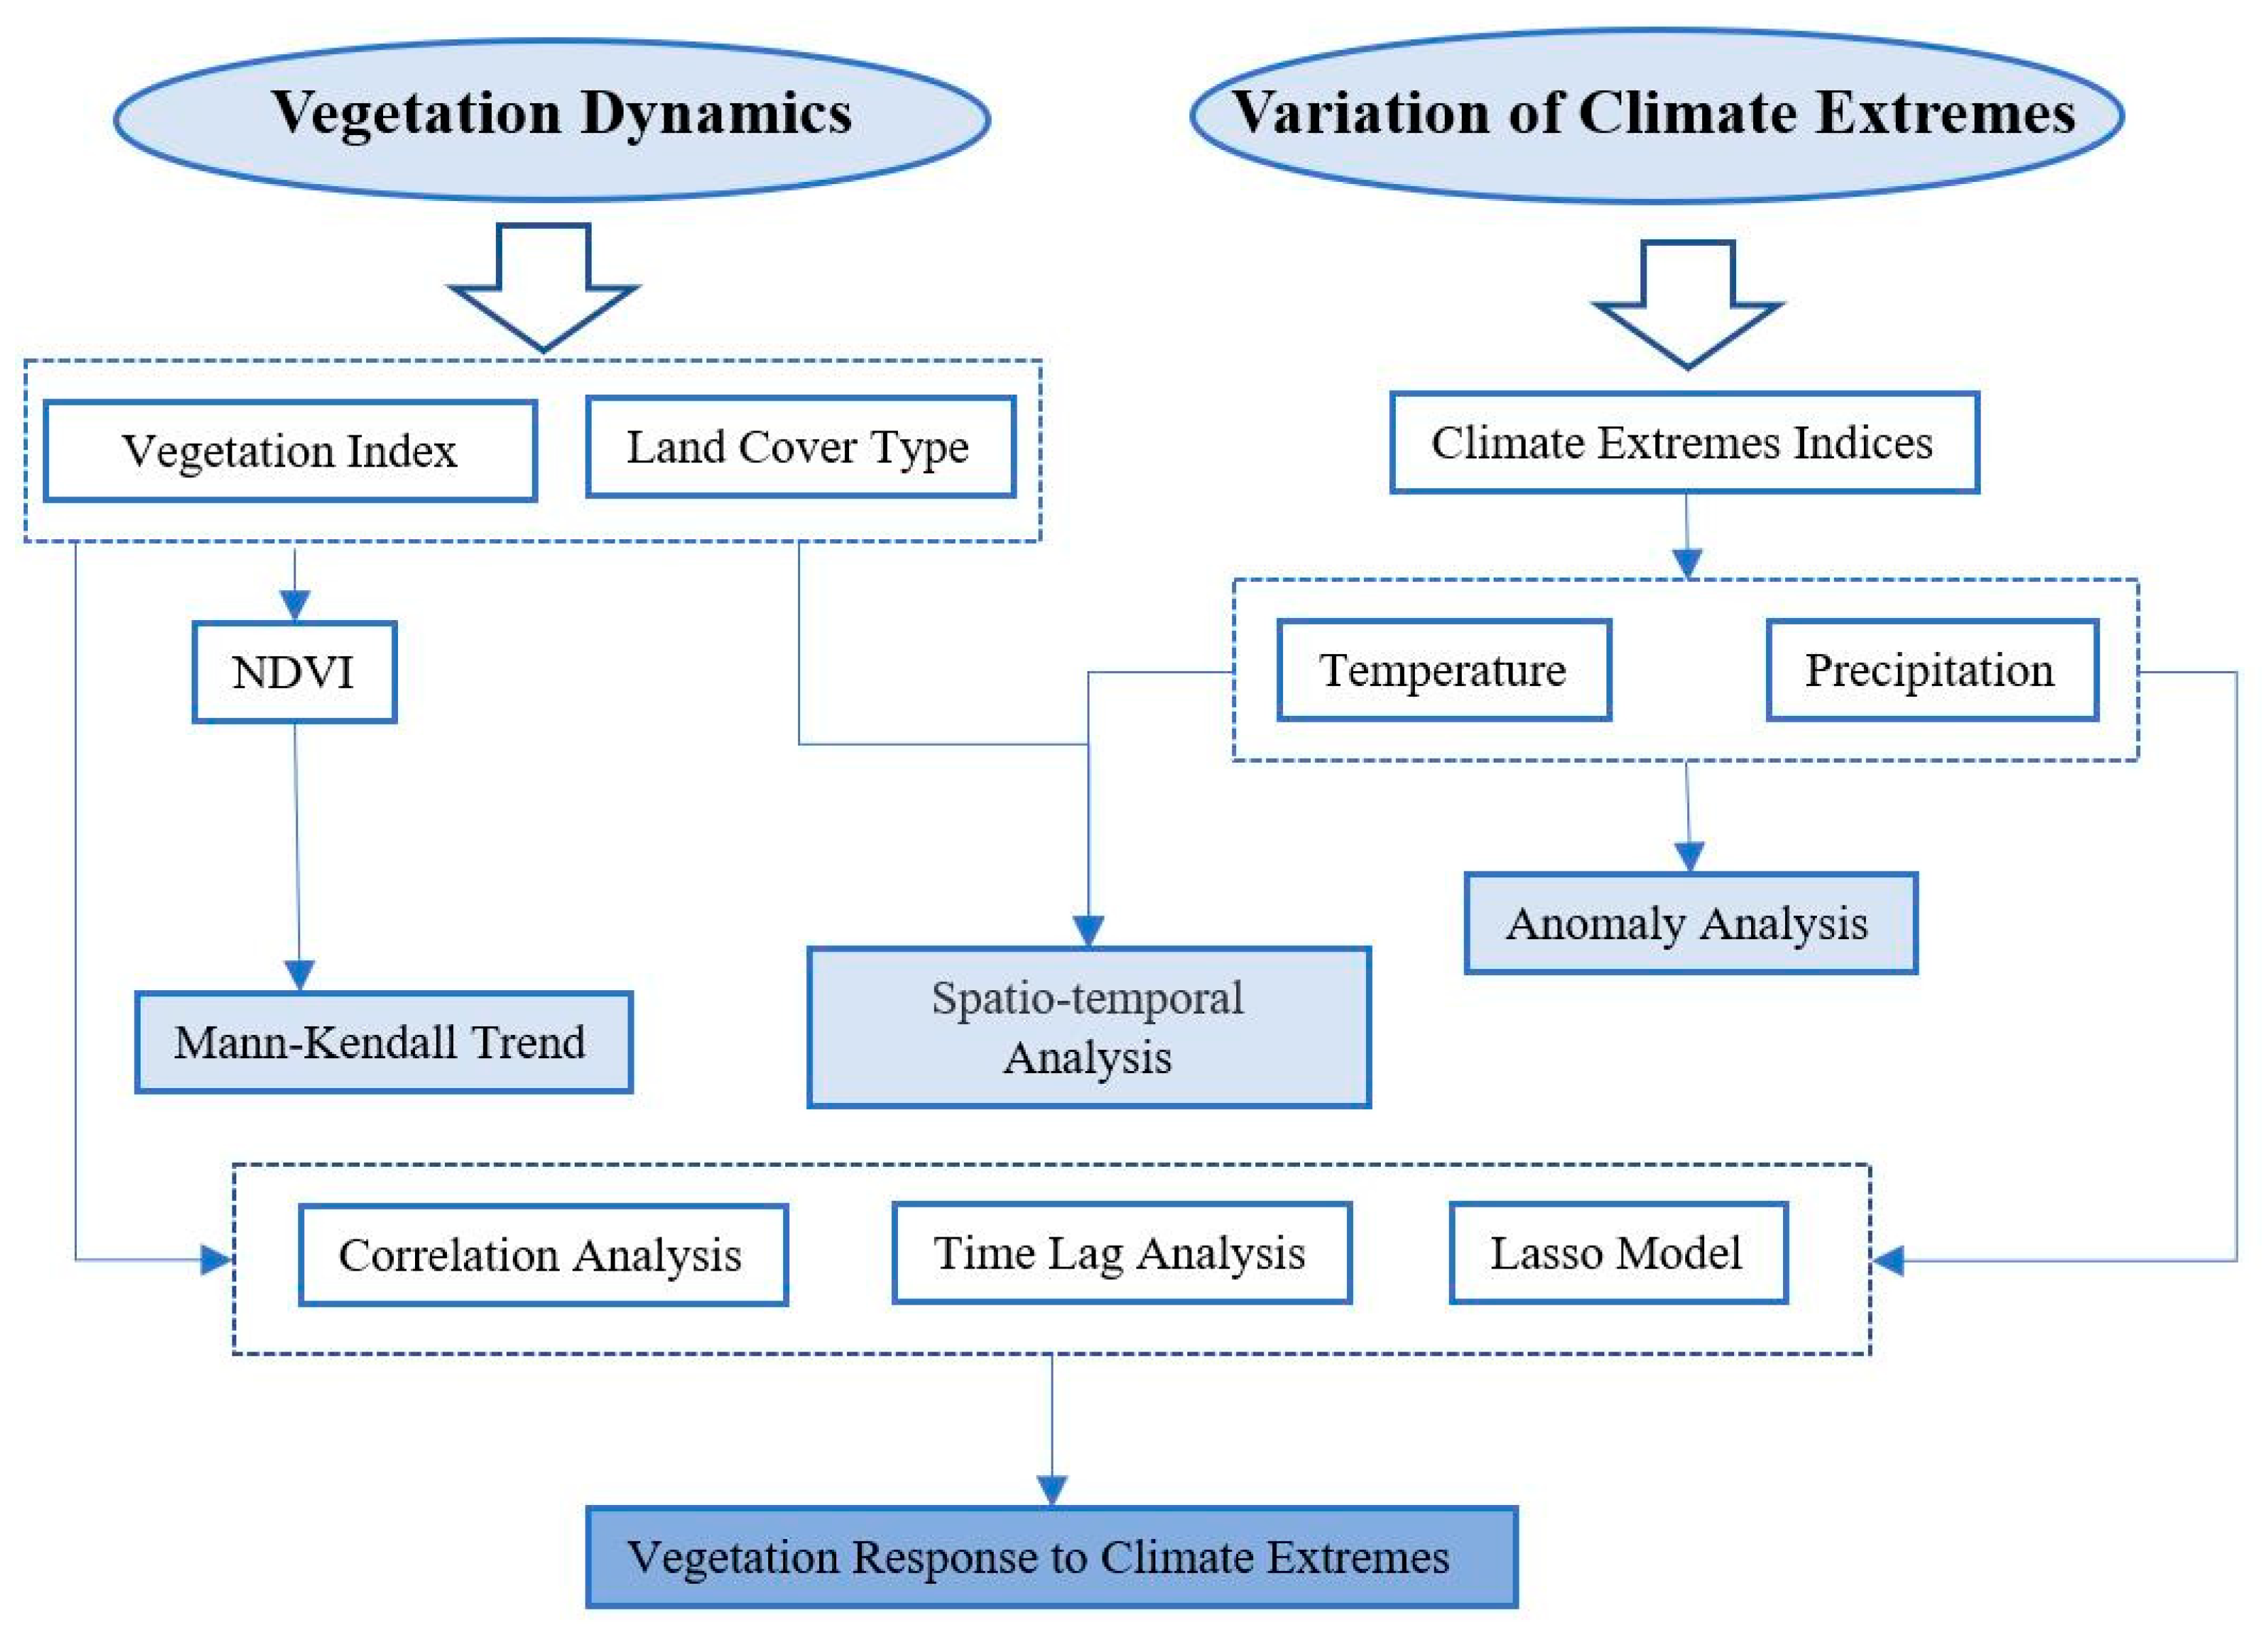
We used the Mann-Kendall (MK) trend analysis to investigate the dynamic trend of vegetation in ARNC from 2000 to 2018 [53,54]. As vegetation in this region is very limited in winter, we only used NDVI data in spring (March–May), summer (June–August), and autumn (September–November). After the temperature extremes and precipitation extremes, anomaly analysis was conducted, the correlation between NDVI and CEIs was analyzed to further investigate the characteristics of vegetation’s response to climate extremes at different temporal scales. To avoid multicollinearity, the Least absolute shrinkage and selection operator logistic regression (Lasso) model was adopted to analyze the relationship between NDVI and CEIs and to reveal the major influential climate extremes factors to NDVI change. The time lag analysis method was employed to analyze the time lag of the response and help reveal the spatial patterns of the time lag effect. The data and methods used involves the following steps (Figure 2).
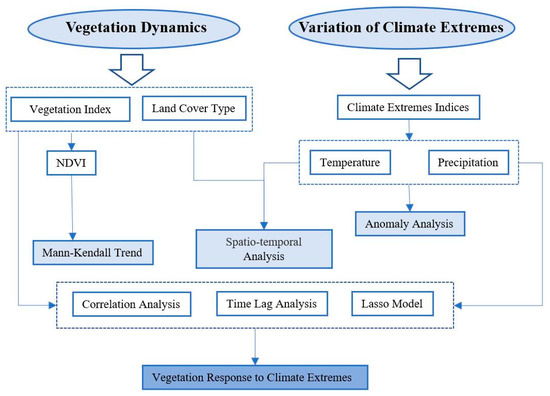
Figure 2.
Framework of the study.
3.2.1. Trend Analysis
We chose the Mann–Kendall (MK) Trend test for analyzing the trend of annual NDVI variation during 2000–2018 [54]. This method does not require the samples to follow a specific distribution, and its results are not easily affected by abnormal values [55,56]. The MK method is effective for dealing with abnormal distribution data in many fields, in particular hydrology and meteorology. The trend can be detected successfully when the sample size is over 10. It is also noted that the existence of serial correlation can alter the variance of the estimate of the MK statistic [57]. To quantify the significance of a trend, we first computed a standardized Z test statistic and then fit the standard normal distribution to the S statistic [58,59]. The Z is a test statistic; the Z value is calculated according to Equation (1):
S is the variance. Given confidence level,, indicates that there are significant changes in the sequence by pixel time series. Positive values of Z indicate increasing trends while negative values indicate decreasing trends.
The Theil–Sen (TS) slope [60] was further used to assess the magnitude of the trend [61]. The formula is shown as below [62]:
The slope is the trend of NDVI, and are the year number. and are the NDVI values of the time series for the same pixels j and i in 2 different years, respectively, sign is a sign function, and n is the length of the time series.
3.2.2. Anomaly Analysis
In the study of climate change, the anomaly is often used to describe the deviation between the observed value out of a series of values and its corresponding expected value. The anomaly can be classified into the positive anomaly and negative anomaly, depending on whether a certain data is higher or lower than the long-term average of its whole series. The anomaly sequence calculated in this study is the difference between the measured values and the mean values of 11 CEIs within ARNC from 2000 to 2018. For sequence , the cumulative anomaly of t at a certain moment is expressed as Equation (5) [63]:
We calculated all the cumulative anomaly values and drew the cumulative anomaly curve for trend analysis. In addition, the moving average (MA) method was employed to determine the average of the time series of CEIs to show the trend of its change over time.
3.2.3. Correlation Analysis
To study the response of vegetation to climate extremes, we used Pearson’s correlation analysis to assess the impact of temperature extremes and precipitation extremes on vegetation growth. It is calculated as Equation (6) [64],
where R is the correlation coefficient between the monthly value of two variables and , and and are their mean values. When R is greater than 0, the two variables are positively correlated. When R is less than 0, the two variables are negatively related.
3.2.4. Time Lag Cross-Correlation Method
To determine the period in which temperature and precipitation extremes exert a greater impact on vegetation growth, the time lag cross-correlation method was used to determine the time lag of vegetation growth and CEIs. In 2000−2018, this study selected growing season vegetation (April to August) as a set of variables, assuming that time series of NDVI and CEIs are related to each other in any time lag of k. The formula of time lag cross-correlation number is as follows:
where n is the number of and with a time lag of k (k = 0, 1, 2, 3,…).
3.2.5. Least Absolute Shrinkage and Selection Operator Logistic Regression (Lasso)
The Lasso is a compression estimation method proposed by Robert Tibshirani [65]. By introducing the penalty function into the regression model, the regression coefficient of the insignificant variable is compressed to 0, thus solving the multicollinearity problem [66]. In this paper, the Lasso model was implemented for modeling and analyzing the relationship between NDVI and CEIs in R software [67]. After selecting influential factors with high correlation and eliminating influential factors with small correlation, major climate extremes factors affecting NDVI were discussed.
4. Results
4.1. Spatial Variations of Vegetation Trend
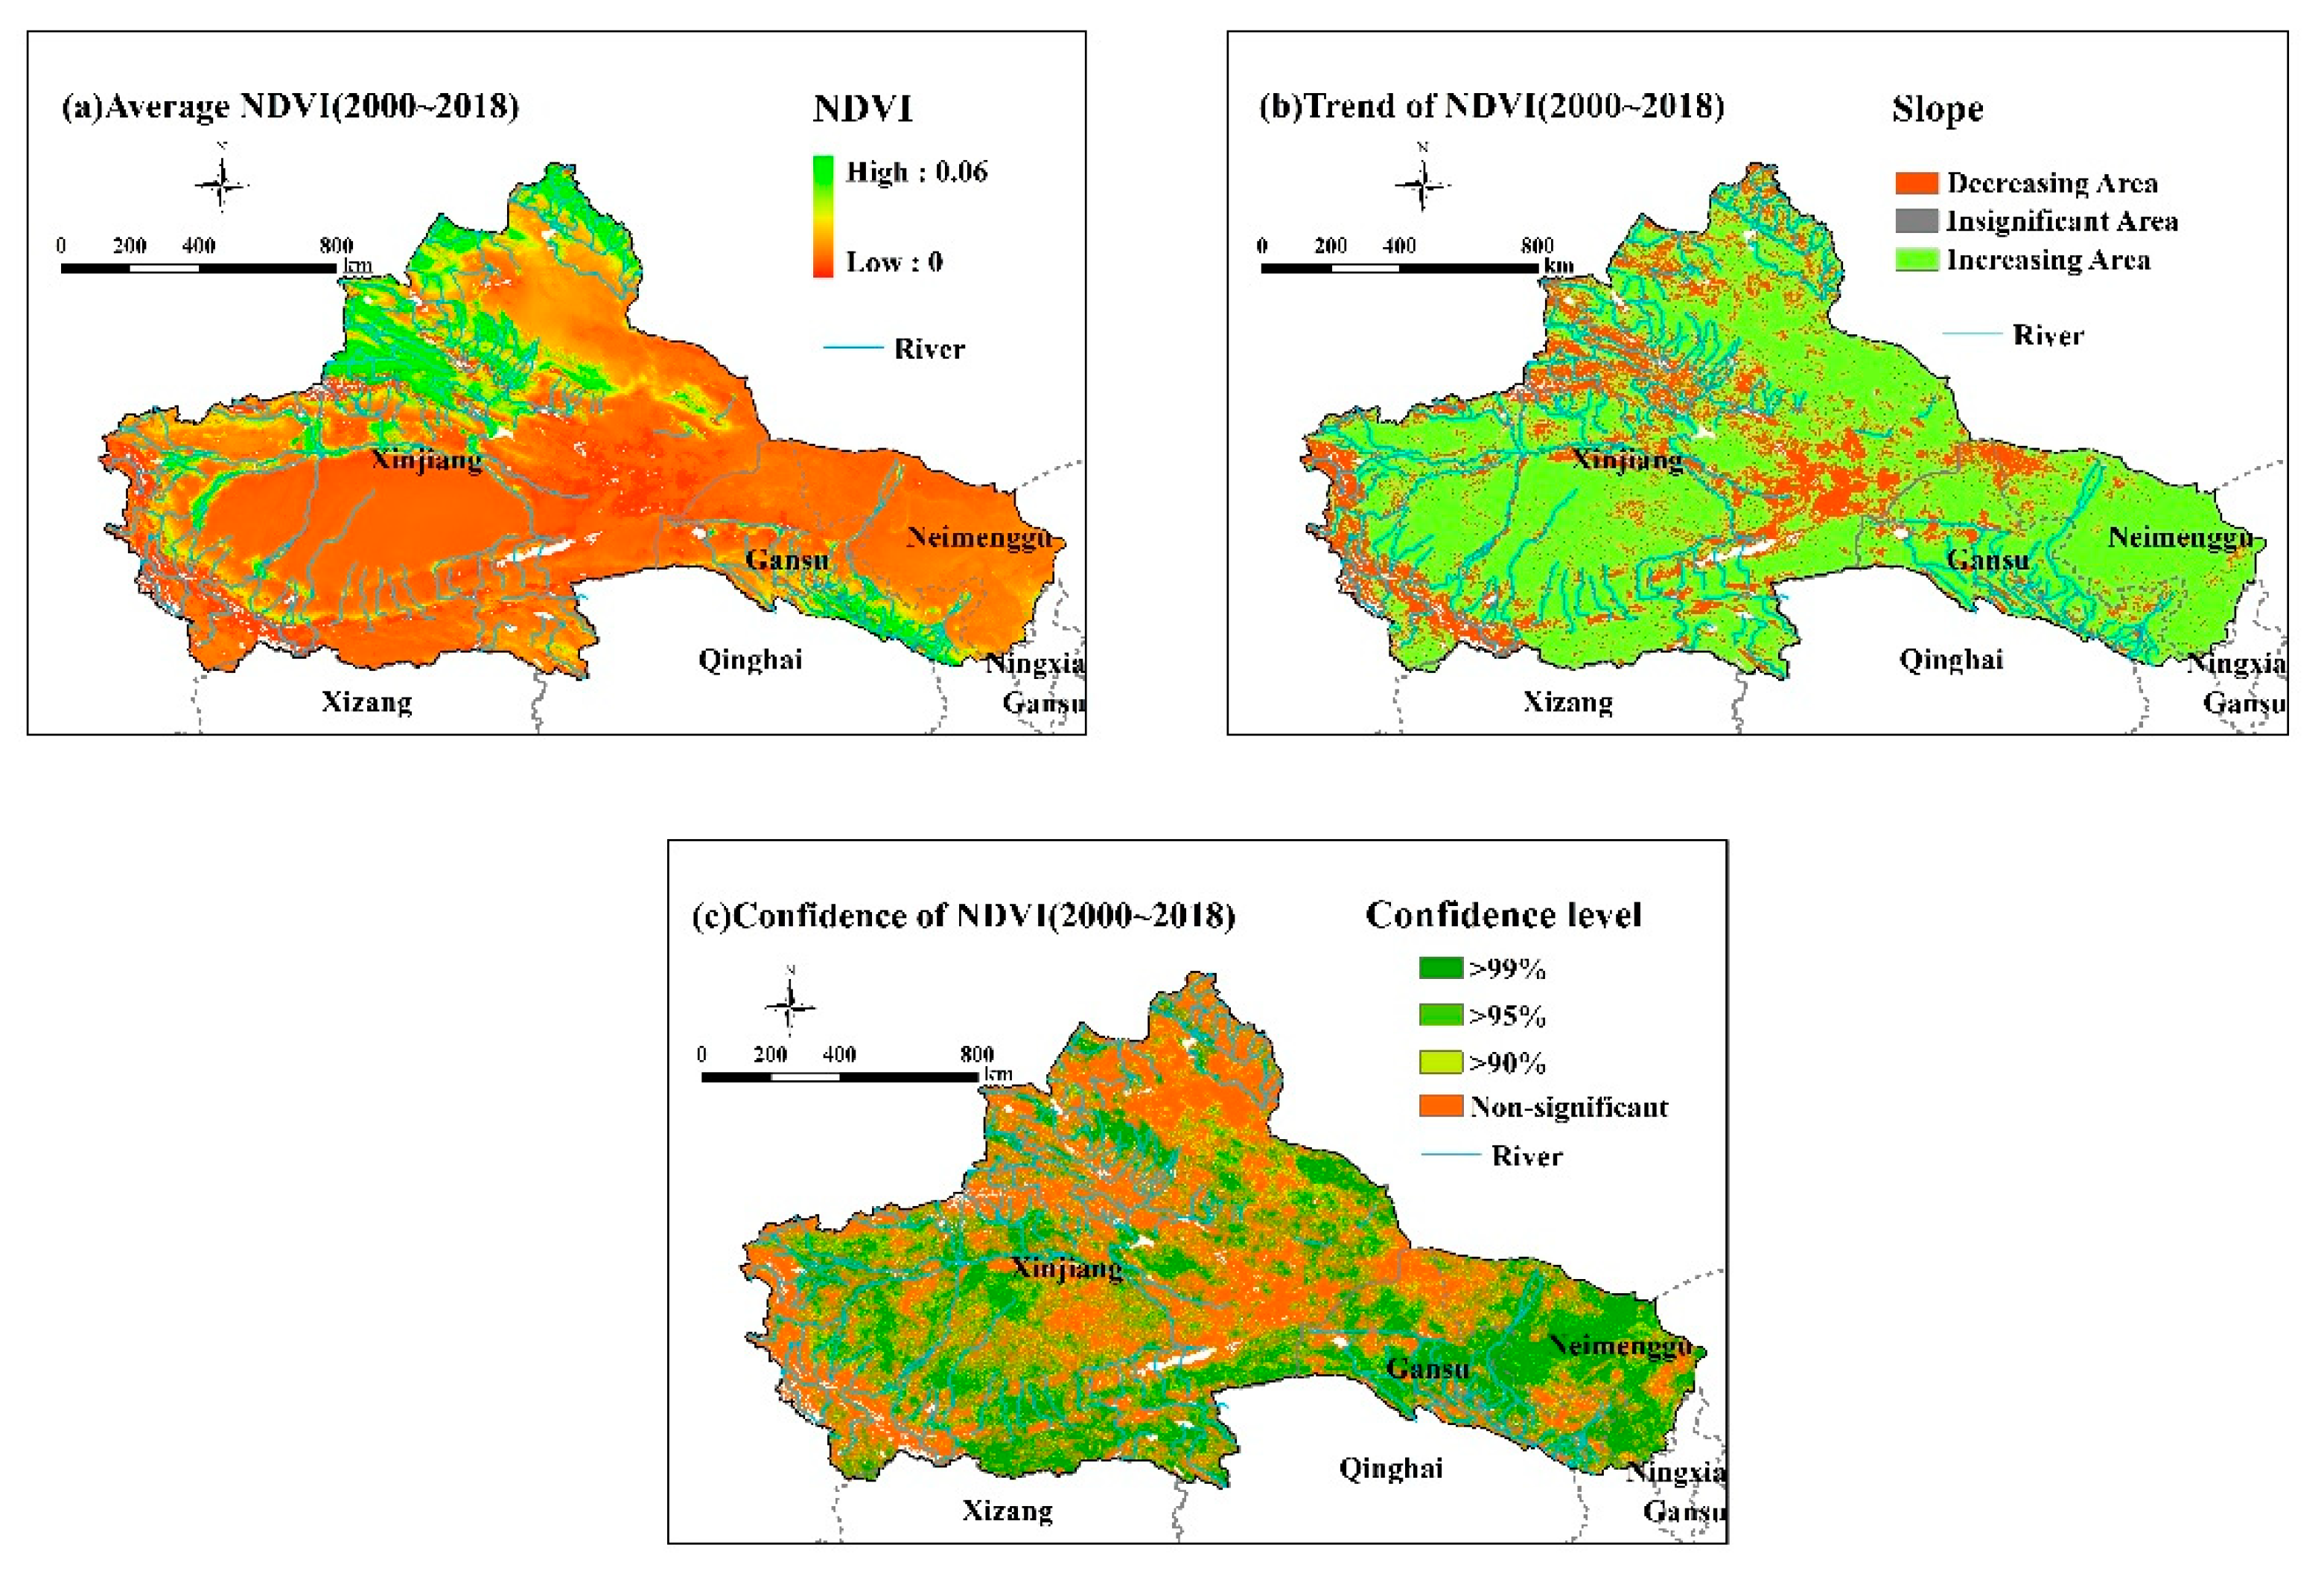
Figure 3 shows the spatial distribution of annual average NDVI in the ARNC from 2000 to 2018 (Figure 3a), the annual trend of NDVI (Figure 3b), and its confidence (Figure 3c) derived from MK and T-S slope methods. High NDVI values were concentrated in Tianshan and Altai Mountains in the northwest and southeast parts of the study area where precipitation is rich, which covers about 20.98% of ARNC. Low NDVI values were distributed in the aridest center and northwest part, which accounts for 36.04% of the total area.
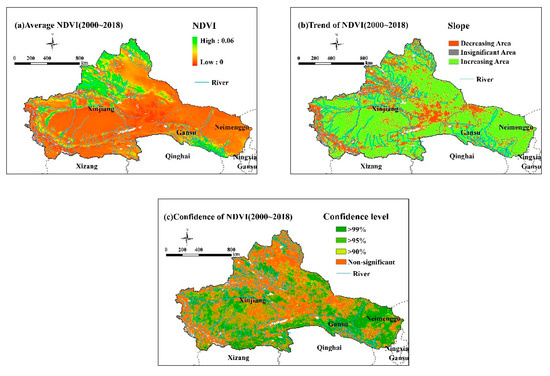
Figure 3.
(a) Mean NDVI, (b) annual NDVI trend, and (c) the confidence level in ARNC from 2000 to 2018.
Figure 3 demonstrates that the overall trends of NDVI are increasing. This indicates an increase in vegetation. The NDVI-increasing area accounts for 74.57%, and the decreasing area takes up the remaining quarter. In general, vegetation is abundant in the piedmont of Tianshan Mountains, Altai Mountains, Qilian Mountains, and the Kunlun Mountains in recent 19-yr, while vegetation in other regions had slightly changed. NDVI has increased in 74.57% of the study area, 50.61% of which showed a significant increasing trend at the 90% confidence level and was mainly located in the northern mountainous area. The increase in vegetation there is attributed to the effective implementation of the strategy of returning farmland to the forest [68,69].
4.2. Temporal Variations of Vegetation
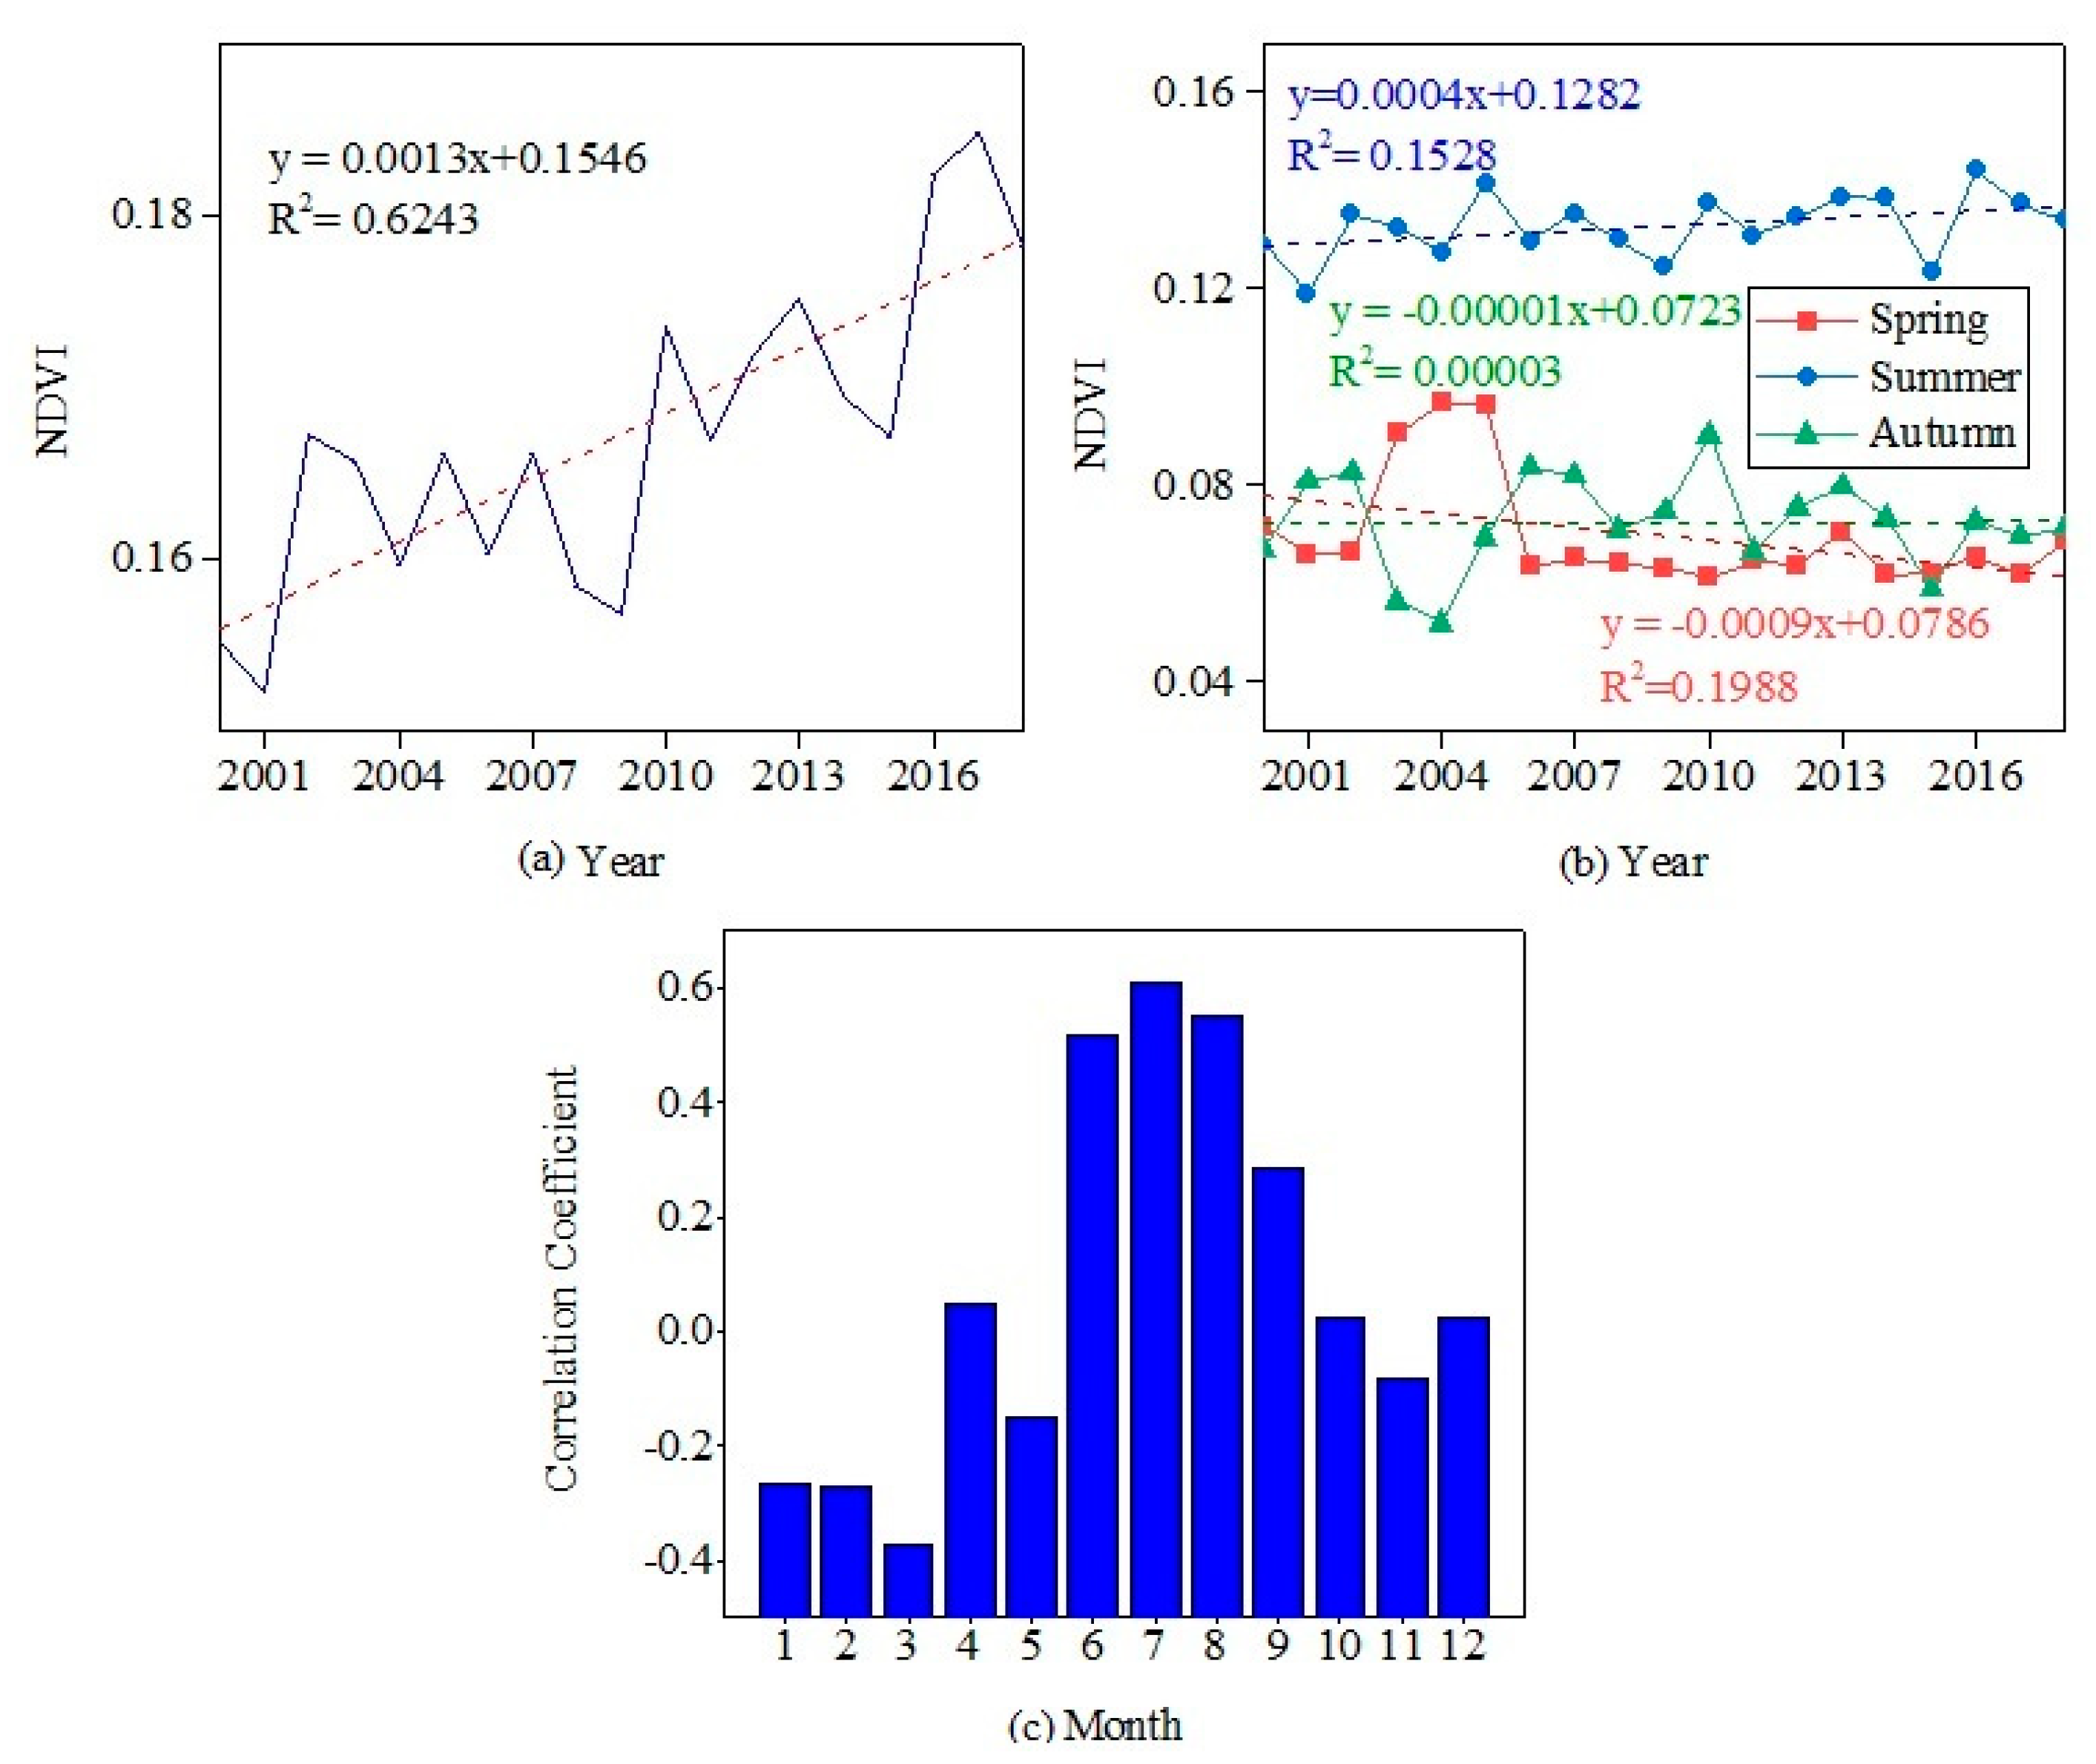
To further analyze the overall temporal change of NDVI, we used the linear regression methods to reveal the time-series of annual NDVI (Figure 4a), seasonal NDVI (Figure 4b), an association of different monthly and annual NDVI (Figure 4c) from 2000 to 2018. The NDVI value of each year in Figure 4 was derived by taking the average value of all the pixels on the annual NDVI images.
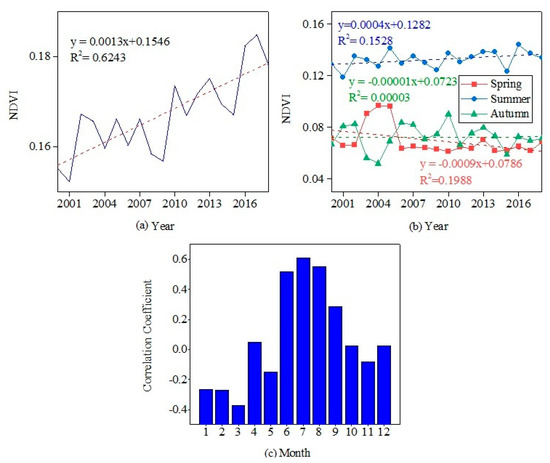
Figure 4.
Variations of (a) annual NDVI, (b) seasonal NDVI, and (c) monthly NDVI in ARNC.
Figure 4 shows that the overall NDVI fluctuates continuously from 2000 to 2018. Annual NDVI surpassed the multi-year average NDVI (0.17) in 2016, as the NDVI was highest in 2017 (0.18) and lowest in 2001 (0.15). The increasing rate of NDVI is ~0.0013 (13%/a), indicating that the vegetation increased in ARNC from 2000 to 2018. Among the three seasons, summer has the highest overall NDVI with relatively small annual variation and a slightly increasing trend (~0.04%/a). Spring and autumn have close NDVI series, and a decreasing trend (~0.09%/a) was identified in the spring NDVI series. Figure 4c reflects the intra-annual heterogeneity of NDVI. A positive correlation of monthly NDVI was found in April, June to October, and December. The positive correlation indicates that the monthly NDVI has an increasing trend and the vegetation gradually increases.
4.3. Spatiotemporal Variation of CEIs
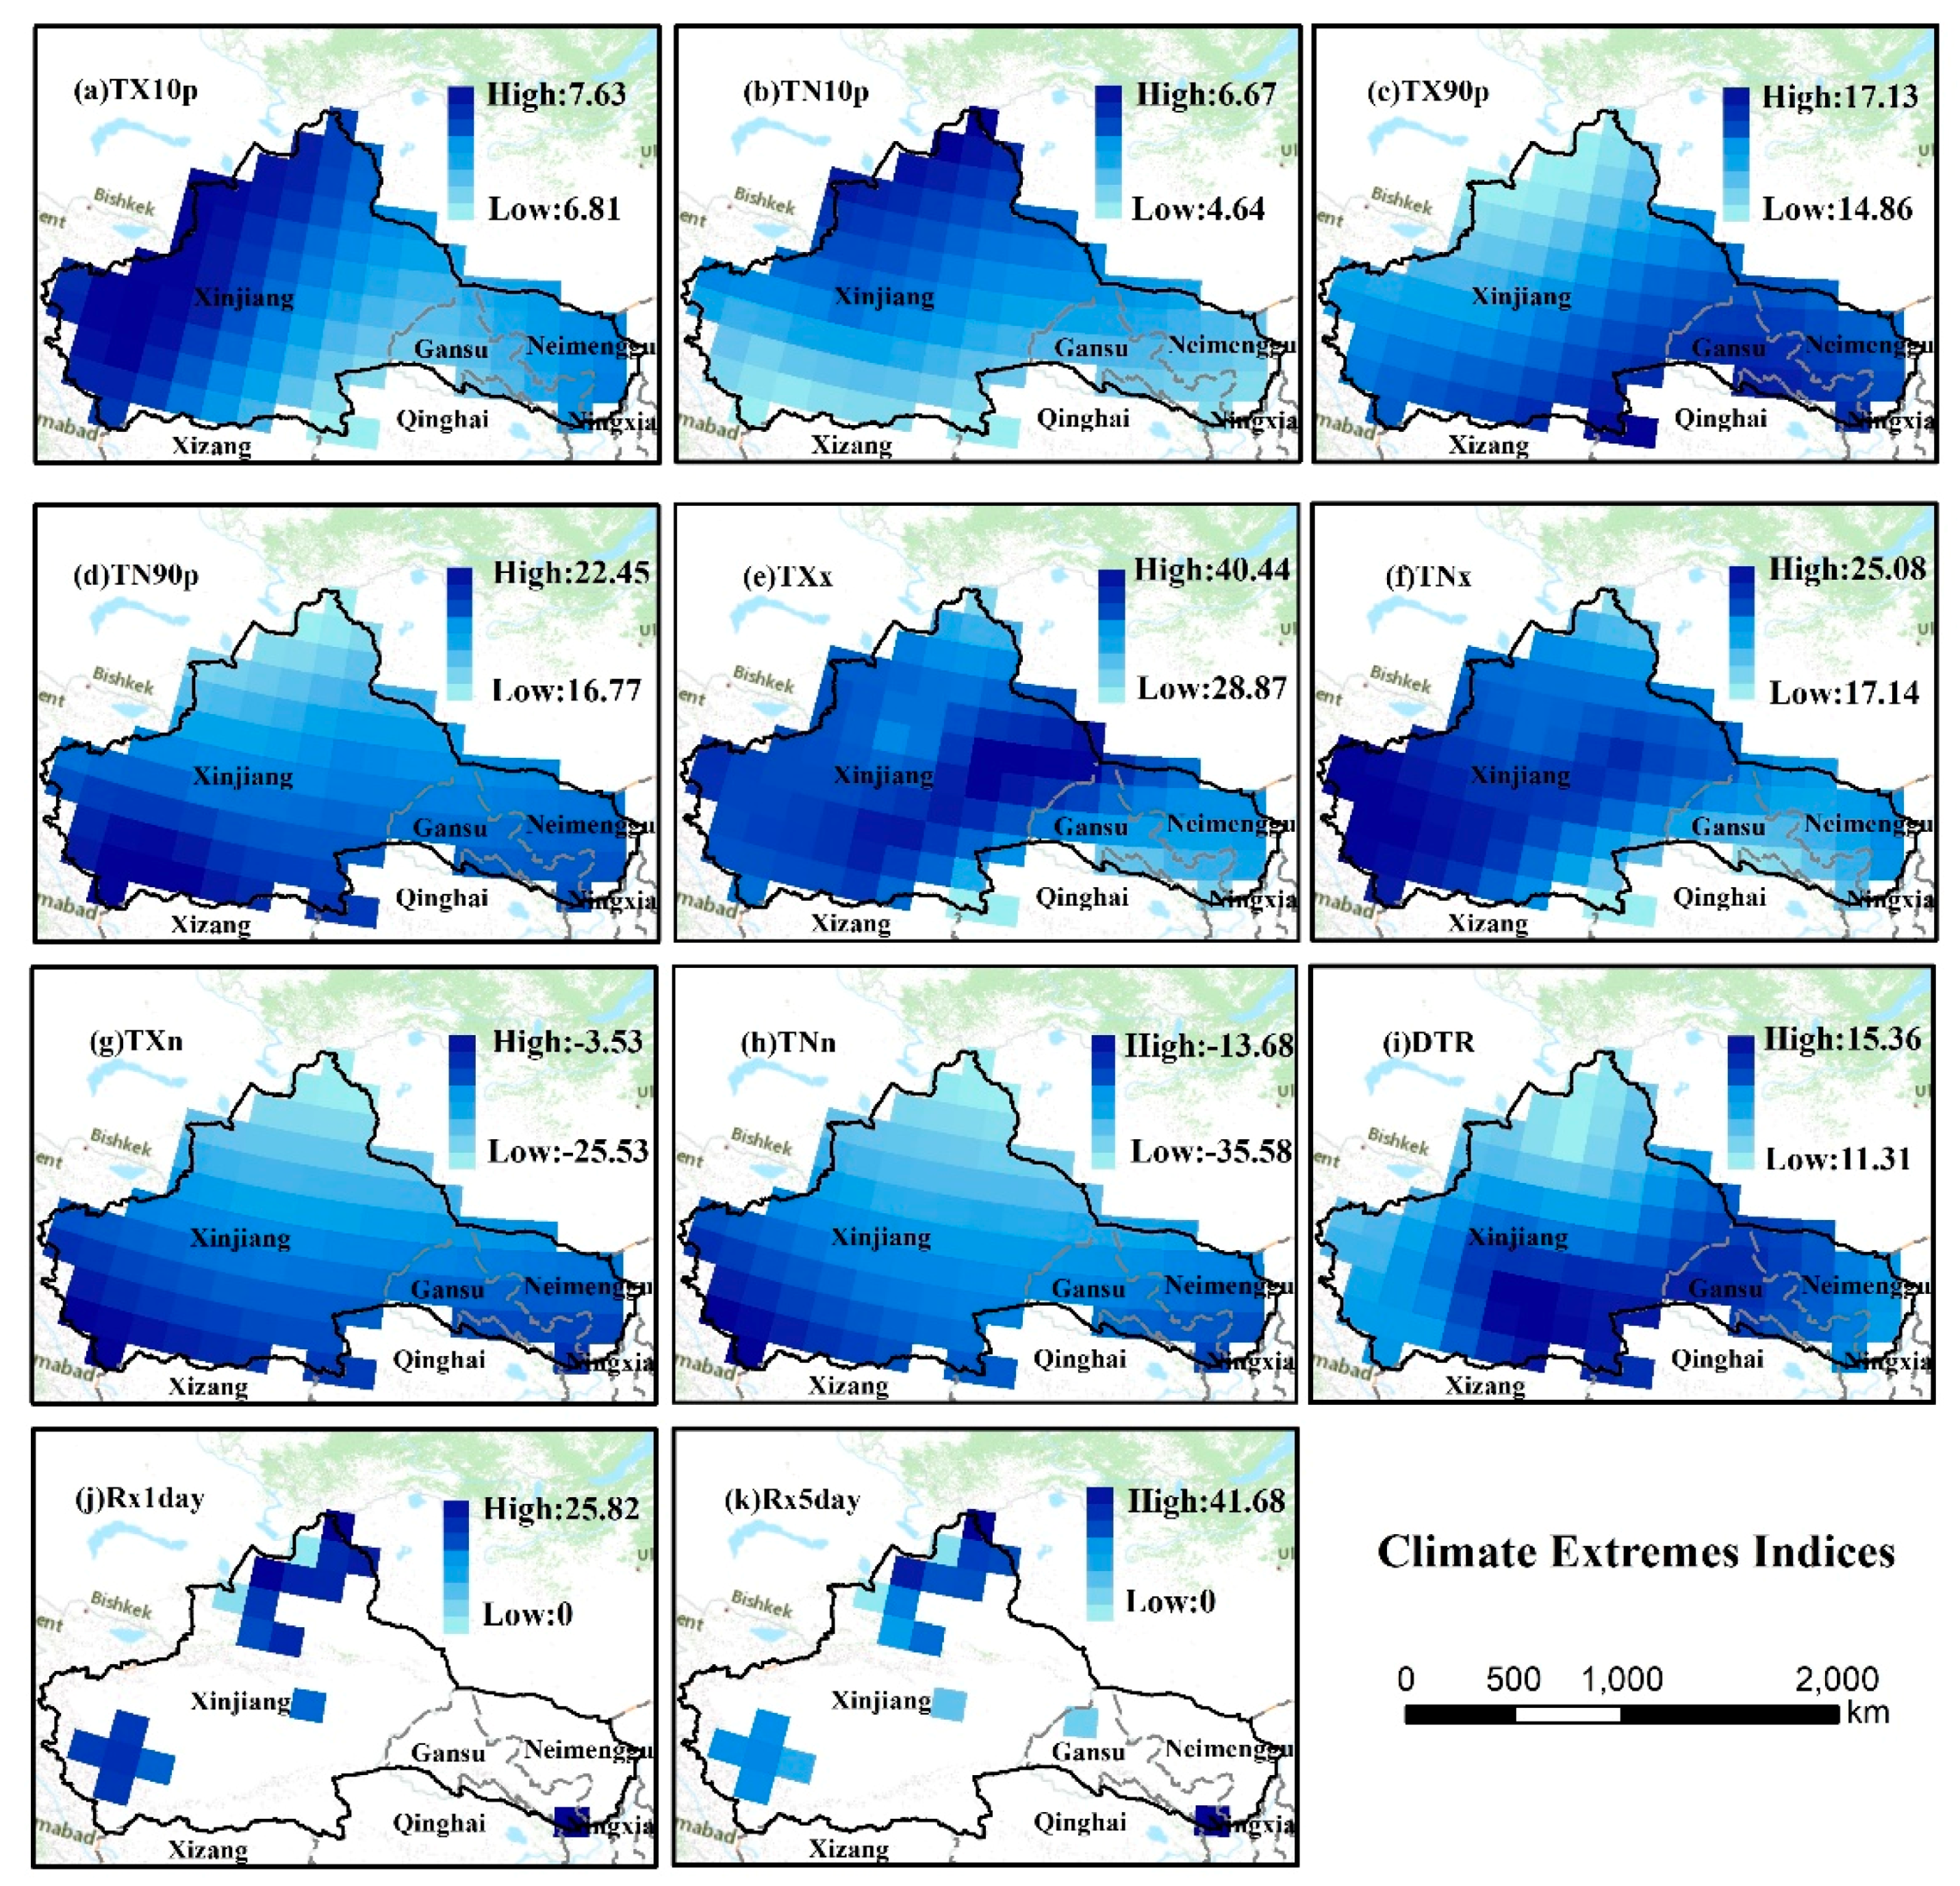
Figure 5 shows the great heterogeneity of climate extremes in ARNC from 2000 to 2018. And low-temperature extremes (TX10p, TN10p, and TNx) mainly occurred in the Tianshan Mountains and the Altai Mountains, due to their high altitude. The maximum values of high-temperature extremes (TXn, TXx, TN90p, and TX90p) are concentrated in the Turpan and Tarim basins. This phenomenon may be caused by the cold front from the high pressure in Mongolia high-pressure being blocked by Tianshan Mountain, making it difficult to reach its southern side. The highest value of the DTR in ARNC is 15.36 °C and the lowest value is 11.30 °C. The high values are distributed in the Kunlun Mountains and the Altai Mountains. Precipitation extremes are affected by the altitude and are more spatially variable. High precipitation extremes (Rx1day and Rx5day) are distributed in the Altai Mountains, the Tianshan Mountains, and the Kunlun Mountains, and their high altitudes bring abundant precipitation.
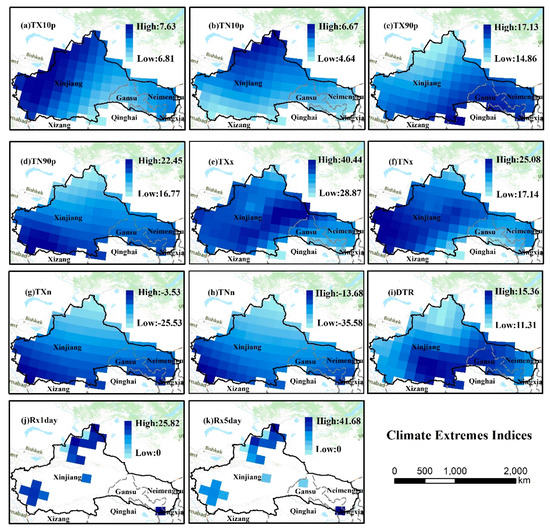
Figure 5.
Spatial distribution of CEIs based on HadEX3 data during 2000–2018. (a) TX10p (days), (b) TN10p (days), (c) TX90p (days), (d) TN90p (days), (e) TXx (°C), (f) TNx (°C), (g) TXn (°C), (h) TNn (°C), (i) DTR (°C), (j) Rx1day (mm), and (k) Rx5day (mm).
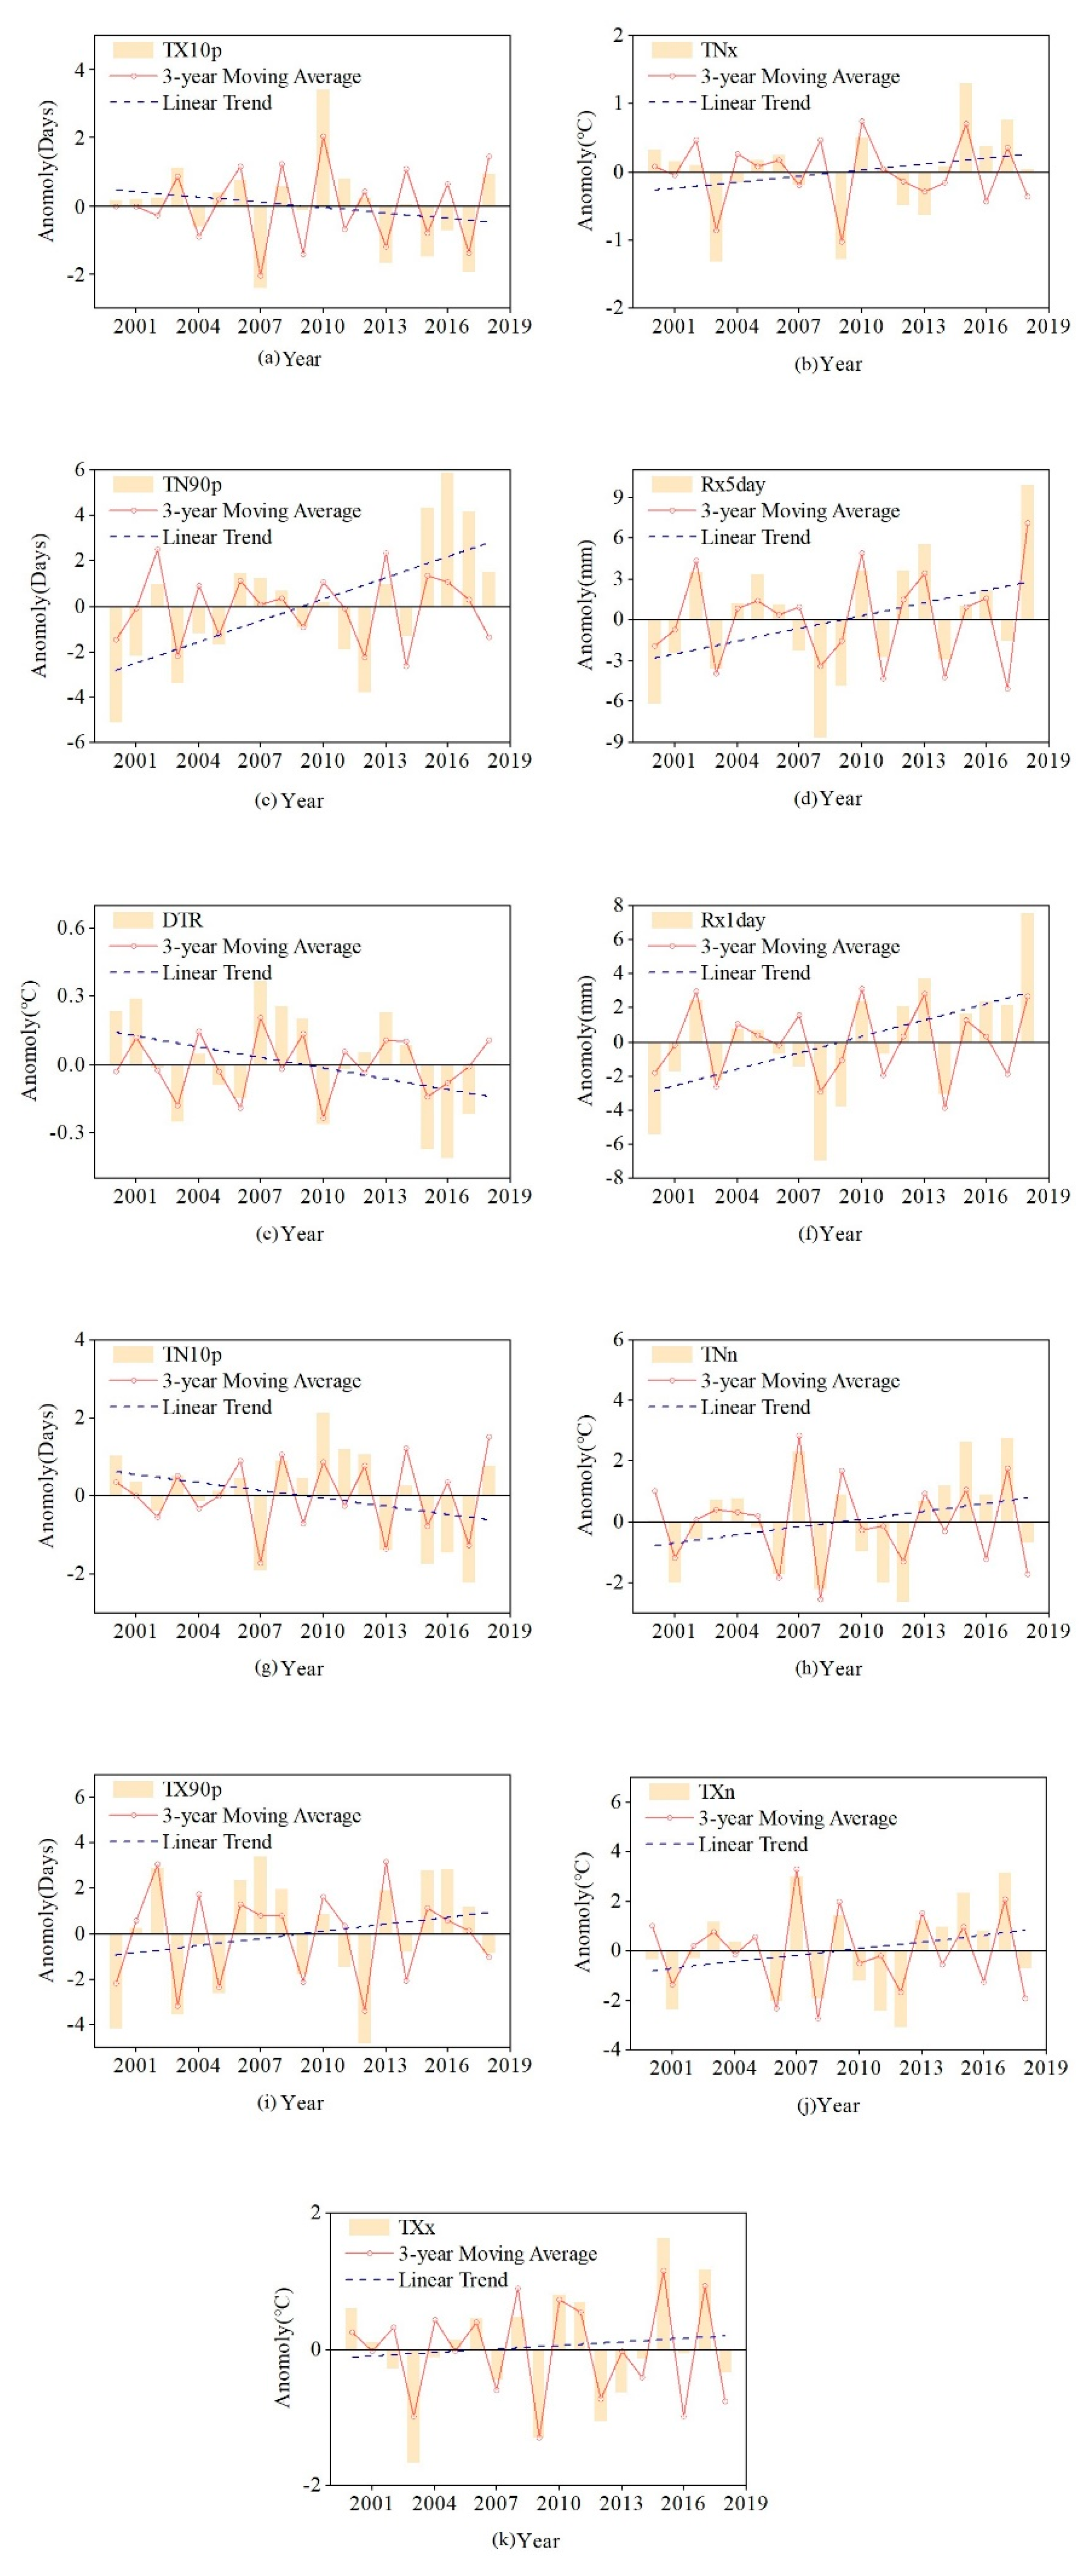
Figure 6 shows that most of the CEIs, except for TX10p, TN10p, and DTR, had rapidly increasing trends from 2000–2018. For the change of CEIs, the study shows that the linear trends for Rx1day, Rx5day, TN90p, TNn, TNx, TX90p, TXn, TXx have increased at rates of 6.09 mm/19a, 5.93 mm/19a, 5.95 days/19a, 1.64 °C/19a, 0.56 °C/19a, 5.96 days/19a, 1.70 °C/19a, and 0.54 °C/19a, respectively.
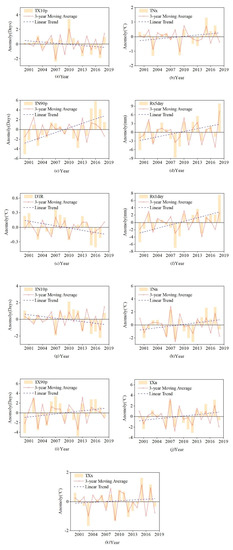
Figure 6.
Inter-annual variations of CEIs anomalies, linear trend, and 3-year moving average in the ARNC from 2000 to 2018. (a) TX10p (days), (b) TN10p (days), (c) TX90p (days), (d) TN90p (days), (e) TXx (°C), (f) TNx (°C), (g) TXn (°C), (h) TNn (°C), (i) DTR (°C), (j) Rx1day (mm), and (k) Rx5day (mm).
On the contrary, temperature extremes indices (TN10p, TX10p, and DTR) decreased at rates of 1.30 days/19a, 0.98 days/19a, and 0.30 °C/19a, respectively. The 3-year moving average shows that CEIs fluctuate and slightly increase. Moreover, the inter-annual range of DTR also demonstrates a decreasing trend. Most of the years show positive anomalies after 2010, indicating that the temperature is rising continuously, which is consistent with the characteristics of global warming. Moreover, the 3-year moving average also shows that precipitation extremes occurred increasingly frequently and negative anomalies were generally found before 2010. Precipitation extremes increased significantly, suggesting that ARNC might be becoming wetter.
4.4. Vegetation Variations in Response to Climate Extremes
4.4.1. Correlation between NDVI and CEIs
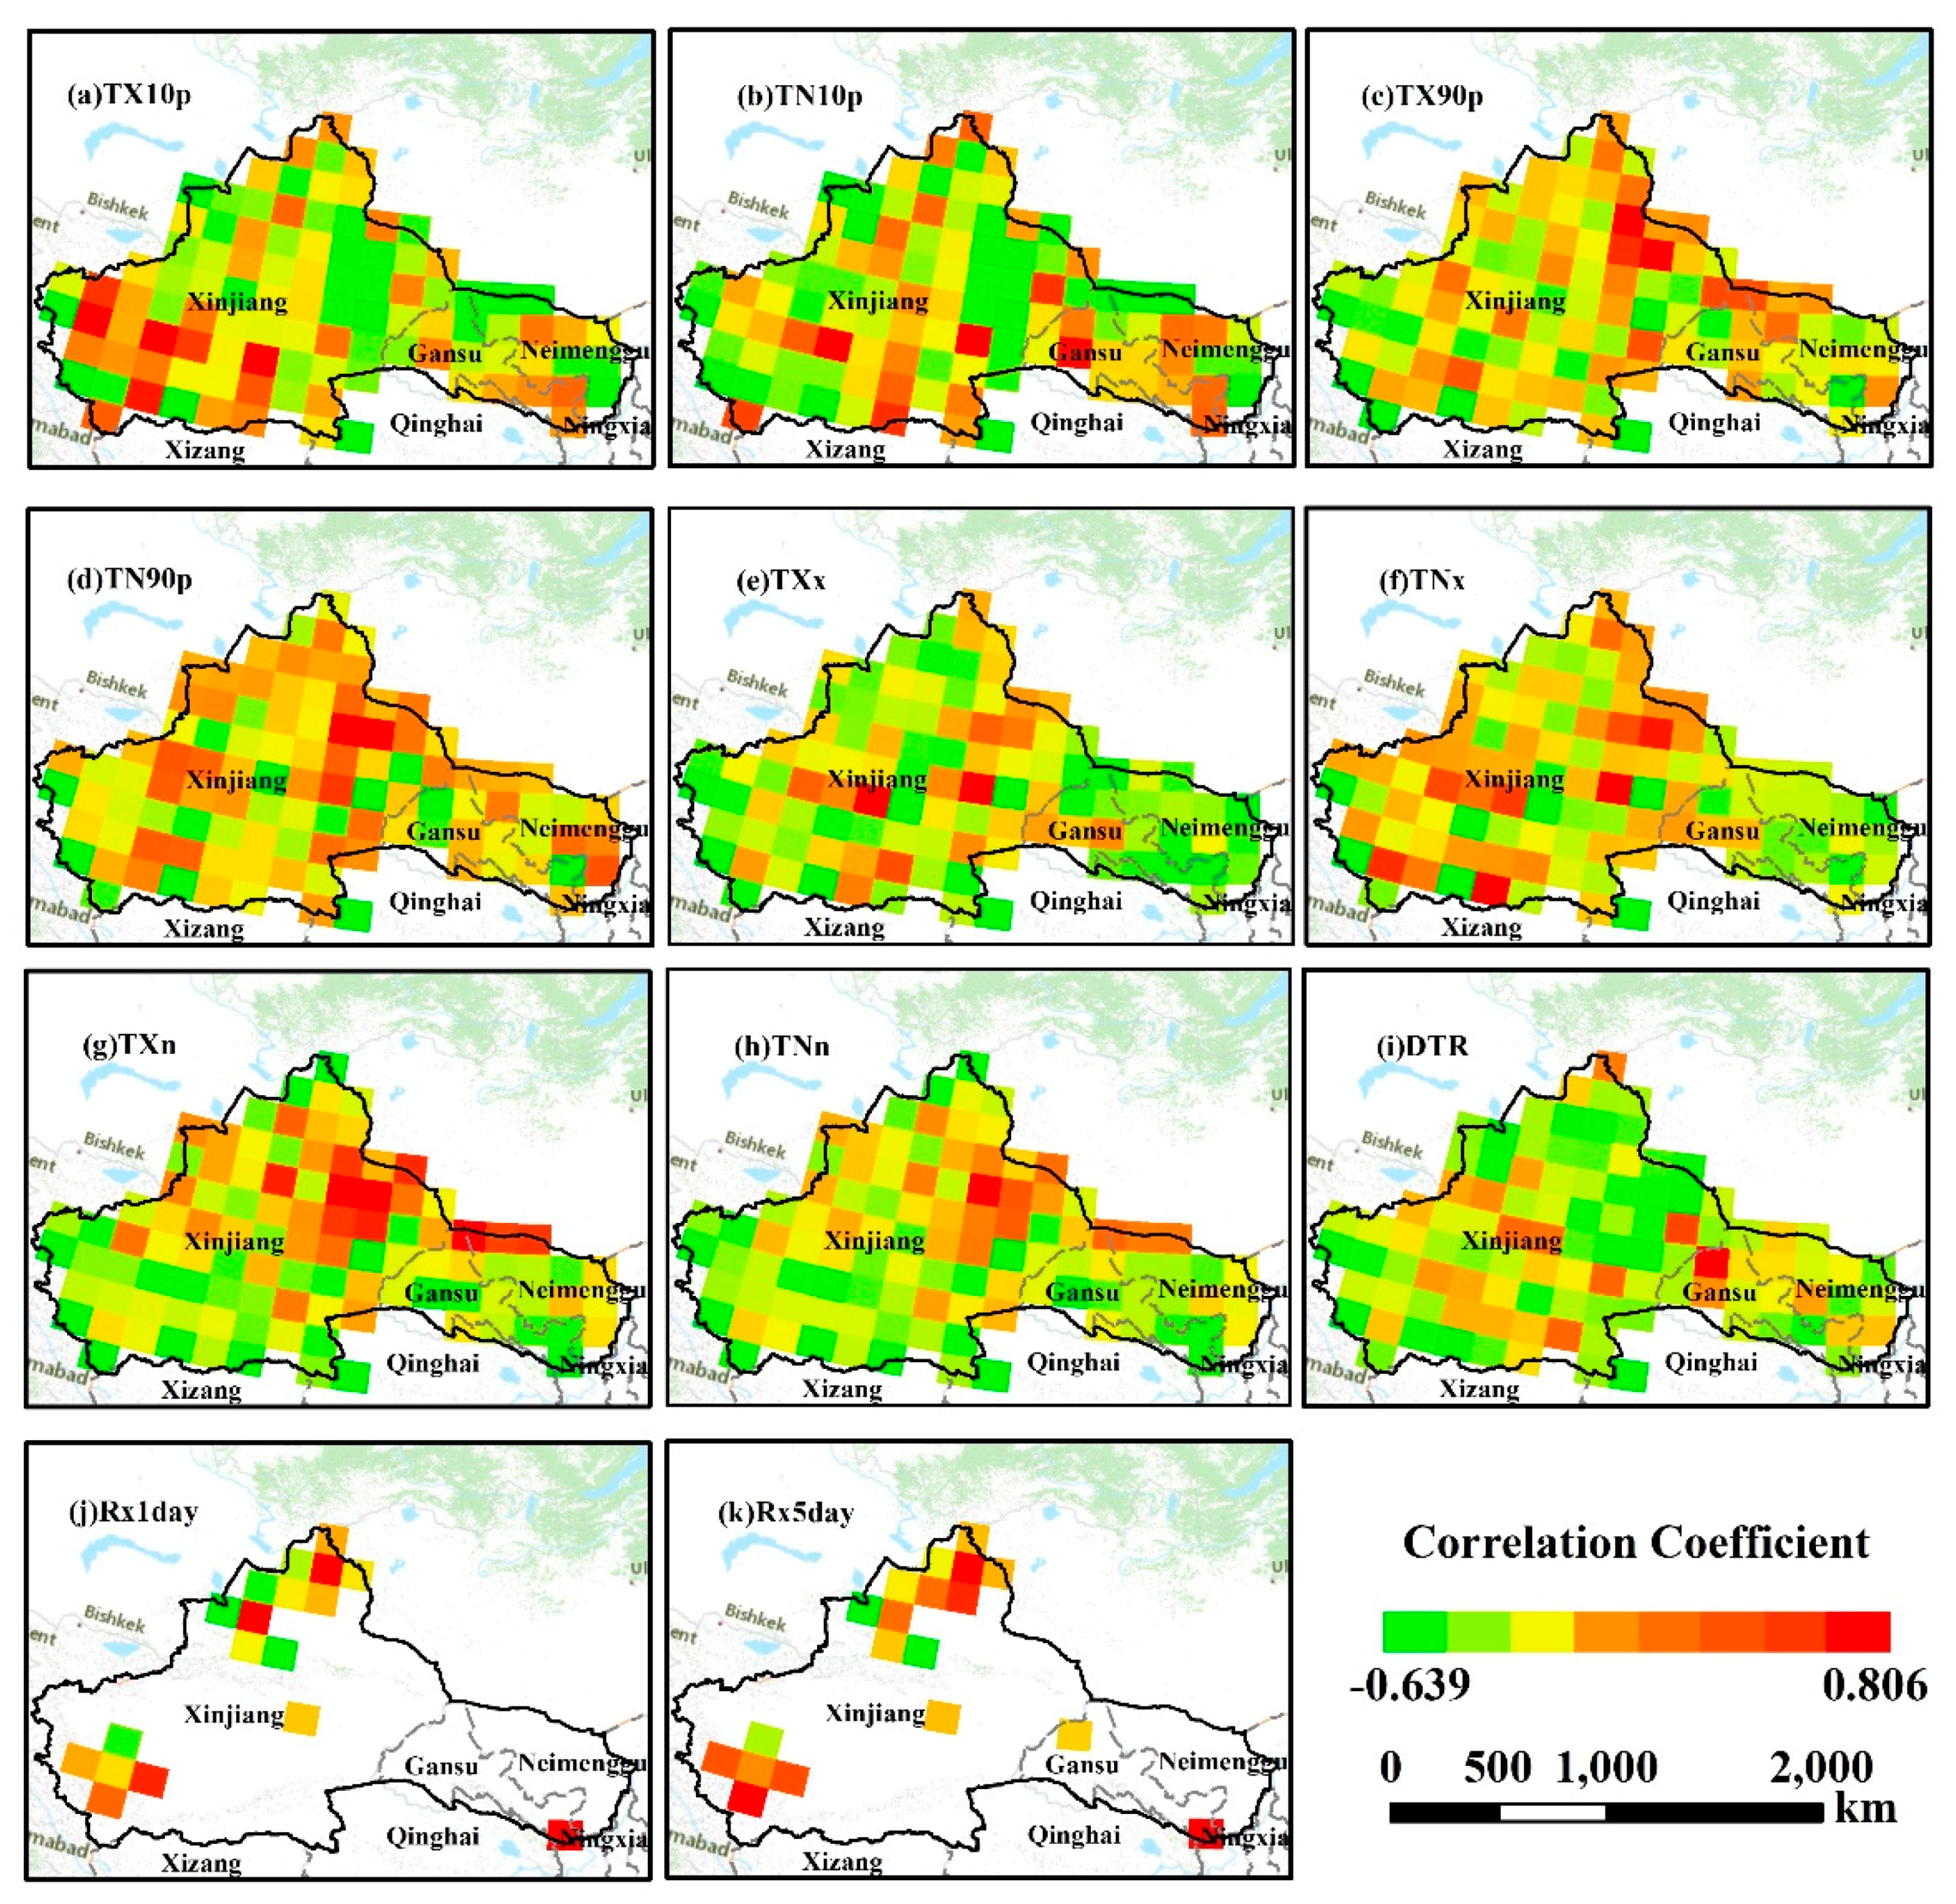
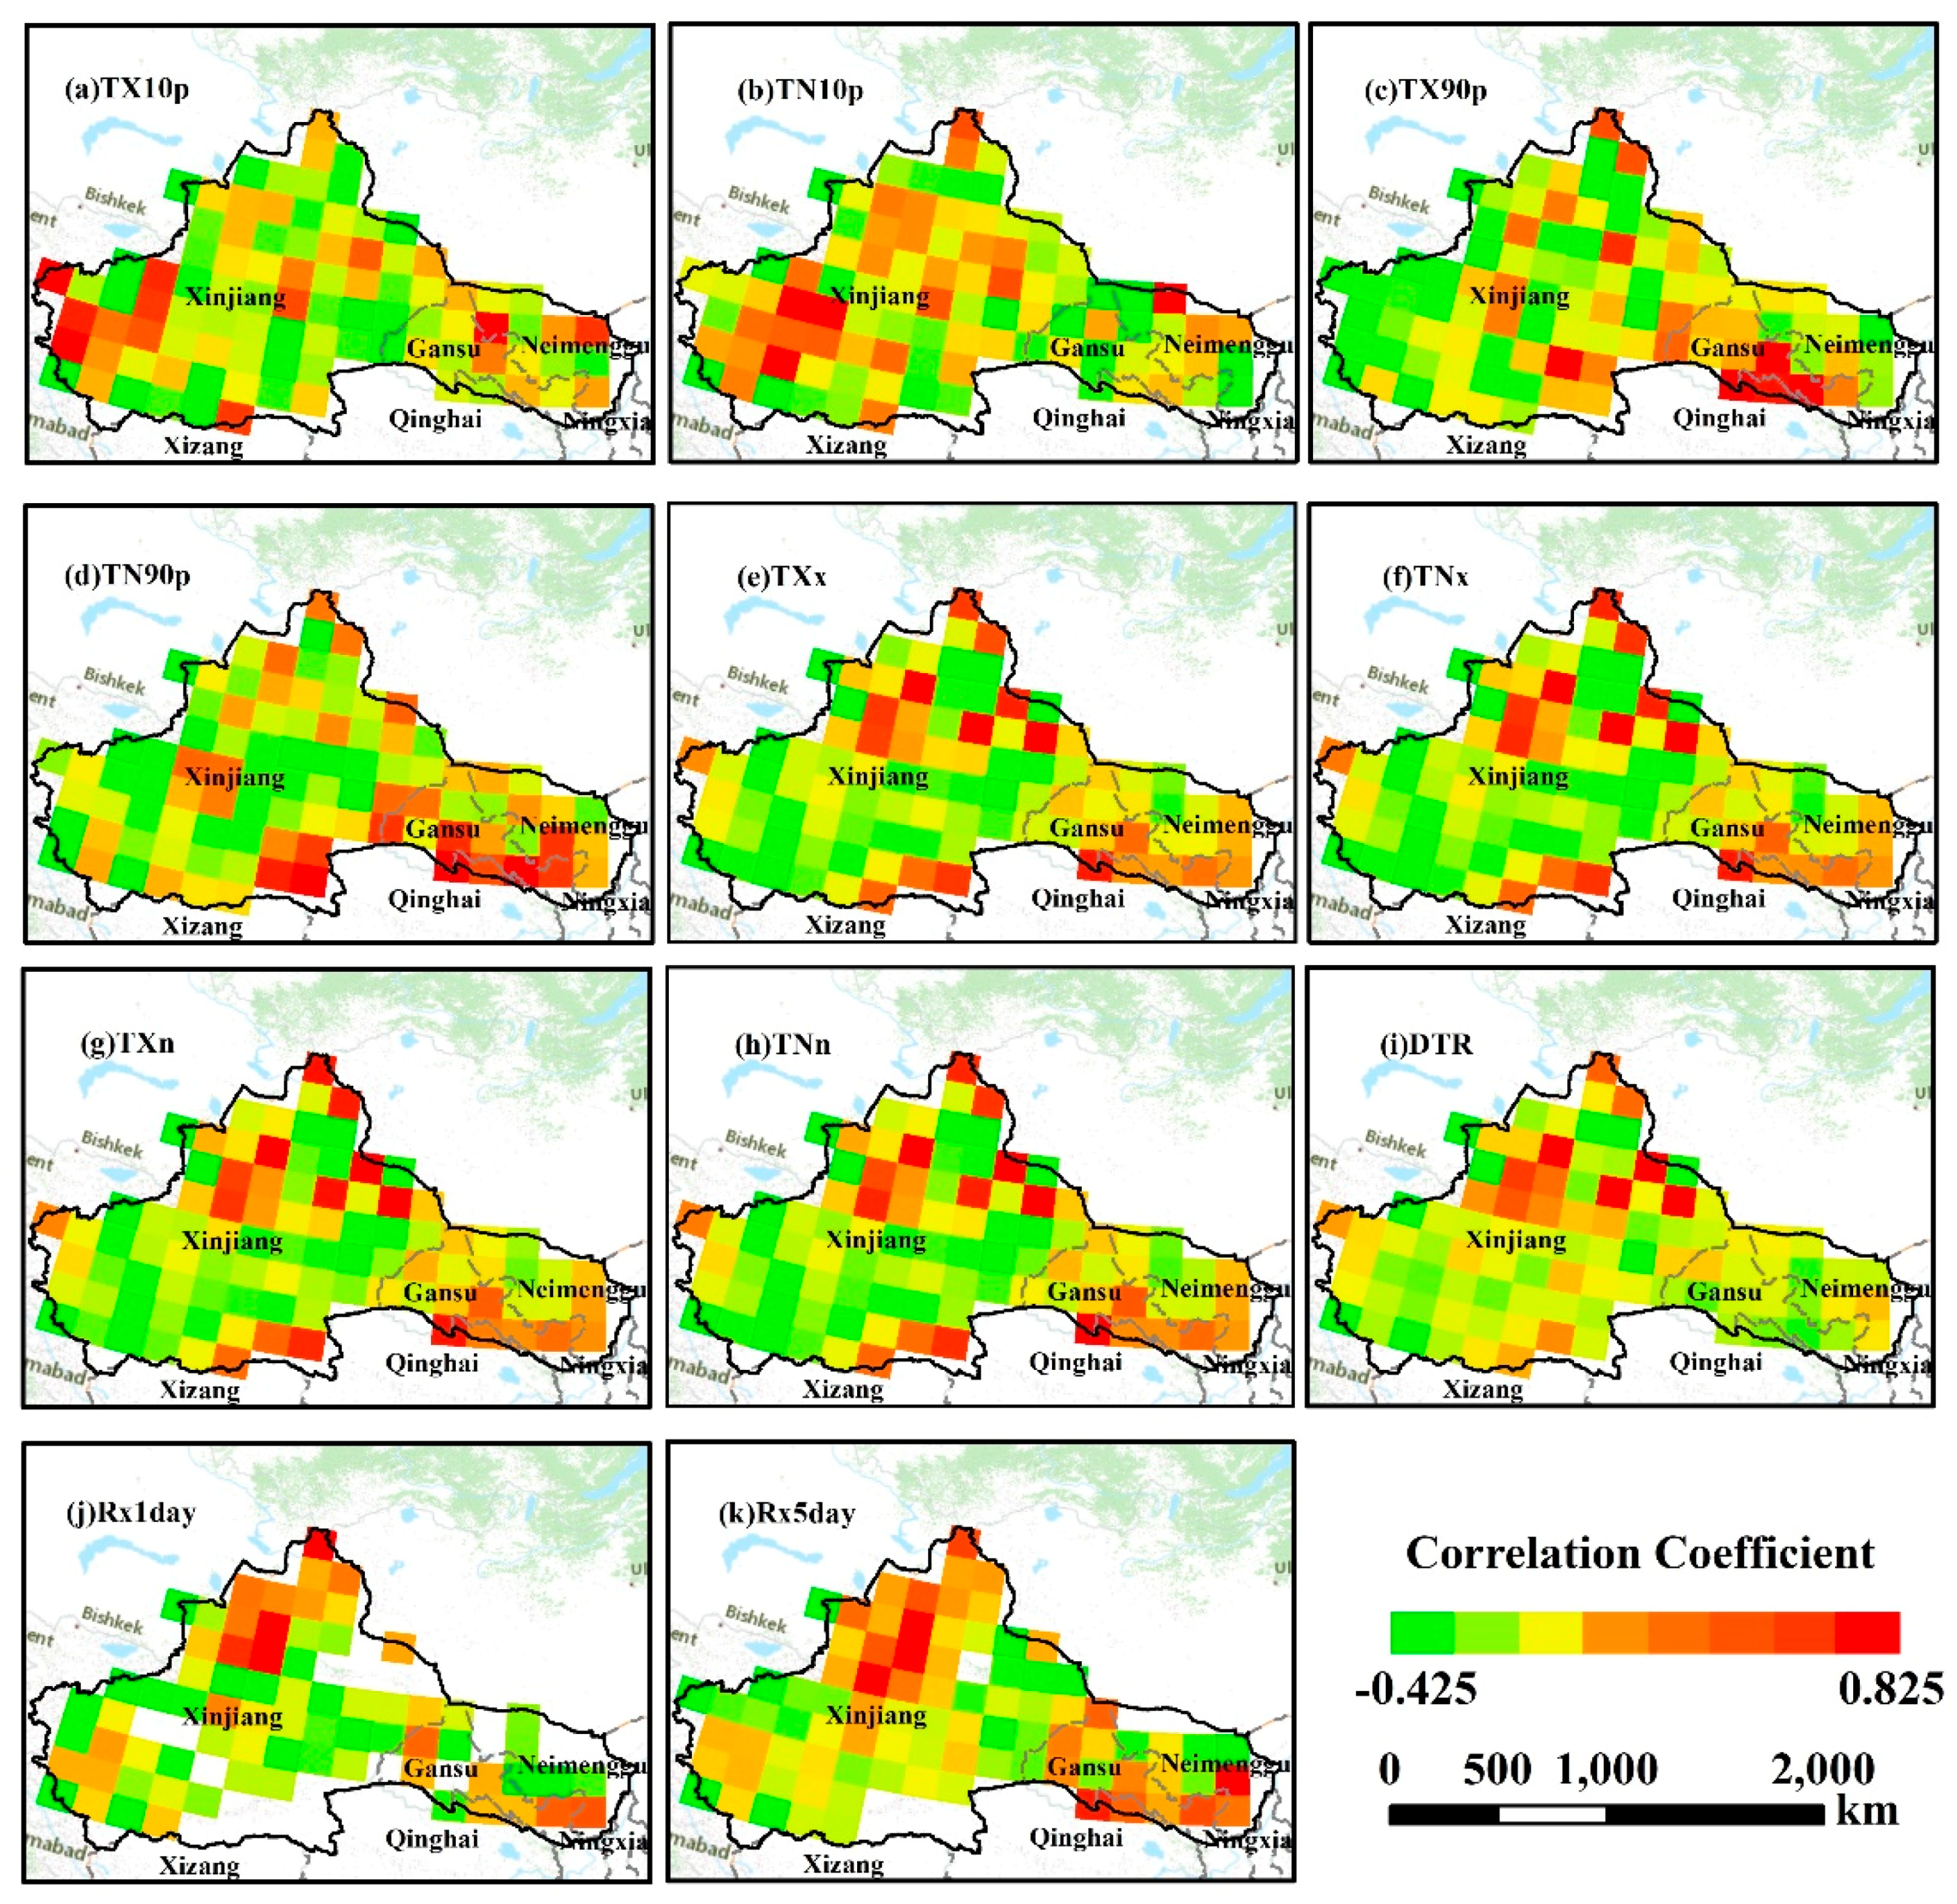
To reveal the annual mean NDVI of the study area and its response to climate extremes, we conducted a Pearson’s correlation analysis between NDVI and CEIs. NDVI data were resampled to the same spatial resolution as CEIs data, which facilitated the correlation analysis at the grid level. The spatial distribution of the correlation coefficient between NDVI and CEIs is shown in Figure 7.
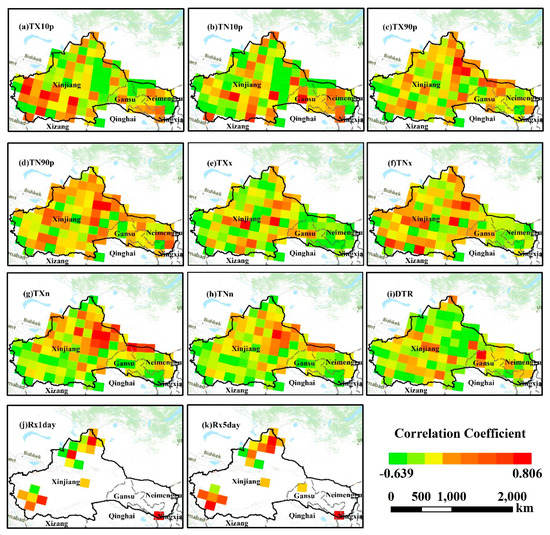
Figure 7.
Correlation coefficient between NDVI and CEIs at grid level in ARNC from 2000 to 2018. (a) TX10p (days), (b) TN10p (days), (c) TX90p (days), (d) TN90p (days), (e) TXx (°C), (f) TNx (°C), (g) TXn (°C), (h) TNn (°C), (i) DTR (°C), (j) Rx1day (mm), and (k) Rx5day (mm).
Figure 7 demonstrates that the positive and negative correlation between CEIs and NDVI co-exist in space, indicating the spatial heterogeneity of the response of vegetation to CEIs. The positive correlation between temperature extremes and NDVI is more common than the negative correlation. 83.50% of the total pixels show a positive correlation with TN90p, which proves that warm nights could reduce freezing damage and affect vegetation growth. In contrast, the indices with higher negative correlation areas are DTR and TN10p, which accounted for 75.26% and 72.16%, respectively. Most of them are mainly distributed in the temperate desert area of Junggar Basin and Tarim Basin. Due to the characteristics of the underlying surface, the temperature extremes vary greatly in different areas, producing a variety of vegetation coverage. The correlation of NDVI and CEIs were calculated annually and for different seasons (Table 2) in ARNC.

Table 2.
Correlation between NDVI and CEIs in annual and different seasons.
There are also significant differences in the correlation between vegetation and precipitation extremes in different regions. The positive correlation of NDVI and precipitation extremes (Rx1day and Rx5day) are concentrated in the Tianshan Mountains, Altai Mountains, Ili Valley, and Junggar Basin. The negative correlation between them are located on the edge of the Taklimakan desert. The area of the positive correlation between Rx1day and Rx1day accounts for 14.29% and 16.33% with NDVI (where the blank area is missing annual data). In general, the hydrothermal combination is suitable for the growth of vegetation in the southwest of ARNC.
On an annual scale, the correlation coefficient between most CEIs and NDVI was lower than 0.3, showing a weak correlation (Table 2). The response of NDVI to precipitation extremes shows a significant positive correlation (0.607 and 0.500), indicating that vegetation is more sensitive to changes in precipitation because precipitation can promote vegetation growth and development. However, it should be noted that the increase in temperature extremes can cause drought and have a negative effect on vegetation growth. Table 2 indicates that the precipitation extremes have a stronger effect on NDVI on an annual scale than temperature extremes.
Considering that vegetation responds differently to climate extremes in different seasons, this study analyzed the correlation between seasonal NDVI and CEIs from 2000 to 2018 (Table 2). Table 2 shows that different seasons have different responses to climate extremes. The relationship between NDVI and precipitation extremes (Rx1day and Rx5day) is not significant in spring. However, there is a significant positive correlation between NDVI and precipitation extremes in summer (p < 0.01 and p < 0.05), indicating a strong dependence on precipitation extremes.
Besides, the result reveals that NDVI has a strong response to precipitation extremes in the growing season and the improvement of vegetation is mainly affected by the increase in precipitation. NDVI exhibits a negative correlation with precipitation extremes in autumn. The temperature extremes have very low correlations with NDVI in spring, summer, and autumn, which is consistent with previous results [70,71]. High-temperature extremes events reduce the risk of vegetation damage to a low-temperature environment, prolong the vegetation phenology, and accelerate the water supplement of snow melting to plants. Therefore, except for low-temperature extreme indices such as TN10p and TX10p, the temperature extreme indices are positively correlated with NDVI. Meanwhile, the response of NDVI to DTR has negative correlations in spring, summer (p < 0.01), and autumn, indicating that the increase of the temperature difference between day and night would damage vegetation growth in ARNC. However, the temperature extremes are slightly higher than the precipitation extremes with NDVI in autumn, which agrees with Xu et al.’s study [72].
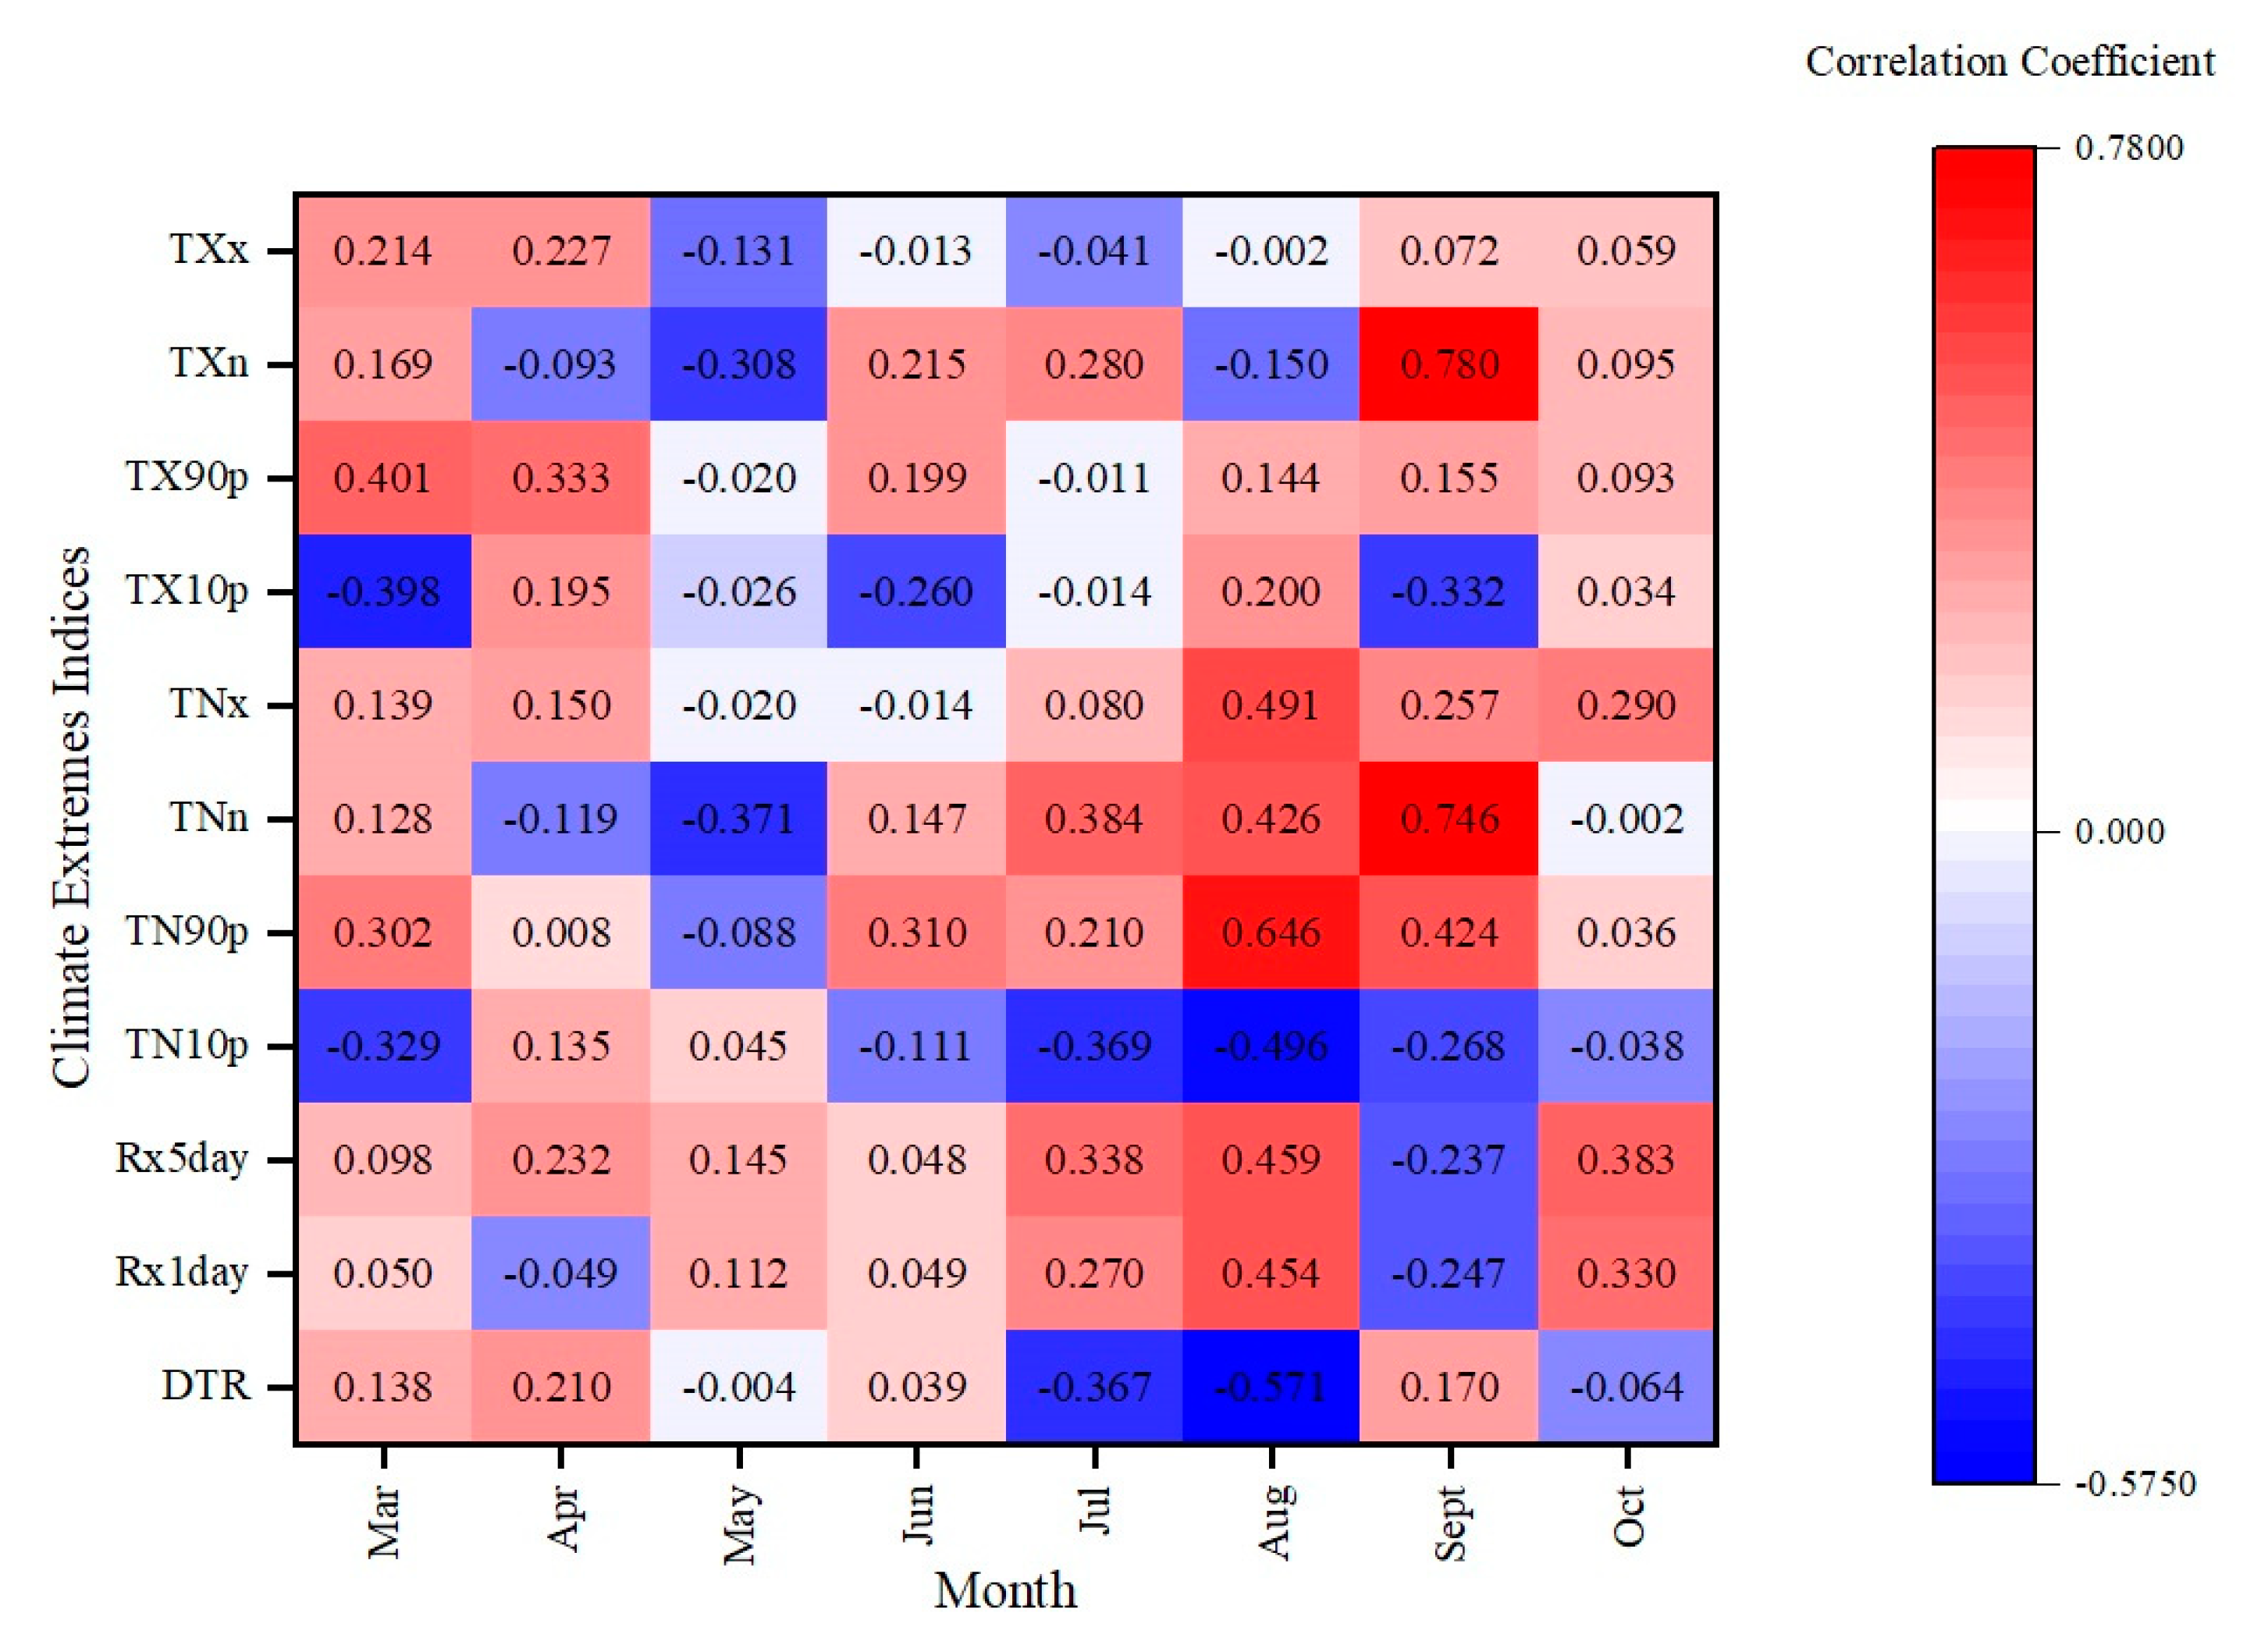
The results of the annual scale cannot fully explain the response characteristics of vegetation to climate extremes. To further explore the response characteristics between NDVI and CEIs, we calculated the Pearson’s correlation coefficient between NDVI and CEIs on a monthly basis in ARNC (Figure 8). Considering that the vegetation coverage in winter is low, and there may usually be snow cover that affects the analysis, cold months were removed from the data. The analysis of the monthly characteristics of vegetation to climate extremes is helpful to understand the relationship between vegetation and climate extremes.
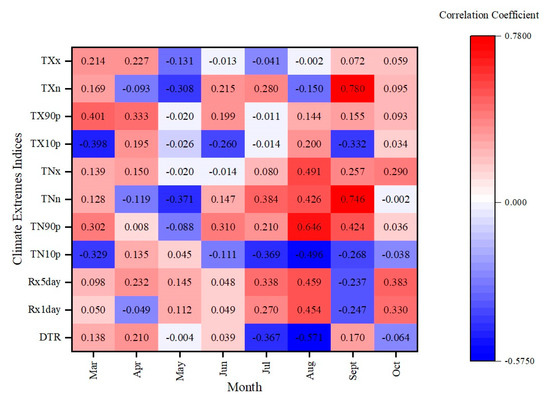
Figure 8.
The correlation coefficient between NDVI and CEIs at monthly time scale in the ARNC during 2000–2018.
Figure 8 shows that the correlation between NDVI and CEIs has a time-dependent difference at the monthly time scale. This result demonstrates that precipitation plays an important role in vegetation growth. NDVI had a positive correlation with Rx1day and Rx5day in August in ARNC, while there was a negative correlation in January, November, and December. This is because an increase in precipitation will cause lower temperatures and have a negative effect on the vegetation growth in ARNC. As for the temperature extremes, TXx and NDVI were all negatively correlated from May to August. The main reason is that the high temperature causes the evaporation of surface water and the decrease of soil moisture, which causes the death of vegetation that depends on groundwater and soil moisture [73]. However, TXx, TXn are positively correlated with NDVI from September to December, indicating that winter temperature rise may promote forest growth [74]. The response of NDVI to TX10p and TN10p represents negative correlations because low temperature extremes have a negative effect on vegetation growth. TN90p and TX90p show positive correlations with NDVI, where the highest coefficient are 0.646 and 0.720 in August and November, respectively. This demonstrates that high temperatures lead to the melting of snow and ice at the monthly time scale and extend the growing season of vegetation. This result also indicates that NDVI is closely related to the warm night indices, which is consistent with Hatfield et al.’s study [75].
4.4.2. Lasso Model
To further explore the CEIs specific impact on NDVI for ARNC in 2000–2018, Lasso was used to compensate for the Pearson correlation analysis. To select CEIs, we chose the optimal regression equation and calculated the predicted NDVI using the model result. The regression equation of predicted NDVI (Y) is as follows:
Y = (6.019981 × 10⁻³) * Rx1day + (1.824994 × 10⁻²) * Rx5day + (7.235223 × 10⁻¹) * TNn + 1.675866 × 10⁻¹⁶
The result shows that DTR, TN10p, TN90p, TNx, TX10p, TX90p, TXn, and TXx are compressed to 0, while Rx1day, Rx5day, and TNn are singled out as factors affecting NDVI in ARNC. Equation (8) shows that the precipitation extremes indices (Rx1day and Rx5day) and temperature extremes index (TNn) are relatively strong, so the influence of the three indices are taken into consideration comprehensively with NDVI. This means the precipitation extremes are much more strongly correlated to the growth of vegetation than temperature extremes in ARNC. Moreover, the regression coefficients of the precipitation extremes are both greater than 0, indicating that the change of precipitation extremes has a significant impact on the vegetation. The main reason is that the climate is dry in ARNC, which affects the respiration of the ecosystem [76]. Precipitation can increase the soil moisture content, which has a great impact on ecosystem respiration, and especially on vegetation growth [77]. Therefore, precipitation extremes are regarded as an important factor in the variation of NDVI in the dry areas [78].
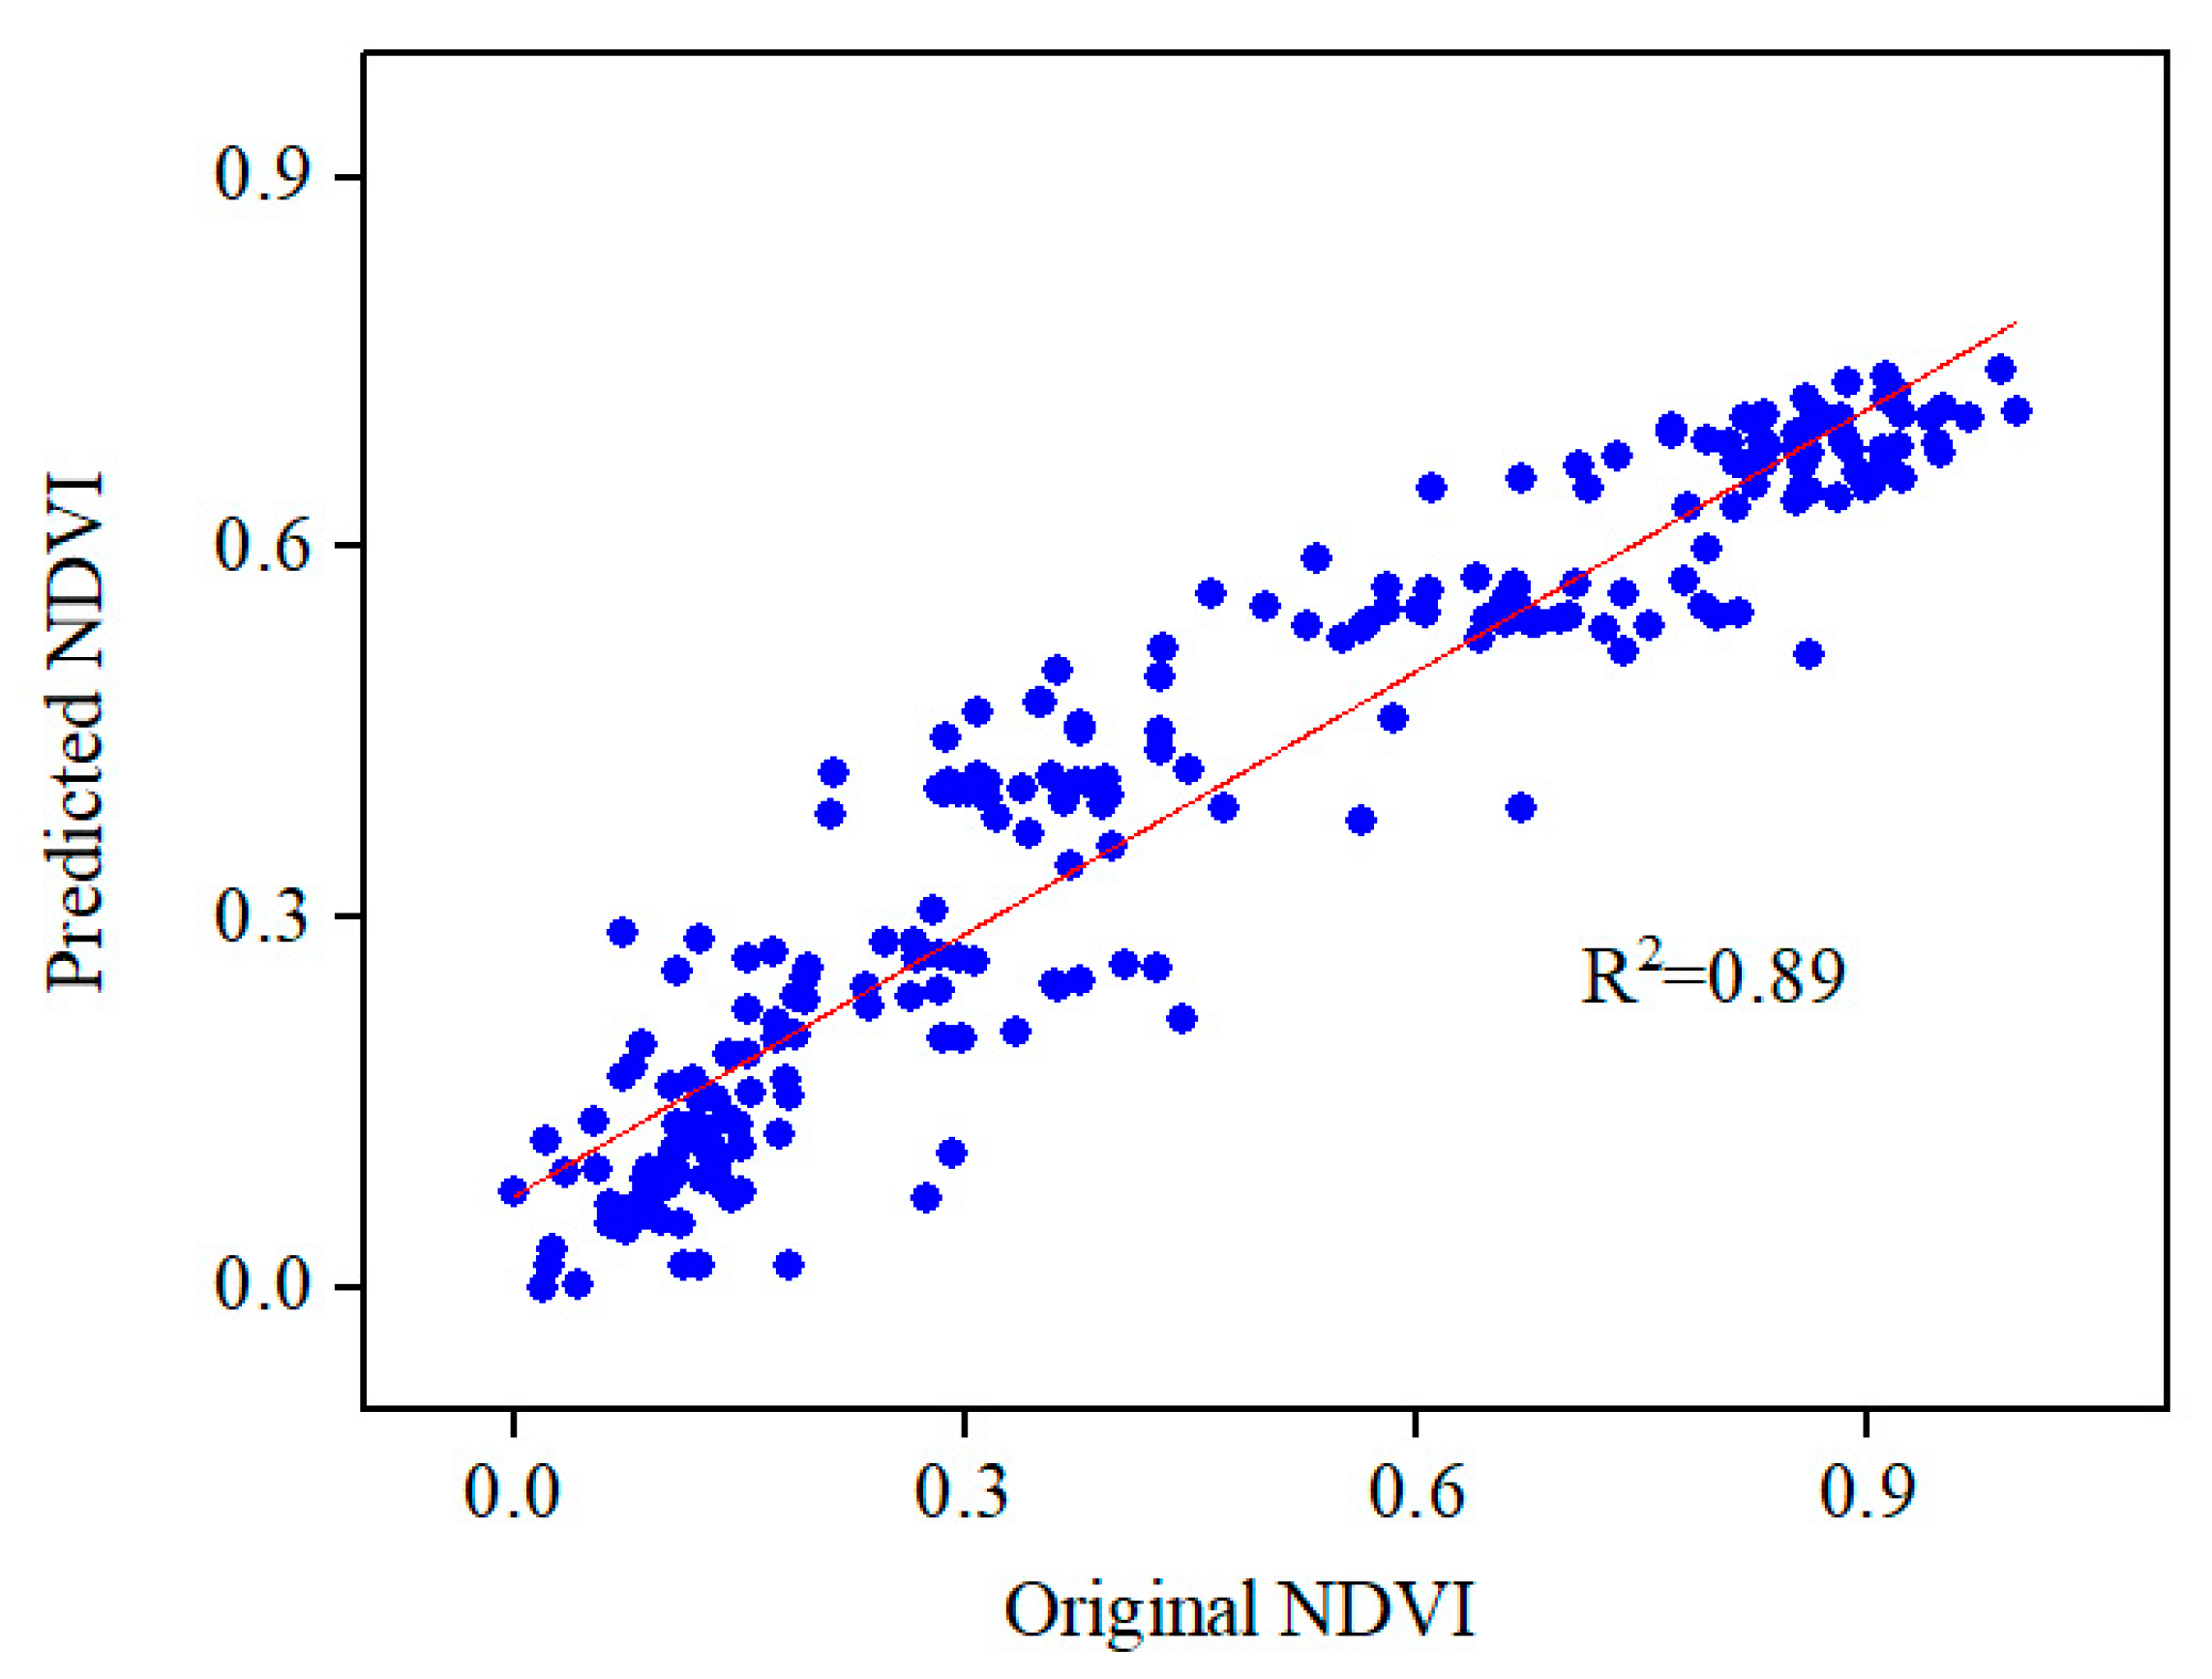
Based on the three CEIs selected from the Lasso model, the predicted NDVI and original NDVI were compared and analyzed from 2000 to 2018 (Figure 9). The results show that predicted NDVI and the original NDVI are highly consistent. The predicted NDVI had a good correlation (R = 0.94, p < 0.01) with the original NDVI, and the regression equation has a high degree of fit (R2 = 0.89), with high credibility. It is shown that ARNC is mainly affected by the change of Rx1day, Rx5day, and TNn, which is consistent with the analysis and also verifies the reliability of model fitting.
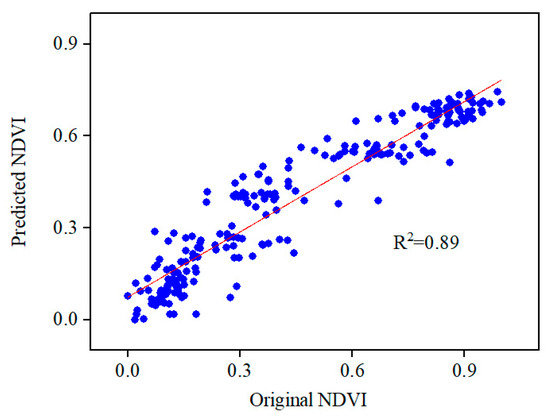
Figure 9.
Original NDVI and predicted NDVI from the lasso model in ARNC from 2000 to 2018.
4.5. Lagged Response of NDVI to CEIs
Considering that the response of NDVI to climate extremes is not necessarily happening immediately, it has been noticed that the vegetation responses have a certain time-lag effect. Previous studies showed that the time lag of vegetation responses to climatic factors varies from 0 to 3 months [79,80]. We analyze the correlation coefficient values between NDVI and CEIs during the vegetation growth season (April to August) with a lag of zero months (0), one month (1), two months (2), and three months (3), consecutively. Figure 10 shows the maximum correlation coefficient, and Figure 11 shows the corresponding time lag.
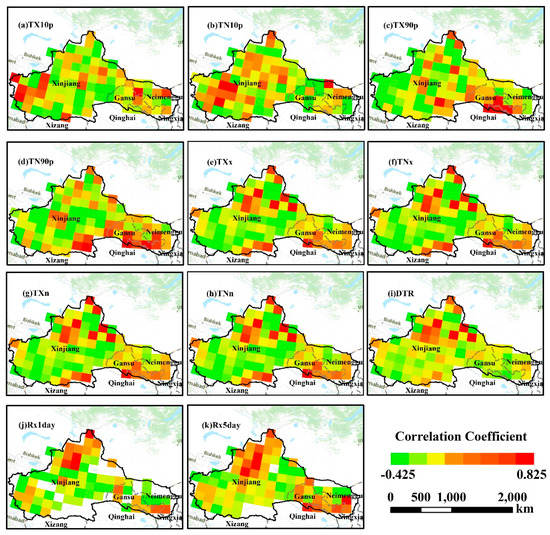
Figure 10.
Maximum correlation coefficient between NDVI and CEIs considering a 0~3 month time lag. (a) TX10p (days), (b) TN10p (days), (c) TX90p (days), (d) TN90p (days), (e) TXx (°C), (f) TNx (°C), (g) TXn (°C), (h) TNn (°C), (i) DTR (°C), (j) Rx1day (mm), and (k) Rx5day (mm).
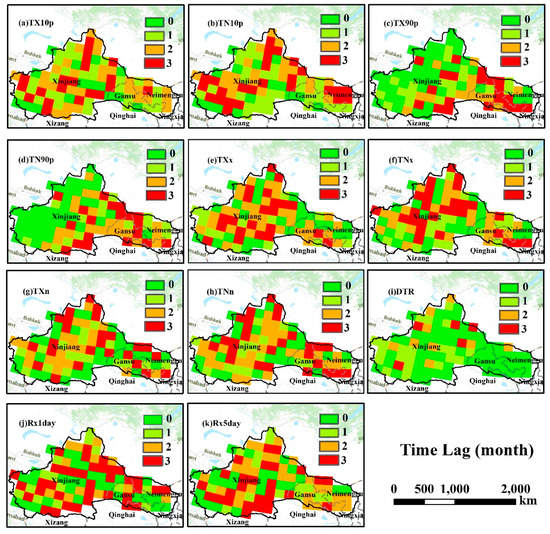
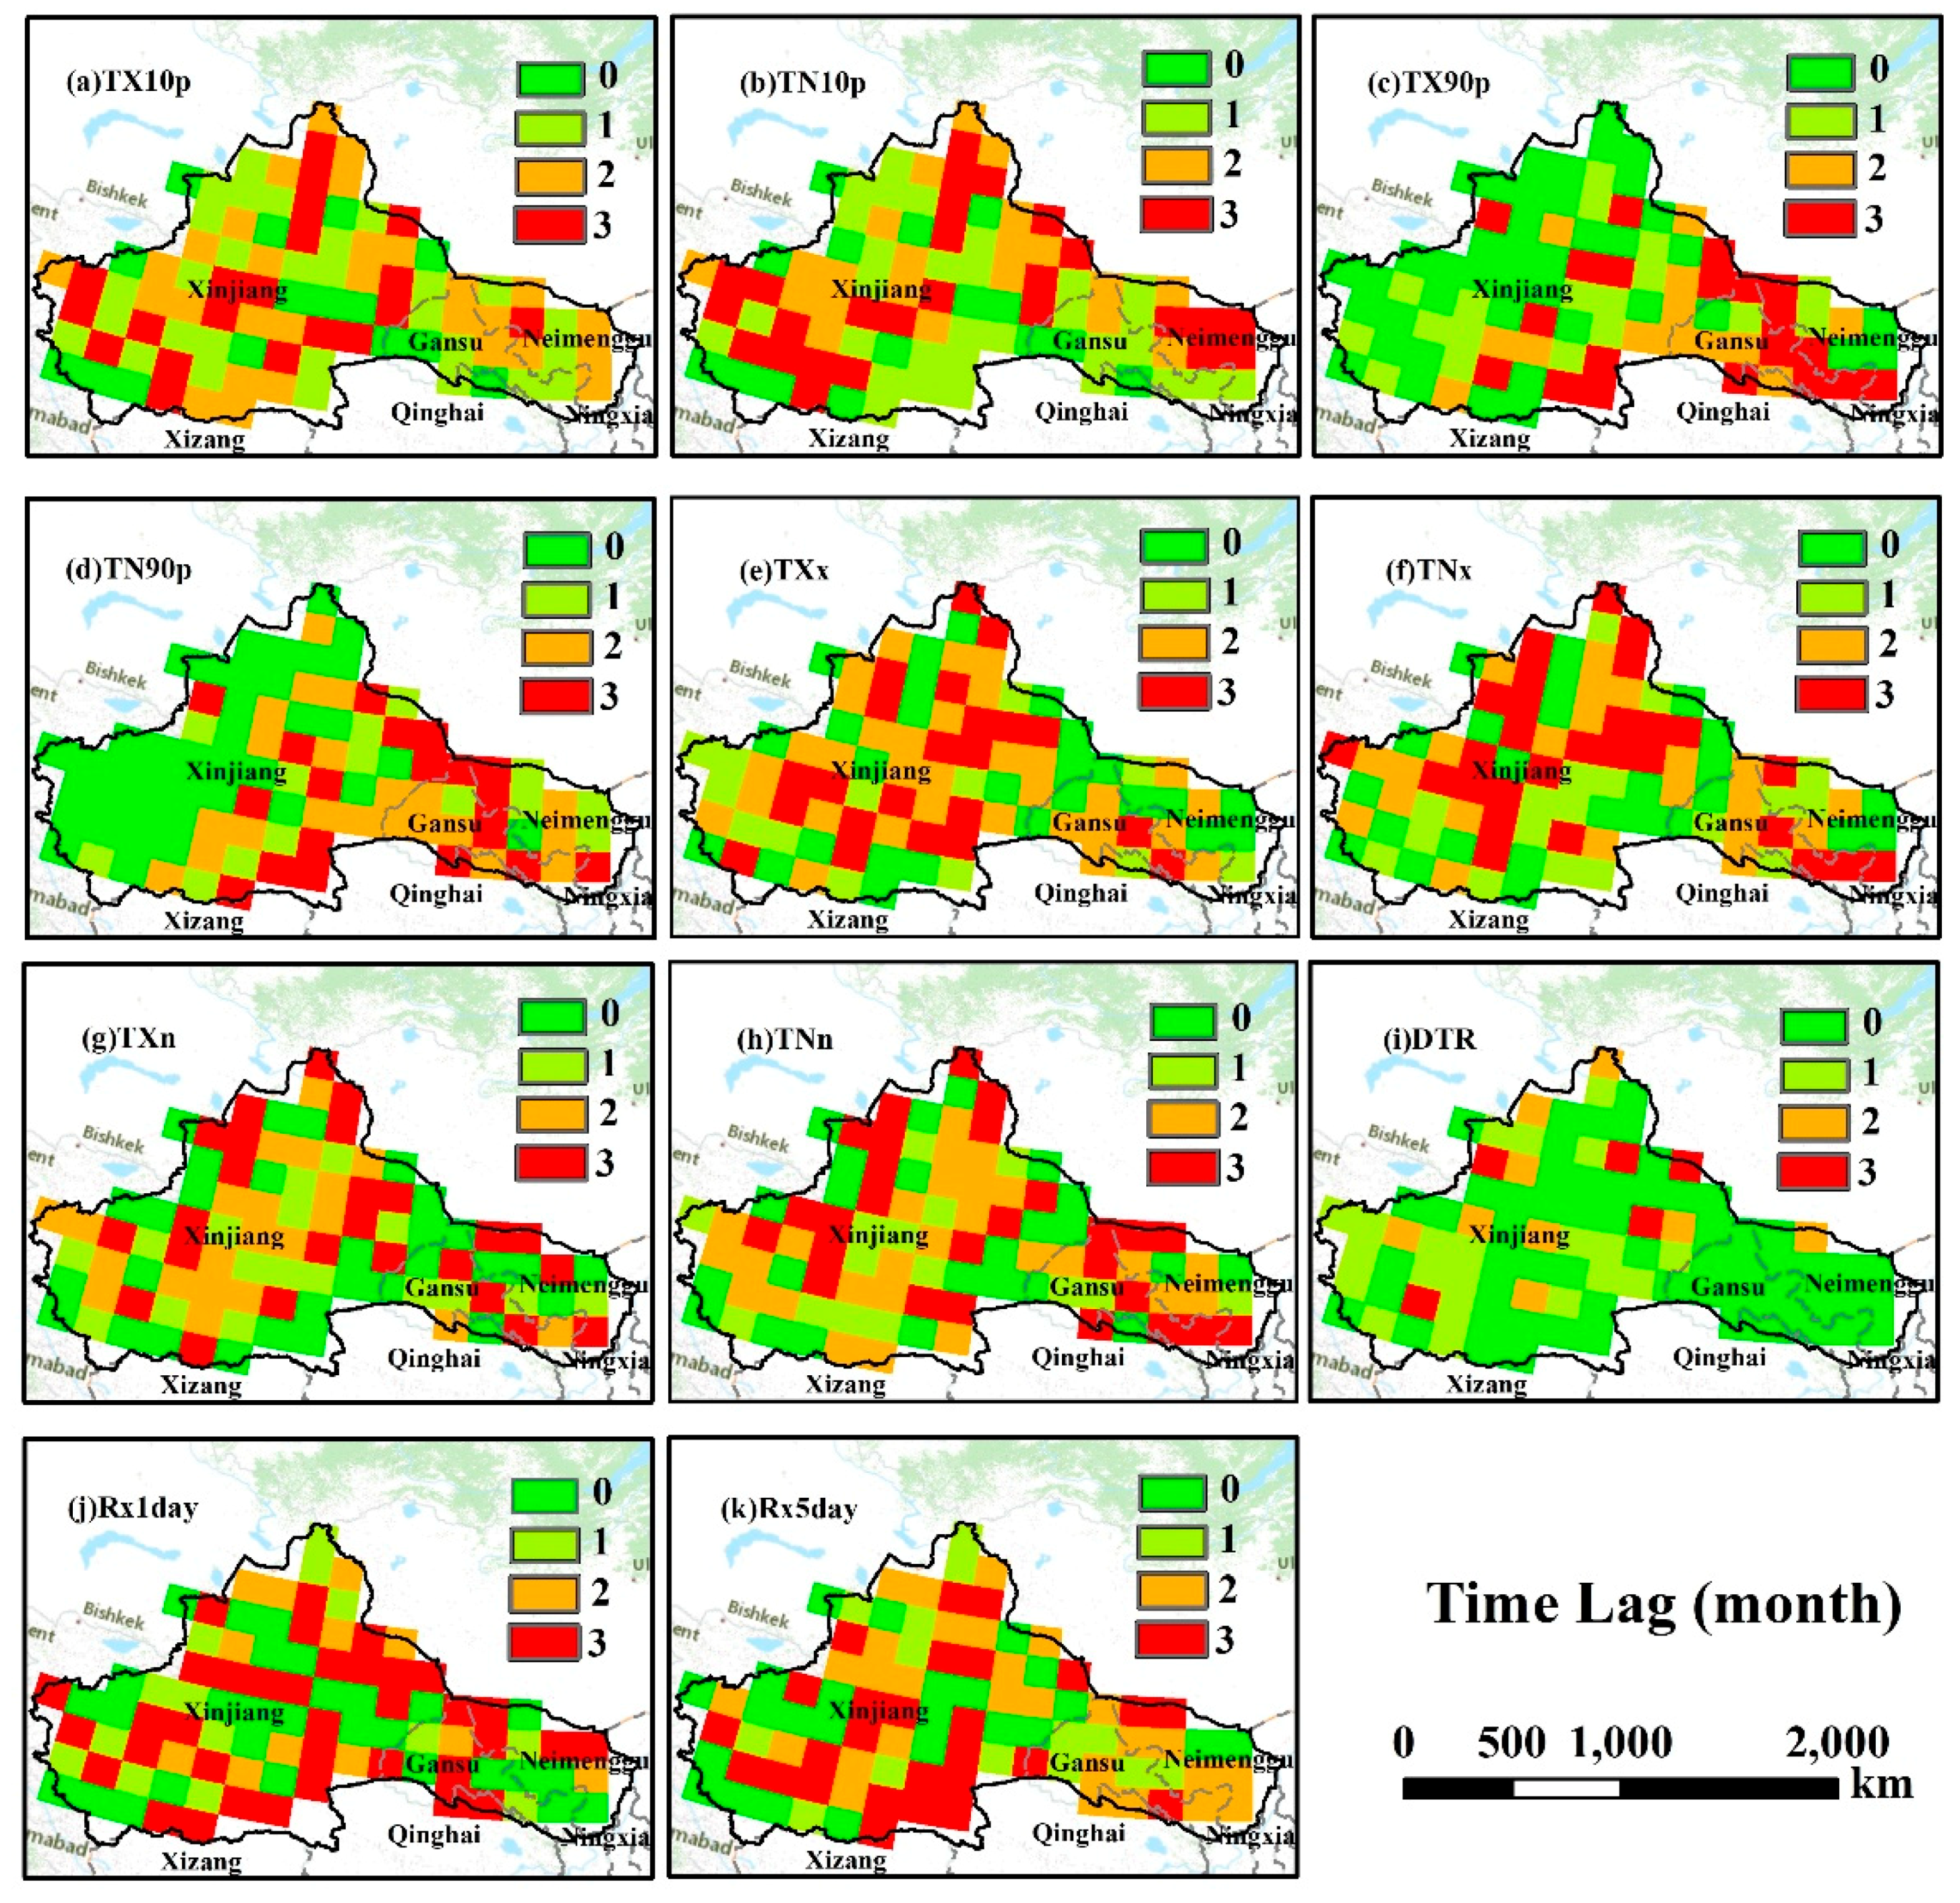
Figure 11.
Time lag between NDVI and CEIs. (a) TX10p (days), (b) TN10p (days), (c) TX90p (days), (d) TN90p (days), (e) TXx (°C), (f) TNx (°C), (g) TXn (°C), (h) TNn (°C), (i) DTR (°C), (j) Rx1day (mm), and (k) Rx5day (mm).
The correlation and time lag between NDVI and CEIs showed regional differences in the growing period (Figure 10 and Figure 11). Figure 10 reveals that the positive correlations of NDVI to CEIs (TXx, TNx, TXn, and TNn) are 20.43% (p < 0.01), 20.43% (p < 0.01), 20.43% (p < 0.01), and 21.50% (p < 0.01), and that they are distributed in Junggar Basin and northern Xinjiang. On the contrary, the negative correlations are 7.52%, 8.6%, 8.6%, and 8.6%, and are distributed in the Taklimakan Desert, northern Xinjiang and northern Alexa, etc. This inhibits the growth of vegetation. The low-temperature extremes (TNn and TXn) are distributed in the vicinity of the Tianshan Mountains. Extreme cold causes freezing damage to vegetation, and even death in some cases. However, due to global warming, low-temperature extremes will gradually rise, and the changes will affect the growth of vegetation. The response of NDVI to DTR has a significant positive correlation (6.45%, p < 0.01). Precipitation extremes have a strong effect on NDVI, and the maximum coefficients of NDVI to Rx1day and Rx5day are 0.50 (p < 0.5) and 0.61 (p < 0.01) because of the demand for precipitation is high on vegetation growth in ARNC. The areas with positive correlation are 2.15% (p < 0.05) and 2.15% (p < 0.01), respectively, and are distributed among Junggar Basin, Altai Mountains, Kunlun Mountains, and the Qilian Mountains. The response of NDVI to CEIs demonstrates complex distribution characteristics, as it is affected by various factors including topography, landform, altitude, and latitude.
Figure 11 shows the time lag of NDVI to CEIs from 2000 to 2018. For temperature extremes, the lag of the NDVI response is at most three months, and temperature extremes mainly occur in the “0, 1, 2, 3” (TXx, TNx, TXn, TNn, TN90p, and TX90p). The DTR is concentrated in the lag of 3 months and distributed in most areas of the arid region of Northwest China, including Gansu Inner Mongolia region, Junggar Basin, Altai Mountain, Qilian Mountain, and other places. However, the response of NDVI to precipitation extremes has a lag of two months (Rx1day and Rx5day), while the lag is about a month in dry areas. The result is consistent with the results of a previous study showing that the phenological dynamics of vegetation are mainly affected by the accumulated precipitation in the earlier period in semi-arid and arid areas [81].
4.6. Responses of Different Vegetation Types
From the perspective of vegetation types, the interannual correlation coefficients of different vegetation types are different to some extent between NDVI and CEIs (Table 3). The correlation between precipitation extremes indices (Rx1day, Rx5day) and NDVI in all vegetation types are positive, indicating that precipitation has an overall positive impact on the vegetation growth in ARNC. In particular, Deserta has a strong response to precipitation extremes. In the Needleleaf Forests area, the high-temperature extreme indices (TN90p andTX90p) are positively correlated with NDVI (p < 0.05), indicating that high-temperature extremes can promote the growth and development of vegetation. NDVI of all vegetation types is negatively correlated with low-temperature extreme indices (TN10p and TX10p), suggesting low temperature has an inhibitory effect on vegetation growth. In addition, DTR is negatively correlated with NDVI for all vegetation types, indicating that a larger daily temperature range will inhibit the growth of vegetation.

Table 3.
Correlation coefficients between CEIs and NDVI for different vegetation types in ARNC.
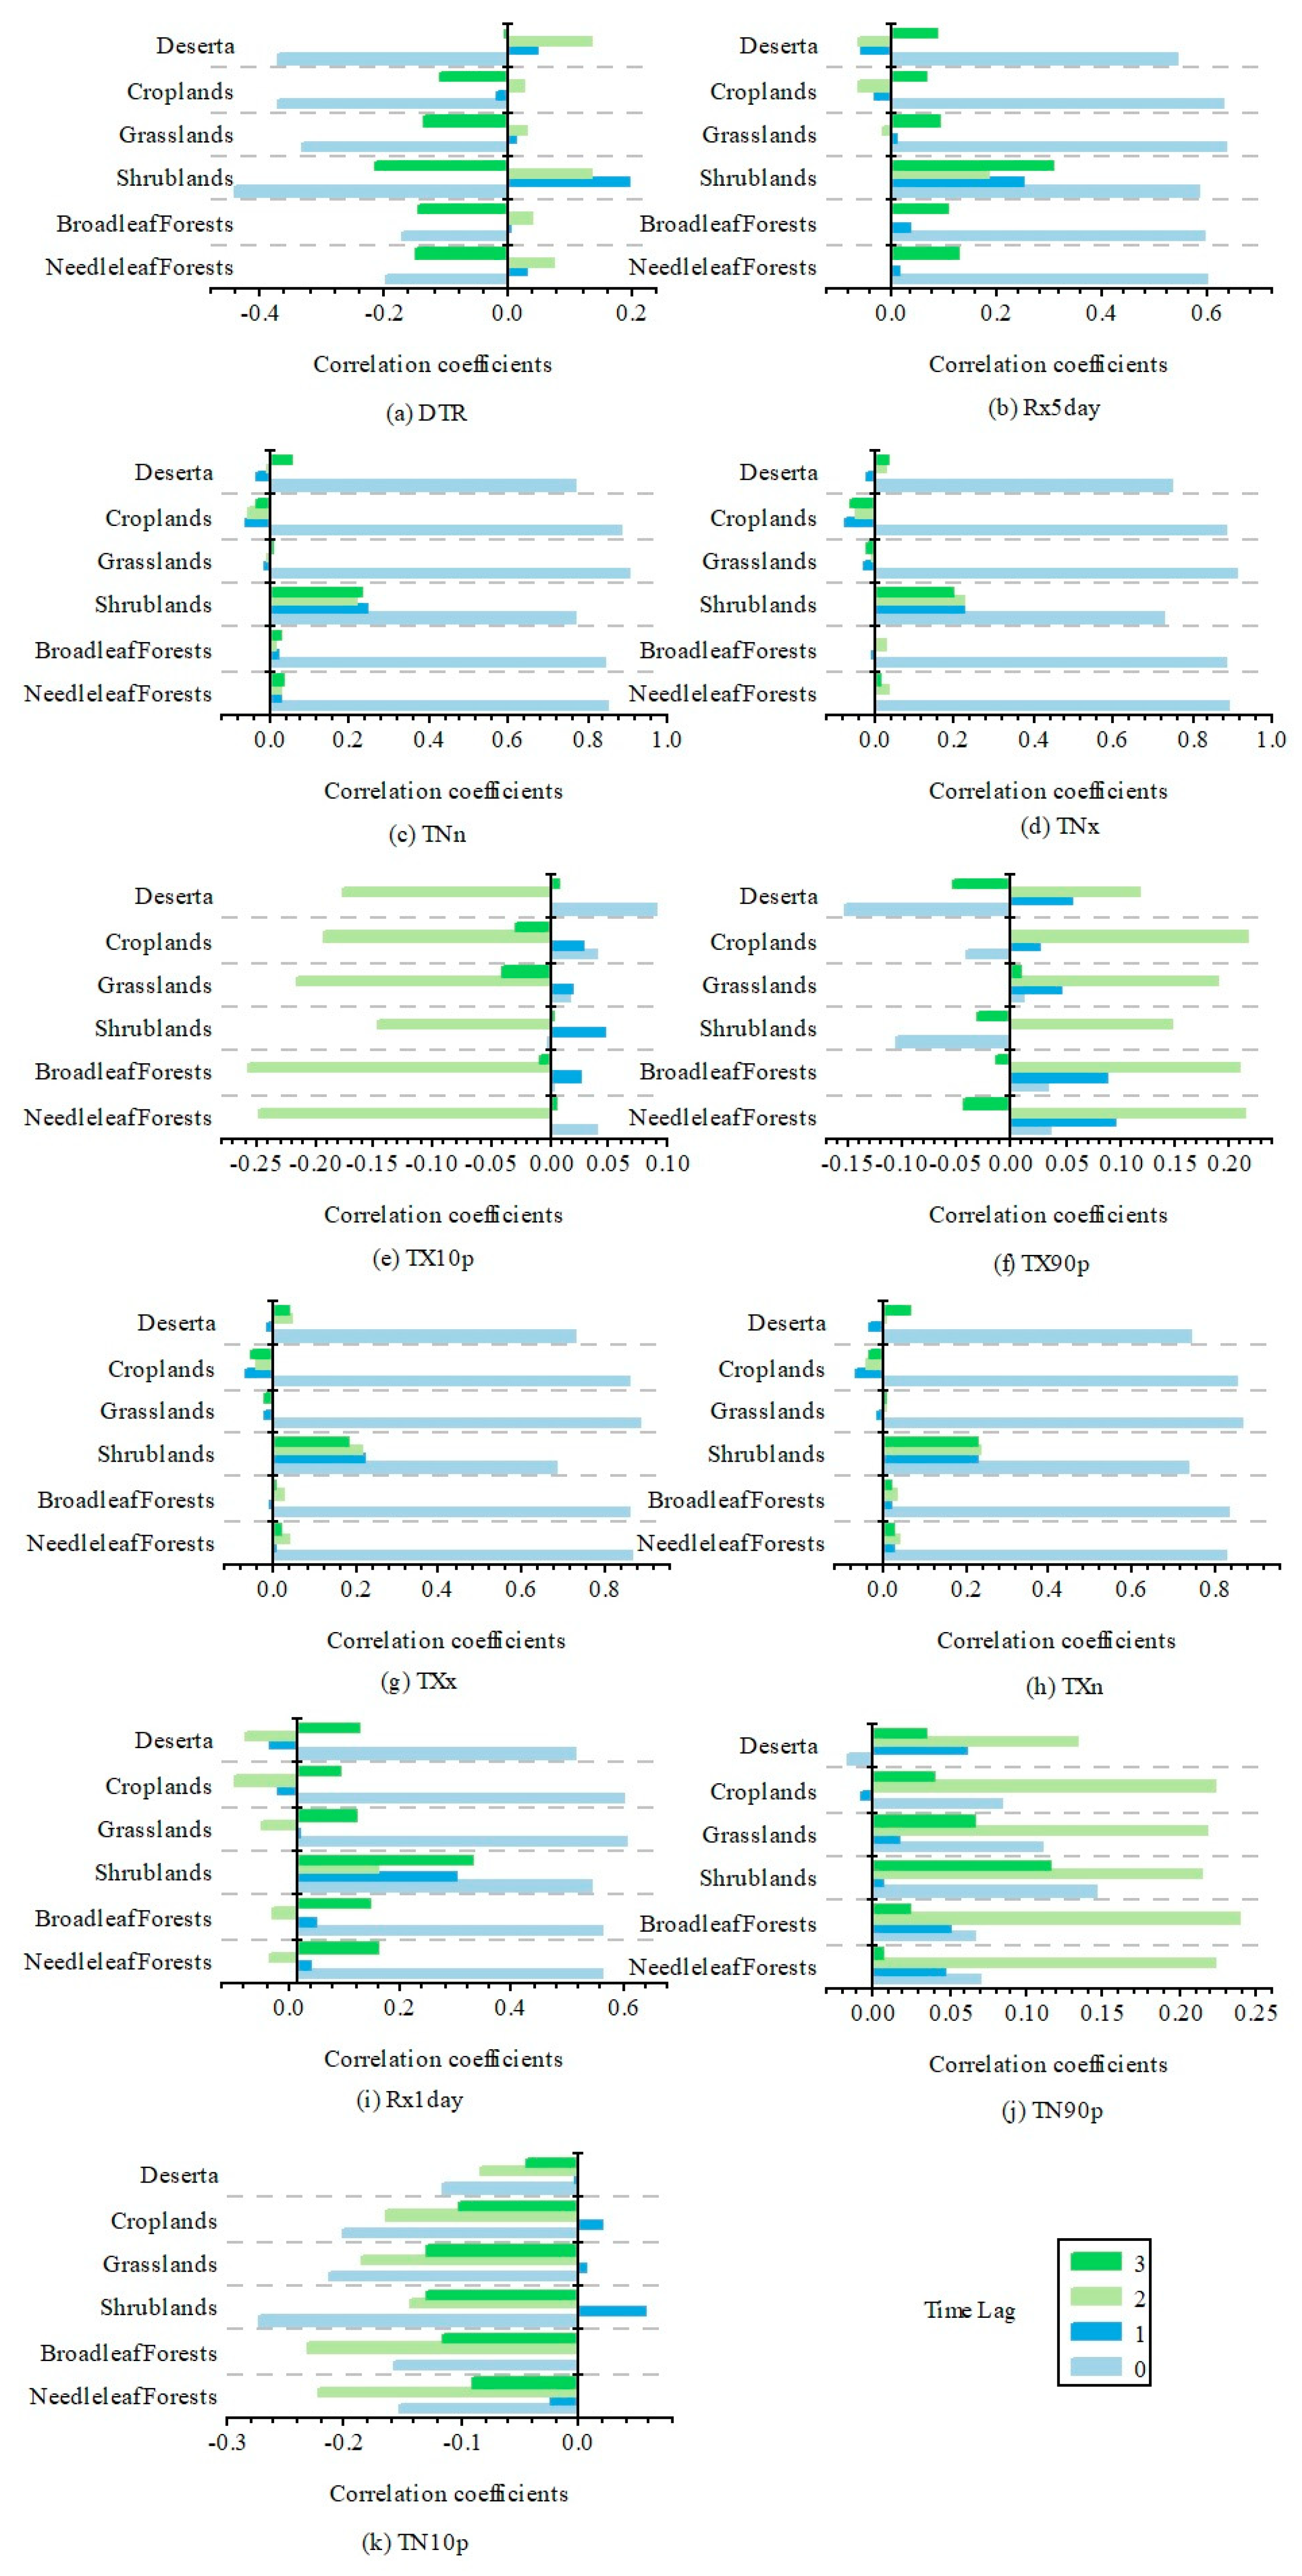
Figure 12 shows the response of NDVI has a certain hysteresis effect to precipitation and temperature extremes for different vegetation types. For most of the vegetation types, the time lag is 0 months, but for Shrublands and Broadleaf Forests, it is 3 months. Because precipitation is the restrictive factor of vegetation growth in the arid region. For all the vegetation types, temperature extremes indices, such as TN90p, TX10p, TX90p, are correlated with NDVI with a time lag of at least 2 months.
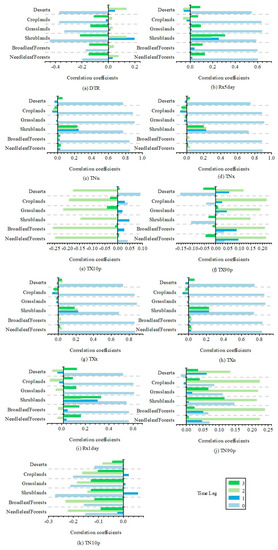
Figure 12.
Correlation coefficient between NDVI and the preceding 0~3 month for different vegetation types. (a) DTR (°C), (b) Rx5day (mm), (c) TNn (°C), (d) TNx (°C), (e) TX10p (days), (f) TX90p (days), (g) TXx (°C), (h) TXn (°C), (i) Rx1day (mm), (j) TN90p (days), and (k) TN10p (days).
5. Discussion
Based on our analysis, the vegetation shows a slightly increasing trend from 2000 to 2018 in ARNC, with NDVI increased in grasslands and broadleaf forests in particular. This is consistent with the greening trend in Northwest China as revealed by existing studies [82,83], which indicates that the ecological environment has been continuously improved. The ecological environment is relatively fragile in ARNC, which is why vegetation degradation was identified in some areas. Vegetation degradation may be caused by the variation of climate extremes, which may lead to vegetation degradation in the desert area [84]. In the meantime, except for the climate reason, the increase of vegetation may also credit some major projects such as the Grain for Green Project and the Natural Forest Protection Project [85], which improves the regional ecological environment and increases the vegetation cover.
Climate extremes events have received more and more attention in recent years, because of their serious impact on society, economy, ecological system [3,86,87,88]. As a sensitive area of global warming [89], that the ARNC was found to become warming and wetting, with precipitation extremes indices and high-temperature extreme indices increasing. Precipitation extremes were found to be closely related to total precipitation [90,91]. This means that the vegetation changes may also be attributed to the overall precipitation, not only the precipitation extremes. Global warming will increase the degree of aridity in arid regions, because high-temperature extremes will cause soil moisture evaporation strongly, limiting the physiological activities of vegetation [92]. Besides, low-temperature extremes will cause ice cover and vegetation death. In addition, TX90p was found to be closely related to NDVI, because daytime warming can directly affect vegetation activities [93]. Some studies suggest that this is due to the different effects of daytime temperature warming on vegetation, which is regulated by insect herbivores [94,95]. We further verified that the response of vegetation growth to climate extremes change has a certain time lag, which means the impact of climate extremes on vegetation growth is generally manifested in the next month. Furthermore, our results show that the climate extremes have different effects on different vegetation types.
6. Conclusions
Changes in climate extremes have an important effect on ecosystems, vegetation in particular. With varied geographical settings and a complex climate in ARNC. The interaction between vegetation and climate extremes is a very complicated process. Therefore, research on the response of vegetation to climate extremes is necessary. This study analyzed the spatial and temporal vegetation variations in ARNC and their response to CEIs using MODIS vegetation index data and HadEX3 data from 2000 to 2018. Vegetation exhibited a trend of a gradual increase, indicating that the ecological environment has been gradually improving. Spatio-temporal analysis on the climate extremes suggests that the climate in ARNC is becoming warmer and wetter in recent years. Correlations between NDVI and CEIs vary across different temporal scales. Precipitation extremes seem to be more decisive to vegetation growth than temperature extremes at monthly or seasonal scales. The lag time of NDVI response to temperature extremes is at least three months, while that to precipitation extremes has a lag of two months. It is also noted that different vegetation types have different responses to climate extremes.
This study chooses 11 CEIs to reveal the response of NDVI to climate extremes, to supplement existing related studies in ARNC. Its results may be limited by the coarse resolution of the climate extremes dataset. Nevertheless, this study provided useful references for understanding regional vegetation changes and their response to climate extremes events. However, it is noted that using NDVI as the surrogate of vegetation can be sometimes problematic in arid zones, especially when the canopies are sparse. Adopting some soil-adjusted vegetation indices or green vegetation fraction cover derived from spectral unmixing might achieve more accurate results. Moreover, vegetation change could also be affected by human activities, which will affect the results of this study. Therefore, this response mechanism should be studied more systematically in future research.
Author Contributions
S.W.: methodology, software, validation, visualization, and writing—original draft. C.H.: conceptualization, methodology, writing—reviewing and editing, supervision, resources and funding acquisition. Q.L.: data curation and software. All authors have read and agreed to the published version of the manuscript.
Funding
This research was funded by the National Key R&D Program of China, grant number 2017YFC0404302, 2017YFC1502501.
Institutional Review Board Statement
Not applicable.
Informed Consent Statement
Not applicable.
Data Availability Statement
The NDVI dataset is produced and maintained by the NASA (https://modis.gsfc.nasa.gov/, accessed on 10 November 2020) in this study. The climate extremes data is available from the Met Office Hadley Center (www.metoffice.gov.uk/hadobs/hadex3, accessed on 10 November 2020).
Acknowledgments
The authors would like to thank NASA for providing MODIS NDVI data for this study. The climate extremes dataset was obtained from Met Office Hadley Center (www.metoffice.gov.uk/hadobs/hadex3, accessed on 10 November 2020).
Conflicts of Interest
The authors declare no conflict of interest.
References
- Field, C.B.; Barros, V.; Stocker, T.F.; Dahe, Q. Managing the Risks of Extreme Events and Disasters to Advance Climate Change Adaptation: Special Report of the Intergovernmental Panel on Climate Change; Cambridge University Press: Cambridge, UK, 2012; pp. 569–572. [Google Scholar]
- Gray, V. Climate Change 2007: The Physical Science Basis. Summary for Policy Makers. S. Afr. Geogr. J. Being A Rec. Proc. S. Afr. Geogr. Soc. 2007, 92, 86–87. [Google Scholar]
- Easterling, D.R.; Evans, J.L.; Groisman, P.Y.; Karl, T.R.; Ambenje, P. Observed Variability and Trends in Extreme Climate Events: A Brief Review. Bull. Am. Meteorol. Soc. 2000, 81, 417–426. [Google Scholar] [CrossRef]
- Houghton, J.E.T.; Ding, Y.H.; Griggs, J.; Noguer, M.; Johnson, C.A. Climate Change 2001. Sci. Basis 2001, 59, 24. [Google Scholar]
- Lloyd, E.A.; Shepherd, T.G. Environmental catastrophes, climate change, and attribution. Ann. N. Y. Acad. Sci. 2020, 1469, 105–124. [Google Scholar] [CrossRef]
- Curriero, F.C.; Patz, J.A.; Rose, J.B.; Lele, S. The association between extreme precipitation and waterborne disease outbreaks in the United States, 1948–1994. Am. J. Public Health 2001, 91, 1194. [Google Scholar] [CrossRef]
- Shi, J.; Cui, L.; Wen, K.; Tian, Z.; Zhang, B. Trends in the consecutive days of temperature and precipitation extremes in China during 1961–2015. Environ. Res. 2018, 161, 381–391. [Google Scholar] [CrossRef] [PubMed]
- Xu, L.; Yu, G.; Tu, Z.; Zhang, Y.; Tsendbazar, N.E. Monitoring vegetation change and their potential drivers in Yangtze River Basin of China from 1982 to 2015. Environ. Monit. Assess. 2020, 192, 642. [Google Scholar] [CrossRef]
- Aguilar, E.; Peterson, T.C.; Obando, P.R.; Frutos, R.; Retana, J.A.; Solera, M.; Soley, J.; García, I.G.; Araujo, R.M.; Santos, A.R. Changes in precipitation and temperature extremes in Central America and northern South America, 1961–2003. J. Geophys. Res. 2005, 110, D23107. [Google Scholar] [CrossRef]
- Gang, Y.; Zengyun, H.; Xi, C.; Tashpolat, T. Vegetation dynamics and its response to climate change in Central Asia. J. Arid Land 2016, 8, 375–388. [Google Scholar]
- Yengoh, G.T.; Dent, D.; Olsson, L.; Tengberg, A.E.; Iii, C.J.T. Use of the Normalized Difference Vegetation Index (NDVI) to Assess Land Degradation at Multiple Scales: Current Status, Future Trends, and Practical Considerations. Springer Brief Environ. Sci. 2015, 100. [Google Scholar]
- Bing, G.; Yi, Z.; Shi-Xin, W.; He-Ping, T. The relationship between normalized difference vegetation index (NDVI) and climate factors in the semiarid region: A case study in Yalu Tsangpo River basin of Qinghai-Tibet Plateau. J. Mt. Sci. 2014, 11, 926–940. [Google Scholar]
- Mao, D.; Wang, Z.; Luo, L.; Ren, C. Integrating AVHRR and MODIS data to monitor NDVI changes and their: Relationships with climatic parameters in Northeast China. Int. J. Appl. Earth Obs. Geoinf. 2012, 18, 528–536. [Google Scholar] [CrossRef]
- Lin, X.; Niu, J.; Berndtsson, R.; Yu, X.; Chen, X. NDVI Dynamics and Its Response to Climate Change and Reforestation in Northern China. Remote Sens. 2020, 12, 4138. [Google Scholar] [CrossRef]
- Sun, W.; Song, X.; Mu, X.; Peng, G.; Zhao, G. Spatiotemporal vegetation cover variations associated with climate change and ecological restoration in the Loess Plateau. Agric. For. Meteorol. 2015, 209–210, 87–99. [Google Scholar] [CrossRef]
- Jiang, L.; Guli, ·J.; Bao, A.; Guo, H.; Ndayisaba, F. Vegetation dynamics and responses to climate change and human activities in Central Asia. Sci. Total Environ. 2017, 599–600, 967–980. [Google Scholar] [CrossRef] [PubMed]
- Lamchin, M.; Lee, W.K.; Jeon, S.W.; Wang, S.W.; Lim, C.H.; Song, C.; Sung, M. Long-term trend and correlation between vegetation greenness and climate variables in Asia based on satellite data. Sci. Total Environ. 2018, 618, 1089–1095. [Google Scholar] [CrossRef]
- Nemani, R.; Keeling, C.D.; Hashimoto, H.; Jolly, W.M.; Piper, S.C. Climate-Driven Increases in Global Terrestrial Net Primary Production from 1982 to 1999. Science 2003, 300, 1560–1563. [Google Scholar] [CrossRef] [PubMed]
- Frank, D.; Reichstein, M.; Bahn, M.; Thonicke, K.; Frank, D.; Mahecha, M.D.; Smith, P.; Velde, M.; Vicca, S.; Babst, F. Effects of climate extremes on the terrestrial carbon cycle: Concepts, processes and potential future impacts. Glob. Chang. Biol. 2015, 21, 2861–2880. [Google Scholar] [CrossRef] [PubMed]
- John, R.; Chen, J.; Ou-Yang, Z.T.; Xiao, J.; Becker, R.; Samanta, A.; Ganguly, S.; Yuan, W.; Batkhishig, O. Vegetation response to extreme climate events on the Mongolian Plateau from 2000 to 2010. Environ. Res. Lett. 2013, 8, 035033. [Google Scholar] [CrossRef]
- Liu, G.; Liu, H.; Yin, Y. Global patterns of NDVI-indicated vegetation extremes and their sensitivity to climate extremes. Environ. Res. Lett. 2013, 8, 279–288. [Google Scholar] [CrossRef]
- Roerink, G.J.; Menenti, M.; Su, Z.W.; Soepboer, W. Assessment of climate impact on vegetation dynamics by using remote sensing. Phys. Chem. Earth 2002, 28, 103–109. [Google Scholar] [CrossRef]
- Zhao, A.; Zhang, A.; Liu, X.; Cao, S. Spatiotemporal changes of normalized difference vegetation index (NDVI) and response to climate extremes and ecological restoration in the Loess Plateau, China. Theor. Appl. Climatol. 2018, 132, 555–567. [Google Scholar] [CrossRef]
- Bokhorst, S.; T?Mmervik, H.; Callaghan, T.V.; Phoenix, G.K.; Bjerke, J.W. Vegetation recovery following extreme winter warming events in the sub-Arctic estimated using NDVI from remote sensing and handheld passive proximal sensors. Environ. Exp. Bot. 2012, 81, 18–25. [Google Scholar] [CrossRef]
- Ogle, K.; Reynolds, J.F. Plant responses to precipitation in desert ecosystems: Integrating functional types, pulses, thresholds, and delays. Oecologia 2004, 141, 282–294. [Google Scholar] [CrossRef] [PubMed]
- Thomey, M.L.; Collins, S.L.; Vargas, R.; Johnson, J.E.; Brown, R.F.; Natvig, D.O.; Friggens, M.T. Effect of precipitation variability on net primary production and soil respiration in a Chihuahuan Desert grassland. Glob. Chang. Biol. 2011, 17, 1505–1515. [Google Scholar] [CrossRef]
- Solomon, S.; Qin, D.; Manning, M.; Chen, Z.; Marquis, M.; Averyt, K.B.; Tignor, M.; Miller, H.L. The Physical Science Basis: Contribution of Working Group I to the Fourth Assessment Report of the Intergovernmental Panel on Climate Change. IPCC Fourth Assess. Rep. 2007, 18, 95–123. [Google Scholar]
- Yuan, W.; Cai, W.; Chen, Y.; Liu, S.; Dong, W.; Zhang, H.; Yu, G.; Chen, Z.; He, H.; Guo, W. Severe summer heatwave and drought strongly reduced carbon uptake in Southern China. Sci. Rep. 2016, 6, 18813. [Google Scholar] [CrossRef] [PubMed]
- Yafeng, S.; Yongping, S.; Ruji, H. Preliminary study on signal, impact and foreground of climatic shift from warm-dry to warm-humid in Northwest China. J. Glaciol. Geocryol. 2002, 24, 219–226. [Google Scholar]
- Almazroui, M.; Saeed, S.; Saeed, F.; Islam, M.N.; Ismail, M. Projections of Precipitation and Temperature over the South Asian Countries in CMIP6. Earth Syst. Environ. 2020, 4, 297–320. [Google Scholar] [CrossRef]
- Ding, Y.; Liu, S.; Li, J.; Shangguan, D. Glaciers in response to recent climate warming in Western China. Ann. Glaciol. 2006, 43, 97–105. [Google Scholar] [CrossRef]
- Alexander, L.V.; Zhang, X.B.; Peterson, T.C.; Caesar, J.; Vazquez-Aguirre, J.L. Global observed changes in daily climate extremes of temperature and precipitation. J. Geophys. Res. Atmos. 2006, 111, D051099. [Google Scholar] [CrossRef]
- Gobiet, A.; Kotlarski, S.; Beniston, M.; Heinrich, G.; Rajczak, J.; Stoffel, M. 21st century climate change in the European Alps—A review. Sci. Total Environ. 2014, 493, 1138–1151. [Google Scholar] [CrossRef]
- Deng, H.; Chen, Y.; Shi, X.; Li, W.; Wang, H.; Zhang, S.; Fang, G. Dynamics of temperature and precipitation extremes and their spatial variation in the arid region of northwest China. Atmos. Res. 2014, 138, 346–355. [Google Scholar] [CrossRef]
- Chen, Y.; Deng, H.; Li, B.; Li, Z.; Xu, C. Abrupt change of temperature and precipitation extremes in the arid region of Northwest China. Quatern. Int. 2014, 336, 35–43. [Google Scholar] [CrossRef]
- Sura, P. A general perspective of extreme events in weather and climate. Atmos. Res. 2011, 101, 1–21. [Google Scholar] [CrossRef]
- Tang, X. Progress and Prospect of Extreme Climate Events in Arid Northwest China. Int. J. Geosci. 2013, 4, 36–42. [Google Scholar] [CrossRef]
- Sun, Q.; Miao, C.; Duan, Q. Extreme climate events and agricultural climate indices in China: CMIP5 model evaluation and projections. Int. J. Climatol. 2016, 36, 43–61. [Google Scholar] [CrossRef]
- Doughty, C.E.; Metcalfe, D.B.; Girardin, C.A.J.; Amézquita, F.F.; Cabrera, D.G.; Huasco, W.H.; Silva-Espejo, J.E.; Araujo-Murakami, A.; da Costa, M.C.; Rocha, W.; et al. Drought impact on forest carbon dynamics and fluxes in Amazonia. Nature 2015, 519, 78–82. [Google Scholar] [CrossRef] [PubMed]
- Chen, Y. Water Resources Research in Northwest China; Springer: New York, NY, USA, 2014; pp. 109–144. [Google Scholar]
- Wang, K.; Jiang, H. Atmospheric Water Vapor Transport from Westerly and Monsoon over Northwest China. Proc. Fifth Annu. Conf. Young Sci. China Assoc. Sci. Technol. 2004, 1, 499–506. [Google Scholar]
- Liang, D.; Yan, Z.; Huang, L.; Zhao, J.; Ling, T.; Yang, F. Evaluation of the Consistency of MODIS Land Cover Product (MCD12Q1) Based on Chinese 30 m GlobeLand30 Datasets: A Case Study in Anhui Province, China. ISPRS Int. J. Geo-Inf. 2015, 4, 2519–2541. [Google Scholar] [CrossRef]
- Li, B.; Chen, Y.; Shi, X. Why does the temperature rise faster in the arid region of northwest China? J. Geophys. Res. Atmos. 2012, 117, D16115. [Google Scholar] [CrossRef]
- Pettorelli, N.; Vik, J.O.; Mysterud, A.; Gaillard, J.M.; Stenseth, N.C. Using the satellite-derived NDVI to assess ecological responses to environmental change. Trends Ecol. Evol. 2005, 20, 503–510. [Google Scholar] [CrossRef] [PubMed]
- Verbyla, D. Comparison of eMODIS and MOD/MYD13A2 NDVI products during 2012–2014 spring green-up periods in Alaska and northwest Canada. Int. J. Appl. Earth Obs. Geoinf. 2015, 36, 83–86. [Google Scholar] [CrossRef]
- Huete, A.; Didan, K.; Van Leeuwen, W.; Miura, T.; Glenn, E. MODIS Vegetation Indices. In Land Remote Sensing and Global Environmental Change; Springer: New York, NY, USA, 2010; Volume 11, pp. 579–602. [Google Scholar]
- Gu, J.; Li, X.; Huang, C.; Okin, G.S. A simplified data assimilation method for reconstructing time-series MODIS NDVI data. Adv. Space Res. 2009, 44, 501–509. [Google Scholar] [CrossRef]
- Dunn, R.J.H.; Alexander, L.V.; Donat, M.G.; Zhang, X.; Bador, M.; Herold, N.; Lippmann, T.; Allan, R.; Aguilar, E.; Barry, A.A.; et al. Development of an Updated Global Land In Situ-Based Data Set of Temperature and Precipitation Extremes: HadEX3. J. Geophys. Res. Atmos. 2020, 125, D032263. [Google Scholar] [CrossRef]
- Wong, M.C.; Mok, H.Y.; Lee, T.C. Observed changes in extreme weather indices in Hong Kong. Int. J. Climatol. 2011, 31, 2300–2311. [Google Scholar] [CrossRef]
- You, Q.L.; Kang, S.C.; Aguilar, E.; Yan, Y.P. Changes in daily climate extremes in the eastern and central Tibetan Plateau during 1961–2005. J. Geophys. Res. Atmos. 2008, 113, D07101. [Google Scholar] [CrossRef]
- You, Q.; Kang, S.; Aguilar, E.; Pepin, N.; Flügel, W.A.; Yan, Y.; Xu, Y.; Zhang, Y.; Jie, H. Changes in daily climate extremes in China and their connection to the large scale atmospheric circulation during 1961–2003. Clim. Dyn. 2011, 36, 2399–2417. [Google Scholar] [CrossRef]
- Frich, P.L.; Alexander, L.; Della-Marta, P.; Gleason, B.; Peterson, T.C. Observed coherent changes in climatic extremes during 2nd half of the 20th century. Clim. Res. 2002, 19, 193–212. [Google Scholar] [CrossRef]
- Kendall, M.G. Rank Correlation Methods. Br. J. Psychol. 1990, 25, 86–91. [Google Scholar] [CrossRef]
- Mann, H.B. Nonparametric test against trend. Econometrica 1945, 13, 245–259. [Google Scholar] [CrossRef]
- Yue, S.; Wang, C.Y. The Mann-Kendall Test Modified by Effective Sample Size to Detect Trend in Serially Correlated Hydrological Series. Water Resour. Manag. 2004, 18, 201–218. [Google Scholar] [CrossRef]
- Hirsch, R.M.; Slack, J.R. A Nonparametric Trend Test for Seasonal Data with Serial Dependence. Water Resour. Res. 1984, 20, 727–732. [Google Scholar] [CrossRef]
- Yue, S.; Pilon, P.; Phinney, B.; Cavadias, G. The influence of autocorrelation on the ability to detect trend in hydrological series. Hydrol. Process. 2002, 16, 1807–1829. [Google Scholar] [CrossRef]
- Jong, R.D.; Bruin, S.D.; Wit, A.D.; Schaepman, M.E.; Dent, D.L. Analysis of monotonic greening and browning trends from global NDVI time-series. Remote Sens. Environ. 2011, 115, 692–702. [Google Scholar] [CrossRef]
- Douglas, E.M.; Vogel, R.M.; Kroll, C.N. Trends in floods and low flows in the United States: Impact of spatial correlation. J. Hydrol. 2000, 240, 90–105. [Google Scholar] [CrossRef]
- Stow, D.; Daeschner, S.; Hope, A.; Douglas, D.; Petersen, A. Variability of the Seasonally Integrated Normalized Difference Vegetation Index across the North Slope of Alaska in the 1990s. Int. J. Remote Sens. 2003, 24, 1111–1117. [Google Scholar] [CrossRef]
- Peng, S.; Piao, S.; Shen, Z.; Ciais, P.; Sun, Z.; Chen, S.; Bacour, C.; Peylin, P.; Chen, A. Precipitation amount, seasonality and frequency regulate carbon cycling of a semi-arid grassland ecosystem in Inner Mongolia, China: A modeling analysis. Agric. For. Meteorol. 2013, 178, 46–55. [Google Scholar] [CrossRef]
- Gocic, M.; Trajkovic, S. Analysis of changes in meteorological variables using Mann-Kendall and Sen’s slope estimator statistical tests in Serbia. Glob. Planet. Chang. 2013, 100, 172–182. [Google Scholar] [CrossRef]
- Wang, S.; Yan, Y.; Yan, M.; Zhao, X. Quantitative estimation of the impact of precipitation and human activities on runoff change of the Huangfuchuan River Basin. J. Geogr. Sci. 2012, 22, 906–918. [Google Scholar] [CrossRef]
- Peng, J.; Liu, Z.; Liu, Y.; Wu, J.; Han, Y. Trend analysis of vegetation dynamics in Qinghai–Tibet Plateau using Hurst Exponent. Ecol. Indic. 2012, 14, 28–39. [Google Scholar] [CrossRef]
- Tibshirani, R. Regression shrinkage and selection via the lasso: A retrospective. J. R. Stat. Soc. 2011, 73, 267–288. [Google Scholar] [CrossRef]
- Zandler, H.; Brenning, A.; Samimi, C. Quantifying dwarf shrub biomass in an arid environment: Comparing empirical methods in a high dimensional setting. Remote Sens. Environ. 2015, 158, 140–155. [Google Scholar] [CrossRef]
- Team, R.D.C. R: A language and environment for statistical computing. R Foundation for Statistical Computing, R Foundation for Statistical Computing, Vienna, Austria. Computing 2010, 14, 12–21. [Google Scholar]
- Kong, W.; Sun, O.; Xu, W.; Yaning, C. Changes in vegetation and landscape patterns with altered river water-flow in arid West China. J. Arid Environ. 2009, 73, 306–313. [Google Scholar] [CrossRef]
- Jia, B.; Zhang, Z.; Ci, L.; Ren, Y.; Pan, B.; Zhong, Z. Oasis land-use dynamics and its influence on the oasis environment in Xinjiang, China. J. Arid Environ. 2004, 56, 11–26. [Google Scholar] [CrossRef]
- Li, J.; Lewis, J.; Rowland, J.; Tappan, G.; Tieszen, L.L. Evaluation of land performance in Senegal using multi-temporal NDVI and rainfall series. J. Arid Environ. 2004, 59, 463–480. [Google Scholar] [CrossRef]
- Yao, J.; Chen, Y.; Zhao, Y.; Mao, W.; Xu, X.; Liu, Y.; Yang, Q. Response of vegetation NDVI to climatic extremes in the arid region of Central Asia: A case study in Xinjiang, China. Theor. Appl. Climatol. 2017, 131, 1503–1515. [Google Scholar] [CrossRef]
- Yu, Z.; Li, Z.; Rasmus, F.; Kun, W.; Irina, V.; Feng, T. Climate Contributions to Vegetation Variations in Central Asian Drylands: Pre- and Post-USSR Collapse. Remote Sens. 2015, 7, 2449–2470. [Google Scholar]
- Tan, Z.; Tao, H.; Jiang, J.; Zhang, Q. Influences of Climate Extremes on NDVI (Normalized Difference Vegetation Index) in the Poyang Lake Basin, China. Wetlands 2015, 35, 1033–1042. [Google Scholar] [CrossRef]
- Wang, J.; Rich, P.M.; Price, K.P. Temporal responses of NDVI to precipitation and temperature in the central Great Plains, USA. Int. J. Remote Sens. 2003, 24, 2345–2364. [Google Scholar] [CrossRef]
- Hatfield, J.L.; Prueger, J.H. Temperature extremes: Effect on plant growth and development. Weather Clim. Extrem. 2015, 10, 4–10. [Google Scholar] [CrossRef]
- Ciais, P.; Reichstein, M.; Viovy, N.; Granier, A.; Ogee, J.; Allard, V.; Aubinet, M.; Buchmann, N.; Bernhofer, C.; Carrara, A. Europe-wide reduction in primary productivity caused by the heat and drought in 2003. Nature 2005, 437, 529–533. [Google Scholar] [CrossRef]
- Vicca, S.; Bahn, M.; Estiarte, M.; Loon, E.; Vargas, R.; Alberti, G.; Ambus, P.; Arain, M.; Beier, C.; Bentley, L.; et al. Can current moisture responses predict soil CO2 efflux under altered precipitation regimes? A synthesis of manipulation experiments. Biogeosciences 2014, 11, 2991–3013. [Google Scholar] [CrossRef]
- Reyer, C.; Leuzinger, S.; Rammig, A.; Wolf, A.; Bartholomeus, R.; Bonfante, A.; De Lorenzi, F.; Dury, M.; Gloning, P.; Jaoudé, R.; et al. A plant’s perspective of extremes: Terrestrial plant responses to changing climatic variability. Glob. Chang. Biol. 2013, 19, 75–89. [Google Scholar] [CrossRef] [PubMed]
- Anderson, L.O.; Malhi, Y.; Aragao, L.E.O.C.; Ladle, R.; Arai, E.; Barbier, N.; Phillips, O. Remote sensing detection of droughts in Amazonian forest canopies. New Phytol. 2010, 187, 733–750. [Google Scholar] [CrossRef] [PubMed]
- Chen, T.; De Jeu, R.A.M.; Liu, Y.Y.; Van Werf, G.R.; Dolman, A.J. Using satellite based soil moisture to quantify the water driven variability in NDVI: A case study over mainland Australia. Remote Sens. Environ. 2014, 140, 330–338. [Google Scholar] [CrossRef]
- Darrel, J.; Russell, S.; Huete, A. Functional differences between summer and winter season rain assessed with MODIS-derived phenology in a semi-arid region. J. Veg. Sci. 2010, 21, 16. [Google Scholar]
- Li, Z.; Yan, F.; Fan, X. The variability of NDVI over northwest China and its relation to temperature and precipitation. 2003 IEEE Int. Geosci. Remote Sens. Symp. 2003, 4, 2275–2277. [Google Scholar]
- Kong, D.; Zhang, Q.; Singh, V.P.; Shi, P. Seasonal vegetation response to climate change in the northern hemisphere (1982–2013). Glob. Planet. Chang. 2016, 148, 1–8. [Google Scholar] [CrossRef]
- Xu, W.; Liu, H.; Zhang, Q.; Liu, P. Response of vegetation ecosystem to climate change based on remote sensing and information entropy: A case study in the arid inland river basin of China. Environ. Earth Sci. 2021, 80, 132. [Google Scholar] [CrossRef]
- Liu, Y.; Wang, Q.-F.; Yu, G.-R.; Zhu, X.; Xy, Z.; Guo, Q.; Yang, H.; Li, S.; Hu, Z. Ecosystems carbon storage and carbon sequestration potential of two main tree species for the Grain for Green Project on China’s hilly Loess Plateau. Acta Ecol. Sin. 2011, 31, 4277–4286. [Google Scholar]
- Trenberth, K.E. Conceptual Framework for Changes of Extremes of the Hydrological Cycle with Climate Change. Clim. Chang. 1999, 42, 327–339. [Google Scholar] [CrossRef]
- Kaser, G.; Martin Gro, S.; Marzeion, B. Contribution potential of glaciers to water availability in different climate regimes. Proc. Natl. Acad. Sci. USA 2010, 107, 20223–20227. [Google Scholar] [CrossRef] [PubMed]
- Hanson, C.E.; Palutikof, J.P.; Livermore, M.T.J.; Barring, L.; Bindi, M.; Corte-Real, J.; Durao, R.; Giannakopoulos, C.; Good, P.; Holt, T. Modelling the impact of climate extremes: An overview of the MICE project. Clim. Chang. 2007, 81, 163–177. [Google Scholar] [CrossRef]
- Zuo, L.; Zhang, Z.; Zhao, X.; Xiao, W.; Fang, L. Multitemporal analysis of cropland transition in a climate-sensitive area: A case study of the arid and semiarid region of northwest China. Reg. Environ. Chang. 2014, 14, 75–89. [Google Scholar] [CrossRef]
- Zhai, P.; Zhang, X.; Wan, H.; Pan, X. Trends in Total Precipitation and Frequency of Daily Precipitation Extremes over China. J. Clim. 2005, 18, 1096–1098. [Google Scholar] [CrossRef]
- Wang, H.; Chen, Y.; Chen, Z. Spatial distribution and temporal trends of mean precipitation and extremes in the arid region, northwest of China, during 1960–2010. Hydrol. Process. 2013, 27, 1807–1818. [Google Scholar] [CrossRef]
- Luo, N.; Mao, D.; Wen, B.; Liu, X. Climate Change Affected Vegetation Dynamics in the Northern Xinjiang of China: Evaluation by SPEI and NDVI. Land 2020, 9, 90. [Google Scholar] [CrossRef]
- Du, Z.; Zhao, J.; Pan, H.; Wu, Z.; Zhang, H. Responses of vegetation activity to the daytime and nighttime warming in Northwest China. Environ. Monit. Assess. 2019, 191, 721. [Google Scholar] [CrossRef] [PubMed]
- Barton, B.T.; Schmitz, O.J. Opposite effects of daytime and nighttime warming on top-down control of plant diversity. Ecology 2017, 99, 13–20. [Google Scholar] [CrossRef] [PubMed]
- Speights, C.J.; Harmon, J.P.; Barton, B.T. Contrasting the potential effects of daytime versus nighttime warming on insects. Curr. Opin. Insect Sci. 2017, 23, 1–6. [Google Scholar] [CrossRef] [PubMed]
Publisher’s Note: MDPI stays neutral with regard to jurisdictional claims in published maps and institutional affiliations. |
© 2021 by the authors. Licensee MDPI, Basel, Switzerland. This article is an open access article distributed under the terms and conditions of the Creative Commons Attribution (CC BY) license (http://creativecommons.org/licenses/by/4.0/).

