
Profiling Dust Mass Concentration in Northwest China Using a Joint Lidar and Sun-Photometer Setting

 ,
,  ,
, 

Abstract
1. Introduction
2. Field Experiments and Measurements

| Sites | Lat/Lon | Elevation | Periods | References |
|---|---|---|---|---|
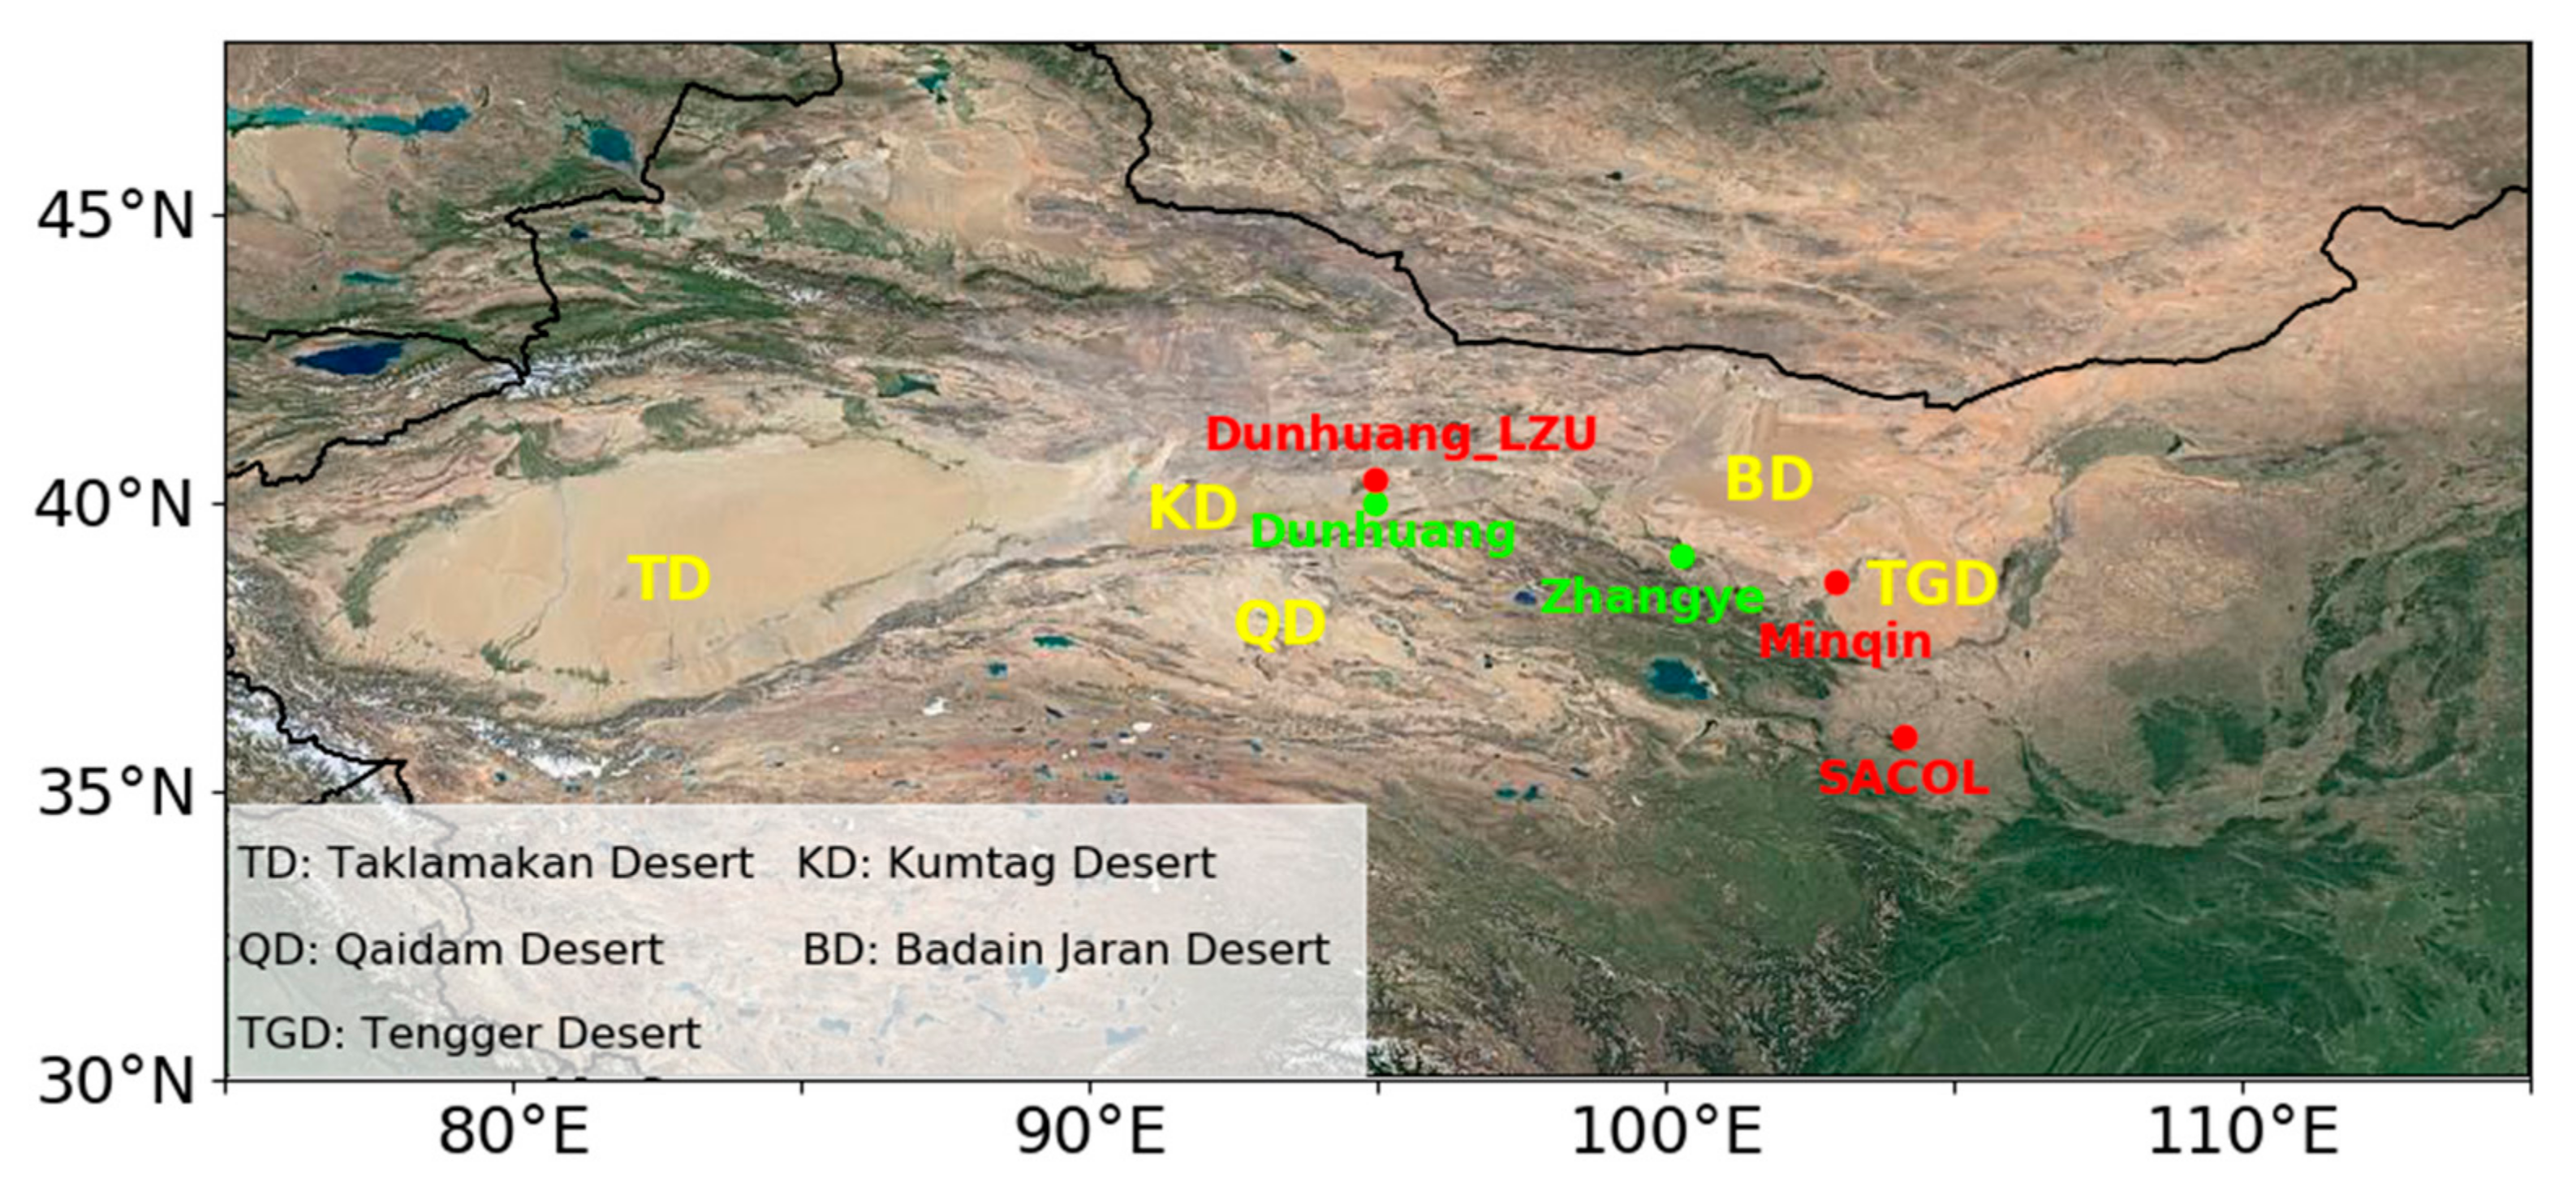
| Dunhuang | 40.04° N, 94.79° E | 1381 m | March–May, 2001 | Huebert et al. [41] |
| Zhangye | 39.08° N, 100.28° E | 1461 m | April–June, 2008 | Huang et al. [55] |
| Minqin | 38.61° N, 102.96° E | 1373 m | April–June, 2010 | Bi et al. [56] |
| Dunhuang_LZU | 40.49° N, 94.96° E | 1061 m | April–June, 2012 | Bi et al. [51] |
| SACOL | 35.57° N, 104.08° E | 1966 m | August 2007–May 2013 | Huang et al. [61] |
3. Retrieval Methods
3.1. Retrieval of Dust MEE from AERONET Sun-Photometer
3.2. Retrieval of DMC Profiles from MPL
4. Results
4.1. Identification and Classification of Dust Aerosol
4.2. Optical and Microphysical Properties of Dust Aerosols
4.3. Dust MEE in Northwest China
4.4. DMC Profile in Northwest China
4.4.1. Case Studies
4.4.2. Average DMC Profile during Field Experiments
5. Discussion
5.1. Uncertainties of the DMC Retrieval
5.2. Uncertainty in DMC Caused by the Assumption of MEE
6. Conclusions
- -
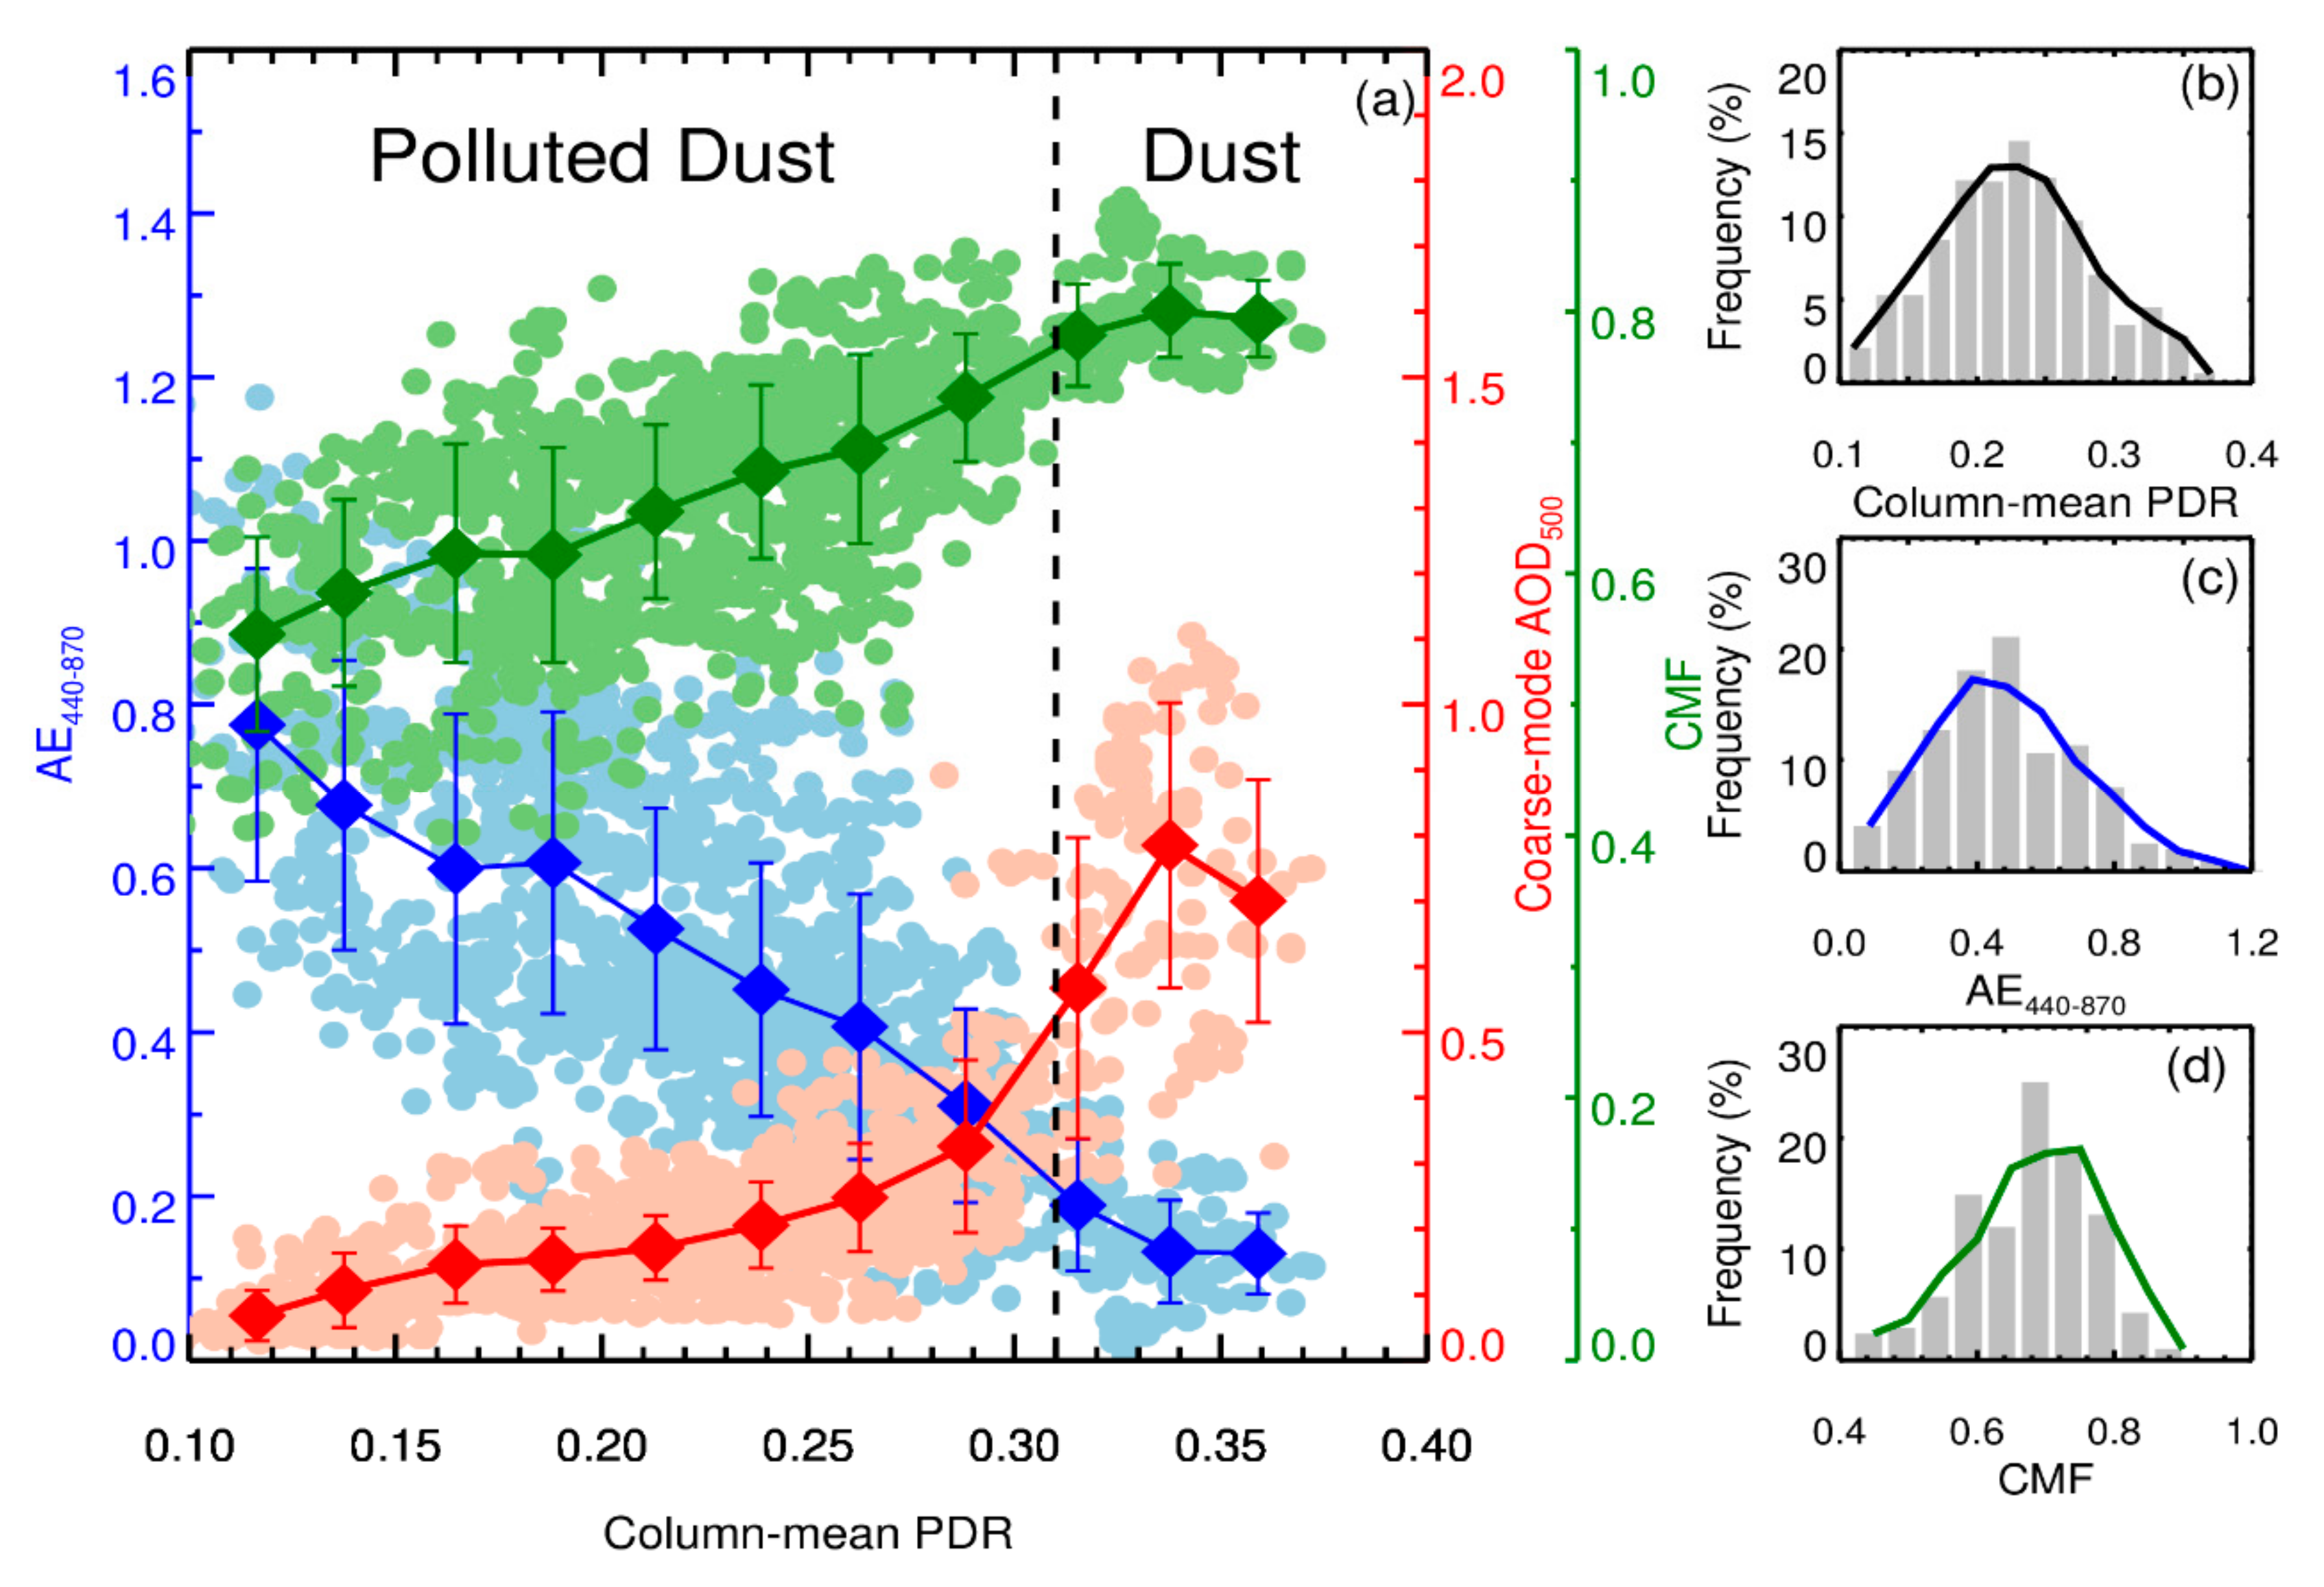
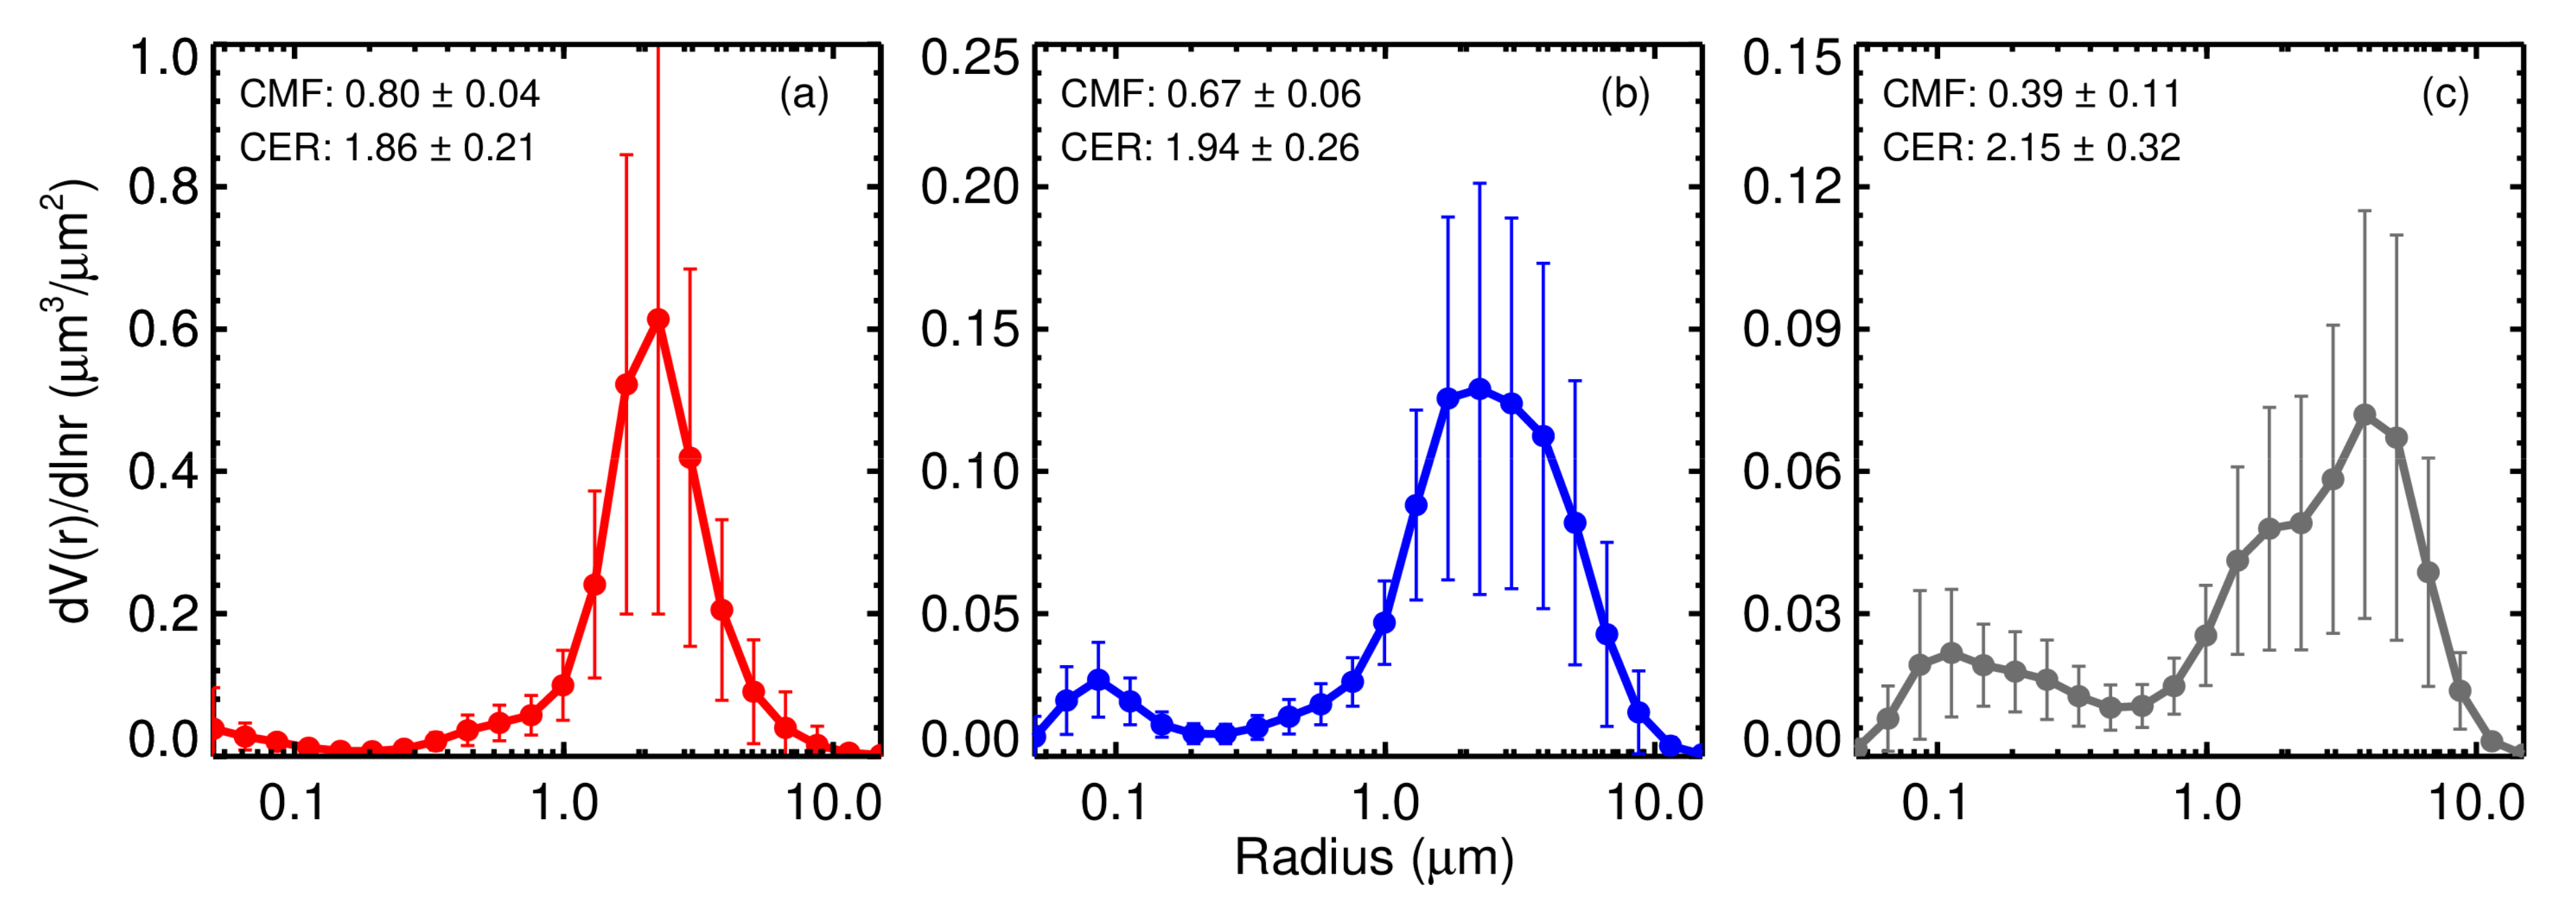
- Dust identification and separation using PDR is more effective than that of AE440–870. Pure mineral dust and polluted dust in Northwest China can also be well identified by AE440–870 ≤ 0.2 with CMF ≥ 0.8 and 0.2 < AE440–870 ≤ 1.2 with CMF ≥ 0.4 without lidar detection.
- -
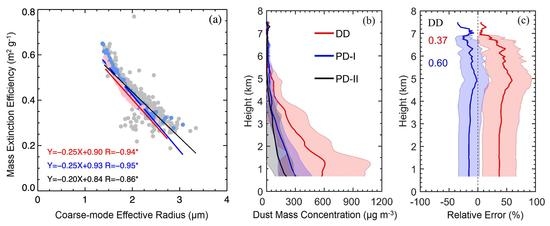
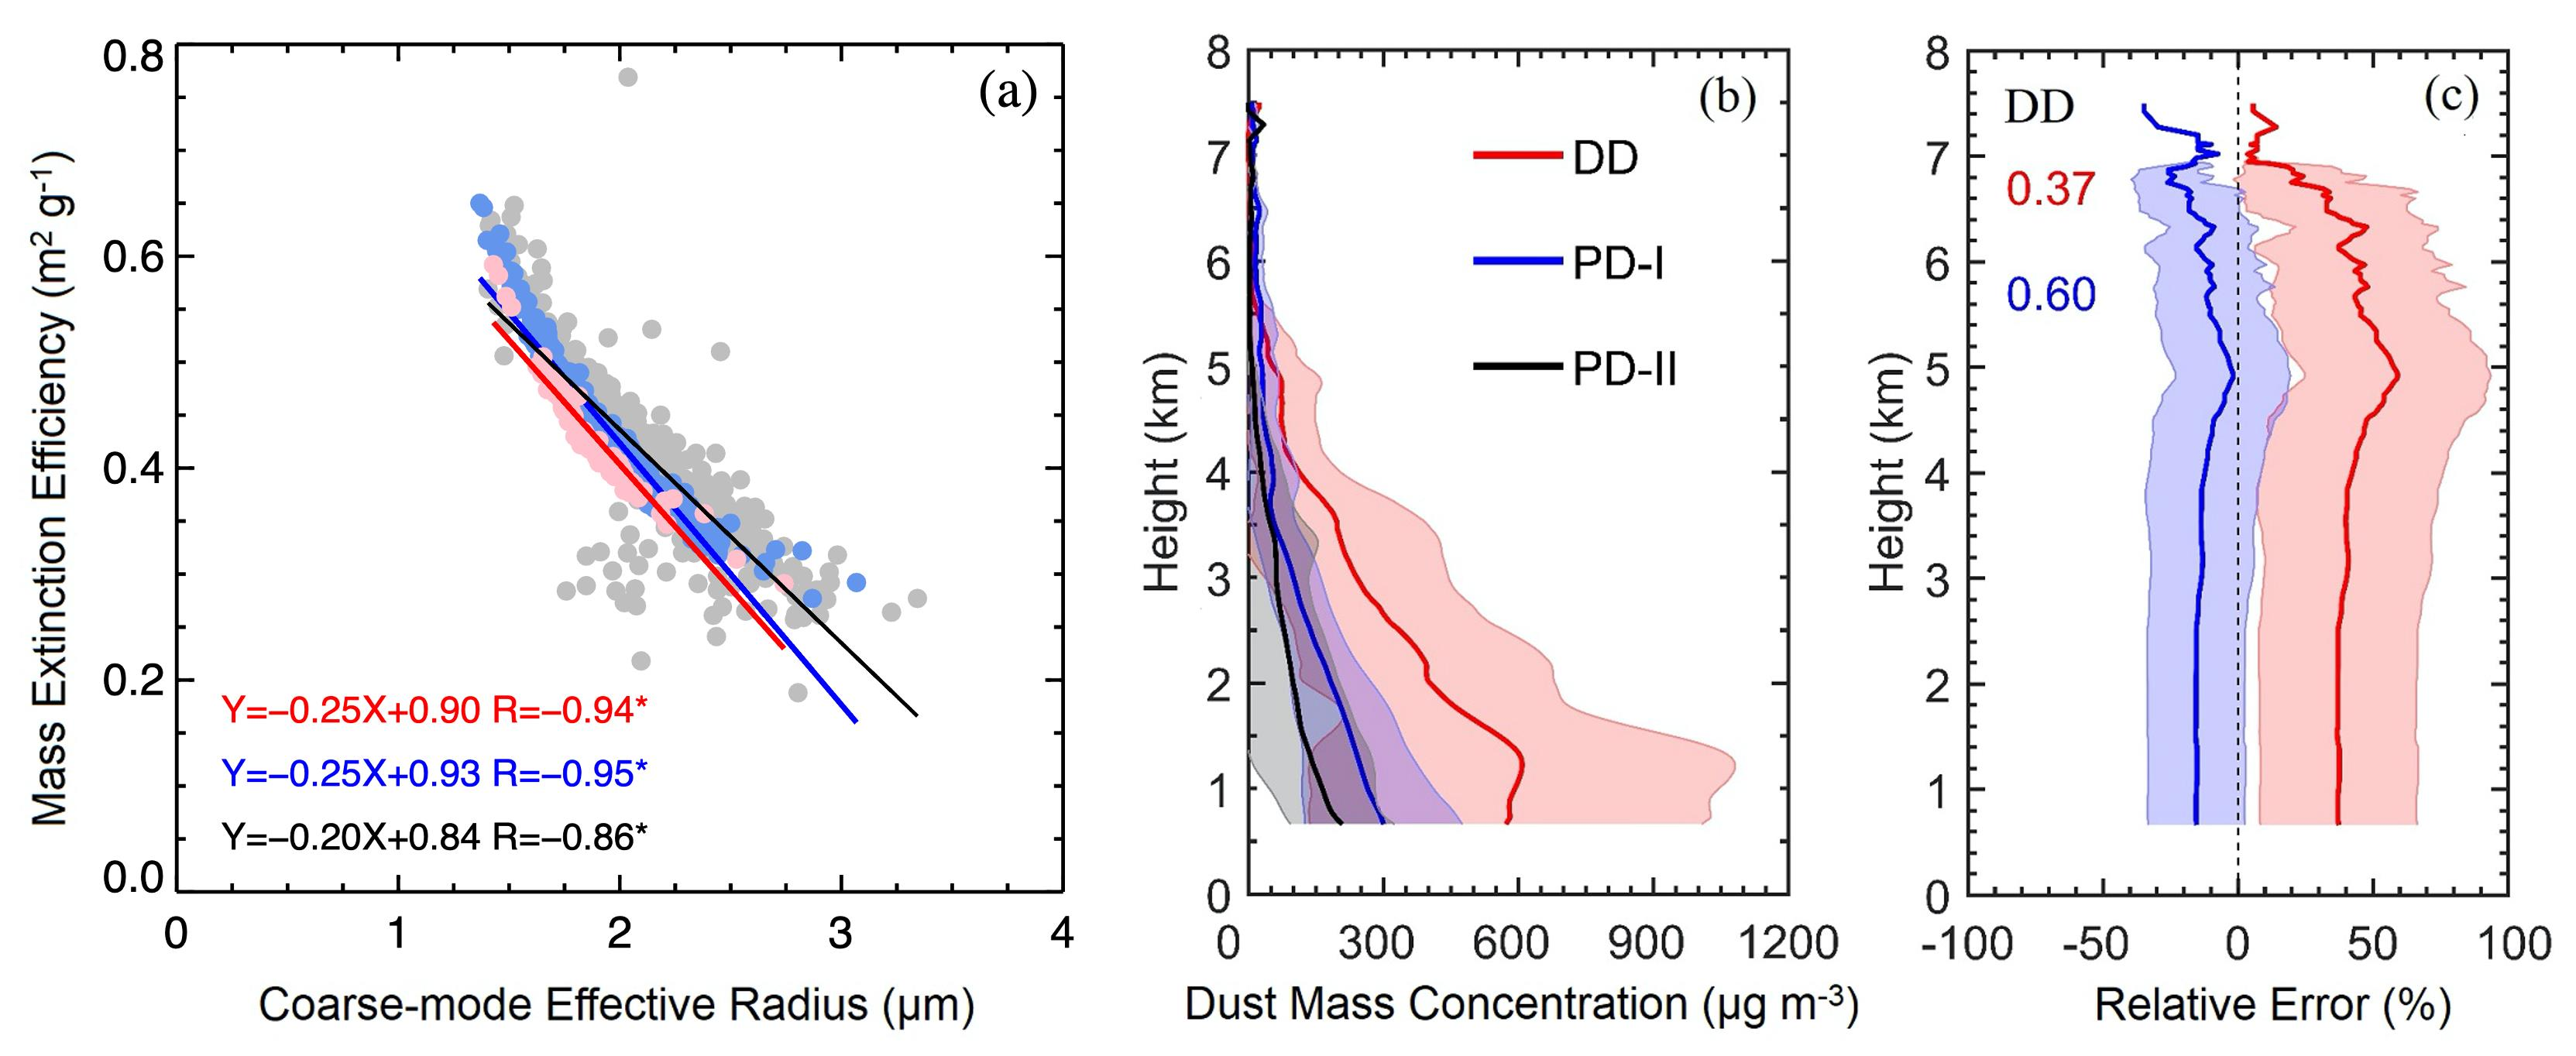
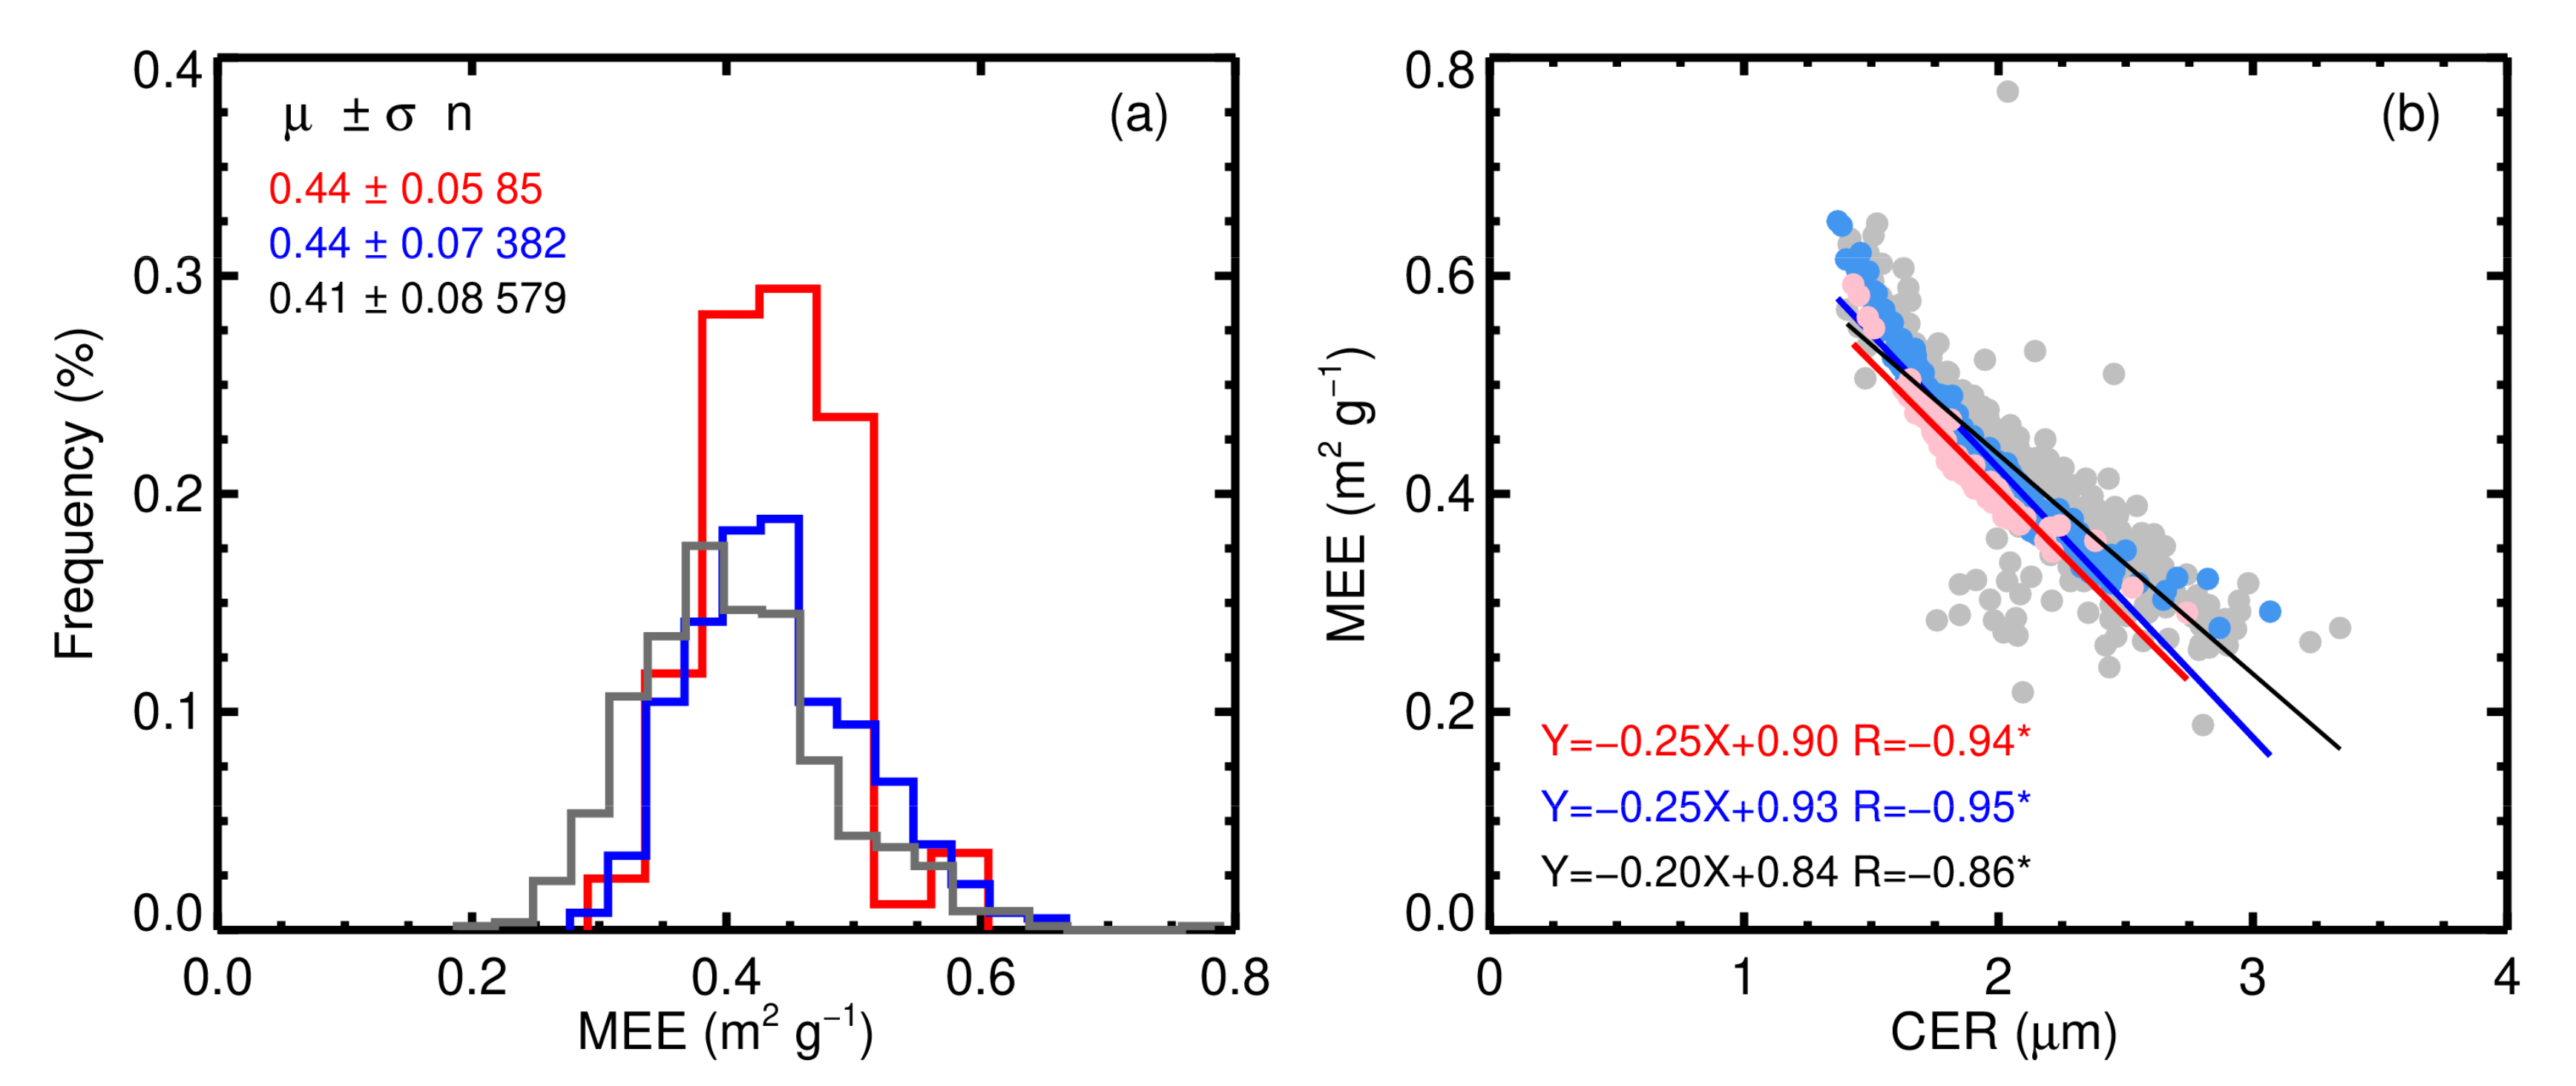
- The dust MEE derived from the AERONET sun-photometer is within the range of 0.30 to 0.60 m2 g−1, with the average and SD of 0.44 ± 0.05, 0.44 ± 0.07, and 0.41 ± 0.08 m2 g−1 for the DD, PD-I, and PD-II conditions. The obtained results are also consistent with the in-situ observations by airborne and multi-wavelength lidar in Africa.
- -
- There is a significant negative correlation between the dust MEE and dust CER, with R of −0.94, −0.95, and −0.86 for the DD, PD-I, and PD-II conditions. This suggests that the dust MEE is not a fixed value and it significantly varies with the size of the dust particles in different dust weather processes.
- -
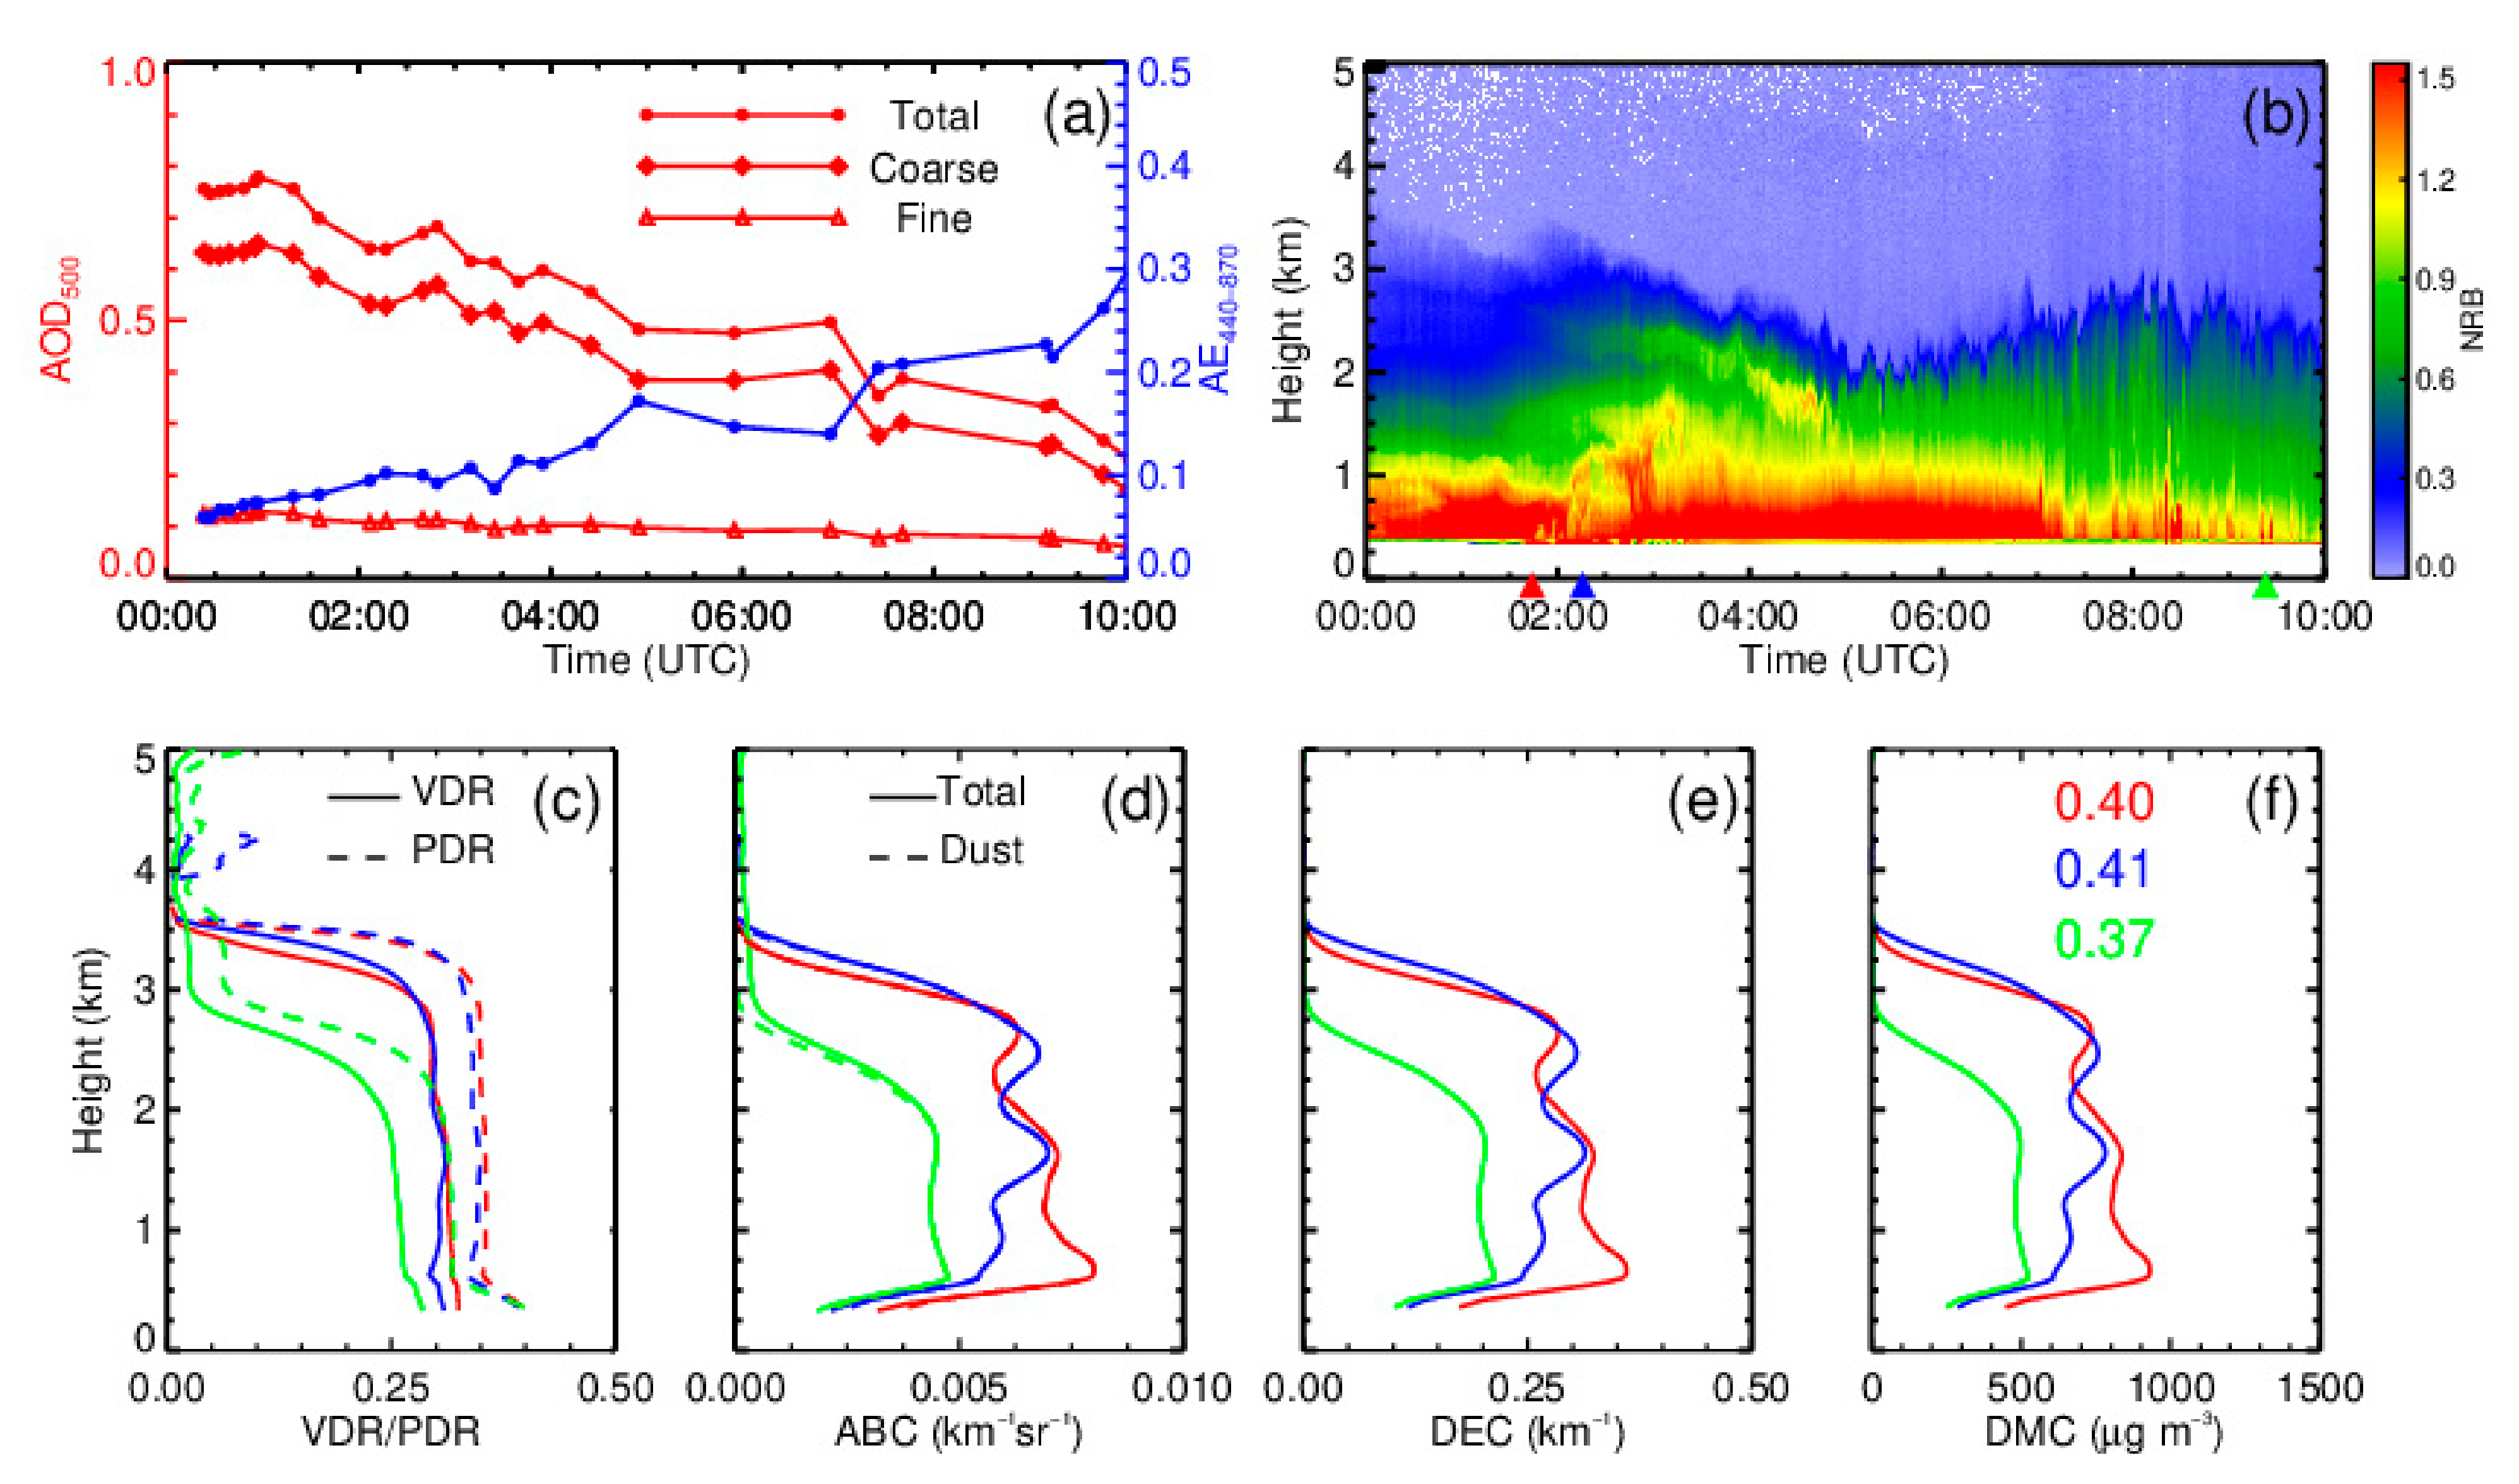
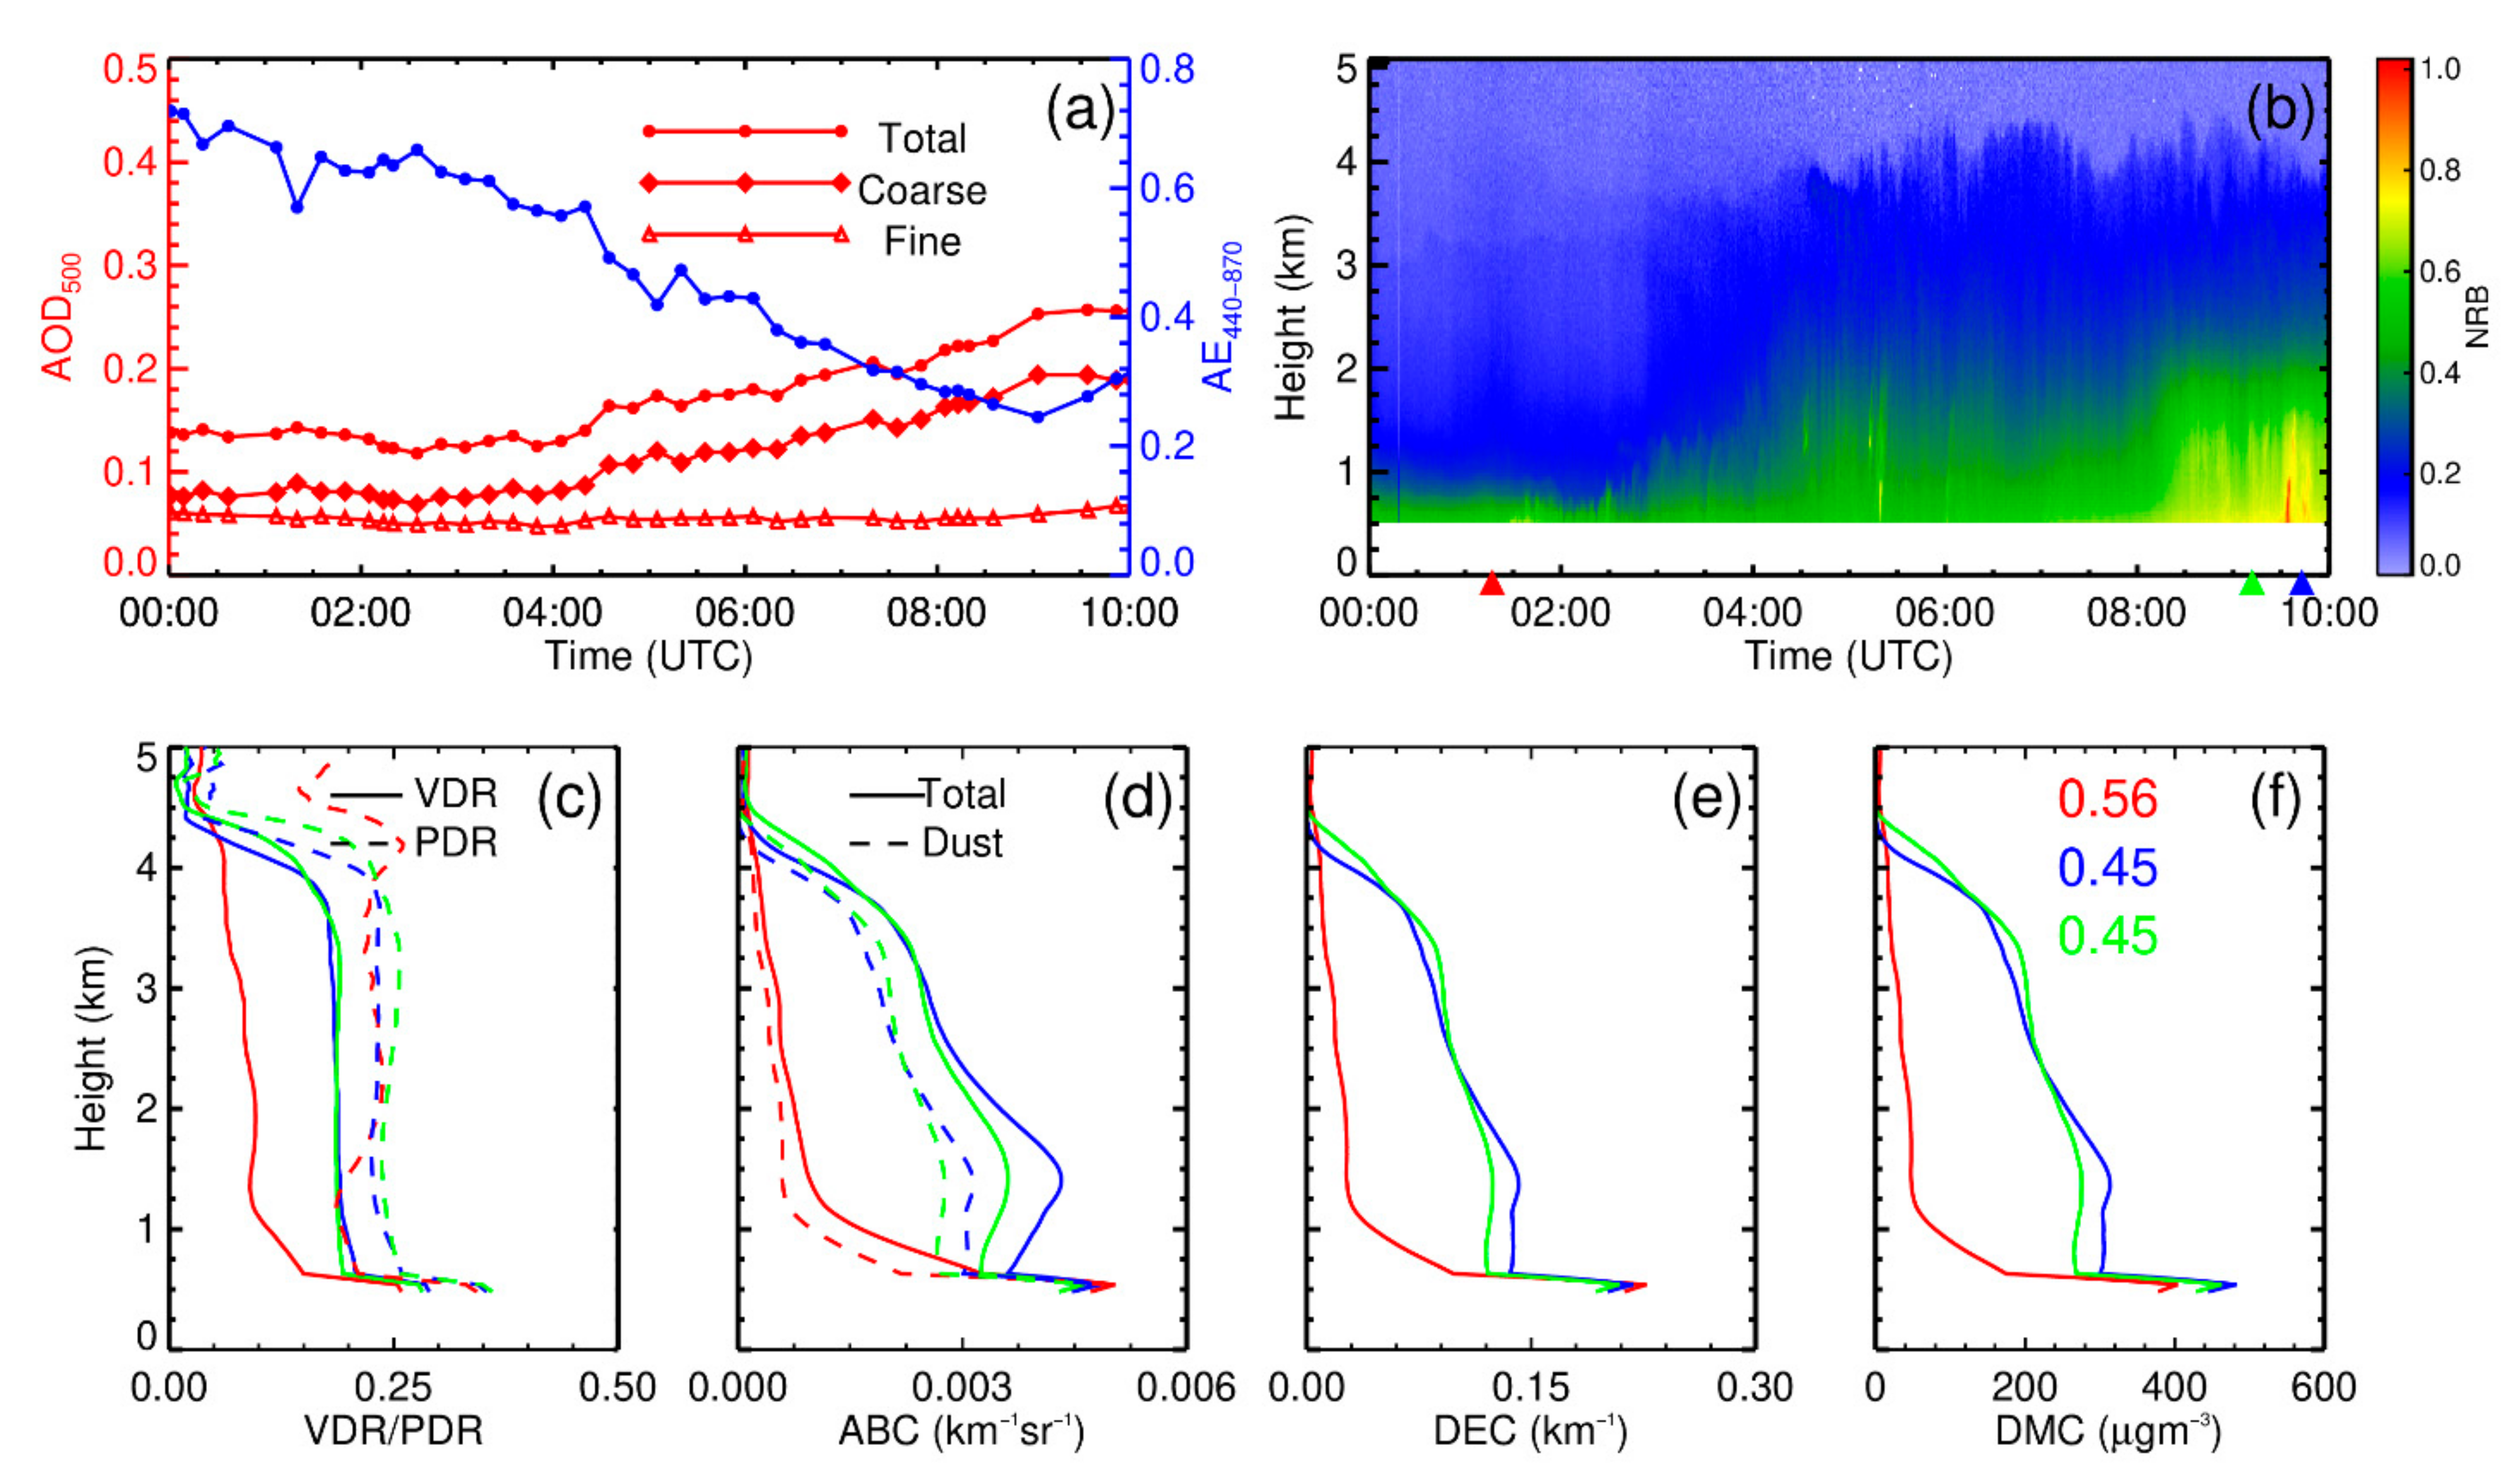
- The MPL-based lidar-photometer method is efficient for the continental aerosol mixtures consisting of dust and anthropogenic pollutants in Northwest China. This method strongly relies on accurate lidar observations of the PDR.
- -
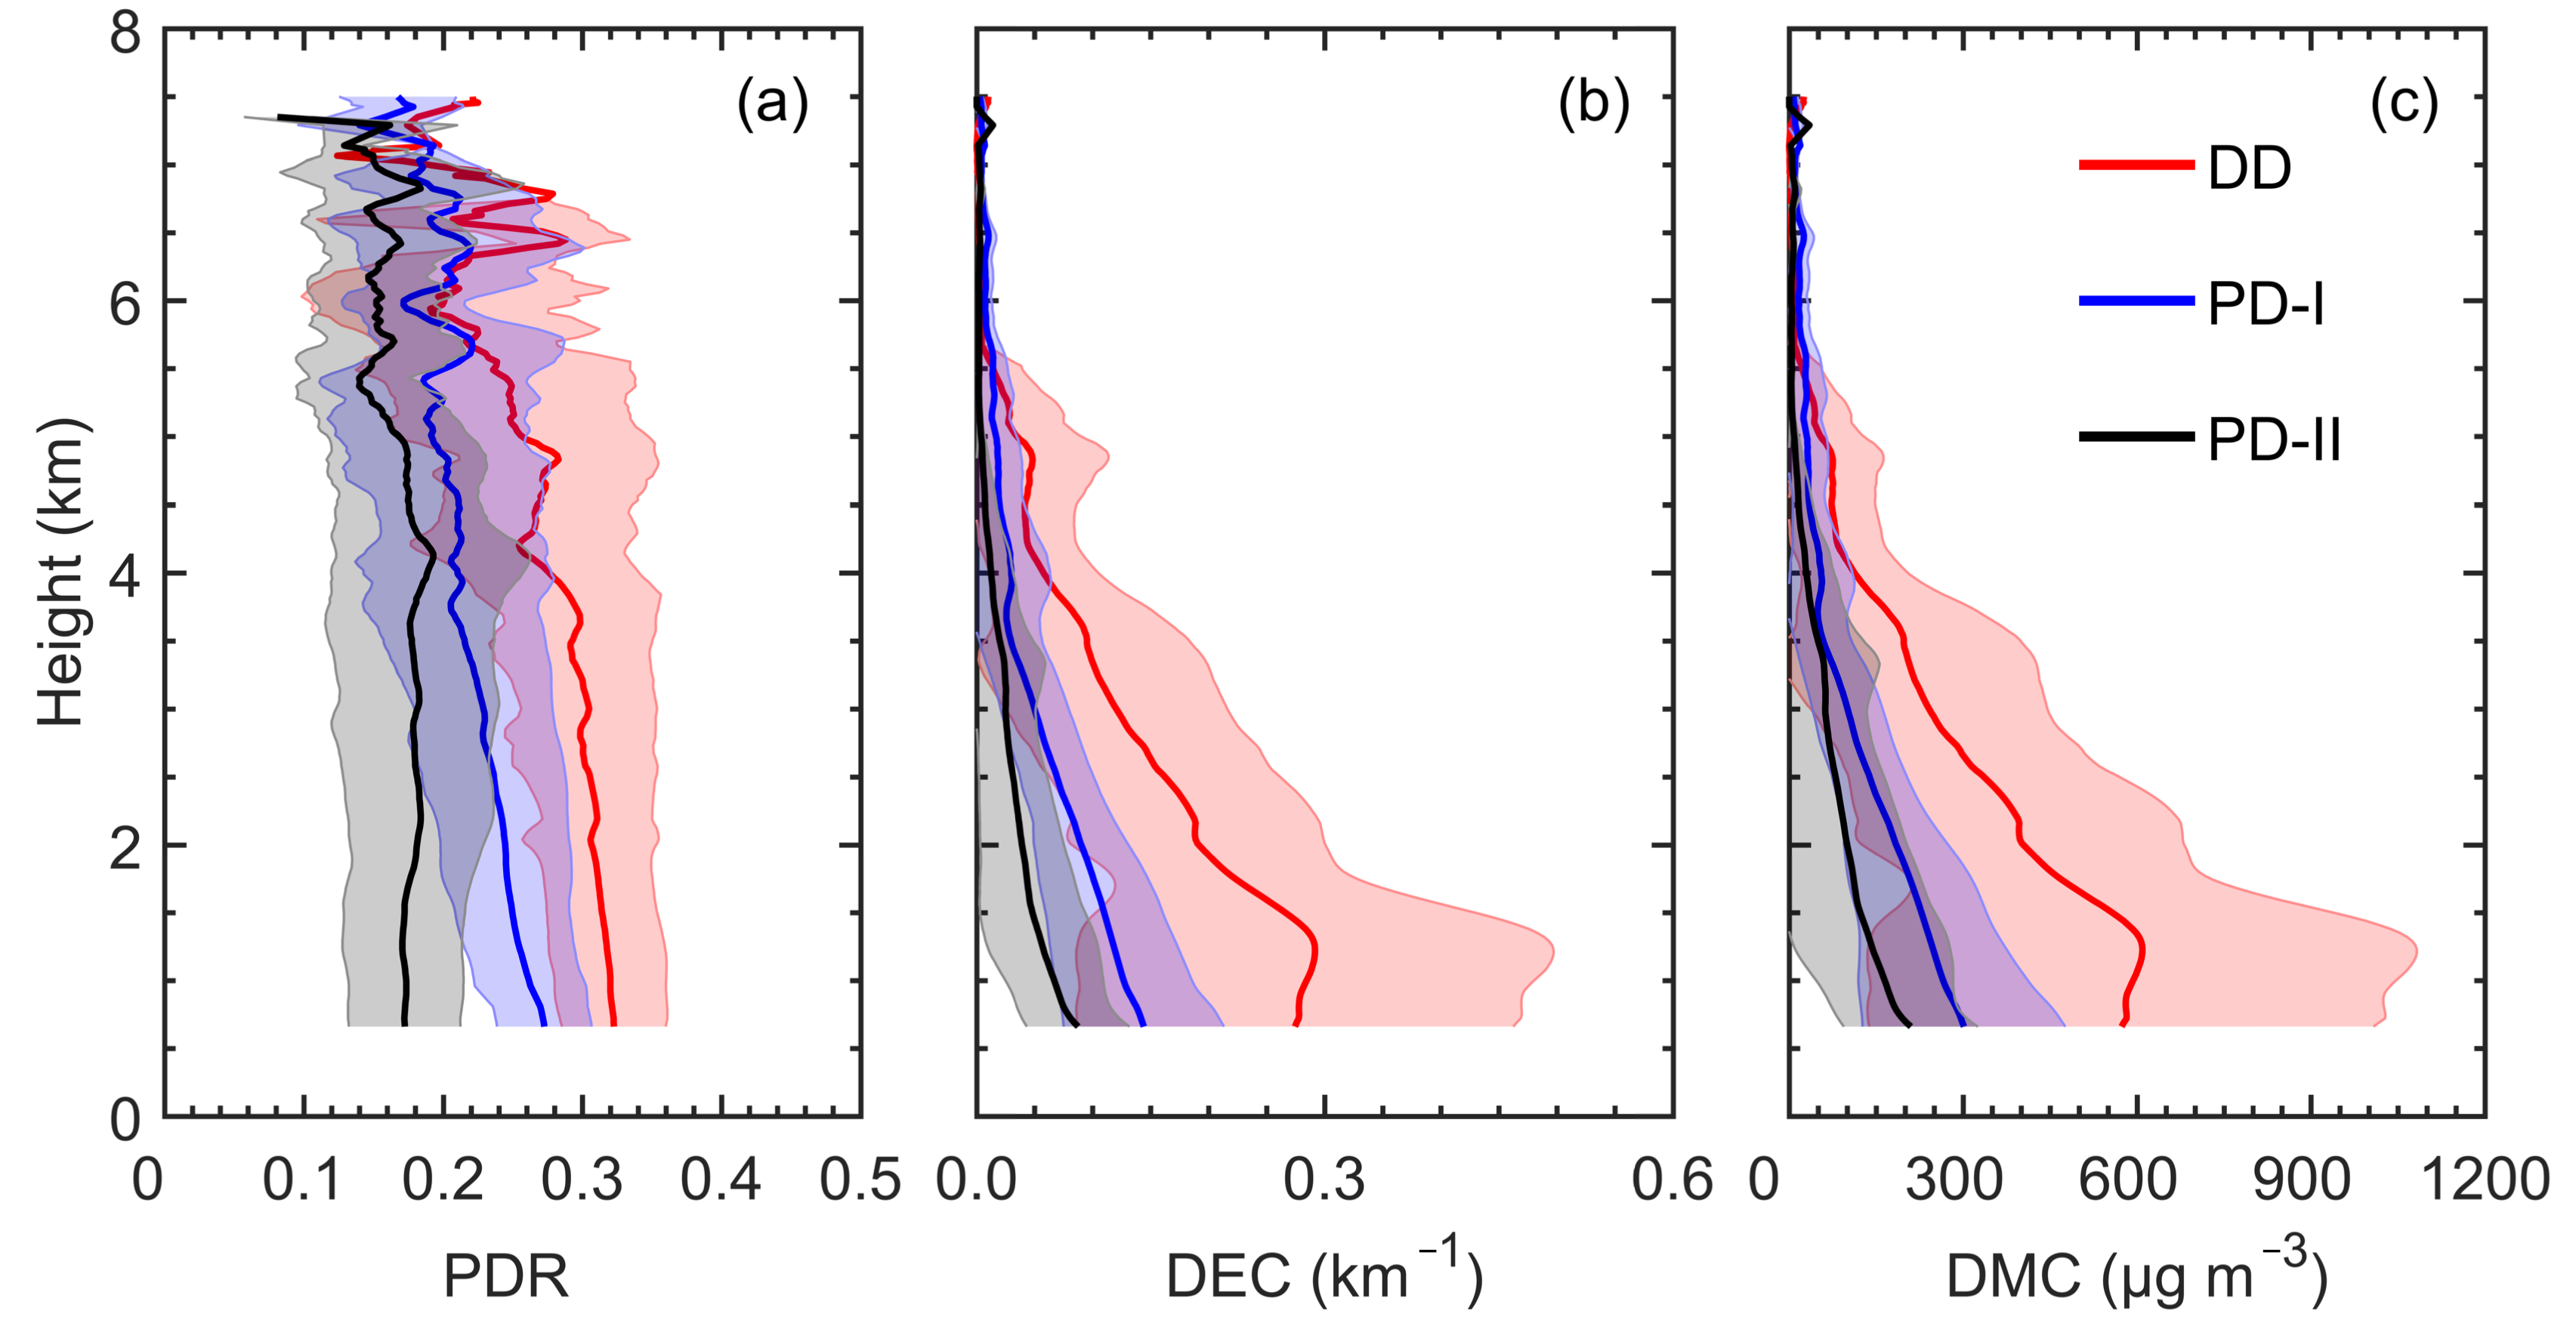
- The measurements of DMC indicated that the dust loading mainly occurred in the free troposphere (<6 km). The average of dust mass loading trapped in the planetary boundary layer under 2 km is up to 905 ± 635 µg m−2 for the DD condition in the studied dust field experiments.
- -
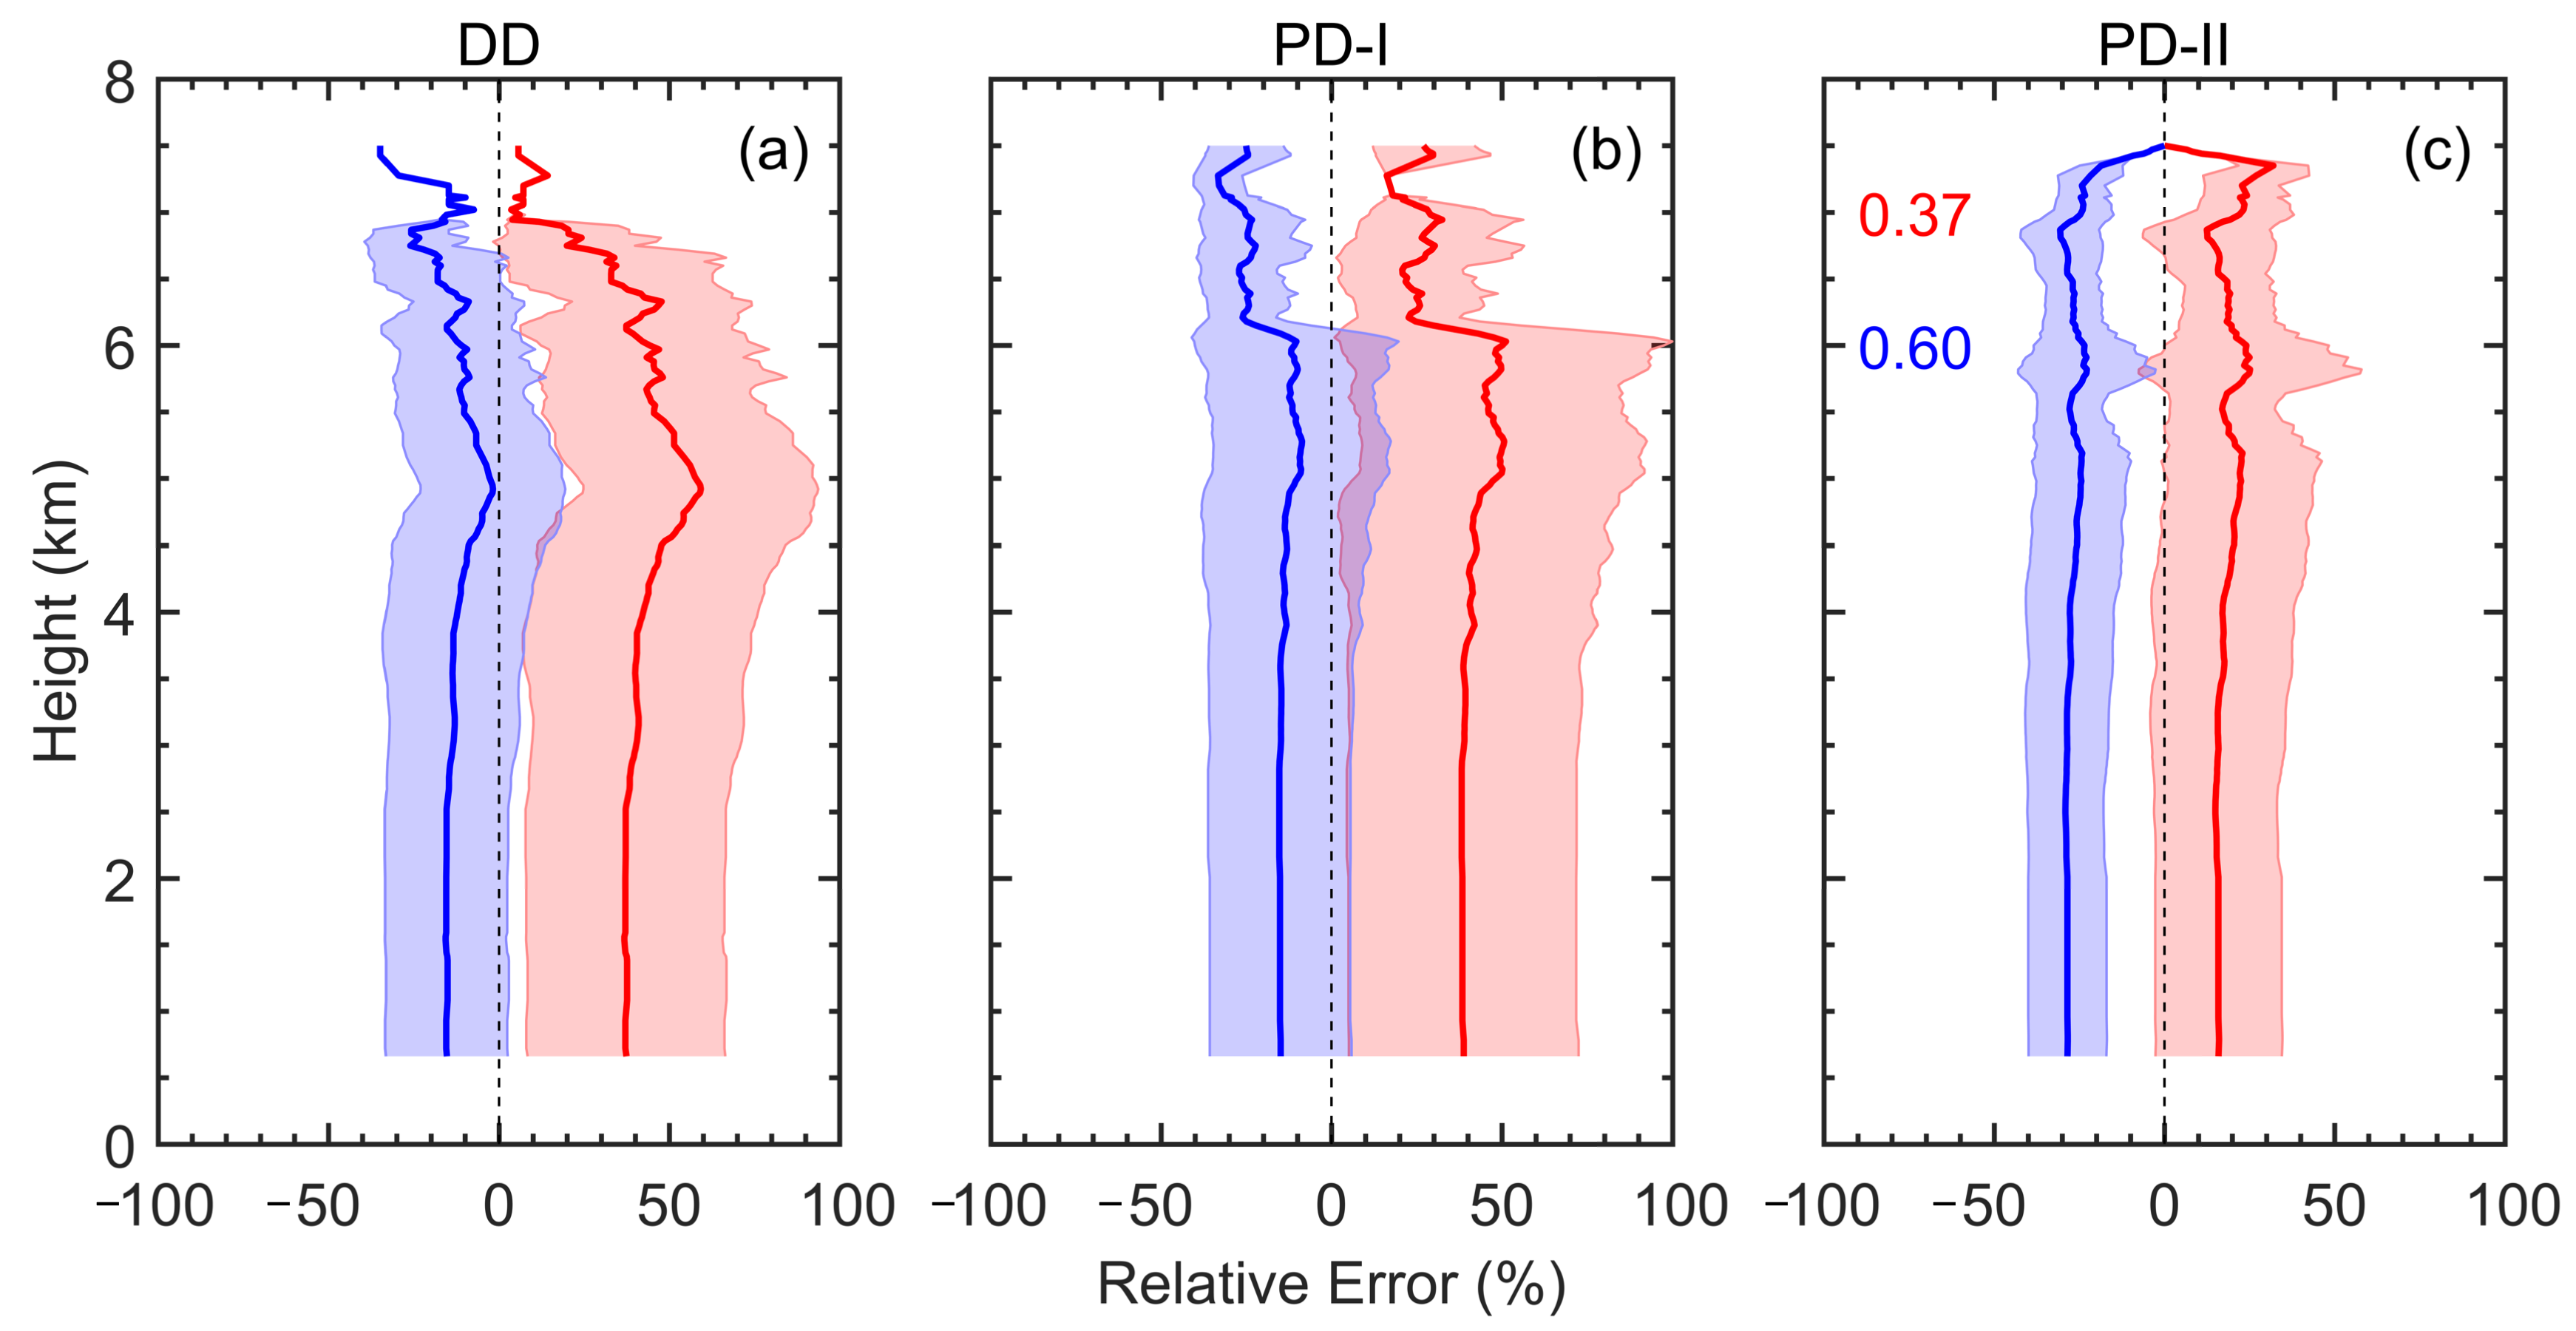
- With the assumption of dust MEE of 0.37 and 0.60 m2 g−1, the DMC in Northwest China is respectively overestimated by 20–40% and underestimated by 15–30%. This suggests that the change of MEE with the size of dust particles must be considered in the estimation of DMC, regardless of ground-based or satellite-based remote sensing.
Author Contributions
Funding
Data Availability Statement
Acknowledgments
Conflicts of Interest
References
- Li, Z.; Lau, W.K.M.; Ramanathan, V.; Wu, G.; Ding, Y.; Manoj, M.G.; Liu, J.; Qian, Y.; Li, J.; Zhou, T.; et al. Aerosol and monsoon climate interactions over Asia. Rev. Geophys. 2016, 54, 866–929. [Google Scholar] [CrossRef]
- Huang, J.; Wang, T.; Wang, W.; Li, Z.; Yan, H. Climate effects of dust aerosols over East Asian arid and semiarid regions. J. Geophys. Res. Atmos. 2014, 119, 11398–311416. [Google Scholar] [CrossRef]
- Wang, T.; Han, Y.; Huang, J.; Sun, M.; Jian, B.; Huang, Z.; Yan, H. Climatology of dust-forced radiative heating over the Tibetan Plateau and its surroundings. J. Geophys. Res. Atmos. 2020, 125, e2020JD032942. [Google Scholar] [CrossRef]
- Huang, J.; Lin, B.; Minnis, P.; Wang, T.; Wang, X.; Hu, Y.; Yi, Y.; Ayers, J.K. Satellite-based assessment of possible dust aerosols semi-direct effect on cloud water path over East Asia. Geophys. Res. Lett. 2006, 33, L19802. [Google Scholar] [CrossRef]
- Huang, J.; Minnis, P.; Lin, B.; Wang, T.; Yi, Y.; Hu, Y.; Sun-Mack, S.; Ayers, K. Possible influences of Asian dust aerosols on cloud properties and radiative forcing observed from MODIS and CERES. Geophys. Res. Lett. 2006, 33. [Google Scholar] [CrossRef]
- Liu, Y.; Li, Y.; Huang, J.; Zhu, Q.; Wang, S. Attribution of the Tibetan Plateau to northern drought. Natl. Sci. Rev. 2020, 7, 489–492. [Google Scholar] [CrossRef]
- Liu, Y.; Zhu, Q.; Huang, J.; Hua, S.; Jia, R. Impact of dust-polluted convective clouds over the Tibetan Plateau on downstream precipitation. Atmos. Environ. 2019, 209, 67–77. [Google Scholar] [CrossRef]
- Yan, H.; Wang, T. Ten Years of Aerosol Effects on Single-Layer Overcast Clouds over the U.S. Southern Great Plains and the China Loess Plateau. Adv. Meteorol. 2020, 2020, 6719160. [Google Scholar] [CrossRef]
- Mahowald, N.; Jickells, T.D.; Baker, A.R.; Artaxo, P.; Benitez-Nelson, C.R.; Bergametti, G.; Bond, T.C.; Chen, Y.; Cohen, D.D.; Herut, B.; et al. Global distribution of atmospheric phosphorus sources, concentrations and deposition rates, and anthropogenic impacts. Glob. Biogeochem. Cycles 2008, 22, GB4026. [Google Scholar] [CrossRef]
- Yu, H.; Chin, M.; Yuan, T.; Bian, H.; Remer, L.A.; Prospero, J.M.; Omar, A.; Winker, D.; Yang, Y.; Zhang, Y.; et al. The fertilizing role of African dust in the Amazon rainforest: A first multiyear assessment based on data from Cloud-Aerosol Lidar and Infrared Pathfinder Satellite Observations. Geophys. Res. Lett. 2015, 42, 1984–1991. [Google Scholar] [CrossRef]
- Tan, S.; Li, J.; Che, H.; Chen, B.; Wang, H. Transport of East Asian dust storms to the marginal seas of China and the southern North Pacific in spring 2010. Atmos. Environ. 2017, 148, 316–328. [Google Scholar] [CrossRef]
- Prospero, J.M.; Barkley, A.E.; Gaston, C.J.; Gatineau, A.; Sansano, A.C.Y.; Panechou, K. Characterizing and Quantifying African Dust Transport and Deposition to South America: Implications for the Phosphorus Budget in the Amazon Basin. Glob. Biogeochem. Cycles 2020, 34. [Google Scholar] [CrossRef]
- Prospero, J.M.; Collard, F.X.; Molinie, J.; Jeannot, A. Characterizing the annual cycle of African dust transport to the Caribbean Basin and South America and its impact on the environment and air quality. Glob. Biogeochem. Cycles 2014, 28, 757–773. [Google Scholar] [CrossRef]
- Griffin, D.W. Atmospheric movement of microorganisms in clouds of desert dust and implications for human health. Clin. Microbiol. Rev. 2007, 20, 459–477. [Google Scholar] [CrossRef]
- Shao, Y.; Wyrwoll, K.-H.; Chappell, A.; Huang, J.; Lin, Z.; McTainsh, G.H.; Mikami, M.; Tanaka, T.Y.; Wang, X.; Yoon, S. Dust cycle: An emerging core theme in Earth system science. Aeolian Res. 2011, 2, 181–204. [Google Scholar] [CrossRef]
- Wang, T.; Tang, J.; Sun, M.; Liu, X.; Huang, Y.; Huang, J.; Han, Y.; Cheng, Y.; Huang, Z.; Li, J. Identifying a transport mechanism of dust aerosols over South Asia to the Tibetan Plateau: A case study. Sci. Total Environ. 2021, 758, 143714. [Google Scholar] [CrossRef] [PubMed]
- Kim, D.; Chin, M.; Yu, H.; Diehl, T.; Tan, Q.; Kahn, R.A.; Tsigaridis, K.; Bauer, S.E.; Takemura, T.; Pozzoli, L.; et al. Sources, sinks, and transatlantic transport of North African dust aerosol: A multimodel analysis and comparison with remote sensing data. J. Geophys. Res. Atmos. 2014, 119, 6259–6277. [Google Scholar] [CrossRef]
- Chen, S.; Huang, J.; Kang, L.; Wang, H.; Ma, X.; He, Y.; Yuan, T.; Yang, B.; Huang, Z.; Zhang, G. Emission, transport, and radiative effects of mineral dust from the Taklimakan and Gobi deserts: Comparison of measurements and model results. Atmos. Chem. Phys. 2017, 17, 2401–2421. [Google Scholar] [CrossRef]
- Sarangi, C.; Qian, Y.; Rittger, K.; Leung, L.R.; Chand, D.; Bormann, K.J.; Painter, T.H. Dust dominates high-altitude snow darkening and melt over high-mountain Asia. Nat. Clim. Chang. 2020, 10, 1045–1051. [Google Scholar] [CrossRef]
- Kok, J.F.; Ridley, D.A.; Zhou, Q.; Miller, R.L.; Zhao, C.; Heald, C.L.; Ward, D.S.; Albani, S.; Haustein, K. Integrative analysis of desert dust size and abundance suggests less dust climate cooling. Nat. Geosci. 2017, 10, 274–278. [Google Scholar] [CrossRef] [PubMed]
- Huneeus, N.; Schulz, M.; Balkanski, Y.; Griesfeller, J.; Prospero, J.; Kinne, S.; Bauer, S.; Boucher, O.; Chin, M.; Dentener, F.; et al. Global dust model intercomparison in AeroCom phase I. Atmos. Chem. Phys. 2011, 11, 7781–7816. [Google Scholar] [CrossRef]
- Kaufman, Y.J.; Koren, I.; Remer, L.A.; Tanre, D.; Ginoux, P.; Fan, S. Dust transport and deposition observed from the Terra-Moderate Resolution Imaging Spectroradiometer (MODIS) spacecraft over the Atlantic Ocean. J. Geophys. Res. Atmos. 2005, 110, D10S12. [Google Scholar] [CrossRef]
- Jin, S.; Ma, Y.; Zhang, M.; Gong, W.; Dubovik, O.; Liu, B.; Shi, Y.; Yang, C. Retrieval of 500 m Aerosol Optical Depths from MODIS Measurements over Urban Surfaces under Heavy Aerosol Loading Conditions in Winter. Remote Sens. 2019, 11, 2218. [Google Scholar] [CrossRef]
- Zhang, M.X.; Zhao, C.; Cong, Z.Y.; Du, Q.Y.; Xu, M.Y.; Chen, Y.; Chen, M.; Li, R.; Fu, Y.F.; Zhong, L.; et al. Impact of topography on black carbon transport to the southern Tibetan Plateau during the pre-monsoon season and its climatic implication. Atmos. Chem. Phys. 2020, 20, 5923–5943. [Google Scholar] [CrossRef]
- Tao, M.; Chen, L.; Wang, Z.; Wang, J.; Che, H.; Xu, X.; Wang, W.; Tao, J.; Zhu, H.; Hou, C. Evaluation of MODIS Deep Blue Aerosol Algorithm in Desert Region of East Asia: Ground Validation and Intercomparison. J. Geophys. Res. Atmos. 2017, 122, 10329–10340. [Google Scholar] [CrossRef]
- Yu, H.; Chin, M.; Bian, H.; Yuan, T.; Prospero, J.M.; Omar, A.H.; Remer, L.A.; Winker, D.M.; Yang, Y.; Zhang, Y.; et al. Quantification of trans-Atlantic dust transport from seven-year (2007–2013) record of CALIPSO lidar measurements. Remote Sens. Environ. 2015, 159, 232–249. [Google Scholar] [CrossRef]
- Ginoux, P.; Prospero, J.; Gill, T.; Hsu, N.; Zhao, M. Global-scale attribution of anthropogenic and natural dust sources and their emission rates based on MODIS Deep Blue aerosol products. Rev. Geophys. 2012, 50, RG3005. [Google Scholar] [CrossRef]
- Huang, J.; Liu, J.; Chen, B.; Nasiri, S. Detection of anthropogenic dust using CALIPSO lidar measurements. Atmos. Chem. Phys. 2015, 15, 11653–11665. [Google Scholar] [CrossRef]
- Yu, H.; Tan, Q.; Chin, M.; Remer, L.A.; Kahn, R.A.; Bian, H.; Kim, D.; Zhang, Z.; Yuan, T.; Omar, A.H.; et al. Estimates of African Dust Deposition Along the Trans-Atlantic Transit Using the Decadelong Record of Aerosol Measurements from CALIOP, MODIS, MISR, and IASI. J. Geophys. Res. Atmos. 2019, 124, 7975–7996. [Google Scholar] [CrossRef]
- Liu, Z.; Winker, D.; Omar, A.; Vaughan, M.; Kar, J.; Trepte, C.; Hu, Y.; Schuster, G. Evaluation of CALIOP 532 nm aerosol optical depth over opaque water clouds. Atmos. Chem. Phys. 2015, 15, 1265–1288. [Google Scholar] [CrossRef][Green Version]
- Osborne, S.R.; Johnson, B.T.; Haywood, J.M.; Baran, A.J.; Harrison, M.A.J.; McConnell, C.L. Physical and optical properties of mineral dust aerosol during the Dust and Biomass-burning Experiment. J. Geophys. Res. Atmos. 2008, 113, D00C03. [Google Scholar] [CrossRef]
- Johnson, B.T.; Osborne, S.R. Physical and optical properties of mineral dust aerosol measured by aircraft during the GERBILS campaign. Q. J. R. Meteorol. Soc. 2011, 137, 1117–1130. [Google Scholar] [CrossRef]
- Weinzierl, B.; Petzold, A.; Esselborn, M.; Wirth, M.; Rasp, K.; Kandler, K.; Schuetz, L.; Koepke, P.; Fiebig, M. Airborne measurements of dust layer properties, particle size distribution and mixing state of Saharan dust during SAMUM 2006. Tellus B Chem. Phys. Meteorol. 2009, 61, 96–117. [Google Scholar] [CrossRef]
- Müller, D.; Veselovskii, I.; Kolgotin, A.; Tesche, M.; Ansmann, A.; Dubovik, O. Vertical profiles of pure dust and mixed smoke-dust plumes inferred from inversion of multiwavelength Raman/polarization lidar data and comparison to AERONET retrievals and in situ observations. Appl. Opt. 2013, 52, 3178–3202. [Google Scholar] [CrossRef]
- Mamouri, R.E.; Ansmann, A. Fine and coarse dust separation with polarization lidar. Atmos. Meas. Tech. 2014, 7, 3717–3735. [Google Scholar] [CrossRef]
- Maring, H.; Savoie, D.L.; Izaguirre, M.A.; Custals, L.; Reid, J.S. Mineral dust aerosol size distribution change during atmospheric transport. J. Geophys. Res. Atmos. 2003, 108, 8592. [Google Scholar] [CrossRef]
- Ansmann, A.; Tesche, M.; Seifert, P.; Gross, S.; Freudenthaler, V.; Apituley, A.; Wilson, K.M.; Serikov, I.; Linne, H.; Heinold, B.; et al. Ash and fine-mode particle mass profiles from EARLINET-AERONET observations over central Europe after the eruptions of the Eyjafjallajokull volcano in 2010. J. Geophys. Res. Atmos. 2011, 116, D00U02. [Google Scholar] [CrossRef]
- Wagner, J.; Ansmann, A.; Wandinger, U.; Seifert, P.; Schwarz, A.; Tesche, M.; Chaikovsky, A.; Dubovik, O. Evaluation of the Lidar/Radiometer Inversion Code (LIRIC) to determine microphysical properties of volcanic and desert dust. Atmos. Meas. Tech. 2013, 6, 1707–1724. [Google Scholar] [CrossRef]
- Nemuc, A.; Vasilescu, J.; Talianu, C.; Belegante, L.; Nicolae, D. Assessment of aerosol’s mass concentrations from measured linear particle depolarization ratio (vertically resolved) and simulations. Atmos. Meas. Tech. 2013, 6, 3243–3255. [Google Scholar] [CrossRef]
- Mamouri, R.E.; Ansmann, A. Potential of polarization/Raman lidar to separate fine dust, coarse dust, maritime, and anthropogenic aerosol profiles. Atmos. Meas. Tech. 2017, 10, 3403–3427. [Google Scholar] [CrossRef]
- Huebert, B.J.; Bates, T.; Russell, P.B.; Shi, G.Y.; Kim, Y.J.; Kawamura, K.; Carmichael, G.; Nakajima, T. An overview of ACE-Asia: Strategies for quantifying the relationships between Asian aerosols and their climatic impacts. J. Geophys. Res. Atmos. 2003, 108, 8633. [Google Scholar] [CrossRef]
- Mikami, M.; Shi, G.Y.; Uno, I.; Yabuki, S.; Iwasaka, Y.; Yasui, M.; Aoki, T.; Tanaka, T.Y.; Kurosaki, Y.; Masuda, K.; et al. Aeolian dust experiment on climate impact: An overview of Japan-China joint project ADEC. Glob. Planet. Chang. 2006, 52, 142–172. [Google Scholar] [CrossRef]
- Huang, J.; Minnis, P.; Chen, B.; Huang, Z.; Liu, Z.; Zhao, Q.; Yi, Y.; Ayers, J. Long-range transport and vertical structure of Asian dust from CALIPSO and surface measurements during PACDEX. J. Geophys. Res. Atmos. 2008, 113, D23212. [Google Scholar] [CrossRef]
- Li, Z.; Li, C.; Chen, H.; Tsay, S.C.; Holben, B.; Huang, J.; Li, B.; Maring, H.; Qian, Y.; Shi, G.; et al. East Asian Studies of Tropospheric Aerosols and their Impact on Regional Climate (EAST-AIRC): An overview. J. Geophys. Res. Atmos. 2011, 116, D00K34. [Google Scholar] [CrossRef]
- Holben, B.N.; Eck, T.F.; Slutsker, I.; Tanre, D.; Buis, J.P.; Setzer, A.; Vermote, E.; Reagan, J.A.; Kaufman, Y.J.; Nakajima, T.; et al. AERONET—A federated instrument network and data archive for aerosol characterization. Remote Sens. Environ. 1998, 66, 1–16. [Google Scholar] [CrossRef]
- Eck, T.F.; Holben, B.N.; Dubovik, O.; Smirnov, A.; Goloub, P.; Chen, H.B.; Chatenet, B.; Gomes, L.; Zhang, X.Y.; Tsay, S.C.; et al. Columnar aerosol optical properties at AERONET sites in central eastern Asia and aerosol transport to the tropical mid-Pacific. J. Geophys. Res. Atmos. 2005, 110, D06202. [Google Scholar] [CrossRef]
- Takamura, T.; Nakajima, T. Overview of SKYNET and its activities. Pure Appl. Opt. 2004, 37, 3303–3308. [Google Scholar]
- Nakajima, T.; Yoon, S.C.; Ramanathan, V.; Shi, G.Y.; Takemura, T.; Higurashi, A.; Takamura, T.; Aoki, K.; Sohn, B.J.; Kim, S.W.; et al. Overview of the Atmospheric Brown Cloud East Asian Regional Experiment 2005 and a study of the aerosol direct radiative forcing in east Asia. J. Geophys. Res. Atmos. 2007, 112, D24S91. [Google Scholar] [CrossRef]
- Che, H.; Zhang, X.; Chen, H.; Damiri, B.; Goloub, P.; Li, Z.; Zhang, X.; Wei, Y.; Zhou, H.; Dong, F.; et al. Instrument calibration and aerosol optical depth validation of the China Aerosol Remote Sensing Network. J. Geophys. Res. Atmos. 2009, 114, D03206. [Google Scholar] [CrossRef]
- Che, H.; Zhang, X.Y.; Xia, X.; Goloub, P.; Holben, B.; Zhao, H.; Wang, Y.; Zhang, X.C.; Wang, H.; Blarel, L.; et al. Ground-based aerosol climatology of China: Aerosol optical depths from the China Aerosol Remote Sensing Network (CARSNET) 2002–2013. Atmos. Chem. Phys. 2015, 15, 7619–7652. [Google Scholar] [CrossRef]
- Bi, J.; Huang, J.; Shi, J.; Hu, Z.; Zhou, T.; Zhang, G.; Huang, Z.; Wang, X.; Jin, H. Measurement of scattering and absorption properties of dust aerosol in a Gobi farmland region of northwestern China—A potential anthropogenic influence. Atmos. Chem. Phys. 2017, 17, 7775–7792. [Google Scholar] [CrossRef]
- Arimoto, R.; Zhang, X.Y.; Huebert, B.J.; Kang, C.H.; Savoie, D.L.; Prospero, J.M.; Sage, S.K.; Schloesslin, C.A.; Khaing, H.M.; Oh, S.N. Chemical composition of atmospheric aerosols from Zhenbeitai, China, and Gosan, South Korea, during ACE-Asia. J. Geophys. Res. Atmos. 2004, 109, D19S04. [Google Scholar] [CrossRef]
- Xu, J.; Bergin, M.H.; Greenwald, R.; Schauer, J.J.; Shafer, M.M.; Jaffrezo, J.L.; Aymoz, G. Aerosol chemical, physical, and radiative characteristics near a desert source region of northwest China during ACE-Asia. J. Geophys. Res. Atmos. 2004, 109, D19S03. [Google Scholar] [CrossRef]
- Wang, T.; Huang, J. A method for estimating optical properties of dusty cloud. Chin. Opt. Lett. 2009, 7, 368–372. [Google Scholar] [CrossRef]
- Huang, Z.; Huang, J.; Bi, J.; Wang, G.; Wang, W.; Fu, Q.; Li, Z.; Tsay, S.-C.; Shi, J. Dust aerosol vertical structure measurements using three MPL lidars during 2008 China-U.S. joint dust field experiment. J. Geophys. Res. Atmos. 2010, 115. [Google Scholar] [CrossRef]
- Bi, J.; Huang, J.; Fu, Q.; Ge, J.; Shi, J.; Zhou, T.; Zhang, W. Field measurement of clear-sky solar irradiance in Badain Jaran Desert of Northwestern China. J. Quant. Spectrosc. Radiat. Transf. 2013, 122, 194–207. [Google Scholar] [CrossRef]
- Wang, X.; Wen, H.; Shi, J.; Bi, J.; Huang, Z.; Zhang, B.; Zhou, T.; Fu, K.; Chen, Q.; Xin, J. Optical and microphysical properties of natural mineral dust and anthropogenic soil dust near dust source regions over northwestern China. Atmos. Chem. Phys. 2018, 18, 2119–2138. [Google Scholar] [CrossRef]
- Tian, P.; Zhang, L.; Ma, J.; Tang, K.; Xu, L.; Wang, Y.; Cao, X.; Liang, J.; Ji, Y.; Jiang, J.; et al. Radiative absorption enhancement of dust mixed with anthropogenic pollution over East Asia. Atmos. Chem. Phys. 2018, 18, 7815–7825. [Google Scholar] [CrossRef]
- Zhang, X.; Arimoto, R.; An, Z. Dust emission from Chinese desert sources linked to variations in atmospheric circulation. J. Geophys. Res. Atmos. 1997, 102, 28041–28047. [Google Scholar] [CrossRef]
- Zhang, X.; Zhang, G.; Zhu, G.; Zhang, D.; An, Z.; Chen, T.; Huang, X. Elemental tracers for Chinese source dust. Sci. China Ser. D Earth Sci. 1996, 39, 512–521. [Google Scholar]
- Huang, J.P.; Zhang, W.; Zuo, J.Q.; Bi, J.R.; Shi, J.S.; Wang, X.; Chang, Z.L.; Huang, Z.W.; Yang, S.; Zhang, B.D.; et al. An Overview of the Semi-arid Climate and Environment Research Observatory over the Loess Plateau. Adv. Atmos. Sci. 2008, 25, 906–921. [Google Scholar] [CrossRef]
- Campbell, J.R.; Hlavka, D.L.; Welton, E.J.; Flynn, C.J.; Turner, D.D.; Spinhirne, J.D.; Scott, V.S.; Hwang, I.H. Full-time, eye-safe cloud and aerosol lidar observation at atmospheric radiation measurement program sites: Instruments and data processing. J. Atmos. Ocean. Technol. 2002, 19, 431–442. [Google Scholar] [CrossRef]
- Xie, H.; Zhou, T.; Fu, Q.; Huang, J.; Huang, Z.; Bi, J.; Shi, J.; Zhang, B.; Ge, J. Automated detection of cloud and aerosol features with SACOL micro-pulse lidar in northwest China. Opt. Express 2017, 25, 30732–30753. [Google Scholar] [CrossRef]
- O’Neill, N.T.; Eck, T.F.; Smirnov, A.; Holben, B.N.; Thulasiraman, S. Spectral discrimination of coarse and fine mode optical depth. J. Geophys. Res. Atmos. 2003, 108, 4559. [Google Scholar] [CrossRef]
- Dubovik, O.; Sinyuk, A.; Lapyonok, T.; Holben, B.N.; Mishchenko, M.; Yang, P.; Eck, T.F.; Volten, H.; Munoz, O.; Veihelmann, B.; et al. Application of spheroid models to account for aerosol particle nonsphericity in remote sensing of desert dust. J. Geophys. Res. Atmos. 2006, 111, D11208. [Google Scholar] [CrossRef]
- Dubovik, O.; Holben, B.; Eck, T.F.; Smirnov, A.; Kaufman, Y.J.; King, M.D.; Tanre, D.; Slutsker, I. Variability of absorption and optical properties of key aerosol types observed in worldwide locations. J. Geophys. Res. Atmos. 2002, 59, 590–608. [Google Scholar] [CrossRef]
- Müller, D.; Weinzierl, B.; Petzold, A.; Kandler, K.; Ansmann, A.; Muller, T.; Tesche, M.; Freudenthaler, V.; Esselborn, M.; Heese, B.; et al. Mineral dust observed with AERONET Sun photometer, Raman lidar, and in situ instruments during SAMUM 2006: Shape-independent particle properties. J. Geophys. Res. Atmos. 2010, 115, D11207. [Google Scholar] [CrossRef]
- Ginoux, P.; Chin, M.; Tegen, I.; Prospero, J.M.; Holben, B.; Dubovik, O.; Lin, S.J. Sources and distributions of dust aerosols simulated with the GOCART model. J. Geophys. Res. Atmos. 2001, 106, 20255–20273. [Google Scholar] [CrossRef]
- Hess, M.; Koepke, P.; Schult, I. Optical properties of aerosols and clouds: The software package OPAC. Bull. Am. Meteorol. Soc. 1998, 79, 831–844. [Google Scholar] [CrossRef]
- Gasteiger, J.; Gross, S.; Freudenthaler, V.; Wiegner, M. Volcanic ash from Iceland over Munich: Mass concentration retrieved from ground-based remote sensing measurements. Atmos. Chem. Phys. 2011, 11, 2209–2223. [Google Scholar] [CrossRef]
- Cordoba-Jabonero, C.; Sicard, M.; Ansmann, A.; del Aguila, A.; Baars, H. Separation of the optical and mass features of particle components in different aerosol mixtures by using POLIPHON retrievals in synergy with continuous polarized Micro-Pulse Lidar (P-MPL) measurements. Atmos. Meas. Tech. 2018, 11, 4775–4795. [Google Scholar] [CrossRef]
- Flynn, C.; Mendoza, A.; Zheng, Y.; Mathur, S. Novel polarization-sensitive micropulse lidar measurement technique. Opt. Express 2007, 15, 2785–2790. [Google Scholar] [CrossRef]
- Dee, D.P.; Uppala, S.M.; Simmons, A.J.; Berrisford, P.; Poli, P.; Kobayashi, S.; Andrae, U.; Balmaseda, M.A.; Balsamo, G.; Bauer, P.; et al. The ERA-Interim reanalysis: Configuration and performance of the data assimilation system. Q. J. R. Meteorol. Soc. 2011, 137, 553–597. [Google Scholar] [CrossRef]
- Zhou, T.; Xie, H.; Bi, J.; Huang, Z.; Huang, J.; Shi, J.; Zhang, B.; Zhang, W. Lidar Measurements of Dust Aerosols during Three Field Campaigns in 2010, 2011 and 2012 over Northwestern China. Atmosphere 2018, 9, 173. [Google Scholar] [CrossRef]
- Hayasaka, T.; Satake, S.; Shimizu, A.; Sugimoto, N.; Matsui, I.; Aoki, K.; Muraji, Y. Vertical distribution and optical properties of aerosols observed over Japan during the Atmospheric Brown Clouds—East Asia Regional Experiment 2005. J. Geophys. Res. Atmos. 2007, 112, D22S35. [Google Scholar] [CrossRef]
- Freudenthaler, V.; Esselborn, M.; Wiegner, M.; Heese, B.; Tesche, M.; Ansmann, A.; Mueller, D.; Althausen, D.; Wirth, M.; Fix, A.; et al. Depolarization ratio profiling at several wavelengths in pure Saharan dust during SAMUM 2006. Tellus B Chem. Phys. Meteorol. 2009, 61, 165–179. [Google Scholar] [CrossRef]
- Groß, S.; Tesche, M.; Freudenthaler, V.; Toledano, C.; Wiegner, M.; Ansmann, A.; Althausen, D.; Seefeldner, M. Characterization of Saharan dust, marine aerosols and mixtures of biomass-burning aerosols and dust by means of multi-wavelength depolarization and Raman lidar measurements during SAMUM 2. Tellus B Chem. Phys. Meteorol. 2011, 63, 706–724. [Google Scholar] [CrossRef]
- Wiegner, M.; Gross, S.; Freudenthaler, V.; Schnell, F.; Gasteiger, J. The May/June 2008 Saharan dust event over Munich: Intensive aerosol parameters from lidar measurements. J. Geophys. Res. Atmos. 2011, 116, D23213. [Google Scholar] [CrossRef]
- Shimizu, A.; Sugimoto, N.; Matsui, I.; Arao, K.; Uno, I.; Murayama, T.; Kagawa, N.; Aoki, K.; Uchiyama, A.; Yamazaki, A. Continuous observations of Asian dust and other aerosols by polarization lidars in China and Japan during ACE-Asia. J. Geophys. Res. Atmos. 2004, 109, D19S17. [Google Scholar] [CrossRef]
- Sugimoto, N.; Uno, I.; Nishikawa, M.; Shimizu, A.; Matsui, I.; Dong, X.; Chen, Y.; Quan, H. Record heavy Asian dust in Beijing in 2002: Observations and model analysis of recent events. Geophys. Res. Lett. 2003, 30, 1640. [Google Scholar] [CrossRef]
- Hu, Q.; Wang, H.; Goloub, P.; Li, Z.; Veselovskii, I.; Podvin, T.; Li, K.; Korenskiy, M. The characterization of Taklamakan dust properties using a multiwavelength Raman polarization lidar in Kashi, China. Atmos. Chem. Phys. 2020, 20, 13817–13834. [Google Scholar] [CrossRef]
- Hofer, J.; Ansmann, A.; Althausen, D.; Engelmann, R.; Baars, H.; Fomba, K.W.; Wandinger, U.; Abdullaev, S.F.; Makhmudov, A.N. Optical properties of Central Asian aerosol relevant for spaceborne lidar applications and aerosol typing at 355 and 532 nm. Atmos. Chem. Phys. 2020, 20, 9265–9280. [Google Scholar] [CrossRef]
- Kim, M.-H.; Omar, A.H.; Tackett, J.L.; Vaughan, M.A.; Winker, D.M.; Trepte, C.R.; Hu, Y.; Liu, Z.; Poole, L.R.; Pitts, M.C.; et al. The CALIPSO version 4 automated aerosol classification and lidar ratio selection algorithm. Atmos. Meas. Tech. 2018, 11, 6107–6135. [Google Scholar] [CrossRef]
- Córdoba-Jabonero, C.; Andrey-Andrés, J.; Gómez, L.; Adame, J.A.; Sorribas, M.; Navarro-Comas, M.; Puentedura, O.; Cuevas, E.; Gil-Ojeda, M. Vertical mass impact and features of Saharan dust intrusions derived from ground-based remote sensing in synergy with airborne in-situ measurements. Atmos. Environ. 2016, 142, 420–429. [Google Scholar] [CrossRef]
- Ansmann, A.; Seifert, P.; Tesche, M.; Wandinger, U. Profiling of fine and coarse particle mass: Case studies of Saharan dust and Eyjafjallajökull/Grimsvötn volcanic plumes. Atmos. Chem. Phys. 2012, 12, 9399–9415. [Google Scholar] [CrossRef]
- Burgos, M.A.; Mateos, D.; Cachorro, V.E.; Toledano, C.; de Frutos, A.M. Aerosol properties of mineral dust and its mixtures in a regional background of north-central Iberian Peninsula. Sci. Total Environ. 2016, 572, 1005–1019. [Google Scholar] [CrossRef] [PubMed]
- Wang, T.; Chen, Y.; Gan, Z.; Han, Y.; Li, J.; Huang, J. Assessment of dominating aerosol properties and their long-term trend in the Pan-Third Pole region: A study with 10-year multi-sensor measurements. Atmos. Environ. 2020, 239, 117738. [Google Scholar] [CrossRef]
- Bi, J.; Huang, J.; Holben, B.; Zhang, G. Comparison of key absorption and optical properties between pure and transported anthropogenic dust over East and Central Asia. Atmos. Chem. Phys. 2016, 16, 15501–15516. [Google Scholar] [CrossRef]
- Ansmann, A.; Mamouri, R.E.; Hofer, J.; Baars, H.; Althausen, D.; Abdullaev, S.F. Dust mass, cloud condensation nuclei, and ice-nucleating particle profiling with polarization lidar: Updated POLIPHON conversion factors from global AERONET analysis. Atmos. Meas. Tech. 2019, 12, 4849–4865. [Google Scholar] [CrossRef]
- Chen, G.; Ziemba, L.D.; Chu, D.A.; Thornhill, K.L.; Schuster, G.L.; Winstead, E.L.; Diskin, G.S.; Ferrare, R.A.; Burton, S.P.; Ismail, S.; et al. Observations of Saharan dust microphysical and optical properties from the Eastern Atlantic during NAMMA airborne field campaign. Atmos. Chem. Phys. 2011, 11, 723–740. [Google Scholar] [CrossRef]
- Tesche, M.; Ansmann, A.; Muller, D.; Althausen, D.; Engelmann, R.; Freudenthaler, V.; Gross, S. Vertically resolved separation of dust and smoke over Cape Verde using multiwavelength Raman and polarization lidars during Saharan Mineral Dust Experiment 2008. J. Geophys. Res. Atmos. 2009, 114, D13202. [Google Scholar] [CrossRef]


| Sites | Types | CAOD | CMF | CVC | CER (μm) | Samples |
|---|---|---|---|---|---|---|
| Dunhuang | DD | 0.33 ± 0.18 | 0.82 ± 0.02 | 0.28 ± 0.15 | 1.74 ± 0.10 | 8 |
| PD-I | 0.21 ± 0.03 | 0.78 ± 0.01 | 0.18 ± 0.03 | 1.84 ± 0.10 | 7 | |
| Zhangye | DD | 0.52 ± 0.15 | 0.79 ± 0.03 | 0.54 ± 0.15 | 2.17 ± 0.23 | 14 |
| PD-I | 0.21 ± 0.06 | 0.67 ± 0.05 | 0.18 ± 0.03 | 1.93 ± 0.25 | 44 | |
| PD-II | 0.16 ± 0.04 | 0.46 ± 0.06 | 0.13 ± 0.04 | 1.88 ± 0.12 | 12 | |
| Minqin | DD | 0.31 ± 0.04 | 0.80 ± 0.02 | 0.25 ± 0.03 | 1.73 ± 0.03 | 4 |
| PD-I | 0.18 ± 0.04 | 0.70 ± 0.06 | 0.15 ± 0.04 | 1.82 ± 0.13 | 13 | |
| Dunhuang_LZU | DD | 0.79 ± 0.23 | 0.80 ± 0.02 | 0.66 ± 0.21 | 1.76 ± 0.17 | 19 |
| PD-I | 0.25 ± 0.09 | 0.72 ± 0.03 | 0.20 ± 0.09 | 1.73 ± 0.18 | 24 | |
| PD-II | 0.15 ± 0.00 | 0.54 ± 0.00 | 0.12 ± 0.00 | 1.83 ± 0.00 | 1 | |
| SACOL | DD | 0.72 ± 0.29 | 0.81 ± 0.03 | 0.64 ± 0.26 | 1.83 ± 0.15 | 40 |
| PD-I | 0.26 ± 0.09 | 0.66 ± 0.05 | 0.23 ± 0.09 | 1.96 ± 0.27 | 294 | |
| PD-II | 0.12 ± 0.05 | 0.38 ± 0.11 | 0.12 ± 0.06 | 2.16 ± 0.32 | 566 |
Publisher’s Note: MDPI stays neutral with regard to jurisdictional claims in published maps and institutional affiliations. |
© 2021 by the authors. Licensee MDPI, Basel, Switzerland. This article is an open access article distributed under the terms and conditions of the Creative Commons Attribution (CC BY) license (http://creativecommons.org/licenses/by/4.0/).
Share and Cite
Wang, T.; Han, Y.; Hua, W.; Tang, J.; Huang, J.; Zhou, T.; Huang, Z.; Bi, J.; Xie, H. Profiling Dust Mass Concentration in Northwest China Using a Joint Lidar and Sun-Photometer Setting. Remote Sens. 2021, 13, 1099. https://doi.org/10.3390/rs13061099
Wang T, Han Y, Hua W, Tang J, Huang J, Zhou T, Huang Z, Bi J, Xie H. Profiling Dust Mass Concentration in Northwest China Using a Joint Lidar and Sun-Photometer Setting. Remote Sensing. 2021; 13(6):1099. https://doi.org/10.3390/rs13061099
Chicago/Turabian StyleWang, Tianhe, Ying Han, Wenli Hua, Jingyi Tang, Jianping Huang, Tian Zhou, Zhongwei Huang, Jianrong Bi, and Hailing Xie. 2021. "Profiling Dust Mass Concentration in Northwest China Using a Joint Lidar and Sun-Photometer Setting" Remote Sensing 13, no. 6: 1099. https://doi.org/10.3390/rs13061099
APA StyleWang, T., Han, Y., Hua, W., Tang, J., Huang, J., Zhou, T., Huang, Z., Bi, J., & Xie, H. (2021). Profiling Dust Mass Concentration in Northwest China Using a Joint Lidar and Sun-Photometer Setting. Remote Sensing, 13(6), 1099. https://doi.org/10.3390/rs13061099